Attached files
| file | filename |
|---|---|
| 8-K - FORM 8-K - BRINKS CO | form_8k.htm |
| EX-99.1 - EXHIBIT 99.1 - BRINKS CO | exhibit_99-1.htm |

The Brink’s Company First Quarter 2015 Earnings Call NYSE: BCO May 1, 2015 Exhibit 99.2

Forward-Looking Statements and Non-GAAP Results These materials contain forward-looking statements. Actual results could differ materially from projected or estimated results. Information regarding factors that could cause such differences is available in today's release and in The Brink’s Company’s most recent SEC filings. Information discussed today is representative as of today only and Brink's assumes no obligation to update any forward-looking statements. These materials are copyrighted and may not be used without written permission from Brink's. Today’s presentation is focused primarily on non-GAAP results. Detailed reconciliations of non-GAAP to GAAP results are provided in the appendix beginning on page 17 and on pages 13– 14 of today’s release and in our SEC filings. *

CEO Overview First-Quarter Results Segment Review Outlook First Quarter 2015 Earnings Call May 1, 2015

CEO Overview * First-Quarter 2015 Non-GAAP Results(a) EPS $.41 versus $.15 Revenue down 8% on negative currency translation 4% organic revenue growth Improvement driven by U.S., Mexico, lower corporate expenses 2015 EPS guidance reaffirmed $1.55 - $1.75 Revenue outlook reduced from $3.4 billion to $3.1 billion due to currency and removal of Venezuela Increased margin rate outlook to range of 5.3% to 5.8% Venezuela now excluded from Non-GAAP results and guidance (a) See reconciliation to GAAP results in Appendix.

First Quarter 2015
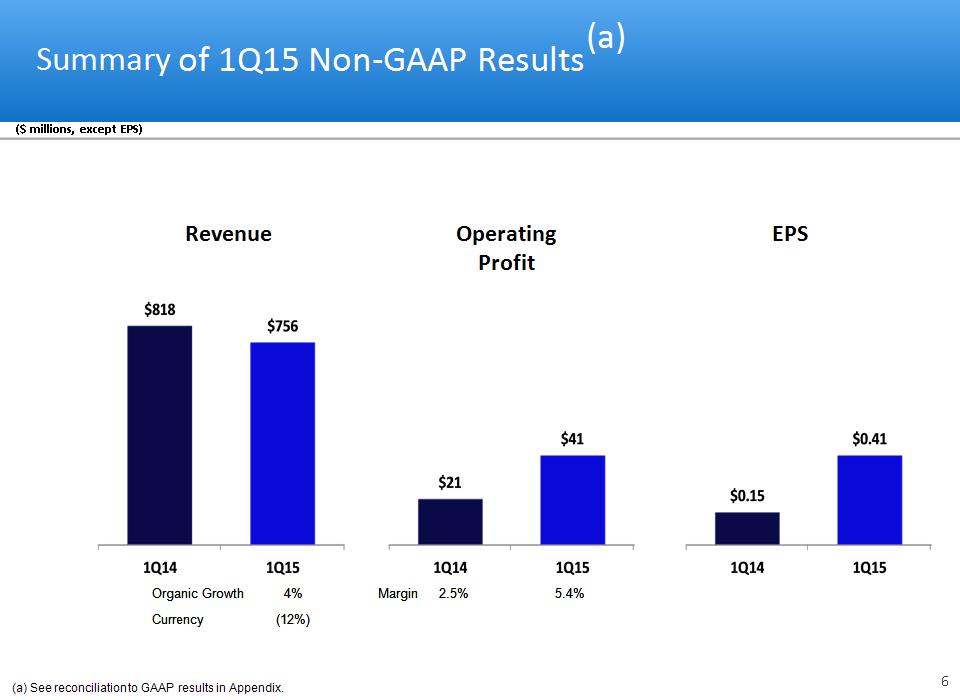
* Summary of 1Q15 Non-GAAP Results(a) ($ millions, except EPS) Revenue Operating Profit EPS Margin 2.5% 5.4% Organic Growth 4% Currency (12%) (a) See reconciliation to GAAP results in Appendix.
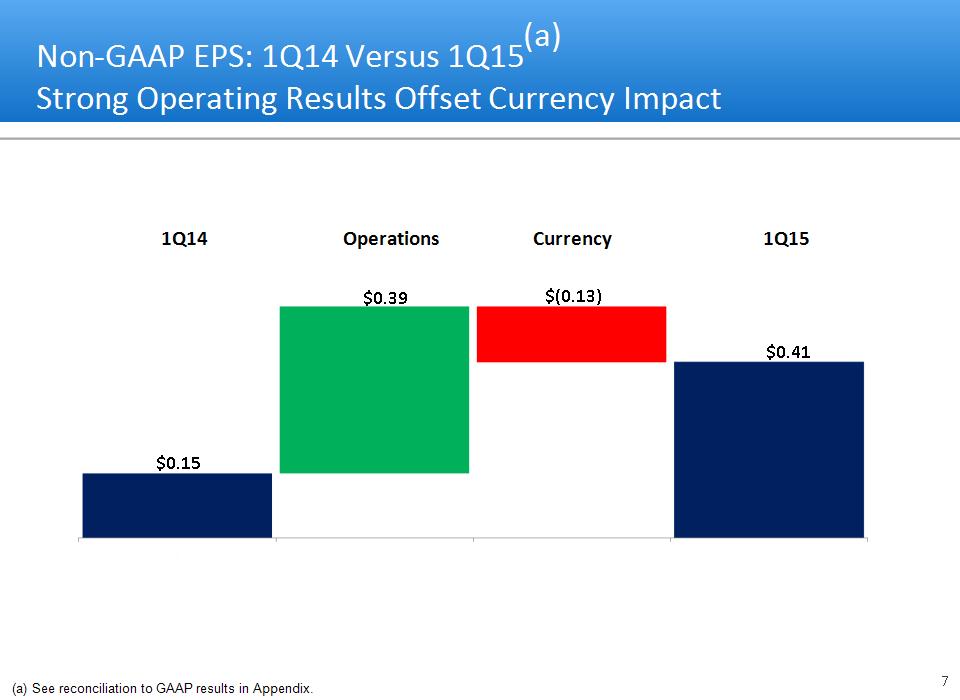
* Non-GAAP EPS: 1Q14 Versus 1Q15(a) Strong Operating Results Offset Currency Impact Currency Operations 1Q14 1Q15 $0.15 $0.41 $(0.13) $0.39 (a) See reconciliation to GAAP results in Appendix.

* Non-GAAP Cash Flow, Capital Investment and Net Debt ($ millions) Capital Expenditures and Capital Leases(b) Net Debt(a) Non-GAAP CFOA(a) (Excluding pension payments) $17 $(23) 1Q14 1Q15 See reconciliation to GAAP results in Appendix From continuing operations

First Quarter 2015 Segment Results

* ($ millions, except %) U.S. Results: On Track to Meet 2015 Targets Strong growth across most lines of business ATM volume up solid double digits Money processing growth from 2014 “wins” Fuel surcharge adjustments a 1.5% drag on revenue, no margin impact Strong volume drives 4Q14/1Q15 profit SG&A reduced, lower health care costs Focus on key process improvement projects continues Operating Profit Full-Year Outlook ~4 - 5 % Revenue 7% 4% Organic Growth 6.2% Margin rate

Organic Growth ($ millions, except %) * Mexico: Profits Improve Despite Revenue Decline Revenue Peso devaluation drives 1Q15 decline 4Q13/1Q14 lost bank business drives organic decline last 4 quarters Revenue growth in retail partially offset lost bank volume 2Q/3Q14 impact from timing of cost actions versus revenue decline Strong 4Q14 performance Solid 1Q15 results helped by benefits change/timing Operating Profit Full Year Outlook ~6 - 8 % Margin Rate 1Q14 2Q14 3Q14 4Q14 1Q15

* First Quarter Results: France, Brazil & Canada France ($ millions) Aviation security growth offsets slight CIT/money processing declines Expect challenging year on low/no revenue growth and Euro devaluation Repositioning business to focus on customer cash supply chain Brazil Revenue growth from price increase timing Solid margin rate but down from strong 1Q14 performance Expect seasonally strong 2H results Canada Revenue decline driven by customer loss due to sale of Threshold business unit in 2013 Pension cost increase from lower discount rate caused profit decline Expect improved 2H results from SG&A actions & some revenue gains Organic Growth 0% Margin 3.9% Organic Growth 4% Margin 8.3% Organic Growth (2%) Margin 4.4%

* Global Markets: Solid Performance Despite Currency Headwinds EMEA ($ millions) No growth environment & unfavorable currency Continued solid margins Expect full-year revenue decline from currency and Germany guarding contract but similar margins as 2014 Latin America Strong organic revenue growth in Argentina and Chile offset by currency Op Profit improvement driven by Argentina and Chile Asia Solid growth and margins across the region Organic Growth 0% Margin 7.1% Organic Growth 16% Margin 18.2% Organic Growth 14% Margin 16.8%

2015 Outlook

2015 EPS Outlook Unchanged - Reflects Strong Operations (a) * 1Q Actuals $0.15 0.39 (0.13) $0.41 Rest of Year 0.86 0.65 – 0.85 (0.37) 1.14 – 1.34 $1.01 1.04 – 1.24 (0.50) $1.55 – 1.75 Currency Operations 2014 2015 Outlook $1.04 - $1.24 $(0.50) $1.01 $1.55 - $1.75 (a) See reconciliation to GAAP results in Appendix.

Non-GAAP 2015 EPS Outlook Unchanged: Increased Margin Rate Offsets Lower Revenue (a) * EPS Guidance unchanged: $1.55 - $1.75 2015 Outlook 2014 2015 Outlook Revenue $3,351 ~$3,100 Op Profit 124 165 - 180 Interest/Other Income (22) (21) Taxes (47) (60- 68) Noncontrolling interests (6) (7) Income from continuing ops (b) 49 77 - 86 EPS Range $1.01 $1.55 – 1.75 Key Metrics Revenue Change Organic $150 5% Currency (400) (12) Total $(250) (7)% Op Profit Margin 3.7% 5.3% - 5.8% Tax Rate 45.7% 42% ($ millions, except EPS) (b) Attributable to Brink’s (a) See reconciliation to GAAP results in Appendix 2015 Key Changes From Prior Guidance Revenue Prior Guidance $3,400 Currency ex Venezuela ~(150) Venezuela ~(150) Current Guidance ~$3,100 Op Profit Prior Guidance $173 – $190 Margin 5.1% - 5.6% Current guidance $165 - $180 Margin 5.3% - 5.8%

Appendix

* ($ millions, except EPS) Brink’s Historical Results(a) Operating Profit EPS (a) See reconciliation to GAAP results in Appendix.

New Organization Structure 4 geographic units replaced with 2 operating units Eliminated regional roles and structures * How We Achieve Our Profit Goals: $45 - $50 Million Cost Savings Expected in 2015 ($ millions) Global Headcount Reductions Global reductions SG&A and operations Majority of 2015 savings implemented in 1Q15 2014 Severance Costs 2015 Savings ~$15 $3 2014 Severance Costs 2015 Savings ~$30-$35 $19

* 2015 & 2016 Margin Rate Targets(a) Prior Reporting Format Segment Non-Segment Operating Profit Margin 5.1% (1.4) 3.7% 6.7 – 7.2% (1.4) 5.3 – 5.8% ~8.3% ~(1.3) ~7.0% Non-GAAP Margin (a) See reconciliation to GAAP results in Appendix.
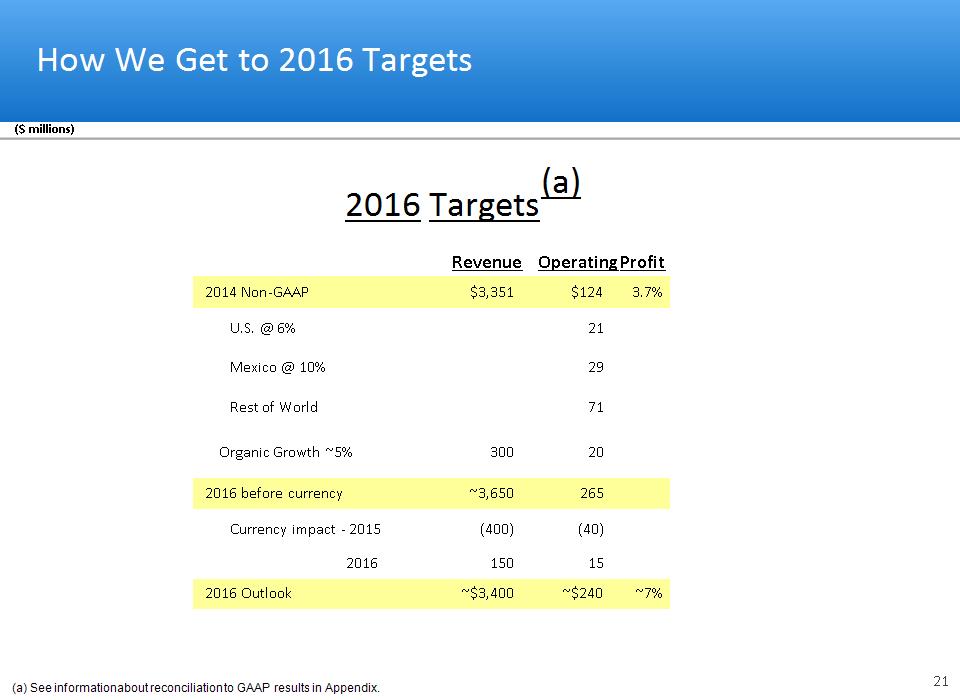
How We Get to 2016 Targets * ($ millions) 2014 Non-GAAP $3,351 $124 3.7% U.S. @ 6% 21 Mexico @ 10% 29 Rest of World 71 Organic Growth ~5% 300 20 2016 before currency ~3,650 265 Currency impact - 2015 (400) (40) 2016 150 15 2016 Outlook ~$3,400 ~$240 ~7% 2016 Targets(a) Operating Profit Revenue (a) See information about reconciliation to GAAP results in Appendix.

* Non-GAAP EPS Outlook(a) Operations 2015 2016 Currency 2015 2016 (a) See reconciliation to 2014 GAAP results and other information in Appendix.

* Non-GAAP Revenue Trend(a) ($ millions) (a) See reconciliation to GAAP results and other information in Appendix.
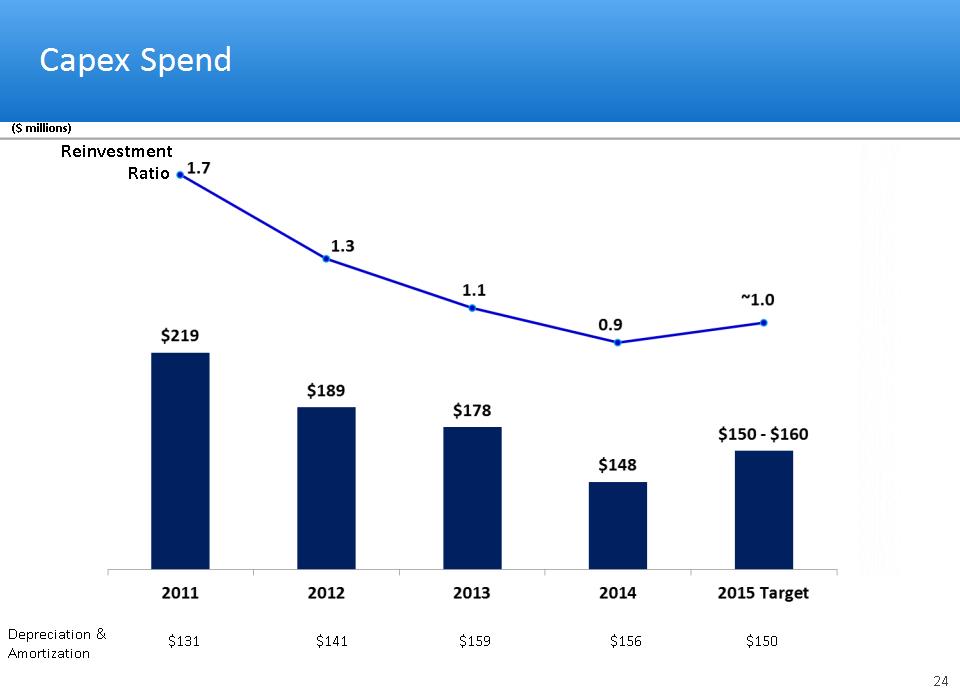
Reinvestment Ratio ($ millions) * Capex Spend Depreciation & Amortization $131 $159 $141 $156 $150

Legacy Liabilities – Underfunding – at December 31, 2014 * ($ millions)

Prepaid 2015 and 2016 pension payments in 3Q14 Accelerates de-risking of invested asset allocation Reduces PBGC premiums (current borrowing costs are lower than PBGC premiums) No future cash payments expected based on current actuarial assumptions Lump-sum pension payments made to eligible former employees in 4Q14 $56 million non-cash GAAP settlement loss recognized in 4Q14 Reduced plan assets by $150 million & liability reduced slightly more No cash payments to UMWA expected until 2032 * Estimated Cash Payments: $0 to Primary U.S. Pension $0 to UMWA until 2032 Payments to Primary U.S. Pension Payments to UMWA through ($ millions) (and beyond)
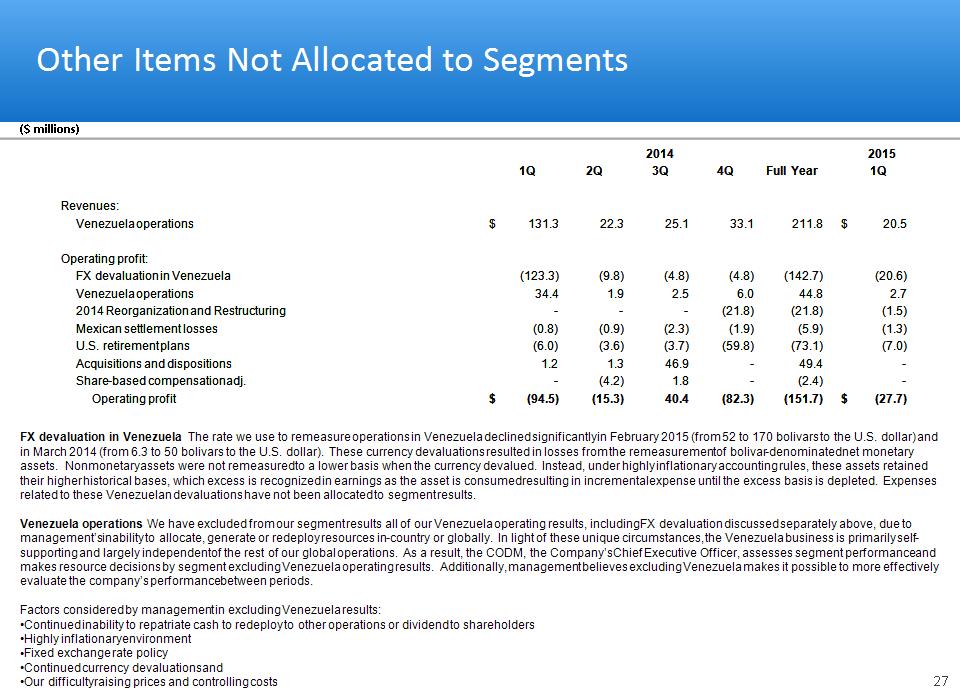
* Other Items Not Allocated to Segments FX devaluation in Venezuela The rate we use to remeasure operations in Venezuela declined significantly in February 2015 (from 52 to 170 bolivars to the U.S. dollar) and in March 2014 (from 6.3 to 50 bolivars to the U.S. dollar). These currency devaluations resulted in losses from the remeasurement of bolivar-denominated net monetary assets. Nonmonetary assets were not remeasured to a lower basis when the currency devalued. Instead, under highly inflationary accounting rules, these assets retained their higher historical bases, which excess is recognized in earnings as the asset is consumed resulting in incremental expense until the excess basis is depleted. Expenses related to these Venezuelan devaluations have not been allocated to segment results. Venezuela operations We have excluded from our segment results all of our Venezuela operating results, including FX devaluation discussed separately above, due to management’s inability to allocate, generate or redeploy resources in-country or globally. In light of these unique circumstances, the Venezuela business is primarily self-supporting and largely independent of the rest of our global operations. As a result, the CODM, the Company’s Chief Executive Officer, assesses segment performance and makes resource decisions by segment excluding Venezuela operating results. Additionally, management believes excluding Venezuela makes it possible to more effectively evaluate the company’s performance between periods. Factors considered by management in excluding Venezuela results: Continued inability to repatriate cash to redeploy to other operations or dividend to shareholders Highly inflationary environment Fixed exchange rate policy Continued currency devaluations and Our difficulty raising prices and controlling costs 2014 2014 2014 2014 2014 2014 2014 2014 2014 2015 2015 1Q 2Q 3Q 4Q Full Year 1Q Revenues: Revenues: Revenues: Revenues: Venezuela operations Venezuela operations Venezuela operations $ 131.3 22.3 25.1 33.1 211.8 $ 20.5 Operating profit: Operating profit: Operating profit: Operating profit: FX devaluation in Venezuela FX devaluation in Venezuela FX devaluation in Venezuela (123.3) (9.8) (4.8) (4.8) (142.7) (20.6) Venezuela operations Venezuela operations Venezuela operations 34.4 1.9 2.5 6.0 44.8 2.7 2014 Reorganization and Restructuring 2014 Reorganization and Restructuring 2014 Reorganization and Restructuring - - - (21.8) (21.8) (1.5) Mexican settlement losses Mexican settlement losses Mexican settlement losses (0.8) (0.9) (2.3) (1.9) (5.9) (1.3) U.S. retirement plans U.S. retirement plans U.S. retirement plans (6.0) (3.6) (3.7) (59.8) (73.1) (7.0) Acquisitions and dispositions Acquisitions and dispositions Acquisitions and dispositions 1.2 1.3 46.9 - 49.4 - Share-based compensation adj. Share-based compensation adj. Share-based compensation adj. - (4.2) 1.8 - (2.4) - Operating profit Operating profit $ (94.5) (15.3) 40.4 (82.3) (151.7) $ (27.7) ($ millions)

* Other Items Not Allocated to Segments 2014 Reorganization and Restructuring Brink’s reorganized and restructured its business in December 2014, eliminating the management roles and structures in its former Latin America and EMEA regions and implementing a plan to reduce the cost structure of various country operations by eliminating approximately 1,700 positions across its global workforce. Severance costs of $21.8 million associated with these actions were recognized in 2014. Additional charges related to severance and lease terminations of $1.5 million were recognized in the first quarter of 2015. These amounts have not been allocated to segment results. Mexican settlement losses Employee termination costs in Mexico are accounted for as retirement benefits under ASC Topic 715. Settlement charges related to these termination benefits have not been allocated to segment results. U.S. retirement plans Costs related to our frozen U.S. retirement plans have not been allocated to segment results. Brink’s primary U.S. pension plan settled a portion of its obligation in the fourth quarter of 2014 under a lump sum buy-out offer. Approximately 4,300 terminated participants were paid about $150 million of plan assets under this offer in lieu of receiving their pension benefit. A $56 million settlement loss was recognized as a result of the settlement. Acquisitions and dispositions Gains and losses related to acquisitions and dispositions that have not been allocated to segment results are described below: Brink’s sold an equity investment in a CIT business in Peru and recognized a $44.3 million gain in the third quarter of 2014. The gain on the sale and the equity earnings have not been allocated to segment results. A favorable adjustment to the 2010 business acquisition gain for Mexico ($0.7 million in the third quarter of 2014) is not allocated to segment results. Share-based compensation adjustment Accounting adjustments related to share-based compensation have not been allocated to segment results ($4.2 million expense in the second quarter of 2014 and a $1.8 million benefit in the third quarter of 2014). The accounting adjustments revise the accounting for certain share-based awards from fixed to variable fair value accounting as noted in ASC Topic 718, Stock Compensation. As of July 11, 2014, all outstanding equity awards had met the conditions for a grant date as defined in ASC Topic 718 and have since been accounted for as fixed share-based compensation expense.

* Non-GAAP Reconciled to GAAP (In millions, except for percentages and per share amounts) 2014 2014 2014 2014 2014 2014 2014 2014 2014 2015 2015 1Q 2Q 3Q 4Q Full Year 1Q Revenues: Revenues: Revenues: Revenues: Non-GAAP Non-GAAP Non-GAAP Non-GAAP $ 818.3 836.7 847.4 848.1 3,350.5 $ 755.6 Other items not allocated to segments(b) Other items not allocated to segments(b) Other items not allocated to segments(b) 131.3 22.3 25.1 33.1 211.8 20.5 GAAP GAAP GAAP GAAP $ 949.6 859.0 872.5 881.2 3,562.3 $ 776.1 Operating profit (loss): Operating profit (loss): Operating profit (loss): Operating profit (loss): Non-GAAP Non-GAAP Non-GAAP Non-GAAP $ 20.8 24.0 20.8 58.6 124.2 40.6 Other items not allocated to segments(b) Other items not allocated to segments(b) Other items not allocated to segments(b) (94.5) (15.3) 40.4 (82.3) (151.7) (27.7) GAAP GAAP GAAP GAAP $ (73.7) 8.7 61.2 (23.7) (27.5) $ 12.9 Taxes: Taxes: Taxes: Taxes: Non-GAAP Non-GAAP Non-GAAP Non-GAAP $ 6.9 8.5 6.7 24.8 46.9 15.2 Other items not allocated to segments(b) Other items not allocated to segments(b) Other items not allocated to segments(b) (3.3) (1.3) 21.5 (27.1) (10.2) (3.9) Income tax rate adjustment(c) Income tax rate adjustment(c) Income tax rate adjustment(c) 5.1 (3.1) (1.4) (0.6) - 4.2 GAAP GAAP GAAP GAAP $ 8.7 4.1 26.8 (2.9) 36.7 $ 15.5 Noncontrolling interests: Noncontrolling interests: Noncontrolling interests: Noncontrolling interests: Non-GAAP Non-GAAP Non-GAAP Non-GAAP Non-GAAP $ 0.8 2.1 2.2 1.3 6.4 0.8 Other items not allocated to segments(b) Other items not allocated to segments(b) Other items not allocated to segments(b) (31.3) (3.7) (1.6) (0.7) (37.3) (6.2) Income tax rate adjustment(c) Income tax rate adjustment(c) Income tax rate adjustment(c) 1.3 - (1.2) (0.1) - (1.1) GAAP GAAP GAAP GAAP $ (29.2) (1.6) (0.6) 0.5 (30.9) $ (6.5) Income from continuing operations attributable to Brink's: Income from continuing operations attributable to Brink's: Income from continuing operations attributable to Brink's: Income from continuing operations attributable to Brink's: Non-GAAP Non-GAAP Non-GAAP Non-GAAP $ 7.3 8.1 5.7 28.3 49.4 20.1 Other items not allocated to segments(b) Other items not allocated to segments(b) Other items not allocated to segments(b) (59.9) (10.3) 20.5 (54.5) (104.2) (17.6) Income tax rate adjustment(c) Income tax rate adjustment(c) Income tax rate adjustment(c) (6.4) 3.1 2.6 0.7 - (3.1) GAAP GAAP GAAP GAAP $ (59.0) 0.9 28.8 (25.5) (54.8) $ (0.6) EPS: EPS: EPS: EPS: Non-GAAP Non-GAAP Non-GAAP Non-GAAP $ 0.15 0.16 0.12 0.58 1.01 0.41 Other items not allocated to segments(b) Other items not allocated to segments(b) Other items not allocated to segments(b) (1.23) (0.21) 0.41 (1.12) (2.12) (0.36) Income tax rate adjustment(c) Income tax rate adjustment(c) Income tax rate adjustment(c) (0.13) 0.06 0.05 0.01 - (0.06) GAAP GAAP GAAP GAAP $ (1.21) 0.02 0.58 (0.52) (1.12) $ (0.01) Non-GAAP margin Non-GAAP margin Non-GAAP margin Non-GAAP margin 2.5% 2.9% 2.5% 6.9% 3.7% 5.4% Amounts may not add due to rounding. See slide 30 for footnote explanations

* Non-GAAP Reconciled to GAAP Amounts may not add due to rounding. From continuing operations. See “Other Items Not Allocated To Segments” on slides 27-28 for pre-tax amounts and details. Other Items Not Allocated To Segments for noncontrolling interests, income from continuing operations attributable to Brink's and EPS are the effects of the same items at their respective line items of the consolidated statements of income (loss). Non-GAAP income from continuing operations and non-GAAP EPS have been adjusted to reflect an effective income tax rate in each interim period equal to the full-year non-GAAP effective income tax rate. The estimated full-year non-GAAP effective tax rate is 42.0% for 2015 and was 45.7% for 2014. Note: The consolidated non-GAAP outlook amounts for 2015 and 2016 are not reconciled to GAAP because we are unable to quantify certain amounts that would be required to be included in the GAAP measure without unreasonable effort. Three Months Ended Three Months Ended Three Months Ended Three Months Ended Three Months Ended Three Months Ended Three Months Ended Three Months Ended Three Months Ended Three Months Ended March 31, 2015 March 31, 2015 March 31, 2015 March 31, 2015 March 31, 2015 March 31, 2014 March 31, 2014 March 31, 2014 March 31, 2014 March 31, 2014 Pre-tax Tax Effective tax rate Pre-tax Tax Effective tax rate Effective Income Tax Rate(a) Effective Income Tax Rate(a) Effective Income Tax Rate(a) Non-GAAP Non-GAAP Non-GAAP Non-GAAP 36.1 15.2 42.0% 15.0 6.9 45.7% Other items not allocated to segments(b) Other items not allocated to segments(b) (27.7) 0.3 142.5% (94.5) 1.8 (56.6%) GAAP GAAP GAAP $ 8.4 15.5 184.5% $ (79.5) 8.7 (10.9%)

* Non-GAAP Reconciliations – Cash Flows To eliminate the change in the balance of customer obligations related to cash received and processed in certain of our secure Cash Management Services operations. The title to this cash transfers to us for a short period of time. The cash is generally credited to customers’ accounts the following day and we do not consider it as available for general corporate purposes in the management of our liquidity and capital resources. Both measures of “Non-GAAP cash flows from operating activities” (before and after U.S. pension contributions) are supplemental financial measures that are not required by, or presented in accordance with GAAP. The purpose of these Non-GAAP measures is to report financial information excluding the impact of cash received and processed in certain of our Cash Management Services operations, without cash flows from discontinued operations and with and without cash flows related to the primary U.S pension plan. We believe these measures are helpful in assessing cash flows from operations, enable period-to-period comparability and are useful in predicting future operating cash flows. These Non-GAAP measures should not be considered as an alternative to cash flows from operating activities determined in accordance with GAAP and should be read in conjunction with our consolidated statements of cash flows. ($ millions) NON-GAAP CASH FLOWS FROM OPERATING ACTIVITIES – RECONCILED TO U.S. GAAP NON-GAAP CASH FLOWS FROM OPERATING ACTIVITIES – RECONCILED TO U.S. GAAP NON-GAAP CASH FLOWS FROM OPERATING ACTIVITIES – RECONCILED TO U.S. GAAP NON-GAAP CASH FLOWS FROM OPERATING ACTIVITIES – RECONCILED TO U.S. GAAP First Quarter First Quarter First Quarter First Quarter First Quarter (In millions) 2015 2014 Cash flows from operating activities – GAAP Cash flows from operating activities – GAAP $ (23.4) $ 30.6 Decrease (increase) in certain customer obligations(a) Decrease (increase) in certain customer obligations(a) (1.5) (7.4) Cash outflows (inflows) related to discontinued operations Cash outflows (inflows) related to discontinued operations 2.0 (2.6) Cash flows from operating activities – Non-GAAP (reduced by pension contributions) (22.9) 20.6 Contributions to primary U.S. pension plan Contributions to primary U.S. pension plan - (3.4) Cash flows from operating activities – Non-GAAP (before pension contributions) $ (22.9) $ 17.2

* Title to cash received and processed in certain of our secure Cash Management Services operations transfers to us for a short period of time. The cash is generally credited to customers’ accounts the following day and we do not consider it as available for general corporate purposes in the management of our liquidity and capital resources and in our computation of Net Debt. Net Debt is a supplemental Non-GAAP financial measure that is not required by, or presented in accordance with GAAP. We use Net Debt as a measure of our financial leverage. We believe that investors also may find Net Debt to be helpful in evaluating our financial leverage. Net Debt should not be considered as an alternative to Debt determined in accordance with GAAP and should be reviewed in conjunction with our consolidated balance sheets. Set forth above is a reconciliation of Net Debt, a Non-GAAP financial measure, to Debt, which is the most directly comparable financial measure calculated and reported in accordance with GAAP. Net Debt excluding cash and debt in Venezuelan operations was $373 million at March 31, 2015, and $332 million at December 31, 2014. Non-GAAP Reconciliations – Net Debt March 31, December 31, (In millions) (In millions) (In millions) 2015 2014 Debt: Debt: Debt: Short-term Short-term $ 47.0 59.4 Long-term Long-term 460.8 407.4 Total Debt 507.8 466.8 Less: Less: Less: Cash and cash equivalents Cash and cash equivalents 168.8 176.2 Amounts held by Cash Management Services operations(a) Amounts held by Cash Management Services operations(a) (29.6) (28.0) Cash and cash equivalents available for general corporate purposes 139.2 148.2 Net Debt $ 368.6 318.6