Attached files
| file | filename |
|---|---|
| EX-99.1 - EXHIBIT 99.1 - OMNICARE INC | ocrerex991q12015.htm |
| 8-K - 8-K - OMNICARE INC | a8-kshellq12015pr.htm |
First-Quarter 2015 Financial Results Supplemental Slides
Certain of the statements made today and listed within the following presentation slides are forward-looking statements within the meaning of the Private Securities Litigation Reform Act of 1995. These forward-looking statements include, but are not limited to, all statements regarding the intent, belief or current expectations regarding the matters discussed in this presentation. Such forward-looking statements are based on management’s current expectations and involve known and unknown risks, uncertainties, contingencies and other factors that could cause results, performance or achievements to differ materially from those stated. The most significant of these risks and uncertainties are described in the Company’s Form 10-K, Form 10-Q and Form 8-K reports filed with the Securities and Exchange Commission. Investors are cautioned that such statements are only predictions and that actual events or results may differ materially. These forward-looking statements speak only as of the date this presentation was originally given. We undertake no obligation to publicly release the results of any revisions to the forward-looking statements made today, to reflect events or circumstances after today or to reflect the occurrence of unanticipated events. To facilitate comparisons and enhance understanding of core operating performance, certain financial measures have been adjusted from the comparable amount under Generally Accepted Accounting Principles (GAAP). A detailed reconciliation of adjusted numbers to the most comparable GAAP numbers is attached to our press release and posted under “Supplemental Financial Data” in the Investors section of our website at http://ir.omnicare.com. Additionally, all amounts are presented on a continuing operations basis, unless otherwise stated. 2 Forward-Looking Statements
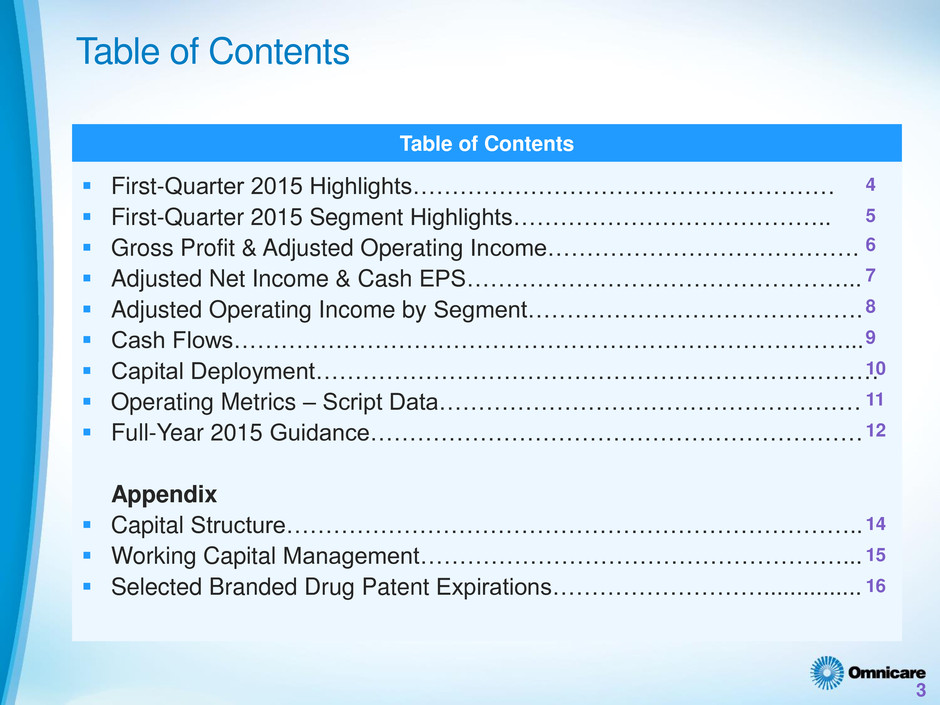
3 Table of Contents First-Quarter 2015 Highlights……………………………………………… First-Quarter 2015 Segment Highlights………………………………….. Gross Profit & Adjusted Operating Income…………………………………. Adjusted Net Income & Cash EPS…………………………………………... Adjusted Operating Income by Segment……………………………………. Cash Flows……………………………………………………………………... Capital Deployment……………………………………………………………… Operating Metrics – Script Data……………………………………………… Full-Year 2015 Guidance……………………………………………………… Appendix Capital Structure……………………………………………………………….. Working Capital Management………………………………………………... Selected Branded Drug Patent Expirations………………………............... Table of Contents 4 12 5 6 7 8 9 10 11 16 14 15
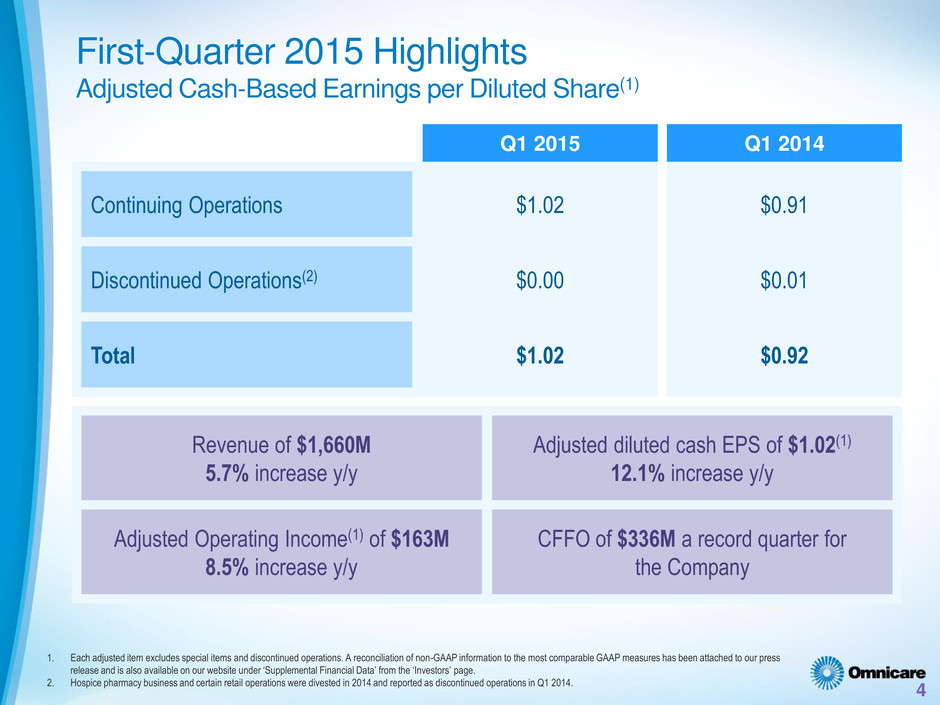
Continuing Operations First-Quarter 2015 Highlights Adjusted Cash-Based Earnings per Diluted Share(1) 4 Q1 2014 Q1 2015 Discontinued Operations(2) Total $1.02 $0.00 $1.02 $0.91 $0.01 $0.92 Revenue of $1,660M 5.7% increase y/y 1. Each adjusted item excludes special items and discontinued operations. A reconciliation of non-GAAP information to the most comparable GAAP measures has been attached to our press release and is also available on our website under ‘Supplemental Financial Data’ from the ‘Investors’ page. 2. Hospice pharmacy business and certain retail operations were divested in 2014 and reported as discontinued operations in Q1 2014. Adjusted diluted cash EPS of $1.02(1) 12.1% increase y/y Adjusted Operating Income(1) of $163M 8.5% increase y/y CFFO of $336M a record quarter for the Company
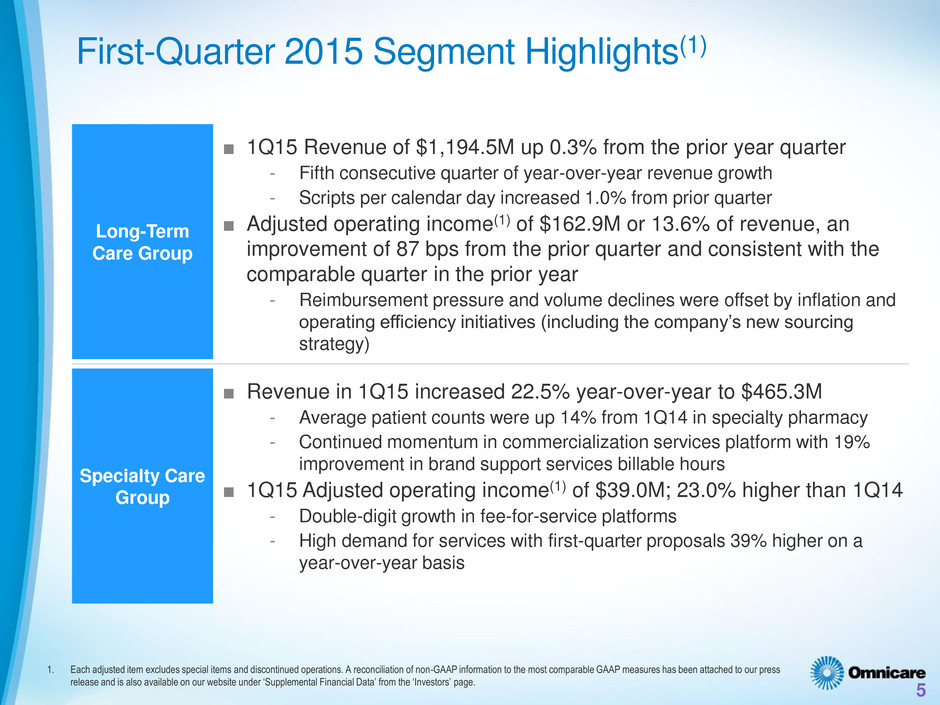
First-Quarter 2015 Segment Highlights(1) 5 Long-Term Care Group Specialty Care Group ■ 1Q15 Revenue of $1,194.5M up 0.3% from the prior year quarter - Fifth consecutive quarter of year-over-year revenue growth - Scripts per calendar day increased 1.0% from prior quarter ■ Adjusted operating income(1) of $162.9M or 13.6% of revenue, an improvement of 87 bps from the prior quarter and consistent with the comparable quarter in the prior year - Reimbursement pressure and volume declines were offset by inflation and operating efficiency initiatives (including the company’s new sourcing strategy) ■ Revenue in 1Q15 increased 22.5% year-over-year to $465.3M - Average patient counts were up 14% from 1Q14 in specialty pharmacy - Continued momentum in commercialization services platform with 19% improvement in brand support services billable hours ■ 1Q15 Adjusted operating income(1) of $39.0M; 23.0% higher than 1Q14 - Double-digit growth in fee-for-service platforms - High demand for services with first-quarter proposals 39% higher on a year-over-year basis 1. Each adjusted item excludes special items and discontinued operations. A reconciliation of non-GAAP information to the most comparable GAAP measures has been attached to our press release and is also available on our website under ‘Supplemental Financial Data’ from the ‘Investors’ page.
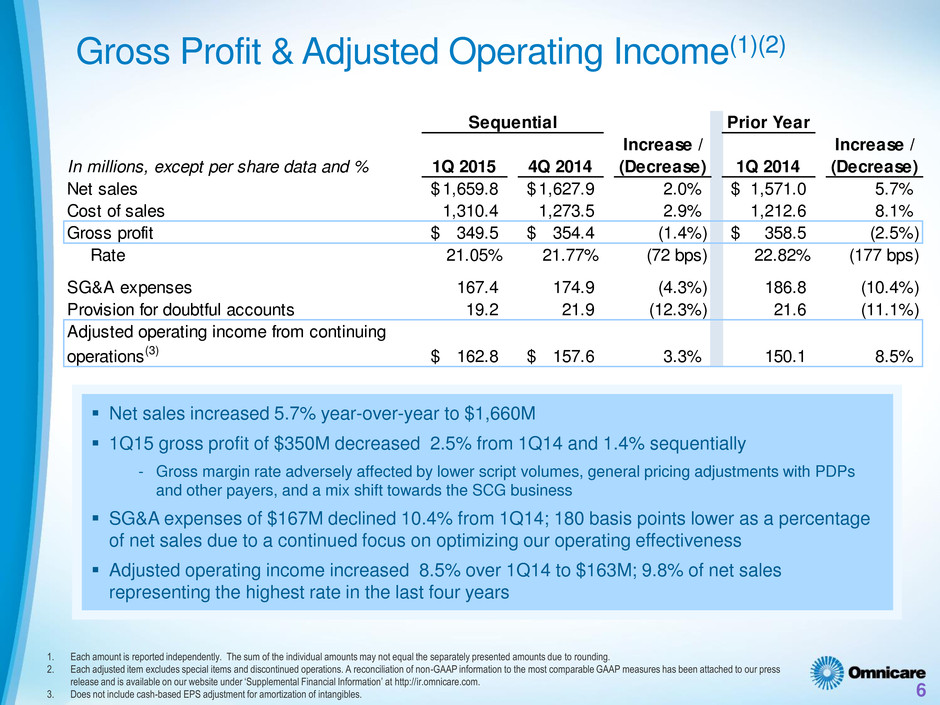
Prior Year In millions, except per share data and % 1Q 2015 4Q 2014 Increase / (Decrease) 1Q 2014 Increase / (Decrease) Net sales 1,659.8$ 1,627.9$ 2.0% 1,571.0$ 5.7% Cost of sales 1,310.4 1,273.5 2.9% 1,212.6 8.1% Gross profit 349.5$ 354.4$ (1.4%) 358.5$ (2.5%) Rate 21.05% 21.77% (72 bps) 22.82% (177 bps) SG&A expenses 167.4 174.9 (4.3%) 186.8 (10.4%) Provision for doubtful accounts 19.2 21.9 (12.3%) 21.6 (11.1%) Adjusted operating income from continuing operations(3) 162.8$ 157.6$ 3.3% 150.1 8.5% Sequential Gross Profit & Adjusted Operating Income(1)(2) 6 Net sales increased 5.7% year-over-year to $1,660M 1Q15 gross profit of $350M decreased 2.5% from 1Q14 and 1.4% sequentially - Gross margin rate adversely affected by lower script volumes, general pricing adjustments with PDPs and other payers, and a mix shift towards the SCG business SG&A expenses of $167M declined 10.4% from 1Q14; 180 basis points lower as a percentage of net sales due to a continued focus on optimizing our operating effectiveness Adjusted operating income increased 8.5% over 1Q14 to $163M; 9.8% of net sales representing the highest rate in the last four years 1. Each amount is reported independently. The sum of the individual amounts may not equal the separately presented amounts due to rounding. 2. Each adjusted item excludes special items and discontinued operations. A reconciliation of non-GAAP information to the most comparable GAAP measures has been attached to our press release and is available on our website under ‘Supplemental Financial Information’ at http://ir.omnicare.com. 3. Does not include cash-based EPS adjustment for amortization of intangibles.
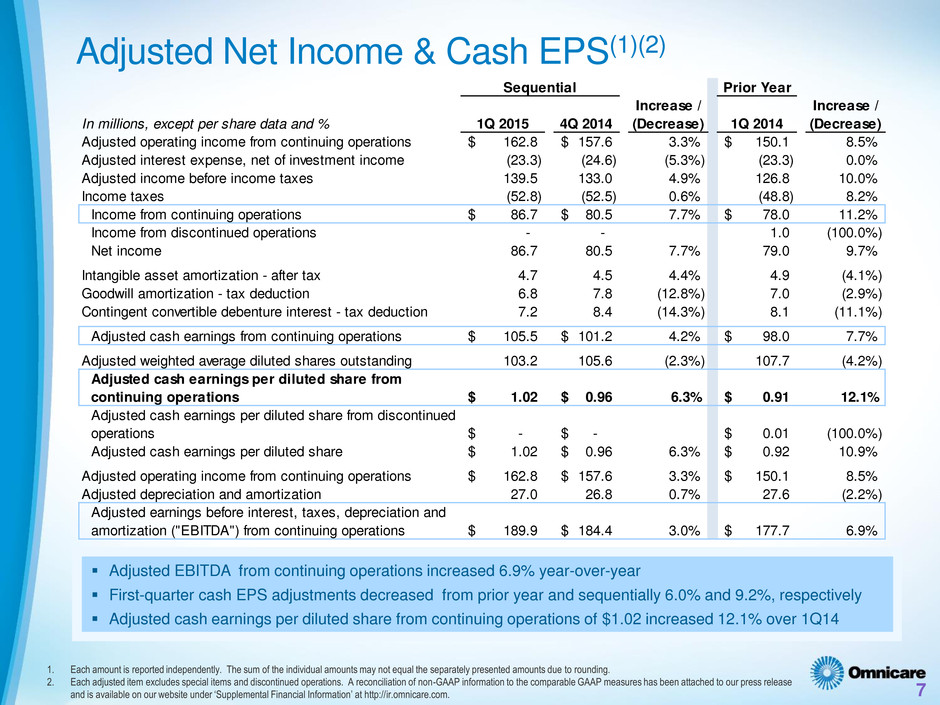
Adjusted Net Income & Cash EPS(1)(2) 7 1. Each amount is reported independently. The sum of the individual amounts may not equal the separately presented amounts due to rounding. 2. Each adjusted item excludes special items and discontinued operations. A reconciliation of non-GAAP information to the comparable GAAP measures has been attached to our press release and is available on our website under ‘Supplemental Financial Information’ at http://ir.omnicare.com. Adjusted EBITDA from continuing operations increased 6.9% year-over-year First-quarter cash EPS adjustments decreased from prior year and sequentially 6.0% and 9.2%, respectively Adjusted cash earnings per diluted share from continuing operations of $1.02 increased 12.1% over 1Q14 Prior Year In millions, except per share data and % 1Q 2015 4Q 2014 Increase / (Decrease) 1Q 2014 Increase / (Decrease) Adjusted operating income from continuing operations 162.8$ 157.6$ 3.3% 150.1$ 8.5% Adjusted interest expense, net of investment income (23.3) (24.6) (5.3%) (23.3) 0.0% Adjusted income before income taxes 139.5 133.0 4.9% 126.8 10.0% Income taxes (52.8) (52.5) 0.6% (48.8) 8.2% Income from continuing operations 86.7$ 80.5$ 7.7% 78.0$ 11.2% Income from discontinued operations - - 1.0 (100.0%) Net income 86.7 80.5 7.7% 79.0 9.7% Intangible asset amortization - after tax 4.7 4.5 4.4% 4.9 (4.1%) Goodwill amortization - tax deduction 6.8 7.8 (12.8%) 7.0 (2.9%) Contingent convertible debenture interest - tax deduction 7.2 8.4 (14.3%) 8.1 (11.1%) Adjusted cash earnings from continuing operations 105.5$ 101.2$ 4.2% 98.0$ 7.7% Adjusted weighted average diluted shares outstanding 103.2 105.6 (2.3%) 107.7 (4.2%) Adjusted cash earnings per diluted share from continuing operations 1.02$ 0.96$ 6.3% 0.91$ 12.1% Adjusted cash earnings per diluted share from discontinued operations -$ -$ 0.01$ (100.0%) Adjusted cash earnings per diluted share 1.02$ 0.96$ 6.3% 0.92$ 10.9% Adjusted operating income from continuing operations 162.8$ 157.6$ 3.3% 150.1$ 8.5% Adjusted depreciation and amortization 27.0 26.8 0.7% 27.6 (2.2%) Adjusted earnings before interest, taxes, depreciation and amortization ("EBITDA") from continuing operations 189.9$ 184.4$ 3.0% 177.7$ 6.9% Sequential
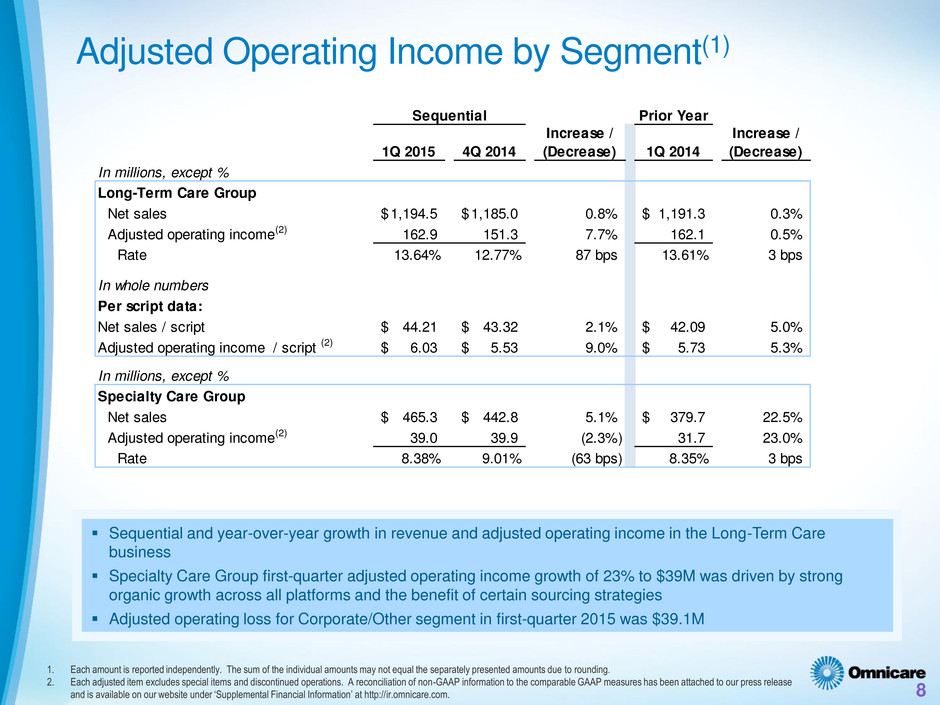
Adjusted Operating Income by Segment(1) 8 Sequential and year-over-year growth in revenue and adjusted operating income in the Long-Term Care business Specialty Care Group first-quarter adjusted operating income growth of 23% to $39M was driven by strong organic growth across all platforms and the benefit of certain sourcing strategies Adjusted operating loss for Corporate/Other segment in first-quarter 2015 was $39.1M 1. Each amount is reported independently. The sum of the individual amounts may not equal the separately presented amounts due to rounding. 2. Each adjusted item excludes special items and discontinued operations. A reconciliation of non-GAAP information to the comparable GAAP measures has been attached to our press release and is available on our website under ‘Supplemental Financial Information’ at http://ir.omnicare.com. Prior Year 1Q 2015 4Q 2014 Increase / (Decrease) 1Q 2014 Increase / (Decrease) In millions, except % Long-Term Care Group Net sales 1,194.5$ 1,185.0$ 0.8% 1,191.3$ 0.3% Adjusted operating income(2) 162.9 151.3 7.7% 162.1 0.5% Rate 13.64% 12.77% 87 bps 13.61% 3 bps In whole numbers Per script data: Net sales / script 44.21$ 43.32$ 2.1% 42.09$ 5.0% Adjusted operating income / script (2) 6.03$ 5.53$ 9.0% 5.73$ 5.3% In millions, except % Specialty Care Group Net sales 465.3$ 442.8$ 5.1% 379.7$ 22.5% Adjusted operating income(2) 39.0 39.9 (2.3%) 31.7 23.0% Rate 8.38% 9.01% (63 bps) 8.35% 3 bps Sequential
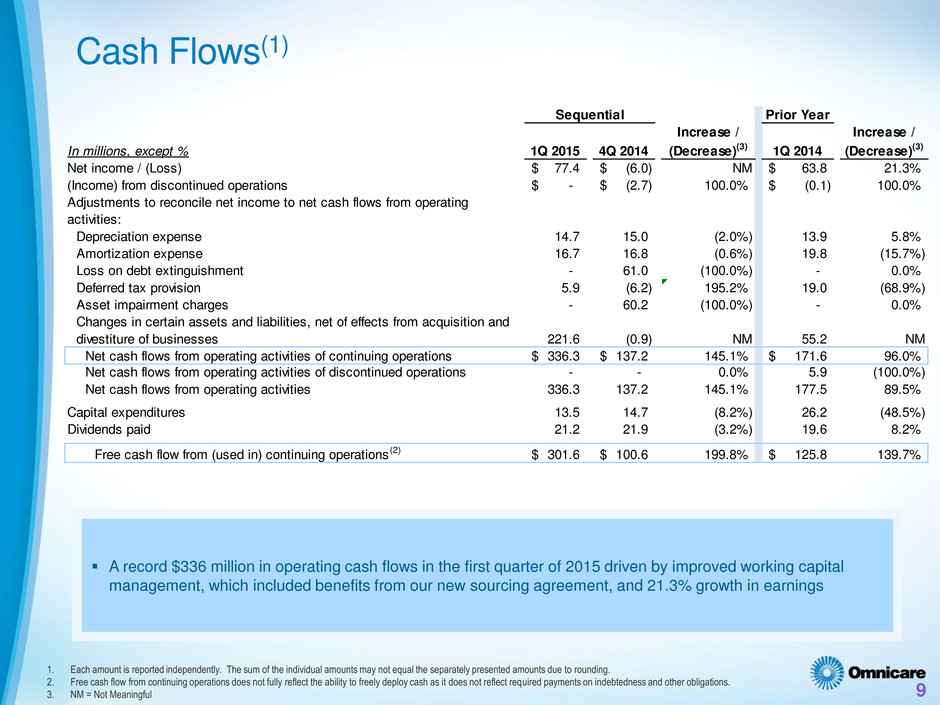
Prior Year In millions, except % 1Q 2015 4Q 2014 Increase / (Decrease)(3) 1Q 2014 Increase / (Decrease)(3) Net income / (Loss) 77.4$ (6.0)$ NM 63.8$ 21.3% (Income) from discontinued operations -$ (2.7)$ 100.0% (0.1)$ 100.0% Adjustments to reconcile net income to net cash flows from operating activities: Depreciation expense 14.7 15.0 (2.0%) 13.9 5.8% Amortization expense 16.7 16.8 (0.6%) 19.8 (15.7%) Loss on debt extinguishment - 61.0 (100.0%) - 0.0% Deferred tax provision 5.9 (6.2) 195.2% 19.0 (68.9%) Asset impairment charges - 60.2 (100.0%) - 0.0% Changes in certain assets and liabilities, net of effects from acquisition and divestiture of businesses 221.6 (0.9) NM 55.2 NM Net cash flows from operating activities of continuing operations 336.3$ 137.2$ 145.1% 171.6$ 96.0% Net cash flows from operating activities of discontinued operations - - 0.0% 5.9 (100.0%) Net cash flows from operating activities 336.3 137.2 145.1% 177.5 89.5% Capital expenditures 13.5 14.7 (8.2%) 26.2 (48.5%) Dividends paid 21.2 21.9 (3.2%) 19.6 8.2% Free cash flow from (used in) continuing operations (2) 301.6$ 100.6$ 199.8% 125.8$ 139.7% Sequential Cash Flows(1) 9 1. Each amount is reported independently. The sum of the individual amounts may not equal the separately presented amounts due to rounding. 2. Free cash flow from continuing operations does not fully reflect the ability to freely deploy cash as it does not reflect required payments on indebtedness and other obligations. 3. NM = Not Meaningful A record $336 million in operating cash flows in the first quarter of 2015 driven by improved working capital management, which included benefits from our new sourcing agreement, and 21.3% growth in earnings
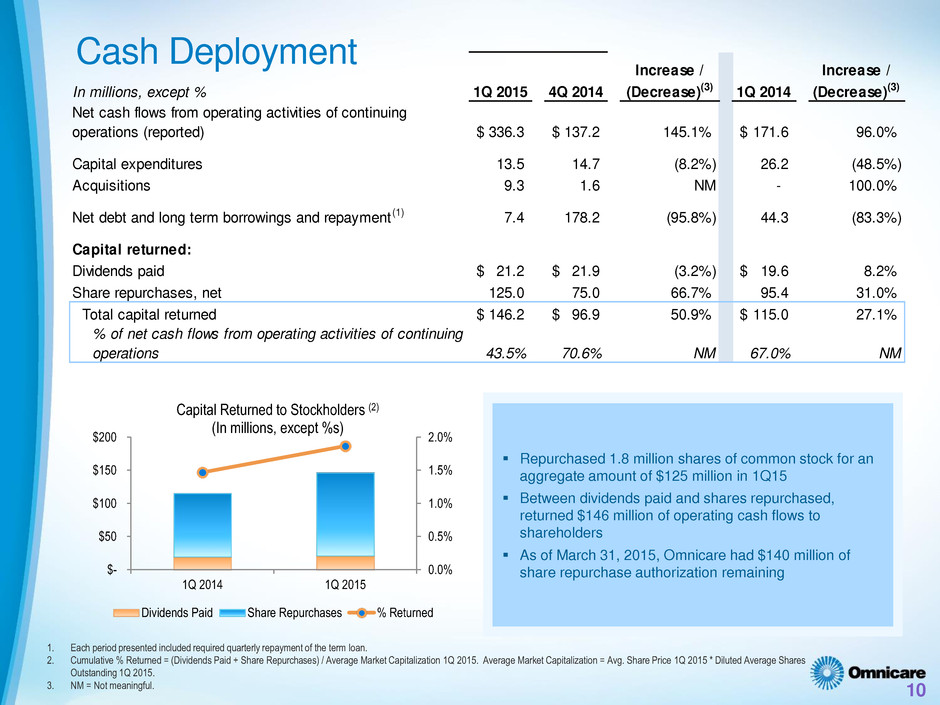
Cash Deployment 10 Repurchased 1.8 million shares of common stock for an aggregate amount of $125 million in 1Q15 Between dividends paid and shares repurchased, returned $146 million of operating cash flows to shareholders As of March 31, 2015, Omnicare had $140 million of share repurchase authorization remaining 1. Each period presented included required quarterly repayment of the term loan. 2. Cumulative % Returned = (Dividends Paid + Share Repurchases) / Average Market Capitalization 1Q 2015. Average Market Capitalization = Avg. Share Price 1Q 2015 * Diluted Average Shares Outstanding 1Q 2015. 3. NM = Not meaningful. In millions, except % 1Q 2015 4Q 2014 Increase / (Decrease)(3) 1Q 2014 Increase / (Decrease)(3) Net cash flows from operating activities of continuing operations (reported) 336.3$ 137.2$ 145.1% 171.6$ 96.0% Capital expenditures 13.5 14.7 (8.2%) 26.2 (48.5%) Acquisitions 9.3 1.6 NM - 100.0% Net debt and long term borrowings and repayment (1) 7.4 178.2 (95.8%) 44.3 (83.3%) apital returned: Dividends paid 21.2$ 21.9$ (3.2%) 19.6$ 8.2% Share repurchases, net 125.0 75.0 66.7% 95.4 31.0% Total capital returned 146.2$ 96.9$ 50.9% 115.0$ 27.1% % of net cash flows from operating activities of continuing operations 43.5% 70.6% NM 67.0% NM 0.0% 0.5% 1.0% 1.5% 2.0% $- $50 $100 $150 $200 1Q 2014 1Q 2015 Capital Returned to Stockholders (2) (In millions, except %s) Dividends Paid Share Repurchases % Returned
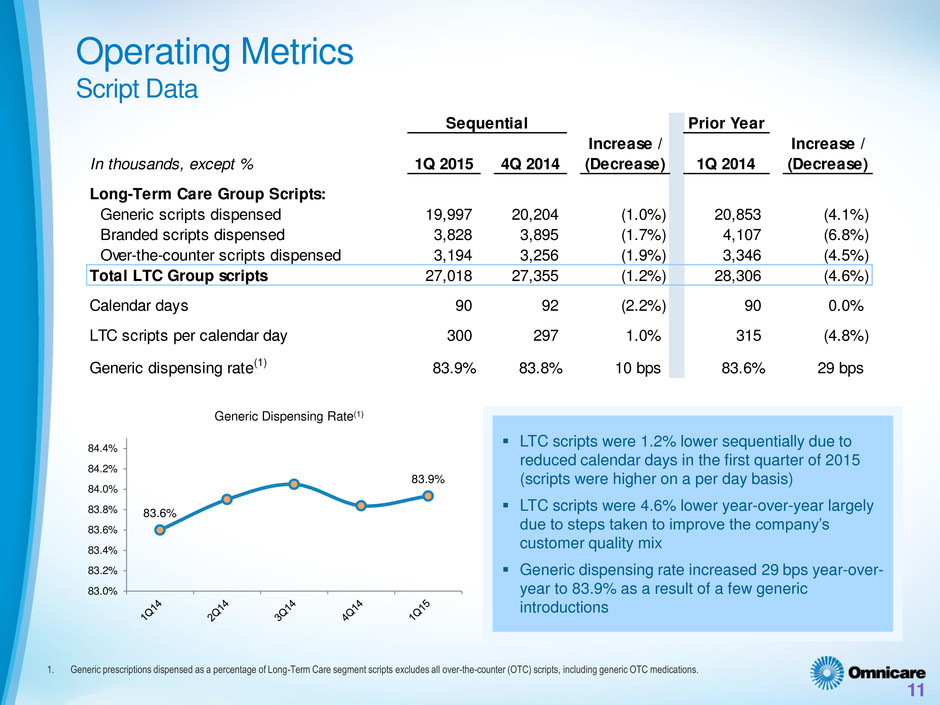
Prior Year In thousands, except % 1Q 2015 4Q 2014 Increase / (Decrease) 1Q 2014 Increase / (Decrease) Long-Term Care Group Scripts: Generic scripts dispensed 19,997 20,204 (1.0%) 20,853 (4.1%) Branded scripts dispensed 3,828 3,895 (1.7%) 4,107 (6.8%) Over-the-counter scripts dispensed 3,194 3,256 (1.9%) 3,346 (4.5%) Total LTC Group scripts 27,018 27,355 (1.2%) 28,306 (4.6%) Calendar days 90 92 (2.2%) 90 0.0% LTC scripts per calendar day 300 297 1.0% 315 (4.8%) Generic dispensing rate(1) 83.9% 83.8% 10 bps 83.6% 29 bps Sequential Operating Metrics Script Data 11 1. Generic prescriptions dispensed as a percentage of Long-Term Care segment scripts excludes all over-the-counter (OTC) scripts, including generic OTC medications. LTC scripts were 1.2% lower sequentially due to reduced calendar days in the first quarter of 2015 (scripts were higher on a per day basis) LTC scripts were 4.6% lower year-over-year largely due to steps taken to improve the company’s customer quality mix Generic dispensing rate increased 29 bps year-over- year to 83.9% as a result of a few generic introductions 83.6% 83.9% 83.0% 83.2% 83.4% 83.6% 83.8% 84.0% 84.2% 84.4% Generic Dispensing Rate(1)
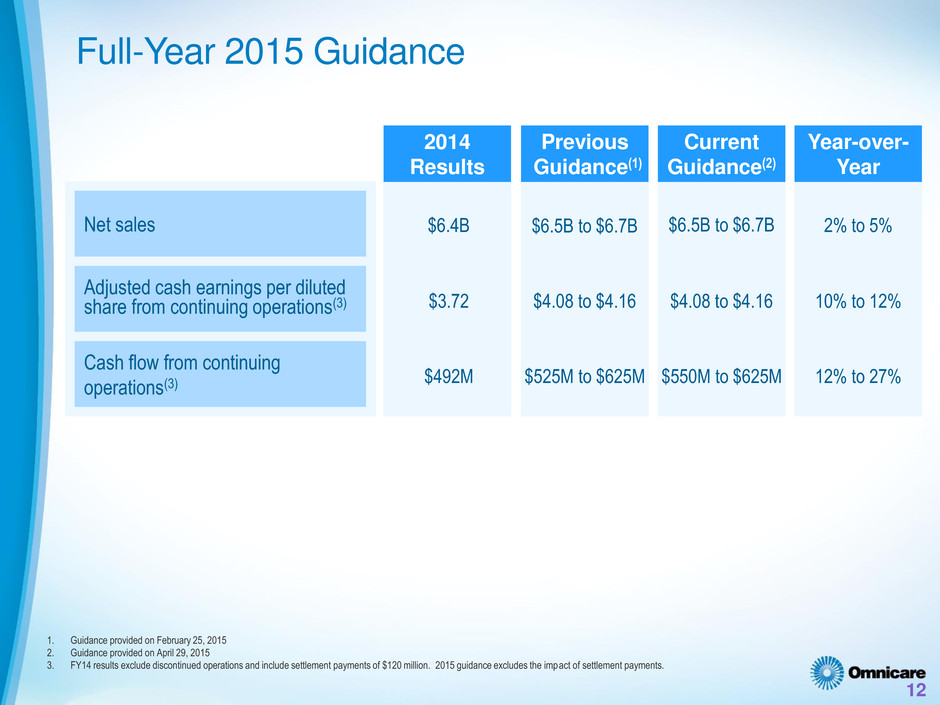
Full-Year 2015 Guidance 1. Guidance provided on February 25, 2015 2. Guidance provided on April 29, 2015 3. FY14 results exclude discontinued operations and include settlement payments of $120 million. 2015 guidance excludes the impact of settlement payments. 12 Net sales Previous Guidance(1) Adjusted cash earnings per diluted share from continuing operations(3) Cash flow from continuing operations(3) $6.5B to $6.7B $4.08 to $4.16 $525M to $625M Current Guidance(2) Year-over- Year $6.5B to $6.7B $4.08 to $4.16 $550M to $625M 2% to 5% 10% to 12% 12% to 27% 2014 Results $6.4B $3.72 $492M
Appendix
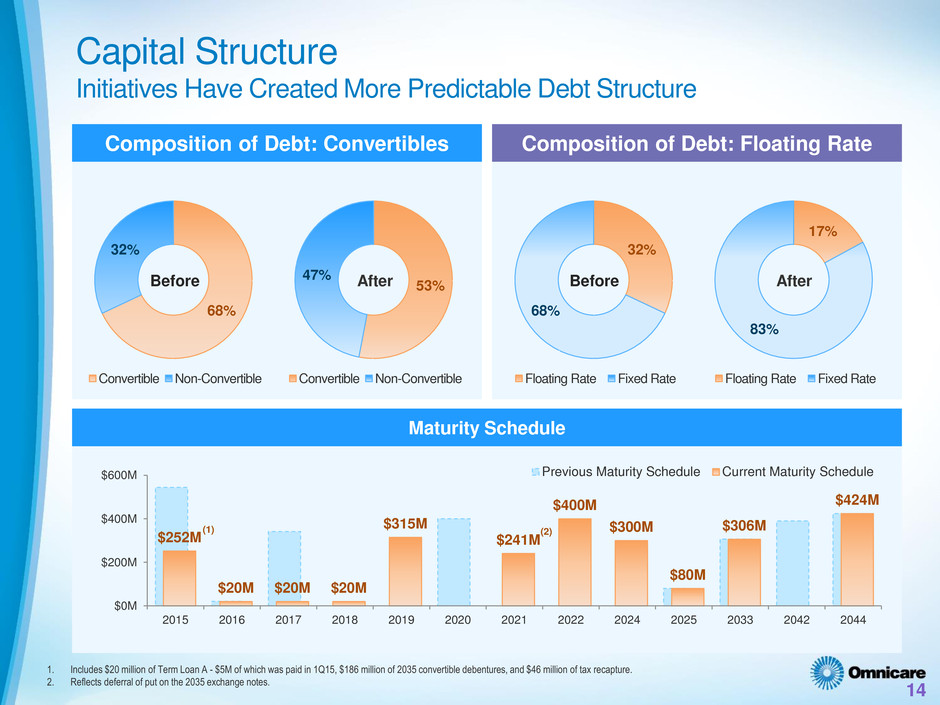
Capital Structure Initiatives Have Created More Predictable Debt Structure $252M $20M $20M $20M $315M $241M $400M $300M $80M $306M $424M $0M $200M $400M $600M 2015 2016 2017 2018 2019 2020 2021 2022 2024 2025 2033 2042 2044 Previous Maturity Schedule Current Maturity Schedule Composition of Debt: Convertibles (1) (2) Maturity Schedule Composition of Debt: Floating Rate 68% 32% Convertible Non-Convertible 53% 47% Convertible Non-Convertible 14 Before After 32% 68% Floating Rate Fixed Rate 17% 83% Floating Rate Fixed Rate Before After 1. Includes $20 million of Term Loan A - $5M of which was paid in 1Q15, $186 million of 2035 convertible debentures, and $46 million of tax recapture. 2. Reflects deferral of put on the 2035 exchange notes.
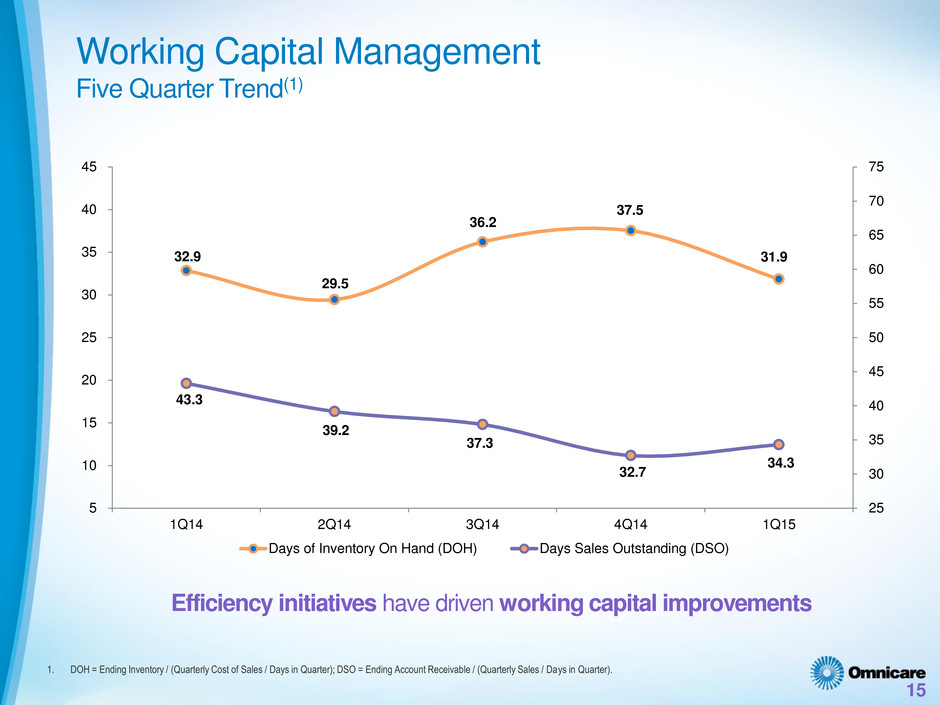
Working Capital Management Five Quarter Trend(1) 15 Efficiency initiatives have driven working capital improvements 1. DOH = Ending Inventory / (Quarterly Cost of Sales / Days in Quarter); DSO = Ending Account Receivable / (Quarterly Sales / Days in Quarter). 32.9 29.5 36.2 37.5 31.9 43.3 39.2 37.3 32.7 34.3 25 30 35 40 45 50 55 60 65 70 75 5 10 15 20 25 30 35 40 45 1Q14 2Q14 3Q14 4Q14 1Q15 Days of Inventory On Hand (DOH) Days Sales Outstanding (DSO)
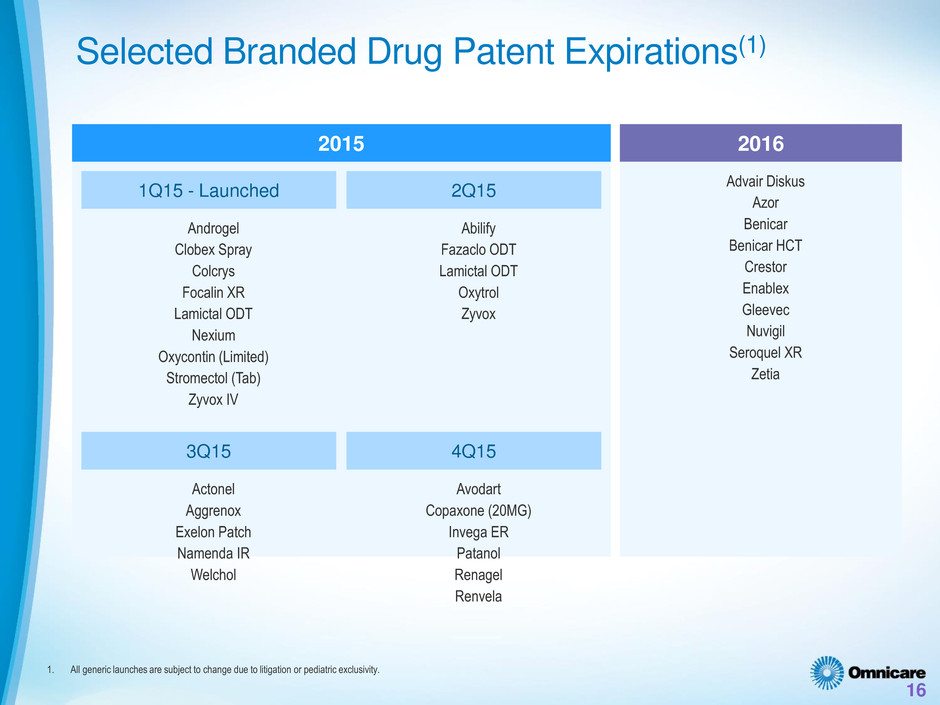
1. All generic launches are subject to change due to litigation or pediatric exclusivity. 16 2015 2016 Selected Branded Drug Patent Expirations(1) 1Q15 - Launched 2Q15 3Q15 4Q15 Androgel Clobex Spray Colcrys Focalin XR Lamictal ODT Nexium Oxycontin (Limited) Stromectol (Tab) Zyvox IV Abilify Fazaclo ODT Lamictal ODT Oxytrol Zyvox Actonel Aggrenox Exelon Patch Namenda IR Welchol Avodart Copaxone (20MG) Invega ER Patanol Renagel Renvela Advair Diskus Azor Benicar Benicar HCT Crestor Enablex Gleevec Nuvigil Seroquel XR Zetia
First-Quarter 2015 Financial Results Supplemental Slides
