Attached files
| file | filename |
|---|---|
| 8-K - 8-K - STEPAN CO | scl-8k_20150428.htm |
Exhibit 99.1
NORTHFIELD, Illinois, April 28, 2015 -- Stepan Company (NYSE: SCL) today reported:
Stepan Reports First Quarter Earnings Growth of 63% to $21.3 Million
First Quarter Highlights
|
· |
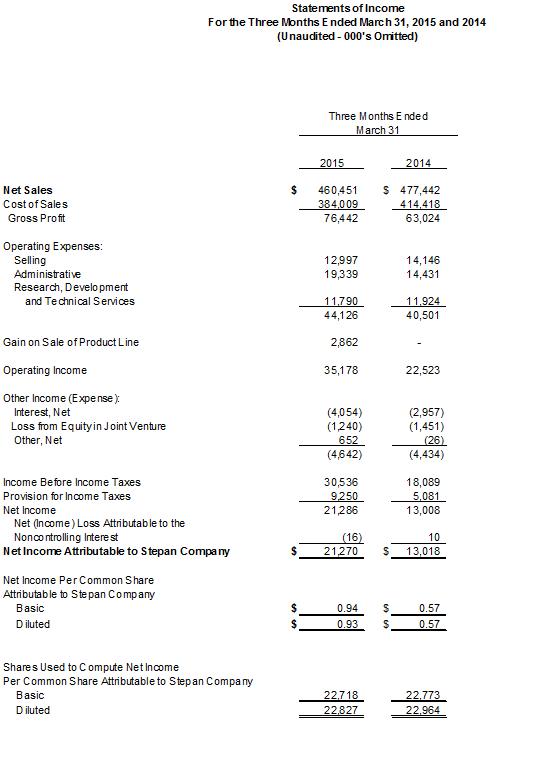
Reported net income was $21.3 million or $0.93 per diluted share versus $13.0 million or $0.57 per diluted share in the prior year. |
|
· |
Surfactant and Polymer volume increased 2% and 5%, respectively. Net sales declined 4% to $460.5 million versus $477.4 million in the prior year due to a 6% decline in foreign currency translation. |
|
· |
Surfactants delivered record quarterly operating income of $33.8 million. |
|
· |
Polymer operating income was $14.8 million including a $2.9 million gain on the sale of the Company’s Specialty Polyurethane System business. Excluding the gain, Polymer operating income was up 10%. |
|
· |
Adjusted net income* was $20.4 million or $0.90 per diluted share versus $12.8 million or $0.56 per diluted share in the prior year. |
|
* |
Adjusted net income is a non-GAAP measure which excludes Deferred Compensation income/ expense as well as other infrequent/non-recurring items. See Table II for this non-GAAP reconciliation. |
“Our first quarter results benefited from actions taken in 2014 to improve product mix, to reduce cost and to improve efficiency,” said F. Quinn Stepan, Jr., President and Chief Executive Officer. “Slightly higher volumes and margins offset the negative impacts of a stronger U.S. dollar.”
“While we are pleased with the year over year improvement in the first quarter, our focus remains on delivering meaningful growth during the remainder of this year and beyond. In 2015, we expect continued profit gains from improved operations, increased geographic presence particularly in the functional markets for Surfactants and higher rigid polyol volumes for the insulation market.”
Exhibit 99.1
Financial Summary

* See Table II for a reconciliation of non-GAAP Adjusted Net Income and Earnings per Diluted Share.
Summary of First Quarter Adjusted Net Income Items
Adjusted net income excludes non-operational deferred compensation income/expense as well as certain other infrequent or non-recurring items.
|
· |
Gain on sale of the Specialty Polyurethane System Business: The current year quarter includes a $1.8 million after-tax gain ($2.9 million pre-tax) recognized from the divestiture of the Company’s Specialty Polyurethane System business which was announced on January 20, 2015. |
|
· |
Deferred Compensation: The current year quarter includes $0.6 million of after-tax expense versus $0.3 million of after-tax income in the prior year. |
|
· |
Environmental Reserve: The current year quarter includes $0.3 million of after-tax environmental reserve expense associated with the Company’s Maywood, New Jersey site. |
Percentage Change in Net Sales
The decrease in quarterly net sales was primarily due to the negative impact of foreign currency translations due to the strengthening of the U.S. dollar. This decrease was partially offset by volume growth in both the Surfactant and Polymer segments.
|
|
Three Months Ended March 31, 2015 |
|
Volume |
2% |
|
Selling Price |
- |
|
Foreign CurrencyTranslation |
(6%) |
|
Total |
(4%) |
Segment Results
Segment Net Sales
|
|
Three Months Ended |
||||
|
|
March 31 |
||||
|
($ in thousands) |
|
|
|
|
|
|
|
2015 |
|
2014 |
|
% Change |
|
|
|
|
|
|
|
|
Surfactants |
$ 330,551 |
|
$ 335,710 |
|
(2) |
|
Polymers |
109,364 |
|
119,107 |
|
(8) |
|
Specialty Products |
20,536 |
|
22,625 |
|
(9) |
|
Total Net Sales |
$ 460,451 |
|
$ 477,442 |
|
(4) |
|
|
|
|
|
|
|
Segment Operating Income

Total segment operating income increased $17.6 million or 53% versus the prior year.
3
|
● |
Surfactant sales were $330.6 million, $5.2 million less than last year. The translation impact of a stronger U.S. dollar decreased sales by $21.2 million. Sales volume was 2% higher. Strong volume growth outside of North America was partially offset by lower North American commodity laundry volumes previously reported. The quarter benefited from higher sales through our distribution partners, an enhanced oil recovery pilot and growing volumes of our environmentally advantaged solvent for the Agricultural market. Surfactant operating income increased $15.4 million or 84% versus the prior year. All regions were higher. Income in all four regions benefited from operational improvements, an improved product and end-market mix, as well as falling raw material costs. |
|
● |
Polymers sales declined by $9.7 million to $109.4 million. $7.8 million of this decline was from the negative impact of foreign currency. Sales volume was up 5%. Phthalic Anhydride prices fell with lower cost raw material orthoxylene. Polymer operating income increased $4.0 million versus the prior year. Excluding the gain on the sale of the Specialty Polyurethane Systems product line, operating income increased $1.1 million or 10% versus the prior year. Most of this increase was attributable to higher volumes and margins in Rigid Polyols. Income on Phthalic Anhydride sold to the merchant market was down due to seasonally high raw material inventory, as petroleum based products declined in price. |
|
● |
Specialty Products operating income declined $1.8 million or 44% versus the prior year. This decline was primarily due to lower volumes within the Lipid Nutrition business. |
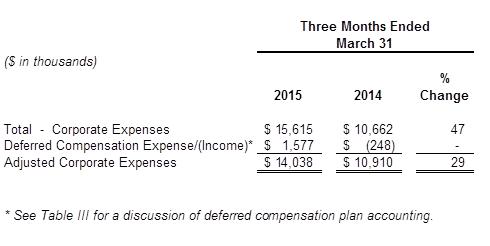
Corporate Expenses
|
· |
For the first quarter, corporate expenses, excluding deferred compensation, increased $3.1 million or 29% for the quarter. This increase was mostly attributable to higher incentive-based compensation expense, higher consulting expenses related to our efficiency initiative, and higher environmental remediation reserve expense related to the Company’s Maywood, New Jersey site. Excluding these items, adjusted corporate |
4
|
expense was up slightly compared to prior year, primarily due to increased activity related to Patents & Trademarks. |
Income Taxes
The effective tax rate increased to 30% for the quarter compared to 28% for the first quarter of 2014. The increase was driven by a larger percentage of consolidated income being earned in the U.S. where the Company’s effective tax rate is generally higher.
Selected Balance Sheet Information
The Company’s net debt level decreased $2.3 million versus year-end while the Net Debt ratio remained at 26.0%.

The major working capital components were:

Capital spending was $28.3 million for the quarter versus $20.5 million in the prior year quarter.
Outlook
“Coming into the year, we stated our belief that the Company was well positioned to re-establish earnings momentum in 2015. After the first quarter, we are on track. We believe continued income growth in Polymers, an improved surfactant mix of end-use markets and products, successful execution of our efficiency initiative and benefits from falling petroleum-based raw material prices will have a favorable impact on full year results.”
5
“Underutilization of North American anionic capacity remains an opportunity and a vulnerability which will be addressed in 2015. We expect consumer product volumes in Latin America should increase, supported by our planned plant acquisition in Brazil now anticipated to close in the second quarter. Polymers income should grow from continued global conservation efforts and the introduction of new specialty CASE resins and polyols. Additional polyol capacity is planned for 2016 in China, Poland and the United States.”
Dividend Declaration
The Board of Directors of Stepan Company declared a quarterly cash dividend on its common stock of $0.18 per share. The dividend is payable on June 12, 2015, to common stockholders of record on May 29, 2015. The Company increased its quarterly cash dividend by $0.01 per share in the fourth quarter of 2014, marking the 47th consecutive year of paying increased dividends.
Conference Call
Stepan Company will host a conference call to discuss the first quarter results at 8:00 A.M. Eastern Daylight Time (7:00 A.M. CDT) on April 29, 2015. Telephone access to the live conference call will be available by dialing +1 (800) 732-8470. To listen to a live webcast of this call, please go to our Internet website at: www.stepan.com, click on investor relations, next click on conference calls and follow the directions on the screen.
Supporting Slides
Slides supporting this press release will be made available at www.stepan.com under the Investor Relations center at approximately the same time as this press release is issued.
Corporate Profile
Stepan Company is a major manufacturer of specialty and intermediate chemicals used in a broad range of industries. Stepan is a leading merchant producer of surfactants, which are the key ingredients in consumer and industrial cleaning compounds. The Company is also a leading supplier of Polyurethane polyols used in the expanding thermal insulation market, and C.A.S.E. (Coatings, Adhesives, Sealants, and Elastomers) industries.
Headquartered in Northfield, Illinois, Stepan utilizes a network of modern production facilities located in North and South America, Europe and Asia.
The common stock is traded on the New York Stock Exchange (NYSE) under the symbol SCL. For more information about Stepan Company please visit the Company online at www.stepan.com
6
Contact: Scott D. Beamer (847) 446-7500
* * * * *
Tables follow
Except for historical information, all other information in this news release consists of forward-looking statements within the meaning of the Private Securities Litigation Reform Act of 1995. These forward-looking statements are subject to risks and uncertainties that could cause actual results to differ materially from those projected, anticipated or implied. The most significant of these uncertainties are described in Stepan Company’s Form 10-K, Form 8-K and Form 10-Q reports and exhibits to those reports, and include (but are not limited to), prospects for our foreign operations, foreign currency fluctuations, certain global and regional economic conditions, the probability of future acquisitions and the uncertainties related to the integration of acquired businesses, the probability of new products, the loss of one or more key customer or supplier relationships, the costs and other effects of governmental regulation and legal and administrative proceedings, including the expenditures necessary to address and resolve environmental claims and proceedings, disruptions in production at manufacturing facilities, volatility of raw material and energy costs, maintaining and protecting intellectual property rights, interruption or breaches of information technology systems, disruptions in transportation or significant changes in transportation costs, and general economic conditions. These forward-looking statements are made only as of the date hereof, and Stepan Company undertakes no obligation to update or revise the forward-looking statements, whether as a result of new information, future events or otherwise.
7
Table I
8
Table II
Reconciliation of Non-GAAP Net Income and Earnings per Diluted Share

* All amounts in this Table are presented after-tax.
The Company believes that certain non-GAAP measures, when presented in conjunction with comparable GAAP (Generally Accepted Accounting Principles) measures, are useful because that information is an appropriate measure for evaluating the Company’s operating performance. Internally, the Company uses this non-GAAP information as an indicator of business performance, and evaluates management’s effectiveness with specific reference to these indicators. These measures should be considered in addition to, not a substitute for, or superior to, measures of financial performance prepared in accordance with GAAP.
9
Table III
Deferred Compensation Plan
The full effect of the deferred compensation plan on quarterly pre-tax income was $1.0 million of expense versus $0.4 million of income in the prior year. The accounting for the deferred compensation plan results in operating income when the price of Stepan Company common stock or mutual funds held in the plan fall and expense when they rise. The Company also recognizes the change in value of mutual funds as investment income or loss. The quarter end market prices of Stepan Company common stock are as follows:
|
2015 |
|
2014 |
||||||
|
|
|
3/31 |
|
12/31 |
9/30 |
6/30 |
3/31 |
|
|
Stepan Company |
|
$41.66 |
|
$40.08 |
$44.38 |
$52.86 |
$64.56 |
|
The deferred compensation income statement impact is summarized below:

10
Table IV
Effects of Foreign Currency Translation
The Company’s foreign subsidiaries transact business and report financial results in their respective local currencies. As a result, foreign subsidiary income statements are translated into U.S. dollars at average foreign exchange rates appropriate for the reporting period. Because foreign exchange rates fluctuate over time, foreign currency translation affects period-to-period comparisons of financial statement items (i.e. because foreign exchange rates fluctuate, similar period-to-period local currency results for a foreign subsidiary may translate into different U.S. dollar results). Below is a table that presents the impact that foreign currency translation had on the changes in consolidated net sales and various income line items for the first quarter:

11
Table V
Stepan Company
Consolidated Balance Sheets
March 31, 2015 and December 31, 2014

12