Attached files
| file | filename |
|---|---|
| EX-5.1 - EX-5.1 - Freshpet, Inc. | d908066dex51.htm |
| EX-1.1 - EX-1.1 - Freshpet, Inc. | d908066dex11.htm |
| EX-23.1 - EX-23.1 - Freshpet, Inc. | d908066dex231.htm |
Table of Contents
As filed with the Securities and Exchange Commission on April 27, 2015
Registration No. 333-203368
SECURITIES AND EXCHANGE COMMISSION
Washington, D.C. 20549
AMENDMENT NO. 1
TO
FORM S-1
REGISTRATION STATEMENT
UNDER
THE SECURITIES ACT OF 1933
FRESHPET, INC.
(Exact name of registrant as specified in its charter)
| Delaware | 2047 | 20-1884894 | ||
| (State or other jurisdiction of incorporation or organization) |
Primary Standard Industrial Classification Code Number) |
(I.R.S. Employer Identification Number) |
400 Plaza Drive, 1st Floor
Secaucus, New Jersey 07094
(201) 520-4000
(Address, including zip code, and telephone number, including area code, of registrant’s principal executive offices)
Richard Kassar
Chief Financial Officer
400 Plaza Drive, 1st Floor
Secaucus, New Jersey 07094
(201) 520-4000
(Name, address, including zip code, and telephone number, including area code, of agent for service)
Copies of all communications, including communications sent to agent for service, should be sent to:
| Christian O. Nagler, Esq. Andrew M. Herman, Esq. Kirkland & Ellis LLP 601 Lexington Avenue New York, New York 10022 (212) 446-4800 |
Marc D. Jaffe, Esq. Senet S. Bischoff, Esq. Latham & Watkins LLP 885 Third Avenue New York, New York 10022 (212) 906-1200 |
Approximate date of commencement of proposed sale to the public:
As soon as practicable after this Registration Statement becomes effective.
If any of the securities being registered on this Form are to be offered on a delayed or continuous basis pursuant to Rule 415 under the Securities Act of 1933, check the following box: ¨
If this Form is filed to register additional securities for an offering pursuant to Rule 462(b) under the Securities Act, please check the following box and list the Securities Act registration statement number of the earlier effective registration statement for the same offering. ¨
If this Form is a post-effective amendment filed pursuant to Rule 462(c) under the Securities Act, check the following box and list the Securities act registration statement number of the earlier effective registration statement for the same offering. ¨
If this Form is a post-effective amendment filed pursuant to Rule 462(d) under the Securities Act, check the following box and list the Securities Act registration statement number of the earlier effective registration statement for the same offering. ¨
Indicate by check mark whether the registrant is a large accelerated filer, an accelerated filer, a non-accelerated filer, or a smaller reporting company. See the definitions of “large accelerated filer,” “accelerated filer” and “smaller reporting company” in Rule 12b-2 of the Exchange Act. (Check one):
| Large accelerated filer | ¨ | Accelerated filer | ¨ | |||
| Non-accelerated filer | x (Do not check if a smaller reporting company) | Smaller reporting company | ¨ | |||
CALCULATION OF REGISTRATION FEE
|
| ||||||||
| Title of Each Class of Securities to be Registered |
Amount to be Registered(1) |
Proposed Maximum Offering Price Per Share |
Proposed Maximum Offering Price(1)(2) |
Amount of Registration Fee(3) | ||||
| Common Stock, $0.001 par value per share |
6,110,353 | $22.86 | $139,682,670 | $16,231.13 | ||||
|
| ||||||||
|
| ||||||||
| (1) | Includes the additional shares of common stock that the underwriters have the option to purchase. |
| (2) | Estimated solely for the purpose of calculating the registration fee. In accordance with Rule 457(c) under the Securities Act of 1933, as amended, the price shown is the average of the high and low selling price of the common stock on April 24, 2015, as reported on The Nasdaq Global Market. |
| (3) | A registration fee of $13,061 was previously paid. |
The registrant hereby amends this Registration Statement on such date or dates as may be necessary to delay its effective date until the registrant shall file a further amendment which specifically states that this Registration Statement shall thereafter become effective in accordance with Section 8(a) of the Securities Act of 1933, as amended, or until this Registration Statement shall become effective on such date as the Securities and Exchange Commission, acting pursuant to said Section 8(a), may determine.
Table of Contents
The information in this preliminary prospectus is not complete and may be changed. These securities may not be sold until the registration statement filed with the Securities and Exchange Commission is effective. This preliminary prospectus is not an offer to sell nor does it seek an offer to buy these securities in any jurisdiction where the offer or sale is not permitted.
Subject to Completion. Dated April 27, 2015.
5,313,351 Shares

Freshpet, Inc.
Common Stock
The selling stockholders identified in this prospectus are offering 5,313,351 shares of our common stock. We will not receive any of the proceeds from the sale of share by the selling stockholders. Our common stock is currently listed on The Nasdaq Global Market under the symbol “FRPT.” The last sale price of our common stock on April 24, 2015 as reported by The Nasdaq Global Market was $22.86 per share.
We are an “emerging growth company” as defined under the federal securities laws and, as such, are subject to reduced public company reporting requirements. See “Prospectus Summary—Implications of Being an Emerging Growth Company.”
See “Risk Factors” on page 14 to read about factors you should consider before buying shares of our common stock.
Neither the Securities and Exchange Commission nor any other regulatory body has approved or disapproved of these securities or passed upon the accuracy or adequacy of this prospectus. Any representation to the contrary is a criminal offense.
| Per Share |
Total | |||||||
| Public offering price |
$ | $ | ||||||
| Underwriting discount(1) |
$ | $ | ||||||
| Proceeds, before expenses, to selling stockholders |
$ | $ | ||||||
| (1) | We refer you to “Underwriting” beginning on page 99 of this prospectus for additional information regarding total underwriting compensation. |
To the extent that the underwriters sell more than 5,313,351 shares of common stock, the underwriters have the option to purchase up to an additional 797,002 shares from the selling stockholders at the price to the public less the underwriting discount.
The underwriters expect to deliver the shares against payment in New York, New York on , 2015.
| Goldman, Sachs & Co. | Credit Suisse |
| Baird | Stifel | SunTrust Robinson Humphrey | Canaccord Genuity |
Prospectus dated , 2015.

Table of Contents

Table of Contents

Table of Contents

Table of Contents
| Page | ||||
| 1 | ||||
| 14 | ||||
| 30 | ||||
| 31 | ||||
| 32 | ||||
| 33 | ||||
| 34 | ||||
| 35 | ||||
| 36 | ||||
| MANAGEMENT’S DISCUSSION AND ANALYSIS OF FINANCIAL CONDITION AND RESULTS OF OPERATIONS |
40 | |||
| 58 | ||||
| 69 | ||||
| 76 | ||||
| 83 | ||||
| 86 | ||||
| 89 | ||||
| 93 | ||||
| MATERIAL U.S. FEDERAL INCOME AND ESTATE TAX CONSIDERATIONS FOR NON-U.S. HOLDERS |
95 | |||
| 99 | ||||
| 103 | ||||
| 103 | ||||
| 103 | ||||
| F-1 | ||||
Neither we, the selling stockholders, nor the underwriters have authorized anyone to provide you with any information other than that contained in this prospectus or in any free writing prospectus prepared by or on behalf of us or to which we have referred you. The selling stockholders are offering to sell, and seeking offers to buy, shares of our common stock only in jurisdictions where such offers and sales are permitted. The information in this prospectus or any free writing prospectus is accurate only as of its date, regardless of its time of delivery or the time of any sale of shares of our common stock. Our business, financial condition, results of operations and prospects may have changed since that date.
i
Table of Contents
MARKET, RANKING AND OTHER INDUSTRY DATA
This prospectus contains industry and market data, forecasts and projections that are based on internal data and estimates, independent industry publications, reports by market research firms or other published independent sources. In particular, we have obtained information regarding the pet food industry from Euromonitor International (“Euromonitor”), the American Pet Products Association (“APPA”), and Packaged Facts, a division of Market Research Group LLC (“Packaged Facts”). Other industry and market data included in this prospectus are from internal analyses based upon data available from known sources or other proprietary research and analysis.
We believe these data to be reliable as of the date of this prospectus, but there can be no assurance as to the accuracy or completeness of such information. We have not independently verified the market and industry data obtained from these third-party sources. Our internal data and estimates are based upon information obtained from trade and business organizations, other contacts in the markets in which we operate and our management’s understanding of industry conditions. Though we believe this information to be true and accurate, such information has not been verified by any independent sources. You should carefully consider the inherent risks and uncertainties associated with the market and other industry data contained in this prospectus.
NON-GAAP FINANCIAL MEASURES
We believe that our financial statements and the other financial data included in this prospectus have been prepared in a manner that complies, in all material respects, with generally accepted accounting principles in the United States (“GAAP”), and are consistent with current practice with the exception of the presentation of certain non-GAAP financial measures, EBITDA and Adjusted EBITDA (each as defined below).
As used herein, EBITDA represents net loss plus depreciation and amortization, interest expense (including fees on debt guarantee, which we believe were a cost of our prior financing arrangement akin to interest expense), and income tax expense. As used herein, Adjusted EBITDA represents EBITDA plus loss on disposal of equipment, new plant startup expense and processing, share based compensation and launch expenses. EBITDA and Adjusted EBITDA do not represent, and should not be considered as alternatives to net loss, as determined under GAAP.
We present EBITDA and Adjusted EBITDA because we believe each of these measures provides an additional metric to evaluate our operations and, when considered with both our GAAP results and the reconciliation to net loss, provides a more complete understanding of our business than could be obtained absent this disclosure. We use EBITDA and Adjusted EBITDA, together with financial measures prepared in accordance with GAAP, such as sales, gross profit percentage, and cash flow from operations, to assess our historical and prospective operating performance, to provide meaningful comparisons of operating performance across periods, to enhance our understanding of our operating performance and to compare our performance to that of our peers and competitors. Adjusted EBITDA is further utilized for our covenant requirements under our credit agreement, and additionally an important component of internal budgeting and setting management compensation. We believe EBITDA and Adjusted EBITDA are useful to investors in assessing the operating performance of our business without the effect of non-cash items and other items.
EBITDA and Adjusted EBITDA should not be considered in isolation or as alternatives to net loss, income from operations or any other measure of financial performance calculated and prescribed in accordance with GAAP. Neither EBITDA nor Adjusted EBITDA should be considered a measure of discretionary cash available to us to invest in the growth of our business. Our Adjusted EBITDA may not be comparable to similar titled measures in other organizations because other organizations may not calculate Adjusted EBITDA in the same manner as we do. Our presentation of Adjusted EBITDA should not be construed as an inference that our future
ii
Table of Contents
results will be unaffected by the expenses that are excluded from that term or by unusual or non-recurring items. We recognize that both EBITDA and Adjusted EBITDA have limitations as analytical financial measures. For example, neither EBITDA nor Adjusted EBITDA reflects:
| • | our capital expenditures or future requirements for capital expenditures; |
| • | the interest expense (including fees on debt guarantee, which we believe were a cost of our financing arrangement akin to interest expense), or the cash requirements necessary to service interest expense or principal payments, associated with indebtedness; |
| • | depreciation and amortization, which are non-cash charges, although the assets being depreciated and amortized will likely have to be replaced in the future, nor does EBITDA or Adjusted EBITDA reflect any cash requirements for such replacements; and |
| • | changes in cash requirements for our working capital needs. |
Additionally, Adjusted EBITDA excludes (i) non-cash stock based compensation expense, which is and will remain a key element of our overall long term incentive compensation package, and (ii) certain costs essential to our sales growth and strategy, including an allowance for marketing expenses for each new store added to our network and uncapitalizable freight costs associated with Freshpet Fridge replacements. Adjusted EBITDA also excludes certain cash charges resulting from matters we consider not to be indicative of our ongoing operations. Other companies in our industry may calculate EBITDA and Adjusted EBITDA differently than we do, limiting their usefulness as comparative measures.
TRADEMARKS, SERVICE MARKS AND TRADE NAMES
We own the trademarks, service marks and trade names that we use in connection with the operation of our business, including our corporate names, logos and website names. This prospectus may also contain trademarks, service marks, trade names and copyrights of other companies, which are the property of their respective owners. Solely for convenience, the trademarks, service marks, trade names and copyrights referred to in this prospectus are listed without the TM, SM, © and ® symbols, but we will assert, to the fullest extent under applicable law, our rights or the rights of the applicable licensors, if any, to these trademarks, service marks, trade names and copyrights.
iii
Table of Contents
The following summary highlights information appearing elsewhere in this prospectus. This summary does not contain all of the information you should consider before investing in our common stock. You should read this entire prospectus carefully. In particular, you should read the sections entitled “Risk Factors” and “Management’s Discussion and Analysis of Financial Condition and Results of Operations” and our consolidated financial statements and the notes relating to those statements included elsewhere in this prospectus. Some of the statements in this prospectus constitute forward-looking statements. See “Forward-Looking Statements.”
In this prospectus, unless the context requires otherwise, references to “Freshpet” the “Company,” “we,” “our,” or “us” refer to Freshpet, Inc., the issuer of the common stock offered hereby, and its consolidated subsidiary.
Overview
We started Freshpet with a single-minded mission—to bring the power of real, fresh food to our dogs and cats. We were inspired by the rapidly growing view among pet owners that their dogs and cats are a part of their family, leading them to demand healthier pet food choices. Over the last nine years, we have created a comprehensive business model to deliver wholesome pet food that “pet parents” can trust, and in the process we believe we have become one of the fastest growing pet food companies in North America. Our business model is difficult for others to replicate and we see significant opportunity for future growth by leveraging the unique elements of our business:
| Our Brand |
We founded the fresh, refrigerated pet food category in North America and our brand transparently communicates our passion and dedication. |
| Our Product Know-How |
Our fresh, refrigerated products are differentiated inside and out from conventional pet food as a result of our proprietary recipes, cooking techniques and packaging developed over the last nine years. |
| Our Freshpet Kitchens |
All of our food is made in the United States, and we own and operate what we believe is North America’s only fresh, refrigerated pet food manufacturing facility, which we call the Freshpet Kitchens, located in Bethlehem, Pennsylvania. |
| Our Refrigerated Distribution |
We are the only pet food company with an established refrigerated supply chain connecting our Freshpet Kitchens to retail stores across North America. |
| Our Freshpet Fridge |
We sell our products through a fast-growing network of company-owned branded refrigerators, known as Freshpet Fridges, installed in over 13,300 retail stores across North America. |
| Our Culture |
We foster a culture of innovation, and we strive to be open, honest and socially responsible in everything we do. |
Freshpet is disrupting the North American pet food industry, which is an over $22 billion industry, by driving consumers to reassess conventional dog and cat food offerings that have remained essentially unchanged for decades. We position our brand to benefit from mainstream trends of growing pet humanization and
1
Table of Contents
consumer focus on health and wellness. We price our products to be accessible to the average consumer, providing us with broad demographic appeal and allowing us to penetrate multiple classes of retail including grocery, mass, club, pet specialty and natural. We have successfully expanded our network of Freshpet Fridges within leading blue-chip retail chains including Albertsons, BJ’s, Kroger, Petco, PetSmart, Publix, Safeway, Target, Wal-Mart and Whole Foods. The strength of our business model extends to our customers, who we believe find that Freshpet grows their pet category sales, drives higher traffic, increases shopper frequency and delivers category leading margins. As of December 31, 2014, Freshpet Fridges were located in over 13,300 stores, and we believe there is an opportunity to install a Freshpet Fridge in at least 35,000 stores across North America.
Freshpet’s differentiated pet food empowers pet parents to provide positive nutrition and well- being to their pets. Our success is reflected in the growth we have delivered:
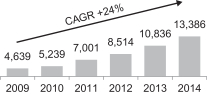
| • | Our Freshpet Fridge store locations increased from 7,001 in 2011 to 13,386 in 2014, representing a compounded annual growth rate of 24%; and, as of March 31, 2015, we had 14,019 installed Freshpet Fridges, representing 21% growth over the number as of March 31, 2014. |
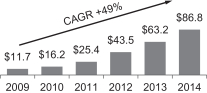
| • | Our net sales increased from $25.4 million in 2011 to $86.8 million in 2014, representing a compounded annual growth rate of 51%. |
| Freshpet Fridge Store Locations |
Net Sales ($ millions) | |
|
|
|
| • | Our gross profit margins, which we define as net sales minus costs of goods sold divided by net sales, improved 610 basis points from 42.6% in the year ended December 31, 2011 to 48.7% in the year ended December 31, 2014. |
| • | Our net loss from operations decreased from $23.4 million in 2011 to $6.4 million in 2014. |
| • | Our net loss increased from $24.2 million in 2011 to $37.3 million in 2014. Net loss in 2014 included $25.9 million of non-cash fees on debt guarantee. Excluding this item, net loss was $10.7 million in 2014, a decrease in net loss of $13.5 million compared to 2011. We will no longer incur non-cash fees on debt guarantee in future periods. |
Our Industry
We compete in the North American dog and cat food market, which had 2014 retail sales of over $22 billion, and has grown at an average compounded annual growth rate of 3% from 2007 to 2014, according to Euromonitor. The pet food market has historically been resilient as consumers continue to spend on their pets even during economic downturns. Within the pet food market, premium and/or natural brands are gaining market share, according to Packaged Facts. We believe pet food industry growth is being driven by increasing pet ownership in U.S. households, a growing trend of pet humanization as pet owners view their pets as family members, and a greater consumer focus on health and wellness.
The pet food purchasing decision is underpinned by higher brand loyalty than many other consumer packaged goods categories. A consumer selecting a pet food brand resists frequent switching in order to avoid disrupting the pet’s diet, resulting in high repeat purchasing behavior. As a result, we believe that as consumers try fresh, refrigerated pet food, they are likely to become repeat users of the product.
2
Table of Contents
Our Competitive Strengths
We believe that the following strengths differentiate Freshpet and position us to become a leading brand in pet food:
The category defining brand in fresh, refrigerated pet food. Freshpet is the first and only fresh, refrigerated pet food brand distributed across North America. Our products represent a significant innovation in pet food, and we have developed a brand proposition that pet parents can intuitively trust.
All of our meats and vegetables are sourced in North America, and all our products are made in the United States. We use simple, fresh ingredients that are gently cooked without preservatives. Pet parents can easily recognize ingredients in our products as being similar to fresh food they buy for their families. In palatability tests commissioned by us and conducted by third party kennels, dogs chose Freshpet over other leading pet food brands by a wide margin. In addition, according to a study commissioned by us and conducted by a third party researcher, pet parents perceived that Freshpet provides their pets with greater enthusiasm for eating and visible health improvements. By satisfying pet nutritional needs and strong pet parent motivations, we have built a growing base of loyal consumers who we believe have a deep emotional connection to the Freshpet brand.
Proven, scalable and defensible point-of-sale retail model. We sell our products through a fast-growing network of company-owned branded refrigerators, or Freshpet Fridges, which replace standard shelving in the pet aisle or an end-cap of a retail store. We are the only company to have a branded refrigeration fixture, in-aisle electric power and significant exclusive shelf space in the pet department of leading national retail chains. We believe our Freshpet Fridges generate compelling economics with an average cash-on-cash payback period of less than 15 months, calculated by comparing our total current costs for a refrigerator (including installation and maintenance) to our current margin on net revenues. We have installed Freshpet Fridges across all major classes of pet retail including grocery, mass, club, pet specialty and natural. Our track record of consistently growing the number of store locations with key customers underscores the success of our point-of-sale model.
| Selected Customers |
Year Entered |
Freshpet Fridge Locations at Launch |
Freshpet Fridge Locations at December 31, 2014 |
|||||||||
| Wal-Mart |
2007 | 51 | 1,639 | |||||||||
| Petco |
2007 | 97 | 1,374 | |||||||||
| PetSmart |
2006 | 29 | 1,328 | |||||||||
| Target |
2012 | 50 | 1,178 | |||||||||
| Kroger |
2007 | 185 | 970 | |||||||||
| Whole Foods |
2012 | 29 | 242 | |||||||||
We believe our customers find that Freshpet grows sales of their overall pet category, drives higher traffic, increases shopper frequency and delivers category leading margins. We believe our attractive business proposition to customers will allow us to continue penetrating store locations of existing and new customers.
Difficult to replicate know-how, manufacturing facilities and supply chain. We built and currently operate what we believe is the only fresh, refrigerated pet food manufacturing facility in North America, which was designed by us to operate at human-grade food quality and safety standards.
Over the last nine years, we have developed proprietary know-how in the areas of recipes, ingredients sourcing, cooking techniques and product packaging, and have established the only refrigerated pet food supply chain in North America. We have built a team of professionals with unique skills in production and delivery of fresh refrigerated pet food. As a result, our facilities, processes and people represent advantages that would be difficult for others to replicate.
3
Table of Contents
Experienced, committed management team and company culture focused on core values. We have a deep bench of management talent with a tremendous amount of pet industry experience and significant ownership in Freshpet. The majority of our senior executive team previously worked together to revitalize the Meow Mix brand, and successfully sold it in 2006. Our CEO, Richard Thompson, served as CEO of The Meow Mix Company from 2002 to 2006 and previously founded the American Italian Pasta Company. We believe our culture and core values, spanning Pets, People and Planet, allow us to attract a passionate employee base while also helping pet parents connect with the Freshpet brand.
Our Growth Strategies
We intend to continue growing net sales and profitability through the following growth strategies:
Continue to grow awareness, trial and adoption to increase Freshpet’s North American market share. Our market share is currently less than 1% of the over $22 billion North American pet food market. As of March 31, 2014, approximately 17% of U.S. pet food consumers were aware of the Freshpet brand, which provides us a significant opportunity to grow over time. As a result of our marketing investments, consumer trial of Freshpet products tripled from 2010 to 2014, and repeat purchase rates also increased significantly. In many retail accounts where Freshpet has been available for five years or more, we have achieved between 8%-10% market share of dry and wet dog food sales. We believe that with growing awareness and availability of Freshpet, we have expansive runway to grow trial, adoption and market share.
Continue to grow points of distribution by installing new Freshpet Fridges. We believe there is a significant opportunity to continue to grow our network of Freshpet Fridges by expanding within the store base of existing and new customers. We grew the number of Freshpet Fridge store locations at a compounded annual rate of 24% between 2011 and 2014. We operate Freshpet Fridges in more than 13,300 stores, and we estimate that there is an opportunity to install a Freshpet Fridge in at least 35,000 retail locations across North America. Over the next three years, we plan to install over 6,000 Freshpet Fridges in new retail locations. We expect continued demand for our Freshpet Fridges driven by the strong business proposition and attractive margins that we deliver to customers.
Continue to deliver innovation in pet food and expand our product offerings. We are continually working to develop new products that are aligned with consumer trends and preferences. Our new products remain true to our founding mission—simple, fresh, good food—while expanding our base of consumers and usage occasions. New product introductions since 2011 represented 37% of our net sales in 2014. We currently have a strong innovation pipeline, including entirely new product platforms, which expands the breadth of our fresh product offerings. We also see significant opportunity in the future to expand into pet categories such as cat food and pet treats where we are underpenetrated today. We expect that new product introductions will continue to meaningfully drive growth going forward.
Continue to enhance our operating margins. We intend to enhance our operating margins, which we define as net sales minus costs of goods sold minus selling, general & administrative expenses divided by net sales, through efficiencies of scale as we grow our net sales ahead of costs. We have made significant investments in management, manufacturing capacity, information systems and other infrastructure to enable us to pursue our growth. From 2011 through 2014, we expanded our gross profit margins by approximately 610 basis points from 42.6% to 48.7%. We expect that gross profit margins improvement and operating leverage from SG&A costs will be a significant driver of earnings growth going forward.
4
Table of Contents
Preliminary First Quarter Results
Set forth below are selected preliminary, unaudited financial results for the first quarter ended March 31, 2015. These financial results are unaudited and should be considered preliminary and subject to change.
We expect to report net sales of approximately $27.0 million for the three months ended March 31, 2015, an increase of approximately $7.6 million, or approximately 39%, as compared to net sales of $19.4 million for the three months ended March 31, 2014. Excluding net sales related to our non-refrigerated fresh baked product test items, we expect to report net sales of approximately $26.5 million for the three months ended March 31, 2015, an increase of approximately $7.1 million, or approximately 37%, as compared to net sales for the three months ended March 31, 2014. Net sales increase was partially driven by velocity gains in Grocery and Mass as well as Pet Specialty, Natural and Other channels during the most recent quarter and growth in Freshpet Fridge store locations, which grew to 14,019 as of March 31, 2015, an increase of approximately 21% compared to 11,596 as of March 31, 2014.
We expect to report Adjusted EBITDA of between $1.9 million and $2.0 million for the three months ended March 31, 2015, an increase of between $1.1 million and $1.2 million, compared to $0.8 million for the three months ended March 31, 2014. Excluding Adjusted EBITDA related to our non-refrigerated fresh baked product test items, we expect to report Adjusted EBITDA of between $2.5 million and $2.6 million for the three months ended March 31, 2015, an increase of between $1.7 million and $1.8 million, compared to Adjusted EBITDA for the three months ended March 31, 2014. The results include approximately $0.8 million of research and development expense related to our non-refrigerated fresh baked product test items, offset by approximately $0.2 million gross profit related to such items.
The following table provides a preliminary reconciliation of our expected range for Adjusted EBITDA to our expected range for net loss, which is the most directly comparable financial measure presented in accordance with GAAP. All line items are approximations.
| March 31, 2015(1) | ||||||||
| (Dollars in thousands) | Low End of Range |
High End of Range |
||||||
| Net loss |
$ | (2,650 | ) | $ | (2,550 | ) | ||
| Depreciation & amortization |
1,750 | 1,750 | ||||||
| Interest expense |
25 | 25 | ||||||
| Income tax expense |
15 | 15 | ||||||
|
|
|
|
|
|||||
| EBITDA |
(860 | ) | (760 | ) | ||||
|
|
|
|
|
|||||
| Loss on disposal of equipment |
— | — | ||||||
| Launch expense(2) |
800 | 800 | ||||||
| Share based compensation |
1,850 | 1,850 | ||||||
| Warrant fair valuation |
125 | 125 | ||||||
|
|
|
|
|
|||||
| Adjusted EBITDA |
$ | 1,915 | $ | 2,015 | ||||
|
|
|
|
|
|||||
| (1) | For comparison, we had Adjusted EBITDA of $4.0 million and $2.3 million for the three months ended December 31, 2014 and 2013, respectively. Adjusted EBITDA for the three months ended December 31, 2014 was comprised of net loss of $16.4 million, plus $15.5 million of fees on debt guarantee, $1.7 million of depreciation & amortization, $1.4 million of interest expense, $0.1 million of loss on disposal of equipment, $0.6 million of launch expense, $0.8 million of share based compensation and $0.3 million of warrant fair valuation. Adjusted EBITDA for the three months ended December 31, 2013 was comprised of |
| net loss of $5.2 million, plus $1.9 million of fees on debt guarantee, $2.7 million of depreciation & |
5
Table of Contents
| amortization, $1.0 million of interest expense, $0.5 million of loss on disposal of equipment, $0.8 million of launch expense, $0.5 million of new plant start up expenses and processing, and $0.2 million of share based compensation. |
| (2) | Represents new store marketing allowance of $1,000 for each store added to our distribution network as well as the uncapitalized freight costs associated with Freshpet Fridge replacements. The expense enhances the overall marketing spend to support our growing distribution network. |
The results provided in this section are preliminary and unaudited and do not present all information necessary for an understanding of our financial condition as of March 31, 2015 and our results of operations for the first quarter ended March 31, 2015. They have been prepared by and are the responsibility of our management. The preliminary estimated results presented are subject to the completion of our financial closing procedures. Accordingly, these results are subject to change. KPMG LLP has not audited, reviewed, compiled or performed any procedures with respect to the accompanying preliminary financial data. Accordingly, KPMG LLP does not express an opinion or any other form of assurance with respect thereto.
RISK FACTORS
An investment in our common stock involves a high degree of risk. Any of the factors set forth under “Risk Factors” may limit our ability to successfully execute our business strategy. You should carefully consider all of the information set forth in this prospectus and, in particular, should evaluate the specific factors set forth under “Risk Factors” in deciding whether to invest in our common stock. Below is a summary of some of the principal risks we face:
| • | we may not be able to successfully implement our growth on a timely basis or at all; |
| • | we may not be able to generate sufficient cash flow or raise capital on acceptable terms to meet our needs; |
| • | we may lose key members of our senior management team; |
| • | our products may be alleged to cause injury or illness or fail to comply with government regulation; |
| • | we may lose a significant customer; and |
| • | our marketing and trade spending programs may prove insufficient or ineffective. |
OUR CORPORATE INFORMATION
We were incorporated in Delaware in November 2004 and currently exist as a Delaware corporation. In December 2010, MidOcean Partners and certain of its affiliated entities (collectively, “MidOcean”) became our largest stockholder. Our principal executive offices are located at 400 Plaza Drive, 1st Floor, Secaucus, New Jersey 07094. Our telephone number is (201) 520-4000. The address of our corporate website is www.freshpet.com. The information contained in or that can be accessed through our website does not constitute a part of, and is not incorporated by reference into, this prospectus.
On November 13, 2014, we completed our initial public offering of 11,979,167 shares of our common stock at a price to the public of $15.00 per share, which included 1,562,500 shares of our common stock sold pursuant to the underwriters’ option to purchase additional shares. After underwriters’ discounts and commissions and offering expenses, we received net proceeds from the offering of approximately $167.1 million. In addition, concurrent with the completion of our initial public offering, we received approximately $18.0 million of gross proceeds from the related debt refinancing. A portion of these proceeds were used to repay certain outstanding
6
Table of Contents
indebtedness and accrued interest and to effect the redemption of our Series B Preferred Stock, par value $0.001 (the “Series B Preferred Stock”). See “Summary Consolidated Financial Data” and our consolidated financial statements and the notes thereto for additional information. We intend to use the remainder of the proceeds to support our growth, primarily through installing new Freshpet Fridges and adding manufacturing capacity, and for working capital and general corporate purposes.
EQUITY SPONSOR
MidOcean is a private equity firm focused on investing in middle market companies in North America. MidOcean’s targeted sectors include consumer, business & media services and industrial services. Immediately following the consummation of this offering, we expect MidOcean to own 7,169,261 shares of our common stock, or approximately 21.4% of our outstanding shares, or 6,941,000 shares of our common stock, or approximately 20.7% of our outstanding shares, if the underwriters’ option to purchase additional shares of our common stock is exercised in full.
7
Table of Contents
IMPLICATIONS OF BEING AN EMERGING GROWTH COMPANY
We qualify as an emerging growth company as defined in the Jumpstart Our Business Startups Act of 2012 (the “JOBS Act”). An emerging growth company may take advantage of specified reduced reporting and other burdens that are otherwise applicable generally to public companies. These provisions include:
| • | a requirement to have only two years of audited financial statements and only two years of related selected financial data and management’s discussion and analysis of financial condition and results of operations disclosure; |
| • | an exemption from the auditor attestation requirement in the assessment of our internal control over financial reporting pursuant to the Sarbanes-Oxley Act of 2002 (the “Sarbanes-Oxley Act”); |
| • | an exemption from new or revised financial accounting standards until they would apply to private companies and from compliance with any new requirements adopted by the Public Company Accounting Oversight Board requiring mandatory audit firm rotation; |
| • | reduced disclosure about the emerging growth company’s executive compensation arrangements; and |
| • | no requirement to seek non-binding advisory votes on executive compensation or golden parachute arrangements. |
The JOBS Act permits emerging growth companies to take advantage of an extended transition period to comply with new or revised accounting standards applicable to public companies. We chose to “opt out” of this provision, and as a result, we plan to comply with new or revised accounting standards as required when they are adopted. This decision to opt out of the extended transition period is irrevocable.
We have elected to adopt certain of the reduced disclosure requirements available to emerging growth companies. As a result of these elections, the information that we provide in this prospectus may be different than the information you may receive from other public companies in which you hold equity interests. In addition, it is possible that some investors will find our common stock less attractive as a result of our elections, which may result in a less active trading market for our common stock and more volatility in our stock price.
We will remain an emerging growth company until the earliest of (i) the end of the fiscal year following the fifth anniversary of the completion of our initial public offering in November 2014, (ii) the first fiscal year after our annual gross revenue are $1.0 billion or more, (iii) the date on which we have, during the previous three-year period, issued more than $1.0 billion in non-convertible debt securities or (iv) the end of any fiscal year in which the market value of our common stock held by non-affiliates exceeded $700 million as of the end of the second quarter of that fiscal year.
8
Table of Contents
THE OFFERING
| Common stock offered by the selling stockholders |
5,313,351 shares (6,110,353 shares if the underwriters exercise their option to purchase additional shares of our common stock in full). |
| Underwriters’ option to purchase additional shares |
The selling stockholders have granted the underwriters a 30-day option to purchase up to an additional 797,002 shares of our common stock. |
| Common stock to be outstanding immediately after completion of this offering |
Immediately following the consummation of this offering, we will have 33,470,732 shares of common stock outstanding. |
| Use of proceeds |
We will not receive any proceeds from the sale of common stock by the selling stockholders in this offering. See “Use of Proceeds.” |
| Dividend policy |
We currently intend to retain all available funds and any future earnings to fund the development and growth of our business and to repay indebtedness, and therefore, we do not anticipate paying any cash dividends in the foreseeable future. Any future determination to declare and pay cash dividends will be at the discretion of our Board of Directors and will depend on, among other things, our financial condition, results of operations, cash requirements, contractual restrictions and such other factors as our Board of Directors deems relevant. In addition, covenants in our credit agreement restrict our ability to pay dividends. For additional information, see “Dividend Policy.” |
| Listing |
Our common stock is listed on The Nasdaq Global Market (“Nasdaq”) under the symbol “FRPT.” |
| Risk factors |
Investing in our common stock involves a high degree of risk. See “Risk Factors” beginning on page 14 of this prospectus for a discussion of factors you should carefully consider before investing in our common stock. |
Unless otherwise indicated, all information in this prospectus:
| • | assumes no exercise by the underwriters of their option to purchase 797,002 additional shares of common stock from the selling stockholders; and |
| • | excludes 936,648 shares of our common stock reserved for future grants under our 2014 Omnibus Incentive Plan and 61,117 shares of common stock that may be issued upon the exercise of a warrant held by City National Bank. |
9
Table of Contents
SUMMARY CONSOLIDATED FINANCIAL DATA
The following table presents a summary of our consolidated financial data as of, and for the periods ended on, the dates indicated. The summary consolidated balance sheet data as of December 31, 2014 and 2013 and the consolidated statements of operations data for each of the years in the three-year period ended December 31, 2014 have been derived from our audited consolidated financial statements included elsewhere in this prospectus. The consolidated balance sheet data as of December 31, 2012 have been derived from our audited consolidated financial statements not included in this prospectus. You should read the following financial information together with the information under “Capitalization” and “Management’s Discussion and Analysis of Financial Condition and Results of Operations” and our consolidated financial statements included elsewhere in this prospectus. Historical results are not necessarily indicative of results to be expected for any future period.
| Year ended December 31, | ||||||||||||
| 2014 | 2013 | 2012 | ||||||||||
| (Dollars in thousands, except per share data) | ||||||||||||
| Consolidated Statement of Operations Data |
||||||||||||
| Net sales |
$ | 86,764 | $ | 63,151 | $ | 43,519 | ||||||
| Cost of goods sold |
44,546 | 35,958 | 22,881 | |||||||||
|
|
|
|
|
|
|
|||||||
| Gross profit |
42,218 | 27,193 | 20,638 | |||||||||
| Selling, general and administrative expenses |
48,636 | 39,574 | 35,385 | |||||||||
|
|
|
|
|
|
|
|||||||
| Loss from operations |
(6,418 | ) | (12,381 | ) | (14,747 | ) | ||||||
| Other expenses |
(328 | ) | (538 | ) | (344 | ) | ||||||
| Fees on debt guarantee(1) |
(25,937 | ) | (5,245 | ) | (1,895 | ) | ||||||
| Interest expense |
(4,614 | ) | (3,492 | ) | (1,638 | ) | ||||||
|
|
|
|
|
|
|
|||||||
| Loss before income taxes |
(37,297 | ) | (21,656 | ) | (18,624 | ) | ||||||
| Income tax expense |
(42 | ) | (31 | ) | (32 | ) | ||||||
|
|
|
|
|
|
|
|||||||
| Net loss |
(37,339 | ) | (21,687 | ) | (18,656 | ) | ||||||
|
|
|
|
|
|
|
|||||||
| Preferred stock dividends on Series B and Series C(2) |
(11,286 | ) | (8,596 | ) | (7,954 | ) | ||||||
|
|
|
|
|
|
|
|||||||
| Additional loss to common stockholders upon conversion of Series C Preferred Stock into common stock(3) |
(82,655 | ) | — | — | ||||||||
|
|
|
|
|
|
|
|||||||
| Net loss attributable to common stockholders |
$ | (131,280 | ) | $ | (30,283 | ) | $ | (26,610 | ) | |||
|
|
|
|
|
|
|
|||||||
| Net loss per share: |
||||||||||||
| Basic |
$ | (9.63 | ) | $ | (2.91 | ) | $ | (2.56 | ) | |||
| Diluted |
$ | (9.63 | ) | $ | (2.91 | ) | $ | (2.56 | ) | |||
| Weighted average shares of common stock outstanding: |
||||||||||||
| Basic |
13,632,042 | 10,415,014 | 10,413,467 | |||||||||
| Diluted |
13,632,042 | 10,415,014 | 10,413,467 | |||||||||
| Year ended December 31, | ||||||||||||
| 2014 | 2013 | 2012 | ||||||||||
| (Dollars in thousands) | ||||||||||||
| Other Operating and Financial Data |
||||||||||||
| Freshpet Fridge store locations at period end: |
||||||||||||
| Grocery |
6,130 | 5,367 | 4,565 | |||||||||
| Pet |
3,979 | 3,051 | 2,737 | |||||||||
| Mass |
3,035 | 2,247 | 1,181 | |||||||||
| Natural |
242 | 171 | 31 | |||||||||
|
|
|
|
|
|
|
|||||||
| Total |
13,386 | 10,836 | 8,514 | |||||||||
| EBITDA(4) |
$ | (321 | ) | $ | (6,974 | ) | $ | (10,363 | ) | |||
| Adjusted EBITDA(4) |
5,515 | (192 | ) | (6,096 | ) | |||||||
| Capital expenditures: |
||||||||||||
| Freshpet Kitchens and other plant capital expenditures |
2,226 | 12,987 | 13,298 | |||||||||
| Freshpet Fridge and other capital expenditures |
14,905 | 11,656 | 13,097 | |||||||||
| Total cash outflows of capital expenditures |
17,131 | 24,643 | 26,395 | |||||||||
10
Table of Contents
| As of December 31, | ||||||||||||
| 2014 | 2013 | 2012 | ||||||||||
| Consolidated Balance Sheet Data |
||||||||||||
| Cash and cash equivalents |
$ | 36,259 | $ | 2,445 | $ | 1,633 | ||||||
| Working capital(5) |
41,862 | (3,435 | ) | (3,111 | ) | |||||||
| Total assets |
112,462 | 62,617 | 44,094 | |||||||||
| Total debt |
— | 76,112 | 44,057 | |||||||||
| Redeemable preferred stock: |
||||||||||||
| Series B |
— | 30,728 | 26,513 | |||||||||
| Series C |
— | 70,463 | 61,103 | |||||||||
| Total stockholders’ equity (deficit) |
$ | 103,393 | $ | (131,058 | ) | $ | (101,804 | ) | ||||
| (1) | Represents fees paid to certain stockholders for acting as guarantors for a portion of our prior payment obligations under the $62.5 million revolving note payable (the “$62.5 Million Revolver”). Pursuant to a Fee and Reimbursement Agreement, the Company was obligated to pay each guarantor a contingent fee equal to 10% per annum of the amount each guarantor committed to guarantee. Portions of the proceeds from our initial public offering and related debt refinancing were used to repay the borrowings under the $62.5 Million Revolver, relieving us of our future fees on the debt guarantee. Concurrently, with the closing of our initial public offering, the outstanding guarantee fees were converted into shares of our Series C Preferred Stock, par value $0.001 (the “Series C Preferred Stock”), which were then converted into common stock. See our consolidated financial statements and the notes thereto for additional information. |
| (2) | Represents dividends associated with our redeemable Series B Preferred Stock and Series C Preferred Stock. Holders of Series B Preferred Stock were entitled to receive dividends payable in additional fully paid and non-assessable shares of Series B Preferred Stock at a rate per annum of 15% of the original issue price. Such dividends were to be fully cumulative from the first day of issuance and accrued without interest on both the initial Series B Preferred Stock obtained and shares obtained via dividend, on a quarterly basis. Holders of Series C Preferred Stock were entitled to dividends at a rate of 8% per annum of the Series C Preferred Stock original issue price. Once the Series C Preferred Stock was converted to Common Stock, the accrued dividends that had not been declared by the Board of Directors were relinquished. |
| (3) | Immediately prior to the conversion of Series C Preferred Stock to Common Stock, the Series C Preferred Stock were fair valued utilizing the Common Stock share price at the date of conversion. The difference between fair value and book value was recorded as net loss attributable to common stockholders. |
| (4) | EBITDA and Adjusted EBITDA are not financial measures prepared in accordance GAAP. As used herein, EBITDA represents net loss plus depreciation and amortization, interest expense (including fees on debt guarantee, which we believe were a cost of our prior financing arrangement akin to interest expense), and income tax expense. As used herein, Adjusted EBITDA represents EBITDA plus loss on disposal of equipment, new plant startup expense and processing, share based compensation, warrant fair valuation, and launch expenses. |
We present EBITDA and Adjusted EBITDA because we believe each of these measures provides an additional metric to evaluate our operations and, when considered with both our GAAP results and the reconciliation to net loss set forth below, provides a more complete understanding of our business than could be obtained absent this disclosure. We use EBITDA and Adjusted EBITDA, together with financial measures prepared in accordance with GAAP, such as sales, gross profit margins, and cash flow from operations, to assess our historical and prospective operating performance, to provide meaningful comparisons of operating performance across periods, to enhance our understanding of our operating performance and to compare our performance to that of our peers and competitors.
Adjusted EBITDA is further utilized for our covenant requirements under our credit agreement, and additionally as an important component of internal budgeting and setting management compensation.
11
Table of Contents
EBITDA and Adjusted EBITDA are presented here because we believe they are useful to investors in assessing the operating performance of our business without the effect of non-cash items, and other items as detailed below.
EBITDA and Adjusted EBITDA should not be considered in isolation or as alternatives to net loss, income from operations or any other measure of financial performance calculated and prescribed in accordance with GAAP. Neither EBITDA nor Adjusted EBITDA should be considered a measure of discretionary cash available to us to invest in the growth of our business. Our Adjusted EBITDA may not be comparable to similarly titled measures in other organizations because other organizations may not calculate Adjusted EBITDA in the same manner as we do. Our presentation of Adjusted EBITDA should not be construed as an inference that our future results will be unaffected by the expenses that are excluded from that term or by unusual or non-recurring items. We recognize that both EBITDA and Adjusted EBITDA have limitations as analytical financial measures. For example, neither EBITDA nor Adjusted EBITDA reflects:
| • | our capital expenditures or future requirements for capital expenditures; |
| • | the interest expense (including fees on debt guarantee, which we believe were a cost of our prior financing arrangement akin to interest expense), or the cash requirements necessary to service interest expense or principal payments, associated with indebtedness; |
| • | depreciation and amortization, which are non-cash charges, although the assets being depreciated and amortized will likely have to be replaced in the future, nor does EBITDA or Adjusted EBITDA reflect any cash requirements for such replacements; and |
| • | changes in cash requirements for our working capital needs. |
Additionally, Adjusted EBITDA excludes (i) non-cash stock based compensation expense, which is and will remain a key element of our overall long term incentive compensation package, and (ii) certain costs essential to our sales growth and strategy, including an allowance for marketing expenses for each new store added to our network and uncapitalizable freight costs associated with Freshpet Fridge replacements. Adjusted EBITDA also excludes certain cash charges resulting from matters we consider not to be indicative of our ongoing operations. Other companies in our industry may calculate EBITDA and Adjusted EBITDA differently than we do, limiting their usefulness as comparative measures.
The following table provides a reconciliation of EBITDA and Adjusted EBITDA to net loss which is the most directly comparable financial measure presented in accordance with GAAP:
| Year ended December 31, | ||||||||||||
| 2014 | 2013 | 2012 | ||||||||||
| (Dollars in thousands) | ||||||||||||
| Net loss |
$ | (37,339 | ) | $ | (21,687 | ) | $ | (18,656 | ) | |||
| Fees on debt guarantee(a) |
25,937 | 5,245 | 1,895 | |||||||||
| Depreciation & amortization |
6,425 | 5,945 | 4,728 | |||||||||
| Interest expense |
4,614 | 3,492 | 1,638 | |||||||||
| Income tax expense |
42 | 31 | 32 | |||||||||
|
|
|
|
|
|
|
|||||||
| EBITDA |
(321 | ) | (6,974 | ) | (10,363 | ) | ||||||
|
|
|
|
|
|
|
|||||||
| Loss on disposal of equipment |
309 | 503 | 333 | |||||||||
| Launch expense(b) |
3,513 | 3,305 | 2,815 | |||||||||
| New plant start up expenses and processing(c) |
113 | 1,996 | — | |||||||||
| Share based compensation(d) |
1,564 | 978 | 1,119 | |||||||||
| Warrant fair valuation(e) |
337 | — | — | |||||||||
|
|
|
|
|
|
|
|||||||
| Adjusted EBITDA |
$ | 5,515 | $ | (192 | ) | $ | (6,096 | ) | ||||
|
|
|
|
|
|
|
|||||||
| (a) | Represents fees paid to certain stockholders for acting as guarantors for a portion of our prior payment obligations under the $62.5 Million Revolver. Pursuant to a Fee and Reimbursement Agreement, the |
12
Table of Contents
| Company was obligated to pay each guarantor a contingent fee equal to 10% per annum of the amount each guarantor committed to guarantee. Portions of the proceeds from our initial public offering and related debt refinancing were used to repay the borrowings under the $62.5 Million Revolver, relieving us of our future fees on the debt guarantee. Concurrently, with the closing of our initial public offering, the outstanding guarantee fees were converted into shares of our Series C Preferred Stock, which were then converted into common stock. See our consolidated financial statements and the notes thereto for additional information. |
| (b) | Represents new store marketing allowance of $1,000 for each store added to our distribution network as well as the uncapitalized freight costs associated with Freshpet Fridge replacements. The expense enhances the overall marketing spend to support our growing distribution network. |
| (c) | Represents additional operating costs incurred in 2013 and in the first quarter of 2014 in connection with the opening of our new primary manufacturing facility in Bethlehem, Pennsylvania, which was completed in the fourth quarter of 2013. |
| (d) | Represents non-cash stock based compensation expense. |
| (e) | Represents the change of fair value for the outstanding warrants. |
| (5) | Represents our currents assets minus current liabilities. |
13
Table of Contents
Investing in our common stock involves a high degree of risk. Before you purchase our common stock, you should carefully consider the risks described below and the other information contained in this prospectus, including our consolidated financial statements and accompanying notes. If any of the following risks actually occurs, our business, financial condition, results of operations or cash flows could be materially adversely affected. In any such case, the trading price of our common stock could decline, and you could lose all or part of your investment.
Risks Related to Our Business and Industry
We may not be able to successfully implement our growth strategy on a timely basis or at all.
Our future success depends, in large part, on our ability to implement our growth strategy of expanding distribution by installing new Freshpet Fridges, attracting new consumers to our brand and launching new products. Our ability to increase awareness, consumer trial and adoption of our products, and to implement this growth strategy depends, among other things, on our ability to:
| • | partner with customers to secure space for our Freshpet Fridges; |
| • | implement our marketing strategy; |
| • | develop new product lines and extensions; |
| • | partner with distributors to deliver our products to customers; |
| • | continue to compete effectively in multiple classes of retail, including grocery, mass, club, pet specialty and natural; and |
| • | expand and maintain brand loyalty. |
We may not be able to successfully implement our growth strategy or to grow consistently from period to period. Our business, financial condition and results of operations will be adversely affected if we fail to implement our growth strategy or if we invest resources in a growth strategy that ultimately proves unsuccessful.
We expect to need capital in the future, and we may not be able to generate sufficient cash flow or raise capital on acceptable terms to meet our needs.
Developing our business will require significant capital in the future. To meet our capital needs, we expect to rely on our cash flow from operations, the proceeds from our initial public offering, our credit facilities, and other third-party financing. Third-party financing in the future may not, however, be available on terms favorable to us, or at all. Our ability to obtain additional funding will be subject to various factors, including general market conditions, our operating performance, the market’s perception of our growth potential, lender sentiment and our ability to incur additional debt in compliance with other contractual restrictions, such as financial covenants under our debt documents.
Additionally, our ability to make payments on and to refinance our indebtedness and to fund planned expenditures for our growth plans will depend on our ability to generate cash in the future. If our business does not achieve the levels of profitability or generate the amount of cash that we anticipate or if we expand faster than anticipated, we may need to seek additional debt or equity financing to operate and expand our business.
We believe that cash and cash equivalents, expected cash flow from operations and planned borrowing capacity are adequate to fund debt service requirements, operating lease obligations, capital expenditures and working capital obligations for the foreseeable future. However, our ability to continue to meet these requirements and obligations will depend on, among other things, our ability to achieve anticipated levels of
14
Table of Contents
revenue and cash flow from operations and our ability to manage costs and working capital successfully. Additionally, our cash flow generation ability is subject to general economic, financial, competitive, legislative and regulatory factors and other factors that are beyond our control. We cannot assure you that our business will generate cash flow from operations in an amount sufficient to enable us to fund our liquidity needs. Further, our capital requirements may vary materially from those currently planned if, for example, our revenues do not reach expected levels or we have to incur unforeseen capital expenditures and make investments to maintain our competitive position. If this is the case, we may seek alternative financing, such as selling additional debt or equity securities, and we cannot assure you that we will be able to do so on favorable terms, if at all. Moreover, if we issue new debt securities, the debt holders would have rights senior to common stockholders to make claims on our assets, and the terms of any debt could restrict our operations, including our ability to pay dividends on our common stock. If we issue additional equity or convertible debt securities, existing stockholders may experience dilution, and such new securities could have rights senior to those of our common stock. These factors may make the timing, amount, terms and conditions of additional financings unattractive. Our inability to raise capital could impede our growth or otherwise require us to forego growth opportunities and could materially adversely affect our business, financial condition and results of operations.
Failure to retain our senior management may adversely affect our operations.
Our success is substantially dependent on the continued service of certain members of our senior management, including Richard Thompson, our Chief Executive Officer. These members of senior management have been primarily responsible for determining the strategic direction of our business and for executing our growth strategy and are integral to our brand and culture, and the reputation we enjoy with suppliers, contract manufacturers, distributors, customers and consumers. The loss of the services of any of these employees could have a material adverse effect on our business and prospects, as we may not be able to find suitable individuals to replace them on a timely basis, if at all. In addition, any such departure could be viewed in a negative light by investors and analysts, which may cause the price of our common stock to decline.
If our products are alleged to cause injury or illness or fail to comply with governmental regulations, we may suffer adverse public relations, need to recall our products and experience product liability claims.
We may be exposed to product recalls, including voluntary recalls or withdrawals, and adverse public relations if our products are alleged to cause injury or illness or if we are alleged to have mislabeled or misbranded our products or otherwise violated governmental regulations. We may also voluntarily recall or withdraw products that we consider below our standards, whether for taste, appearance or otherwise, in order to protect our brand reputation. Consumer or customer concerns (whether justified or not) regarding the safety of our products could adversely affect our business. A product recall or withdrawal could result in substantial and unexpected expenditures, destruction of product inventory, and lost sales due to the unavailability of the product for a period of time, which could reduce profitability and cash flow. In addition, a product recall or withdrawal may require significant management attention. Product recalls, product liability claims (even if unmerited or unsuccessful), or any other events that cause consumers to no longer associate our brands with high quality and safe products may also result in adverse publicity, hurt the value of our brands, lead to a decline in consumer confidence in and demand for our products, and lead to increased scrutiny by federal and state regulatory agencies of our operations, which could have a material adverse effect on our business, financial condition and results of operations.
We also may be subject to product liability claims and adverse public relations if consumption or use of our products is alleged to cause injury or illness. While we carry product liability insurance, our insurance may not be adequate to cover all liabilities we may incur in connection with product liability claims. For example, punitive damages are generally not covered by insurance. In addition, we may not be able to continue to maintain our existing insurance, obtain comparable insurance at a reasonable cost, if at all, or secure additional coverage (which may result in future product liability claims being uninsured). A product liability judgment against us or our agreement to settle a product liability claim could also result in substantial and unexpected expenditures,
15
Table of Contents
which would reduce profitability and cash flow. In addition, even if product liability claims against us are not successful or are not fully pursued, these claims could be costly and time-consuming and may require management to spend time defending the claims rather than operating our business.
The loss of a significant customer, certain actions by a significant customer or financial difficulties of a significant customer could adversely affect our results of operations.
A relatively limited number of customers account for a large percentage of our net sales. During 2014, ten customers, who purchase either directly from us or through third party distributors, collectively accounted for more than 68% of our net sales. Wal-Mart and Target (which purchase through a distributor) are the only customers who accounted for more than 10% of our net sales during 2014. These percentages may increase if there is consolidation among retailers or if mass merchandisers grow disproportionately to their competition. We expect that a significant portion of our revenues will continue to be derived from a small number of customers; however, these customers may not continue to purchase our products in the same quantities as they have in the past. Our customers are generally not contractually obligated to purchase from us. Changes in our customers’ strategies, including a reduction in the number of brands they carry, shipping strategies, a shift of shelf space to or increased emphasis on private label products (including “store brands”), a reduction in shelf space for pet food items or a reduction in the space allocated for our Freshpet Fridges may adversely affect our sales. Requirements that may be imposed on us by our customers, such as sustainability, inventory management or product specification requirements, may have an adverse effect on our results of operations. Additionally, especially during economic downturns, our customers may face financial difficulties, bankruptcy or other business disruptions that may impact their operations and their purchases from us and may affect their ability to pay us for products purchased from us. Customers may grow their inventory in anticipation of a price increase, or in anticipation of, or during, our promotional events, which typically provide for reduced prices during a specified time or other customer or consumer incentives. To the extent customers seek to reduce their usual or customary inventory levels or change their practices regarding purchases in excess of consumer consumption, our sales and results of operations could be adversely impacted in that period. If our sales of products to one or more of our significant customers are reduced, this reduction could have a material adverse effect on our business, financial condition and results of operations.
Our operating results depend, in part, on the sufficiency and effectiveness of our marketing and trade spending programs.
In general, due to the highly competitive nature of the businesses in which we compete, we must execute effective and efficient marketing investments and trade spending programs with respect to our businesses overall to sustain our competitive position in our markets. Marketing investments may be costly. Additionally, we may, from time to time, change our marketing and trade spending strategies, including the timing, amount or nature of television advertising and related promotional programs. The sufficiency and effectiveness of our marketing and trade spending practices is important to our ability to retain or improve our market share or margins. If our marketing and trade spending programs are not successful or if we fail to implement sufficient and effective marketing and trade spending programs, our business, financial condition and results of operations may be adversely affected.
The growth of our business depends on our ability to introduce new products and improve existing products in anticipation of changes in consumer preferences and demographics.
Our business is focused on the development, manufacture, marketing and distribution of pet food products. If consumer demand for our products decreased, our business would suffer. Sales of pet food products are subject to evolving consumer preferences and changing demographics. A significant shift in consumer demand away from our products or a decline in pet ownership could reduce our sales or the prestige of our brand, which would harm our business, financial condition and results of operations.
16
Table of Contents
A key element of our growth strategy depends on our ability to develop and market new products and improvements to our existing products that meet our standards for quality and appeal to consumer preferences. The success of our innovation and product development efforts is affected by our ability to anticipate changes in consumer preferences and demographics, the technical capability of our product development staff in developing and testing product prototypes, including complying with governmental regulations, and the success of our management and sales team in introducing and marketing new products. Failure to develop and market new products that appeal to consumers could negatively impact our business, financial condition and results of operations.
Additionally, the development and introduction of new products requires substantial research, development and marketing expenditures, which we may be unable to recoup if the new products do not gain widespread market acceptance. Efforts to accelerate our innovation may exacerbate risks associated with innovation. If we are unsuccessful in meeting our objectives with respect to new or improved products, our business, financial condition and results of operations could be harmed.
Limited manufacturing capacity could have a material adverse effect on our business, financial condition, and results of operations.
All of the products we manufacture in-house are processed through our Freshpet Kitchens in Bethlehem, Pennsylvania, which we believe is North America’s only fresh, refrigerated pet food manufacturing facility. Accordingly, we have limited available manufacturing capacity to meet our quality standards. An unforeseen event, such as a natural disaster or work stoppage, at our Freshpet Kitchens could significantly limit our manufacturing capacity.
Accurate forecasting of sales demand is critical to ensuring available capacity. Our forecasts are based on multiple assumptions, which may cause our estimates to be inaccurate, affecting our ability to obtain adequate manufacturing capacity. Our current plans to meet expected production needs rely in large part on the successful expansion of our Freshpet Kitchens. Any substantial delay may hinder our ability to produce all of the product needed to meet orders and achieve financial performance.
If our growth exceeds our expectations, we may not be able to increase our own manufacturing capacity to, or obtain contract manufacturing capacity at, a level that meets demand for our products, which could prevent us from meeting increased customer demand and harm our business. However, if we overestimate our demand and overbuild our capacity, we may have significantly underutilized assets, and we may experience reduced margins. If we do not accurately align our manufacturing capabilities with demand, it could have a material adverse effect on our business, financial condition and results of operations.
Government regulation, scrutiny, warnings and public perception could increase our costs of production and increase legal and regulatory expenses.
Manufacturing, processing, labeling, packaging, storing and distributing pet products are activities subject to extensive federal, state and local regulation, as well as foreign regulation. In the United States, these aspects of our operations are regulated by the U.S. Food and Drug Administration (“FDA”), and various state and local public health and agricultural agencies. The FDA Food Safety Modernization Act provides direct recall authority to the FDA and includes a number of other provisions designed to enhance food safety, including increased inspections by the FDA of domestic and foreign food facilities and increased review of food products imported into the United States. In addition, many states have adopted the Association of American Feed Control Officials’ model pet food regulations or variations thereof, which generally regulate the information manufacturers provide about pet food. Complying with government regulation can be costly or may otherwise adversely affect our business. Failure to comply with applicable laws and regulations could subject us to civil remedies, including fines, injunctions, recalls or seizures, as well as potential criminal sanctions, which could have a material adverse effect on our business, financial condition and results of operations.
17
Table of Contents
Our business is also affected by import and export controls and similar laws and regulations, both in the United States and elsewhere. Issues such as national security or health and safety, which slow or otherwise restrict imports or exports, could adversely affect our business. In addition, the modification of existing laws or regulations or the introduction of new laws or regulations could require us to make material expenditures or otherwise adversely affect the way that we have historically operated our business.
Our business may be subject to false marketing claims.
From time to time we may be subject to claims from competitors or consumers, including consumer class actions, alleging that our product claims are deceptive. Regardless of their merit, these claims can require significant time and expense to investigate and defend. Whether or not a false marketing claim is successful, such assertions could have an adverse effect on our business, financial condition and results of operations, and the negative publicity surrounding them could harm our reputation and brand image.
Adverse weather conditions, natural disasters, pestilences and other natural conditions can disrupt our operations, which can adversely affect our business, financial condition and results of operations.
The ingredients that we use in the production of our products (including, among others, meat, vegetables, fruits, carrageenans, whole grains, vitamins and minerals) are vulnerable to adverse weather conditions and natural disasters, such as floods, droughts, frosts, fires, earthquakes, tornadoes and pestilences. Adverse weather conditions may be impacted by climate change and other factors. Adverse weather conditions and natural disasters can reduce crop size and crop quality, which in turn could reduce our supply of ingredients, lower recoveries of usable ingredients, increase the prices of our ingredients, increase our transportation costs or increase our cost of storing ingredients if harvests are accelerated and processing capacity is unavailable. Additionally, the growth of crops, as well as the manufacture and processing of our products, requires significant amounts of water. Drought or other causes of a reduction of water in aquifers may affect availability of water, which in turn may adversely affect our results of operations. Competing manufacturers may be affected differently by weather conditions and natural disasters depending on the location of their supplies or operations. If our supply of ingredients is reduced, we may not be able to find enough supplemental supply sources on favorable terms, if at all, which could impact our ability to supply product to our customers and adversely affect our business, financial condition and results of operations. Increased costs for ingredients or other inputs could also adversely affect our business, financial condition and results of operations as described in “—The inputs, commodities, and ingredients that we require are subject to price increases and shortages that could adversely affect our results of operations.”
Additionally, adverse weather conditions, natural disasters or other natural conditions affecting our operating activities or major facilities could cause an interruption or delay in our production or delivery schedules and loss of inventory and/or data or render us unable to accept and fulfill customer orders in a timely manner, or at all. If our operations are damaged by a fire, flood or other disaster, for example, we may be subject to supply or delivery interruptions, destruction of our facilities and products or other business disruptions, which could adversely affect our business, financial condition and results of operations.
If we fail to develop and maintain our brand, our business could suffer.
We believe that developing and maintaining our brand is critical to our success. The importance of our brand recognition may become even greater as competitors offer more products similar to ours. Our financial success is directly dependent on consumer perception of our brand. Our brand-building activities involve providing high-quality products, increasing awareness of our brand, creating and maintaining brand loyalty and increasing the availability of our products.
The success of our brand may suffer if our marketing plans or product initiatives do not have the desired impact on our brand’s image or its ability to attract customers. Further, our brand value could diminish significantly due to a number of factors, including consumer perception that we have acted in an irresponsible
18
Table of Contents
manner, adverse publicity about our products (whether or not valid), our failure to maintain the quality of our products, product contamination, the failure of our products to deliver consistently positive consumer experiences, or the products becoming unavailable to consumers. The growing use of social and digital media by consumers increases the speed and extent that information and opinions can be shared. Negative posts or comments about us or our brands or products on social or digital media could damage our brands and reputation. If we fail to maintain the favorable perception of our brands, our business, financial condition and results of operations could be negatively impacted.
The pet food product category in which we participate is highly competitive. If we are unable to compete effectively, our results of operations could be adversely affected.
The pet food product category in which we participate is highly competitive. There are numerous brands and products that compete for shelf space and sales, with competition based primarily upon brand recognition and loyalty, product packaging, quality and innovation, taste, nutrition, breadth of product line, price and convenience. We compete with a significant number of companies of varying sizes, including divisions or subsidiaries of larger companies. We face strong competition from competitors’ products that are sometimes sold at lower prices. Price gaps between our products and our competitors’ products may result in market share erosion and harm our business. A number of our competitors have broader product lines, substantially greater financial and other resources and/or lower fixed costs than we have. Our competitors may succeed in developing new or enhanced products, including fresh, refrigerated pet food, that are more attractive to customers or consumers than our products. These competitors may also prove to be more successful in marketing and selling their products or may be better able to increase prices to reflect cost pressures. We may not compete successfully with these other companies or maintain or grow the distribution of our products. We cannot predict the pricing or promotional activities of our competitors or whether they will have a negative effect on us. Many of our competitors engage in aggressive pricing and promotional activities. There are competitive pressures and other factors which could cause our products to lose market share or decline in sales or result in significant price or margin erosion, which would have a material adverse effect on our business, financial condition and results of operations.
If the operating capacity or reputation of our Freshpet Fridges is harmed, our business, financial condition and results of operations may suffer.
Our success depends on our network of company-owned branded refrigerators, known as Freshpet Fridges. If the operating capacity of our Freshpet Fridges is harmed by external factors, such as adverse weather or energy supply, or internal factors, such as faulty manufacturing or insufficient maintenance, our products contained in those fridges may be damaged and need to be discarded. In addition, if our Freshpet Fridges fail to operate as intended, for any reason, the reputation of our Freshpet Fridges with customers and the reputation of our brand with consumers may decline. In such event, customers may choose to discontinue, or not to expand, their use of Freshpet Fridges and our products and consumers may choose to forgo purchasing our products. Additionally, growing concern about the environmental impact of refrigerators could likewise harm the reputation of our Freshpet Fridges with customers and our brand with consumers. Any such harm to the operating capacity or reputation of our Freshpet Fridges could adversely affect our business, financial condition and results of operations.
If we are not successful in protecting our intellectual property rights, our business, financial conditions and results of operations may be harmed.
We rely on trademark, copyright, trade secret, patent and other intellectual property laws, as well as nondisclosure and confidentiality agreements and other methods, to protect our intellectual property rights as well as the intellectual property of third parties with respect to which we are subject to non- use and non-disclosure obligations. We may need to engage in litigation or similar activities to enforce our intellectual property rights, to protect our trade secrets or to determine the validity and scope of proprietary rights of others.
19
Table of Contents
Any such litigation could require us to expend significant resources and divert the efforts and attention of our management and other personnel from our business operations. The steps we take to prevent misappropriation, infringement or other violation of our intellectual property or the intellectual property of others may not be successful. In addition, effective patent, copyright, trademark and trade secret protection may be unavailable or limited for some of our trademarks and patents in some foreign countries. Failure to protect our intellectual property could harm our business, financial condition and results of operations.
Our brand names and trademarks are important to our business, and we have registered or applied to register many of these trademarks. We cannot assure you that our trademark applications will be approved. Third parties may also oppose our trademark applications, or otherwise challenge our use of the trademarks. In the event that our trademarks are successfully challenged, we could be forced to rebrand our products, which could result in the loss of brand recognition and could require us to devote resources advertising and marketing new brands. Further, we cannot assure you that competitors will not infringe our trademarks, or that we will have adequate resources to enforce our trademarks.
We rely on unpatented proprietary know-how in the areas of recipes, ingredients sourcing, cooking techniques, packaging, transportation and delivery. It is possible that others will independently develop the same or similar know-how or otherwise obtain access to our proprietary know-how. To protect our trade secrets and other proprietary know-how, we require employees, consultants, advisors and collaborators to enter into confidentiality agreements. We cannot assure you that these agreements will provide meaningful protection in the event of any unauthorized use, misappropriation or disclosure of our trade secrets, know-how or other proprietary information. If we are unable to maintain the proprietary nature of our recipes, methods and other know-how, we could be materially adversely affected.
We may not be able to successfully implement initiatives to improve productivity and streamline operations to control or reduce costs. Failure to implement such initiatives could adversely affect our results of operations.
Because our ability to effectively implement price increases for our products can be affected by factors outside of our control, our profitability and growth depend significantly on our efforts to control our operating costs. Because many of our costs, such as energy and logistics costs, packaging costs and ingredient, commodity and raw product costs, are affected by factors outside or substantially outside our control, we generally must seek to control or reduce costs through operating efficiency or other initiatives. If we are not able to identify and complete initiatives designed to control or reduce costs and increase operating efficiency on time or within budget, our results of operations could be adversely impacted. In addition, if the cost savings initiatives we have implemented to date, or any future cost-savings initiatives, do not generate expected cost savings, our business, financial condition and results of operations could be adversely affected.
The inputs, commodities, and ingredients that we require are subject to price increases and shortages that could adversely affect our results of operations.
The primary inputs, commodities, and ingredients that we use include meat, vegetables, fruits, carrageenans, whole grains, vitamins, minerals, packaging and energy (including wind power). Prices for these and other items we use may be volatile, and we may experience shortages in these items due to factors beyond our control, such as commodity market fluctuations, availability of supply, increased demand (whether for the item we require or for other items, which in turn impacts the item we require), weather conditions, natural disasters, currency fluctuations, governmental regulations (including import restrictions), agricultural programs or issues, energy programs, labor strikes and the financial health of our suppliers. Input, commodity, and ingredient price increases or shortages may result in higher costs or interrupt our production schedules, each of which could have a material adverse effect on our results of operations. Production delays could lead to reduced sales volumes and profitability as well as loss of market share. Higher costs could adversely impact our earnings. For example, fuel prices affect our transportation costs for both ingredients and finished product. If we are not able to implement our productivity initiatives or increase our product prices to offset price increases of our inputs, commodities, and
20
Table of Contents
ingredients, as a result of consumer sensitivity to pricing or otherwise, or if sales volumes decline due to price increases, our results of operations could be adversely affected. Our competitors may be better able than we are to implement productivity initiatives or effect price increases or to otherwise pass along cost increases to their customers. Moreover, if we increase our prices in response to increased costs, we may need to increase marketing spending, including trade promotion spending, in order to retain our market share. Such increased marketing spending may significantly offset the benefits, if any, of any price increase and negatively impact our business, financial condition and results of operations.
If the ingredients we use in our products are contaminated, alleged to be contaminated or are otherwise rumored to have adverse effects, our results of operations could be adversely affected.
We buy our ingredients from third-party suppliers. If these materials are alleged or prove to include contaminants that affect the safety or quality of our products or are otherwise rumored to have adverse effects, for any reason, we may need to find alternate ingredients for our products, delay production of our products, or discard or otherwise dispose of our products, which could adversely affect our results of operations. Additionally, if this occurs after the affected product has been distributed, we may need to withdraw or recall the affected product and we may experience adverse publicity or product liability claims. In either case, our business, financial condition and results of operations could be adversely affected.
Restrictions imposed in reaction to outbreaks of animal diseases could have a material adverse effect on our business, financial condition and results of operations.
The cost of the protein-based ingredients we use in our products has been adversely impacted in the past by the publicity surrounding animal diseases, such as bovine spongiform encephalopathy, or “mad cow disease.” As a result of extensive global publicity and trade restrictions imposed to provide safeguards against mad cow disease, the cost of alternative sources of the protein-based ingredients we use in our products, such as soybeans, pork meat and bone meal, has from time to time increased significantly and may increase again in the future if additional cases of mad cow disease are found.
If mad cow disease or other animal diseases, such as foot-and-mouth disease or highly pathogenic avian influenza, also known as “bird flu,” impacts the availability of the protein-based ingredients we use in our products, we may be required to locate alternative sources for protein-based ingredients. Those sources may not be available to sustain our sales volumes, may be more costly and may affect the quality and nutritional value of our products. If outbreaks of mad cow disease, foot-and- mouth disease, bird flu or any other animal disease or the regulation or publicity resulting therefrom impacts the cost of the protein-based ingredients we use in our products, or the cost of the alternative protein-based ingredients necessary for our products as compared to our current costs, we may be required to increase the selling price of our products to avoid margin deterioration. However, we may not be able to charge higher prices for our products without negatively impacting future sales volumes.
We rely on co-packers to provide our supply of treat products. Any failure by co-packers to fulfill their obligations or any termination or renegotiation of our co-packing agreements could adversely affect our results of operations.
We have supply agreements with co-packers that require them to provide us with specific finished products. We rely on co-packers as our sole-source for treat products. We also anticipate that we will rely on sole suppliers for future products. The failure for any reason of a co-packer to fulfill its obligations under the applicable agreements with us or the termination or renegotiation of any such co- packing agreement could result in disruptions to our supply of finished goods and have an adverse effect on our results of operations. Additionally, from time to time, a co-packer may experience financial difficulties, bankruptcy or other business disruptions, which could disrupt our supply of finished goods or require that we incur additional expense by providing financial accommodations to the co-packer or taking other steps to seek to minimize or avoid supply disruption,
21
Table of Contents
such as establishing a new co- packing arrangement with another provider. During an economic downturn, our co-packers may be more susceptible to experiencing such financial difficulties, bankruptcies or other business disruptions. A new co-packing arrangement may not be available on terms as favorable to us as the existing co- packing arrangement, if at all.
If we do not manage our supply chain effectively, including inventory levels, our business, financial condition and results of operation may be adversely affected.
The inability of any supplier, co-packer, third-party distributor or transportation provider to deliver or perform for us in a timely or cost-effective manner could cause our operating costs to increase and our profit margins to decrease. We must continuously monitor our inventory and product mix against forecasted demand or risk having inadequate supplies to meet consumer demand as well as having too much inventory on hand that may reach its expiration date and become unsaleable. If we are unable to manage our supply chain effectively and ensure that our products are available to meet consumer demand, our operating costs could increase and our profit margins could decrease.
Failure by our transportation providers to deliver our products on time or at all could result in lost sales.
We use third-party transportation providers for our product shipments. We rely on one such provider for almost all of our shipments. Transportation services include scheduling and coordinating transportation of finished products to our customers, shipment tracking and freight dispatch services. Our use of transportation services for shipments is subject to risks, including increases in fuel prices, which would increase our shipping costs, and employee strikes and inclement weather, which may impact the ability of providers to provide delivery services that adequately meet our shipping needs, including keeping our products adequately refrigerated during shipment. Any such change could cause us to incur costs and expend resources. Moreover, in the future we may not be able to obtain terms as favorable as those we receive from the third-party transportation providers that we currently use, which in turn would increase our costs and thereby adversely affect our business, financial condition and results of operations.
If we are unable to maintain or increase prices for our products, our results of operations may be adversely affected.
We rely in part on price increases to neutralize cost increases and improve the profitability of our business. Our ability to effectively implement price increases or otherwise raise prices for our products can be affected by a number of factors, including competition, our competitors’ pricing and marketing, aggregate industry supply, category limitations, market demand and economic conditions, including inflationary pressures. During challenging economic times, our ability to increase the prices of our products may be particularly constrained. Additionally, customers may pressure us to rescind price increases that we have announced or already implemented (either through a change in list price or increased promotional activity). If we are unable to maintain or increase prices for our products (or must increase promotional activity), our results of operations could be adversely affected. Furthermore, price increases generally result in volume losses, as consumers purchase fewer units. If such losses (also referred to as the elasticity impact) are greater than expected or if we lose distribution due to a price increase (which may result from a customer response or otherwise), our business, financial condition and results of operations could be adversely affected.
We may face difficulties as we expand into countries in which we have no prior operating experience.
We may choose to expand our global footprint by entering into new markets. As we expand our business into new countries we may encounter regulatory, personnel, technological and other difficulties that increase our expenses or delay our ability to become profitable in such countries. This may have an adverse effect on our business.
22
Table of Contents
If we are unable to attract, train and retain employees, we may not be able to grow or successfully operate our business.
Our success depends in part upon our ability to attract, train and retain a sufficient number of employees who understand and appreciate our culture and are able to represent our brand effectively and establish credibility with our business partners and consumers. If we are unable to hire and retain employees capable of meeting our business needs and expectations, our business and brand image may be impaired. Any failure to meet our staffing needs or any material increase in turnover rates of our employees may adversely affect our business, financial condition and results of operations.
Unionization activities or labor disputes may disrupt our operations and affect our profitability.
Although none of our employees are currently covered under collective bargaining agreements, our employees may elect to be represented by labor unions in the future. If a significant number of our employees were to become unionized and collective bargaining agreement terms were significantly different from our current compensation arrangements, it could adversely affect our business, financial condition and results of operations. In addition, a labor dispute involving some or all of our employees may harm our reputation, disrupt our operations and reduce our revenues, and resolution of disputes may increase our costs.
As an employer, we may be subject to various employment-related claims, such as individual or class actions or government enforcement actions relating to alleged employment discrimination, employee classification and related withholding, wage-hour, labor standards or healthcare and benefit issues. Such actions, if brought against us and successful in whole or in part, may affect our ability to compete or could materially adversely affect our business, financial condition and results of operations.
Disruptions in the worldwide economy may adversely affect our business, results of operations and financial condition.
Adverse and uncertain economic conditions may impact distributor, customer and consumer demand for our products. In addition, our ability to manage normal commercial relationships with our suppliers, contract manufacturers, distributors, customers, consumers and creditors may suffer. Consumers have access to lower-priced offerings and, during economic downturns, may shift purchases to these lower-priced or other perceived value offerings. Customers may become more conservative in response to these conditions and seek to reduce their inventories. For example, during the economic downturn from 2007 through 2009, customers significantly reduced their inventories, and inventory levels have not returned to, and are not expected to return to, pre-downturn levels. Our results of operations depend upon, among other things, our ability to maintain and increase sales volume with our existing customers, to attract new consumers and to provide products that appeal to consumers at prices they are willing and able to pay. Prolonged unfavorable economic conditions may have an adverse effect on our sales and profitability.
We are subject to environmental regulation and environmental risks, which may adversely affect our business. Climate change or concerns regarding climate change may increase environmental regulation and environmental risks.
As a result of our agricultural and food processing operations, we are subject to numerous environmental laws and regulations. Many of these laws and regulations are becoming increasingly stringent and compliance with them is becoming increasingly expensive. Changes in environmental conditions may result in existing legislation having a greater impact on us. Additionally, we may be subject to new legislation and regulation in the future. For example, increasing concern about climate change may result in additional federal and state legal and regulatory requirements to reduce or mitigate the effects of green-house gas emissions. Compliance with environmental legislation and regulations, particularly if they are more aggressive than our current sustainability measures used to monitor our emissions and improve our energy efficiency, may increase our costs and adversely
23
Table of Contents
affect our results of operations. We cannot predict the extent to which any environmental law or regulation that may be enacted or enforced in the future may affect our operations. The effect of these actions and future actions on the availability and use of pesticides could adversely impact our financial position or results of operations. If the cost of compliance with applicable environmental laws or regulations increases, our business, financial condition and results of operations could be negatively impacted.
Intellectual property infringement or violation claims may adversely impact our results of operations.
We may be subject to claims by others that we infringe on their intellectual property or otherwise violate their intellectual property rights. To the extent we develop, introduce and acquire products, the risk of such claims may be exacerbated. Any such claims, even those without merit, could (i) require us to expend significant resources, (ii) cause us to cease making or using products that incorporate the challenged intellectual property, (iii) require us to redesign, reengineer or rebrand our products or packaging, including our Freshpet Fridges located in over 13,300 retail stores, (iv) divert management’s attention and resources or (v) require us to enter into royalty or licensing agreements in order to obtain the right to use a third party’s intellectual property, which may not be available to us on acceptable terms or at all. Any of such events may adversely impact our business, financial condition and results of operations.
Our business operations could be disrupted if our information technology systems fail to perform adequately.
The efficient operation of our business depends on our information technology systems, some of which are managed by third-party service providers. We rely on our information technology systems to effectively manage our business data, communications, supply chain, order entry and fulfillment, and other business processes. The failure of our information technology systems to perform as we anticipate could disrupt our business and could result in transaction errors, processing inefficiencies, and the loss of sales and customers, causing our business and results of operations to suffer. In addition, our information technology systems may be vulnerable to damage or interruption from circumstances beyond our control, including fire, natural disasters, power outages, systems failures, security breaches, cyber attacks and viruses. Any such damage or interruption could have a material adverse effect on our business, financial condition and results of operations.
We are subject to cyber security risks and may incur increasing costs in an effort to minimize those risks.
Our business employs systems and websites that allow for the secure storage and transmission of proprietary or confidential information regarding our customers, employees, suppliers and others, including personal identification information. Security breaches could expose us to a risk of loss or misuse of this information, litigation, and potential liability. We may not have the resources or technical sophistication to anticipate or prevent rapidly-evolving types of cyber attacks. Attacks may be targeted at us, our customers and suppliers, or others who have entrusted us with information. Actual or anticipated attacks may cause us to incur increasing costs, including costs to deploy additional personnel and protection technologies, train employees, and engage third-party experts and consultants. Advances in computer capabilities, new technological discoveries, or other developments may result in the technology used by us to protect transaction or other data being breached or compromised. In addition, data and security breaches can also occur as a result of non-technical issues, including breach by us or by persons with whom we have commercial relationships that result in the unauthorized release of personal or confidential information. Any compromise or breach of our security could result in a violation of applicable privacy and other laws, significant legal and financial exposure, and a loss of confidence in our security measures, which could have an adverse effect on our business, financial condition and results of operations.
If we are unable to substantially utilize our net operating loss carryforward, our financial results will be adversely affected.
As of December 31, 2014, we had federal net operating loss (“NOLs”) carryforwards of approximately $163.0 million, which expire at various dates between 2025 and 2034, and state NOLs of approximately $124.5 million. In general, a corporation that undergoes an “ownership change” is subject to limitations on its ability to
24
Table of Contents
utilize its prechange NOLs, to offset future taxable income. In general, under section 382 of the U.S. Internal Revenue Code of 1986, as amended (the “Code”), an ownership change occurs if the aggregate stock ownership of certain stockholders (generally 5% stockholders, applying certain look-through and aggregation rules) increases by more than 50 percentage points over such stockholders’ lowest percentage ownership during the testing period (generally three years). We may be subject to the net operating loss utilization provisions of section 382 of the Code. Purchases of our common stock in amounts greater than specified levels, which is beyond our control, could result in an ownership change and the imposition of an annual limitation on our ability to utilize our NOLs attributable to periods before the ownership change in future tax periods. The amount of the annual limitation depends on our value immediately before the ownership change, changes to our capital during a specified period prior to the ownership change, and the federal published interest rate. Limitations imposed on our ability to utilize NOLs could cause U.S. federal and state income taxes to be paid earlier than would be paid if such limitations were not in effect and could cause such NOLs to expire unused, in each case reducing or eliminating the benefit of such NOLs. Although we have not undergone a Code Section 382 analysis, if we were to undergo an ownership change it is likely that the utilization of the NOLs will be substantially limited.
Failure to maintain effective internal controls in accordance with Section 404 of the Sarbanes-Oxley Act could have a material adverse effect on our business and stock price.
As a private company, we were not required to comply with the rules of the SEC implementing Section 404 of the Sarbanes-Oxley Act and therefore were not required to make a formal assessment of the effectiveness of our internal control over financial reporting for that purpose. As a publicly traded company, we are now required to comply with the SEC’s rules implementing Section 302 and 404 of the Sarbanes-Oxley Act, which require management to certify financial and other information in our quarterly and annual reports and provide an annual management report on the effectiveness of controls over financial reporting. Though we are required to disclose changes made in our internal controls and procedures on a quarterly basis, we are not required to make our first annual assessment of our internal control over financial reporting pursuant to Section 404 until the year following our first annual report required to be filed with the SEC. Pursuant to the JOBS Act, our independent registered public accounting firm will not be required to attest to the effectiveness of our internal control over financial reporting until the later of the year following our first annual report required to be filed with the SEC or the date we are no longer an emerging growth company, which may be up to five full fiscal years following our initial public offering in November 2014.
If we identify weaknesses in our internal control over financial reporting, are unable to comply with the requirements of Section 404 in a timely manner or to assert that our internal control over financial reporting is effective, or if our independent registered public accounting firm is unable to express an opinion as to the effectiveness of our internal control over financial reporting, investors may lose confidence in the accuracy and completeness of our financial reports and the market price of our common stock could be negatively affected, and we could become subject to investigations by Nasdaq, the SEC or other regulatory authorities, which could require additional financial and management resources.
Risks Related to Ownership of Our Common Stock
Our quarterly operating results may fluctuate significantly and could fall below the expectations of securities analysts and investors due to seasonality and other factors, some of which are beyond our control, resulting in a decline in our stock price.
Our quarterly operating results may fluctuate significantly because of several factors, including:
| • | the timing of installation of new Freshpet Fridges and related expenses; |
| • | profitability of our Freshpet Fridges, especially in new markets; |
| • | changes in interest rates; |
| • | impairment of long-lived assets; |
| • | macroeconomic conditions, both nationally and locally; |
25
Table of Contents
| • | negative publicity relating to the consumption of products we serve; |
| • | changes in consumer preferences and competitive conditions; |
| • | expansion to new markets; |
| • | increases in infrastructure costs; and |
| • | fluctuations in commodity prices. |
As a result of these factors, our quarterly and annual operating results may fluctuate significantly. Accordingly, results for any one quarter are not necessarily indicative of results to be expected for any other quarter or for any year for any particular future period may decrease. In the future, operating results may fall below the expectations of securities analysts and investors. In that event, the price of our common stock would likely decrease.
The price of our common stock has been and may continue to be volatile and you may lose all or part of your investment.
Since our initial public offering and through April 24, 2015, our share price has ranged from a high of $25.92 per share to a low of $13.11 per share. The market price of our common stock could fluctuate significantly for the foreseeable future, and you may not be able to resell your shares at or above the purchase price. Those fluctuations could be based on various factors in addition to those otherwise described in this prospectus, including those described under “—Risks Related to Our Business and Industry” and the following:
| • | our operating performance and the performance of our competitors or pet food companies in general; |
| • | the public’s reaction to our press releases, our other public announcements and our filings with the SEC; |
| • | changes in earnings estimates or recommendations by research analysts who follow us or other companies in our industry; |
| • | global, national or local economic, legal and regulatory factors unrelated to our performance; |
| • | the number of our shares publicly traded; |
| • | future sales of our common stock by our officers, directors and significant stockholders; |
| • | the arrival or departure of key personnel; and |
| • | other developments affecting us, our industry or our competitors. |
In addition, in recent years the stock market has experienced significant price and volume fluctuations. These fluctuations may be unrelated to the operating performance of particular companies. These broad market fluctuations may cause declines in the market price of our common stock. The price of our common stock could fluctuate based upon factors that have little or nothing to do with our business, financial condition and results of operations, and those fluctuations could materially reduce our common stock price.
As we operate in a single industry, we are especially vulnerable to these factors to the extent that they affect our industry or our products. In the past, securities class action litigation has often been initiated against companies following periods of volatility in their stock price. This type of litigation could result in substantial costs and divert our management’s attention and resources, and could also require us to make substantial payments to satisfy judgments or to settle litigation.
Future sales of our common stock, or the perception that such sales may occur, could depress our common stock price.
The price of our common stock could decline if there are substantial sales of our common stock, particularly sales by our directors, executive officers and significant stockholders. Upon the completion of this offering, we will have 33,470,732 shares of our common stock outstanding. All of the shares of common stock sold in this
26
Table of Contents
offering will be eligible for sale in the public market, unless they are held by our affiliates. Shares held by directors, executive officers and other affiliates will be subject to volume limitations under Rule 144 under the Securities Act of 1933, as amended (the “Securities Act”).
After this offering, our officers, directors, greater than 5% stockholders and selling stockholders will be subject to lock-up agreements with the underwriters that restrict their ability to sell shares of common stock until 91 days after the date of this prospectus. After the lock-up agreements expire, an additional 14,438,896 shares of common stock will be eligible for sale in the public market, subject in many cases to the limitations of Rule 144 under the Securities Act. Upon completion of this offering, stockholders owning an aggregate of up to 11,294,651 shares of common stock are entitled, under a registration rights agreement, to require us to register shares of our common stock owned by them for sale in a public offering. We have also registered shares of common stock that we have issued and may issue in the future under our employee equity incentive plans. Once issued, these shares may be sold freely in the public market, subject to existing lock-up agreements.
Goldman, Sachs & Co. and Credit Suisse Securities (USA) LLC, on behalf of the underwriters, in their discretion may permit our stockholders to sell shares prior to the expiration of the restrictive provisions contained in those lock-up agreements. The market price of the shares of our common stock could decline as a result of the sale of a substantial number of our shares of common stock in the public market, the availability of shares for sale or the perception in the market that the holders of a large number of shares intend to sell their shares. In addition, the sale of these shares by stockholders could impair our ability to raise capital through the sale of additional stock.
If securities or industry analysts do not publish research or publish inaccurate or unfavorable research about our business, our stock price and trading volume could decline.
The trading market for our common stock will depend in part on the research and reports that securities or industry analysts publish about us or our business. If one or more of the analysts who cover us downgrades our common stock or publishes inaccurate or unfavorable research about our business, our stock price would likely decline. If one or more of these analysts ceases coverage of us or fails to publish reports on us regularly, demand for our common stock could decrease, which could cause our stock prices and trading volume to decline.
Our principal stockholders and their affiliates own a substantial portion of our outstanding equity, and their interests may not always coincide with the interests of the other holders.
Following this offering, MidOcean and Freshpet Investors LLC are expected to own approximately 21.4% and 12.3%, respectively, of our common stock, or 20.7% and 11.4%, respectively, if the underwriters’ option to purchase additional shares of our common stock is exercised in full. As a result, MidOcean and Freshpet Investors LLC could potentially have significant influence over all matters presented to our stockholders for approval, including election and removal of our directors, change in control transactions and the outcome of all actions requiring a majority stockholder approval.
In addition, persons associated with MidOcean and Freshpet Investors LLC currently serve on our Board of Directors. The interests of MidOcean and Freshpet Investors LLC may not always coincide with the interests of the other holders of our common stock, and the concentration of control in MidOcean and Freshpet Investors LLC will limit other stockholders’ ability to influence corporate matters. The concentration of ownership and voting power of MidOcean and Freshpet Investors LLC may also delay, defer or even prevent an acquisition by a third party or other change of control of our Company and may make some transactions more difficult or impossible without their support, even if such events are in the best interests of our other stockholders. Therefore, the concentration of voting power among MidOcean and Freshpet Investors LLC may have an adverse effect on the price of our common stock. We may also take actions that our other stockholders do not view as beneficial, which may adversely affect our results of operations and financial condition and cause the value of your investment to decline.
27
Table of Contents
We have no current plans to pay dividends for the foreseeable future.
We may retain future earnings, if any, for future operations, expansion and debt repayment and have no current plans to pay any cash dividends for the foreseeable future. Any future determination to declare and pay cash dividends will be at the discretion of our Board of Directors and will depend on, among other things, our financial condition, results of operations, cash requirements, contractual restrictions and such other factors as our Board of Directors deems relevant. Our ability to pay dividends may also be limited by covenants of any future outstanding indebtedness we or our subsidiaries incur. As a result, you may not receive any return on an investment in our common stock unless you sell our common stock for a price greater than that which you paid for it. See “Dividend Policy.”
Provisions in our charter documents and Delaware law may delay or prevent our acquisition by a third party, even if the acquisition would be beneficial to our stockholders, and could make it more difficult for you to change our management.
Our Certificate of Incorporation and Bylaws and Delaware law contain several provisions that may make it more difficult for a third party to acquire control of us without the approval of our Board of Directors. For example, we will have a classified Board of Directors with three-year staggered terms, which could delay the ability of stockholders to change membership of a majority of our Board of Directors. These provisions may make it more difficult or expensive for a third party to acquire a majority of our outstanding equity interests. These provisions also may delay, prevent or deter a merger, acquisition, tender offer, proxy contest or other transaction that might otherwise result in our stockholders receiving a premium over the market price for their common stock. See “Description of Capital Stock.”
Under our Certificate of Incorporation, individuals or entities that bring certain claims or join such claims may be obligated to reimburse the Company for the expenses it reasonably incurs in connection with such actions if the claim proves unsuccessful.
Our Certificate of Incorporation provides, to the fullest extent permitted by law, in the event that any person or entity (the “Claimant”) (x) initiates or asserts (1) any derivative action or proceeding brought on behalf of the Company, (2) any claim of breach of a fiduciary duty owed by any director, officer, employee or agent of the Company to the Company or its stockholders, (3) any action against the Company or any of its directors, officers, employees or agents arising pursuant to any provision of the General Corporation Law of the State of Delaware (the “DGCL”), our Certificate of Incorporation or our Bylaws, or (4) any action asserting a claim governed by the internal affairs doctrine (each of the foregoing, a “Claim”), or joins any such Claim as a named party, and (y) does not thereby obtain a judgment on the merits that substantially achieves the full remedy or relief sought in the Claim, such Claimant shall be jointly and severally obligated to reimburse the Company for all fees, costs and expenses (including attorneys’ fees and the fees of experts) actually and reasonably incurred by the Company in defending such Claim. This provision of our Certificate of Incorporation may deter stockholder litigation that may be in the best interests of the Company or our stockholders.
We are an emerging growth company and, as a result of the reduced disclosure and governance requirements applicable to emerging growth companies, our common stock may be less attractive to investors.
We are an emerging growth company, as defined in the JOBS Act, and we are eligible to take advantage of certain exemptions from various reporting requirements applicable to other public companies, but not to emerging growth companies, including, but not limited to, an exemption from the auditor attestation requirement of Section 404 of the Sarbanes-Oxley Act, reduced disclosure about executive compensation arrangements pursuant to the rules applicable to smaller reporting companies and no requirement to seek non-binding advisory votes on executive compensation or golden parachute arrangements. We will remain an emerging growth company until the earliest of (i) the end of the fiscal year following the fifth anniversary of the completion of our initial public offering in November 2014, (ii) the first fiscal year after our annual gross revenue are $1.0 billion
28
Table of Contents
or more, (iii) the date on which we have, during the previous three-year period, issued more than $1.0 billion in non-convertible debt securities or (iv) the end of any fiscal year in which the market value of our common stock held by non-affiliates exceeded $700 million as of the end of the second quarter of that fiscal year.
We cannot predict if investors will find our common stock less attractive as a result of our taking advantage of these exemptions. If some investors find our common stock less attractive as a result of our choices, there may be a less active trading market for our common stock and our stock price may be more volatile.
Claims for indemnification by our directors and officers may reduce our available funds to satisfy successful third-party claims against us and may reduce the amount of money available to us.
Our Certificate of Incorporation and Bylaws provide that we will indemnify our directors and officers, in each case to the fullest extent permitted by Delaware law. In addition, we have entered and expect to continue to enter into agreements to indemnify our directors, executive officers and other employees as determined by our Board of Directors. Under the terms of such indemnification agreements, we are required to indemnify each of our directors and officers, to the fullest extent permitted by the laws of the state of Delaware, if the basis of the indemnitee’s involvement was by reason of the fact that the indemnitee is or was a director or officer of the Company or any of its subsidiaries or was serving at the Company’s request in an official capacity for another entity. We must indemnify our officers and directors against all reasonable fees, expenses, charges and other costs of any type or nature whatsoever, including any and all expenses and obligations paid or incurred in connection with investigating, defending, being a witness in, participating in (including on appeal), or preparing to defend, be a witness or participate in any completed, actual, pending or threatened action, suit, claim or proceeding, whether civil, criminal, administrative or investigative, or establishing or enforcing a right to indemnification under the indemnification agreement. The indemnification agreements also require us, if so requested, to advance within 30 days of such request all reasonable fees, expenses, charges and other costs that such director or officer incurred, provided that such person will return any such advance if it is ultimately determined that such person is not entitled to indemnification by us. Any claims for indemnification by our directors and officers may reduce our available funds to satisfy successful third-party claims against us and may reduce the amount of money available to us.
Future offerings of debt securities, which would rank senior to our common stock upon our bankruptcy or liquidation, and future offerings of equity securities that may be senior to our common stock for the purposes of dividend and liquidating distributions, may adversely affect the market price of our common stock.
In the future, we may attempt to increase our capital resources by making offerings of debt securities or additional offerings of equity securities. Upon bankruptcy or liquidation, holders of our debt securities and shares of preferred stock and lenders with respect to other borrowings will receive a distribution of our available assets prior to the holders of our common stock. Additional equity offerings may dilute the holdings of our existing stockholders or reduce the market price of our common stock, or both, and may result in future Section 382 limitations that could reduce the rate at which we utilize our NOL carryforwards. Preferred stock, if issued, could have a preference on liquidating distributions or a preference on dividend payments or both that could limit our ability to make a dividend distribution to the holders of our common stock. Our decision to issue securities in any future offering will depend on market conditions and other factors beyond our control. As a result, we cannot predict or estimate the amount, timing or nature of our future offerings, and purchasers of our common stock in this offering bear the risk of our future offerings reducing the market price of our common stock and diluting their ownership interest in our company.
29
Table of Contents
This prospectus contains forward-looking statements that are subject to risks and uncertainties. All statements other than statements of historical fact included in this prospectus are forward-looking statements. Forward-looking statements discuss our current expectations and projections relating to our financial condition, results of operations, plans, objectives, future performance and business. You can identify forward-looking statements by the fact that they do not relate strictly to historical or current facts. These statements may include words such as “aim,” “anticipate,” “believe,” “estimate,” “expect,” “forecast,” “outlook,” “potential,” “project,” “projection,” “plan,” “intend,” “seek,” “may,” “could,” “would,” “will,” “should,” “can,” “can have,” “likely,” the negatives thereof and other words and terms of similar meaning in connection with any discussion of the timing or nature of future operating or financial performance or other events. They appear in a number of places throughout this prospectus and include statements regarding our intentions, beliefs or current expectations concerning, among other things, our results of operations, financial condition, liquidity, prospects, growth, strategies and the industry in which we operate. All forward-looking statements are subject to risks and uncertainties that may cause actual results to differ materially from those that we expected, including:
| • | our ability to successfully implement our growth; |
| • | our ability to generate sufficient cash flow or raise capital on acceptable terms; |
| • | the loss of key members of our senior management team; |
| • | allegations that our products cause injury or illness or fail to comply with government regulations; |
| • | the loss of a significant customer; |
| • | the effectiveness of our marketing and trade spending programs; |
| • | our ability to introduce new products and improve existing products; |
| • | our limited manufacturing capacity; |
| • | the impact of government regulation, scrutiny, warning and public perception; |
| • | the effect of false marketing claims; |
| • | adverse weather conditions, natural disasters, pestilences and other natural conditions affecting our operations; |
| • | our ability to develop and maintain our brand; |
| • | volatility in the price of our common stock; and |
| • | other factors discussed under the headings “Risk Factors,” “Management’s Discussion and Analysis of Financial Condition and Results of Operations” and “Business.” |
While we believe that our assumptions are reasonable, we caution that it is very difficult to predict the impact of known factors, and it is impossible for us to anticipate all factors that could affect our actual results. Important factors that could cause actual results to differ materially from our expectations, or cautionary statements, are disclosed under “Risk Factors” and “Management’s Discussion and Analysis of Financial Condition and Results of Operations” in this prospectus. All forward-looking statements are expressly qualified in their entirety by these cautionary statements. You should evaluate all forward-looking statements made in this prospectus in the context of these risks and uncertainties.
We caution you that the important factors referenced above may not contain all of the factors that are important to you. In addition, we cannot assure you that we will realize the results or developments we expect or anticipate or, even if substantially realized, that they will result in the consequences we anticipate or affect us or our operations in the way we expect. The forward-looking statements included in this prospectus are made only as of the date hereof. We undertake no obligation to publicly update or revise any forward-looking statement as a result of new information, future events or otherwise, except as otherwise required by law. If we do update one or more forward-looking statements, no inference should be made that we will make additional updates with respect to those or other forward-looking statements. We qualify all of our forward-looking statements by these cautionary statements.
30
Table of Contents
We will not receive any proceeds from the sale of our common stock by the selling stockholders, including any sale of shares from the exercise by the underwriters of their option to purchase additional shares from the selling stockholders. We have agreed to pay certain expenses related to this offering.
31
Table of Contents
We have not declared any dividends on our common stock. We currently intend to retain all available funds and any future earnings to fund the development and growth of our business and to repay indebtedness, and therefore we do not anticipate paying any cash dividends in the foreseeable future. Additionally, our ability to pay dividends on our common stock will be limited by restrictions on the ability of our subsidiaries and us to pay dividends or make distributions under the terms of current and any future agreements governing our indebtedness. Any future determination to declare and pay cash dividends will be at the discretion of our Board of Directors in accordance with applicable law and will depend on, among other things, our financial condition, results of operations, cash requirements, contractual restrictions and such other factors as our Board of Directors deems relevant.
Accordingly, you may need to sell your shares of our common stock to realize a return on your investment, and you may not be able to sell your shares at or above the price you paid for them. See “Risk Factors—Risks Related to Ownership of our Common Stock—We have no current plans to pay dividends for the foreseeable future.”
32
Table of Contents
Our common stock began trading on Nasdaq under the symbol “FRPT” on November 7, 2014. Prior to that date, there was no public market for our common stock. The table sets forth, for the periods indicated below, the high and low intra-day sales prices per share of our common stock as reported on Nasdaq since November 7, 2014.
| High | Low | |||||||
| 2014 |
||||||||
| Fourth Quarter (from November 7, 2014) |
$ | 20.45 | $ | 13.30 | ||||
| 2015 |
||||||||
| First Quarter |
21.25 | 13.11 | ||||||
| Second Quarter (through April 24, 2015) |
25.92 | 19.48 | ||||||
As of April 23, 2015, we had 130 holders of record of our common stock. The actual number of stockholders is greater than this number of record holders, and includes stockholders who are beneficial owners but whose shares are held in street name by brokers and other nominees. The number of record holders also does not include stockholders whose shares may be held in trust by other entities.
33
Table of Contents
The following table sets forth our cash and cash equivalents, indebtedness and our capitalization as of December 31, 2014 on an actual basis. You should read this information together with our audited consolidated financial statements and related notes included elsewhere in this prospectus and the information set forth under the headings “Selected Historical Consolidated Financial and Other Data” and “Management’s Discussion and Analysis of Financial Condition and Results of Operations.”
| (Dollars in thousands) | As of December 31, 2014 |
|||
| Cash and cash equivalents |
$ | 36,259 | ||
|
|
|
|||
| Debt: |
||||
| Credit Facilities |
— | |||
|
|
|
|||
| Total debt |
— | |||
| Stockholders’ Equity: |
||||
| Common stock, $0.001 par value per share; 200,000,000 shares authorized, 33,468,342 shares issued and outstanding |
33 | |||
| Additional paid-in-capital |
288,218 | |||
| Accumulated deficit |
(184,858 | ) | ||
|
|
|
|||
| Total stockholders’ equity |
103,393 | |||
|
|
|
|||
| Total capitalization |
$ | 139,652 | ||
|
|
|
|||
34
Table of Contents
The shares of common stock to be sold by the selling stockholders pursuant to this prospectus are currently issued and outstanding. Accordingly, there will be no dilution to our existing stockholders as a result of this offering.
35
Table of Contents
SELECTED HISTORICAL CONSOLIDATED FINANCIAL AND OTHER DATA
The following table presents selected consolidated financial data as of, and for the periods ended on, the dates indicated. The consolidated balance sheet data as of December 31, 2014 and 2013 and the consolidated statements of operations data for each of the years in the three-year period ended December 31, 2014 have been derived from our audited consolidated financial statements included elsewhere in this prospectus. The consolidated balance sheet data as of December 31, 2012 have been derived from our audited consolidated financial statements not included in this prospectus. You should read the following financial information together with the information under “Capitalization” and “Management’s Discussion and Analysis of Financial Condition and Results of Operations” and our consolidated financial statements included elsewhere in this prospectus. Historical results are not necessarily indicative of results to be expected for any future period.
| Year ended December 31, | ||||||||||||
| 2014 | 2013 | 2012 | ||||||||||
| (Dollars in thousands, except per share data) | ||||||||||||
| Consolidated Statement of Operations Data |
||||||||||||
| Net sales |
$ | 86,764 | $ | 63,151 | $ | 43,519 | ||||||
| Cost of goods sold |
44,546 | 35,958 | 22,881 | |||||||||
|
|
|
|
|
|
|
|||||||
| Gross profit |
42,218 | 27,193 | 20,638 | |||||||||
| Selling, general and administrative expenses |
48,636 | 39,574 | 35,385 | |||||||||
|
|
|
|
|
|
|
|||||||
| Loss from operations |
(6,418 | ) | (12,381 | ) | (14,747 | ) | ||||||
| Other expenses |
(328 | ) | (538 | ) | (344 | ) | ||||||
| Fees on debt guarantee(1) |
(25,937 | ) | (5,245 | ) | (1,895 | ) | ||||||
| Interest expense |
(4,614 | ) | (3,492 | ) | (1,638 | ) | ||||||
|
|
|
|
|
|
|
|||||||
| Loss before income taxes |
(37,297 | ) | (21,656 | ) | (18,624 | ) | ||||||
| Income tax expense |
(42 | ) | (31 | ) | (32 | ) | ||||||
|
|
|
|
|
|
|
|||||||
| Net loss |
(37,339 | ) | (21,687 | ) | (18,656 | ) | ||||||
|
|
|
|
|
|
|
|||||||
| Preferred stock dividends on Series B and Series C(2) |
(11,286 | ) | (8,596 | ) | (7,954 | ) | ||||||
|
|
|
|
|
|
|
|||||||
| Additional loss to common stockholders upon conversion of Series C Preferred Stock into common stock(3) |
(82,655 | ) | — | — | ||||||||
|
|
|
|
|
|
|
|||||||
| Net loss attributable to common stockholders |
$ | (131,280 | ) | $ | (30,283 | ) | $ | (26,610 | ) | |||
|
|
|
|
|
|
|
|||||||
| Net loss per share: |
||||||||||||
| Basic |
$ | (9.63 | ) | $ | (2.91 | ) | $ | (2.56 | ) | |||
| Diluted |
$ | (9.63 | ) | $ | (2.91 | ) | $ | (2.56 | ) | |||
| Weighted average shares of common stock outstanding: |
||||||||||||
| Basic |
13,632,042 | 10,415,014 | 10,413,467 | |||||||||
| Diluted |
13,632,042 | 10,415,014 | 10,413,467 | |||||||||
36
Table of Contents
| Year ended December 31, | ||||||||||||
| 2014 | 2013 | 2012 | ||||||||||
| (Dollars in thousands) | ||||||||||||
| Other Operating and Financial Data |
||||||||||||
| Freshpet Fridge store locations at period end: |
||||||||||||
| Grocery |
6,130 | 5,367 | 4,565 | |||||||||
| Pet |
3,979 | 3,051 | 2,737 | |||||||||
| Mass |
3,035 | 2,247 | 1,181 | |||||||||
| Natural |
242 | 171 | 31 | |||||||||
|
|
|
|
|
|
|
|||||||
| Total |
13,386 | 10,836 | 8,514 | |||||||||
| EBITDA(4) |
$ | (321 | ) | $ | (6,974 | ) | $ | (10,363 | ) | |||
| Adjusted EBITDA(4) |
5,515 | (192 | ) | (6,096 | ) | |||||||
| Capital expenditures: |
||||||||||||
| Freshpet Kitchens and other plant capital expenditures |
2,226 | 12,987 | 13,298 | |||||||||
| Freshpet Fridge and other capital expenditures |
14,905 | 11,656 | 13,097 | |||||||||
| Total cash outflows of capital expenditures |
17,131 | 24,643 | 26,395 | |||||||||
| As of December 31, | ||||||||||||
| 2014 | 2013 | 2012 | ||||||||||
| Consolidated Balance Sheet Data |
||||||||||||
| Cash and cash equivalents |
$ | 36,259 | $ | 2,445 | $ | 1,633 | ||||||
| Working capital(5) |
41,862 | (3,435 | ) | (3,111 | ) | |||||||
| Total assets |
112,462 | 62,617 | 44,094 | |||||||||
| Total debt |
— | 76,112 | 44,057 | |||||||||
| Redeemable preferred stock: |
||||||||||||
| Series B |
— | 30,728 | 26,513 | |||||||||
| Series C |
— | 70,463 | 61,103 | |||||||||
| Total stockholders’ equity (deficit) |
$ | 103,393 | $ | (131,058 | ) | $ | (101,804 | ) | ||||
| (1) | Represents fees paid to certain stockholders for acting as guarantors for a portion of our prior payment obligations under the $62. 5 Million Revolver. Pursuant to a Fee and Reimbursement Agreement, the Company was obligated to pay each guarantor a contingent fee equal to 10% per annum of the amount each guarantor committed to guarantee. Portions of the proceeds from our initial public offering and related debt refinancing were used to repay the borrowings under the $62.5 Million Revolver, relieving us of our future fees on the debt guarantee. Concurrently, with the closing of our initial public offering, the outstanding guarantee fees were converted into shares of our Series C Preferred Stock, which were then converted into common stock. See our consolidated financial statements and the notes thereto for additional information. |
| (2) | Represents dividends associated with our redeemable Series B Preferred Stock and Series C Preferred Stock. Holders of Series B Preferred Stock were entitled to receive dividends payable in additional fully paid and non-assessable shares of Series B Preferred Stock at a rate per annum of 15% of the original issue price. Such dividends were to be fully cumulative from the first day of issuance and accrued without interest on both the initial Series B Preferred Stock obtained and shares obtained via dividend, on a quarterly basis. Holders of Series C Preferred Stock were entitled to dividends at a rate of 8% per annum of the Series C Preferred Stock original issue price. Once the Series C Preferred Stock was converted to Common Stock, the accrued dividends that had not been declared by the Board of Directors were relinquished. |
| (3) | Immediately prior to the conversion of Series C Preferred Stock to Common Stock, the Series C Preferred Stock were fair valued utilizing the Common Stock share price at the date of conversion. The difference between fair value and book value was recorded as net loss attributable to common stockholders. |
| (4) | EBITDA and Adjusted EBITDA are not financial measures prepared in accordance with GAAP. As used herein, EBITDA represents net loss plus depreciation and amortization, interest expense (including fees on debt guarantee, which we believe were a cost of our prior financing arrangement akin to interest expense), and income tax expense. As used herein, Adjusted EBITDA represents EBITDA plus loss on disposal of equipment, new plant startup expense and processing, share based compensation, warrant fair valuation, and launch expenses. |
37
Table of Contents
We present EBITDA and Adjusted EBITDA because we believe each of these measures provides an additional metric to evaluate our operations and, when considered with both our GAAP results and the reconciliation to net loss set forth below, provides a more complete understanding of our business than could be obtained absent this disclosure. We use EBITDA and Adjusted EBITDA, together with financial measures prepared in accordance with GAAP, such as sales, gross profit margins, and cash flow from operations, to assess our historical and prospective operating performance, to provide meaningful comparisons of operating performance across periods, to enhance our understanding of our operating performance and to compare our performance to that of our peers and competitors.
Adjusted EBITDA is further utilized for our covenant requirements under our credit agreement, and additionally as an important component of internal budgeting and setting management compensation.
EBITDA and Adjusted EBITDA are presented here because we believe they are useful to investors in assessing the operating performance of our business without the effect of non-cash items, and other items as detailed below.
EBITDA and Adjusted EBITDA should not be considered in isolation or as alternatives to net loss, income from operations or any other measure of financial performance calculated and prescribed in accordance with GAAP. Neither EBITDA nor Adjusted EBITDA should be considered a measure of discretionary cash available to us to invest in the growth of our business. Our Adjusted EBITDA may not be comparable to similarly titled measures in other organizations because other organizations may not calculate Adjusted EBITDA in the same manner as we do. Our presentation of Adjusted EBITDA should not be construed as an inference that our future results will be unaffected by the expenses that are excluded from that term or by unusual or non-recurring items. We recognize that both EBITDA and Adjusted EBITDA have limitations as analytical financial measures. For example, neither EBITDA nor Adjusted EBITDA reflects:
| • | our capital expenditures or future requirements for capital expenditures; |
| • | the interest expense (including fees on debt guarantee, which we believe were a cost of our prior financing arrangement akin to interest expense), or the cash requirements necessary to service interest expense or principal payments, associated with indebtedness; |
| • | depreciation and amortization, which are non-cash charges, although the assets being depreciated and amortized will likely have to be replaced in the future, nor does EBITDA or Adjusted EBITDA reflect any cash requirements for such replacements; and |
| • | changes in cash requirements for our working capital needs. |
Additionally, Adjusted EBITDA excludes (i) non-cash stock based compensation expense, which is and will remain a key element of our overall long term incentive compensation package, and (ii) certain costs essential to our sales growth and strategy, including an allowance for marketing expenses for each new store added to our network and uncapitalizable freight costs associated with Freshpet Fridge replacements. Adjusted EBITDA also excludes certain cash charges resulting from matters we consider not to be indicative of our ongoing operations. Other companies in our industry may calculate EBITDA and Adjusted EBITDA differently than we do, limiting their usefulness as comparative measures.
38
Table of Contents
The following table provides a reconciliation of EBITDA and Adjusted EBITDA to net loss which is the most directly comparable financial measure presented in accordance with GAAP:
| Year ended December 31, | ||||||||||||
| 2014 | 2013 | 2012 | ||||||||||
| (Dollars in thousands) | ||||||||||||
| Net loss |
$ | (37,339 | ) | $ | (21,687 | ) | $ | (18,656 | ) | |||
| Fees on debt guarantee(a) |
25,937 | 5,245 | 1,895 | |||||||||
| Depreciation & amortization |
6,425 | 5,945 | 4,728 | |||||||||
| Interest expense |
4,614 | 3,492 | 1,638 | |||||||||
| Income tax expense |
42 | 31 | 32 | |||||||||
|
|
|
|
|
|
|
|||||||
| EBITDA |
(321 | ) | (6,974 | ) | (10,363 | ) | ||||||
|
|
|
|
|
|
|
|||||||
| Loss on disposal of equipment |
309 | 503 | 333 | |||||||||
| Launch expense(b) |
3,513 | 3,305 | 2,815 | |||||||||
| New plant start up expenses and processing(c) |
113 | 1,996 | — | |||||||||
| Share based compensation(d) |
1,564 | 978 | 1,119 | |||||||||
| Warrant fair valuation(e) |
337 | — | — | |||||||||
|
|
|
|
|
|
|
|||||||
| Adjusted EBITDA |
$ | 5,515 | $ | (192 | ) | $ | (6,096 | ) | ||||
|
|
|
|
|
|
|
|||||||
| (a) | Represents fees paid to certain stockholders for acting as guarantors for a portion of our prior payment obligations under the $62.5 Million Revolver. Pursuant to a Fee and Reimbursement Agreement, the Company was obligated to pay each guarantor a contingent fee equal to 10% per annum of the amount each guarantor committed to guarantee. Portions of the proceeds from our initial public offering and related debt refinancing were used to repay the borrowings under the $62.5 Million Revolver, relieving us of our future fees on the debt guarantee. Concurrently, with the closing of our initial public offering, the outstanding guarantee fees were converted into shares of our Series C Preferred Stock, which were then converted into common stock. See our consolidated financial statements and the notes thereto for additional information. |
| (b) | Represents new store marketing allowance of $1,000 for each store added to our distribution network as well as the uncapitalized freight costs associated with Freshpet Fridge replacements. The expense enhances the overall marketing spend to support our growing distribution network. |
| (c) | Represents additional operating costs incurred in 2013 and in the first quarter of 2014 in connection with the opening of our new primary manufacturing facility in Bethlehem, Pennsylvania, which was completed in the fourth quarter of 2013. |
| (d) | Represents non-cash stock based compensation expense. |
| (e) | Represents the change of fair value for the outstanding warrants. |
| (5) | Represents our currents assets minus current liabilities. |
39
Table of Contents
MANAGEMENT’S DISCUSSION AND ANALYSIS OF FINANCIAL CONDITION
AND RESULTS OF OPERATIONS
The following discussion summarizes the significant factors affecting our consolidated operating results, financial condition, liquidity and cash flows as of and for the periods presented below. The following discussion and analysis should be read in conjunction with the “Selected Consolidated Historical Financial and Other Data” and our audited consolidated financial statements and the related notes thereto, included elsewhere in this prospectus.
In addition to historical information, this discussion and analysis contains forward-looking statements based on current expectations that involve risks, uncertainties and assumptions, such as our plans, objectives, expectations, and intentions set forth under the sections entitled “Risk Factors” and “Forward-Looking Statements.” Our actual results and the timing of events may differ materially from those discussed in these forward-looking statements as a result of various factors, including those set forth in the section entitled “Risk Factors” and elsewhere in this prospectus.
Overview
We started Freshpet with a single-minded mission to bring the power of real, fresh food to our dogs and cats. We were inspired by the rapidly growing view among pet owners that their dogs and cats are a part of their family, leading them to demand healthier pet food choices. Over the last nine years, we have created a comprehensive business model to deliver wholesome pet food that pet parents can trust, and in the process we believe we have become one of the fastest growing pet food companies in North America. Our business model is difficult for others to replicate and we see significant opportunity for future growth by leveraging the unique elements of our business, including our brand, our product know-how, our Freshpet Kitchens, our refrigerated distribution, our Freshpet Fridge and our culture.
Components of our Operating Results
Net Sales
Our net sales are derived from the sale of pet food to our customers, who purchase either directly from us or through third party distributors. Our products are sold to consumers through a fast-growing network of company-owned branded refrigerators, known as Freshpet Fridges, located in our customers’ stores. We continue to roll out Freshpet Fridges across leading retailers across North America and have installed Freshpet Fridges in over 13,300 retail stores as of December 31, 2014. All of our products are sold under the Freshpet brand name, with ingredients, packaging and labeling customized by class of retail. Sales are recorded net of discounts, slotting, returns and promotional allowances.
Our net sales growth is driven by the following key factors:
| • | Increasing sales velocity from the average Freshpet Fridge due to increasing awareness, trial and adoption of Freshpet products. Our investments in marketing and advertising help to drive awareness and trial at each point of sale. |
| • | Continued innovation and new product introductions. New products introduced since 2011 represented 37% of our net sales in 2014. From time to time, we review our product line and may remove products that are not meeting sales or profitability goals. |
| • | Increased penetration of Freshpet Fridge locations in major classes of retail, including grocery, mass, club, pet specialty and natural. The impact of new Freshpet Fridge installations on our net sales varies by retail class and depends on numerous factors including store traffic, refrigerator size, placement within the store, and proximity to other stores that carry our products. |
| • | Consumer trends including growing pet ownership, pet humanization and a focus on health and wellness. |
40
Table of Contents
We believe that as a result of the above key factors, we will continue to penetrate the pet food marketplace and increase our share of the pet food category.
Gross Profit
Our gross profit is net of costs of goods sold, which include the costs of product manufacturing, product ingredients, packaging materials, spoils, and inbound freight. The construction of our scalable manufacturing facility in Bethlehem, Pennsylvania was completed in November 2013, essentially replacing our Quakertown, Pennsylvania facility, and has significantly improved our production efficiency. Growing capacity utilization of our new facility will allow us to leverage fixed costs and thereby expand our gross profit margins.
Our gross profit margins are impacted by the cost of ingredients and packaging materials. We expect to mitigate any adverse movement in input costs through a combination of cost management and price increases. We implemented modest price increases in 2011 and 2012 that offset increased ingredient costs and did not perceive a decline in demand.
Selling, General and Administrative Expenses
Our selling, general and administrative expenses consist of the following:
Outbound freight. Outbound freight from our Freshpet Kitchens is managed by a national third- party refrigerated and frozen human food manufacturer that delivers our product to grocery retailers in the United States. Additionally, we sell through third-party distributors for the mass, club, pet specialty and natural classes in the United States and Canada. As our sales volume increases, we expect our outbound freight costs to decrease as a percentage of net sales as we achieve benefits of scale.
Marketing & advertising. Our marketing and advertising expenses primarily consist of national television media, digital marketing, social media, and grass roots marketing to drive brand awareness. These expenses may vary from quarter to quarter depending on the timing of our marketing and advertising campaigns. We expect our marketing & advertising costs to decrease as a percentage of net sales as we leverage national advertising spend across a growing network of Freshpet Fridges.
Freshpet Fridge operating costs. Freshpet Fridge operating costs consist of repair costs, installation fees to third-party service providers, and depreciation. The purchase and installation costs for new Freshpet Fridges are capitalized and depreciated over the estimated useful life. All new refrigerators are covered by a manufacturer warranty for one to three years. We subsequently incur maintenance and freight costs for repairs and refurbishments handled by third-party service providers.
Research & development. Research and development costs consist of expenses to develop and test new products.
Brokerage. We utilize third-party brokers to assist with monitoring our Freshpet Fridges at the point-of-sale as well as representing us at headquarters for various customers. These brokers visit our retail customers’ store locations and ensure items are stocked, maintain Freshpet Fridge appearance, and replace missing price tags.
Other general & administrative costs. Other general and administrative costs include non-plant personnel salaries and benefits, which include stock compensation, as well as corporate general & administrative costs. We expect to incur incremental annual costs of approximately $2.0 million to $2.3 million per year related to operating as a public company.
Selling, general and administrative costs as a percentage of net sales have continued to decrease from 81.3% in 2012, 62.7% in 2013, and 56.1% in 2014. We expect our selling, general, and administrative expenses to decrease as a percentage of net sales as we continue to expand our distribution footprint and grow our net sales.
41
Table of Contents
Fees on Debt Guarantee
In connection with the $62.5 Million Revolver, we entered into a Fee and Reimbursement Agreement with certain stockholders. That agreement stipulated that we pay each guarantor a contingent fee of 10% per annum of the amount each guarantor committed to guarantee. The fees on debt guarantee recognized in each period were a function of the outstanding note payable and the fair value of the underlying guarantee. We used a portion of the proceeds from our initial public offering and the related debt refinancing to repay the borrowings under the $62.5 Million Revolver, relieving us of future fees on the debt guarantee. The fees on debt guarantee liability were settled in the form of shares of our Series C Preferred Stock at a price of $5.25 per share, which were then converted into shares of our common stock at a 1-to-0.7396 ratio.
Income Taxes
We had federal net operating loss (“NOL”) carry forwards of approximately $163.0 million as of December 31, 2014, which expire between 2025 and 2034. We may be subject to certain limitations in our annual utilization of net operating loss carry forwards to off-set future taxable income pursuant to Section 382 of the Internal Revenue Code, which could result in NOLs expiring unused. At December 31, 2014, we had approximately $124.5 million of State NOLs, which expire between 2015 and 2034. At December 31, 2014, we had a full valuation allowance against our deferred tax assets as the realization of such assets was not considered more likely than not.
Results of Operations
| Twelve months ended December 31, | ||||||||||||||||||||||||
| 2014 | 2013 | 2012 | 2014 | 2013 | 2012 | |||||||||||||||||||
| Amount | Amount | Amount | Percent of Net Sales |
Percent of Net Sales |
Percent of Net Sales |
|||||||||||||||||||
| Consolidated Statements of Operations Data |
||||||||||||||||||||||||
| Net sales |
$ | 86,764 | $ | 63,151 | $ | 43,519 | 100 | % | 100 | % | 100 | % | ||||||||||||
| Cost of goods sold |
44,546 | 35,958 | 22,881 | 51 | 57 | 53 | ||||||||||||||||||
|
|
|
|
|
|
|
|
|
|
|
|
|
|||||||||||||
| Gross profit |
42,218 | 27,193 | 20,638 | 49 | 43 | 47 | ||||||||||||||||||
| Selling, general and administrative expenses |
48,636 | 39,574 | 35,385 | 56 | 63 | 81 | ||||||||||||||||||
|
|
|
|
|
|
|
|
|
|
|
|
|
|||||||||||||
| Loss from operations |
(6,418 | ) | (12,381 | ) | (14,747 | ) | (7 | ) | (20 | ) | (34 | ) | ||||||||||||
| Other expenses: |
||||||||||||||||||||||||
| Other expenses |
(328 | ) | (538 | ) | (344 | ) | (0 | ) | (1 | ) | (1 | ) | ||||||||||||
| Fees on debt guarantee |
(25,937 | ) | (5,245 | ) | (1,895 | ) | (30 | ) | (8 | ) | (4 | ) | ||||||||||||
| Interest expense |
(4,614 | ) | (3,492 | ) | (1,638 | ) | (5 | ) | (6 | ) | (4 | ) | ||||||||||||
|
|
|
|
|
|
|
|
|
|
|
|
|
|||||||||||||
| Loss before income taxes |
(37,297 | ) | (21,656 | ) | (18,624 | ) | (43 | ) | (34 | ) | (43 | ) | ||||||||||||
| Income tax expense |
42 | 31 | 32 | (0 | ) | (0 | ) | (0 | ) | |||||||||||||||
|
|
|
|
|
|
|
|
|
|
|
|
|
|||||||||||||
| Net loss |
$ | (37,339 | ) | $ | (21,687 | ) | $ | (18,656 | ) | (43 | )% | (34 | )% | (43 | )% | |||||||||
|
|
|
|
|
|
|
|
|
|
|
|
|
|||||||||||||
42
Table of Contents
Twelve Months Ended December 31, 2014 Compared to Twelve Months Ended December 31, 2013
Net Sales
The following table sets forth net sales by class of retail:
| Twelve months ended December 31, | ||||||||||||||||
| 2014 | 2013 | |||||||||||||||
| Amount | Percentage of Net Sales |
Amount | Percentage of Net Sales |
|||||||||||||
| Grocery and Mass (1) |
$ | 65,212,966 | 75 | % | $ | 49,731,873 | 79 | % | ||||||||
| Pet Specialty, Natural and Other (2) |
21,551,146 | 25 | 13,418,903 | 21 | ||||||||||||
|
|
|
|
|
|
|
|
|
|||||||||
| Net Sales |
$ | 86,764,112 | 100 | % | $ | 63,150,776 | 100 | % | ||||||||
|
|
|
|
|
|
|
|
|
|||||||||
| (1) | Includes club retail class |
| (2) | Other sales represent less than 1% of net sales |
Net sales increased $23.6 million, or 37%, to $86.8 million for the twelve months ended December 31, 2014 as compared to the same period in the prior year. The number of stores carrying Freshpet products grew from 10,836 as of December 31, 2013 to 13,386 as of December 31, 2014, an increase of 24%. We also experienced velocity gains in Grocery and Mass as well as Pet Specialty, Natural and Other during 2014.
Gross Profit
Gross profit increased $15.0 million, or 55%, to $42.2 million for the twelve months ended December 31, 2014 as compared to the same period in the prior year. The increase was primarily driven by higher net sales, lower manufacturing costs per pound due to continued efficiency gains at our new Freshpet Kitchens in Bethlehem, Pennsylvania, which was completed in the fourth quarter of 2013, as well as the one-time cost of new plant startup expenses and processing of $2.0 million in 2013. The increase was partially offset by higher depreciation (net of 2013 write-off for disposal of non-usable equipment) of approximately $0.3 million, related to the new manufacturing facility. As a result, gross profit margins increased to 49% for the twelve months ended December 31, 2014 compared to 43% in the same period of the prior year.
Selling, General and Administrative Expenses
Selling, general and administrative expenses increased $9.1 million or 23%, to $48.6 million for the twelve months ended December 31, 2014 as compared to the same period in the prior year. Key components of the dollar increase include additional outbound freight costs of $2.6 million due to increased volume and sales, higher advertising expenses of $2.2 million, higher share-based compensation expense of $0.6 million, warrant expense related to the fair valuation of the outstanding warrants of $0.3 million, and incremental operating expenses of $3.4 million. The increased operating expenses were primarily due to new hires, increased employee benefit costs, higher brokerage with growing sales, and increased refrigerator repairs due to our growing Freshpet Fridge network. As a percentage of net sales, selling, general and administrative expenses decreased from 63% for 2013 to 56% for 2014.
Loss from Operations
Loss from operations decreased $6.0 million, or 48%, to $6.4 million for the twelve months ended December 31, 2014 as compared to the same period in the prior year as a result of the factors discussed above.
Fees on Debt Guarantee
Fees on debt guarantee expense increased $20.7 million to $25.9 million for the twelve months ended December 31, 2014 as compared to the same period in the prior year due to the change in the fair value of the fees on debt guarantee. The increase is attributable to adjusting the fair value of the fees on debt guarantee
43
Table of Contents
liability to the fair value of as of the settlement date of our initial public offering. Upon closing our initial public offering, we converted outstanding guarantee fees into 2,477,756 shares of our Series C Preferred Stock, which were subsequently converted into 1,832,531 shares of our common stock at a fair value of $18.05, which was the share price upon the close of our initial public offering.
Interest Expense
Interest expense increased $1.1 million, or 32%, to $4.6 million for the twelve months ended December 31, 2014 as compared to the same period in the prior year primarily due to $0.7 million of write-offs of loan origination fees and note discounts associated with the pay down of debt upon our initial public offering. In addition, we incurred an increase in borrowings in 2014 for both working capital and capital expenditures for new refrigerators to support retail expansion and plant improvements.
Net Loss
Net loss increased $15.7 million, or 72%, to $37.3 million for the twelve months ended December 31, 2014 as compared to the same period in the prior year. Net loss was 43% of net sales for the twelve months ended December 31, 2014 as compared to a net loss of 34% of net sales for the same period in the prior year.
Twelve Months Ended December 31, 2013 Compared to Twelve Months Ended December 31, 2012
Net Sales
The following table sets forth net sales by class of retail:
| Twelve months ended December 31, | ||||||||||||||||
| 2013 | 2012 | |||||||||||||||
| Amount | Percentage of Net Sales |
Amount | Percentage of Net Sales |
|||||||||||||
| Grocery and Mass(1) |
$ | 49,731,873 | 79 | % | $ | 33,985,199 | 78 | % | ||||||||
| Pet Specialty, Natural and Other(2) |
13,418,903 | 21 | 9,534,262 | 22 | ||||||||||||
|
|
|
|
|
|
|
|
|
|||||||||
| Net Sales |
$ | 63,150,776 | 100 | % | $ | 43,519,461 | 100 | % | ||||||||
|
|
|
|
|
|
|
|
|
|||||||||
| (1) | Includes club retail class |
| (2) | Other sales represent less than 1% of net sales |
Net sales increased $19.7 million, or 45%, to $63.2 million for 2013 as compared to the prior year. The number of stores carrying Freshpet products grew from 8,514 stores as of December 31, 2012 to 10,836 as of December 31, 2013, an increase of 27%. We also experienced velocity gains in Grocery and Mass as well as Pet Specialty, Natural and Other during 2013.
Gross Profit
Gross profit increased by $6.5 million, or 32%, to $27.2 million for 2013 as compared to the prior year. The increase was primarily driven by higher net sales, partially offset by higher cost per pound of manufacturing due to duplicate expenditures of $0.9 million related to duplicate plant personnel and plant overhead during the transition to our new Freshpet Kitchens facility in Bethlehem, Pennsylvania in the last quarter of 2013, as well as incremental outsourced processing costs of $1.1 million to guarantee quality during the transition to the new Freshpet Kitchens. Additionally, during 2013, we incurred a net loss for disposal of non-usable equipment in the amount of $0.8 million, which was charged to costs of goods sold. We expect our gross profit margins to expand as we realize operating leverage with increasing economies of scale of our Freshpet Kitchens.
44
Table of Contents
Selling, General and Administrative Expenses
Selling, general and administrative expenses increased $4.2 million, or 12%, to $39.6 million for 2013 as compared to the prior year. As a percentage of net sales, selling, general and administrative expenses decreased from 81% for 2012 to 63% for 2013. Key components of the increase in expenses include additional outbound freight costs of $1.7 million due to increased volume sold, higher marketing expenses of $1.4 million and incremental operating expenses of $1.1 million. The increased operating expenses were primarily due to new hires, increased employee benefit costs, higher brokerage with growing sales, and increased refrigerator repairs due to our growing Freshpet Fridge network.
Loss from Operations
Loss from operations decreased $2.4 million, or 16%, to $12.4 million for 2013 as compared to the prior year as a result of the factors discussed above.
Fees on Debt Guarantee
Fees on debt guarantee expense increased $3.3 million, or 177%, to $5.2 million in 2013 as compared to the prior year due to the increase in the amount of guaranteed debt from $40.0 million to $60.0 million in May 2013, a full year of guarantee fees in 2013, plus the change in the fair value of the fees on debt guarantee.
Interest Expense
Interest Expense increased $1.9 million, or 113%, to $3.5 million for 2013 as compared to the prior year due to increased borrowings for both working capital and capital expenditures for new refrigerators to support retail expansion and plant improvements.
Net Loss
Net loss increased $3.0 million, or 16%, to $21.7 million for 2013 as compared to the prior year.
Selected Quarterly Financial Data
The following quarterly consolidated statement of operations data for the 12 fiscal quarters ended December 31, 2014 has been prepared on a basis consistent with our audited annual consolidated financial statements and includes, in the opinion of management, all normal recurring adjustments necessary for a fair statement of the financial information contained herein. The following quarterly data should be read together with our consolidated financial statements included elsewhere in this report.
| 2014 | ||||||||||||||||
| Q1 | Q2 | Q3 | Q4 | |||||||||||||
| (Dollars in thousands) | ||||||||||||||||
| Freshpet Fridge store locations |
11,596 | 12,593 | 12,970 | 13,386 | ||||||||||||
| Net sales |
$ | 19,350 | $ | 20,386 | $ | 22,520 | $ | 24,508 | ||||||||
| Gross profit |
9,293 | 10,073 | 10,874 | 11,978 | ||||||||||||
| Gross profit margins |
48.0 | % | 49.4 | % | 48.3 | % | 48.9 | % | ||||||||
| Net loss |
$ | (5,142 | ) | $ | (6,267 | ) | $ | (9,483 | ) | $ | (16,447 | ) | ||||
| 2013 | ||||||||||||||||
| Q1 | Q2 | Q3 | Q4 | |||||||||||||
| (Dollars in thousands) | ||||||||||||||||
| Freshpet Fridge store locations |
9,001 | 9,801 | 10,269 | 10,836 | ||||||||||||
| Net sales |
$ | 13,885 | $ | 14,848 | $ | 16,698 | $ | 17,720 | ||||||||
| Gross profit |
6,598 | 6,900 | 7,277 | 6,418 | ||||||||||||
| Gross profit margins |
47.5 | % | 46.5 | % | 43.6 | % | 36.2 | % | ||||||||
| Net loss |
$ | (4,719 | ) | $ | (5,254 | ) | $ | (6,495 | ) | $ | (5,219 | ) | ||||
45
Table of Contents
| 2012 | ||||||||||||||||
| Q1 | Q2 | Q3 | Q4 | |||||||||||||
| (Dollars in thousands) | ||||||||||||||||
| Freshpet Fridge store locations |
7,190 | 7,891 | 8,155 | 8,514 | ||||||||||||
| Net sales |
$ | 9,383 | $ | 10,537 | $ | 11,227 | $ | 12,372 | ||||||||
| Gross profit |
4,300 | 5,005 | 5,323 | 6,010 | ||||||||||||
| Gross profit margins |
45.8 | % | 47.5 | % | 47.4 | % | 48.6 | % | ||||||||
| Net loss |
$ | (4,388 | ) | $ | (4,179 | ) | $ | (6,018 | ) | $ | (4,071 | ) | ||||
Liquidity and Capital Resources
Developing our business will require significant capital in the future. To meet our capital needs, we expect to rely on our current and future cash flow from operations, and our current available borrowing capacity. Our ability to obtain additional funding will be subject to various factors, including general market conditions, our operating performance, the market’s perception of our growth potential, lender sentiment and our ability to incur additional debt in compliance with other contractual restrictions, such as financial covenants under our debt documents.
Additionally, our ability to make payments on, and to refinance, our indebtedness and to fund planned expenditures for our growth plans will depend on our ability to generate cash in the future. If our business does not achieve the levels of profitability or generate the amount of cash that we anticipate or if we expand faster than anticipated, we may need to seek additional debt or equity financing to operate and expand our business. Future third-party financing may not be available on favorable terms or at all.
We believe that cash and cash equivalents, expected cash flow from operations and planned borrowing capacity are adequate to fund debt service requirements, operating lease obligations, capital expenditures and working capital obligations for the foreseeable future. However, our ability to continue to meet these requirements and obligations will depend on, among other things, our ability to achieve anticipated levels of revenue and cash flow from operations and our ability to manage costs and working capital successfully. Additionally, our cash flow generation ability is subject to general economic, financial, competitive, legislative and regulatory factors and other factors that are beyond our control. We cannot assure you that our business will generate cash flow from operations in an amount sufficient to enable us to fund our liquidity needs. Further, our capital requirements may vary materially from those currently planned if, for example, our revenues do not reach expected levels or we have to incur unforeseen capital expenditures and make investments to maintain our competitive position. If this is the case, we may seek alternative financing, such as selling additional debt or equity securities, and we cannot assure you that we will be able to do so on favorable terms, if at all. Moreover, if we issue new debt securities, the debt holders would have rights senior to common stockholders to make claims on our assets, and the terms of any debt could restrict our operations, including our ability to pay dividends on our common stock. If we issue additional equity or convertible debt securities, existing stockholders may experience dilution, and such new securities could have rights senior to those of our common stock. These factors may make the timing, amount, terms and conditions of additional financings unattractive. Our inability to raise capital could impede our growth or otherwise require us to forego growth opportunities and could materially adversely affect our business, financial condition and results of operations.
| As of December 31, | ||||||||||||
| 2014 | 2013 | 2012 | ||||||||||
| (Dollars in thousands) | ||||||||||||
| Cash & Equivalents |
$ | 36,259 | $ | 2,445 | $ | 1,633 | ||||||
| Accounts Receivable, net |
5,360 | 3,498 | 2,778 | |||||||||
| Inventory |
7,314 | 5,512 | 3,824 | |||||||||
| Prepaid Expense and Other |
1,291 | 174 | 144 | |||||||||
| Accounts Payable |
(5,424 | ) | (6,287 | ) | (9,206 | ) | ||||||
| Accrued Expenses |
(2,938 | ) | (1,907 | ) | (2,284 | ) | ||||||
|
|
|
|
|
|
|
|||||||
| Working Capital |
$ | 41,862 | $ | (3,435 | ) | $ | (3,111 | ) | ||||
|
|
|
|
|
|
|
|||||||
46
Table of Contents
Working Capital consists of current assets net of current liabilities.
The increase in working capital for December 31, 2014 compared to December 31, 2013 is primarily due to increased cash, increased accounts receivable due to higher net sales, increased inventory due to a higher net sales run-rate, offset by a slight increase in net current liabilities. The increase in cash is due to the net proceeds from our initial public offering.
Our primary cash needs are for ingredients, purchases and operating expenses, marketing expenses and capital expenditures to procure Freshpet Fridges and expand and improve our manufacturing plant to support our net sales growth. We also expect to invest approximately $23 to $25 million in capital expenditures to expand our plant capacity and increase distribution. We expect to be able to use our current liquidity position, and future operating cash flows to fund the plant expansion.
We normally carry three to four weeks of finished goods inventory. The average duration of our accounts receivable is approximately three weeks.
To date, our funding consisted primarily of our initial public offering proceeds of $164.4 million, net of underwriting discount and offering expenses, and net proceeds of $6.6 million from private placements of capital stock. We utilized the net proceeds from our initial public offering to pay down approximately $126.2 million of outstanding indebtedness, Series B Preferred Stock, and accrued interest. Currently, we have no debt outstanding under our credit agreements.
The following table sets forth, for the periods indicated, our beginning balance of cash, net cash flows provided by (used in) operating, investing and financing activities and our ending balance of cash.
| As of December 31, | ||||||||||||
| 2014 | 2013 | 2012 | ||||||||||
| (Dollars in thousands) | ||||||||||||
| Cash at the beginning of period |
$ | 2,445 | $ | 1,633 | $ | 2,868 | ||||||
| Net cash used in operating activities |
(8,026 | ) | (11,241 | ) | (8,716 | ) | ||||||
| Net cash used in investing activities |
(16,877 | ) | (24,643 | ) | (26,306 | ) | ||||||
| Net cash flow from financing activities |
58,718 | 36,696 | 33,763 | |||||||||
|
|
|
|
|
|
|
|||||||
| Cash at end of period |
$ | 36,260 | $ | 2,445 | $ | 1,633 | ||||||
|
|
|
|
|
|
|
|||||||
Net Cash used in Operating Activities
Cash used in operating activities consists primarily of net income adjusted for certain non-cash items (provision for loss on receivables, loss on disposal of equipment, fees on debt guarantee, depreciation and amortization, share-based compensation, revaluation of outstanding warrants and issuance of common stock options for service).
For 2014, net cash used in operating activities was $8.0 million, which consisted of a net loss of $37.3 million, partially offset by $35.4 million of non-cash items, and $6.1 million increase related to changes in operating assets and liabilities. The change in operating assets and liabilities is primarily due to the increase in accounts receivable of $1.9 million, an increase in inventories of $1.7 million, an increase in prepaid expenses and other current assets of $1.1 million, and a decrease of accounts payable of $1.6 million. The increase in accounts receivable and inventory is primarily due to a 37.4% growth in net sales. The change in accounts payable and prepaid and other current assets is due to timing of payments.
For 2013, net cash used in operating activities was $11.2 million and consisted of net loss of $21.7 million, partially offset by $13.3 million of non-cash items and $2.8 million of increases due to changes in operating assets and liabilities. The changes in operating assets and liabilities consisted primarily of an increase in accounts
47
Table of Contents
receivable of $0.9 million, an increase in inventories of $1.8 million, an increase in prepaid and other assets of $0.2 million, partially offset by an increase in payables and accrued expenses of $0.1 million. The increases in accounts receivable and inventory are primarily due to 45% growth of net sales compared to 2012.
For 2012, net cash used in operating activities was $8.7 million and consisted of net loss of $18.7 million, partially offset by net non-cash expenses of $8.2 million and a $1.8 million increase related to changes in operating assets and liabilities. Changes in operating assets and liabilities consisted primarily of increases in accounts receivable of $1.6 million, an increase in inventories of $0.8 million, an increase in prepaid and other assets of $0.1 million, partially offset by an increase in payables and accrued expenses of $4.2 million. The increases in accounts receivable and inventory are primarily due to 71% growth of net sales compared to 2011. The increase in payables was due to timing of payments for capital and other operating expenses. The increase in accrued expenses was primarily due to increased incentive compensation.
Net Cash Used in Investing Activities
Net cash used in investing activities for the twelve months ended December 31, 2014, 2013, and 2012 relates primarily to capital expenditures. Net cash used in investing activities was $16.9 million, $24.6 million, and $26.3 million for the respective periods. The capital spending during 2014 mainly related to Freshpet Fridges and other equipment, which was $14.9 million in 2014, $11.7 million in 2013, and $13.1 million in 2012. In 2014, there were also capital plant costs of $2.2 million. In 2013 and 2012, the capitalized plant costs were $13.0 million and $13.3 million, respectively. The capitalized plant costs in 2013 and 2012 related mainly to the development of our Freshpet Kitchens in Bethlehem, Pennsylvania, which was completed in 2013.
Net Cash from Financing Activities
Net cash from financing activities was $58.7 million in 2014, $36.7 million in 2013, and $33.8 million in 2012. The net cash from financing activities in 2014 related to proceeds from the issuance of common stock, net of issuance costs, in the amount of $164.4 million, and proceeds from the issuance of Series C Preferred Stock in the amount of $6.6 million. The funds from financing activities during 2014 were offset by the $112.3 million repayment of debt and redemption of Series B Preferred Stock, net of the increase in borrowing, which was offset by financing fees paid in connection with the borrowing.
The net cash from financing activities for 2013 and 2012 were primarily due to an increase in bank debt borrowings of $32.0 million during 2013 and $33.0 million during 2012, as well as proceeds from the issuance of our preferred stock of $5.0 million during 2013 and $1.1 million during 2012.
Indebtedness and Debt Refinancing
Prior to the initial public offering and related debt refinancing, our debt outstanding consisted of a $1.5 million stockholder note (the “Stockholder Note”), a $27,000,000 revolving note payable (the “$27.0 Million Revolver”), a $62.5 million revolving note payable, and $2,000,000 in shareholder convertible notes (the “Convertible Notes”).
The Stockholder Note accrued interest compounded annually at a rate of 10% and was initially due on December 23, 2020. In connection with the issuance of the Stockholder Note in February 2010, for every $16.39 that was borrowed with the notes, one share of common stock was issued to the lender. As a result, 91,528 shares of common stock were issued and the fair value of the stock at issuance, $6.56 a share, was recorded as a discount to the debt.
The $27.0 Million Revolver initially matured on October 31, 2015, and the $62.5 Million Revolver initially matured on May 1, 2016.
On October 23, 2014, we issued $2.0 million in aggregate principal amount of convertible notes to certain of its stockholders, which were paid down upon the consummation of our initial public offering. The Convertible
48
Table of Contents
Notes were issued at 98% of par and were convertible into Series C Preferred Stock at a price of $5.25 per share, at the option of the holder, at any time after December 31, 2014. We did not accrue interest as the Convertible Notes started to accrue interest on December 7, 2014, which was after the November 13, 2014 repayment.
On November 13, 2014, in connection with the completion of our initial public offering, we entered into senior secured credit facilities (the “Debt Refinancing”) comprising a 5-year $18.0 million term facility (the “Term Facility”), a 3-year $10.0 million revolving facility (the “Revolving Facility”) and a $12.0 million additional term loan commitment earmarked primarily for capital expenditures (the “Capex Commitments” and together with the Term Facility and Revolving Facility, the “Credit Facilities” and such loan agreement, the “Loan Agreement”). Any drawn Capex Commitments (the “Capex Loans”) will mature on the fifth anniversary of the execution of the Loan Agreement. Any undrawn Capex Commitments will expire on the third anniversary of the execution of the agreement. Under the terms of the Loan Agreement, the commitments for the Revolving Facility may be increased up to $20.0 million subject to certain conditions.
We used a portion of the net proceeds from the Debt Refinancing and our initial public offering to repay the $1.5 Million Stockholder Note, the $27.0 Million Revolver, the $62.5 Million Revolver, Convertible Notes, and $1.3 million of accrued interest. Borrowings under the Credit Facilities will bear interest at variable rates depending on our election, either at a base rate or at LIBOR, in each case, plus an applicable margin. The initial applicable margin will be 3.75% for base rate loans and 4.75% for LIBOR loans. Thereafter, subject to our leverage ratio, the applicable base rate margin will vary from 2.75% and 3.75% and the applicable LIBOR rate margin will vary from 3.75% and 4.75%. In addition, we will also be required to pay customary fees and expenses for the Credit Facilities.
Further, on December 23, 2014, we paid down and extinguished the Term Facility and increased the Capex Commitments from $12 million to $30 million. The Credit Facilities are secured by substantially all of our assets. The Loan Agreement provides for the maintenance of various covenants, including financial covenants, and includes events of default that are customary for facilities of this type. As of December 31, 2014, we were in compliance with all the covenants in its credit agreement.
In connection with a loan transaction with City National Bank, and in consideration thereof, we issued to City National Bank a warrant to purchase up to an aggregate of 61,117 shares of our common stock at a purchase price of $6.28 per share. In the event we issue additional equity instruments at a purchase price or exercise price lower than the warrant exercise price, the exercise price will be adjusted. The warrant was recorded as a liability with adjustments to fair value recorded in the statement of operations. This warrant is exercised upon surrender to us, on a net basis, such that, without the exchange of any funds, such holder purchases that number of shares otherwise issuable upon exercise of its warrant less that number of shares having a current market price at the time of exercise equal to the aggregate exercise price that would otherwise have been paid by such holder upon the exercise of the warrant. This warrant automatically converts on October 5, 2017 without any action by the holder.
Contractual Obligations and Commitments
The following table sets forth our expected contractual obligations as of December 31, 2014:
| Payments Due by Period | ||||||||||||||||||||
| (Dollars in thousands) | Total | Less than 1 Year |
Between 1-3 Years |
Between 3-5 Years |
More than 5 Years |
|||||||||||||||
| Operating lease obligations |
$ | 747,484 | $ | 370,318 | $ | 377,166 | $ | — | $ | — | ||||||||||
| Other long-term liabilities |
— | — | — | — | — | |||||||||||||||
|
|
|
|
|
|
|
|
|
|
|
|||||||||||
| Total |
$ | 747,484 | $ | 370,318 | $ | 377,166 | $ | — | $ | — | ||||||||||
|
|
|
|
|
|
|
|
|
|
|
|||||||||||
49
Table of Contents
Segment
We have determined we operate in one segment: the manufacturing, marketing, and distribution of pet food and pet treats for dogs and cats.
Inflation
Our profitability is dependent, among other things, on our ability to anticipate and react to changes in the costs of key operating resources, including food and other raw materials, labor, energy and other supplies and services. Substantial increases in costs and expenses could impact our operating results to the extent that such increases cannot be passed along to our customers. The impact of inflation on food, labor, and energy costs can significantly affect the profitability of our Company.
While we have been able to offset inflation and other changes in the costs of key operating resources through price increases, productivity improvements and greater economies of scale, there can be no assurance that we will be able to continue to do so in the future. From time to time, competitive conditions could limit our pricing flexibility. In addition, macroeconomic conditions could make additional price increases imprudent. There can be no assurance that all future cost increases can be offset by increased prices or that increased prices will be fully absorbed by our without any resulting changes in their purchasing patterns.
Off Balance Sheet Arrangements
We have no off balance sheet arrangements or any holdings in variable interest entities.
Critical Accounting Policies
Our management’s discussion and analysis of financial condition and results of operations is based on our financial statements, which have been prepared in accordance with GAAP. The preparation of these financial statements requires us to make estimates and assumptions that affect the reported amounts of assets and liabilities and the disclosure of contingent assets and liabilities at the date of the financial statements, as well as the revenue and expenses incurred during the reported periods. On an ongoing basis, we evaluate our estimates and judgments, including those related to accrued expenses and stock-based compensation. We base our estimates on historical experience and on various other factors that we believe are reasonable under the circumstances, the results of which form the basis for making judgments about the carrying value of assets and liabilities that are not apparent from other sources. Changes in estimates are reflected in reported results for the period in which they become known. Actual results may differ from these estimates under different assumptions or conditions.
While our significant accounting policies are described in the notes to our financial statements appearing in this prospectus, we believe that the following critical accounting policies are most important to understanding and evaluating our reported financial results.
The preparation of financial statements in conformity with U.S. GAAP requires management to make estimates and assumptions that affect the reported amounts of assets and liabilities and disclosure of contingent assets and liabilities at the date of the financial statements, and the reported amounts of net sales and expenses during the reporting period.
We believe that the accounting policies discussed below are critical to understanding our historical and future performance, as these policies related to the more significant areas involving management’s judgments and estimates. We base our estimates on historical experience and on various assumptions that we believe to be reasonable under the circumstances. Actual results, as determined at a later date, could differ from those estimates. To the extent that there are differences between our estimate and the actual results, our future financial statement presentation, financial condition, results of operations and cash flows will be affected.
50
Table of Contents
The following critical accounting policies reflect significant judgments and estimates used in preparation of our consolidated financial statements:
Property, Plant and Equipment—Property, plant and equipment are recorded at cost. We provide for depreciation on the straight-line method by charges to income at rates based upon estimated recovery periods of 7 years for furniture and office equipment, 5 years for automotive equipment, 3 – 9 years for refrigeration equipment, 5 – 10 years for machinery and equipment, and 15 – 39 years for building and improvements. Capitalized cost includes the costs incurred to bring the property, plant and equipment to the condition and location necessary for its intended use, which includes any necessary delivery, electrical and installation cost for equipment. Maintenance and repairs that do not extend the useful life of the assets over two years are charged to expense as incurred. Leasehold improvements are amortized over the shorter of the term of the related lease or the estimated useful lives on the straight-line method (without consideration of option renewal terms).
We evaluate all long-lived assets for impairment. Long-lived assets are evaluated for impairment whenever events or changes in circumstances indicate the carrying value of an asset may not be recoverable. Management must exercise judgment in assessing whether or not circumstances require a formal evaluation of the recoverability of our long-lived assets. Recoverability of assets to be held and used is measured by a comparison of the carrying amount of an asset to estimated undiscounted future net cash flows expected to be generated by the asset. If the carrying amount of an asset exceeds its estimated undiscounted future net cash flows, an impairment charge is recognized by the amount by which the carrying amount of the asset exceeds the fair value of the asset. Recoverability of assets held for sale is measured by a comparison of the carrying amount of an asset or asset group to their fair value less estimated costs to sell. Estimating future cash flows and calculating fair value of assets requires significant estimates and assumptions by management. These estimates involve inherent uncertainties, and the measurement of the recoverability of the cost of a potentially impaired asset is dependent on the accuracy of the assumptions used in making the estimates and how these estimates compare to our future operating performance. If the carrying amount is not fully recoverable, an impairment loss is recognized to reduce the carry amount to fair value, and is charged to expense in the period of impairment.
Income Taxes—We account for income taxes under the asset and liability method in accordance with authoritative guidance for income taxes. We recognize deferred tax assets and liabilities and their respective tax basis and operating loss and tax credit carry forwards. We measure deferred tax assets and liabilities using enacted tax rates expected to apply to taxable income in the years in which those temporary differences are expected to be recorded or settled. We recognize the effect on deferred tax assets and liabilities of a change in tax rates in income in the period that includes the enactment date.
At December 31, 2014, we had federal NOL carryforwards of approximately $163.0 million, which expire at various dates between 2025 and 2034. We may be subject to the net operating loss utilization provisions of Section 382 of the Code. The effect of an ownership change would be the imposition of an annual limitation on the use of NOL carryforwards attributable to periods before the change. The amount of the annual limitation depends upon our value immediately before the ownership change, changes to our capital during a specified period prior to the change, and the federal published interest rate. Although we have not undergone a Code Section 382 analysis, if we were to undergo an ownership change it is likely that the utilization of the NOLs will be substantially limited.
A valuation allowance is appropriate when management believes it is more likely than not, the deferred tax asset will not be realized. At December 31, 2014 and 2013, we determined that a valuation allowance of approximately 100% is deemed appropriate.
Revenue Recognition and Incentives—Revenue from product sales is generally recognized upon shipment to the customers, at which point title and risk of loss is transferred and the selling price is fixed or determinable. This completes the revenue-earning process specifically that an arrangement exists, delivery has occurred, ownership has transferred, the price is fixed and collectability is reasonably assured. A provision for payment
51
Table of Contents
discounts and product return allowances, which is estimated based upon our historical performance, management’s experience and current economic trends, is recorded as a reduction of sales in the same period that the revenue is recognized.
Trade incentives, consisting primarily of customer pricing allowances and merchandising funds and from time-to-time, consumer coupons are offered through various programs to customers and consumers. Sales are recorded net of estimated trade incentive spending, which is recognized as incurred at the time of sale. Accruals for expected payouts under these programs are included as accrued expense in the consolidated balance sheet. Coupon redemption costs are also recognized as reduction to calculate net sales when the coupons are issued. Estimates of trade promotion expense and coupon redemption costs are based upon programs offered, timing of those offers, estimated redemption/usage rates from historical performance, management’s experience and current economic trends.
Valuation of our Preferred Shares—As of December 31, 2013, we had 112,160 shares of Series B Preferred Stock and 11,238,098 shares of Series C Preferred Stock issued and outstanding, respectively. Upon consummation of our initial public offering, the Series B Preferred Stock were redeemed for $35.0 million of cash and the Series C Preferred Stock were converted to shares of common stock.
Valuation of Series B Preferred Stock
All shares of Series B Preferred Stock were issued in 2006 and 2007. In determining the issue price, we considered the voting, dividend, and liquidation rights of the Series B Preferred Stock. Based on the terms, it was concluded that the fair value of the Series B Preferred Stock was $100 a share. The Series B Preferred Stock was not convertible to common stock. As of December 31, 2014 there were no shares of Series B Preferred Stock outstanding.
Valuation of Series C Preferred Stock
As of December 31, 2014 there were no shares of Series C Preferred Stock outstanding. The below discussion relates to the valuation of the Series C Preferred Stock through its redemption on November 13, 2014.
The initial tranche of Series C Preferred Stock totaling 9.1 million shares was issued in December 2010 at $5.25 per share to an investor which had no previous investment in us. In determining the valuation of the Series C Preferred Stock we considered a separate transaction that occurred during December 2010, in which we repurchased approximately 4.8 million shares of our common stock from an investor at $5.25 a share, which represented approximately 25% of the outstanding common shares immediately before the transaction. Based on the arm’s length transaction and taking into account the various rights and preferences of the equity securities transacted, our Board of Directors deemed the fair value of the Series C Preferred Stock to be $5.25. In reaching this determination, we considered many factors, including (i) the Series C Preferred Stock is convertible into common stock at a rate of 1:1, (ii) the Series C Preferred Stock dividends are only payable in a liquidation or redemption event and are not considered in the conversion into common stock and (iii) the Series C Preferred Stock voting rights are equivalent to the voting rights of the common stock. Accordingly, our Board of Directors believed that the repurchase of our common stock from a third party investor represented a reasonable measure of fair value of our Series C Preferred Stock given the similarities in the terms of the securities.
During the following 13-months, we issued an additional 1.1 million shares of Series C Preferred Stock at $5.25 per share. During that period we did not issue any shares of our common stock. Due to no additional arm’s length transactions during the period, our Board of Directors considered various objective and subjective factors to determine the fair market value of our Series C Preferred Stock, including:
| • | the per share price of the December 2010 sale of Series C Preferred Stock and repurchase of common stock; |
| • | revenue and corresponding expense growth; |
52
Table of Contents
| • | external market conditions affecting the pet food industry; |
| • | trends within the pet food industry; |
| • | our results of operations and financial position; and |
| • | our stage of business strategy. |
Based on the factors above, the Board of Directors determined that the Series C Preferred Stock fair value was unchanged at $5.25.
During November 2013 and February 2014, we issued additional shares of Series C Preferred Stock totaling 1.4 million at a per share price of $5.25. Given the passage of time since our last third party transaction involving our common stock, we engaged a third-party valuation specialist to assist us in determining the value our common stock as of February 6, 2014. The common stock valuation was determined using a weighted average enterprise value employing an income and market approach analysis. The income approach uses valuation techniques to convert future cash flows and earnings to a single present value amount. The market approach used the guideline company method, a valuation technique in which the fair market value is calculated based on market prices realized in actual arm’s length transactions. The technique consists of undertaking a detailed market analysis of publicly traded companies that provides a reasonable basis for comparison to the relative investment characteristics of the subject company. Valuation ratios, which relate market prices to selected financial statistics derived from the guideline companies, are selected and applied to the subject company after consideration of adjustments for financial position, growth, markets, profitability, and other factors. The enterprise value was weighted using 80% income approach and 20% market approach. The Option Pricing Method (OPM) was then used to allocate enterprise value to each class of equity, taking into account the relative rights and preferences of each class. A discount for lack of marketability of approximately 11% was applied to reach the final valuation of the common stock; because, as we were a private company, there are impediments to liquidity, including lack of publicly available information and the lack of a trading market. The valuation specialist determined the fair value of our common stock at February 6, 2014 was $0.88 per share. The reduction in the fair value of the common stock we experienced from December 31, 2010 to December 31, 2013 was attributable to (i) the dividends recognized on the Series B Preferred Stock and Series C Preferred Stock; (ii) the debt guarantee fees that began in June 2012 and (iii) significant capital expenditures for both Freshpet Fridges and new manufacturing facility in Bethlehem, Pennsylvania.
In addition, during April 2014 we issued additional shares of Series C Preferred Stock totaling 0.8 million at a per share price of $5.25. In assessing whether the April 2014 issuance had a beneficial conversion feature, we noted the new information on hand since the last valuation two months prior on February 6, 2014. Since the last Series C Preferred Stock Valuation, further progress was made towards our initial public offering. We further noted that the first quarter results for 2014 and updated forecast were in line with the forecast that was utilized in the February 6, 2014 valuation report. Based on the updated information on hand, it was noted that there was not enough new information that would increase the valuation of the common stock above the $5.25 grant price of the April 2014 Series C Preferred Stock issuance.
During November 2014, our Series C Preferred Stock was fair valued immediately prior to their conversion to shares of Common Stock. The Series C Preferred Stock was fair valued utilizing the share price at the date of conversion. The difference between fair value and book value was recorded to net loss attributable to common stockholders.
There is no beneficial conversion feature associated with any of the issuance of the Preferred Series C Preferred Stock.
Share Based Compensation—We account for all share-based compensation payments issued to employees, directors, and non-employees using a fair value method. Accordingly, share-based compensation expense is measured based on the estimated fair value of the awards on the date of grant, net of forfeitures. We recognize
53
Table of Contents
compensation expense for the portion of the award that is ultimately expected to vest over the period during which the recipient renders the required services to us using the straight-line single option method. In accordance with authoritative guidance, we remeasure the fair value of non-employee share-based awards as the awards vest, and recognize the resulting value, if any, as expense during the period the related services are rendered.
Significant Factors, Assumptions and Methodologies Used in Determining Fair Value
We apply the fair value recognition provisions of ASC Topic 718, Compensation-Stock Compensation, which we refer to as ASC 718. Determining the amount of share-based compensation to be recorded requires us to develop estimates of the fair value of stock options as of their grant date. For service period and performance based options we recognize share-based compensation expense ratably over the requisite service, which is the vesting period of the award. For exit event options we recognize share-based compensation expense upon the occurrence of an exit event as defined in the option grant agreement. Calculating the fair value of share-based awards requires that we make highly subjective assumptions.
We use the Black-Scholes option pricing model to value our stock option awards. Use of this valuation methodology requires that we make assumptions as to the volatility of our common stock, the expected term of our stock options, the risk free interest rate for a period that approximates the expected term of our stock options and our expected dividend yield. We utilized our historical stock price as an indicator of volatility for all grants prior to 2013. The grants during 2014 all occurred while our common stock was publicly traded. Subsequent to our initial public offering, we no longer deemed it appropriate to use historical volatility as it was not representative of our common stock on the public market. As such expected volatility that was utilized was based upon the volatility of a group of similar entities, referred to as “guideline” companies.
We use the simplified method as prescribed by the Securities and Exchange Commission Staff Accounting Bulletin No. 107, Share-Based Payment, to calculate the expected term of stock option grants to employees as we do not have sufficient historical exercise data to provide a reasonable basis upon which to estimate the expected term of stock options granted to employees. We utilize a dividend yield of zero based on the fact that we have never paid cash dividends and have no current intention to pay cash dividends. The risk-free interest rate used for each grant is based on the U.S. Treasury yield curve in effect at the time of grant for instruments with a similar expected life. The weighted-average assumptions used to estimate the fair value of stock options using the Black-Scholes option pricing model were as follows for the years ended December 31, 2014, 2013 and 2012:
| Year Ended December 31, | ||||||
| 2014 | 2013 | 2012 | ||||
| Weighted average exercise price of options granted |
15.00 | 7.10 | 7.10 | |||
| Expected volatility |
41.9% | 86.0% | 91.2% | |||
| Average expected term in years |
3.9 – 6.6 | 7 | 7 | |||
| Risk-free interest rate |
1.01% – 2.09% | 1.7% | 1.2% | |||
| Expected dividend yield |
0.0% | 0.0% | 0.0% | |||
We are also required to estimate forfeitures at the time of grant, and revise those estimates in subsequent periods if actual forfeitures differ from our estimates. We use historical data to estimate pre-vesting option forfeitures and record share-based compensation expense only for those awards that are expected to vest. To the extent that actual forfeitures differ from our estimates, the difference is recorded as a cumulative adjustment in the period the estimates were revised. Through December 31, 2014, actual forfeitures have not been material.
Share-based compensation expense was $1.6 million, $1.0 million and $1.1 million for the years ended December 31, 2014, 2013, and 2012 respectively. As of December 31, 2014, we had $14.7 million of total unrecognized share-based compensation expense, which we expect to recognize $7.1 million in 2015, $6.6 million in 2016, and $1.0 million in 2017.
54
Table of Contents
If factors change or we employ different assumptions, stock-based compensation expense in future periods may differ significantly from what we have recorded in the past. If there is a difference between the assumptions used in determining stock-based compensation expense and the actual factors that become known over time, we may change the input factors used in determining stock-based compensation expense for future grants. These changes, if any, may materially impact our results of operations in the period such changes are made. We expect to continue to grant stock options in the future, and to the extent that we do, our actual stock-based compensation expense recognized in future periods will likely increase.
Fees on Debt Guarantee—On June 8, 2012, we entered into a Fee and Reimbursement Agreement whereby we and certain investors (the “Guarantors”) entered into agreements to guarantee a portion of our payment obligation with respect to the $62.5 Million Revolver, the Guarantors had determined that the Guarantee was the most advantageous means for protecting or enhancing the value of their existing equity investment and provided the guarantee solely for that purpose. The Guarantors earned a contingent fee equal to 10% per annum of the amount of the outstanding guarantee by such Guarantor pursuant to the credit agreement in the form of newly issued shares of our Series C Preferred Stock, par value $0.001 per share, at a price of $5.25 per share (the “Guarantee Preferred Stock Fee”). The Guarantee Preferred Stock Fee accrued only from and after the date that such Guarantor entered into the guarantee. Upon consummation of our initial public offering, the fees on debt guarantee were settled in the form of shares of our Series C Preferred Stock at a price of $5.25 per share, which were subsequently converted into common stock.
We recognized the Guarantee Preferred Stock Fee as a financial instrument and recorded a liability at fair value at time of issuance. The liability was remeasured to its fair value at each reporting period with changes recorded in the consolidated statement of operations and comprehensive loss. Immediately prior to settlement of the guarantee fee we fair valued the fees on debt guarantee, with the change recorded in the consolidated statement of operations and comprehensive loss. For all reporting periods prior to the settlement of the fees on debt guarantee, we used a third party valuation firm to assist us with determining the fair value of the Guarantee Preferred Stock Fee. For the fair valuation immediately prior to the settlement of the guarantee fee we used our common stock share price.
Fair Value of Financial Instruments—Fair value is defined as the price that would be received to sell an asset or paid to transfer a liability (an exit price) in an orderly transaction between market participants at the reporting date. The accounting guidance specifies a hierarchy of valuation techniques based on whether the inputs to those valuation techniques are observable or unobservable. Observable inputs reflect market data obtained from independent sources, while unobservable inputs reflect market assumptions. The hierarchy gives the highest priority to unadjusted quoted prices in active markets for identical assets or liabilities (Level 1 measurement) and the lowest priority to unobservable inputs (Level 3 measurement).
The three levels of the fair value hierarchy are as follows:
| • | Level 1—Unadjusted quoted prices in active markets for identical assets or liabilities that the reporting entity has the ability to access at the measurement date. Level 1 primarily consists of financial instruments whose value is based on quoted market prices such as exchange-traded instruments and listed equities. |
| • | Level 2—Inputs other than quoted prices included within Level 1 that are observable for the asset or liability, either directly or indirectly (e.g. quoted prices of similar assets or liabilities in active markets, or quoted prices for identical or similar assets or liabilities in markets that are not active). Level 2 includes financial instruments that are valued using models or other valuation methodologies. |
| • | Level 3—Unobservable inputs for the asset or liability. Financial instruments are considered Level 3 when their fair values are determined using pricing models, discounted cash flows or similar techniques and at least one significant model assumption or input is unobservable. |
55
Table of Contents
The carrying amounts reported in the balance sheets for cash and cash equivalents, other receivables, accounts payable and accrued expenses approximate their fair value based on the short- term maturity of these instruments. The warrant liability is recorded at fair value with changes in fair value reflected in the statement of operations and comprehensive loss.
Basic and Diluted Net Loss Per Share of Common Stock—We compute basic net loss per share of common stock by dividing net loss applicable to common stockholders by the weighted average number of shares of common stock outstanding during the period, excluding the dilutive effects of preferred stock, warrants and stock options. We compute diluted net loss per share of common stock by dividing the net loss applicable to common stockholders by the sum of the weighted average number of shares of common stock outstanding during the period plus the potential dilutive effects of preferred stock and stock options outstanding during the period calculated in accordance with the treasury stock method, but such items are excluded if their effect is anti-dilutive. Because the impact of these items is anti-dilutive during periods of net loss, there was no difference between our basic and diluted net loss per share of common stock for the years ended December 31, 2014, 2013 and 2012.
JOBS Act
On April 5, 2012, the JOBS Act was enacted. Section 107 of the JOBS Act provides that an emerging growth company can take advantage of the extended transition period provided in Section 7(a)(2)(B) of the Securities Act for complying with new or revised accounting standards. In other words, an emerging growth company can delay the adoption of certain accounting standards until those standards would otherwise apply to private companies. We have irrevocably elected not to avail ourselves of this extended transition period and, as a result, we will adopt new or revised accounting standards on the relevant dates on which adoption of such standards is required for other public companies.
As an emerging growth company we are not required to, among other things, (i) provide an auditor’s attestation report on our systems of internal controls over financial reporting pursuant to Section 404, (ii) provide all of the compensation disclosure that may be required of non-emerging growth public companies under the Dodd-Frank Wall Street Reform and Consumer Protection Act, (iii) comply with any requirement that may be adopted by the Public Company Accounting Oversight Board regarding mandatory audit firm rotation or a supplement to the auditor’s report providing additional information about the audit and the financial statements (auditor discussion and analysis), and (iv) disclose certain executive compensation-related items such as the correlation between executive compensation and performance and comparisons of the Chief Executive Officer’s compensation to median employee compensation. These exemptions will apply until we no longer meet the requirements of being an emerging growth company. We will remain an emerging growth company until the earliest of (i) the end of the fiscal year following the fifth anniversary of the completion of this offering, (ii) the first fiscal year after our annual gross revenue are $1.0 billion or more, (iii) the date on which we have, during the previous three-year period, issued more than $1.0 billion in non-convertible debt securities or (iv) the end of any fiscal year in which the market value of our common stock held by non-affiliates exceeded $700 million as of the end of the second quarter of that fiscal year.
Quantitative and Qualitative Disclosures about Market Risk
Interest Rate Risk
We are exposed to market risk from changes in interest rates on debt and changes in commodity prices. Our exposure to interest rate fluctuations is limited to our outstanding indebtedness under our Credit Facilities.
Commodity Price Risk
We purchase certain products that are affected by commodity prices and are, therefore, subject to price volatility caused by weather, market conditions and other factors which are not considered predictable or within
56
Table of Contents
our control. In many cases, we believe we will be able to address material commodity cost increases by either increasing prices or reducing operating expenses. However, increases in commodity prices, without adjustments to pricing or reduction to operating expenses, could increase our operating costs as a percentage of our net sales.
Recent Accounting Pronouncements
In April 2014, the FASB issued ASU 2014-08, “Reporting Discontinued Operations and Disclosures of Disposals of Components of an Entity,” (“ASU 2014-08”). Under ASU 2014-08, only disposals representing a strategic shift in operations that have a major effect on our operations and financial results should be presented as discontinued operations. Additionally, ASU 2014-08 requires expanded disclosures about discontinued operations that will provide financial statement users with more information about the assets, liabilities, income, and expenses of discontinued operations. The amendments in ASU 2014-08 are effective for fiscal years, and interim periods within those years, beginning after December 15, 2014. However, ASU 2014-08 should not be applied to a component that is classified as held for sale before the effective date even if the component is disposed of after the effective date. Early adoption is permitted, but only for disposals (or classifications as held for sale) that have not been reported in financial statements previously issued. The effects of ASU 2014-08 will depend on any future disposals by us.
On May 28, 2014, the FASB issued ASU No. 2014-09, Revenue from Contracts with Customers, which requires an entity to recognize the amount of revenue to which it expects to be entitled for the transfer of promised goods or services to customers. The ASU will replace most existing revenue recognition guidance in U.S. GAAP when it becomes effective. The new standard is effective for us on January 1, 2017. Early application is not permitted. The standard permits the use of either the retrospective or cumulative effect transition method. We are evaluating the effect that ASU 2014-09 will have on our consolidated financial statements and related disclosures. We have not yet selected a transition method nor have we determined the effect of the standard on our ongoing financial reporting.
57
Table of Contents
Overview
We started Freshpet with a single-minded mission—to bring the power of real, fresh food to our dogs and cats. We were inspired by the rapidly growing view among pet owners that their dogs and cats are a part of their family, leading them to demand healthier pet food choices. Over the last nine years, we have created a comprehensive business model to deliver wholesome pet food that “pet parents” can trust, and in the process we believe we have become one of the fastest growing pet food companies in North America. Our business model is difficult for others to replicate and we see significant opportunity for future growth by leveraging the unique elements of our business:
| Our Brand |
We founded the fresh, refrigerated pet food category in North America and our brand transparently communicates our passion and dedication. |
| Our Product Know-How |
Our fresh, refrigerated products are differentiated inside and out from conventional pet food as a result of our proprietary recipes, cooking techniques and packaging developed over the last nine years. |
| Our Freshpet Kitchens |
All of our food is made in the United States, and we own and operate what we believe is North America’s only fresh, refrigerated pet food manufacturing facility, which we call the Freshpet Kitchens, located in Bethlehem, Pennsylvania. |
| Our Refrigerated Distribution |
We are the only pet food company with an established refrigerated supply chain connecting our Freshpet Kitchens to retail stores across North America. |
| Our Freshpet Fridge |
We sell our products through a fast-growing network of company-owned branded refrigerators, known as Freshpet Fridges, installed in over 13,300 retail stores across North America. |
| Our Culture |
We foster a culture of innovation, and we strive to be open, honest and socially responsible in everything we do. |
Freshpet is disrupting the North American pet food industry, which is an over $22 billion industry, by driving consumers to reassess conventional dog and cat food offerings that have remained essentially unchanged for decades. We position our brand to benefit from mainstream trends of growing pet humanization and consumer focus on health and wellness. We price our products to be accessible to the average consumer, providing us with broad demographic appeal and allowing us to penetrate multiple classes of retail including grocery, mass, club, pet specialty and natural. We have successfully expanded our network of Freshpet Fridges within leading blue-chip retail chains including Albertsons, BJ’s, Kroger, Petco, PetSmart, Publix, Safeway, Target, Wal-Mart and Whole Foods. The strength of our business model extends to our customers, who we believe find that Freshpet grows their pet category sales, drives higher traffic, increases shopper frequency and delivers category leading margins. As of December 31, 2014, Freshpet Fridges were located in over 13,300 stores, and we believe there is an opportunity to install a Freshpet Fridge in at least 35,000 stores across North America.
Freshpet’s differentiated pet food empowers pet parents to provide positive nutrition and well- being to their pets. Our success is reflected in the growth we have delivered:
| • | Our Freshpet Fridge store locations increased from 7,001 in 2011 to 13,386 in 2014, representing a compounded annual growth rate of 24%; and, as of March 31, 2015, we had 14,019 installed Freshpet Fridges, representing 21% growth over the number as of March 31, 2014. |
58
Table of Contents
| • | Our net sales increased from $25.4 million in 2011 to $86.8 million in 2014, representing a compounded annual growth rate of 51%. |
| Freshpet Fridge Store Locations |
Net Sales ($ millions) | |
|
|
|
| • | Our gross profit margins, which we define as net sales minus costs of goods sold divided by net sales, improved 610 basis points from 42.6% in the year ended December 31, 2011 to 48.7% in the year ended December 31, 2014. |
| • | Our net loss from operations decreased from $23.4 million in 2011 to $6.4 million in 2014. |
| • | Our net loss increased from $24.2 million in 2011 to $37.3 million in 2014. Net loss in 2014 included $25.9 million of non cash fees on debt guarantee. Excluding this item, net loss was $10.7 million in 2014, a decrease in net loss of $13.5 million compared to 2011. We will no longer incur non cash fees on debt guarantee in future periods. |
Our Industry
We compete in the North American dog and cat food market, which had 2014 retail sales of over $22 billion and has grown at an average compounded annual growth rate of 3% from 2007 to 2014, according to Euromonitor. According to APPA, U.S. pet food spending is expected to continue to increase at a similar rate over the next 5 years. Of the total market, dog food, cat food, and treats & mixers accounted for retail sales of $12.1 billion, $6.8 billion, and $3.5 billion, respectively. The U.S. represented $20.8 billion or approximately 92% of North American dog and cat food sales. The pet food market has historically been resilient as consumers continue to spend on their pets even during economic downturns. Within the pet food market, premium and/or natural brands are gaining market share, according to Packaged Facts. According to a report from Packaged Facts, from 2008 to 2012, natural pet food in the United States grew at a compounded annual growth rate of 18% and is expected to grow at an annual rate of 17% for 2012 to 2017.
We believe the following trends are driving growth in our industry:
Pet ownership. There are currently over 84.6 million pet-owning households in the United States, according to the APPA. The percentage of U.S. households with dogs or cats (or both) has increased from 47.8% in 2006 to 52.3% in 2013. More U.S. households today have pets than have children, which we believe to be a result of demographic shifts and changing attitudes towards pets.
Pet humanization. According to Packaged Facts, 83% of U.S. pet owners view their pets as members of the family. As pets are increasingly viewed as companions, friends, and family members, pet owners are being transformed into “pet parents” who spare no expense for their loved ones, driving premiumization across pet categories. This trend is reflected in food purchasing decisions. Nearly 80% of U.S. pet owners are as concerned about the quality of their pet’s food as they are about their own, according to market researcher Mintel.
Increasing consumer focus on health & wellness. Consumers are increasingly purchasing fresh, natural, and organic food products. According to Euromonitor, from 2002 to 2014, the U.S. natural and organic food market grew at a compound annual growth rate of approximately 10%, compared to the overall U.S. food market’s growth rate of 3.1%. We believe consumers are seeking simple, fresh and easy to understand food products from brands they trust and made with ingredients that are transparently sourced.
59
Table of Contents
The pet food purchasing decision is underpinned by higher brand loyalty than many other consumer packaged goods categories. A consumer selecting a pet food brand resists frequent switching in order to avoid disrupting the pet’s diet, resulting in high repeat purchasing behavior. As a result, we believe that as consumers try fresh, refrigerated pet food, they are likely to become repeat users of the product.
Our Opportunity
Even though long-term consumer trends of pet humanization and health and wellness are well documented, conventional pet food sold as dry kibble or in wet cans has not changed substantially for decades. We believe that the pet food industry has not kept pace with how consumers think about food for their families, including their pets. As a result, consumers are searching for higher quality, less processed food for their dogs and cats—meals that measure up to today’s sensibilities of what actually constitutes “good food.” Freshpet was specifically designed to address this growing need with affordable offerings accessible to the average consumer.
Our Competitive Strengths
We believe that the following strengths differentiate Freshpet and position us to become a leading brand in pet food:
The category defining brand in fresh, refrigerated pet food. Freshpet is the first and only fresh, refrigerated pet food brand distributed across North America. Our products represent a significant innovation in pet food, and we have developed a brand proposition that pet parents can intuitively trust.
All of our meats and vegetables are sourced in North America, and all our products are made in the United States. We use fresh and simple ingredients, over 70% of which are sourced locally within a 175 mile radius of the Freshpet Kitchens. None of our ingredients are sourced from China. We gently cook these ingredients using proprietary recipes and use no preservatives. Pet parents can easily recognize ingredients in our products as being similar to fresh food they buy for their families. In palatability tests commissioned by us and conducted by third party kennels, dogs chose Freshpet over other leading pet food brands by a wide margin. In addition, according to a study commissioned by us and conducted by a third party researcher, pet parents perceived that Freshpet provides their pets with greater enthusiasm for eating and visible health improvements. By satisfying pet nutritional needs and strong pet parent motivations, we have built a growing base of loyal consumers who we believe have a deep emotional connection to the Freshpet brand.
Proven, scalable and defensible point-of-sale retail model. We sell our products through a fast-growing network of company-owned branded refrigerators, or Freshpet Fridges, which are typically four feet wide by seven feet high, and replace standard shelving in the pet aisle or an end-cap of a retail store. We are the only company to have a branded refrigeration fixture, in-aisle electric power and significant exclusive shelf space in the pet department of leading national retail chains. The Freshpet Fridge is a significant competitive advantage as it provides us with a brightly-lit and highly- visible merchandising platform and control over how our brand is presented to consumers at the point of sale. We believe we have developed strong capabilities in the design, sourcing, installation and maintenance of these refrigerators. We believe our Freshpet Fridges generate compelling economics with an average cash-on-cash payback period of less than 15 months, calculated by comparing our total current costs for a refrigerator (including installation and maintenance) to our current margin on net revenues.
60
Table of Contents
We have successfully installed Freshpet Fridges across all major classes of pet retail including grocery, mass, club, pet specialty and natural. Our track record of consistently growing the number of store locations with key customers underscores the success of our point-of-sale model.
| Selected Customers |
Year Entered |
Freshpet Fridge Locations at Launch |
Freshpet Fridge Locations at December 31, 2014 |
|||||||||
| Wal-Mart |
2007 | 51 | 1,639 | |||||||||
| Petco |
2007 | 97 | 1,374 | |||||||||
| PetSmart |
2006 | 29 | 1,328 | |||||||||
| Target |
2012 | 50 | 1,178 | |||||||||
| Kroger |
2007 | 185 | 970 | |||||||||
| Whole Foods |
2012 | 29 | 242 | |||||||||
The pet category is of strategic importance to many of our customers due to the category size and frequency of purchase. Introducing Freshpet allows customers to offer consumers a new and innovative product that is aligned with consumer trends at an accessible price point for the average shopper. We believe our customers find that Freshpet grows sales of their overall pet category, drives higher traffic, increases shopper frequency and delivers category leading margins. We believe our attractive business proposition to customers will allow us to continue penetrating store locations of existing and new customers.
Difficult to replicate know-how, manufacturing facilities and supply chain. We built and currently operate what we believe to be the only fresh, refrigerated pet food manufacturing facility in North America. Our facility was designed by us to operate at human-grade food quality and safety standards. Over the last nine years, we have developed proprietary in-house know-how in the areas of recipes, ingredients sourcing, cooking techniques and product packaging. We have established the only refrigerated pet food supply chain in North America, including warehousing, transportation and refrigeration at the point-of-sale. In addition to physical infrastructure, we have cultivated a team of professionals with unique skills in production and delivery of fresh, refrigerated pet food. As a result, our facilities, processes and people represent advantages that would be difficult for others to replicate.
Experienced, committed management team and company culture focused on core values. We have a deep bench of management talent with a tremendous amount of pet industry experience and significant ownership in Freshpet. The majority of our senior executive team previously worked together to revitalize the Meow Mix brand and successfully sold it in 2006. Our CEO, Richard Thompson, served as CEO of The Meow Mix Company from 2002 to 2006 and previously founded the American Italian Pasta Company. Over time, we have grown this senior team with carefully selected individuals who possess substantial industry experience and share our core values.
Our core values span Pets, People and Planet. We produce the highest quality food for Pets and are active in pet-related charitable giving. We treat our People, including team members and partners, with respect and look to foster their growth alongside our own. We try to be good stewards of the Planet by using renewable energy and looking to constantly improve the efficiency of our operations. We believe our culture and values allow us to attract a passionate employee base while also helping pet parents connect with the Freshpet brand.
Our Growth Strategies
We intend to continue growing net sales and profitability through the following growth strategies:
Continue to grow awareness, trial and adoption to increase Freshpet’s North American market share. We believe that Freshpet is in the nascent stages of penetrating the pet food market with our innovative fresh, refrigerated product offering. Our market share is currently less than 1% of the over $22 billion North American pet food market. As of March 31, 2014, approximately 17% of U.S. pet food consumers were aware of the Freshpet brand, which provides us a significant opportunity to grow over time.
61
Table of Contents
We deploy a broad set of marketing tools to reach pet parents. We focus our marketing efforts on educating pet parents about the benefits of fresh, refrigerated food. Since 2011, we have strategically utilized national TV advertising to meaningfully drive sales productivity. More recently, our investments in social and digital media have spurred an active online community of enthusiastic pet parents that advocate for our products and drive “grass roots” education efforts about the benefits of fresh, refrigerated pet food to broaden our consumer reach. Freshpet also is active in public relations and event marketing initiatives utilizing our Freshpet food truck. In addition, our Freshpet Fridges serve as local brand ambassadors to introduce consumers to our brand in over 13,300 retail locations.
As a result of our marketing investments, consumer trial of Freshpet products has tripled from 2010 to 2014, and repeat purchase rates also increased significantly. In many retail accounts where Freshpet has been available for five years or more, we have achieved between 8%—10% market share of dry and wet dog food sales. We believe that with growing awareness and availability of Freshpet, we have expansive runway to grow trial, adoption and market share.
Continue to grow points of distribution by installing new Freshpet Fridges. We believe there is a significant opportunity to continue to grow our network of Freshpet Fridges by expanding within the store base of existing and new customers. We grew the number of Freshpet Fridge store locations by a compounded annual rate of 24% between 2011 and 2014. We operate Freshpet Fridges in more than 13,300 stores in North America, and we estimate that there is an opportunity to install a Freshpet Fridge in at least 35,000 retail locations across North America. Within our current footprint we believe we have the opportunity to double our store count at existing customers alone.
Over the next three years, we plan to install over 6,000 Freshpet Fridges in new retail locations. We have developed organizational resources and a national network of service providers to enable us to achieve this goal. We expect continued demand for our Freshpet Fridges driven by the strong business proposition and attractive margins that we deliver to customers.
Continue to deliver innovation in pet food and expand our product offerings. As the first and only manufacturer of fresh, refrigerated pet food distributed across North America, product innovation is core to our business. We are continually working to develop new products that address a variety of consumer trends and preferences. Our innovations are designed to remain true to our founding mission—simple, fresh, good food—while expanding our base of consumers and usage occasions. For example, our Roasted Meals products mirror product trends in human food, and our Dog Joy Turkey Bacon treats offer an indulgent treat outside of regular meals. In 2014, new product introductions since 2011 represented 37% of our net sales.
We have a strong innovation pipeline, including entirely new product platforms, which expands the breadth of our fresh offerings. We also see significant opportunity to expand into pet categories where we are underpenetrated. Over 94% of our 2014 net sales were derived from dog food, a segment that represents 53% of overall U.S. pet food retail sales. Other segments of pet food, including cat food and pet treats, represent compelling growth opportunities to expand our base of users and usage occasions. We expect that new product introductions will continue to meaningfully drive growth going forward.
Continue to enhance our operating margins. We intend to enhance our operating margins through efficiencies of scale as we grow our net sales ahead of costs. We have made significant investments in management, manufacturing capacity, information systems and other infrastructure to enable us to pursue our growth. The Freshpet Kitchens currently operate with capacity utilization of approximately 70%, and we can double our production capacity through investments in expanding our existing site as our sales volumes grow.
From 2011 through 2014, we expanded our gross profit margins by approximately 610 basis points from 42.6% to 48.7% as a result of leveraging higher sales and cost efficiencies achieved from the new Freshpet Kitchens opened in the second half of 2013. We expect that gross profit margins improvement and operating leverage from SG&A costs will be a significant driver of earnings growth going forward.
62
Table of Contents
Our Mission and Values
We started Freshpet with a single-minded mission—to bring the power of real, fresh food to our dogs and cats. And, we are committed to doing so in ways that are good for Pets, People and Planet.
Pets
Our pets are members of our family and deserve to eat the kind of fresh, healthy food that we do.
We cook our fresh, nutritious pet food with the same care that we would take in preparing human food. Through the Freshpet Foundation, we support nutritional research in areas of prevention, care and treatment of diseases in dogs. Since founding Freshpet, we have donated over two million fresh meals to pets via shelters, charitable organizations and humane societies. Our team members get paid time off to pursue activities that help pets in their community. We also participate in Random Acts of Kindness to do our part to improve the lives of pets and pet parents.
People
People include our team members, our partners and pet parents. We treat our team members with respect and are committed to helping them develop professionally and personally. We try to be good partners with customers, distributors and suppliers by conducting business with honesty and transparency. Additionally, we strive to help pet owners by providing pet parenting resources.
Planet
We are committed to being socially responsible and minimizing our environmental impact. The electricity used in the Freshpet Kitchens is 100% wind-powered. We also strive to conserve energy by continually improving the efficiency of our Freshpet Fridges and partnering with freight and logistics providers committed to sustainable practices.
Our commitment to our values helps us engage with consumers, motivate our team members and attract strong partners, which allows us to fulfill our mission of delivering the best nutritional product choices to improve the well-being of our pets, enrich pet parents’ lives and contribute to communities. Freshpet—Pets, People, Planet.
Our Products
Our products consist of dog food, cat food and dog and cat treats. All Freshpet products are made according to our nutritional philosophy of fresh, meat-based nutrition and minimal processing. Our proprietary recipes include real, fresh meat and varying combinations of vitamin-rich vegetables, leafy greens and anti-oxidant rich fruits, without the use of preservatives, additives or artificial ingredients. Our unique product attributes appeal to diverse consumer needs across multiple classes of retail where Freshpet is sold. Consequently, our brand resonates across a broad cross-section of pet parent demographics.
63
Table of Contents
All of our products are sold under the Freshpet brand name, with ingredients, packaging and labeling customized by class of retail. Our products are available in multiple forms, including slice and serve rolls, bagged meals and tubs. The following is a summary of our primary classes of retail and corresponding product offerings:
| Class of Retail |
Mass Merchandisers & Traditional Grocery |
Pet Specialty | Natural Grocers | |||
| Launch |
Launched in 2006 | Launched in 2010 | Launched in 2012 | |||
| Preliminary Packaging |

|

|

| |||
| Selected Products |

|

|

| |||
We also offer fresh and frozen treats across all classes of retail under the Dognation and Dog Joy labels, which accounted for 12% of total net sales in 2014.
Our Product Innovation
As the first and only manufacturer of fresh, refrigerated pet food distributed across North America, product innovation is core to our strategy. We take a fresh approach to pet food and are not constrained by conventional pet food products, attributes and production capabilities. We employ a tightly-knit, creative team of marketing and research and development professionals, and we consult with outside experts through our Nutrition Council, which includes leading microbiologists and veterinary nutritionists. Our team often identifies pet parents’ needs by evaluating emerging demand trends in both pet food and human food. Our fully equipped research and development facility located near the Freshpet Kitchens tests small batches of new recipes and tries out new cooking techniques. New products are refined iteratively with the help of consumer panel data to arrive at products that we believe can be commercially successful.
The success of our approach is evidenced by our broad product portfolio today. We began Freshpet by producing fresh, refrigerated slice and serve rolls, and over time have steadily expanded into successful new product forms including bags, tubs and treats. We also introduced new recipes and ingredients, such as proteins and grain-free options, never before seen in pet food that cater to the specific dietary requirements of pets.
For the year ended 2014, new product introductions since 2011 represented 37% of our net sales. We have a strong innovation pipeline, including entirely new product platforms, which expand the breadth of our fresh offerings. We expect that new product introductions will continue to meaningfully drive growth going forward.
Our Supply Chain
Manufacturing: All of our products are manufactured in the United States. We own and operate what we believe to be the only fresh, refrigerated pet food manufacturing facility in North America, the Freshpet Kitchens at Bethlehem, Pennsylvania. This 58,000 square foot facility completed in 2013 was built to human grade food standards and houses two production lines customized to produce fresh, refrigerated food. In 2014, approximately 90% of our product volume was manufactured by us. For manufacture of some low volume products, we strategically partner with a select group of contract manufacturers that operate human food manufacturing facilities.
64
Table of Contents
Ingredients and Packaging: Our products are made with natural and fresh ingredients including meat, vegetables, fruits, whole grains, vitamins and minerals. We use high quality food grade plastic packaging materials. Over 70% of our ingredients are sourced locally from within a 175 mile radius of the Freshpet Kitchens, 97% are from North America and none are sourced from China. We maintain rigorous standards for ingredient quality and safety. By volume, our largest input, antibiotic-free fresh chicken, represents approximately 50% of total ingredients. In order to retain operating flexibility and negotiating leverage, we do not enter into exclusivity agreements or long term commitments with any of our suppliers. All of our suppliers are well-established companies that have the scale to support our growth. For every ingredient, we either use multiple suppliers or have identified alternative sources of supply that meet our quality and safety standards.
Distribution: Outbound transportation from our facility is handled through a partnership with a leading human food manufacturer, which also warehouses and delivers our refrigerated products to grocery retail accounts across North America. This partnership is governed by a written agreement pursuant to which our products are stored and shipped on a cost-plus basis. As a result, as our volumes grow, we expect to be able to leverage our distribution costs. We use national and regional distributors to cover the mass, pet specialty and natural retail classes. Our agreements with other distributors are based on regional mutual exclusivity within each region for the fresh refrigerated pet category.
Our Product Quality & Safety
We go to great lengths to ensure product quality, consistency and safety from ingredient sourcing to finished product. Our company-owned manufacturing facility allows us to exercise significant control over production. Our quality assurance team includes nine professionals with significant experience in pet and human food production.
Our production processes are designed to meet science-based quality standards with documented plans for Hazard Analysis Critical Control Points and Hazard Analysis Risk Based Preventive Control to monitor established production controls, calibrate instruments, record data and perform corrective actions. Our on-site laboratory has microbial and composition testing capabilities. Quality control approvals are based on a positive release strategy, wherein a batch can only be shipped when it passes control point record reviews and laboratory testing. At the end of each working day, a third shift consisting of a cleaning crew sanitizes all equipment that is in contact with food material. Before commencing production the next day, quality assurance professionals swab equipment to test for potential contaminants.
Freshpet’s food safety program is certified at Safe Quality Food Level III, which is the highest standard determined under the Global Food Safety Initiative Benchmarks. We believe our systems and standards for product quality and safety can support our growth and ensure continued success in the market.
Our Customers and Distributors
We sell our products throughout North America, generating the vast majority of our sales in the United States. The strength of our business model makes us an attractive partner for leading blue-chip retailers, who we believe find that Freshpet grows the sales of their pet category, drives higher traffic, increases shopper frequency and delivers category-leading margins. Our Freshpet Fridge locations have been consistently increasing as we add new retail accounts and add stores in existing accounts. We are in over 13,300 stores and believe there is opportunity for us to install a Freshpet Fridge in at least 35,000 stores in North America. We sell our products through the following classes of retail: grocery, mass, club, pet specialty and natural.
65
Table of Contents
Evolution of Store Count by Class of Retail
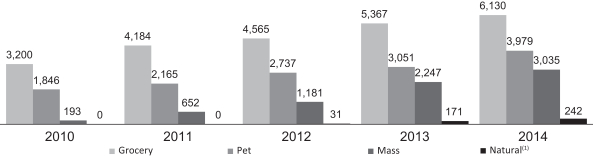
| (1) | We began selling in the natural retail class in 2012. |
Our customers determine whether they wish to purchase our products either directly from us or through a third party distributor. In 2014, our largest distributor by net sales, McLane Company, Inc., which sells to three of our customers, including Wal-Mart and Target, accounted for 22% of our net sales. No other distributor or customer accounted for more than 10% of our net sales in 2014.
The Freshpet Fridge
We sell our products through a growing network of company-owned branded refrigerators, the Freshpet Fridges. Our Freshpet Fridges are typically four feet wide by seven feet high, and replace standard shelving in the pet aisle or an end-cap of a retail store. Our Freshpet Fridge designs are constantly evolving with all new models featuring prominent edge-lit LED headers, LED interior lighting, crisp black interiors, and frameless glass swing doors for aesthetics and easy access. We use state-of- the-art refrigeration technology and environmentally friendly refrigerants to minimize energy consumption and environmental impact.
We design, produce, install and maintain the Freshpet Fridge through a combination of in-house resources and world-class partners. We source our Freshpet Fridges from three leading global commercial refrigerator manufacturers with whom we have a collaborative approach to refrigerator design and innovation. Once ordered by us, Freshpet Fridges are shipped to distribution centers for delivery and installation in retail stores.
Installation into retail locations and ongoing maintenance of the Freshpet Fridge is coordinated by Freshpet and executed through leading third-party service providers. All of our Freshpet Fridges are protected by a manufacturer warranty for one to three years. Our refrigerators are designed to be highly reliable, and at any given time less than 1% of the network is out of service for maintenance. Moreover, to ensure quality, cleanliness and appropriate in-stock levels, we employ brokerage partners to conduct a physical audit of the Freshpet Fridge network on an ongoing basis, with photographic results of every Freshpet Fridge in the network transmitted back to Freshpet and reviewed by members of our sales team.
We currently estimate less than 15 month cash-on-cash payback for the average Freshpet Fridge installation, calculated by comparing our total current costs for a refrigerator (including installation and maintenance) to our current margin on net revenues. We believe our attractive value proposition to retailers and pet parents will allow us to continue penetrating store locations of existing and new customers. The Freshpet Fridge provides a highly-visible merchandising platform, allows us to control how our brand is presented to consumers at point-of-sale and represents a significant point of differentiation from other pet food competitors.
Marketing and Advertising
Our marketing strategy is designed to educate consumers about the benefits of fresh refrigerated pet food and build awareness of the Freshpet brand. We deploy a broad set of marketing tools across television, digital and public relations to reach consumers through multiple touch points and increase product trials.
66
Table of Contents
Our network of over 13,300 branded Freshpet Fridges in prominent locations within blue-chip retailers helps to introduce consumers to our brand and instantly distinguish Freshpet from traditionally merchandised pet food. Since 2011, we have effectively used national TV advertising to drive incremental consumers to try Freshpet products. We expect to realize greater benefits from national TV advertising as we continue to grow the network of Freshpet store locations nationwide. More recently, we have expanded our online presence to better target consumers seeking information on healthy pet food. We reach consumers across multiple digital and social media platforms including websites, blogs and online reviews, as well as with tailored messaging on popular digital hubs including Facebook, Twitter and YouTube. Our public relations strategy includes event marketing and the use of our Freshpet truck to create buzz among pet parents at high pet traffic areas.
Our marketing strategy has allowed us to drive new consumers to our brand and develop a highly engaged community of users who actively advocate for Freshpet.
Competition
Pet food is a highly competitive industry. We compete with manufacturers of conventional pet food such as Mars, Nestlé and Big Heart Pet Brands (part of The J.M. Smucker Company). We also compete with specialty and natural pet food manufacturers such as Colgate-Palmolive, Blue Buffalo and Merrick. In addition, we compete with many regional niche brands in individual geographic markets.
Given a North American retail landscape dominated by large retailers, with limited shelf space and a significant number of competing products, competitors actively support their brands through marketing, advertising, promotional spending and discounting.
Competitive factors in the pet food industry include product quality, ingredients, brand awareness and loyalty, product variety, product packaging and design, reputation, price, advertising, promotion and nutritional claims. We believe that we compete effectively with respect to each of these factors. Moreover, our fresh, refrigerated product offering and secured shelf space in the form of the Freshpet Fridge offer significant advantages against competitors.
Team Members
As of December 31, 2014, we had 162 employees all of whom are located in the United States. None of our employees is represented by a labor union or by any collective bargaining arrangements with respect to his or her employment with us. We believe that our employee relations are good.
Properties
Our corporate headquarters is currently located in Secaucus, New Jersey and consists of approximately 14,815 square feet of office space and is subject to a lease agreement that expires on January 31, 2017.
We own the Freshpet Kitchens, our manufacturing facility in Bethlehem, Pennsylvania, which consists of approximately 58,470 square feet. We are currently in the process of expanding our Freshpet Kitchens site in two phases. The first phase will add an additional 7,600 square feet, and the second phase 28,000 square feet. We lease a manufacturing facility in Quakertown, Pennsylvania, which consists of approximately 6,500 square feet. The lease agreement expires on June 30, 2015, and we do not expect to renew it as we consolidate all in-house manufacturing at the Freshpet Kitchens. We believe that our properties have been adequately maintained, are in good condition generally and are suitable and adequate for its business as presently conducted.
Trademarks and Other Intellectual Property
We believe that our rights in our trademarks and service marks are important to our marketing efforts to develop brand recognition and differentiate our brand from our competitors and are a valuable part of our
67
Table of Contents
business. We own a number of trademarks and service marks that have been registered, or for which applications are pending, with the United States Patent and Trademark Office including, among others, Freshpet, Vital, Nature’s Fresh, Roasted Meals, Freshpet Dog Joy Treats and Dognation.
We believe that our intellectual property has substantial value and has significantly contributed to our success to-date. We are continually developing new technology and enhancing proprietary technology related to our pet food, Fridges and manufacturing operations.
We also rely on unpatented proprietary expertise, recipes and formulations, continuing innovation and other trade secrets to develop and maintain our competitive position.
Government Regulation
Along with our brokers, distributors, and ingredients and packaging suppliers, we are subject to extensive laws and regulations in the United States by federal, state and local government authorities. In the United States, the federal agencies governing the manufacture, distribution and advertising of our products include, among others, the FTC, the FDA, the USDA, the United States Environmental Protection Agency and the Occupational Safety and Health Administration. Under various statutes, these agencies, among other things, prescribe the requirements and establish the standards for quality and safety and regulate our marketing and advertising to consumers. Certain of these agencies, in certain circumstances, must not only approve our products, but also review the manufacturing processes and facilities used to produce these products before they can be marketed in the United States. We are also subject to the laws of Canada, including the Canadian Food Inspection Agency, as well as provincial and local regulations.
We are subject to labor and employment laws, laws governing advertising, privacy laws, safety regulations and other laws, including consumer protection regulations that regulate retailers or govern the promotion and sale of merchandise. Our operations, and those of our distributors and suppliers, are subject to various laws and regulations relating to environmental protection and worker health and safety matters. We monitor changes in these laws and believe that we are in material compliance with applicable laws.
Information Systems
We employ a comprehensive enterprise resource planning (ERP) system provided and supported by a leading global software partner. This system covers order entry, customer service, accounts payable, accounts receivable, purchasing, asset management and manufacturing. Our order management process is automated via Electronic Data Interchange with virtually all our customers, which feeds orders directly to our ERP platform. From time to time, we enhance and complement the system with additional software. We are currently expanding our ERP system with a Warehouse Management System which will allow us to improve tracking and management of ingredients, streamline manufacturing and provide the ability to ship direct to customers. We expect the system to be operational during the first half of 2015.
We backup data every hour and store a copy locally for immediate restoration if needed. All data is transmitted to a secure offsite cloud storage service daily for disaster recovery needs. We believe our systems infrastructure is scalable and can support our future growth.
Legal Proceedings
We are currently involved in various claims and legal actions that arise in the ordinary course of our business, including claims resulting from employment related matters. None of these claims, most of which are covered by insurance, has had a material effect on us, and as of the date of this prospectus, we are not party to any material pending legal proceedings and are not aware of any claims that could have a material adverse effect on our business, financial condition, results of operations or cash flows. However, a significant increase in the number of these claims or an increase in amounts owing under successful claims could materially and adversely affect our business, financial condition, results of operations or cash flows.
68
Table of Contents
Set forth below is the name, age (as of April 10, 2015), position and a description of the business experience of each of our executive officers and each of our post-IPO directors:
| Name |
Age | Position(s) | ||||
| Charles A. Norris |
68 | Chairman of the Board and Director | ||||
| Richard Thompson |
63 | Director and Chief Executive Officer | ||||
| J. David Basto |
42 | Director | ||||
| Daryl G. Brewster |
58 | Director | ||||
| Lawrence S. Coben |
56 | Director | ||||
| Walter N. George III |
58 | Director | ||||
| Christopher B. Harned |
52 | Director | ||||
| Robert C. King |
56 | Director | ||||
| Jonathan S. Marlow |
35 | Director | ||||
| Craig D. Steeneck |
57 | Director | ||||
| Richard Kassar |
67 | Chief Financial Officer | ||||
| Scott Morris |
46 | Chief Marketing Officer | ||||
| Cathal Walsh |
43 | Senior Vice President of Cooler Operations | ||||
| Michael Hieger |
41 | Senior Vice President of Manufacturing Operations | ||||
| Stephen Macchiaverna |
57 | Senior Vice President, Controller and Secretary | ||||
| Thomas Farina |
50 | Senior Vice President of Sales | ||||
| Kathryn Winstanley |
35 | Vice President of Marketing | ||||
Background of Directors and Executive Officers
Chairman of the Board and Director—Charles A. Norris has been a member of our Board of Directors and Chairman of the Board since October 2006. Mr. Norris has served as the Chairman of Glacier Water Services Inc. since 2001. He is also a member of the board of directors of AEM Electronics Inc., a position he has held since 2004, and a member of the board of directors of MP Holdco LLC, a position he has held since 2015. Mr. Norris is the retired President of McKesson Water Products Company, a bottled water company and division of McKesson Corporation, where he served as President from 1990 until he retired in October 2000. From 1981 through 1989, Mr. Norris served as President of Deer Park Spring Water Company, which was a division of Nestle USA, and then led an investor group that acquired the business in 1985 until it was sold to Clorox in 1987. Mr. Norris remained an executive officer of Clorox through 1989 following their acquisition of Deer Park. From 1973 to 1985, Mr. Norris served in various operational executive positions with Nestle in both Switzerland and the United States. Mr. Norris provides the Board of Directors with extensive corporate leadership experience as well as a deep understanding of our business.
Director and CEO—Richard Thompson has been a member of our Board of Directors since December 2010 and has served as Chief Executive Officer since January 2011 when MidOcean made its initial investment in us. From 2007 to 2010, Mr. Thompson made investments in various businesses including ZooToo, an online community for pet lovers. He served as Chief Executive Officer of The Meow Mix Company from 2002 until its sale to Del Monte Foods in 2006. Mr. Thompson has been involved in a number of successful ventures, including the American Italian Pasta Company, which he founded in 1985 and where he served as its President and Chief Executive Officer from 1986 to 1991. Mr. Thompson provides the Board of Directors with knowledge of the daily affairs of the Company, public company experience and expertise in the consumer products industry.
Director—J. David Basto has been a member of our Board of Directors since December 2010. Mr. Basto is Founding Partner and Managing Director of Broad Sky Partners, a position he has held since its formation in 2013. Prior to co-founding Broad Sky Partners, Mr. Basto worked for MidOcean from its inception in 2003 through 2013, most recently as Managing Director and co-head of MidOcean’s consumer sector investing team. Prior to MidOcean, Mr. Basto worked for DB Capital Partners and its predecessor BT Capital Partners from 1998
69
Table of Contents
through 2003. Previously, Mr. Basto held positions with Juno Partners and Tucker Anthony Inc. Mr. Basto currently serves on the board of directors of SBD Holdings Group Corp., the parent company of South Beach Diet Corp., and as a director and co-chairman of MP Holdco LLC. Mr. Basto provides the Board of Directors with expertise in analyzing financial issues and insights into the consumer sector.
Director—Daryl G. Brewster has been a member of our Board of Directors since January 2011. Since 2013, Mr. Brewster has served as the Chief Executive Officer of Committee Encouraging Corporate Philanthropy, a coalition of over 200 large cap companies focused on addressing societal challenges through business. Since 2008, Mr. Brewster has also been the founder/CEO of Brookside Management, LLC, a boutique consulting firm that provides C-level insights and support to consumer companies and service providers to the industry. In 2013, Mr. Brewster co-founded Brewster Foods Group, a family-run business focused on investing in and operating small cap food businesses, where he continues to act as the company’s co-founder and co-chair. Between 2009 and 2013, Mr. Brewster was a Management Advisor to MidOcean partners. Prior to that, Mr. Brewster served as the Chief Executive Officer of Krispy Kreme Doughnuts, Inc. from March 2006 through January 2008. From 1996 to 2006, Mr. Brewster was a senior executive at Kraft, Inc. (which acquired Nabisco in 2000), where he served in numerous senior executive roles, most recently as Group Vice President and President, Snacks, Biscuits and Cereal. Before joining Nabisco, Mr. Brewster served as Managing Director, Campbell’s Grocery Products Ltd.—UK; Vice-President, Campbell’s Global Strategy, and Business Director, Campbell’s U.S. Soup. Mr. Brewster serves on the board of MP Holdco LLC and the boards of several middle-market growth companies, and previously served on the board of E*Trade Financial Services, Inc. Mr. Brewster provides the Board of Directors with experience in corporate leadership, public company operations, and an understanding of the pet and consumer packaged goods industries.
Director—Lawrence S. Coben, Ph.D., has been a member of our Board of Directors since November 2014. Mr. Coben is currently Chairman and Chief Executive Officer of Tremisis Energy Corporation LLC, positions he has held since May 2006. Mr. Coben was also Chairman and Chief Executive Officer of Tremisis Energy Acquisition Corporation II from July 2007 through March 2009 and of Tremisis Energy Acquisition Corporation from February 2004 to May 2006. From January 2001 to January 2004, Mr. Coben was a Senior Principal of Sunrise Capital Partners L.P., a private equity firm. From 1997 to January 2001, Mr. Coben was an independent consultant and, from 1994 to 1996, he was Chief Executive Officer of Bolivian Power Company. Mr. Coben currently serves on the board of NRG Energy, Inc. and is an Advisory Partner of the Morgan Stanley Infrastructure Partners. Mr. Coben served on the board of directors of Chilean Utility SAESA from 2008 to 2010 and the British power developer Rurelec PLC from 2011 to 2014. Mr. Coben is also Executive Director of the Sustainable Prevention Initiative and a Consulting Scholar at the University of Pennsylvania Museum of Archaeology and Anthropology. Mr. Coben provides the Board of Directors with significant managerial, strategic, and financial expertise, particularly as it relates to company financings, transactions and development initiatives.
Director—Walter N. George III has been a member of our Board of Directors since November 2014. Mr. George is the President of G3 Consulting, LLC, a boutique advisory firm specializing in value creation in small and mid-market consumer products companies, a company he founded in 2013. Mr. George served as President of the American Italian Pasta Company and Corporate Vice President of Ralcorp Holdings from 2010 until its sale to ConAgra Foods in 2013. Mr. George served as Chief Operating Officer at American Italian Pasta Company from 2008 to 2010. From 2001 to 2008, Mr. George served in other executive roles with American Italian Pasta Company, including Senior Vice President—Supply Chain and Logistics and Executive Vice President—Operations and Supply Chain. From 1988 through 2001, Mr. George held a number of senior operating positions with Hill’s Pet Nutrition, a subsidiary of Colgate Palmolive Company, most recently as Vice President of Supply Chain. Mr. George serves on the board of directors of Vision Bank and Old World Spice and Seasoning Company. Mr. George provides the Board of Directors with operations expertise, consumer products and pet food industry expertise and public company experience.
Director—Christopher B. Harned has been a member of our Board of Directors since 2006. Mr. Harned also served as our Vice Chairman from October 2006 to December 2010. Mr. Harned has been a Managing
70
Table of Contents
Director in the Investment Banking Group of Nomura Securities International Inc. since September 2014. Prior to joining Nomura, Mr. Harned was a Managing Director with Robert W. Baird & Co., Inc. from November 2011 through September 2014. Prior to joining Baird, Mr. Harned served as a Partner with The Cypress Group LLC from 2001 through November 2011, where he directed the firm’s investment strategy in the consumer products sector and led the investment in The Meow Mix Company. Prior to joining The Cypress Group, Mr. Harned was a Managing Director and Global Head of Consumer Products M&A at Lehman Brothers, where he worked for over 16 years, from September 1985 to November 2001. Mr. Harned currently serves on the board of directors of Quad/Graphics, Inc., a global printer and media channel integrator, and bswift, LLC, a human resources and employee benefits software-as-a-service business. Mr. Harned provides the Board of Directors with expertise in the consumer products sector, the capital markets, public company experience and audit and finance committee experience.
Director—Robert C. King has been a member of our Board of Directors since November 2014. Mr. King served as the Chief Executive Officer of Cytosport, Inc., a sports nutrition company and maker of Muscle Milk, from July 2013 to August 2014. Prior to joining Cytosport, Mr. King was an advisor to TSG Consumer Partners, a mid-market private equity firm specializing in consumer packaged goods companies, from March 2011 to July 2013. Mr. King spent 21 years in the North America Pepsi system, from 1989 to 2010, including serving as Executive Vice President and President of North America for Pepsi Bottling Group from 2008 to his retirement in 2010, President of North America for Pepsi Bottling Group from 2006 to 2008, President of Field Bottling from 2005 to 2006 and Senior Vice President and General Manager for the Mid-Atlantic Business Unit from 2002 to 2005. Before joining the North America Pepsi system, Mr. King worked in various sales and marketing positions with E&J Gallo Winery from 1984 to 1989, most recently as Western Region Sales Manager, and with Procter & Gamble from 1980 to 1984, most recently as Unit Manager. Mr. King has served as non-executive chairman of the board of Gehl Foods, a Wind Point Partners firm, since 2015 and as a board member to Island Oasis Frozen Cocktail Co., Inc. since 2011. He previously served as a board member and advisor to Cytosport and Neurobrands, LLC, a producer of premium functional beverages. Mr. King provides the Board of Directors with corporate leadership, public company experience, operations expertise and more than 30 years of consumer packaged goods experience.
Director—Jonathan S. Marlow has been a member of our Board of Directors since December 2010. Mr. Marlow is a Principal at MidOcean, and has been with the firm since 2009, where he has focused on investments within the consumer sector. Prior to MidOcean, Mr. Marlow worked for Investcorp International Inc. in the private equity group from 2006 through 2008. Previously, Mr. Marlow held positions at J.F. Lehman & Company and Bear, Stearns & Co. Inc. Mr. Marlow currently serves on the board of directors of Agilex Fragrances. Mr. Marlow provides the Board of Directors with expertise in investment strategies and insight into the consumer sector.
Director—Craig D. Steeneck has been a member of our Board of Directors since November 2014. Mr. Steeneck has served as the Executive Vice President and Chief Financial Officer of Pinnacle Foods Inc. since July 2007, where he oversees the company’s financial operations, treasury, tax and information technology. From June 2005 to July 2007, Mr. Steeneck served as Executive Vice President, Supply Chain Finance and IT of Pinnacle Foods, helping to redesign the supply chain to generate savings and improved financial performance. From April 2003 to June 2005, Mr. Steeneck served as Executive Vice President, Chief Financial Officer and Chief Administrative Officer of Cendant Timeshare Resort Group (now Wyndham Worldwide), playing key roles in wide-scale organization of internal processes and staff management. From March 2001 to April 2003, Mr. Steeneck served as Executive Vice President and Chief Financial Officer of Resorts Condominiums International, a subsidiary of Cendant. From October 1999 to February 2001, he was the Chief Financial Officer of International Home Foods Inc. Mr. Steeneck is also a Certified Public Accountant in the State of New Jersey. Mr. Steeneck provides the Board of Directors with extensive management experience in the consumer packaged goods industry as well as accounting and financial expertise.
CFO—Richard Kassar has served as Chief Financial Officer since January 2011. He previously served as our Chief Executive Officer from July 2006 to January 2011 and as President from January 2011 to June 2014. Mr. Kassar has acted as our principal financial and accounting officer since 2006. Prior to joining Freshpet, he
71
Table of Contents
was Senior Vice President and Chief Financial Officer of The Meow Mix Company until its sale to Del Monte Foods in 2006. From 1999 to 2001, he served as Co-President and Chief Financial Officer of Global Household Brands. From 1986 to 1999, Mr. Kassar was employed by Chock Full O’ Nuts in various positions and most recently served as Senior Vice President, Chief Operating Officer and Corporate Controller. Mr. Kassar has been a director of World Fuel Services Corporation since 2002. Mr. Kassar has over 20 years’ experience in the consumer brands industry.
CMO & Co-Founder—Scott Morris is a co-founder of Freshpet and has served as Senior Vice President of Sales and Marketing from 2010 to 2013 and Chief Marketing Officer since January 2014. Mr. Morris is involved in all aspects of Company development and day-to-day operations. Prior to joining Freshpet, Mr. Morris was Vice President of Marketing at The Meow Mix Company from 2002 to 2006. Previously, Mr. Morris worked at Ralston Purina from 1990 to 2002, holding various leadership positions in Sales and Marketing, most recently Pet Food Group Director. Mr. Morris founded The Freshpet Foundation, a 501(c)(3) non-profit charitable organization. He has over 20 years’ experience in consumer packaged goods sales, management and marketing.
SVP Cooler Operations & Co-Founder—Cathal Walsh is a co-founder of Freshpet and has served as Senior Vice President of Cooler Operations since January 2011 and previously served as our Chief Operating Officer from October 2006 to January 2011. Prior to joining Freshpet, Mr. Walsh was Zone Marketing Manager at Nestlé Worldwide from 2000 to 2005 and was Marketing Manager at Nestlé Pet Care from 1996 to 2000. Mr. Walsh has over 16 years’ experience in packaged goods marketing, sales and management, including in international food markets.
SVP Manufacturing Operations—Michael Hieger has served as Senior Vice President of Manufacturing Operations since January 2014. Mr. Hieger was Vice President of Manufacturing Operations from 2007 to 2013. In addition to plant-wide day-to-day activities, he is involved in new product development and co-manufacturing operations. Prior to joining Freshpet, Mr. Hieger focused on dry pet food extrusion as the Engineering Manager with The Meow Mix Company from 2002 to 2006 and as the Pet Treats Manager with Ralston Purina from 1997 to 2002. Mr. Hieger has over 17 years’ experience in pet food manufacturing.
SVP, Controller & Secretary—Stephen Macchiaverna has served as Senior Vice President, Controller and Secretary since October 2006. Prior to joining Freshpet, Mr. Macchiaverna was the Controller for The Meow Mix Company from its inception in 2002 through its sale and transition to Del Monte Foods in 2006. From 1999 to 2001, he was the Vice President of Finance and Treasurer of Virgin Drinks USA, Inc. Mr. Macchiaverna began his consumer packaged goods career with First Brands Corporation, where he worked from 1986 to 1999, most recently as Divisional Controller for all domestic subsidiaries. He has over 25 years’ experience in consumer packaged goods financial management.
SVP Sales—Thomas Farina has served as Senior Vice President of Sales since January 2013 and as our Eastern Region Vice President from 2006 to 2013. Before joining Freshpet, Mr. Farina worked as Eastern Region Vice President at The Meow Mix Company from 2001 to 2006. From 1989 to 1995, Mr. Farina held various positions with American Home Food Products and after its sale, he worked in various positions at International Home Foods from 1996 to 2000, including Regional Vice President. Mr. Farina has over 25 years’ experience in consumer packaged goods.
VP Marketing—Kathryn Winstanley has served as Vice President of Marketing since 2006. Prior to joining Freshpet, Ms. Winstanley was a Senior Brand Manager at The Meow Mix Company from 2004 to 2006 and was a Brand Manager at Snapple Beverage Group from 2001 to 2003. She has over 13 years’ experience in consumer packaged goods marketing and management.
Family Relationships
There are no family relationships among any of our directors or executive officers.
72
Table of Contents
Corporate Governance and Board Structure
In accordance with our Certificate of Incorporation and Bylaws, our Board of Directors consists of 10 members and is divided into three classes with staggered three-year terms. At each annual general meeting of stockholders, the successors to directors whose terms then expire will be elected to serve from the time of election and qualification until the third annual meeting following election. The authorized number of directors may be changed by resolution of the Board of Directors. Vacancies on the Board of Directors can be filled by resolution of the Board of Directors. Mr. Norris serves as the Chairman of our Board of Directors. We believe that each of the members of our Board of Directors except Mr. Thompson is independent consistent with the rules of Nasdaq. Mr. Harned, Mr. Brewster and Mr. King are the Class I directors and their terms will expire in 2015. Mr. Basto, Mr. George, Mr. Steeneck and Mr. Coben are the Class II directors and their terms will expire in 2016. Mr. Norris, Mr. Marlow and Mr. Thompson are the Class III directors and their terms will expire in 2017. The division of our Board of Directors into three classes with staggered three-year terms may delay or prevent a change of our management or a change in control.
Mr. Norris serves as a managing member of Freshpet Investors LLC, Mr. Harned and Mr. Coben are investors in Freshpet Investors LLC and Mr. Marlow serves as a principal of MidOcean. See “Principal and Selling Stockholders” and “Certain Relationships and Related Party Transactions—Stockholders Agreement.”
Board Committees
Our Board of Directors has three standing committees: an Audit Committee, a Nominating and Corporate Governance Committee and a Compensation Committee. Each of the committees reports to the Board of Directors as they deem appropriate, and as the Board of Directors may request. The composition, duties and responsibilities of these committees are set forth below. In the future, our Board of Directors may establish other committees, as it deems appropriate, to assist it with its responsibilities.
Audit Committee
The Audit Committee is responsible for, among other matters: (1) appointing, compensating, retaining, evaluating, terminating and overseeing our independent registered public accounting firm; (2) discussing with our independent registered public accounting firm their independence from management; (3) reviewing with our independent registered public accounting firm the scope and results of their audit and the audit fee; (4) approving all audit and permissible non-audit services to be performed by our independent registered public accounting firm, including taking into consideration whether the independent auditor’s provision of any non-audit services to us is compatible with maintaining the independent auditor’s independence; (5) overseeing the financial reporting process and discussing with management and our independent registered public accounting firm the interim and annual consolidated financial statements that we file with the SEC; (6) reviewing and monitoring our accounting principles, accounting policies, financial and accounting controls and compliance with legal and regulatory requirements; (7) establishing procedures for the confidential anonymous submission of concerns regarding questionable accounting, internal controls or auditing matters; (8) reviewing and approving related person transactions; (9) annually reviewing the Audit Committee charter and the committee’s performance; and (10) handling such other matters that are specifically delegated to the Audit Committee by our Board of Directors from time to time.
Our Audit Committee consists of Mr. Steeneck (chair), Mr. Harned and Mr. Basto. Our Board of Directors has affirmatively determined that Mr. Steeneck, Mr. Harned, and Mr. Basto meet the definition of “independent directors” for purposes of serving on an Audit Committee under applicable SEC and Nasdaq rules. In addition, Mr. Steeneck qualifies as our “audit committee financial expert,” as such term is defined in Item 407 of Regulation S-K.
Our Board of Directors adopted a written charter for the Audit Committee, which is available on our corporate website at www.freshpet.com. Our website is not part of this prospectus.
73
Table of Contents
Nominating and Corporate Governance Committee
The nominating and corporate governance committee is responsible for developing and recommending to the Board of Directors criteria for identifying and evaluating candidates for directorships and making recommendations to the Board of Directors regarding candidates for election or reelection to the Board of Directors at each annual stockholders’ meeting. In addition, the nominating and corporate governance committee is responsible for overseeing our corporate governance guidelines and reporting and making recommendations to the Board of Directors concerning corporate governance matters. The nominating and corporate governance committee is also responsible for making recommendations to the Board of Directors concerning the structure, composition and function of the Board of Directors and its committees.
Our Nominating and Corporate Governance Committee consists of Mr. Coben (chair), Mr. George and Mr. King. Our Board of Directors has affirmatively determined that Mr. Coben, Mr. George and Mr. King meet the definition of “independent directors” for purposes of serving on a Nominating and Corporate Governance Committee under applicable SEC and Nasdaq rules.
Our Board of Directors adopted a written charter for the Nominating and Corporate Governance Committee, which is available on our corporate website at www.freshpet.com. The information contained on our website does not constitute a part of this prospectus.
Compensation Committee
The Compensation Committee is responsible for, among other matters: (1) reviewing key employee compensation goals, policies, plans and programs; (2) reviewing and approving the compensation of our directors, chief executive officer and other executive officers; (3) reviewing and approving employment agreements and other similar arrangements between us and our executive officers; and (4) administering our stock plans and other incentive compensation plans.
Our Compensation Committee consists of Mr. Marlow (chair), Mr. Brewster, Mr. Harned and Mr. King. Our Board of Directors has affirmatively determined that Mr. Marlow, Mr. Brewster, Mr. Harned and Mr. King meet the definition of “independent directors” for purposes of serving on a Compensation Committee under applicable SEC and Nasdaq rules.
Our Board of Directors adopted a new written charter for the Compensation Committee, which is available on our corporate website at www.freshpet.com. The information contained on our website does not constitute a part of this prospectus.
Risk Oversight
Our Board of Directors is currently responsible for overseeing our risk management process. The Board of Directors focuses on our general risk management strategy and the most significant risks facing us and ensures that appropriate risk mitigation strategies are implemented by management. The Board of Directors is also apprised of particular risk management matters in connection with its general oversight and approval of corporate matters and significant transactions.
Our Board of Directors does not have a standing risk management committee, but rather administers this oversight function directly through our Board of Directors as a whole, as well as through various standing committees of our Board of Directors that address risks inherent in their respective areas of oversight. In particular, our Board of Directors is responsible for monitoring and assessing strategic risk exposure, our Audit Committee is responsible for overseeing our major financial risk exposures and the steps our management has taken to monitor and control these exposures and our Compensation Committee assesses and monitors whether any of our compensation policies and programs has the potential to encourage unnecessary risk-taking. In addition, our Audit Committee oversees the performance of our internal audit function and considers and approves or disapproves any related-party transactions.
74
Table of Contents
Our management is responsible for day-to-day risk management. This oversight includes identifying, evaluating, and addressing potential risks that may exist at the enterprise, strategic, financial, operational, compliance and reporting levels.
Risk and Compensation Policies
Prior to the completion of this offering, we intend to analyze our compensation programs and policies to determine whether those programs and policies are reasonably likely to have a material adverse effect on us.
Leadership Structure of the Board of Directors
The positions of Chairman of the Board and Chief Executive Officer are presently separated. We believe that separating these positions allows our Chief Executive Officer to focus on our day-to-day business, while allowing the Chairman of the Board to lead the Board of Directors in its fundamental role of providing advice to and independent oversight of management. Our Board of Directors recognizes the time, effort and energy that the Chief Executive Officer is required to devote to his position in the current business environment, as well as the commitment required to serve as our Chairman, particularly as the Board of Directors’ oversight responsibilities continue to grow. While our Bylaws and corporate governance guidelines do not require that our Chairman and Chief Executive Officer positions be separate, our Board of Directors believes that having separate positions is the appropriate leadership structure for us at this time and demonstrates our commitment to good corporate governance.
Compensation Committee Interlocks and Insider Participation
None of the members of the Compensation Committee is or has been an executive officer or employee of the Company, nor did they have any relationships requiring disclosure by the Company under Item 404 of Regulation S-K. None of our executive officers served as a director or a member of a compensation committee (or other committee serving an equivalent function) of any other entity, an executive officer of which served as one of our directors or a member of the Compensation Committee during 2014.
Code of Ethics
We adopted a written General Code of Ethics (“General Code”) which applies to all of our directors, officers and other employees, including our principal executive officer, principal financial officer and controller. In addition, we adopted a written Code of Ethics for Executive Officers and Principal Accounting Personnel (“Code of Ethics”) which applies to our principal executive officer, principal financial officer, controller and other designated members of our management. Copies of each code are available on our corporate website www.freshpet.com. The information contained on our website does not constitute a part of this prospectus. We will provide any person, without charge, upon request, a copy of our General Code or Code of Ethics. Such requests should be made in writing to the attention of our Corporate Secretary at the following address: Freshpet, Inc., 400 Plaza Drive, 1st Floor, Secaucus, New Jersey 07094.
75
Table of Contents
This section describes the material elements of compensation awarded to, earned by each of our named executive officers (the “NEOs”) in fiscal 2014. Our NEOs for 2014 are Richard Thompson, who served as our Chief Executive Officer during 2014, Scott Morris, who served as our Chief Marketing Officer during 2014, and Richard Kassar, who served as our Chief Financial Officer during 2014. This section also provides qualitative information regarding the manner and context in which compensation is awarded to and earned by our executive officers and is intended to place in perspective the data presented in the tables and narrative that follow.
Compensation Philosophy and Objectives
Our compensation philosophy is to align executive compensation with the interests of our stockholders by basing certain compensation decisions on financial objectives that our Board of Directors believes are primary determinants of long-term stockholder value. An important goal of our executive compensation program is to ensure that we hire and retain talented and experienced executives who are motivated to achieve or exceed our short-term and long-term corporate goals. Our executive compensation programs are designed to reinforce a strong pay-for-performance orientation and to serve the following purposes:
| • | to reward our NEOs for sustained financial and operating performance and leadership excellence; |
| • | to align their interests with those of our stockholders; and |
| • | to encourage our NEOs to remain with us for the long-term. |
Elements of Compensation
Base Salary
We pay our NEOs a base salary based on the experience, skills, knowledge and responsibilities required of each officer. We believe base salaries are an important element in our overall compensation program because base salaries provide a fixed element of compensation that reflects job responsibilities and value to us. In 2014, we paid base salaries of $450,000 to Mr. Thompson, $325,000 to Mr. Morris and $275,000 to Mr. Kassar. None of our NEOs is currently party to an employment agreement or other agreement or arrangement that provides for automatic or scheduled increases in base salary. Base salaries for our NEOs are determined by our full Board of Directors at its sole discretion, and no NEO has the right to automatic or scheduled increases in base salary.
Annual Incentive Bonuses
Through the completion of fiscal year 2014, our Board of Directors had not adopted a formal plan or set of formal guidelines with respect to annual incentive or bonus payments, and had rather relied on an annual assessment of the Company’s operating performance, including Adjusted EBITDA, as well as the performance of our executives during the preceding year to make annual incentive and bonus determinations. For 2014, the full Board of Directors determined to pay performance-based bonuses of $96,000 to Mr. Thompson, $57,600 to Mr. Morris, and $48,000 to Mr. Kassar. The performance-based bonuses, which are calculated as a percentage of base salary, are designed to motivate our employees to achieve annual goals based on our strategic, financial, and operating performance objectives. In addition, the Board of Directors determined to pay bonuses in connection with the completion of our initial public offering of $24,000 to Mr. Thompson, $34,000 to Mr. Morris, and $24,000 to Mr. Kassar. In connection with our efforts to formalize our compensation practices, our Board of Directors adopted an annual incentive plan, in which our NEOs are eligible to participate beginning in fiscal year 2015. Our Board of Directors retained the discretion to pay any amounts due under such incentive plan in cash or equity or a combination of both.
76
Table of Contents
Long-Term Equity Compensation
Although we do not have a formal policy with respect to the grant of equity incentive awards to our executive officers, or any formal equity ownership guidelines applicable to them, we believe that equity grants provide our executives with a strong link to our long-term performance, create an ownership culture and help to align the interests of our executives and our stockholders. In addition, we believe that equity grants with a time-based vesting feature promote executive retention because this feature incents our executive officers to remain in our employment during the vesting period. Accordingly, our Board of Directors periodically reviews the equity incentive compensation of our NEOs and from time to time may grant equity incentive awards to them in the form of stock options.
On November 7, 2014, we entered into amendments to all outstanding option agreements under the 2010 Stock Option Plan (the “2010 Plan”) with our employees, including certain of our NEOs, modifying certain of the vesting terms of the options and reducing the number of options subject to the awards. As amended, the options granted to our NEOs become vested and exercisable as follows, subject to the NEOs’ continued employment during the applicable vesting period: (i) the vesting terms of a first tranche of time-vesting options has not been amended and the options subject to such tranche became fully vested on December 31, 2014, (ii) a performance-vesting tranche of the options becomes vested and exercisable in equal installments on each of December 31, 2015 and December 31, 2016, subject to the achievement of certain annual earnings targets, and (iii) a second tranche of time-vesting options becomes vested and exercisable with respect to 40% of such options on November 7, 2015 and with respect to the remaining 60% of such options on November 7, 2016. Further, a second tranche of time-vesting options becomes fully vested upon the occurrence of a Change in Control (as defined in the 2010 Plan) and the performance-vesting tranche becomes fully vested if a Change in Control occurs on or before December 31, 2016, subject to the Change in Control per share price of the Company’s common stock being equal to or in excess of $21.30 per share.
In connection with our initial public offering, we adopted a new equity incentive plan in 2014, our 2014 Omnibus Incentive Plan (the “2014 Plan”). In 2014, we granted our NEOs options to purchase shares of our common stock under the 2014 Plan, 50% of which become vested and exercisable in equal installments on each of the first three anniversaries of the date of grant and 50% of which become vested and exercisable based on the achievement of certain earnings targets during years 2015, 2016 and 2017, subject to the NEOs’ continued employment through the applicable vesting dates. We expect that future awards will be made under the 2014 Plan. For additional detail regarding the 2014 Plan, please see the “Stock Option and Other Compensation Plans” section below.
Other Supplemental Benefits
Our NEOs are eligible for the following benefits on a similar basis as other eligible employees:
| • | health, dental and vision insurance; |
| • | vacation, personal holidays and sick days; |
| • | life insurance and supplemental life insurance; and |
| • | short-term and long-term disability. |
401(k) Retirement Plan
Additionally, we maintain a 401(k) retirement savings plan (the “401(k) Plan”) that is intended to be a tax-qualified defined contribution plan under Section 401(k) of the Internal Revenue Code. In general, all of our employees are eligible to participate, beginning on the first day of the month following commencement of their employment. The 401(k) Plan includes a salary deferral arrangement pursuant to which a participant may elect to reduce his or her current compensation by up to the statutorily prescribed limit, equal to $17,500 in 2014, and have the amount of the reduction contributed to his or her 401(k) Plan. Currently, we match contributions made
77
Table of Contents
by participants in the 401(k) Plan up to 4% of the employee’s annual eligible earnings. We believe that providing a vehicle for tax-deferred retirement savings through our 401(k) Plan, and making matching contributions, adds to the overall desirability of our executive compensation package and further incentivizes our employees, including our NEOs, in accordance with our compensation policies.
We do not maintain any pension plans or non-qualified deferred compensation plans for the benefit of our employees or other service providers.
Summary Compensation Table
The following table sets forth information regarding compensation awarded to, earned by or paid to our NEOs during 2013 and 2014.
| Name and principal position |
Year | Salary ($)(1) |
Bonus ($)(2) |
Option Awards ($)(3) |
Non-Equity Incentive Plan Compensation ($)(4) |
All Other Compensation ($)(5) |
Total ($) | |||||||||||||||||||||
| Richard Thompson(6) |
2014 | 405,231 | 24,000 | 2,561,289 | 96,000 | 15,313 | 3,101,833 | |||||||||||||||||||||
| Chief Executive Officer |
2013 | 400,000 | — | — | — | 18,625 | 418,625 | |||||||||||||||||||||
| Scott Morris |
2014 | 329,225 | 34,000 | 588,548 | 57,600 | 30,785 | 1,040,158 | |||||||||||||||||||||
| Chief Marketing Officer |
2013 | 282,692 | — | — | 35,000 | 34,155 | 351,847 | |||||||||||||||||||||
| Richard Kassar Chief Financial Officer |
2014 | 252,469 | 24,000 | 443,549 | 48,000 | 25,257 | 793,275 | |||||||||||||||||||||
| (1) | Salaries for fiscal years 2014 and 2013 do not reflect amounts deferred under the Company’s 401(k) Plan. |
| (2) | The amounts in this column represent cash bonuses granted in connection with the completion of our initial public offering. |
| (3) | The amounts in this column reflect the aggregate grant date fair value of each option award granted during fiscal year 2014 and the incremental fair value of the modifications to option awards granted on January 1, 2011 described above under the caption entitled “Long-Term Equity Compensation” and the table below entitled “Outstanding Equity Awards at December 31, 2014”. The amounts shown were computed in accordance with FASB ASC Topic 718 and are based on the valuation assumptions described in Note 12 to our consolidated financial statements included in this prospectus. Mr. Thompson’s granted and modified option awards in 2014 were $841,889, and $1,719,400, respectively. Mr. Morris’ granted and modified option awards in 2014 were $325,728, and $262,820, respectively and Mr. Kassar’s granted and modified option awards in 2014 were $275,618, and $167,932, respectively. In 2013, we did not grant any of our NEOs options to purchase shares of our common stock. |
| (4) | The amounts reported in the “Non-Equity Incentive Plan Compensation” column represent awards of performance-based annual bonuses to our NEOs. |
| (5) | The compensation included in the “All Other Compensation” column consists of the 401(k) company matching contributions made for each of our NEOs and premiums we paid with respect to each of our NEOs for (a) medical, dental and vision insurance, (b) personal accident insurance, (c) life insurance, (d) long-term disability insurance, (e) short-term disability insurance, and (f) fees related to an education assistance program. |
| (6) | Mr. Thompson also serves as a member of our Board of Directors but does not receive any additional compensation for his service as a director. |
78
Table of Contents
Outstanding Option Awards at December 31, 2014
The following table sets forth information regarding outstanding stock options held by our NEOs as of December 31, 2014:
| Name |
Number of Securities Underlying Unexercised Options Exercisable |
Number of Securities Underlying Unexercised Options Unexercisable(1)(2) |
Option Exercise Price (Per Share)($) |
Option Expiration Date |
||||||||||||
| Richard Thompson |
— | 132,138 | 15.00 | 11/06/2024 | ||||||||||||
| 355,102 | 542,757 | (3) | 7.10 | 12/31/2020 | ||||||||||||
| Scott Morris |
— | 51,124 | 15.00 | 11/06/2024 | ||||||||||||
| 21,374 | 78,808 | (3) | 7.10 | 12/31/2020 | ||||||||||||
| 22,316 | — | 6.28 | 12/03/2016 | |||||||||||||
| Richard Kassar |
— | 43,260 | 15.00 | 11/06/2024 | ||||||||||||
| 15,125 | 50,539 | (3) | 7.10 | 12/31/2020 | ||||||||||||
| 23,676 | — | 8.87 | 02/29/2020 | |||||||||||||
| 22,315 | — | 6.28 | 12/03/2016 | |||||||||||||
| (1) | The unvested time based options vest annually in approximately equal amounts through 2017. |
| (2) | The unvested performance options vest annually based on targets. |
| (3) | Pursuant to an amendment to the NEOs’ option agreement on November 7, 2014, the indicated unvested time based options vest annually through 2016 and the indicated unvested performance options vest annually based on the achievement of certain earnings targets in years 2015 and 2016. |
Employment Agreements with Named Executive Officers
The Company has entered into employment agreements with each of Mr. Thompson, Mr. Morris and Mr. Kassar. The employment agreements provide for an initial term of one year and are subject to automatic one-year extensions beginning on the expiration of the initial term. The automatic extension of the employment agreements may be terminated with at least 90 days’ prior written notice from the executive or the Company stating the intent not to extend the employment term. Under the employment agreements, Mr. Thompson, Mr. Morris and Mr. Kassar are entitled to receive minimum annual base salaries of $450,000, $325,000 and $275,000, respectively, subject to annual review by the Company’s board of directors, and have the opportunity to participate in the Company’s equity incentive programs. Mr. Thompson, Mr. Morris and Mr. Kassar have the opportunity to earn an annual target bonus equal to at least 75%, 50% and 50%, respectively, of their base salary. Each executive is also entitled to participate in the Company’s employee and fringe benefit plans as may be in effect from time to time on the same basis as other employees of the Company generally.
Under the employment agreements, in the event of the executive’s termination of employment without “cause,” with “good reason” or due to “permanent disability” (each as defined in the employment agreements), the executive generally is entitled to receive, subject to the executive’s timely execution of a general release of claims: (i) any unpaid base salary and bonuses through the date of termination, (ii) an amount equal to the annual base salary, payable in equal monthly installments over the twelve-month period following such termination, and (iii) continued health and fringe benefits for a period of twelve months following such termination. In addition, in the event of the executive’s termination of employment without “cause” or with “good reason,” the executive generally is entitled to receive a pro-rated annual performance-based bonus for the year in which termination occurs, provided such termination occurs after June 30th of the applicable year.
The employment agreements contain a non-competition covenant that prohibits the executive from competing against the Company for a period of one year following termination of employment. The new employment agreements also contain non-solicitation provisions that prohibit the executives from actively soliciting the Company’s employees, customers or suppliers during the period of employment and for a period of one year following termination of employment. The executives are also subject to perpetual confidentiality restrictions that protect the Company’s proprietary information, developments and other intellectual property.
79
Table of Contents
Stock Option and Other Compensation Plans
2006 Stock Incentive Plan
The 2006 Stock Incentive Plan (the “2006 Plan”) was adopted by our Board of Directors and approved by our stockholders in October 2006. The 2006 Plan provided for the grant of incentive stock options, nonstatutory stock options, restricted stock awards, restricted stock unit awards, stock appreciation rights and other stock-based awards to our employees, officers, directors, consultants and advisors. As of December 31, 2014, there were options to purchase 440,689 shares of our common stock outstanding under the 2006 Plan, at a weighted average exercise price of $6.41 per share, and options to purchase 21,421 shares of our common stock had been exercised. The 2006 Plan was terminated in December 2010 and no awards have been granted under the 2006 Plan since such termination, however, any award outstanding under the 2006 Plan at the time of the termination will remain in effect until such award is exercised or has expired in accordance with its terms.
2010 Stock Option Plan
The 2010 Plan was adopted by our Board of Directors and approved by our stockholders in December 2010. The 2010 Plan provided for the grant of incentive stock options and nonstatutory stock options to our employees, officers, directors, consultants and advisors. As of December 31, 2014, there were options to purchase 1,979,756 shares of our common stock outstanding under the 2010 Plan, at a weighted average exercise price of $7.10 per share, and no options to purchase shares of our common stock had been exercised. The 2010 Plan was terminated in March 2014 and no awards have been granted under the 2010 Plan since such termination, however, any award outstanding under the 2010 Plan at the time of the termination will remain in effect until such award is exercised or has expired in accordance with its terms.
2014 Omnibus Incentive Plan
The 2014 Plan was adopted by our Board of Directors and approved by our stockholders on October 2, 2014 in connection with our initial public offering. The 2014 Plan provides for grants of stock options, stock appreciation rights, restricted stock, other stock-based awards and other cash-based awards to our directors, officers, employees, consultants and advisors. The aggregate number of shares of common stock which may be issued or used for reference purposes under the 2014 Plan or with respect to which awards may be granted may not exceed 1,479,200 shares. As of December 31, 2014, there were options to purchase 511,170 shares of our common stock outstanding under the 2014 Plan, at a weighted average exercise price of $15.00 per share, and no options to purchase shares of our common stock had been exercised.
Limitations on Liability and Indemnification
Our Certificate of Incorporation, which became effective upon the closing of our initial public offering, limits the personal liability of directors for breach of fiduciary duty to the maximum extent permitted by the DGCL and provides that no director will have personal liability to us or to our stockholders for monetary damages for breach of fiduciary duty or other duty as a director. However, these provisions do not eliminate or limit the liability of any of our directors:
| • | for any breach of the director’s duty of loyalty to us or our stockholders; |
| • | for acts or omissions not in good faith or that involve intentional misconduct or a knowing violation of law; |
| • | for voting for or assenting to unlawful payments of dividends, stock repurchases or other distributions; or |
| • | for any transaction from which the director derived an improper personal benefit. |
80
Table of Contents
Any amendment to or repeal of these provisions will not eliminate or reduce the effect of these provisions in respect of any act, omission or claim that occurred or arose prior to such amendment or repeal. If the DGCL is amended to provide for further limitations on the personal liability of directors of corporations, then the personal liability of our directors will be further limited to the greatest extent permitted by the DGCL.
In addition, our Certificate of Incorporation, which became effective upon the closing of our initial public offering, provides that we must indemnify our directors and officers and we must advance expenses, including attorneys’ fees, to our directors and officers in connection with legal proceedings, subject to very limited exceptions.
We maintain a general liability insurance policy that covers certain liabilities of our directors and officers arising out of claims based on acts or omissions in their capacities as directors or officers. In addition, we have entered into indemnification agreements with our directors. These indemnification agreements may require us, among other things, to indemnify each such director for some expenses, including attorneys’ fees, judgments, fines and settlement amounts incurred by him in any action or proceeding arising out of his service as one of our directors.
Certain of our non-employee directors may, through their relationships with their employers, be insured and/or indemnified against certain liabilities incurred in their capacity as members of our Board of Directors.
Rule 10b5-1 Sales Plans
Our directors and executive officers may adopt written plans, known as Rule 10b5-1 plans, in which they will contract with a broker to buy or sell shares of our common stock on a periodic basis. Under a Rule 10b5-1 plan, a broker executes trades pursuant to parameters established by the director or officer when entering into the plan, without further direction from the director or officer. It also is possible that the director or officer could amend or terminate the plan when not in possession of material, nonpublic information. In addition, our directors and executive officers may buy or sell additional shares outside of a Rule 10b5-1 plan when they are not in possession of material, nonpublic information.
Director Compensation
Our non-employee directors are compensated for their services on our Board of Directors as follows:
| • | each non-employee director receives an annual fee of $75,000 ($37,500 in cash plus an equity grant equal to $37,500) except for the Chairman of the Board who receives an annual fee of $125,000 ($62,500 in cash plus an equity grant equal to $62,500); |
| • | the Chairman of the Audit Committee receives an additional annual fee of $10,000; |
| • | the Chairman of the Compensation Committee receives an additional annual fee of $5,000; and |
| • | the Chairman of the Nominating and Corporate Governance Committee receives an additional annual fee of $5,000. |
During fiscal 2014, our directors received compensation for their services on our Board of Directors from November 7, 2014 (the date of our initial public offering) through the end of the fiscal year on a pro-rata basis.
Each annual fee is payable in arrears in four equal quarterly installments on the last day of each quarter, provided that the amount of each payment will be prorated for any portion of a quarter that a director is not serving on our board.
Each member of our Board of Directors is also entitled to reimbursement for reasonable travel and other expenses incurred in connection with attending meetings of the Board of Directors and any committee of the Board of Directors on which he or she serves.
81
Table of Contents
Prior to our initial public offering, we did not pay cash retainers or provided other forms of compensation such as non-equity awards, equity awards or perquisites, with respect to service on our Board of Directors. We have historically reimbursed our directors for reasonable travel and other expenses incurred in connection with attending meetings of the Board of Directors.
82
Table of Contents
PRINCIPAL AND SELLING STOCKHOLDERS
The following table shows information about the beneficial ownership of our common stock, as of April 23, 2015, by:
| • | each stockholder selling shares in this offering; |
| • | each person known by us to beneficially own 5% or more of our outstanding common stock; |
| • | each of our directors and executive officers; and |
| • | all of our directors and executive officers as a group. |
For further information regarding material transactions between us and certain of our stockholders, see “Certain Relationships and Related Party Transactions.”
The numbers listed below are based on 33,470,732 shares of our common stock outstanding as of April 23, 2015. Unless otherwise indicated, the address of each individual listed in this table is c/o Freshpet, Inc., 400 Plaza Drive, 1st Floor, Secaucus, New Jersey 07094.
| Name and Address of Beneficial Owner(1) |
Common stock owned before the offering |
Shares Being Offered (no option) |
Common stock owned after the offering (no option exercise) |
Shares Being Offered (full option) |
Common stock owned after the offering (full option exercise) |
|||||||||||||||||||||||||||
| Number | Percentage | Number | Percentage | Number | Percentage | |||||||||||||||||||||||||||
| Principal Stockholders: |
||||||||||||||||||||||||||||||||
| MidOcean(2) |
8,691,000 | 26.0 | % | 1,521,739 | 7,169,261 | 21.4 | % | 1,750,000 | 6,941,000 | 20.7 | % | |||||||||||||||||||||
| Freshpet Investors LLC(3) |
6,293,255 | 18.8 | % | 2,165,365 | 4,127,890 | 12.3 | % | 2,490,170 | 3,803,085 | 11.4 | % | |||||||||||||||||||||
| Executive Officers and Directors: |
||||||||||||||||||||||||||||||||
| Charles A. Norris(4) |
6,421,701 | 19.2 | % | — | 4,256,336 | 12.7 | % | — | 3,931,531 | 11.7 | % | |||||||||||||||||||||
| Richard Thompson(5) |
841,744 | 2.5 | % | 44,182 | 797,562 | 2.4 | % | 50,808 | 790,936 | 2.4 | % | |||||||||||||||||||||
| J. David Basto |
5,833 | * | — | 5,833 | * | — | 5,833 | * | ||||||||||||||||||||||||
| Daryl G. Brewster |
38,745 | * | — | 38,745 | * | — | 38,745 | * | ||||||||||||||||||||||||
| Lawrence S. Coben |
8,135 | * | — | 8,135 | * | — | 8,135 | * | ||||||||||||||||||||||||
| Walter N. George III |
19,167 | * | — | 19,167 | * | — | 19,167 | * | ||||||||||||||||||||||||
| Christopher B. Harned |
2,500 | * | — | 2,500 | * | — | 2,500 | * | ||||||||||||||||||||||||
| Robert C. King |
12,500 | * | — | 12,500 | * | — | 12,500 | * | ||||||||||||||||||||||||
| Jonathan S. Marlow |
— | — | — | — | — | — | — | — | ||||||||||||||||||||||||
| Craig D. Steeneck |
19,167 | * | — | 19,167 | * | — | 19,167 | * | ||||||||||||||||||||||||
| Richard Kassar(6) |
276,410 | * | 26,348 | 250,062 | * | 30,300 | 246,110 | * | ||||||||||||||||||||||||
| Scott Morris(7) |
314,341 | * | 45,439 | 268,902 | * | 52,255 | 262,086 | * | ||||||||||||||||||||||||
| Cathal Walsh |
178,039 | * | 31,474 | 146,565 | * | 36,195 | 141,844 | * | ||||||||||||||||||||||||
| Michael Hieger |
34,784 | * | 972 | 33,812 | * | 1,118 | 33,666 | * | ||||||||||||||||||||||||
| Stephen Macchiaverna |
107,586 | * | 8,739 | 98,847 | * | 10,050 | 97,536 | * | ||||||||||||||||||||||||
| Thomas Farina |
122,992 | * | 13,043 | 109,949 | * | 15,000 | 107,992 | * | ||||||||||||||||||||||||
| Kathryn Winstanley |
31,575 | * | — | 31,575 | * | — | 31,575 | * | ||||||||||||||||||||||||
| Executive Officers and Directors as a Group (17 persons) |
8,435,219 | 24.7 | % | 170,197 | 6,099,657 | 18.2 | % | 195,726 | 5,749,323 | 17.2 | % | |||||||||||||||||||||
83
Table of Contents
| Name and Address of Beneficial Owner |
Common stock owned before the offering |
Shares Being Offered (no option) |
Common stock owned after the offering (no option exercise) |
Shares Being Offered (full option) |
Common stock owned after the offering (full option exercise) |
|||||||||||||||||||||||||||
| Number | Percentage | Number | Percentage | Number | Percentage | |||||||||||||||||||||||||||
| Other Selling Stockholders: |
||||||||||||||||||||||||||||||||
| John Phelps |
578,728 | 1.7 | % | 413,357 | 165,371 | * | 475,360 | 103,368 | * | |||||||||||||||||||||||
| The Gibney Family Trust(8) |
443,693 | 1.3 | % | 195,652 | 248,041 | * | 225,000 | 218,693 | * | |||||||||||||||||||||||
| Vital Petfoods Pty LTD(9) |
238,898 | * | 207,737 | 31,161 | * | 238,898 | — | * | ||||||||||||||||||||||||
| Michael Larney |
199,941 | * | 69,565 | 130,376 | * | 80,000 | 119,941 | * | ||||||||||||||||||||||||
| Brett Duewell(10) |
141,630 | * | 18,474 | 123,156 | * | 21,245 | 120,385 | * | ||||||||||||||||||||||||
| Joseph Tuza |
101,415 | * | 65,218 | 36,197 | * | 75,000 | 26,415 | * | ||||||||||||||||||||||||
| City National Corporation(11) |
96,883 | * | 84,246 | 12,637 | * | 96,883 | — | * | ||||||||||||||||||||||||
| Kristen Thompson |
92,498 | * | 43,478 | 49,020 | * | 50,000 | 42,498 | * | ||||||||||||||||||||||||
| Vir Narula(12) |
62,267 | * | 22,841 | 39,426 | * | 26,267 | 36,000 | * | ||||||||||||||||||||||||
| Kent Hemphill |
57,335 | * | 30,435 | 26,900 | * | 35,000 | 22,335 | * | ||||||||||||||||||||||||
| Kristin Hetzel |
57,335 | * | 49,857 | 7,478 | * | 57,335 | — | * | ||||||||||||||||||||||||
| Susie Wright(10) |
53,383 | * | 23,478 | 29,905 | * | 27,000 | 26,383 | * | ||||||||||||||||||||||||
| Craig Kallach(10) |
46,449 | * | 6,087 | 40,362 | * | 7,000 | 39,449 | * | ||||||||||||||||||||||||
| Kent Quinn |
31,853 | * | 27,698 | 4,155 | * | 31,853 | — | * | ||||||||||||||||||||||||
| Additional Selling Stockholders as a Group(13) |
304,871 | * | 197,927 | 106,944 | * | 227,616 | 77,255 | * | ||||||||||||||||||||||||
| * | Less than 1% |
| (1) | A “beneficial owner” of a security is determined in accordance with Rule 13d-3 under the Exchange Act and generally means any person who, directly or indirectly, through any contract, arrangement, understanding, relationship, or otherwise, has or shares: |
| • | voting power which includes the power to vote, or to direct the voting of, such security; and/or |
| • | investment power which includes the power to dispose, or to direct the disposition of, such security. |
Unless otherwise indicated, each person named in the table above has sole voting and investment power, or shares voting and investment power with his spouse (as applicable), with respect to all shares of stock listed as owned by that person. Shares issuable upon the exercise of options exercisable on April 23, 2015 or within 60 days thereafter are considered outstanding and to be beneficially owned by the person holding such options for the purpose of computing such person’s percentage beneficial ownership, but are not deemed outstanding for the purposes of computing the percentage of beneficial ownership of any other person. The address of our executive officers is 400 Plaza Drive, 1st Floor, Secaucus, New Jersey 07094.
| (2) | Includes 5,373,530 shares of common stock held by MidOcean Partners III, L.P., 2,856,777 shares of common stock held by MidOcean Partners III-A, L.P. and 458,193 shares of common stock held by MidOcean Partners III-D, L.P. (collectively, the “MidOcean Entities”). MidOcean Associates, SPC by and on behalf of its Segregated Portfolio, MidOcean Partners Segregated Portfolio III (“Associates”) is the General Partner of each of the MidOcean Entities. MidOcean US Advisor, L.P. (“US Advisor”) provides investment advisory services to each of the MidOcean Entities and Associates. 2,500 shares of restricted common stock are held by US Advisor. J. Edward Virtue indirectly controls the shares of common stock held by the MidOcean Entities. Accordingly, Associates, US Advisor and Mr. Virtue may be deemed to have beneficial ownership of the shares of common stock held by the MidOcean Entities, although each of Associates, US Advisor and Mr. Virtue disclaims beneficial ownership of the shares owned of record by any other person or entity except to the extent of their pecuniary interest therein. The address for each of the MidOcean Entities, Associates, US Advisor and Mr. Virtue is 320 Park Avenue, 16th Floor, New York, New York 10022. |
| (3) | Charles A. Norris and Kayne Anderson Capital Advisors L.P. are the managing members of Freshpet Investors LLC and share voting and investment power over the shares of common stock held by Freshpet Investors LLC. Richard Kayne is the managing partner of Kayne Anderson Capital Advisors L.P. |
84
Table of Contents
| Mr. Norris, Mr. Kayne and Kayne Anderson Capital Advisors L.P. disclaim beneficial ownership of all of the shares of common stock held or controlled by Freshpet Investors LLC except to the extent of their pecuniary interest therein. |
| (4) | Includes 4,166 shares of common stock held by Mr. Norris directly, 124,279 shares of common stock held by Norris Trust dtd 6/18/02 and 6,293,255 shares of common stock held by Freshpet Investors LLC (see footnote 3). Mr. Norris disclaims beneficial ownership of all of the shares of common stock held or controlled by Freshpet Investors LLC except to the extent of his pecuniary interest therein. |
| (5) | Includes 370,930 shares of common stock held directly by Mr. Thompson and 470,814 shares of common stock held by Thompson Holdings, LLP and Thompson FP Food, LLC. Mr. Thompson has voting and investment power over the shares held of record by Thompson Holdings, LLP and Thompson FP Food, LLC. |
| (6) | Includes 255,110 shares of common stock held by Mr. Kassar directly and 21,300 shares of common stock held by Richard Kassar LLC. Mr. Kassar has voting and investment power over the shares held of record by Richard Kassar LLC. |
| (7) | Includes 291,801 shares of common stock held by Mr. Morris directly and 22,540 shares of common stock held by Morris Mutts LLC. Mr. Morris has voting and investment power over the shares held of record by Morris Mutts LLC. |
| (8) | Paul Gibney is the trustee for The Gibney Family Trust. |
| (9) | The natural person having voting or dispositive control over the shares is Christina Johnstone Quinn. |
| (10) | The selling stockholder is an employee of the Company. |
| (11) | City National Bank, a subsidiary of City National Corporation, is a lender under our current credit facility and has been a lender under our prior credit facility. In addition, City National Bank holds a warrant to purchase up to an aggregate of 61,117 shares of our common stock at a purchase price of $6.28 per share. This warrant automatically converts on October 5, 2017 without any action by the holder. See Management’s Discussion and Analysis of Financial Condition and Results of Operations—Liquidity and Capital Resources—Indebtedness and Debt Refinancing. |
| (12) | Includes 34,921 shares held by Mr. Narula and 27,346 shares held by Pension Actuarial Assoc, Inc., DBP, FBO Anisha Narula. Mr. Narula owns 48% of Pension Actuarial Assoc, Inc. and his wife, Anisha Narula, owns 52% of the company. Mr. and Mrs. Narula are the only directors of the company and are trustees of the defined benefit plan. |
| (13) | Represents shares of common stock that are held by 17 selling stockholders not listed above who, as a group, own less than 1.0% of our outstanding shares of common stock prior to this offering. Some of the selling stockholders in this group are employees of the Company. |
85
Table of Contents
CERTAIN RELATIONSHIPS AND RELATED PARTY TRANSACTIONS
Stockholders Agreement
We are party to a Second Amended and Restated Stockholders Agreement with MidOcean, Freshpet Investors LLC and certain of our other stockholders (the “Stockholders Agreement”), pursuant to which certain of the stockholders party thereto are entitled to registration rights. Stockholders holding an aggregate of 11,294,651 shares, or 33.7%, of our common stock after the completion of this offering will be entitled to registration rights pursuant to the Stockholders Agreement.
Demand Registrations
Under the Stockholders Agreement, holders of a majority of the shares subject to the agreement (the “Registrable Securities”) are able to require us to use our best efforts to file a registration statement under the Securities Act (“Demand Registration”), and we are required to notify the remaining holders of Registrable Securities in the event of such request (a “Demand Registration Request”). The holders of Registrable Securities can issue up to eight Demand Registration Requests. All eligible holders will be entitled to participate in any Demand Registration upon proper notice to us. We have certain limited rights to delay or postpone such registration.
Piggyback Registrations
Under the Stockholders Agreement, if at any time we propose or are required to register any of our equity securities under the Securities Act (other than a Demand Registration or certain excluded registrations), we will be required to notify each holder of Registrable Securities of its right to participate in such registration (a “Piggyback Registration”). We have the right to terminate or postpone any registration statement in which holders of Registrable Securities have elected to exercise Piggyback Registration rights.
Expenses of Registration
We are required to bear the registration expenses (other than underwriting discounts) incident to any registration in accordance with the Stockholders Agreement, including the reasonable fees of counsel chosen by the holders of a majority of the Registrable Securities included in the registration.
Indemnification
Under the Stockholders Agreement, we must, subject to certain limitations, indemnify each holder of Registrable Securities and its employees, partners, members, officers, directors, and stockholders of each such holder; agents, representatives, and advisors, including legal counsel and accountants for each such holder; any underwriter (as defined in the Securities Act) for each such holder; and each person, if any, who controls such holder or underwriter within the meaning of the Securities Act or the Exchange Act, against all losses, claims, damages, liabilities and expenses in certain circumstances and to pay any expenses reasonably incurred in connection with investigating and defending such losses, claims, damages, liabilities and expenses, except insofar as the same arise out of or are based upon actions or omissions made in reliance upon and in conformity with written information furnished by or on behalf of any such holder expressly for us in connection with a registration effected pursuant to the Stockholders Agreement.
Selldown Agreement
We are party to a selldown agreement with Freshpet Investors LLC pursuant to which Freshpet Investors LLC agreed for a period of 18 months from the completion of our initial public offering (the “Selldown Period”) not to offer, transfer, distribute, sell, contract to sell, pledge, grant any option to purchase, make any short sale or otherwise dispose of any shares of our common stock, or any options or warrants to purchase any shares of our
86
Table of Contents
common stock, or any securities convertible into, exchangeable for or that represent the right to receive shares of our common stock (collectively, the “applicable securities”), whether owned by Freshpet Investors LLC at the time of the completion of the offering or acquired by it thereafter. Notwithstanding the above restriction, Freshpet Investors LLC may:
| (i) | in any 90 day period (x) during the time beginning on the day that is 181 days following the completion of our initial public offering and ending on the day that is 12 months following the completion of our initial public offering, transfer up to 7.5% of the applicable securities held by it on the date of the agreement and (y) during the time beginning on the day that is 366 days following the completion of our initial public offering and ending at the conclusion of the Selldown Period transfer up to 10% of the applicable securities held by it on the date of the agreement, in each case as a distribution to its members, affiliates or any investment fund or other entity controlled or managed by it; or |
| (ii) | transfer its applicable securities pursuant to a bona fide third party tender offer, merger, consolidation or other similar transaction made to all holders of our common stock involving a change of control (as defined in the selldown agreement) of us following the completion of our initial public offering. |
In connection with this offering, we and Freshpet Investors LLC expect to enter into a waiver to the selldown agreement to permit Freshpet Investors LLC to sell shares of our common stock in this offering.
Indemnification Agreements
We have entered into indemnification agreements with each of our directors and executive officers. Each indemnification agreement provides that, subject to limited exceptions, and among other things, we will indemnify the director or executive officer to the fullest extent permitted by law for claims arising in his or her capacity as our director or officer.
Guarantee Agreement
In connection with the $62.5 Million Revolver, we entered into a Fee and Reimbursement Agreement with MidOcean, certain individuals associated with Freshpet Investors LLC (an entity related to Charles A. Norris, our Chairman of the Board of Directors), Charles A. Norris, Richard Thompson (our Chief Executive Officer), and Richard Kassar (our Chief Financial Officer), each a guarantor of a portion of the $62.5 Million Revolver. MidOcean, certain individuals associated with Freshpet Investors LLC, Charles A. Norris, Richard Thompson and Richard Kassar guaranteed $32.9 million, $24.3 million, $4.3 million, $0.3 million and $0.7 million, respectively. The agreement stipulated that we would pay each guarantor a contingent fee equal to 10% per annum of the amount that each guarantor committed to guarantee. Payments were to be made in the form of newly issued shares of Series C Preferred Stock at the price of $5.25 per share. The fee accrued only from and after the date that the guarantor entered into the guarantee, and if at any time any guarantor’s obligation is terminated in full or in part, the fee continued to accrue only with respect to the amount, if any, of such guarantor’s remaining commitment under the credit agreement governing the $62.5 Million Revolver. The fee was contingent in that it would become due and payable only if all principal and interest under the $62.5 Million Revolver was repaid and a Change of Control (as defined in the agreement) had occurred.
We used a portion of the proceeds from our initial public offering and related debt refinancing to repay the borrowings under the $62.5 Million Revolver, relieving us of future fees on the debt guarantee. In addition, all of the outstanding guarantee fees were converted into Series C Preferred Stock, which were subsequently converted into shares of common stock. As a result, MidOcean, certain individuals associated with Freshpet Investors LLC, Charles A. Norris, Mr. Thompson and Mr. Kassar were issued 1,302,408, 958,852, 168,036, 21,401, and 27,059 shares of Series C Preferred Stock, respectively, which were converted into 963,260, 709,152, 124,279, 15,828 and 20,012 shares of common stock, respectively.
Tyson Agreement
Effective January 9, 2009, we entered into a distribution agreement with Tyson Foods, Inc. (“Tyson”), which is one of our stockholders. Pursuant to the distribution agreement, Tyson agreed to perform certain
87
Table of Contents
distribution and logistical services for us. Our agreement with Tyson expires on December 31, 2015. For the years ended December 31, 2013 and 2014, we paid $6.1 million and $8.9 million, respectively, for work performed by Tyson under the agreement.
We also purchase, on an as needed basis, certain raw materials from Tyson. For the years ended December 31, 2013 and 2014, we paid $0.5 million and $0.6 million, respectively, to Tyson for raw materials provided to us.
The Stockholder Note
We issued $1.5 million of notes to certain stockholders of the Company. The Stockholder Note accrued interest compounded annually at a rate of 10%. The Stockholder Note and all accrued interest were due on December 23, 2020. Freshpet Investors LLC and Tyson held $0.6 million and $0.7 million, respectively, of the Stockholder Note. No other stockholder held an amount exceeding $120,000. We used a portion of the proceeds from our initial public offering and related debt refinancing to repay the Stockholder Note.
The Convertible Notes
We issued $2.0 million in aggregate principal amount of convertible notes on October 23, 2014 to certain stockholders. Beginning on December 7, 2014, the Convertible Notes accrued interest at a rate of 15%, compounded annually and added to the principal amount of the Convertible Notes. The Convertible Notes were issued at 98% of par and were convertible, at the option of the holder, into Series C Preferred Stock, at a price of $5.25 per share, at any time after December 31, 2014 if the Convertible Notes were outstanding at that time. The Convertible Notes would have matured on November 1, 2017.
We used a portion of the proceeds from our initial public offering and related debt refinancing to repay the Stockholder Note. MidOcean, Charles A. Norris (our Chairman of the Board) and David Shladovsky held $1.0 million, $0.5 million and $0.5 million, respectively, in aggregate principal amounts of Convertible Notes.
Procedures for Approval of Related Party Transactions
Our Board of Directors has adopted a written related party transaction policy, which sets forth the policies and procedures for the review and approval or ratification of related party transactions. This policy is administrated by our Audit Committee. These policies provide that, in determining whether or not to recommend the initial approval or ratification of a related party transaction, the relevant facts and circumstances available shall be considered, including, among other factors it deems appropriate, whether the interested transaction is on terms no less favorable than terms generally available to an unaffiliated third party under the same or similar circumstances and the extent of the related party’s interest in the transaction.
88
Table of Contents
The following summary of certain provisions of our capital stock does not purport to be complete and is subject to our Certificate of Incorporation, our Bylaws and the provisions of applicable law. Copies of our Certificate of Incorporation and Bylaws are filed as exhibits to the registration statement, of which this prospectus is a part.
Authorized Capitalization
General
The total amount of our authorized capital stock consists of 200,000,000 shares of common stock, par value $0.001 per share, and 100,000,000 shares of undesignated preferred stock, par value $0.001 per share. As of April 23, 2015, we had 33,470,732 shares of common stock, par value $0.001 per share, issued and outstanding, and no shares of preferred stock issued and outstanding. Following this offering, we will have 33,470,732 shares of common stock and no shares of preferred stock outstanding. In addition, we have one warrant outstanding to purchase up to an aggregate of 61,117 shares of our common stock at a purchase price of $6.28 per share.
The following summary describes all material provisions of our capital stock. We urge you to read our Certificate of Incorporation and our Bylaws, which are included as exhibits to the registration statement of which this prospectus forms a part.
Common Stock
As of April 23, 2015, there were 130 stockholders of record of our common stock. Our common stock is not entitled to preemptive or other similar subscription rights to purchase any of our securities. Our common stock is neither convertible nor redeemable. Unless our Board of Directors determines otherwise, we will issue all of our capital stock in uncertificated form.
Preferred Stock
Our Board of Directors has the authority to issue shares of preferred stock from time to time on terms it may determine, to divide shares of preferred stock into one or more series and to fix the designations, preferences, privileges, and restrictions of preferred stock, including dividend rights, conversion rights, voting rights, terms of redemption, liquidation preference, sinking fund terms, and the number of shares constituting any series or the designation of any series to the fullest extent permitted by the DGCL. The issuance of our preferred stock could have the effect of decreasing the trading price of our common stock, restricting dividends on our capital stock, diluting the voting power of our common stock, impairing the liquidation rights of our capital stock, or delaying or preventing a change in control of our Company.
Voting Rights
Each holder of our common stock is entitled to one vote per share on each matter submitted to a vote of stockholders. Our Bylaws provide that the presence, in person or by proxy, of holders of shares representing a majority of the outstanding shares of capital stock entitled to vote at a stockholders’ meeting shall constitute a quorum. When a quorum is present, the affirmative vote of a majority of the votes cast is required to take action, unless otherwise specified by law or our Certificate of Incorporation, and except for the election of directors, which is determined by a plurality vote. There are no cumulative voting rights.
Dividend Rights
Each holder of shares of our capital stock is entitled to receive such dividends and other distributions in cash, stock or property as may be declared by our Board of Directors from time to time out of our assets or funds
89
Table of Contents
legally available for dividends or other distributions. See “Dividend Policy.” These rights are subject to the preferential rights of the holders of our preferred stock, if any, and any contractual limitations on our ability to declare and pay dividends.
Other Rights
Each holder of common stock is subject to, and may be adversely affected by, the rights of the holders of any series of preferred stock that we may designate and issue in the future. This offering is not subject to pre-emptive rights.
Liquidation Rights
If our company is involved in a consolidation, merger, recapitalization, reorganization, voluntary or involuntary liquidation, dissolution or winding up of our affairs, or similar event, each holder of common stock will participate pro rata in all assets remaining after payment of liabilities, subject to prior distribution rights of preferred stock, if any, then outstanding.
Anti-takeover Effects of our Certificate of Incorporation and Bylaws
Our Certificate of Incorporation and our Bylaws contain provisions that may delay, defer or discourage another party from acquiring control of us. We expect that these provisions, which are summarized below, will discourage coercive takeover practices or inadequate takeover bids. These provisions are also designed to encourage persons seeking to acquire control of us to first negotiate with the Board of Directors, which we believe may result in an improvement of the terms of any such acquisition in favor of our stockholders. However, they also give the Board of Directors the power to discourage acquisitions that some stockholders may favor.
Action by Written Consent, Special Meeting of Stockholders and Advance Notice Requirements for Stockholder Proposals
Our Certificate of Incorporation provides that stockholder action can be taken only at an annual or special meeting of stockholders and cannot be taken by written consent in lieu of a meeting. Our Certificate of Incorporation and Bylaws also provide that, except as otherwise required by law, special meetings of the stockholders can be called only pursuant to a resolution adopted by a majority of the total number of directors that we would have if there were no vacancies. Except as described above, stockholders are not permitted to call a special meeting or to require the Board of Directors to call a special meeting.
In addition, our Bylaws require advance notice procedures for stockholder proposals to be brought before an annual meeting of the stockholders, including the nomination of directors. Stockholders at an annual meeting may only consider the proposals specified in the notice of meeting or brought before the meeting by or at the direction of the Board of Directors, or by a stockholder of record on the record date for the meeting, who is entitled to vote at the meeting and who has delivered a timely written notice in proper form to our secretary, of the stockholder’s intention to bring such business before the meeting.
These provisions could have the effect of delaying until the next stockholder meeting any stockholder actions, even if they are favored by the holders of a majority of our outstanding voting securities.
Classified Board
Our Certificate of Incorporation provides that our Board of Directors is divided into three classes of directors, with the classes as nearly equal in number as possible. As a result, approximately one-third of our Board of Directors is elected each year. The classification of directors has the effect of making it more difficult for stockholders to change the composition of our board.
90
Table of Contents
Removal of Directors
Our Certificate of Incorporation provides that directors may only be removed from office only for cause and only upon the affirmative vote of at least 75% of the voting power of our outstanding shares of common stock.
Amendment to Certificate of Incorporation and Bylaws
The DGCL provides generally that the affirmative vote of a majority of the outstanding stock entitled to vote on amendments to a corporation’s certificate of incorporation or bylaws is required to approve such amendment, unless a corporation’s certificate of incorporation or bylaws, as the case may be, requires a greater percentage. Our Bylaws may be further amended, altered, changed or repealed by a majority vote of our Board of Directors, provided that, in addition to any other vote otherwise required by law, the affirmative vote of at least 75% of the voting power of our outstanding shares of common stock is required to amend, alter, change or repeal our Bylaws. Additionally, the affirmative vote of at least 75% of the voting power of the outstanding shares of capital stock entitled to vote on the adoption, alteration, amendment or repeal of our Certificate of Incorporation, voting as a single class, is required to amend or repeal or to adopt any provision inconsistent with specified provisions of our Certificate of Incorporation. This requirement of a supermajority vote to approve amendments to our Certificate of Incorporation and Bylaws could enable a minority of our stockholders to exercise veto power over any such amendments.
Delaware Anti-Takeover Statute
Section 203 of the DGCL provides that if a person acquires 15% or more of the voting stock of a Delaware corporation, such person becomes an “interested stockholder” and may not engage in certain “business combinations” with the corporation for a period of three years from the time such person acquired 15% or more of the corporation’s voting stock, unless: (1) the Board of Directors approves the acquisition of stock or the merger transaction before the time that the person becomes an interested stockholder, (2) the interested stockholder owns at least 85% of the outstanding voting stock of the corporation at the time the merger transaction commences (excluding voting stock owned by directors who are also officers and certain employee stock plans), or (3) the merger transaction is approved by the Board of Directors and by the affirmative vote at a meeting, not by written consent, of stockholders of 2/3 of the holders of the outstanding voting stock which is not owned by the interested stockholder. A Delaware corporation may elect in its certificate of incorporation or bylaws not to be governed by this particular Delaware law.
Under our Certificate of Incorporation, we opted out of Section 203 of the DGCL and therefore are not subject to Section 203.
Corporate Opportunity
Our Certificate of Incorporation provides that we renounce any interest or expectancy in, or in being offered an opportunity to participate in, any business opportunity that may from time to time be presented to MidOcean or any of its officers, directors, agents, stockholders, members, partners, affiliates and subsidiaries (other than us and our subsidiaries) and that may be a business opportunity for MidOcean, even if the opportunity is one that we might reasonably have pursued or had the ability or desire to pursue if granted the opportunity to do so. No such person will be liable to us for breach of any fiduciary or other duty, as a director or officer or otherwise, by reason of the fact that such person, acting in good faith, pursues or acquires any such business opportunity, directs any such business opportunity to another person or fails to present any such business opportunity, or information regarding any such business opportunity, to us unless, in the case of any such person who is our director or officer, any such business opportunity is expressly offered to such director or officer solely in his or her capacity as our director or officer. Neither MidOcean, nor any of its representatives has any duty to refrain from engaging directly or indirectly in the same or similar business activities or lines of business as us or any of our subsidiaries.
91
Table of Contents
Limitations on Liability and Indemnification of Officers and Directors
Our Certificate of Incorporation limits the liability of our directors to the fullest extent permitted by the DGCL, and our Bylaws provide that we will indemnify them to the fullest extent permitted by such law. We have entered and expect to continue to enter into agreements to indemnify our directors, executive officers and other employees as determined by our Board of Directors. Under the terms of such indemnification agreements, we are required to indemnify each of our directors and officers, to the fullest extent permitted by the laws of the state of Delaware, if the basis of the indemnitee’s involvement was by reason of the fact that the indemnitee is or was a director or officer of the Company or any of its subsidiaries or was serving at the Company’s request in an official capacity for another entity. We must indemnify our officers and directors against all reasonable fees, expenses, charges and other costs of any type or nature whatsoever, including any and all expenses and obligations paid or incurred in connection with investigating, defending, being a witness in, participating in (including on appeal), or preparing to defend, be a witness or participate in any completed, actual, pending or threatened action, suit, claim or proceeding, whether civil, criminal, administrative or investigative, or establishing or enforcing a right to indemnification under the indemnification agreement. The indemnification agreements also require us, if so requested, to advance within 30 days of such request all reasonable fees, expenses, charges and other costs that such director or officer incurred, provided that such person will return any such advance if it is ultimately determined that such person is not entitled to indemnification by us. Any claims for indemnification by our directors and officers may reduce our available funds to satisfy successful third-party claims against us and may reduce the amount of money available to us
Exclusive Jurisdiction of Certain Actions
Our Certificate of Incorporation requires, to the fullest extent permitted by law, that derivative actions brought in the name of the Company, actions against directors, officers and employees for breach of fiduciary duty and other similar actions may be brought only in the Court of Chancery in the State of Delaware and, if brought outside of Delaware, the stockholder bringing the suit will be deemed to have consented to service of process on such stockholder’s counsel. Although we believe this provision benefits the Company by providing increased consistency in the application of Delaware law in the types of lawsuits to which it applies, the provision may have the effect of discouraging lawsuits against our directors and officers.
Payment of Legal Fees in Certain Proceedings
Our Certificate of Incorporation provides, to the fullest extent permitted by law, in the event that any person or entity (the “Claimant”) (x) initiates or asserts (1) any derivative action or proceeding brought on behalf of the Company, (2) any claim of breach of a fiduciary duty owed by any director, officer, employee or agent of the Company to the Company or its stockholders, (3) any action against the Company or any of its directors, officers, employees or agents arising pursuant to any provision of the DGCL, our Certificate of Incorporation or our Bylaws, or (4) any action asserting a claim governed by the internal affairs doctrine (each of the foregoing, a “Claim”), or joins any such Claim as a named party, and (y) does not thereby obtain a judgment on the merits that substantially achieves the full remedy or relief sought in the Claim, such Claimant shall be jointly and severally obligated to reimburse the Company for all fees, costs and expenses (including attorneys’ fees and the fees of experts) actually and reasonably incurred by the Company in defending such Claim.
Registration Rights
See “Certain Relationships and Related Party Transactions—Stockholders Agreement.”
Transfer Agent and Registrar
The transfer agent and registrar for our common stock will be Computershare Trust Company, N.A.
Listing
Our common stock is listed on Nasdaq under the symbol “FRPT.”
92
Table of Contents
SHARES ELIGIBLE FOR FUTURE SALE
Future sales of substantial amounts of our common stock in the public market, or the perception that such sales may occur, could adversely affect the prevailing market price of our common stock and impair our ability to raise equity capital in the future. No prediction can be made as to the effect, if any, future sales of shares, or the availability of shares for future sales, will have on the market price of our common stock prevailing from time to time.
Upon completion of this offering, we will have 33,470,732 shares of common stock outstanding. Of these shares of common stock, the 11,979,167 shares of common stock sold in our initial public offering and the 5,313,351 shares of common stock being sold in this offering (plus any shares sold upon exercise of the underwriters’ option to purchase additional shares) will be freely tradable without restriction under the Securities Act, except for any such shares which may be acquired by an “affiliate” of ours, as that term is defined in Rule 144, which shares will be subject to the volume limitations and other restrictions of Rule 144 described below. The remaining shares of common stock are “restricted securities,” as that term is defined in Rule 144, and may be resold only after registration under the Securities Act or pursuant to an exemption from such registration, including, among others, the exemption provided by Rule 144 under the Securities Act, which is summarized below. These remaining shares of common stock will be available for sale in the public market (after the expiration of the lock-up agreements described below) only if registered or if they qualify for an exemption from registration.
In connection with this offering, we, our directors, our executive officers and the selling stockholders have agreed, subject to certain exceptions, not to dispose of or hedge any shares of our equity interests or securities convertible into or exchangeable for our equity interests during the period from the date of the lock-up agreement continuing through the date 90 days after the date of this prospectus, except with the prior written consent of Goldman, Sachs & Co. and Credit Suisse Securities (USA) LLC.
Following the lock-up periods set forth in the agreements described above, and assuming that the representatives of the underwriters do not release any parties from these agreements, all of the common stock that are restricted securities or are held by our affiliates as of the date of this prospectus will be eligible for sale in the public market in compliance with Rule 144 under the Securities Act.
Rule 144
In general, under Rule 144, as currently in effect, persons who are not one of our affiliates at any time during the three months preceding a sale may sell shares of our common stock beneficially held upon the earlier of (1) the expiration of a six-month holding period, if we have been subject to the reporting requirements of the Exchange Act and have filed all required reports for at least 90 days prior to the date of the sale, or (2) a one-year holding period.
At the expiration of the six-month holding period, a person who was not one of our affiliates at any time during the three months preceding a sale would be entitled to sell an unlimited number of shares of our common stock provided current public information about us is available, and a person who was one of our affiliates at any time during the three months preceding a sale would be entitled to sell within any three-month period a number of shares of common stock that does not exceed the greater of either of the following:
| • | 1% of the number of shares of our common stock then outstanding, which will equal approximately 334,707 shares immediately after this offering; or |
| • | the average weekly trading volume of our common stock on Nasdaq during the four calendar weeks preceding the filing of a notice on Form 144 with respect to the sale. |
At the expiration of the one-year holding period, a person who was not one of our affiliates at any time during the three months preceding a sale would be entitled to sell an unlimited number of shares of our common stock without restriction. A person who was one of our affiliates at any time during the three months preceding a sale would remain subject to the volume restrictions described above.
93
Table of Contents
Sales under Rule 144 by our affiliates are also subject to manner of sale provisions, notice requirements and to the availability of current public information about us. Notwithstanding the availability of Rule 144, we, our directors, our executive officers and the selling stockholders have entered into lock-up agreements as referenced above. The “restricted securities” covered by such lock-up agreements will become eligible for sale (subject to the above limitations under Rule 144) upon the expiration of the restrictions set forth in those agreements.
Stock Plans
We filed a registration statement on Form S-8 under the Securities Act to register shares of our common stock issued or reserved for issuance under our 2010 Plan and 2014 Plan. Accordingly, shares registered under such registration statement are available for sale in the open market, unless such shares are subject to vesting restrictions with us, Rule 144 restrictions applicable to our affiliates or the lock-up restrictions described below.
Lock-Up Agreements
We, our directors, our executive officers and the selling stockholders have agreed, subject to certain exceptions, not to directly or indirectly:
| • | sell, offer, contract or grant any option to sell (including any short sale), pledge, transfer, establish an open “put equivalent position” within the meaning of Rule 16a-l(h) under the Exchange Act; or |
| • | otherwise dispose of any shares of common stock, options or warrants to acquire shares of common stock, or securities exchangeable or exercisable for or convertible into shares of common stock currently or hereafter owned either of record or beneficially; or |
| • | publicly announce an intention to do any of the foregoing for a period of 90 days after the date of this prospectus without the prior written consent of Goldman, Sachs & Co. and Credit Suisse Securities (USA) LLC. |
This restriction terminates after the close of trading of the common stock on and including the 90th day after the date of this prospectus. For additional information, see “Underwriting.”
Selldown Agreement
Pursuant to the terms of a selldown agreement that we entered into with Freshpet Investors LLC, in any 90 day period, Freshpet Investors LLC may (x) during the time beginning on the day that is 181 days following the completion of our initial public offering and ending on the day that is 12 months following the completion of our initial public offering, transfer up to 7.5% of the applicable securities held by it on the date of the agreement and (y) during the time beginning on the day that is 366 days following the completion of our initial public offering and ending on the day that is 18 months following the completion of our initial public offering transfer up to 10% of the applicable securities held by it on the date of the agreement, in each case as a distribution to its members, affiliates or any investment fund or other entity controlled or managed by it. In connection with this offering, we and Freshpet Investors LLC expect to enter into a waiver to the selldown agreement to permit Freshpet Investors LLC to sell shares of our common stock in this offering. See “Certain Relationships and Related Party Transactions—Selldown Agreement” for more information.
Registration Rights
Immediately following this offering, holders of an aggregate of 11,294,651 shares of our common stock, or their transferees, will be entitled to certain rights with respect to the registration of their shares under the Securities Act. Except for shares purchased by affiliates, registration of their shares under the Securities Act would result in these shares becoming freely tradable without restriction under the Securities Act immediately upon effectiveness of the registration, subject to the expiration of the lock-up period, with respect to certain of the shares, described under “Underwriting” in this prospectus, and to the extent such shares have been released from any repurchase option that we may hold. See “Certain Relationships and Related Party Transactions—Stockholders Agreement” for more information.
94
Table of Contents
MATERIAL U.S. FEDERAL INCOME AND ESTATE TAX CONSIDERATIONS FOR
NON-U.S. HOLDERS
Overview
The following is a summary of material U.S. federal income and estate tax consequences to non-U.S. holders, as defined below, of the ownership and disposition of shares of our common stock as of the date of this prospectus. This summary deals only with shares of common stock purchased in this offering that are held as capital assets (generally, property held for investment) by a non-U.S. holder.
For purposes of this discussion, a “non-U.S. holder” means a beneficial owner of shares of our common stock that, for U.S. federal income tax purposes, is not any of the following:
| • | an individual who is a citizen or resident of the United States; |
| • | a corporation (or any other entity treated as a corporation for U.S. federal income tax purposes) created or organized in or under the laws of the United States, any state thereof or the District of Columbia; |
| • | an estate the income of which is subject to U.S. federal income taxation regardless of its source; or |
| • | a trust if it (1) is subject to the primary supervision of a court within the United States and one or more United States persons have the authority to control all substantial decisions of the trust or (2) has a valid election in effect under applicable U.S. Treasury regulations to be treated as a United States person for U.S. federal income tax purposes. |
If any entity or arrangement treated as a partnership for U.S. federal income tax purposes holds shares of our common stock, the tax treatment of a partner in such partnership generally will depend upon the status of the partner and the activities of the partner and the partnership. If you are a partner of a partnership considering an investment in shares of our common stock, you should consult your own tax advisors.
This summary is based upon provisions of the U.S. Internal Revenue Code of 1986, as amended (the “Code”), applicable U.S. Treasury regulations, rulings and other administrative pronouncements and judicial decisions, all as in effect as of the date hereof. Those authorities are subject to different interpretations and may be changed at any time, perhaps retroactively, so as to result in U.S. federal income and estate tax consequences different from those summarized below. We have not sought and do not expect to seek any rulings from the U.S. Internal Revenue Service (the “IRS”) regarding the matters discussed below. There can be no assurance that the IRS will not take positions concerning the tax consequences of the ownership or disposition of shares of our common stock that differ from those discussed below. We cannot assure you that a change in law will not alter significantly the tax consequences described in this summary.
This summary does not address all aspects of U.S. federal income and estate taxes and does not deal with the foreign, state, local, alternative minimum tax, any aspects of the unearned income Medicare contribution tax pursuant to the Health Care and Education Reconciliation Act of 2010 or other tax considerations that may be relevant to non-U.S. holders in light of their particular circumstances. In addition, this summary does not describe the U.S. federal income tax consequences applicable to you if you are subject to special treatment under U.S. federal income tax laws (including if you are a U.S. expatriate or U.S. expatriated entity, a financial institution, an insurance company, a tax-exempt organization, a government or government instrumentality, a trader, broker or dealer in securities or currencies, a “controlled foreign corporation,” a “passive foreign investment company,” an entity treated as a partnership or other pass-through entity for U.S. federal income tax purposes (or an investor in such a pass-through entity), a person who acquired shares of our common stock as compensation or otherwise in connection with the performance of services, or a person who has acquired shares of our common stock as part of a straddle, hedge, conversion transaction or other integrated investment).
This summary is for general information only and is not intended to constitute a complete description of all U.S. federal income and estate tax consequences for non-U.S. holders relating to the ownership and disposition
95
Table of Contents
of our common stock. If you are considering the purchase of shares of our common stock, you should consult your own tax advisors concerning the particular U.S. federal income and estate tax consequences to you of the ownership and disposition of shares of our common stock, as well as the consequences to you arising under other U.S. federal tax laws and the laws of any other applicable taxing jurisdiction in light of your particular circumstances.
Dividends
As discussed under “Dividend Policy” above, we do not currently expect to pay dividends on our common stock in the foreseeable future. In general, in the event that we do pay dividends on shares of our common stock, such cash distributions will constitute dividends for U.S. federal income tax purposes to the extent paid from our current or accumulated earnings and profits, as determined under U.S. federal income tax principles. To the extent any such distributions exceed both our current and our accumulated earnings and profits, they will first be treated as a return of capital reducing your tax basis in our common stock (determined on a share by share basis), but not below zero, and then will be treated as gain from the sale of stock.
Dividends paid to a non-U.S. holder generally will be subject to a U.S. federal withholding tax at a 30% rate, or such lower rate as may be specified by an applicable income tax treaty. However, dividends that are effectively connected with the conduct of a trade or business within the United States by a non-U.S. holder (and, if required by an applicable income tax treaty, are attributable to a U.S. permanent establishment or a fixed base of the non-U.S. holder) generally will not be subject to such withholding tax, provided certain certification and disclosure requirements are satisfied (including the provision of a properly completed IRS Form W-8ECI or other applicable form). Instead, unless an applicable income tax treaty provides otherwise, such dividends will generally be subject to U.S. federal income tax on a net income basis in the same manner as if the non-U.S. holder were a United States person as defined under the Code. A corporate non-U.S. holder may be subject to an additional “branch profits tax” at a rate of 30% (or such lower rate as may be specified by an applicable income tax treaty) on its earnings and profits (subject to adjustments) that are effectively connected with its conduct of a U.S. trade or business.
A non-U.S. holder of shares of our common stock who wishes to claim the benefit of an applicable income tax treaty rate for dividends will be required (a) to complete IRS Form W-8BEN or W-8BEN-E (or other applicable form) and certify under penalty of perjury that such holder is not a United States person as defined under the Code and is eligible for treaty benefits of a reduction in the rate of, or exemption from, withholding on dividends, or (b) if shares of our common stock are held through certain foreign intermediaries, satisfy the relevant certification requirements of applicable U.S. Treasury regulations. This certification must be provided to the applicable withholding agent prior to the payment of dividends and may be required to be updated periodically if there is a change in circumstances that makes any information on such form incorrect.
It is possible that a distribution made to a non-U.S. holder may be subject to over-withholding because, for example, at the time of the distribution we or the relevant withholding agent may not be able to determine how much of the distribution constitutes dividends or the proper documentation establishing the benefits of any applicable treaty has not been properly supplied. If there are any excess amounts withheld on distributions made to a non-U.S. holder, such non-U.S. holder may obtain a refund of any excess amounts withheld by timely filing an appropriate claim for refund with the IRS. Non-U.S. holders should consult their tax advisors regarding the applicable withholding tax rules and the possibility of obtaining a refund of any excess amounts withheld.
96
Table of Contents
Gain on Disposition of Shares of Common Stock
Subject to the discussions below on backup withholding and FATCA (as defined below), any gain realized by a non-U.S. holder on the sale or other taxable disposition of shares of our common stock generally will not be subject to U.S. federal income tax unless:
| • | the gain is effectively connected with a trade or business of the non-U.S. holder conducted in the United States (and, if required by an applicable income tax treaty, is attributable to a U.S. permanent establishment or a fixed base of the non-U.S. holder); |
| • | the non-U.S. holder is an individual who is present in the United States for 183 days or more in the taxable year of that disposition, and certain other conditions are met; or |
| • | we are or have been a U.S. real property holding corporation (a “USRPHC”) for U.S. federal income tax purposes at any time during the shorter of the five-year period ending on the date of the disposition or the period that the non-U.S. holder held shares of our common stock (the “applicable period”). |
In the case of a non-U.S. holder described in the first bullet point above, any gain will be subject to U.S. federal income tax on a net income basis generally in the same manner as if the non-U.S. holder were a United States person as defined under the Code (unless an applicable income tax treaty provides otherwise), and a non-U.S. holder that is a foreign corporation may be subject to an additional “branch profits” tax at a rate of 30% (or such lower rate as may be specified by an applicable income tax treaty) on its effectively connected earnings and profits attributable to such gains (subject to adjustments). Except as otherwise provided by an applicable income tax treaty, an individual non-U.S. holder described in the second bullet point above will be subject to a 30% tax on any gain derived from the sale or other taxable disposition, which may be offset by certain U.S. source capital losses, even though the individual is not considered a resident of the United States under the Code.
With respect to the third bullet point above, we believe we are not currently and will not become a USRPHC. However, because the determination of whether we are a USRPHC depends on the fair market value of our U.S. real property interests relative to the fair market value of our other business assets, there can be no assurance that we are not currently or will not become a USRPHC in the future. Even if we are or become a USRPHC, however, so long as our common stock is regularly traded on an established securities market, a non-U.S. holder will be subject to U.S. federal income tax on any gain in respect of our common stock only if such non-U.S. holder actually or constructively owned more than five percent of our outstanding common stock at any time during the applicable period. You should consult your own tax advisor about the consequences that could result if we are, or become, a USRPHC.
Information Reporting and Backup Withholding
The amount of dividends paid to each non-U.S. holder and any tax withheld with respect to such dividends will be reported annually to the IRS and to each such holder, regardless of whether withholding was reduced or eliminated by an applicable income tax treaty. Copies of the information returns reporting such dividends and withholding may also be made available to the tax authorities in the country in which the non-U.S. holder resides or is established under the provisions of an applicable income tax treaty or agreement.
A non-U.S. holder generally will be subject to backup withholding with respect to dividends paid to such holder unless such holder certifies under penalty of perjury that it is not a United States person as defined under the Code (and the payor does not have actual knowledge or reason to know that such holder is a United States person as defined under the Code), or such holder otherwise establishes an exemption, for example, by properly certifying its non-U.S. status on an IRS Form W-8BEN or W-8BEN-E or other appropriate version of IRS Form W-8.
Information reporting and, depending on the circumstances, backup withholding will apply to the proceeds of a sale or other disposition by a non-U.S. holder of shares of our common stock within the United States or conducted through certain U.S.-related financial intermediaries unless such non-U.S. holder certifies under
97
Table of Contents
penalty of perjury that it is not a United States person as defined under the Code (and the payor does not have actual knowledge or reason to know that the non-U.S. holder is a United States person as defined under the Code), or such non-U.S. holder otherwise establishes an exemption, for example, by properly certifying its non-U.S. status on an IRS Form W-8BEN or W-8BEN-E or other appropriate version of IRS Form W-8.
Backup withholding is not an additional tax. Any amounts withheld from a payment to a non-U.S. holder of common stock under the backup withholding rules may be allowed as a refund or a credit against a non-U.S. holder’s U.S. federal income tax liability provided the required information is timely furnished to the IRS.
Legislation Affecting Taxation of Common Stock Held by or Through Foreign Entities
Legislation enacted in 2010 (commonly known as “FATCA”), generally will impose a withholding tax of 30% on dividend income from our common stock and on the gross proceeds of a sale or other disposition of our common stock paid to (i) a “foreign financial institution” (as such term is defined in Section 1471(d)(4) of the Code) (as the beneficial owner or as an intermediary for the beneficial owner), unless such institution enters into an agreement with the U.S. government to collect and provide to the U.S. tax authorities substantial information regarding U.S. account holders of such institution (which would include certain equity and debt holders of such institution, as well as certain account holders that are foreign entities with U.S. owners), (ii) a foreign entity that is not a financial institution (as the beneficial owner or as an intermediary for the beneficial owner), unless such entity provides the withholding agent with a certification identifying the substantial United States owners of the entity, which generally includes any United States person as defined under the Code who directly or indirectly owns more than 10% of the entity or (iii) the foreign financial institution or non-financial foreign entity otherwise qualifies for an exemption from these rules. The United States and other governments may enter into intergovernmental agreements that modify or supplement these rules. This legislation generally is effective for payments of dividends made after June 30, 2014 and for payments made in respect of gross proceeds from a sale or other disposition made after December 31, 2016. Under certain circumstances, a non-U.S. holder of our common stock might be eligible for refunds or credits of such taxes, and a non-U.S. holder might be required to file a U.S. federal income tax return to claim such refunds or credits. Non-U.S. holders should consult their tax advisors regarding the implications of this legislation on their investment in our common stock.
U.S. Federal Estate Tax
Shares of our common stock that are owned (or deemed to be owned) by an individual who is not a citizen or resident of the United States (as specially defined for U.S. federal estate tax purposes) at the time of death will be includable in such individual’s gross estate for U.S. federal estate tax purposes, unless an applicable estate or other tax treaty provides otherwise, and, therefore, may be subject to U.S. federal estate tax.
THE SUMMARY ABOVE OF MATERIAL U.S. FEDERAL INCOME AND ESTATE TAX CONSEQUENCES TO NON-U.S. HOLDERS IS FOR GENERAL INFORMATION ONLY AND DOES NOT CONSTITUTE TAX ADVICE. POTENTIAL PURCHASERS OF OUR COMMON STOCK ARE URGED TO CONSULT THEIR TAX ADVISORS TO DETERMINE THE U.S. FEDERAL, STATE, LOCAL AND NON-U.S. INCOME, ESTATE AND OTHER TAX AND TAX TREATY CONSIDERATIONS OF OWNING AND DISPOSING OF OUR COMMON STOCK.
98
Table of Contents
We, the selling stockholders and the underwriters named below have entered into an underwriting agreement with respect to the shares being offered. Subject to certain conditions, each underwriter has severally agreed to purchase the number of shares indicated in the following table. Goldman, Sachs & Co. and Credit Suisse Securities (USA) LLC are the representatives of the underwriters.
| Underwriters |
Number of Shares |
|||
| Goldman, Sachs & Co. |
||||
| Credit Suisse Securities (USA) LLC |
||||
| Robert W. Baird & Co. Incorporated |
||||
| Stifel, Nicolaus & Company, Incorporated |
||||
| SunTrust Robinson Humphrey, Inc. |
||||
| Canaccord Genuity Inc. |
||||
|
|
|
|||
| Total |
5,313,351 | |||
|
|
|
|||
The underwriters are committed to take and pay for all of the shares being offered, if any are taken, other than the shares covered by the option described below unless and until this option is exercised.
The underwriters have an option to buy up to an additional 797,002 shares from the selling stockholders to cover sales by the underwriters of a greater number of shares than the total number set forth in the table above. They may exercise that option for 30 days. If any shares are purchased pursuant to this option, the underwriters will severally purchase shares in approximately the same proportion as set forth in the table above.
The following table shows the per share and total underwriting discounts and commissions to be paid to the underwriters by the selling stockholders. We, on behalf of the selling stockholders, have agreed to reimburse the underwriters for certain of their expenses, in an amount of up to $30,000, as set forth in the underwriting agreement. Such amounts are shown assuming both no exercise and full exercise of the underwriters’ option to purchase 797,002 additional shares.
| Paid by the Selling Stockholders |
No Exercise | Full Exercise | ||||||
| Per Share |
$ | $ | ||||||
| Total |
$ | $ | ||||||
Shares sold by the underwriters to the public will initially be offered at the public offering price set forth on the cover of this prospectus. Any shares sold by the underwriters to securities dealers may be sold at a discount of up to $ per share from the public offering price. After the initial offering of the shares, the representatives may change the offering price and the other selling terms. The offering of the shares by the underwriters is subject to receipt and acceptance and subject to the underwriters’ right to reject any order in whole or in part.
We, our officers and directors, and the selling stockholders have agreed with the underwriters, subject to certain exceptions, not to dispose of or hedge any of their common stock or securities convertible into or exchangeable for shares of common stock during the period from the date of this prospectus continuing through the date 90 days after the date of this prospectus, except with the prior written consent of the representatives. This agreement does not apply to any existing employee benefit plans. See “Shares Eligible for Future Sale” for a discussion of certain transfer restrictions.
Our common stock is listed on Nasdaq under the symbol “FRPT.” In connection with the offering, the underwriters may purchase and sell shares of common stock in the open market. These transactions may include short sales, stabilizing transactions and purchases to cover positions created by short sales. Short sales involve the sale by the underwriters of a greater number of shares than they are required to purchase in the offering, and a
99
Table of Contents
short position represents the amount of such sales that have not been covered by subsequent purchases. A “covered short position” is a short position that is not greater than the amount of additional shares for which the underwriters’ option described above may be exercised. The underwriters may cover any covered short position by either exercising their option to purchase additional shares or purchasing shares in the open market. In determining the source of shares to cover the covered short position, the underwriters will consider, among other things, the price of shares available for purchase in the open market as compared to the price at which they may purchase additional shares pursuant to the option described above. “Naked” short sales are any short sales that create a short position greater than the amount of additional shares for which the option described above may be exercised. The underwriters must cover any such naked short position by purchasing shares in the open market. A naked short position is more likely to be created if the underwriters are concerned that there may be downward pressure on the price of the common stock in the open market after pricing that could adversely affect investors who purchase in the offering. Stabilizing transactions consist of various bids for or purchases of common stock made by the underwriters in the open market prior to the completion of the offering.
The underwriters may also impose a penalty bid. This occurs when a particular underwriter repays to the underwriters a portion of the underwriting discount received by it because the representatives have repurchased shares sold by or for the account of such underwriter in stabilizing or short covering transactions.
Purchases to cover a short position and stabilizing transactions, as well as other purchases by the underwriters for their own accounts, may have the effect of preventing or retarding a decline in the market price of our stock, and together with the imposition of the penalty bid, may stabilize, maintain or otherwise affect the market price of the common stock. As a result, the price of the common stock may be higher than the price that otherwise might exist in the open market. The underwriters are not required to engage in these activities and may end any of these activities at any time. These transactions may be effected on Nasdaq, in the over-the-counter market or otherwise.
In relation to each Member State of the European Economic Area which has implemented the Prospectus Directive (each, a “Relevant Member State”) an offer to the public of any shares of our common stock may not be made in that Relevant Member State, except that an offer to the public in that Relevant Member State of any shares of our common stock may be made at any time under the following exemptions under the Prospectus Directive, if they have been implemented in that Relevant Member State:
| (a) | to any legal entity which is a qualified investor as defined in the Prospectus Directive; |
| (b) | to fewer than 100 or, if the Relevant Member State has implemented the relevant provision of the 2010 PD Amending Directive, 150, natural or legal persons (other than qualified investors as defined in the Prospectus Directive), as permitted under the Prospectus Directive, subject to obtaining the prior consent of the representatives for any such offer; or |
| (c) | in any other circumstances falling within Article 3(2) of the Prospectus Directive, provided that no such offer of shares of our common stock shall result in a requirement for the publication by us or any underwriter of a prospectus pursuant to Article 3 of the Prospectus Directive. |
For the purposes of this provision, the expression an “offer to the public” in relation to any shares of our common stock in any Relevant Member State means the communication in any form and by any means of sufficient information on the terms of the offer and any shares of our common stock to be offered so as to enable an investor to decide to purchase any shares of our common stock, as the same may be varied in that Member State by any measure implementing the Prospectus Directive in that Member State, the expression “Prospectus Directive” means Directive 2003/71/EC (and amendments thereto, including the 2010 PD Amending Directive, to the extent implemented in the Relevant Member State), and includes any relevant implementing measure in the Relevant Member State, and the expression “2010 PD Amending Directive” means Directive 2010/73/EU.
Each underwriter has represented and agreed that:
| (a) | it has only communicated or caused to be communicated and will only communicate or cause to be communicated an invitation or inducement to engage in investment activity (within the meaning of |
100
Table of Contents
| Section 21 of the FSMA) received by it in connection with the issue or sale of the shares in circumstances in which Section 21(1) of the FSMA does not apply to the Issuer; and |
| (b) | it has complied and will comply with all applicable provisions of the FSMA with respect to anything done by it in relation to the shares in, from or otherwise involving the United Kingdom. |
The shares may not be offered or sold by means of any document other than (i) in circumstances which do not constitute an offer to the public within the meaning of the Companies Ordinance (Cap.32, Laws of Hong Kong), or (ii) to “professional investors” within the meaning of the Securities and Futures Ordinance (Cap.571, Laws of Hong Kong) and any rules made thereunder, or (iii) in other circumstances which do not result in the document being a “prospectus” within the meaning of the Companies Ordinance (Cap.32, Laws of Hong Kong), and no advertisement, invitation or document relating to the shares may be issued or may be in the possession of any person for the purpose of issue (in each case whether in Hong Kong or elsewhere), which is directed at, or the contents of which are likely to be accessed or read by, the public in Hong Kong (except if permitted to do so under the laws of Hong Kong) other than with respect to shares which are or are intended to be disposed of only to persons outside Hong Kong or only to “professional investors” within the meaning of the Securities and Futures Ordinance (Cap. 571, Laws of Hong Kong) and any rules made thereunder.
This prospectus has not been registered as a prospectus with the Monetary Authority of Singapore. Accordingly, this prospectus and any other document or material in connection with the offer or sale, or invitation for subscription or purchase, of the shares may not be circulated or distributed, nor may the shares be offered or sold, or be made the subject of an invitation for subscription or purchase, whether directly or indirectly, to persons in Singapore other than (i) to an institutional investor under Section 274 of the Securities and Futures Act, Chapter 289 of Singapore (the “SFA”), (ii) to a relevant person, or any person pursuant to Section 275(1A), and in accordance with the conditions, specified in Section 275 of the SFA or (iii) otherwise pursuant to, and in accordance with the conditions of, any other applicable provision of the SFA.
Where the shares are subscribed or purchased under Section 275 by a relevant person which is: (a) a corporation (which is not an accredited investor) the sole business of which is to hold investments and the entire share capital of which is owned by one or more individuals, each of whom is an accredited investor; or (b) a trust (where the trustee is not an accredited investor) whose sole purpose is to hold investments and each beneficiary is an accredited investor, shares, debentures and units of shares and debentures of that corporation or the beneficiaries’ rights and interest in that trust shall not be transferable for 6 months after that corporation or that trust has acquired the shares under Section 275 except: (1) to an institutional investor under Section 274 of the SFA or to a relevant person, or any person pursuant to Section 275(1A), and in accordance with the conditions, specified in Section 275 of the SFA; (2) where no consideration is given for the transfer; or (3) by operation of law.
The securities have not been and will not be registered under the Financial Instruments and Exchange Law of Japan (the Financial Instruments and Exchange Law) and each underwriter has agreed that it will not offer or sell any securities, directly or indirectly, in Japan or to, or for the benefit of, any resident of Japan (which term as used herein means any person resident in Japan, including any corporation or other entity organized under the laws of Japan), or to others for re-offering or resale, directly or indirectly, in Japan or to a resident of Japan, except pursuant to an exemption from the registration requirements of, and otherwise in compliance with, the Financial Instruments and Exchange Law and any other applicable laws, regulations and ministerial guidelines of Japan.
We estimate that our portion of total expenses of this offering, exclusive of underwriting discounts and commissions, will be approximately $ million.
We and the selling stockholders have agreed to indemnify the several underwriters against certain liabilities, including liabilities under the Securities Act.
101
Table of Contents
The underwriters and their respective affiliates are full service financial institutions engaged in various activities, which may include sales and trading, commercial and investment banking, advisory, investment management, investment research, principal investment, hedging, market making, brokerage and other financial and non-financial activities and services. Certain of the underwriters and their respective affiliates have provided, and may in the future provide, a variety of these services to us and to persons and entities with relationships with us, for which they received or will receive customary fees and expenses.
In the ordinary course of their various business activities, the underwriters and their respective affiliates, officers, directors and employees may purchase, sell or hold a broad array of investments and actively trade securities, derivatives, loans, commodities, currencies, credit default swaps and other financial instruments for their own account and for the accounts of their customers, and such investment and trading activities may involve or relate to assets, securities and/or instruments of the issuer (directly, as collateral securing other obligations or otherwise) and/or persons and entities with relationships with us. The underwriters and their respective affiliates may also communicate independent investment recommendations, market color or trading ideas and/or publish or express independent research views in respect of such assets, securities or instruments and may at any time hold, or recommend to clients that they should acquire, long and/or short positions in such assets, securities and instruments.
102
Table of Contents
Kirkland & Ellis LLP, New York, New York will pass upon the validity of the common stock offered hereby. Certain legal matters in connection with this offering will be passed upon for the underwriters by Latham & Watkins LLP, New York, New York.
The consolidated financial statements of Freshpet, Inc. and its subsidiary as of December 31, 2014 and 2013, and for each of the years in the three-year period ended December 31, 2014, have been included herein and in the registration statement in reliance upon the reports of KPMG LLP, an independent registered public accounting firm, appearing elsewhere herein, and upon the authority of said firm as experts in accounting and auditing.
WHERE YOU CAN FIND MORE INFORMATION
We have filed with the SEC a registration statement on Form S-1, including exhibits and schedules, under the Securities Act with respect to the shares of our common stock offered hereby. This prospectus, which constitutes a part of the registration statement, does not contain all of the information set forth in the registration statement or the exhibits and schedules filed therewith. For further information with respect to us and the common stock offered hereby, reference is made to the registration statement and the exhibits and schedules filed therewith. Statements contained in this prospectus regarding the contents of any contract or any other document that is filed as an exhibit to the registration statement are not necessarily complete, and each such statement is qualified in all respects by reference to the full text of such contract or other document filed as an exhibit to the registration statement.
We are subject to the information and periodic and current reporting requirements of the Exchange Act, and, in accordance therewith, file periodic and current reports, proxy statements and other information with the SEC. Such periodic and current reports, proxy statements and other information are made available to the public on the SEC’s website at www.sec.gov and free of charge through our website at www.freshpet.com. To receive copies of public records not posted to the SEC’s website at prescribed rates, you may complete an online form at www.sec.gov, send a fax to (202) 772-9337 or submit a written request to the SEC, Office of FOIA/PA Operations, 100 F Street, N.E., Washington, D.C. 20549. Please call the SEC at 1-800-SEC-0330 for further information. Please note that our website address is provided as an inactive textual reference only. The information contained on, or accessible through, our website is not part of this prospectus and is therefore not incorporated by reference.
103
Table of Contents
INDEX TO CONSOLIDATED FINANCIAL STATEMENTS
| Page | ||||
| F-2 | ||||
| Consolidated Balance Sheets as of December 31, 2014 and 2013 |
F-3 | |||
| F-4 | ||||
| F-5 | ||||
| Consolidated Statements of Cash Flows for the years ended December 31, 2014, 2013, and 2012 |
F-6 | |||
| F-7 | ||||
F-1
Table of Contents
Report of Independent Registered Public Accounting Firm
The Board of Directors and Stockholders
Freshpet Inc.:
We have audited the accompanying consolidated balance sheets of Freshpet, Inc. and subsidiary (the Company) as of December 31, 2014 and 2013, and the related consolidated statements of operations and comprehensive loss, changes in stockholders’ equity (deficit), and cash flows for each of the years in the three-year period ended December 31, 2014. These consolidated financial statements are the responsibility of the Company’s management. Our responsibility is to express an opinion on these consolidated financial statements based on our audits.
We conducted our audits in accordance with the standards of the Public Company Accounting Oversight Board (United States). Those standards require that we plan and perform the audit to obtain reasonable assurance about whether the financial statements are free of material misstatement. An audit includes examining, on a test basis, evidence supporting the amounts and disclosures in the financial statements. An audit also includes assessing the accounting principles used and significant estimates made by management, as well as evaluating the overall financial statement presentation. We believe that our audits provide a reasonable basis for our opinion.
In our opinion, the consolidated financial statements referred to above present fairly, in all material respects, the financial position of Freshpet, Inc. and subsidiary as of December 31, 2014 and 2013, and the results of their operations and their cash flows for each of the years in the three-year period ended December 31, 2014, in conformity with U.S. generally accepted accounting principles.
/s/ KPMG LLP
Short Hills, New Jersey
March 31, 2015
F-2
Table of Contents
CONSOLIDATED BALANCE SHEETS
| December 31, | ||||||||
| 2014 | 2013 | |||||||
| ASSETS | ||||||||
| CURRENT ASSETS |
||||||||
| Cash and equivalents |
$ | 36,259,252 | $ | 2,444,754 | ||||
| Accounts receivable, less allowance for doubtful accounts of $359,425 on December 31, 2014 and $243,777 on December 31, 2013 |
5,360,400 | 3,497,596 | ||||||
| Inventories, net |
7,314,151 | 5,512,225 | ||||||
| Prepaid expenses and other current assets |
1,291,379 | 173,786 | ||||||
|
|
|
|
|
|||||
| Total Current Assets |
50,225,182 | 11,628,361 | ||||||
|
|
|
|
|
|||||
| Property, plant and equipment, net |
57,825,961 | 48,764,032 | ||||||
| Deposits on equipment |
2,883,234 | 1,183,209 | ||||||
| Other assets |
1,527,483 | 1,041,622 | ||||||
|
|
|
|
|
|||||
| Total Assets |
$ | 112,461,860 | $ | 62,617,224 | ||||
|
|
|
|
|
|||||
| LIABILITIES AND STOCKHOLDERS’ EQUITY (DEFICIT) | ||||||||
| CURRENT LIABILITIES: |
||||||||
| Accounts payable |
$ | 5,423,905 | $ | 6,286,720 | ||||
| Accrued expenses |
2,938,316 | 1,907,481 | ||||||
|
|
|
|
|
|||||
| Total Current Liabilities |
8,362,221 | 8,194,201 | ||||||
|
|
|
|
|
|||||
| OTHER LIABILITIES: |
||||||||
| Long-term debt |
— | 1,112,312 | ||||||
| Notes payable |
— | 75,000,000 | ||||||
| Accrued fees on debt guarantee |
— | 7,140,136 | ||||||
| Accrued interest on long term debt |
— | 667,110 | ||||||
| Accrued warrants |
706,940 | 369,564 | ||||||
|
|
|
|
|
|||||
| Total Liabilities |
$ | 9,069,161 | $ | 92,483,323 | ||||
|
|
|
|
|
|||||
| COMMITMENTS AND CONTINGENCIES |
||||||||
| REDEEMABLE PREFERRED STOCK |
||||||||
| Series B, $0.001 par value, 250,000 shares authorized, none and 112,160 issued and outstanding on December 31, 2014 and 2013, respectively |
— | 30,728,450 | ||||||
| Series C, $0.001 par value, 20,000,000 and 15,000,000 shares authorized, none and 11,238,098 issued and outstanding on December 31, 2014 and 2013, respectively |
— | 70,463,489 | ||||||
| STOCKHOLDERS’ EQUITY (DEFICIT): |
||||||||
| Common stock—voting, $0.001 par value, 200,000,000 and 54,000,000 shares authorized, 33,468,342 and 10,421,419 issued and outstanding on December 31, 2014 and 2013, respectively |
33,468 | 10,421 | ||||||
| Additional paid-in capital |
288,216,882 | 16,450,175 | ||||||
| Accumulated deficit |
(184,857,651 | ) | (147,518,634 | ) | ||||
|
|
|
|
|
|||||
| Total Stockholders’ Equity (Deficit) |
103,392,699 | (131,058,038 | ) | |||||
|
|
|
|
|
|||||
| Total Liabilities and Stockholders’ Equity (Deficit) |
$ | 112,461,860 | $ | 62,617,224 | ||||
|
|
|
|
|
|||||
See accompanying notes to the consolidated financial statements.
F-3
Table of Contents
CONSOLIDATED STATEMENTS OF OPERATIONS AND COMPREHENSIVE LOSS
| For the Year ended December 31, | ||||||||||||
| 2014 | 2013 | 2012 | ||||||||||
| NET SALES |
$ | 86,764,112 | $ | 63,150,776 | $ | 43,519,461 | ||||||
| COST OF GOODS SOLD |
44,545,637 | 35,957,835 | 22,881,333 | |||||||||
|
|
|
|
|
|
|
|||||||
| GROSS PROFIT |
42,218,475 | 27,192,941 | 20,638,128 | |||||||||
| SELLING, GENERAL, AND ADMINISTRATIVE EXPENSES |
48,636,167 | 39,573,617 | 35,385,319 | |||||||||
|
|
|
|
|
|
|
|||||||
| LOSS FROM OPERATIONS |
(6,417,692 | ) | (12,380,676 | ) | (14,747,191 | ) | ||||||
| OTHER EXPENSES: |
||||||||||||
| Other Expenses |
(328,793 | ) | (537,812 | ) | (343,212 | ) | ||||||
| Fees on Debt Guarantee |
(25,937,048 | ) | (5,244,700 | ) | (1,895,436 | ) | ||||||
| Interest Expense |
(4,613,731 | ) | (3,492,442 | ) | (1,637,883 | ) | ||||||
|
|
|
|
|
|
|
|||||||
| (30,879,572 | ) | (9,274,954 | ) | (3,876,531 | ) | |||||||
|
|
|
|
|
|
|
|||||||
| LOSS BEFORE INCOME TAXES |
(37,297,264 | ) | (21,655,630 | ) | (18,623,722 | ) | ||||||
| INCOME TAX EXPENSE |
41,753 | 31,525 | 32,776 | |||||||||
|
|
|
|
|
|
|
|||||||
| NET LOSS |
(37,339,017 | ) | (21,687,155 | ) | (18,656,498 | ) | ||||||
| OTHER COMPREHENSIVE INCOME |
||||||||||||
| Foreign Currency Translation Adjustment |
— | — | 23,829 | |||||||||
|
|
|
|
|
|
|
|||||||
| TOTAL COMPREHENSIVE LOSS |
$ | (37,339,017 | ) | $ | (21,687,155 | ) | $ | (18,632,669 | ) | |||
|
|
|
|
|
|
|
|||||||
| NET LOSS ATTRIBUTABLE TO COMMON STOCKHOLDERS |
$ | (131,279,893 | ) | $ | (30,282,659 | ) | $ | (26,609,946 | ) | |||
|
|
|
|
|
|
|
|||||||
| NET LOSS PER SHARE ATTRIBUTABLE TO COMMON STOCKHOLDERS |
||||||||||||
| BASIC |
$ | (9.63 | ) | $ | (2.91 | ) | $ | (2.56 | ) | |||
|
|
|
|
|
|
|
|||||||
| DILUTED |
$ | (9.63 | ) | $ | (2.91 | ) | $ | (2.56 | ) | |||
|
|
|
|
|
|
|
|||||||
| WEIGHTED AVERAGE SHARES OF COMMON STOCK OUTSTANDING USED IN COMPUTING NET LOSS PER SHARE ATTRIBUTABLE TO COMMON STOCKHOLDERS |
||||||||||||
| BASIC |
13,632,042 | 10,415,014 | 10,413,467 | |||||||||
|
|
|
|
|
|
|
|||||||
| DILUTED |
13,632,042 | 10,415,014 | 10,413,467 | |||||||||
|
|
|
|
|
|
|
|||||||
See accompanying notes to the consolidated financial statements.
F-4
Table of Contents
CONSOLIDATED STATEMENTS OF CHANGES IN STOCKHOLDERS’ EQUITY (DEFICIT)
| Common Stock— Voting |
Additional |
Accumulated |
Total |
|||||||||||||||||||||
| Number of Shares Issued |
Amount | Accumulated Deficit |
||||||||||||||||||||||
| BALANCES, DECEMBER 31, 2011 |
10,413,467 | $ | 10,413 | $ | 30,818,666 | $ | (107,174,981 | ) | $ | (23,829 | ) | $ | (76,369,731 | ) | ||||||||||
| Issuance of 4,932 common stock options to consultants for services |
— | — | 27,365 | — | — | 27,365 | ||||||||||||||||||
| Issuance of 4,438 common stock options to employees as compensation for service |
— | — | 6,156 | — | — | 6,156 | ||||||||||||||||||
| Share-based compensation expense |
— | — | 1,118,705 | — | — | 1,118,705 | ||||||||||||||||||
| Series B Preferred Stock dividend accretion |
— | — | (3,638,052 | ) | — | — | (3,638,052 | ) | ||||||||||||||||
| Series C Preferred Stock dividend accretion |
— | — | (4,315,396 | ) | — | — | (4,315,396 | ) | ||||||||||||||||
| Foreign currency translation adjustment |
— | — | — | 23,829 | 23,829 | |||||||||||||||||||
| Net loss |
— | — | — | (18,656,498 | ) | — | (18,656,498 | ) | ||||||||||||||||
|
|
|
|
|
|
|
|
|
|
|
|
|
|||||||||||||
| BALANCES, DECEMBER 31, 2012 |
10,413,467 | $ | 10,413 | $ | 24,017,444 | $ | (125,831,479 | ) | $ | — | $ | (101,803,622 | ) | |||||||||||
|
|
|
|
|
|
|
|
|
|
|
|
|
|||||||||||||
| Issuance of 7,952 shares of common stock for cash |
7,952 | 8 | 49,883 | — | — | 49,891 | ||||||||||||||||||
| Share-based compensation expense |
— | — | 978,352 | — | — | 978,352 | ||||||||||||||||||
| Preferred Series B stock dividend accretion |
— | — | (4,215,230 | ) | — | — | (4,215,230 | ) | ||||||||||||||||
| Preferred Series C stock dividend accretion |
— | — | (4,380,274 | ) | — | — | (4,380,274 | ) | ||||||||||||||||
| Net loss |
— | — | — | (21,687,155 | ) | — | (21,687,155 | ) | ||||||||||||||||
|
|
|
|
|
|
|
|
|
|
|
|
|
|||||||||||||
| BALANCES, DECEMBER 31, 2013 |
10,421,419 | $ | 10,421 | $ | 16,450,175 | $ | (147,518,634 | ) | $ | — | $ | (131,058,038 | ) | |||||||||||
|
|
|
|
|
|
|
|
|
|
|
|
|
|||||||||||||
| Share-based compensation expense |
— | — | 1,553,985 | — | — | 1,553,985 | ||||||||||||||||||
| Shares issued to consultant for services |
666 | 1 | 9,990 | — | — | 9,991 | ||||||||||||||||||
| Series B Preferred Stock dividend accretion |
— | — | (4,271,550 | ) | — | — | (4,271,550 | ) | ||||||||||||||||
| Series C Preferred Stock dividend accretion |
— | — | (7,014,643 | ) | — | — | (7,014,643 | ) | ||||||||||||||||
| Additional loss upon conversion of Series C Preferred Stock into common stock |
— | — | (82,654,683 | ) | — | — | (82,654,683 | ) | ||||||||||||||||
| Shares issued upon consummation of initial public offering (IPO) |
11,979,167 | 11,979 | 164,393,700 | — | — | 164,405,679 | ||||||||||||||||||
| Conversion of Series C Preferred Stock into common stock upon consummation of IPO |
11,067,090 | 11,067 | 199,749,908 | — | — | 199,760,975 | ||||||||||||||||||
| Net loss |
— | — | — | (37,339,017 | ) | — | (37,339,017 | ) | ||||||||||||||||
|
|
|
|
|
|
|
|
|
|
|
|
|
|||||||||||||
| BALANCES, DECEMBER 31, 2014 |
33,468,342 | $ | 33,468 | $ | 288,216,882 | $ | (184,857,651 | ) | $ | — | $ | 103,392,699 | ||||||||||||
|
|
|
|
|
|
|
|
|
|
|
|
|
|||||||||||||
See accompanying notes to the consolidated financial statements.
F-5
Table of Contents
CONSOLIDATED STATEMENT OF CASH FLOWS
| December 31, | ||||||||||||
| 2014 | 2013 | 2012 | ||||||||||
| CASH FLOWS FROM OPERATING ACTIVITIES: |
||||||||||||
| Net loss |
$ | (37,339,017 | ) | $ | (21,687,155 | ) | $ | (18,656,498 | ) | |||
| Adjustments to reconcile net loss to net cash flows from operating activities: |
||||||||||||
| Provision for losses on accounts receivable |
8,092 | 202,653 | 157,306 | |||||||||
| Loss on disposal of equipment and deposits on equipment |
308,707 | 503,436 | 332,877 | |||||||||
| Fees on debt guarantee |
25,937,048 | 5,244,700 | 1,895,436 | |||||||||
| Share-based compensation |
1,563,976 | 978,352 | 1,118,705 | |||||||||
| Revaluation of outstanding warrants |
337,376 | — | — | |||||||||
| Issuance of common stock options for services |
— | — | 33,521 | |||||||||
| Change in reserve for inventory obsolescence |
(112,835 | ) | 150,540 | (188,007 | ) | |||||||
| Depreciation and amortization |
6,424,813 | 5,945,077 | 4,728,005 | |||||||||
| Amortization of deferred financing costs and loan discount |
916,322 | 238,925 | 105,028 | |||||||||
| Changes in operating assets and liabilities: |
||||||||||||
| Accounts receivable |
(1,870,896 | ) | (921,772 | ) | (1,599,443 | ) | ||||||
| Inventories |
(1,689,091 | ) | (1,838,836 | ) | (758,428 | ) | ||||||
| Prepaid expenses and other current assets |
(1,101,899 | ) | (29,530 | ) | (33,221 | ) | ||||||
| Other assets |
(72,660 | ) | (139,094 | ) | (63,891 | ) | ||||||
| Accounts payable |
(1,608,213 | ) | 290,770 | 2,747,074 | ||||||||
| Accrued expenses and accrued interest on long-term debt |
271,975 | (179,268 | ) | 1,465,611 | ||||||||
|
|
|
|
|
|
|
|||||||
| Net cash flows used in operating activities |
(8,026,302 | ) | (11,241,202 | ) | (8,715,925 | ) | ||||||
|
|
|
|
|
|
|
|||||||
| CASH FLOWS FROM INVESTING ACTIVITIES: |
||||||||||||
| Acquisitions of property, plant and equipment, software and deposits on equipment |
(17,130,947 | ) | (24,643,016 | ) | (26,395,114 | ) | ||||||
| Proceeds from sale of equipment |
253,510 | — | 89,428 | |||||||||
|
|
|
|
|
|
|
|||||||
| Net cash flows used in investing activities |
(16,877,437 | ) | (24,643,016 | ) | (26,305,686 | ) | ||||||
|
|
|
|
|
|
|
|||||||
| CASH FLOWS FROM FINANCING ACTIVITIES: |
||||||||||||
| Borrowings on long-term debt |
11,500,000 | 32,000,000 | 33,000,000 | |||||||||
| Repayment of long-term debt |
(88,000,000 | ) | — | — | ||||||||
| Redemption of Series B preferred stock |
(34,998,957 | ) | — | — | ||||||||
| Financing fees paid in connection with borrowings |
(739,469 | ) | (334,818 | ) | (340,418 | ) | ||||||
| Proceeds from shares of common stock issued in initial public offering, net of issuance costs |
164,405,679 | — | — | |||||||||
| Proceeds from the issuance of shares of common stock in private placement |
— | 49,889 | — | |||||||||
| Proceeds from issuance of Series C preferred stock |
6,550,984 | 4,980,652 | 1,103,218 | |||||||||
|
|
|
|
|
|
|
|||||||
| Net cash flows from financing activities |
58,718,237 | 36,695,723 | 33,762,800 | |||||||||
|
|
|
|
|
|
|
|||||||
| EFFECT OF EXCHANGE RATE CHANGES ON CASH |
— | — | 23,829 | |||||||||
|
|
|
|
|
|
|
|||||||
| NET CHANGE IN CASH AND EQUIVALENTS |
33,814,498 | 811,505 | (1,234,982 | ) | ||||||||
| CASH AND EQUIVALENTS, BEGINNING OF YEAR |
2,444,754 | 1,633,249 | 2,868,231 | |||||||||
|
|
|
|
|
|
|
|||||||
| CASH AND EQUIVALENTS, END OF PERIOD |
$ | 36,259,252 | $ | 2,444,754 | $ | 1,633,249 | ||||||
|
|
|
|
|
|
|
|||||||
| SUPPLEMENTAL CASH FLOW INFORMATION: |
||||||||||||
| Interest paid |
$ | 4,702,333 | $ | 2,926,355 | $ | 1,466,346 | ||||||
|
|
|
|
|
|
|
|||||||
| NON-CASH INVESTING AND FINANCING ACTIVITIES: |
||||||||||||
| Preferred stock dividend accretion of Series C and Series B Preferred Stock and additional loss upon conversion of Series C Preferred Stock into common stock upon consummation of IPO |
$ | 93,940,876 | $ | 8,595,504 | $ | 7,953,448 | ||||||
| Property, plant and equipment purchases in accounts payable |
$ | 983,959 | $ | 249,356 | $ | 3,459,680 | ||||||
|
|
|
|
|
|
|
|||||||
See accompanying notes to the consolidated financial statements.
F-6
Table of Contents
NOTES TO CONSOLIDATED FINANCIAL STATEMENTS
Note 1—Nature of the Business and Summary of Significant Accounting Policies:
Nature of the Business—Freshpet, Inc. (hereafter referred to as “Freshpet” or the “Company”), a Delaware corporation, manufactures and markets natural fresh, refrigerated meals and treats for dogs and cats. The Company’s products are distributed throughout the United States and Canada into major retail classes including Grocery and Mass (which includes club) as well as Pet specialty and Natural retail.
Principles of Consolidation—The accompanying consolidated financial statements have been prepared in accordance with accounting principles generally accepted in the U.S. (“U.S. GAAP”). All intercompany accounts and transactions have been eliminated in consolidation.
Segments—The Company operates as a single operating segment reporting to its chief operating decision maker.
Estimates and Uncertainties—The preparation of financial statements in conformity with U.S. GAAP requires management to make estimates and assumptions that affect the reported amounts of assets and liabilities and disclosure of contingent assets and liabilities at the date of the financial statements, and the reported amounts of revenues and expenses during the reporting period. Actual results, as determined at a later date, could differ from those estimates.
Cash and Cash Equivalents—The Company considers money market funds and all other highly liquid debt instruments purchased with an original maturity of three months or less to be cash equivalents.
Accounts Receivable—The Company records trade accounts receivable at net realizable value. This value includes an appropriate allowance for estimated uncollectible accounts. On a periodic basis, the Company evaluates its accounts receivable and establishes an allowance for doubtful accounts based on its history of write-offs and collections and current credit conditions. Accounts receivable are written off when management deems them to be uncollectible.
Inventories—Inventories are stated at the lower of cost or market, using the first-in, first-out method. When necessary, the Company provides allowances to adjust the carrying value of its inventories to the lower of cost or net realizable value, including any costs to sell or dispose and consideration for obsolescence, excessive inventory levels, product deterioration and other factors in evaluating net realizable value.
Deferred Offering Cost—Deferred offering costs, which primarily consist of direct incremental legal and accounting fees relating to the initial public offering (“IPO”) of the Company’s common stock are capitalized. The deferred offering costs were offset against IPO proceeds upon the consummation of the offering. We closed our IPO on November 13, 2014.
Property, Plant and Equipment—Property, plant and equipment are recorded at cost. The Company provides for depreciation on the straight-line method by charges to income at rates based upon estimated recovery periods of 7 years for furniture and office equipment, 5 years for automotive equipment, 6 – 9 years for refrigeration equipment, 5 – 10 years for machinery and equipment, and 15 – 39 years for building and improvements. Capitalized cost includes the costs incurred to bring the property, plant and equipment to the condition and location necessary for its intended use, which includes any necessary delivery, electrical and installation cost for equipment. Maintenance and repairs that do not extend the useful life of the assets over two years are charged to expense as incurred. Leasehold improvements are amortized over the shorter of the term of the related lease or the estimated useful lives on the straight-line method.
Long-Lived Assets—The Company evaluates all long-lived assets for impairment. Long-lived assets are evaluated for impairment whenever events or changes in circumstances indicate the carrying value of an asset
F-7
Table of Contents
FRESHPET INC. AND SUBSIDIARY
NOTES TO CONSOLIDATED FINANCIAL STATEMENTS
may not be recoverable. Recoverability of assets to be held and used is measured by a comparison of the carrying amount of an asset to estimated undiscounted future net cash flows expected to be generated by the asset. If the carrying amount of an asset exceeds its estimated undiscounted future net cash flows, an impairment charge is recognized by the amount by which the carrying amount of the asset exceeds the fair value of the asset. Recoverability of assets held for sale is measured by a comparison of the carrying amount of an asset or asset group to their fair value less estimated costs to sell. Estimating future cash flows and calculating fair value of assets requires significant estimates and assumptions by management. If the carrying amount is not fully recoverable, an impairment loss is recognized to reduce the carry amount to fair value, and is charged to expense in the period of impairment.
Income Taxes—The Company provides for deferred income taxes for temporary differences between financial and income tax reporting, principally net operating loss carryforwards, depreciation, and share-based compensation. Deferred tax assets and liabilities are measured using enacted tax rates in effect for the years in which those temporary differences are expected to be recovered or settled.
A valuation allowance is appropriate when management believes it is more likely than not, the deferred tax asset will not be realized. At December 31, 2014 and 2013, the Company determined that a valuation allowance of approximately 100% is appropriate.
Revenue Recognition and Incentives—Revenue from product sales is recognized upon shipment to the customers as terms are free on board (FOB) shipping point, at which point title and risk of loss is transferred and the selling price is fixed or determinable. This completes the revenue-earning process specifically that an arrangement exists, delivery has occurred, ownership has transferred, the price is fixed and collectability is reasonably assured. A provision for payment discounts and product return allowances, which is estimated based upon the Company’s historical performance, management’s experience and current economic trends, is recorded as a reduction of sales in the same period that the revenue is recognized.
Trade incentives, consisting primarily of customer pricing allowances and merchandising funds, and consumer coupons are offered through various programs to customers and consumers. Sales are recorded net of estimated trade incentive spending, which is recognized as incurred at the time of sale. Accruals for expected payouts under these programs are included as accrued expense in the consolidated balance sheet. Coupon redemption costs are also recognized as reductions of net sales when the coupons are issued. Estimates of trade promotion expense and coupon redemption costs are based upon programs offered, timing of those offers, estimated redemption/usage rates from historical performance, management’s experience and current economic trends.
Advertising—Advertising costs, consisting primarily of media ads, are expensed as incurred. Advertising costs in 2014, 2013, and 2012 were $14,231,930, $12,037,402, and $10,666,163 respectively.
Shipping and Handling Costs/Freight Out—Costs incurred for shipping and handling are included in selling, general, and administrative expenses within the statement of operations and comprehensive loss. Shipping and handling costs primarily consist of costs associated with moving finished products to customers, including costs associated with distribution center and the cost of shipping products to customers through third-party carriers. Shipping and handling cost totaled $9,447,406, $6,872,953, and $5,170,367 for the years ended 2014, 2013, and 2012, respectively.
Share Based Compensation—The Company recognizes share based compensation based on the value of the portion of share-based payment awards that is ultimately expected to vest during the period. Share-based compensation expense recognized in the statement of operations included compensation expense for share based payment awards granted subsequent to December 31, 2006, based on the grant date fair value estimated. Share awards are amortized under the straight-line method over the requisite service period of the entire award. The
F-8
Table of Contents
FRESHPET INC. AND SUBSIDIARY
NOTES TO CONSOLIDATED FINANCIAL STATEMENTS
Company uses historical data to estimate pre-vesting option forfeitures and record stock based compensation expense only for those awards that are expected to vest. To the extent actual forfeitures differ from the estimates, the difference will be recorded as a cumulative adjustment in the period that the estimates are revised.
The Company determines the fair value of the stock options granted as either the fair value of the consideration received or the fair value of the equity instruments issued, whichever is more reliably measurable.
Fair Value of Financial Instruments—Financial Accounting Standards Board (FASB) guidance specifies a hierarchy of valuation techniques based on whether the inputs to those valuation techniques are observable or unobservable. Observable inputs reflect market data obtained from independent sources, while unobservable inputs reflect market assumptions. The hierarchy gives the highest priority to unadjusted quoted prices in active markets for identical assets or liabilities (Level 1 measurement) and the lowest priority to unobservable inputs (Level 3 measurement).
The three levels of the fair value hierarchy are as follows:
| • | Level 1—Unadjusted quoted prices in active markets for identical assets or liabilities that the reporting entity has the ability to access at the measurement date. Level 1 primarily consists of financial instruments whose value is based on quoted market prices such as exchange-traded instruments and listed equities. |
| • | Level 2—Inputs other than quoted prices included within Level 1 that are observable for the asset or liability, either directly or indirectly (e.g., quoted prices of similar assets or liabilities in active markets, or quoted prices for identical or similar assets or liabilities in markets that are not active). Level 2 includes financial instruments that are valued using models or other valuation methodologies. |
| • | Level 3—Unobservable inputs for the asset or liability. Financial instruments are considered Level 3 when their fair values are determined using pricing models, discounted cash flows or similar techniques and at least one significant model assumption or input is unobservable. |
The carrying amounts reported in the balance sheets for cash and cash equivalents, other receivables, accounts payable and accrued expenses approximate their fair value based on the short-term maturity of these instruments. The warrant liability is recorded at fair value with changes in fair value reflected in the statement of operations and comprehensive loss.
As of December 31, 2014, the Company only maintained Level 1 assets and liabilities.
Note 2—Recently Issued Accounting Standards:
In April 2014, the FASB issued ASU 2014-08, “Reporting Discontinued Operations and Disclosures of Disposals of Components of an Entity,” (“ASU 2014-08”). Under ASU 2014-08, only disposals representing a strategic shift in operations that have a major effect on the Company’s operations and financial results should be presented as discontinued operations. Additionally, ASU 2014-08 requires expanded disclosures about discontinued operations that will provide financial statement users with more information about the assets, liabilities, income, and expenses of discontinued operations. The amendments in ASU 2014-08 are effective for fiscal years, and interim periods within those years, beginning after December 15, 2014. However, ASU 2014-08 should not be applied to a component that is classified as held for sale before the effective date even if the component is disposed of after the effective date. Early adoption is permitted, but only for disposals (or classifications as held for sale) that have not been reported in financial statements previously issued. The effects of ASU 2014-08 will depend on any future disposals by the Company.
F-9
Table of Contents
FRESHPET INC. AND SUBSIDIARY
NOTES TO CONSOLIDATED FINANCIAL STATEMENTS
On May 28, 2014, the FASB issued ASU No. 2014-09, “Revenue from Contracts with Customers”, which requires an entity to recognize the amount of revenue to which it expects to be entitled for the transfer of promised goods or services to customers. The ASU will replace most existing revenue recognition guidance in U.S. GAAP when it becomes effective. The new standard is effective for the Company on January 1, 2017. Early application is not permitted. The standard permits the use of either the retrospective or cumulative effect transition method. The Company is evaluating the effect that ASU 2014-09 will have on its consolidated financial statements and related disclosures. The Company has not yet selected a transition method nor has it determined the effect of the standard on its ongoing financial reporting.
Note 3—Inventories:
Inventories are summarized as follows:
| December 31, | ||||||||
| 2014 | 2013 | |||||||
| Raw materials |
$ | 2,321,458 | $ | 1,431,422 | ||||
| Packaging components material |
1,158,967 | 805,424 | ||||||
| Finished goods |
3,905,219 | 3,459,707 | ||||||
|
|
|
|
|
|||||
| 7,385,644 | 5,696,553 | |||||||
| Reserve for obsolescence |
(71,493 | ) | (184,328 | ) | ||||
|
|
|
|
|
|||||
| $ | 7,314,151 | $ | 5,512,225 | |||||
|
|
|
|
|
|||||
Note 4—Property, Plant and Equipment:
Property, plant and equipment, net are summarized as follows:
| December 31, | ||||||||
| 2014 | 2013 | |||||||
| Refrigeration equipment |
$ | 47,789,991 | $ | 35,649,423 | ||||
| Machinery and equipment |
19,677,778 | 20,767,207 | ||||||
| Building and improvements |
9,985,917 | 9,892,291 | ||||||
| Furniture and office equipment |
1,826,249 | 1,727,248 | ||||||
| Leasehold improvements |
627,962 | 1,474,741 | ||||||
| Construction in progress |
1,941,754 | 143,274 | ||||||
| Automotive equipment |
314,885 | 313,930 | ||||||
|
|
|
|
|
|||||
| 82,164,536 | 69,968,114 | |||||||
| Less: Accumulated depreciation and amortization |
(24,338,575 | ) | (21,204,082 | ) | ||||
|
|
|
|
|
|||||
| $ | 57,825,961 | $ | 48,764,032 | |||||
|
|
|
|
|
|||||
Depreciation and amortization expense related to property, plant and equipment totaled approximately $6,356,736, $5,945,077 and $4,593,668 for the years ended December 31, 2014, 2013 and 2012, respectively; of which $2,453,883, $2,204,282 and $803,654 was recorded in cost of goods sold for 2014, 2013 and 2012, respectively; with the remainder of depreciation and amortization expense being recorded to selling, general and administrative expense.
During June 2013, the Company made a decision to exit its leased manufacturing facility in Quakertown, Pennsylvania. The Company recognized accelerated depreciation of approximately $827,370 during 2013 related
F-10
Table of Contents
FRESHPET INC. AND SUBSIDIARY
NOTES TO CONSOLIDATED FINANCIAL STATEMENTS
to the facility assets that were not going to be redeployed at the Company’s manufacturing facility. These assets were written down to their net realizable value and sold during 2014. The proceeds received from the sale of assets were less than the book value of the assets.
During 2013, the Company completed the construction of a manufacturing facility in Bethlehem, Pennsylvania. The costs associated with this facility were reclassified from construction in progress to depreciable assets during 2013 when the facility was ready for its intended use.
During the three months ended March 31, 2014, the Company completed a project to analyze the estimated future years of service on its existing refrigeration equipment. Based on this analysis, the Company estimates that the useful life of its refrigeration equipment increased from 6 to 9 years. The Company will apply this change in estimate prospectively, which reduced depreciation by approximately $1.8 million in 2014 and will reduce depreciation by approximately $2.0 million for 2015. The useful life of the other classes of property, plant and equipment remains unchanged.
Note 5—Income Taxes:
A summary of income taxes as follows:
| December 31, | ||||||||||||
| 2014 | 2013 | 2012 | ||||||||||
| Current: |
||||||||||||
| Federal |
$ | — | $ | — | $ | — | ||||||
| State |
41,753 | 31,525 | 32,776 | |||||||||
|
|
|
|
|
|
|
|||||||
| 41,753 | 31,525 | 32,776 | ||||||||||
|
|
|
|
|
|
|
|||||||
The provisions for income taxes do not bear a normal relationship to loss before income taxes primarily as a result of the valuation allowance on deferred tax assets.
The most significant jurisdictions in which the Company is required to file income tax returns include the U.S. federal jurisdiction and the States of New Jersey, California, Indiana, Pennsylvania and Texas. The Company is no longer subject to U.S. Federal income tax examinations for year ends prior to 2011. With limited exceptions, the Company is no longer subject to state income tax examinations for year ends prior to 2010.
The reconciliation of the statutory federal income tax rate to the Company’s effective tax is presented below:
| December 31, | ||||||||||||
| 2014 | 2013 | 2012 | ||||||||||
| Tax at federal statutory rate |
34.00 | % | 34.00 | % | 34.00 | % | ||||||
| State taxes, net of federal |
0.13 | % | (0.10 | )% | 0.11 | % | ||||||
| Permanent items |
(18.40 | )% | (0.37 | )% | (0.84 | )% | ||||||
| Other |
(1.58 | )% | 0.33 | % | 0.55 | % | ||||||
| Valuation allowance |
(14.26 | )% | (34.00 | )% | (34.00 | )% | ||||||
|
|
|
|
|
|
|
|||||||
| Effective tax rate |
(0.11 | )% | (0.14 | )% | (0.18 | )% | ||||||
|
|
|
|
|
|
|
|||||||
F-11
Table of Contents
FRESHPET INC. AND SUBSIDIARY
NOTES TO CONSOLIDATED FINANCIAL STATEMENTS
The tax effects of temporary differences that give rise to significant portions of the deferred tax assets and deferred tax liabilities are as follows:
| December 31, | ||||||||||||
| 2014 | 2013 | 2012 | ||||||||||
| Net deferred tax asset carryforward |
$ | 59,942,144 | $ | 48,735,783 | $ | 41,034,013 | ||||||
| Fees on debt guarantee |
— | 2,692,877 | 721,670 | |||||||||
| Stock option expense |
1,742,186 | 1,028,880 | 707,505 | |||||||||
| Property and equipment |
(4,605,896 | ) | (1,675,683 | ) | 454,480 | |||||||
| Other |
48,224 | 1,026,231 | 1,284,161 | |||||||||
| Less: Valuation allowance |
(57,126,658 | ) | (51,808,088 | ) | (44,201,829 | ) | ||||||
|
|
|
|
|
|
|
|||||||
| Net deferred tax |
$ | — | $ | — | $ | — | ||||||
|
|
|
|
|
|
|
|||||||
In assessing the realizability of the net deferred tax assets, the Company considers all relevant positive and negative evidence to determine whether it is more likely than not that some portion or all of the deferred income tax assets will not be realized. The realization of the gross deferred tax assets is dependent on several factors, including the generation of sufficient taxable income prior to the expiration of the net operating loss carryforwards. The Company believes that it is more likely than not that the Company’s deferred income tax assets will not be realized. The Company has experienced taxable losses from inception. As such, there was a full valuation allowance against the net deferred tax assets as of December 31, 2014 and 2013.
At December 31, 2014, the Company had federal net operating loss (“NOL”) carryforwards of $162,996,989 which expire between 2025 and 2034. The Company may be subject to certain limitations in its annual utilization of net operating loss carryforwards to off-set future taxable income pursuant to Section 382 of the Internal Revenue Code, which could result in NOLs expiring unused. At December 31, 2014, the Company had $124,504,677 of State NOLs which expire between 2015 and 2034.
Entities are also required to evaluate, measure, recognize and disclose any uncertain income tax provisions taken on their income tax returns. The Company has analyzed its tax positions and has concluded that as of December 31, 2014, there were no uncertain positions. Interest and penalties, if any, as they relate to income taxes assessed, are included in the income tax provision. There was no income tax related interest and penalties included in the income tax provision for 2014, 2013, and 2012.
Net deferred tax assets and liabilities are summarized as follows:
| December 31, | ||||||||||||
| 2014 | 2013 | 2012 | ||||||||||
| Total deferred tax assets |
$ | 61,732,553 | $ | 53,483,771 | $ | 44,201,829 | ||||||
| Total deferred tax liabilities |
(4,605,895 | ) | (1,675,683 | ) | — | |||||||
| Valuation allowance |
(57,126,658 | ) | (51,808,088 | ) | (44,201,829 | ) | ||||||
|
|
|
|
|
|
|
|||||||
| Net deferred income tax assets |
$ | — | $ | — | $ | — | ||||||
|
|
|
|
|
|
|
|||||||
F-12
Table of Contents
FRESHPET INC. AND SUBSIDIARY
NOTES TO CONSOLIDATED FINANCIAL STATEMENTS
Note 6—Accrued Expenses:
Accrued expenses are summarized as follows:
| December 31, | ||||||||
| 2014 | 2013 | |||||||
| Accrued payroll |
$ | 1,802,756 | $ | 1,131,880 | ||||
| Other accrued expenses |
383,679 | 259,018 | ||||||
| Other accrued interest |
22,500 | 307,064 | ||||||
| Accrued marketing |
127,028 | — | ||||||
| Accrued freight |
97,561 | 166,472 | ||||||
| Accrued chiller maintenance |
349,792 | 43,047 | ||||||
| Accrued sales and use tax |
155,000 | — | ||||||
|
|
|
|
|
|||||
| $ | 2,938,316 | $ | 1,907,481 | |||||
|
|
|
|
|
|||||
Note 7—Debt:
As of December 31, 2014, the Company had no outstanding debt. The recorded carrying values of our debt balances approximate fair value given our debt is at variable rates tied to market indicators or is short-term in nature. A detailed cash flow related to debt throughout 2014 is summarized in the table below:
| December 31, | ||||
| 2014 | ||||
| Borrowings on long-term debt |
||||
| Borrowings on $27,000,000 Revolving Note Payable |
9,000,000 | |||
| Borrowings on $62,500,000 Revolving Note Payable |
2,500,000 | |||
|
|
|
|||
| Total borrowings on long-term debt |
11,500,000 | |||
|
|
|
|||
| Repayment on long-term debt |
||||
| Repayment of $27,000,000 Revolving Note Payable |
(24,000,000 | ) | ||
| Repayment of $62,500,000 Revolving Note Payable |
(62,500,000 | ) | ||
| Pay down of $1,500,000 10% Note |
(1,500,000 | ) | ||
|
|
|
|||
| Total repayment on long-term debt |
(88,000,000 | ) | ||
|
|
|
|||
| Net borrowings on short-term debt |
||||
| Borrowings on $40,000,000 Credit Facilities |
18,000,000 | |||
| Repayment of $40,000,000 Credit Facilities |
(18,000,000 | ) | ||
| Borrowings on $2,000,000 Convertible Shareholder Note |
2,000,000 | |||
| Repayment of $2,000,000 Convertible Shareholder Note |
(2,000,000 | ) | ||
|
|
|
|||
| — | ||||
|
|
|
|||
The debt listed below represents debt instruments available during the years ended December 31, 2014 and 2013.
| a. | $1,500,000 10% Note |
Consists of $1,500,000 of notes issued to certain of its stockholders which accrued interest compounded annually at a rate of 10%. These notes and all accrued interest were initially due on December 23, 2020. Upon consummation of the IPO, the $1,500,000 10% note and accrued interest of $854,925 were repaid, and the debt was extinguished. The accrued interest totaled $667,110 at December 31, 2013.
F-13
Table of Contents
FRESHPET INC. AND SUBSIDIARY
NOTES TO CONSOLIDATED FINANCIAL STATEMENTS
In connection with the issuance of these notes in February 2010, for every $16.39 that was borrowed with the notes, one share of common stock was issued to the lender. As a result, 91,528 shares of common stock were issued and fair value of the stock at issuance, $6.56 a share, was recorded as a discount to the debt. The unamortized discount equaled $387,688 at December 31, 2013. Upon repayment of the note, the entire unamortized discount was recorded as interest expense in the statement of operations and comprehensive loss.
| b. | $27,000,000 Revolving Note Payable |
The $27,000,000 revolving note payable initially matured on October 31, 2015. Upon consummation of the IPO, the outstanding $24,000,000 and accrued interest of $198,084 was repaid. The terms of the $27,000,000 revolving note payable were modified to the $40,000,000 Credit Facilities. See section “d” below.
The borrowings bore interest at either a LIBOR Rate plus 8% margin or a Base Rate plus 6%, depending on the election of the Company. Base Rate was defined as the rate of interest publicly quoted by The Wall Street Journal as the “base rate on corporate loans posted by at least 75% of the nation’s 30 largest banks.” If the Company elected to utilize the LIBOR Rate, it could elect to use a 1, 2, or 3 month LIBOR Rate with the interest payable upon the last day of the interest period applicable to the Company’s LIBOR rate election. Interest for the Base Rate loan was payable monthly with the balance of any outstanding advances due at maturity. An unused line of credit fee of 1%, payable monthly, was charged for any portion of the line that was not used, unless at least $3 million was kept on deposit with the bank.
The loan agreement provided for the maintenance of various financial covenants. The Company remained in compliance with these requirements throughout the term of the borrowings. Borrowings on this revolving note payable totaled $15,000,000 at December 31, 2013, and reached total borrowings of $24,000,000 during 2014 prior to repayment.
| c. | $62,500,000 Revolving Note Payable |
The $62,500,000 revolving line of credit agreement initially had a maturity date of May 1, 2016. Upon consummation of the IPO, $62,500,000 and accrued interest of $198,469 was paid off, and the debt was extinguished. Upon extinguishment, the Company recorded the unamortized loan origination fees of $311,458 as interest expense in the consolidated statement of operations and comprehensive loss.
The borrowings bore interest at either a LIBOR Rate (LIBOR Adjusted Rate, plus 3.25%) or a Base Rate (Base Rate plus 2.25%). Base rate was defined as the greater of the Prime Rate on the date of the borrowing and the Federal Funds Effective Rate plus 0.5%. Interest on Base Rate Loans were payable monthly, LIBOR Rate loans were payable at the end of the selected interest rate. This note payable was subordinated to the $15,000,000 revolving note payable except for the first mortgage on the Bethlehem, Pennsylvania property. The loan agreement provided for the maintenance of certain financial covenants. The Company was in compliance with these requirements throughout the term of the borrowings. Borrowings on this revolving note payable totaled $60,000,000 at December 31, 2013, and reached total borrowings of $62,500,000 before pay off.
In connection with this note, the Company entered into a Fee and Reimbursement Agreement with certain stockholders who were also guarantors of the note. See note 11 for further detail.
| d. | $40,000,000 Credit Facilities |
On November 13, 2014, the Company entered into senior secured credit facilities comprising a 5-year $18,000,000 term facility (the “Term Facility”), a 3-year $10,000,000 revolving facility (the “Revolving
F-14
Table of Contents
FRESHPET INC. AND SUBSIDIARY
NOTES TO CONSOLIDATED FINANCIAL STATEMENTS
Facility”) and a $12,000,000 additional term loan commitment earmarked primarily for capital expenditures. Upon closing the $40,000,000 Credit Facilities, the Company had $18,000,000 of aggregate principal amount outstanding under the Term Facility.
On December 23, 2014, the Company repaid the outstanding $18,000,000 million and modified the terms of the $40,000,000 Credit Facilities. The $18,000,000 term facility was extinguished, the 3-year $10,000,000 Revolving Facility remained unchanged, and the $12,000,000 term loan commitment earmarked for capital expenditures was increased to $30,000,000.
Any drawn Capex Commitments will mature on the fifth anniversary of the execution of the loan agreement. Any undrawn Capex Commitments will expire on the third anniversary of the execution of the agreement. Under the terms of the loan agreement, the commitments for the Revolving Facility may be increased up to $10,000,000 subject to certain conditions.
Borrowings under the Credit Facilities will bear interest at variable rates depending on the Company’s election, either at a base rate or at LIBOR, in each case, plus an applicable margin. The initial applicable margin will be 3.75% for base rate loans and 4.75% for LIBOR loans. Thereafter, subject to the Company’s leverage ratio, the applicable base rate margin will vary from 2.75% and 3.75% and the applicable LIBOR rate margin will vary from 3.75% and 4.75%. The loan agreement provides for the maintenance of certain financial covenants. The Company was in compliance with these requirements as of December 31, 2014.
| e. | $2,000,000 Convertible Notes |
On October 23, 2014, the Company issued $2,000,000 in aggregate principal amount of convertible notes to certain of its stockholders, which were repaid upon the consummation of the IPO. The convertible notes were issued at 98% of par and were convertible into Series C Preferred Stock at a price of $5.25 per share, at the option of the holder, at any time after December 31, 2014. The Company did not accrue interest as the convertible notes started to accrue interest on December 7, 2014, which was after the November 13, 2014 repaid.
Note 8—Commitments:
Leases—The Company leases office and manufacturing space under non-cancelable operating leases that expire at various dates through January 31, 2017. As of December 31, 2014, future minimum rentals due under these leases were as follows:
| December 31, | ||||
| 2014 | ||||
| 2015 |
$ | 370,318 | ||
| 2016 |
348,153 | |||
| 2017 |
29,013 | |||
|
|
|
|||
| $ | 747,484 | |||
|
|
|
|||
Rent expense related to these non-cancelable operating leases was $404,438, $481,269, and $326,523 for the years 2014, 2013, and 2012, respectively.
Note 9—Redeemable Preferred Stock:
Immediately following the closing of the IPO on November 13, 2014, the Company redeemed all the outstanding shares of Series B Preferred Stock (“Series B”), including cumulative dividends, for a cash payment of $34,998,957. Additionally, immediately prior to the closing of the IPO, the Company converted the outstanding
F-15
Table of Contents
FRESHPET INC. AND SUBSIDIARY
NOTES TO CONSOLIDATED FINANCIAL STATEMENTS
shares of Series C Preferred Stock (“Series C”) to 11,067,090 shares of common stock. Based on the Series C anti-dilutive clause, the conversion from Series C to common stock was to be equivalent to the 1-to-0.7396 common stock share split that occurred during 2014 in connection with the IPO. The converted Series C included 2,477,756 Series C related to the Fees on Debt Guarantee, which were converted to 1,832,531 shares of common stock. See note 11 for further detail.
Dividends
Holders of Series B were entitled to receive dividends payable in additional fully paid and non-assessable shares of Series B at a rate per annum of 15% of the original issue price. Such dividends were to be fully cumulative from the first day of issuance and accrued without interest on both the initial Series B shares obtained and shares obtained via dividend, on a quarterly basis. The dividend accrued during the years ended 2014, 2013, and 2012 was $4,271,550, $4,215,230, and $3,638,052, respectively. The total cumulative dividends that were paid on November 13, 2014 upon redemption of the Series B was $23,840,008.
Holders of Series C were entitled to dividends at a rate of 8% per annum of the Series C original issue price, subject to appropriate adjustment in the event of any stock dividend, stock split, combination or other similar recapitalization with respect to Series C. Accrued dividends were to be payable only when, and if declared by the Board of Directors. In addition, holders of Series C were entitled to share ratably in any cash dividends declared and paid on the common stock in an amount per share equal to the amount of the dividend proposed to be paid on a share of common stock multiplied by the number of shares of common stock issuable upon conversion of the Series C. Once the Series C shares were converted to common stock, the accrued dividends that had not been declared by the Board of Directors were relinquished. Upon conversion none of the accrued dividends had been declared by the Board of Directors. The dividend accrued during the year ended 2013 and 2012 was $4,380,274 and $4,315,396, respectively. Immediately prior to the conversion of Series C to Common Stock, the Series C shares were fair valued utilizing the share price at the date of conversion. The difference between fair value and book value of $82,654,683 was recorded to net loss attributable to common stockholders. The difference between fair value and book value was net of $64,341,539 of cash proceeds received, net off issuance costs, and $19,687,856 of dividend accretion through the settlement date, of which $7,014,643 was recorded in 2014.
See the table below for detail over the cumulative dividends.
| Fair value per Series C share on November 13, 2014 (date of conversion) |
$ | 166,683,790 | ||
| Cash proceeds received, net of issuance costs(1) |
(64,341,539 | ) | ||
| Cumulative dividend accretion at December 31, 2013 |
(12,672,925 | ) | ||
| Dividend accretion during 2014 |
(7,014,643 | ) | ||
| Additional loss to common shareholders upon conversion of Series C to common stock |
$ | 82,654,683 |
| (1) | —Represents the cash proceeds received, net of issuance costs, by the company from Series C investors throughout the life of the security. |
Series B and Series C were historically classified on the balance sheet outside of permanent equity.
Note 10—Warrant:
In connection with a loan transaction with a bank prior to 2011, and in consideration thereof, the Company issued to a bank a warrant to purchase up to an aggregate of 61,117 shares of voting common stock of the Company at a purchase price of $6.28 per share. In the event the Company issues additional equity instruments at a purchase price or exercise price lower than the warrant exercise price, such exercise price shall be adjusted. This warrant was recorded as a liability with adjustments to fair value recorded in the statement of operations.
F-16
Table of Contents
FRESHPET INC. AND SUBSIDIARY
NOTES TO CONSOLIDATED FINANCIAL STATEMENTS
This warrant is exercised upon surrender to the Company, on a net basis, such that, without the exchange of any funds, such holder purchases that number of shares otherwise issuable upon exercise of its warrant less that number of shares having a current market price at the time of exercise equal to the aggregate exercise price that would otherwise have been paid by such holder upon the exercise of the warrant.
This warrant automatically converts in October 2017 without any action by the holder. The accrued warrant as of December 31, 2014 was $706,940.
Note 11—Guarantee Agreement:
In connection with the $62,500,000 revolving note payable (see note 7), the Company entered into a Fee and Reimbursement Agreement with certain stockholders who were also guarantors of the note. That agreement stipulated that the Company would pay each guarantor a contingent fee equal to 10% per annum of the amount that each guarantor had committed to guarantee. The payment was to be made in the form of newly issued shares of Series C Preferred Stock at the price of $5.25 per share. The fee accrued only from and after the date that the Guarantor entered into the Guarantee, and if at any time any Guarantor’s obligation was terminated in full or in part, the Fee would continue to accrue only with respect to the amount, if any of such Guarantor’s remaining commitment under the Credit Agreement. The fee was contingent in that it would become due and payable only if all principal and interest under the credit agreement had been repaid and a Change of Control had occurred. A Change of Control was defined as any sale, merger, consolidation, share exchange, business combination, equity issuance, or other transaction or series of related transactions, specifically excluding public offerings, which result in the stockholders immediately prior to the transaction(s) owning collectively less than 50% of the voting control immediately following the transaction(s); or (ii) any sale, lease, exchange, transfer, or other disposition of substantially all of the assets, taken as a whole, in a single transaction or series of transactions, excluding sales in the ordinary course of business, sale/leaseback and corporate restructuring transactions.
Immediately prior to the closing of the IPO, the Company converted outstanding fees under the guarantee into 2,477,756 shares of Series C, which were then converted into 1,832,531 shares of common stock.
The fees on debt guarantee was a financial instrument that was recognized as a liability by the Company and recorded at fair value at issuance. The instrument was then adjusted to its then fair value at each reporting period with changes in fair value recorded in the consolidated statement of operations and comprehensive loss. Historically the Company measured the fair value of the outstanding fee on debt guarantee using an option pricing method with several possible distribution outcomes depending on the timing and kind of liquidity event. Expected volatility was estimated utilizing the historical volatility of similar companies. The risk-free interest rates was based on the U.S. Treasury yield for a period consistent with the expected contractual life.
Upon the conversion of the fees on debt guarantee into shares of Series C, and then subsequently into common stock, the share price of the Company’s common stock was utilized to fair value the fees on debt guarantee and record the final fees on debt guarantee.
Note 12—Equity Incentive Plans:
Total compensation cost for share-based payments recognized for the years ended December 31, 2014, 2013, and 2012 was approximately $1,563,976, $978,352, and $1,118,705, respectively. Cost of goods sold the year ended December 31, 2014, 2013, and 2012 included share based compensation of approximately $71,669, $90,614, and $107,067, respectively. Selling, general, and administrative expense for the year ended December 31, 2014, 2013, and 2012 included share-based compensation of approximately $1,492,307, $887,738, and $1,011,638, respectively.
F-17
Table of Contents
FRESHPET INC. AND SUBSIDIARY
NOTES TO CONSOLIDATED FINANCIAL STATEMENTS
2006 Stock Plan—In December 2006, the Company approved the 2006 Stock Plan (the “2006 Plan”) under which options to purchase approximately 624,223 shares of the Company’s common stock were granted to employees and affiliates of the Company. These options vest over 5 years. Certain option awards provide for accelerated vesting if there is a change in control (as defined in the 2006 Plan). At December 31, 2014, there were zero shares available for grant as the plan is frozen. The options granted have maximum contractual terms ranging from 5 to 10 years.
2010 Stock Plan—In December 2010, the Company approved the 2010 Stock Plan (the “2010 Plan”) under which options to purchase approximately 2,146,320 shares of the Company’s common stock were granted to employees and affiliates of the Company (in 2012, the 2010 Plan was amended to allow for option to purchase approximately 2,220,280 shares of the Company’s common stock). These options are either time-based (vest over 4 years), performance-based (vest when performance targets are met, as defined in the stock option grant agreement), or vest at the occurrence of an exit event which is defined as a Change of Control in the Company or an initial public offering registered under the Securities Act, as defined in the stock grant agreement.
In November, 2014, the Company made modifications that affected all performance-based awards and all exit-event awards under the 2010 Plan. Performance-based awards were modified to time vested awards that cliff vest over two years. At the time of modification the original performance-based awards vesting criteria was not considered probable. The exit-event awards were modified to performance-based awards. At December 31, 2014 the new performance-based awards vesting criteria is considered probable. The modified awards were fair valued on the modification date.
The options granted have maximum contractual terms of 10 years. The Board of Directors froze the 2010 Stock Plan such that no further grants may be issued under the 2010 Stock Plan.
2014 Omnibus Incentive Plan—In November 2014, the Company approved the 2014 Omnibus Incentive Plan (the “2014 Plan”) under which 1,479,200 shares of common stock may be issued or used for reference purposes as awards granted under the 2014 Plan. These awards may be in the form of stock options, stock appreciation rights, restricted stock, as well as other stock based and cash based awards. As of December 31, 2014, the stock options granted were either time-based (cliff vest over 3 years) or performance-based (vest when performance targets are met, as defined in the stock option grant agreement).
In addition to stock options granted under the 2014 Plan, the Company issued restricted stock units to the board of directors as compensation for their services. The fair value of restricted stock units is based on the share price on the date of grant. These restricted stock units vest over one year, but are not delivered until the end of the year. The Company will settle these awards by common stock transfer. During 2014 there were 24,166 restricted stock units granted.
At December 31, 2014, there were 943,198 shares of common stock available to be issued or used for reference purposes under the 2014 Plan.
F-18
Table of Contents
FRESHPET INC. AND SUBSIDIARY
NOTES TO CONSOLIDATED FINANCIAL STATEMENTS
Service Period Stock Options—A summary of service period stock options outstanding and changes under the plans during the year ended December 31, 2014 is presented below:
| Options |
Shares | Weighted Average Exercise Price |
Average Remaining Contractual Term |
Aggregate Intrinsic Value |
||||||||||||
| Outstanding at December 31, 2012 |
1,095,412 | $ | 6.82 | |||||||||||||
| Granted |
— | — | ||||||||||||||
| Exercised |
(7,953 | ) | 6.28 | |||||||||||||
| Forfeited |
(4,719 | ) | 6.72 | |||||||||||||
|
|
|
|
|
|||||||||||||
| Outstanding at December 31, 2013 |
1,082,740 | 6.91 | ||||||||||||||
|
|
|
|
|
|||||||||||||
| Granted |
255,585 | 15.00 | ||||||||||||||
| Modified from Performance Based Options to Service Period Stock Options |
680,753 | 7.10 | ||||||||||||||
| Exercised |
— | — | ||||||||||||||
| Forfeited |
(741 | ) | 6.27 | |||||||||||||
|
|
|
|
|
|||||||||||||
| Outstanding at December 31, 2014 |
2,018,337 | $ | 7.91 | 5.8 | $ | 18,391,809 | ||||||||||
|
|
|
|
|
|
|
|
|
|||||||||
| Exercisable at December 31, 2014 |
1,064,565 | $ | 6.81 | 4.5 | $ | 10,914,048 | ||||||||||
|
|
|
|
|
|
|
|
|
|||||||||
No options were exercised during the year ended 2014 or 2012. The total intrinsic value of options exercised during the year ended December 31, 2013 was $6,559.
A summary of the nonvested service period stock options as of December 31, 2014, and changes during the year ended December 31, 2014, is presented below:
| Number of Options |
Weighted- Average Grant-Date Fair Value Per Share |
|||||||
| Nonvested as of December 31, 2013 |
189,234 | $ | 6.02 | |||||
| Granted |
255,585 | 6.34 | ||||||
| Modified from Performance Based Options to Service Period Stock Options |
680,753 | 8.90 | ||||||
| Vested |
(171,059 | ) | 5.83 | |||||
| Forfeited |
(741 | ) | 6.25 | |||||
|
|
|
|||||||
| Nonvested as of December 31, 2014 |
953,772 | $ | 8.16 | |||||
|
|
|
|||||||
As of December 31, 2014, there is approximately $7,090,519 of total unrecognized compensation costs related to non-vested service period options, of which $3,574,546 will be incurred in 2015, $3,065,920 will be incurred in 2016, and the remaining $450,053 will be incurred in 2017.
F-19
Table of Contents
FRESHPET INC. AND SUBSIDIARY
NOTES TO CONSOLIDATED FINANCIAL STATEMENTS
Performance Based Options—Performance based option vesting is contingent upon the Company achieving certain annual or cumulative revenue goals. A summary of performance-based stock options outstanding and changes under the plans during the year ended December 31, 2014 is presented below:
| Options |
Shares | Weighted Average Exercise Price |
Average Remaining Contractual Term |
Aggregate Intrinsic Value |
||||||||||||
| Outstanding at December 31, 2012 |
674,942 | $ | 7.10 | |||||||||||||
| Granted |
11,094 | 7.10 | ||||||||||||||
| Forfeited |
(5,283 | ) | 7.10 | |||||||||||||
|
|
|
|
|
|||||||||||||
| Outstanding at December 31, 2013 |
680,753 | 7.10 | ||||||||||||||
|
|
|
|
|
|||||||||||||
| Granted |
255,585 | 15.00 | ||||||||||||||
| Modified from Exit Event Options to Performance Based Options |
657,693 | 7.10 | ||||||||||||||
| Modified from Performance Based Options to Service Period Stock Options |
(680,753 | ) | 7.10 | |||||||||||||
|
|
|
|
|
|||||||||||||
| Outstanding at December 31, 2014 |
913,278 | $ | 9.31 | 7.1 | $ | 7,078,163 | ||||||||||
|
|
|
|
|
|
|
|
|
|||||||||
No performance-based options are exercisable at December 31, 2014, 2013, or 2012. A summary of the nonvested performance-based options as of December 31, 2014, and changes during the year ended December 31, 2014, is presented below:
| Number of Options |
Weighted- Average Grant-Date Fair Value Per Share |
|||||||
| Outstanding at January 1, 2014 |
680,753 | $ | 5.85 | |||||
| Granted |
255,585 | 6.41 | ||||||
| Modified from Exit Event Options to Performance Based Options |
657,693 | 9.31 | ||||||
| Modified from Performance Based Options to Service Period Stock Options |
(680,753 | ) | (5.85 | ) | ||||
|
|
|
|||||||
| Nonvested as of December 31, 2014 |
913,278 | $ | 8.50 | |||||
|
|
|
|
|
|||||
As of December 31, 2014, there is approximately $7,623,690 of total unrecognized compensation costs related to non-vested performance based options, which would be recognized if and when the contingent vesting criteria is met. Assuming all contingent vesting criteria is met each year, $3,495,497 will be incurred in 2015, $3,565,203 will be incurred in 2016, and $562,990 will be incurred in 2017. As of December 31, 2014, the achievement of the vesting criteria is considered probable.
F-20
Table of Contents
FRESHPET INC. AND SUBSIDIARY
NOTES TO CONSOLIDATED FINANCIAL STATEMENTS
Exit Event Options—Exit event option vesting is contingent upon an the occurrence of an exit event, which results from a Change of Control in the Company or an Initial Public Offering of the Company’s common stock under the Securities Act, as defined in the option grant agreement. A summary of exit event stock options outstanding and changes under the plans during the year ended December 31, 2014 is presented below:
| Shares | Weighted Average Exercise Price |
Average Remaining Contractual Term |
Aggregate Intrinsic Value |
|||||||||||||
| Outstanding at December 31, 2012 |
873,508 | $ | 7.10 | |||||||||||||
| Granted |
5,177 | 7.10 | ||||||||||||||
| Forfeited |
(1,761 | ) | 7.10 | |||||||||||||
|
|
|
|
|
|||||||||||||
| Outstanding at December 31, 2013 |
876,924 | 7.10 | ||||||||||||||
|
|
|
|
|
|||||||||||||
| Cancelled |
(219,231 | ) | 7.10 | |||||||||||||
| Modified from Exit Event Options to Performance Based Options |
(657,693 | ) | 7.10 | |||||||||||||
|
|
|
|
|
|||||||||||||
| Outstanding at December 31, 2014 |
— | — | — | — | ||||||||||||
|
|
|
|
|
|
|
|
|
|||||||||
No exit event options were exercisable at December 31, 2013, or 2012. A summary of the nonvested service period stock options as of December 31, 2014, and changes during the year ended December 31, 2014, is presented below:
| Number of Options |
Weighted- Average Grant-Date Fair Value Per Share |
|||||||
| Outstanding at January 1, 2014 |
876,924 | $ | 5.85 | |||||
| Cancelled |
(219,231 | ) | 5.85 | |||||
| Modified from Exit Event Options to Performance Based Options |
(657,693 | ) | 5.85 | |||||
|
|
|
|||||||
| Nonvested as of December 31, 2014 |
— | |||||||
|
|
|
|
|
|||||
Grant Date Fair Value of Options—The weighted average grant date fair value of options (service period options and performance based options) granted and modified during the year ended December 31, 2014 was $8.35 per share. The weighted average grant date fair value of options granted during the year ended December 31, 2013 and December 31, 2012 were $5.40 and 5.55 per share, respectively.
Expected Volatility—For the grants during the year ended December 31, 2013 the expected volatility was based on the historical volatility of the Company’s common stock.
The grants during the year ended December 31, 2014 all occurred while the Company was publicly traded. Subsequent to the Company’s IPO on November 6, 2014, the Company no longer deemed it appropriate to use its historical volatility as the historical volatility was not representative of the Company’s stock on the public market. As such the expected volatility used is based upon the volatility of a group of similar entities, referred to as “guideline” companies. The Company considered factors such as industry, stage of life cycle and size in considering these “guideline” companies.
F-21
Table of Contents
FRESHPET INC. AND SUBSIDIARY
NOTES TO CONSOLIDATED FINANCIAL STATEMENTS
Weighted Average Expected Term—The Company determined the expected term based on the “shortcut method” described in FASB ASC 718, Compensation—Stock Compensation (an expected term based on the midpoint between the vesting date and the end of the contractual term).
Risk-Free Interest Rate—The risk-free interest rates are based on the U.S. Treasury yield for a period consistent with the expected term of the option in effect at the time of the grant.
Expected Dividend Yield—The Company has not historically declared dividends, and no future dividends are expected to be available to benefit option holders. Accordingly, the Company used an expected dividend yield of zero in the valuation model.
| Year Ended December 31, | ||||||
| 2014 |
2013 | 2012 | ||||
| Expected volatility |
41.9% | 86.0% | 91.2% | |||
| Average expected term in years |
3.9 - 6.6 | 7 | 7 | |||
| Risk-free interest rate |
1.01% - 2.09% | 1.7% | 1.2% | |||
| Expected dividend yield |
0.0% | 0.0% | 0.0% | |||
Note 13—Net Loss Attributable to Common Stockholders:
Basic net loss per common share is calculated by dividing net loss attributable to common stockholders by the weighted-average number of common share outstanding for the period. Diluted net loss per common share is computed by giving effect to all potentially dilutive securities. Diluted net loss per common share is the same as basic net loss per common share, due to the fact that potentially dilutive securities would have an antidilutive effect as the Company incurred a net loss for the year ended December 31, 2014 and 2013.
The computation of net income attributable to common stockholders is as follows:
| Year ended December 31, | ||||||||||||
| 2014 | 2013 | 2012 | ||||||||||
| Net Loss |
$ | (37,339,017 | ) | $ | (21,687,155 | ) | $ | (18,656,498 | ) | |||
| Preferred stock dividends on Series B and Series C |
(11,286,193 | ) | (8,595,504 | ) | (7,953,448 | ) | ||||||
| Additional loss attributable to common stockholders upon conversion of Series C Preferred Stock into common stock |
(82,654,683 | ) | ||||||||||
|
|
|
|
|
|
|
|||||||
| Net Loss attributable to common stockholders |
$ | (131,279,893 | ) | $ | (30,282,659 | ) | $ | (26,609,946 | ) | |||
|
|
|
|
|
|
|
|||||||
The potentially dilutive securities excluded from the determination of diluted loss per share, as their effect is antidilutive, are as follows:
| Year ended December 31, | ||||||||||||
| 2014 | 2013 | 2012 | ||||||||||
| Convertible Preferred Series C (on an as-if converted basis) |
— | 7,713,455 | 7,598,805 | |||||||||
| Service Period Stock Options |
1,220,739 | 1,092,604 | 1,094,618 | |||||||||
| Warrants |
61,117 | 61,117 | 61,117 | |||||||||
|
|
|
|
|
|
|
|||||||
| 1,281,856 | 8,867,176 | 8,754,540 | ||||||||||
|
|
|
|
|
|
|
|||||||
F-22
Table of Contents
FRESHPET INC. AND SUBSIDIARY
NOTES TO CONSOLIDATED FINANCIAL STATEMENTS
Note 14—Retirement Plan:
The Company sponsors a safe harbor 401(k) plan covering all employees. All employees are eligible to participate. Active participants in the plan may make contributions of up to 25% of their compensation. Company contributions totaled approximately $307,754 in 2014, $196,054 in 2013, and $180,098 in 2012.
Note 15—Related Party Transactions:
Payments made to a stockholder for distribution services totaled approximately $8,900,444 in 2014, and $6,146,245 in 2013, and $4,882,534 in 2012. Payments made to stockholders for the purchase of raw materials totaled approximately $5,545,835 in 2014, $4,658,118 in 2013, and $3,059,658 in 2012. In addition there were payments of $175,399 in 2014, $678,371 in 2013, and $707,686 in 2012, related to rent and associated utilities and maintenance to a stockholder who is also a landlord of one of our locations. The rent and associated utilities and maintenance cost were at market rates. None of the above payments were made to any stockholder who is an employee, board member, subsidiary, or affiliate of the Company.
In connection with the $62,500,000 revolving note payable, certain stockholders were guarantors of the note. The agreement stipulated that the Company will pay each guarantor a contingent fee equal to 10% per annum of the amount that each guarantor committed to guarantee. Upon consummation of the IPO, the fees on debt guarantee were paid in the form of Series C shares. See note 11 for further detail.
Note 16—Concentrations:
Concentration of Credit Risk—The Company maintains its cash balances in financial institutions which are insured by the Federal Deposit Insurance Corporation up to $250,000 each. At times, such balances may be in excess of the FDIC insurance limit.
Major Customers—In 2014, 2013, and 2012 net sales to one of our distributors which sells directly to three of our customers—accounted for 22% 28%, and 20% of our net sales, respectively. In 2014, no customer accounted for more than 10% of our net sales while in 2013 and 2012 one customer accounted for 11% and 14%, respectively, of our net sales.
Major Suppliers—The Company purchased approximately 54% of its raw materials from three vendors during 2014, approximately 56% of its raw materials from three vendors during 2013, and approximately 58% of its raw materials from three vendors during 2012.
The Company also purchased approximately 96% of its treats finished goods from three vendors in 2014, approximately 78% from three vendors in 2013, and approximately 76% from three vendors in 2012.
The Company purchased approximately 74% of its packaging material from three vendors during the twelve months ended December 31, 2014, and approximately 67% of its packaging material from three vendors during the twelve months ended December 31, 2013.
Net Sales by Class of Retail—The following table sets forth net sales by class of retail.
| Twelve months ended December 31, | ||||||||||||
| 2014 | 2013 | 2012 | ||||||||||
| Grocery and Mass(1) |
$ | 65,212,966 | $ | 49,731,873 | $ | 33,985,199 | ||||||
| Pet Specialty, Natural and Other(2) |
21,551,146 | 13,418,903 | 9,534,262 | |||||||||
|
|
|
|
|
|
|
|||||||
| Net Sales |
$ | 86,764,112 | $ | 63,150,776 | $ | 43,519,461 | ||||||
|
|
|
|
|
|
|
|||||||
F-23
Table of Contents
FRESHPET INC. AND SUBSIDIARY
NOTES TO CONSOLIDATED FINANCIAL STATEMENTS
| (1) | Includes club retail class |
| (2) | Other sales represent less than 1% of net sales |
Note 17—Unaudited Quarterly Results:
Unaudited quarterly results for the years ended December 31, 2014, 2013, and 2012 were as follows:
| First Quarter |
Second Quarter |
Third Quarter |
Fourth Quarter |
|||||||||||||
| 2014: |
||||||||||||||||
| Net sales |
19,350,197 | 20,386,038 | 22,519,672 | 24,508,205 | ||||||||||||
| Gain (loss) from operations |
(2,301,404 | ) | (3,328,420 | ) | (1,338,419 | ) | 550,551 | |||||||||
| Net loss |
(5,142,223 | ) | (6,266,803 | ) | (9,483,241 | ) | (16,446,750 | ) | ||||||||
| Net loss attributable to common stockholders(1) |
(7,485,640 | ) | (10,771,077 | ) | (12,380,254 | ) | (100,642,922 | ) | ||||||||
| Basic earnings per common share |
(0.53 | ) | (0.77 | ) | (1.19 | ) | (4.35 | ) | ||||||||
| Diluted earnings per common share |
(0.53 | ) | (0.77 | ) | (1.19 | ) | (4.35 | ) | ||||||||
| 2013: |
||||||||||||||||
| Net sales |
13,885,185 | 14,846,366 | 16,698,903 | 17,720,322 | ||||||||||||
| Loss from operations |
(3,147,240 | ) | (3,205,977 | ) | (4,182,320 | ) | (1,845,139 | ) | ||||||||
| Net loss |
(4,719,104 | ) | (5,253,194 | ) | (6,495,643 | ) | (5,219,214 | ) | ||||||||
| Net loss attributable to common stockholders |
(6,751,248 | ) | (7,364,129 | ) | (8,647,369 | ) | (7,519,913 | ) | ||||||||
| Basic earnings per common share |
(0.65 | ) | (0.71 | ) | (0.83 | ) | (0.72 | ) | ||||||||
| Diluted earnings per common share |
(0.65 | ) | (0.71 | ) | (0.83 | ) | (0.72 | ) | ||||||||
| 2012: |
||||||||||||||||
| Net sales |
9,382,537 | 10,536,726 | 11,226,549 | 12,373,649 | ||||||||||||
| Loss from operations |
(4,104,712 | ) | (3,517,450 | ) | (4,671,886 | ) | (2,453,143 | ) | ||||||||
| Net loss |
(4,388,417 | ) | (4,178,740 | ) | (6,017,866 | ) | (4,071,475 | ) | ||||||||
| Net loss attributable to common stockholders |
(6,342,042 | ) | (6,151,618 | ) | (8,020,532 | ) | (6,095,754 | ) | ||||||||
| Basic earnings per common share |
(0.61 | ) | (0.59 | ) | (0.77 | ) | (0.59 | ) | ||||||||
| Diluted earnings per common share |
(0.61 | ) | (0.59 | ) | (0.77 | ) | (0.59 | ) | ||||||||
| (1) | See note 9 for further detail over the dividend accretion that is included within net loss attributable to common stockholders. |
F-24
Table of Contents
5,313,351 Shares
Freshpet, Inc.
Common Stock

Goldman, Sachs & Co.
Credit Suisse
Baird
Stifel
SunTrust Robinson Humphrey
Canaccord Genuity
Table of Contents
PART II—INFORMATION NOT REQUIRED IN PROSPECTUS
Item 13. Other Expenses of Issuance and Distribution.
The following table sets forth all costs and expenses, other than the underwriting discounts payable by us, in connection with the offer and sale of the common stock being registered. All amounts shown are estimates except for the Securities and Exchange Commission (“SEC”) registration fee and the Financial Industry Regulatory Authority, Inc. (“FINRA”) filing fee.
| Amount | ||||
| SEC registration fee |
$ | 16,231 | ||
| FINRA filing fee |
21,453 | |||
| Nasdaq Listing fee |
— | |||
| Printing expenses |
205,000 | |||
| Accounting fees and expenses |
175,000 | |||
| Legal fees and expenses |
250,000 | |||
| Transfer Agent and Registrar fees and expenses |
15,000 | |||
| Miscellaneous expenses |
30,000 | |||
|
|
|
|||
| Total |
$ | 712,684 | ||
|
|
|
|||
Item 14. Indemnification of Officers and Directors.
Section 102(b)(7) of the DGCL allows a corporation to provide in its certificate of incorporation that a director of the corporation shall not be personally liable to the corporation or its stockholders for monetary damages for breach of fiduciary duty as a director, except where the director breached the duty of loyalty, failed to act in good faith, engaged in intentional misconduct or knowingly violated a law, authorized the payment of a dividend or approved a stock repurchase in violation of Delaware corporate law or obtained an improper personal benefit. Our Certificate of Incorporation provides for this limitation of liability.
Section 145 of the DGCL (“Section 145”), provides that a Delaware corporation may indemnify any person who was, is or is threatened to be made, party to any threatened, pending or completed action, suit or proceeding, whether civil, criminal, administrative or investigative (other than an action by or in the right of such corporation), by reason of the fact that such person is or was an officer, director, employee or agent of such corporation or is or was serving at the request of such corporation as a director, officer, employee or agent of another corporation or enterprise. The indemnity may include expenses (including attorneys’ fees), judgments, fines and amounts paid in settlement actually and reasonably incurred by such person in connection with such action, suit or proceeding, provided such person acted in good faith and in a manner he reasonably believed to be in or not opposed to the corporation’s best interests and, with respect to any criminal action or proceeding, had no reasonable cause to believe that his or her conduct was illegal. Where an officer or director is successful on the merits or otherwise in the defense of any action referred to above, the corporation must indemnify him against the expenses which such officer or director has actually and reasonably incurred.
Section 145 further authorizes a corporation to purchase and maintain insurance on behalf of any person who is or was a director, officer, employee or agent of the corporation or is or was serving at the request of the corporation as a director, officer, employee or agent of another corporation or enterprise, against any liability asserted against him and incurred by him in any such capacity, or arising out of his or her status as such, whether or not the corporation would otherwise have the power to indemnify him under Section 145.
Our Certificate of Incorporation provides that we must indemnify our directors and officers to the fullest extent authorized by the DGCL and must also pay expenses incurred in defending any such proceeding in advance of its final disposition upon delivery of an undertaking, by or on behalf of an indemnified person, to repay all amounts so advanced if it should be determined ultimately that such person is not entitled to be indemnified under this section or otherwise.
II-1
Table of Contents
We have entered into indemnification agreements with each of our current directors and officers. These agreements require us to indemnify these individuals to the fullest extent permitted under Delaware law against liabilities that may arise by reason of their service to us, and to advance expenses incurred as a result of any proceeding against them as to which they could be indemnified.
The indemnification rights set forth above shall not be exclusive of any other right which an indemnified person may have or hereafter acquire under any statute, provision of our Certificate of Incorporation, our Bylaws, agreement, vote of stockholders or disinterested directors or otherwise.
We maintain standard policies of insurance that provide coverage (1) to our directors and officers against loss rising from claims made by reason of breach of duty or other wrongful act and (2) to us with respect to indemnification payments that we may make to such directors and officers.
The proposed form of underwriting agreement to be filed as Exhibit 1.1 to this Registration Statement provides for indemnification to our directors and officers by the underwriters against certain liabilities.
Item 15. Recent Sales of Unregistered Securities
We sold 2,410,753 shares of Series C Preferred Stock to existing stockholders in the time period since January 1, 2012 in exchange for an aggregate of $12,634,854. In the time period since January 1, 2012, we issued to directors, officers, employees and contractors options to purchase an aggregate of 74,824 shares of common stock with exercise prices of $7.10 per share pursuant to the 2010 Plan. In the time period since January 1, 2012, upon the exercise of stock options, we have issued 7,952 shares of common stock to certain officers, directors, employees and contractors in exchange for an aggregate of $49,889. No underwriters were used in connection with the transactions. The sale of such securities was exempt from registration pursuant to Section 4(a)(2) of the Securities Act as transactions by an issuer not involving a public offering and/or Rule 506 promulgated under the Securities Act. All of the purchasers in these transactions represented to us in connection with their purchase that they were acquiring the shares for investment and not distribution, and that they could bear the risks of the investment and could hold the securities for an indefinite period of time. Such purchasers received written disclosures that the securities had not been registered under the Securities Act and that any resale must be made pursuant to a registration or an available exemption from such registration. All of the foregoing securities are deemed restricted securities for the purposes of the Securities Act.
Item 16. Exhibits
| (1) | Exhibits: |
The exhibit index attached hereto is incorporated herein by reference.
| (2) | Financial Statement Schedules: |
No financial statement schedules are provided because the information called for is not required or is shown in the financial statements or the notes thereto.
Item 17. Undertakings
| (a) | Insofar as indemnification for liabilities arising under the Securities Act may be permitted to directors, officers and controlling persons of the Registrant pursuant to the foregoing provisions, or otherwise, the Registrant has been advised that in the opinion of the Securities and Exchange Commission such indemnification is against public policy as expressed in the Securities Act and is, therefore, unenforceable. In the event that a claim for indemnification against such liabilities (other than the payment by the Registrant of expenses incurred or paid by a director, officer or controlling person of the Registrant in the |
II-2
Table of Contents
| successful defense of any action, suit or proceeding) is asserted by such director, officer or controlling person in connection with the securities being registered, the Registrant will, unless in the opinion of its counsel the matter has been settled by controlling precedent, submit to a court of appropriate jurisdiction the question whether such indemnification by it is against public policy as expressed in the Securities Act and will be governed by the final adjudication of such issue. |
| (b) | The undersigned Registrant hereby undertakes that: |
| (1) | For purposes of determining any liability under the Securities Act, the information omitted from the form of prospectus filed as part of this registration statement in reliance upon Rule 430A and contained in a form of prospectus filed by the Registrant pursuant to Rule 424(b)(1) or (4) or 497(h) under the Securities Act shall be deemed to be a part of this registration statement as of the time it was declared effective. |
| (2) | For purposes of determining any liability under the Securities Act, each post-effective amendment that contains a form of prospectus shall be deemed to be a new registration statement relating to the securities offered therein, and the offering of such securities at that time shall be deemed to be the initial bona fide offering thereof. |
II-3
Table of Contents
SIGNATURES
Pursuant to the requirements of the Securities Act of 1933, the registrant has duly caused this registration statement to be signed on its behalf by the undersigned, thereunto duly authorized in the City of Secaucus, State of New Jersey, on April 27, 2015.
FRESHPET, INC.
| By: | /s/ Richard Kassar | |
| Name: Richard Kassar | ||
| Title: Chief Financial Officer | ||
* * * *
Pursuant to the requirements of the Securities Act of 1933, this registration statement has been signed by the following persons on April 27, 2015 in the capacities indicated.
| Signature |
Title | |
| * Richard Thompson |
Chief Executive Officer and Director (Principal Executive Officer) | |
| /s/ Richard Kassar Richard Kassar |
Chief Financial Officer (Principal Accounting and Financial Officer) | |
| * Charles A. Norris |
Director | |
| * J. David Basto |
Director | |
| * Daryl G. Brewster |
Director | |
| * Lawrence S. Coben |
Director | |
| * Walter N. George III |
Director | |
II-4
Table of Contents
| Signature |
Title | |
| * Christopher B. Harned |
Director | |
| * Robert C. King |
Director | |
| * Jonathan S. Marlow |
Director | |
| * Craig D. Steeneck |
Director | |
| By: | /s/ Richard Kassar | |
| Richard Kassar | ||
| Attorney-in-Fact | ||
II-5
Table of Contents
EXHIBIT INDEX
| Exhibit No. |
Description | |
| 1.1* | Form of Underwriting Agreement | |
| 3.1 | Third Amended and Restated Certificate of Incorporation (incorporated by reference to the Company’s Registration on Form S-8 filed on December 12, 2014) | |
| 3.2 | Amended and Restated Bylaws (incorporated by reference to the Company’s Registration on Form S-8 filed on December 12, 2014) | |
| 4.1 | Warrant Agreement, dated as of October 5, 2007, between the Company and City National Bank, a national banking association (incorporated by reference to the Company’s Registration Statement on Form S-1 filed on September 12, 2014) | |
| 5.1* | Opinion of Kirkland & Ellis LLP | |
| 10.1 | Amended and Restated Credit Agreement, dated as of April 12, 2013, among the Company, the several banks and other lenders from time to time parties to thereto and OneWest Bank, FSB, as administrative agent for the lenders (incorporated by reference to the Company’s Registration Statement on Form S-1 filed on September 12, 2014) | |
| 10.2 | First Amendment to Amended and Restated Credit Agreement, dated as of May 7, 2013, among the Company, the several banks and other lenders from time to time parties thereto and OneWest Bank, FSB, as administrative agent for the lenders (incorporated by reference to the Company’s Registration Statement on Form S-1 filed on September 12, 2014) | |
| 10.3 | Second Amendment to Amended and Restated Credit Agreement, dated as of July 2, 2013, among the Company, the several banks and other lenders from time to time parties thereto and OneWest Bank, FSB, as administrative agent for the lenders (incorporated by reference to the Company’s Registration Statement on Form S-1 filed on September 12, 2014) | |
| 10.4 | Third Amendment to Amended and Restated Credit Agreement, dated as of September 30, 2013, among the Company, the several banks and other lenders from time to time parties thereto and OneWest Bank, FSB, as administrative agent for the lenders (incorporated by reference to the Company’s Registration Statement on Form S-1 filed on September 12, 2014) | |
| 10.5 | Fourth Amendment to Amended and Restated Credit Agreement, dated as of May 28, 2014, among the Company, the several banks and other lenders from time to time parties thereto and OneWest Bank N.A. (incorporated by reference to Amendment No. 1 to the Company’s Registration Statement on Form S-1 filed on October 2, 2014) | |
| 10.6 | Fifth Amendment to Amended and Restated Credit Agreement, dated as of October 23, 2014, among the Company, the several banks and other lenders from time to time parties thereto and OneWest Bank N.A. (incorporated by reference to Amendment No. 2 to the Company’s Registration Statement on Form S-1 filed on October 27, 2014) | |
| 10.7 | Amended and Restated Loan and Security Agreement, dated as of December 23, 2010, by and between the Company and City National Bank, a national banking association, as lender (incorporated by reference to the Company’s Registration Statement on Form S-1 filed on September 12, 2014) | |
| 10.8 | Amendment Number One to Amended and Restated Loan and Security Agreement, dated as of February 9, 2012, by and between the Company and City National Bank, a national banking association, as lender (incorporated by reference to the Company’s Registration Statement on Form S-1 filed on September 12, 2014) | |
II-6
Table of Contents
| Exhibit No. |
Description | |
| 10.9 | Amendment Number Two to Amended and Restated Loan and Security Agreement, dated as of May 2, 2012, by and between the Company and City National Bank, a national banking association, as lender (incorporated by reference to the Company’s Registration Statement on Form S-1 filed on September 12, 2014) | |
| 10.10 | Amendment Number Three to Amended and Restated Loan and Security Agreement, dated as of June 8, 2012, by and between the Company and City National Bank, a national banking association, as lender (incorporated by reference to the Company’s Registration Statement on Form S-1 filed on September 12, 2014) | |
| 10.11 | Amendment Number Four to Amended and Restated Loan and Security Agreement, dated as of May 3, 2013, by and between the Company and City National Bank, a national banking association, as lender (incorporated by reference to the Company’s Registration Statement on Form S-1 filed on September 12, 2014) | |
| 10.12 | Amendment Number Five to Amended and Restated Loan and Security Agreement, dated as of March 14, 2014, by and between the Company and City National Bank, a national banking association, as lender (incorporated by reference to the Company’s Registration Statement on Form S-1 filed on September 12, 2014) | |
| 10.13 | Amendment Number Six to Amended and Restated Loan and Security Agreement, dated as of September 4, 2014, by and between the Company and City National Bank, a national banking association, as lender (incorporated by reference to the Company’s Registration Statement on Form S-1 filed on September 12, 2014) | |
| 10.14 | Amendment Number Seven to Amended and Restated Loan and Security Agreement, dated as of October 23, 2014, by and between the Company and City National Bank, a national banking association, as lender (incorporated by reference to Amendment No. 2 to the Company’s Registration Statement on Form S-1 filed on October 27, 2014) | |
| 10.15 | Second Amended and Restated Loan and Security Agreement by and between the Company and City National Bank, a national banking association, as the arranger and administrative agent, OneWest Bank, as syndication agent, and the lenders thereto (incorporated by reference to the Company’s Form 8-K filed on November 19, 2014) | |
| 10.16 | Amendment Number One to Second Amended and Restated Loan and Security Agreement by and between the Company and City National Bank, a national banking association, as the arranger and administrative agent, and the lenders thereto (incorporated by reference to the Company’s Form 8-K filed on December 29, 2014) | |
| 10.17 | Amendment Number Two to Second Amended and Restated Loan and Security Agreement by and between the Company and City National Bank, a national banking association, as the arranger and administrative agent, and the lenders thereto (incorporated by reference to the Company’s Form 10-K filed on March 31, 2015) | |
| 10.18 | Amendment Number Three to Second Amended and Restated Loan and Security Agreement by and between the Company and City National Bank, a national banking association, as the arranger and administrative agent, and the lenders thereto (incorporated by reference to the Company’s Form 10-K filed on March 31, 2015) | |
| 10.19 | Freshpet, Inc. 2014 Omnibus Incentive Plan (incorporated by reference to the Company’s Registration on Form S-8 filed on December 12, 2014) | |
| 10.20 | Professor Connor’s, Inc. 2010 Stock Option Plan (incorporated by reference to the Company’s Registration on Form S-8 filed on December 12, 2014) | |
II-7
Table of Contents
| Exhibit No. |
Description | |
| 10.21 | Professor Connor’s, Inc. 2006 Stock Plan (incorporated by reference to the Company’s Registration on Form S-8 filed on December 12, 2014) | |
| 10.22 | Form of Restricted Stock Agreement Pursuant to the Freshpet, Inc. 2014 Omnibus Incentive Plan (incorporated by reference to Amendment No. 2 to the Company’s Registration Statement on Form S-1 filed on October 27, 2014) | |
| 10.23 | Form of Restricted Stock Unit Agreement Pursuant to the Freshpet, Inc. 2014 Omnibus Incentive Plan (incorporated by reference to Amendment No. 2 to the Company’s Registration Statement on Form S-1 filed on October 27, 2014) | |
| 10.24 | Form of Incentive Stock Option Agreement Pursuant to the Freshpet, Inc. 2014 Omnibus Incentive Plan (incorporated by reference to Amendment No. 2 to the Company’s Registration Statement on Form S-1 filed on October 27, 2014) | |
| 10.25 | Form of Nonqualified Stock Option Agreement Pursuant to the Freshpet, Inc. 2014 Omnibus Incentive Plan (incorporated by reference to Amendment No. 2 to the Company’s Registration Statement on Form S-1 filed on October 27, 2014) | |
| 10.26 | Form of Stock Appreciation Rights Agreement Pursuant to the Freshpet, Inc. 2014 Omnibus Incentive Plan (incorporated by reference to Amendment No. 2 to the Company’s Registration Statement on Form S-1 filed on October 27, 2014) | |
| 10.27 | Form of Freshpet, Inc. Non-Employee Director Compensation Policy (incorporated by reference to Amendment No. 3 to the Company’s Registration Statement on Form S-1 filed on November 4, 2014) | |
| 10.28 | Employment Agreement between Richard Thompson and Freshpet, Inc., dated as of December 23, 2010 (incorporated by reference to the Company’s Registration Statement on Form S-1 filed on September 12, 2014) | |
| 10.29 | Form of Employment Agreement between Richard Thompson and Freshpet, Inc. (incorporated by reference to Amendment No. 3 to the Company’s Registration Statement on Form S-1 filed on November 4, 2014) | |
| 10.30 | Employment Agreement between Scott Morris and Freshpet, Inc. dated as of October 25, 2006 (incorporated by reference to the Company’s Registration Statement on Form S-1 filed on September 12, 2014) | |
| 10.31 | Amendment to Employment Agreement between Scott Morris and Freshpet, Inc. dated as of January 6, 2009 (incorporated by reference to the Company’s Registration Statement on Form S-1 filed on September 12, 2014) | |
| 10.32 | Form of Employment Agreement between Scott Morris and Freshpet, Inc. (incorporated by reference to Amendment No. 3 to the Company’s Registration Statement on Form S-1 filed on November 4, 2014) | |
| 10.33 | Employment Agreement between Cathal Walsh and Freshpet, Inc. dated as of October 25, 2006 (incorporated by reference to the Company’s Registration Statement on Form S-1 filed on September 12, 2014) | |
| 10.34 | Amendment to Employment Agreement between Cathal Walsh and Freshpet, Inc. dated as of January 6, 2009 (incorporated by reference to the Company’s Registration Statement on Form S-1 filed on September 12, 2014) | |
| 10.35 | Form of Employment Agreement between Cathal Walsh and Freshpet, Inc. (incorporated by reference to Amendment No. 3 to the Company’s Registration Statement on Form S-1 filed on November 4, 2014) | |
II-8
Table of Contents
| Exhibit No. |
Description | |
| 10.36 | Form of Indemnification Agreement between Freshpet, Inc. and each of its directors and executive officers (incorporated by reference to Amendment No. 3 to the Company’s Registration Statement on Form S-1 filed on November 4, 2014) | |
| 10.37 | Form of Second Amended and Restated Stockholders Agreement (incorporated by reference to Amendment No. 3 to the Company’s Registration Statement on Form S-1 filed on November 4, 2014) | |
| 10.38 | Amended and Restated Fee and Reimbursement Agreement among Freshpet, Inc. and the other parties thereto dated as of April 15, 2013 (incorporated by reference to the Company’s Registration Statement on Form S-1 filed on September 12, 2014) | |
| 10.39 | Amendment No. 1 to the Amended and Restated Fee and Reimbursement Agreement among Freshpet, Inc. and the other parties thereto dated as of October 9, 2013 (incorporated by reference to the Company’s Registration Statement on Form S-1 filed on September 12, 2014) | |
| 10.40 | Amendment No. 2 to the Amended and Restated Fee and Reimbursement Agreement among Freshpet, Inc. and the other parties thereto dated as of April 7, 2014 (incorporated by reference to the Company’s Registration Statement on Form S-1 filed on September 12, 2014) | |
| 10.41 | Form of Amendment No. 3 to the Amended and Restated Fee and Reimbursement Agreement among Freshpet, Inc. and the other parties thereto (incorporated by reference to Amendment No. 3 to the Company’s Registration Statement on Form S-1 filed on November 4, 2014) | |
| 10.42 | Distribution Agreement between Tyson Foods, Inc. and Freshpet, Inc. dated as of January 6, 2009 (incorporated by reference to Amendment No. 2 to the Company’s Registration Statement on Form S-1 filed on October 27, 2014) | |
| 10.43 | Amendment to the Distribution Agreement between Tyson Foods, Inc. and Freshpet, Inc. dated as of August 8, 2014 (incorporated by reference to Amendment No. 2 to the Company’s Registration Statement on Form S-1 filed on October 27, 2014) | |
| 10.44 | Form of Selldown Agreement (incorporated by reference to Amendment No. 3 to the Company’s Registration Statement on Form S-1 filed on November 4, 2014) | |
| 10.45 | Employment Agreement between Richard Kassar and Freshpet, Inc. dated as of October 31, 2014 | |
| 21.1 | List of Subsidiaries (incorporated by reference to the Company’s Registration Statement on Form S-1 filed on September 12, 2014) | |
| 23.1* | Consent of KPMG LLP | |
| 23.2* | Consent of Kirkland & Ellis LLP (included in Exhibit 5.1) | |
| 24.1 | Power of Attorney (included on the signature page of this Registration Statement) | |
| 101.INS | XBRL Instance Document | |
| 101.SCH | XBRL Schema Documents | |
| 101.CAL | XBRL Calculation Linkbase Document | |
| 101.LAB | XBRL Labels Linkbase Document | |
| 101.PRE | XBRL Presentation Linkbase Document | |
| 101.DEF | XBRL Definition Linkbase Document | |
| * | Filed herewith. |
II-9