Attached files
| file | filename |
|---|---|
| 8-K - FORM 8-K - Cape Bancorp, Inc. | t1500974_8k.htm |
Exhibit 99.1

Annual Shareholder Meeting April 27, 2015 C A P E B A N C O R P

C A P E B A N C O R P Forward – Looking Statement Disclaimer This presentation contains certain “forward - looking statements” within the meaning of Section 27 A of the Securities Act of 1933 and Section 21 E of the Securities Exchange Act of 1934 . Such forward - looking statements may be identified by reference to a future period or periods, or by the use of forward looking terminology, such as “may,” “will,” “believe,” “expect,” “estimate,” “anticipate,” “continue,” or similar terms, or the negative of those terms . We caution that such statements may be subject to a number of uncertainties and actual results could differ materially and, therefore, attendees should not place undue reliance on any forward - looking statements . Factors which could cause or contribute to such differences include, but are not limited to, general economic conditions ; changes in interest rates, deposit flows, loan demand, real estate values, and competition ; and other competitive, governmental, regulatory, and technological factors affecting Cape Bank and its operations, pricing, products, and services . Other factors that may cause actual results to differ from results expressed or implied by forward looking statements are described in Cape Bancorp’s Form 10 - K and other periodic filings by Cape Bancorp with the Securities and Exchange Commission . Cape Bancorp does not undertake, and specifically disclaims, any obligation to publicly release the results of any revisions that may be made to any forward - looking statements to reflect the occurrence of anticipated or unanticipated events or circumstances after the date of such statements, except as required under applicable law .

3 Financial Highlights C A P E B A N C O R P

9 Total Assets (dollars in millions) Total Assets 4 C A P E B A N C O R P $1,071.1 $1,040.8 $1,092.9 $1,079.9 $0 $200 $400 $600 $800 $1,000 $1,200 2011 2012 2013 2014

9 Total Assets 5 C A P E B A N C O R P 12/31/2014 12/31/2013 Premises & Equip $20.0 2% BOLI $31.2 3% Goodwill $22.6 2% Cash & Cash Equiv $24.9 2% IntBearing Time Dep $9.2 1% Investment Securities $166.3 15% Loans, Net of Allowance $780.1 71% Other $38.6 4% Millions Premises & Equip $19.7 2% BOLI $31.3 3% Goodwill $22.6 2% Cash & Cash Equiv $31.5 3% IntBearing Time Dep $9.5 1% Investment Securities $165.7 15% Loans, Net of Allowance $770.3 71% Other $29.3 3% Millions

12 Net Loans (dollars in millions) Net Loans 6 C A P E B A N C O R P $716.3 $714.4 $780.1 $770.3 $400 $450 $500 $550 $600 $650 $700 $750 $800 2011 2012 2013 2014

12 Loan Composition (dollars in millions) Gross Loans 7 C A P E B A N C O R P $427.6 $441.0 $485.7 $493.7 $253.4 $236.9 $259.7 $241.2 $48.2 $46.6 $44.4 $45.1 $0 $50 $100 $150 $200 $250 $300 $350 $400 $450 $500 2011 2012 2013 2014 Commercial Loans Residential Mortgages Consumer Loans

Investment Portfolio Composition 12/31/2013 8 C A P E B A N C O R P Fair Value 12/31/2014 Mortgage - backed Securities $67.1 44% Corporate Debt $13.1 9% Government Agency Debt $51.6 34% Municipal Bonds $15.1 10% CRA $4.7 3% Millions Mortgage - backed Securities $71.4 43% Corporate Debt $23.8 14% Government Agency Debt $47.0 29% Municipal Bonds $18.5 11% CRA $4.8 3% Millions

15 9 Credit Performance C A P E B A N C O R P 0.00% 0.50% 1.00% 1.50% 2.00% 2.50% 3.00% 4Q12 1Q13 2Q13 3Q13 4Q13 1Q14 2Q14 3Q14 4Q14 NPLs/ Total Loans NPAs/ Total Assets

12 Deposit Composition (dollars in millions) Deposits 10 C A P E B A N C O R P $485.3 $546.0 $529.2 $552.2 $289.1 $238.6 $269.2 $244.9 $0 $100 $200 $300 $400 $500 $600 2011 2012 2013 2014 Core Deposits Certificates

Capital Trends 11 C A P E B A N C O R P 11.72% 12.57% 10.99% 11.17% $9.22 $9.60 $9.75 $10.28 $8.60 $8.80 $9.00 $9.20 $9.40 $9.60 $9.80 $10.00 $10.20 $10.40 0.00% 2.00% 4.00% 6.00% 8.00% 10.00% 12.00% 14.00% 2011 2012 2013 2014 Tangible Equity/Tangible Asset Tangible Book Value/Share

12 C A P E B A N C O R P Net Income Net Income (dollars in thousands) $7,987 $4,556 $5,551 $6,784 $1,000 $2,000 $3,000 $4,000 $5,000 $6,000 $7,000 $8,000 $9,000 2011 2012 2013 2014

13 C A P E B A N C O R P O/S Shares & Earnings Per Share (thousands) 13,314 13,337 12,060 11,475 $0.64 $0.37 $0.46 $0.61 $0.00 $0.10 $0.20 $0.30 $0.40 $0.50 $0.60 $0.70 1,000 3,000 5,000 7,000 9,000 11,000 13,000 15,000 12/31/2011 12/31/2012 12/31/2013 12/31/2014 O/S Shares EPS

Key Points 2014 14 C A P E B A N C O R P • Opened New Market Development Offices – Delaware County, Pennsylvania Center City, Philadelphia (Jan 2015) • Relocated Commercial Lending Offices from Atlantic City, NJ to Hammonton, NJ

Key Points 2014 15 C A P E B A N C O R P Capital Management • Completed 3rd Stock Buyback • Entered into Agreement & Plan of Merger with Colonial Financial Services, Inc.

16 Strategic & Financial Initiatives C A P E B A N C O R P Focus for 2015

17 C A P E B A N C O R P Through a series of strategic & financial initiatives, Cape has and continues to make a concerted effort to diversify its market exposure westward towards Philadelphia Market Diversification & Financial Strategies Event Timeline: 2011: - Market Development Office opened in Burlington County 2013: - Market Development Office opened in Radnor, PA 2014: - Acquisition of Colonial Financial Services, Inc. Announced 2015: - Colonial Financial Services, Inc. Acquisition Closed April 1, 2015 - Announced Agreement to Purchase Sun National Bank’s Hammonton, NJ Branch Office

18 C A P E B A N C O R P ▪ April 1, 2015: Colonial Acquisition Completed: − Increased Cape’s assets nearly 50% and increases core deposits over 70% − Financially compelling metrics including a projected +20 % accretion to EPS 1 , tangible book value earn back of approximately 2.7 years and an IRR of approximately 18% − Pro forma franchise with 22 banking centers throughout Southern New Jersey − #2 market share in Cumberland County and scalable presence in Gloucester County − Provides an additional core funding source to help Cape execute its current strategy of diversifying its market exposure westward and towards Philadelphia (1) In the first full year with cost savings fully phased in, excluding transaction costs
19 C A P E B A N C O R P ▪ Agreement to Purchase Sun National Bank’s Hammonton, NJ branch office: − Estimated $34.1 million in deposits and $4.9 million in local branch loans − Expands and diversifies franchise into Hammonton, N.J.
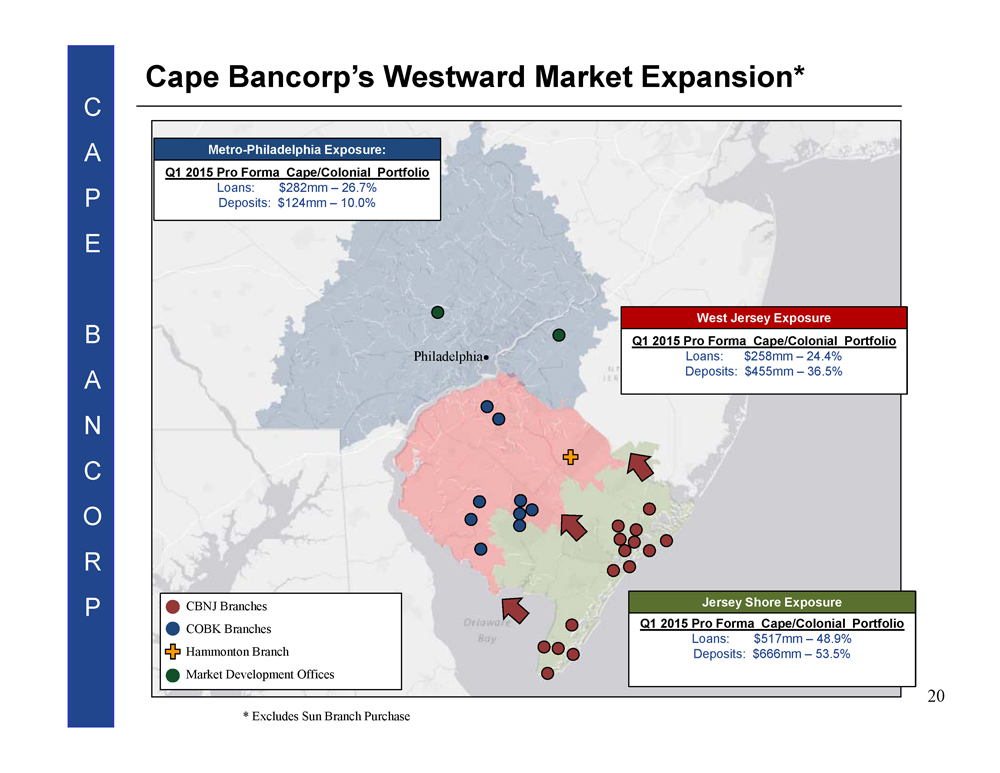
20 C A P E B A N C O R P Cape Bancorp’s Westward Market Expansion* CBNJ Branches COBK Branches Hammonton Branch Market Development Offices Philadelphia Q1 2015 Pro Forma Cape/Colonial Portfolio Loans: $282mm – 26.7% Deposits: $124mm – 10.0% Metro - Philadelphia Exposure: Q1 2015 Pro Forma Cape/Colonial Portfolio Loans: $258mm – 24.4% Deposits: $455mm – 36.5% West Jersey Exposure Q1 2015 Pro Forma Cape/Colonial Portfolio Loans: $517mm – 48.9% Deposits: $666mm – 53.5% Jersey Shore Exposure * Excludes Sun Branch Purchase

C A P E B A N C O R P 21 □ #2 market share in Cumberland County □ # 3 market share in Cape May County □ #5 market share in Atlantic County □ Scalable presence in Gloucester County Cape Pro Forma Deposit Market Share 21 Deposit Market Share in Primary Markets Source: SNL Financial; FDIC. Deposit data as of 6/30/14. Cumberland, NJ 2014 2014 # of Deposits Market Rank Institution Branches ($000) Share (%) 1 Sun Bancorp Inc. (NJ) 5 447,563 17.67 2 Cape Bancorp Inc. (NJ) 7 387,608 15.30 3 BB&T Corp. (NC) 5 361,804 14.28 4 Toronto-Dominion Bank 5 310,660 12.26 5 Century Bancorp MHC (NJ) 3 206,604 8.16 6 Newfield Bancorp Inc. (NJ) 4 194,881 7.69 7 Capital Bank of New Jersey (NJ) 2 192,446 7.60 8 Bank of America Corp. (NC) 5 175,331 6.92 9 Millville S&L Assn. (NJ) 2 132,016 5.21 10 PNC Financial Services Group (PA) 1 61,007 2.41 Total For Institutions In Market 41 2,533,070 Pro Forma for the Hammonton branch acquisition, Cape will have: Gloucester, NJ 2014 2014 # of Deposits Market Rank Institution Branches ($000) Share (%) 1 Toronto-Dominion Bank 11 1,386,643 27.64 2 Fulton Financial Corp. (PA) 13 718,649 14.32 3 Wells Fargo & Co. (CA) 7 491,964 9.81 4 Parke Bancorp Inc. (NJ) 2 334,064 6.66 5 Newfield Bancorp Inc. (NJ) 7 284,478 5.67 6 Investors Bancorp Inc (NJ) 5 239,279 4.77 7 PNC Financial Services Group (PA) 6 229,444 4.57 8 Bank of America Corp. (NC) 5 213,037 4.25 9 BB&T Corp. (NC) 4 175,340 3.49 10 Columbia Bank MHC (NJ) 3 145,960 2.91 14 Cape Bancorp Inc. (NJ) 2 90,160 1.80 Total For Institutions In Market 82 5,016,888 Atlantic, NJ 2014 2014 # of Deposits Market Rank Institution Branches ($000) Share (%) 1 Toronto-Dominion Bank 8 1,005,675 19.47 2 Wells Fargo & Co. (CA) 11 940,489 18.21 3 Bank of America Corp. (NC) 10 632,256 12.24 4 Ocean Shore Holding Co. (NJ) 9 517,919 10.03 5 Cape Bancorp Inc. (NJ) 9 484,879 9.39 6 Sun Bancorp Inc. (NJ) 7 334,584 6.48 7 PNC Financial Services Group (PA) 7 290,342 5.62 8 Parke Bancorp Inc. (NJ) 2 262,176 5.08 9 BB&T Corp. (NC) 6 254,846 4.93 10 Absecon Bancorp (NJ) 4 135,336 2.62 Total For Institutions In Market 81 5,165,103 Cape May, NJ 2014 2014 # of Deposits Market Rank Institution Branches ($000) Share (%) 1 Sturdy Savings Bank (NJ) 13 604,719 21.84 2 Toronto - Dominion Bank 4 384,940 13.90 3 Cape Bancorp Inc. (NJ) 7 367,835 13.29 4 Crest Savings Bancorp MHC (NJ) 7 330,183 11.93 5 PNC Financial Services Group (PA) 7 291,552 10.53 6 Ocean Shore Holding Co. (NJ) 2 259,757 9.38 7 Sea Isle Financial Corp. MHC (NJ) 3 206,552 7.46 8 Bank of America Corp. (NC) 5 196,811 7.11 9 Wells Fargo & Co. (CA) 1 78,497 2.84 10 Franklin Bank (NJ) 1 26,369 0.95 Total For Institutions in Market 54 2,768,589

22 C A P E B A N C O R P Questions? C A P E B A N C O R P