Attached files
| file | filename |
|---|---|
| 8-K - 8-K - CITIZENS FINANCIAL GROUP INC/RI | d913224d8k.htm |
| EX-99.1 - EX-99.1 - CITIZENS FINANCIAL GROUP INC/RI | d913224dex991.htm |
| EX-99.2 - EX-99.2 - CITIZENS FINANCIAL GROUP INC/RI | d913224dex992.htm |
| Exhibit 99.3
|

Citizens Financial Group, Inc.
Financial Supplement
First Quarter 2015
1
|
|
Table of Contents Page
Consolidated Financial Highlights 3
Consolidated Statements of Operations (unaudited) 5
Consolidated Balance Sheets (unaudited) 6
Loans and Deposits 7
Average Balance Sheets and Annualized Yields 8
Segment Financial Highlights 10
Credit-Related Information
Credit Exposure 20
Nonperforming Assets 21
Charge-offs, Recoveries and Related Ratios 22
Summary of Changes in the Allowances 24
Allowance Components 25
Capital and Ratios 26
Per-Share Related Information 27
Non-GAAP Financial Measures and Reconciliations 28
Forward-Looking Statements 34
2
|
|
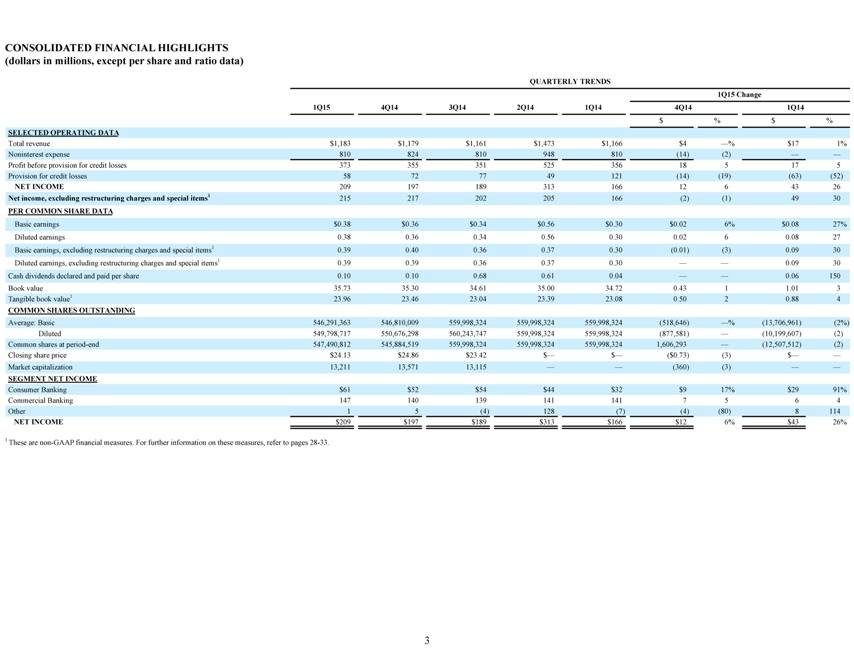
CONSOLIDATED FINANCIAL HIGHLIGHTS
(dollars in millions, except per share and ratio data)
QUARTERLY TRENDS
1Q15 Change
1Q15 4Q14 3Q14 2Q14 1Q14 4Q14 1Q14
$% $%
SELECTED OPERATING DATA
Total revenue $1,183 $1,179 $1,161 $1,473 $1,166 $4 _% $17 1%
Noninterest expense 810 824 810 948 810(14)(2)
Profit before provision for credit losses 373 355 351 525 356 18 5 17 5
Provision for credit losses 58 72 77 49 121(14)(19)(63)(52)
NET INCOME 209 197 189 313 166 12 6 43 26
Net income, excluding restructuring charges and special items1 215 217 202 205 166(2)(1) 49 30
PER COMMON SHARE DATA
Basic earnings $0.38 $0.36 $0.34 $0.56 $0.30 $0.02 6% $0.08 27%
Diluted earnings 0.38 0.36 0.34 0.56 0.30 0.02 6 0.08 27
Basic earnings, excluding restructuring charges and special items1 0.39 0.40 0.36 0.37 0.30(0.01)(3) 0.09 30
Diluted earnings, excluding restructuring charges and special items1 0.39 0.39 0.36 0.37 0.30 0.09 30
Cash dividends declared and paid per share 0.10 0.10 0.68 0.61 0.04 0.06 150
Book value 35.73 35.30 34.61 35.00 34.72 0.43 1 1.01 3
Tangible book value1 23.96 23.46 23.04 23.39 23.08 0.50 2 0.88 4
COMMON SHARES OUTSTANDING
Average: Basic 546,291,363 546,810,009 559,998,324 559,998,324 559,998,324(518,646) _%(13,706,961)(2%)
Diluted 549,798,717 550,676,298 560,243,747 559,998,324 559,998,324(877,581) _(10,199,607)(2)
Common shares at period-end 547,490,812 545,884,519 559,998,324 559,998,324 559,998,324 1,606,293 _(12,507,512)(2)
Closing share price $24.13 $24.86 $23.42 $_ $_($0.73)(3) $
Market capitalization 13,211 13,571 13,115 (360)(3)
SEGMENT NET INCOME
Consumer Banking $61 $52 $54 $44 $32 $9 17% $29 91%
Commercial Banking 147 140 139 141 141 7 5 6 4
Other 1 5(4) 128(7)(4)(80) 8 114
NET INCOME $209 $197 $189 $313 $166 $12 6% $43 26%
1 These are non-GAAP financial measures. For further information on these measures, refer to pages 28-33.
3
|
|
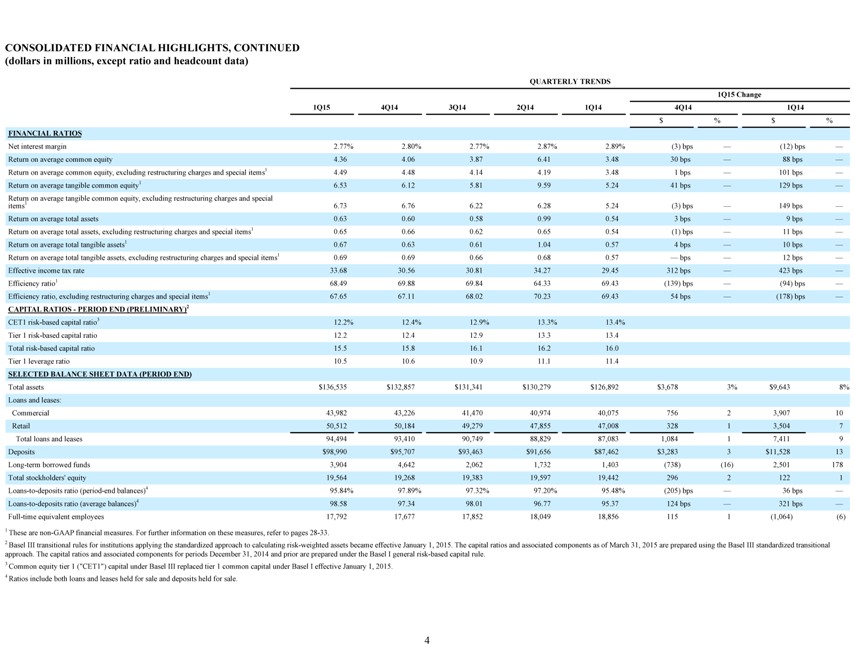
CONSOLIDATED FINANCIAL HIGHLIGHTS, CONTINUED
(dollars in millions, except ratio and headcount data)
QUARTERLY TRENDS
1Q15 Change
1Q15 4Q14 3Q14 2Q14 1Q14 4Q14 1Q14
$% $%
FINANCIAL RATIOS
Net interest margin 2.77% 2.80% 2.77% 2.87% 2.89%(3) bps _(12) bps _
Return on average common equity 4.36 4.06 3.87 6.41 3.48 30 bps _ 88 bps _
Return on average common equity, excluding restructuring charges and special items1 4.49 4.48 4.14 4.19 3.48 1 bps _ 101 bps _
Return on average tangible common equity1 6.53 6.12 5.81 9.59 5.24 41 bps _ 129 bps _
Return on average tangible common equity, excluding restructuring charges and special
items1 6.73 6.76 6.22 6.28 5.24(3) bps _ 149 bps _
Return on average total assets 0.63 0.60 0.58 0.99 0.54 3 bps _ 9 bps _
Return on average total assets, excluding restructuring charges and special items1 0.65 0.66 0.62 0.65 0.54(1) bps _ 11 bps _
Return on average total tangible assets1 0.67 0.63 0.61 1.04 0.57 4 bps _ 10 bps _
Return on average total tangible assets, excluding restructuring charges and special items1 0.69 0.69 0.66 0.68 0.57 _ bps _ 12 bps _
Effective income tax rate 33.68 30.56 30.81 34.27 29.45 312 bps _ 423 bps _
Efficiency ratio1 68.49 69.88 69.84 64.33 69.43(139) bps _(94) bps _
Efficiency ratio, excluding restructuring charges and special items1 67.65 67.11 68.02 70.23 69.43 54 bps _(178) bps _
CAPITAL RATIOS—PERIOD END (PRELIMINARY)2
CET1 risk-based capital ratio3 12.2% 12.4% 12.9% 13.3% 13.4%
Tier 1 risk-based capital ratio 12.2 12.4 12.9 13.3 13.4
Total risk-based capital ratio 15.5 15.8 16.1 16.2 16.0
Tier 1 leverage ratio 10.5 10.6 10.9 11.1 11.4
SELECTED BALANCE SHEET DATA (PERIOD END)
Total assets $136,535 $132,857 $131,341 $130,279 $126,892 $3,678 3% $9,643 8%
Loans and leases:
Commercial 43,982 43,226 41,470 40,974 40,075 756 2 3,907 10
Retail 50,512 50,184 49,279 47,855 47,008 328 1 3,504 7
Total loans and leases 94,494 93,410 90,749 88,829 87,083 1,084 1 7,411 9
Deposits $98,990 $95,707 $93,463 $91,656 $87,462 $3,283 3 $11,528 13
Long-term borrowed funds 3,904 4,642 2,062 1,732 1,403(738)(16) 2,501 178
Total stockholders’ equity 19,564 19,268 19,383 19,597 19,442 296 2 122 1
Loans-to-deposits ratio (period-end balances)4 95.84% 97.89% 97.32% 97.20% 95.48%(205) bps _ 36 bps _
Loans-to-deposits ratio (average balances)4 98.58 97.34 98.01 96.77 95.37 124 bps _ 321 bps _
Full-time equivalent employees 17,792 17,677 17,852 18,049 18,856 115 1(1,064)(6)
1 These are non-GAAP financial measures. For further information on these measures, refer to pages 28-33.
2 Basel III transitional rules for institutions applying the standardized approach to calculating risk-weighted assets became effective January 1, 2015. The capital ratios and associated components as of March 31, 2015 are prepared using the Basel III standardized transitional approach. The capital ratios and associated components for periods December 31, 2014 and prior are prepared under the Basel I general risk-based capital rule.
3 Common equity tier 1 (“CET1”) capital under Basel III replaced tier 1 common capital under Basel I effective January 1, 2015. 4 Ratios include both loans and leases held for sale and deposits held for sale.
4
|
|
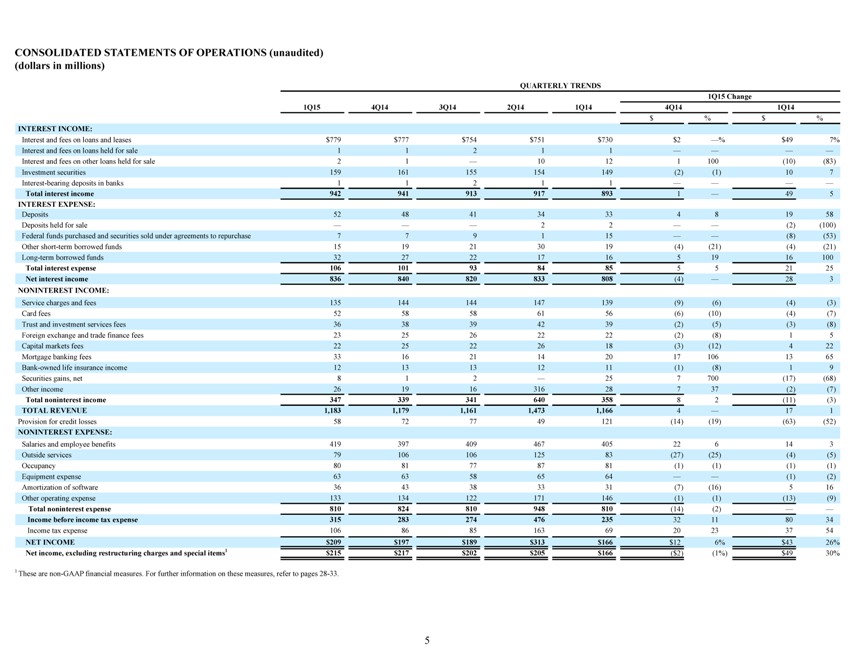
CONSOLIDATED STATEMENTS OF OPERATIONS (unaudited)
(dollars in millions)
QUARTERLY TRENDS
1Q15 Change
1Q15 4Q14 3Q14 2Q14 1Q14 4Q14 1Q14
$% $%
INTEREST INCOME:
Interest and fees on loans and leases $779 $777 $754 $751 $730 $2 _% $49 7%
Interest and fees on loans held for sale 1 1 2 1 1
Interest and fees on other loans held for sale 2 1 _ 10 12 1 100(10)(83)
Investment securities 159 161 155 154 149(2)(1) 10 7
Interest-bearing deposits in banks 1 1 2 1 1
Total interest income 942 941 913 917 893 1 _ 49 5
INTEREST EXPENSE:
Deposits 52 48 41 34 33 4 8 19 58
Deposits held for sale 2 2 (2)(100)
Federal funds purchased and securities sold under agreements to repurchase 7 7 9 1 15 (8)(53)
Other short-term borrowed funds 15 19 21 30 19(4)(21)(4)(21)
Long-term borrowed funds 32 27 22 17 16 5 19 16 100
Total interest expense 106 101 93 84 85 5 5 21 25
Net interest income 836 840 820 833 808(4) _ 28 3
NONINTEREST INCOME:
Service charges and fees 135 144 144 147 139(9)(6)(4)(3)
Card fees 52 58 58 61 56(6)(10)(4)(7)
Trust and investment services fees 36 38 39 42 39(2)(5)(3)(8)
Foreign exchange and trade finance fees 23 25 26 22 22(2)(8) 1 5
Capital markets fees 22 25 22 26 18(3)(12) 4 22
Mortgage banking fees 33 16 21 14 20 17 106 13 65
Bank-owned life insurance income 12 13 13 12 11(1)(8) 1 9
Securities gains, net 8 1 2 _ 25 7 700(17)(68)
Other income 26 19 16 316 28 7 37(2)(7)
Total noninterest income 347 339 341 640 358 8 2(11)(3)
TOTAL REVENUE 1,183 1,179 1,161 1,473 1,166 4 _ 17 1
Provision for credit losses 58 72 77 49 121(14)(19)(63)(52)
NONINTEREST EXPENSE:
Salaries and employee benefits 419 397 409 467 405 22 6 14 3
Outside services 79 106 106 125 83(27)(25)(4)(5)
Occupancy 80 81 77 87 81(1)(1)(1)(1)
Equipment expense 63 63 58 65 64 (1)(2)
Amortization of software 36 43 38 33 31(7)(16) 5 16
Other operating expense 133 134 122 171 146(1)(1)(13)(9)
Total noninterest expense 810 824 810 948 810(14)(2)
Income before income tax expense 315 283 274 476 235 32 11 80 34
Income tax expense 106 86 85 163 69 20 23 37 54
NET INCOME $209 $197 $189 $313 $166 $12 6% $43 26%
Net income, excluding restructuring charges and special items1 $215 $217 $202 $205 $166($2)(1%) $49 30%
1 These are non-GAAP financial measures. For further information on these measures, refer to pages 28-33.
5
|
|
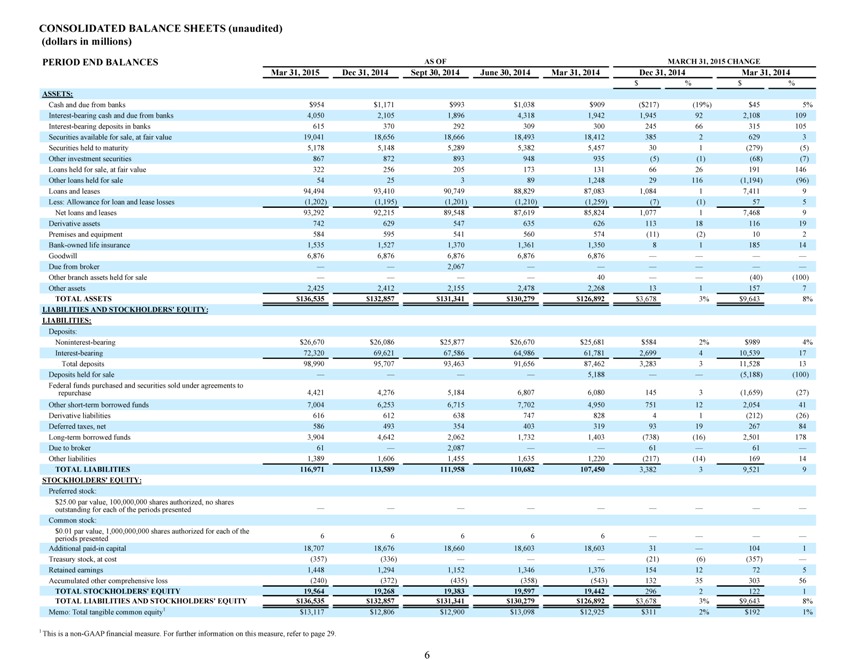
CONSOLIDATED BALANCE SHEETS (unaudited)
(dollars in millions)
PERIOD END BALANCES AS OF MARCH 31, 2015 CHANGE
Mar 31, 2015 Dec 31, 2014 Sept 30, 2014 June 30, 2014 Mar 31, 2014 Dec 31, 2014 Mar 31, 2014
$% $%
ASSETS:
Cash and due from banks $954 $1,171 $993 $1,038 $909($217)(19%) $45 5%
Interest-bearing cash and due from banks 4,050 2,105 1,896 4,318 1,942 1,945 92 2,108 109
Interest-bearing deposits in banks 615 370 292 309 300 245 66 315 105
Securities available for sale, at fair value 19,041 18,656 18,666 18,493 18,412 385 2 629 3
Securities held to maturity 5,178 5,148 5,289 5,382 5,457 30 1(279)(5)
Other investment securities 867 872 893 948 935(5)(1)(68)(7)
Loans held for sale, at fair value 322 256 205 173 131 66 26 191 146
Other loans held for sale 54 25 3 89 1,248 29 116(1,194)(96)
Loans and leases 94,494 93,410 90,749 88,829 87,083 1,084 1 7,411 9
Less: Allowance for loan and lease losses(1,202)(1,195)(1,201)(1,210)(1,259)(7)(1) 57 5
Net loans and leases 93,292 92,215 89,548 87,619 85,824 1,077 1 7,468 9
Derivative assets 742 629 547 635 626 113 18 116 19
Premises and equipment 584 595 541 560 574(11)(2) 10 2
Bank-owned life insurance 1,535 1,527 1,370 1,361 1,350 8 1 185 14
Goodwill 6,876 6,876 6,876 6,876 6,876
Due from broker 2,067
Other branch assets held for sale 40 (40)(100)
Other assets 2,425 2,412 2,155 2,478 2,268 13 1 157 7
TOTAL ASSETS $136,535 $132,857 $131,341 $130,279 $126,892 $3,678 3% $9,643 8%
LIABILITIES AND STOCKHOLDERS’ EQUITY:
LIABILITIES:
Deposits:
Noninterest-bearing $26,670 $26,086 $25,877 $26,670 $25,681 $584 2% $989 4%
Interest-bearing 72,320 69,621 67,586 64,986 61,781 2,699 4 10,539 17
Total deposits 98,990 95,707 93,463 91,656 87,462 3,283 3 11,528 13
Deposits held for sale 5,188 (5,188)(100)
Federal funds purchased and securities sold under agreements to
repurchase 4,421 4,276 5,184 6,807 6,080 145 3(1,659)(27)
Other short-term borrowed funds 7,004 6,253 6,715 7,702 4,950 751 12 2,054 41
Derivative liabilities 616 612 638 747 828 4 1(212)(26)
Deferred taxes, net 586 493 354 403 319 93 19 267 84
Long-term borrowed funds 3,904 4,642 2,062 1,732 1,403(738)(16) 2,501 178
Due to broker 61 _ 2,087 61 _ 61 _
Other liabilities 1,389 1,606 1,455 1,635 1,220(217)(14) 169 14
TOTAL LIABILITIES 116,971 113,589 111,958 110,682 107,450 3,382 3 9,521 9
STOCKHOLDERS’ EQUITY:
Preferred stock:
$25.00 par value, 100,000,000 shares authorized, no shares
outstanding for each of the periods presented
Common stock:
$0.01 par value, 1,000,000,000 shares authorized for each of the
periods presented 6 6 6 6 6
Additional paid-in capital 18,707 18,676 18,660 18,603 18,603 31 _ 104 1
Treasury stock, at cost(357)(336) (21)(6)(357) _
Retained earnings 1,448 1,294 1,152 1,346 1,376 154 12 72 5
Accumulated other comprehensive loss(240)(372)(435)(358)(543) 132 35 303 56
TOTAL STOCKHOLDERS’ EQUITY 19,564 19,268 19,383 19,597 19,442 296 2 122 1
TOTAL LIABILITIES AND STOCKHOLDERS’ EQUITY $136,535 $132,857 $131,341 $130,279 $126,892 $3,678 3% $9,643 8%
Memo: Total tangible common equity1 $13,117 $12,806 $12,900 $13,098 $12,925 $311 2% $192 1%
1 This is a non-GAAP financial measure. For further information on this measure, refer to page 29.
6
|
|
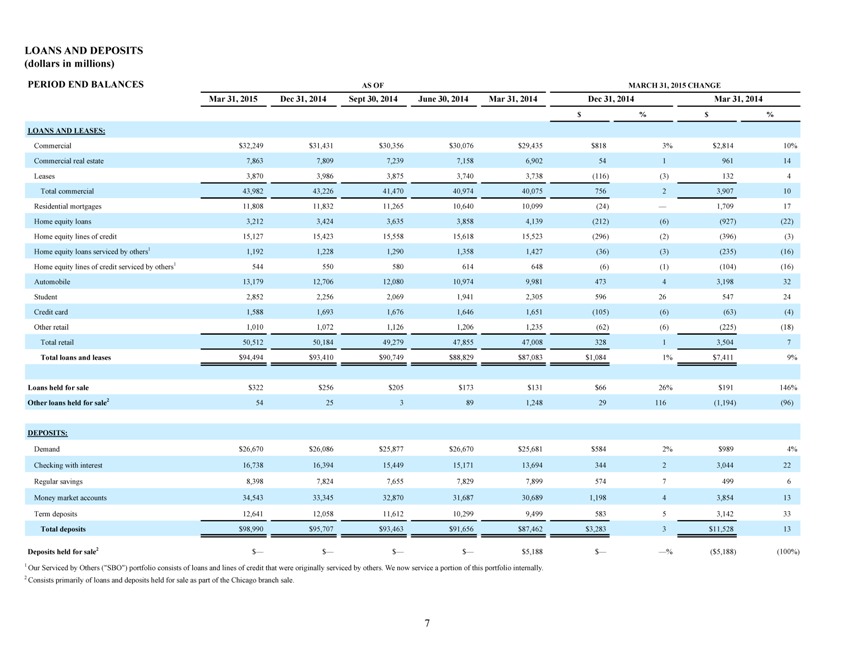
LOANS AND DEPOSITS
(dollars in millions)
PERIOD END BALANCES AS OF MARCH 31, 2015 CHANGE
Mar 31, 2015 Dec 31, 2014 Sept 30, 2014 June 30, 2014 Mar 31, 2014 Dec 31, 2014 Mar 31, 2014
$% $%
LOANS AND LEASES:
Commercial $32,249 $31,431 $30,356 $30,076 $29,435 $818 3% $2,814 10%
Commercial real estate 7,863 7,809 7,239 7,158 6,902 54 1 961 14
Leases 3,870 3,986 3,875 3,740 3,738(116)(3) 132 4
Total commercial 43,982 43,226 41,470 40,974 40,075 756 2 3,907 10
Residential mortgages 11,808 11,832 11,265 10,640 10,099(24) _ 1,709 17
Home equity loans 3,212 3,424 3,635 3,858 4,139(212)(6)(927)(22)
Home equity lines of credit 15,127 15,423 15,558 15,618 15,523(296)(2)(396)(3)
Home equity loans serviced by others1 1,192 1,228 1,290 1,358 1,427(36)(3)(235)(16)
Home equity lines of credit serviced by others1 544 550 580 614 648(6)(1)(104)(16)
Automobile 13,179 12,706 12,080 10,974 9,981 473 4 3,198 32
Student 2,852 2,256 2,069 1,941 2,305 596 26 547 24
Credit card 1,588 1,693 1,676 1,646 1,651(105)(6)(63)(4)
Other retail 1,010 1,072 1,126 1,206 1,235(62)(6)(225)(18)
Total retail 50,512 50,184 49,279 47,855 47,008 328 1 3,504 7
Total loans and leases $94,494 $93,410 $90,749 $88,829 $87,083 $1,084 1% $7,411 9%
Loans held for sale $322 $256 $205 $173 $131 $66 26% $191 146%
Other loans held for sale2 54 25 3 89 1,248 29 116(1,194)(96)
DEPOSITS:
Demand $26,670 $26,086 $25,877 $26,670 $25,681 $584 2% $989 4%
Checking with interest 16,738 16,394 15,449 15,171 13,694 344 2 3,044 22
Regular savings 8,398 7,824 7,655 7,829 7,899 574 7 499 6
Money market accounts 34,543 33,345 32,870 31,687 30,689 1,198 4 3,854 13
Term deposits 12,641 12,058 11,612 10,299 9,499 583 5 3,142 33
Total deposits $98,990 $95,707 $93,463 $91,656 $87,462 $3,283 3 $11,528 13
Deposits held for sale2 $_ $_ $_ $_ $5,188 $ %($5,188)(100%)
1 Our Serviced by Others (“SBO”) portfolio consists of loans and lines of credit that were originally serviced by others. We now service a portion of this portfolio internally.
2 Consists primarily of loans and deposits held for sale as part of the Chicago branch sale.
7
|
|
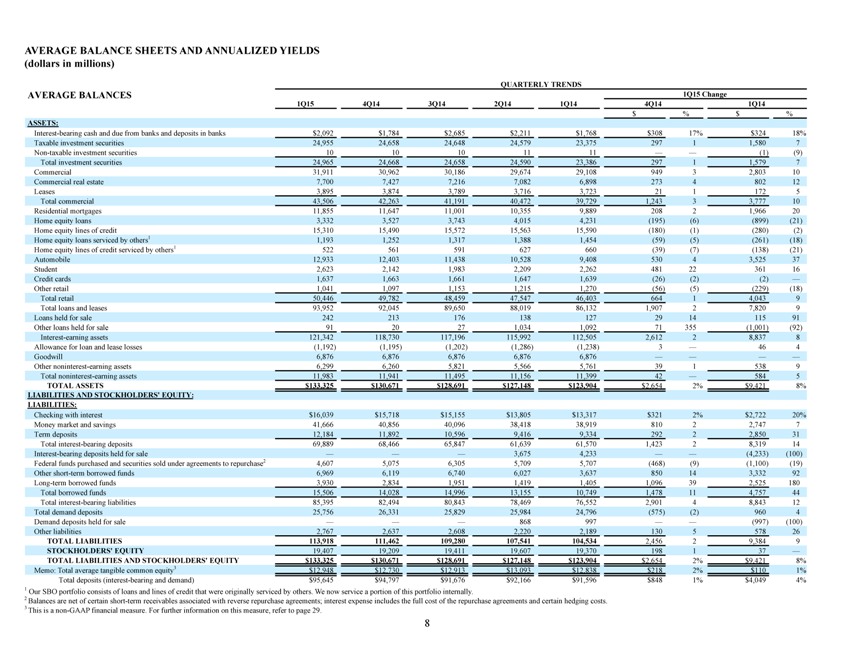
AVERAGE BALANCE SHEETS AND ANNUALIZED YIELDS
(dollars in millions)
QUARTERLY TRENDS
AVERAGE BALANCES 1Q15 Change
1Q15 4Q14 3Q14 2Q14 1Q14 4Q14 1Q14
$% $%
ASSETS:
Interest-bearing cash and due from banks and deposits in banks $2,092 $1,784 $2,685 $2,211 $1,768 $308 17% $324 18%
Taxable investment securities 24,955 24,658 24,648 24,579 23,375 297 1 1,580 7
Non-taxable investment securities 10 10 10 11 11 (1)(9)
Total investment securities 24,965 24,668 24,658 24,590 23,386 297 1 1,579 7
Commercial 31,911 30,962 30,186 29,674 29,108 949 3 2,803 10
Commercial real estate 7,700 7,427 7,216 7,082 6,898 273 4 802 12
Leases 3,895 3,874 3,789 3,716 3,723 21 1 172 5
Total commercial 43,506 42,263 41,191 40,472 39,729 1,243 3 3,777 10
Residential mortgages 11,855 11,647 11,001 10,355 9,889 208 2 1,966 20
Home equity loans 3,332 3,527 3,743 4,015 4,231(195)(6)(899)(21)
Home equity lines of credit 15,310 15,490 15,572 15,563 15,590(180)(1)(280)(2)
Home equity loans serviced by others1 1,193 1,252 1,317 1,388 1,454(59)(5)(261)(18)
Home equity lines of credit serviced by others1 522 561 591 627 660(39)(7)(138)(21)
Automobile 12,933 12,403 11,438 10,528 9,408 530 4 3,525 37
Student 2,623 2,142 1,983 2,209 2,262 481 22 361 16
Credit cards 1,637 1,663 1,661 1,647 1,639(26)(2)(2) _
Other retail 1,041 1,097 1,153 1,215 1,270(56)(5)(229)(18)
Total retail 50,446 49,782 48,459 47,547 46,403 664 1 4,043 9
Total loans and leases 93,952 92,045 89,650 88,019 86,132 1,907 2 7,820 9
Loans held for sale 242 213 176 138 127 29 14 115 91
Other loans held for sale 91 20 27 1,034 1,092 71 355(1,001)(92)
Interest-earning assets 121,342 118,730 117,196 115,992 112,505 2,612 2 8,837 8
Allowance for loan and lease losses(1,192)(1,195)(1,202)(1,286)(1,238) 3 _ 46 4
Goodwill 6,876 6,876 6,876 6,876 6,876
Other noninterest-earning assets 6,299 6,260 5,821 5,566 5,761 39 1 538 9
Total noninterest-earning assets 11,983 11,941 11,495 11,156 11,399 42 _ 584 5
TOTAL ASSETS $133,325 $130,671 $128,691 $127,148 $123,904 $2,654 2% $9,421 8%
LIABILITIES AND STOCKHOLDERS’ EQUITY:
LIABILITIES:
Checking with interest $16,039 $15,718 $15,155 $13,805 $13,317 $321 2% $2,722 20%
Money market and savings 41,666 40,856 40,096 38,418 38,919 810 2 2,747 7
Term deposits 12,184 11,892 10,596 9,416 9,334 292 2 2,850 31
Total interest-bearing deposits 69,889 68,466 65,847 61,639 61,570 1,423 2 8,319 14
Interest-bearing deposits held for sale 3,675 4,233 (4,233)(100)
Federal funds purchased and securities sold under agreements to repurchase2 4,607 5,075 6,305 5,709 5,707(468)(9)(1,100)(19)
Other short-term borrowed funds 6,969 6,119 6,740 6,027 3,637 850 14 3,332 92
Long-term borrowed funds 3,930 2,834 1,951 1,419 1,405 1,096 39 2,525 180
Total borrowed funds 15,506 14,028 14,996 13,155 10,749 1,478 11 4,757 44
Total interest-bearing liabilities 85,395 82,494 80,843 78,469 76,552 2,901 4 8,843 12
Total demand deposits 25,756 26,331 25,829 25,984 24,796(575)(2) 960 4
Demand deposits held for sale 868 997 (997)(100)
Other liabilities 2,767 2,637 2,608 2,220 2,189 130 5 578 26
TOTAL LIABILITIES 113,918 111,462 109,280 107,541 104,534 2,456 2 9,384 9
STOCKHOLDERS’ EQUITY 19,407 19,209 19,411 19,607 19,370 198 1 37 _
TOTAL LIABILITIES AND STOCKHOLDERS’ EQUITY $133,325 $130,671 $128,691 $127,148 $123,904 $2,654 2% $9,421 8%
Memo: Total average tangible common equity3 $12,948 $12,730 $12,913 $13,093 $12,838 $218 2% $110 1%
Total deposits (interest-bearing and demand) $95,645 $94,797 $91,676 $92,166 $91,596 $848 1% $4,049 4%
1 Our SBO portfolio consists of loans and lines of credit that were originally serviced by others. We now service a portion of this portfolio internally.
2 Balances are net of certain short-term receivables associated with reverse repurchase agreements; interest expense includes the full cost of the repurchase agreements and certain hedging costs. 3 This is a non-GAAP financial measure. For further information on this measure, refer to page 29.
8
|
|
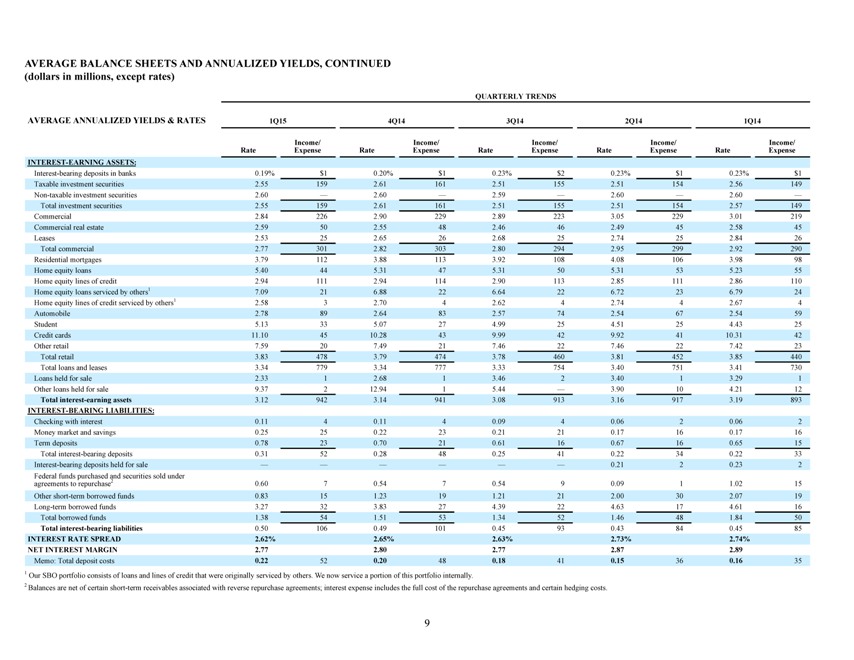
AVERAGE BALANCE SHEETS AND ANNUALIZED YIELDS, CONTINUED
(dollars in millions, except rates)
QUARTERLY TRENDS
AVERAGE ANNUALIZED YIELDS & RATES 1Q15 4Q14 3Q14 2Q14 1Q14
Income/ Income/ Income/ Income/ Income/
Rate Expense Rate Expense Rate Expense Rate Expense Rate Expense
INTEREST-EARNING ASSETS:
Interest-bearing deposits in banks 0.19% $1 0.20% $1 0.23% $2 0.23% $1 0.23% $1
Taxable investment securities 2.55 159 2.61 161 2.51 155 2.51 154 2.56 149
Non-taxable investment securities 2.60 _ 2.60 _ 2.59 _ 2.60 _ 2.60 _
Total investment securities 2.55 159 2.61 161 2.51 155 2.51 154 2.57 149
Commercial 2.84 226 2.90 229 2.89 223 3.05 229 3.01 219
Commercial real estate 2.59 50 2.55 48 2.46 46 2.49 45 2.58 45
Leases 2.53 25 2.65 26 2.68 25 2.74 25 2.84 26
Total commercial 2.77 301 2.82 303 2.80 294 2.95 299 2.92 290
Residential mortgages 3.79 112 3.88 113 3.92 108 4.08 106 3.98 98
Home equity loans 5.40 44 5.31 47 5.31 50 5.31 53 5.23 55
Home equity lines of credit 2.94 111 2.94 114 2.90 113 2.85 111 2.86 110
Home equity loans serviced by others1 7.09 21 6.88 22 6.64 22 6.72 23 6.79 24
Home equity lines of credit serviced by others1 2.58 3 2.70 4 2.62 4 2.74 4 2.67 4
Automobile 2.78 89 2.64 83 2.57 74 2.54 67 2.54 59
Student 5.13 33 5.07 27 4.99 25 4.51 25 4.43 25
Credit cards 11.10 45 10.28 43 9.99 42 9.92 41 10.31 42
Other retail 7.59 20 7.49 21 7.46 22 7.46 22 7.42 23
Total retail 3.83 478 3.79 474 3.78 460 3.81 452 3.85 440
Total loans and leases 3.34 779 3.34 777 3.33 754 3.40 751 3.41 730
Loans held for sale 2.33 1 2.68 1 3.46 2 3.40 1 3.29 1
Other loans held for sale 9.37 2 12.94 1 5.44 _ 3.90 10 4.21 12
Total interest-earning assets 3.12 942 3.14 941 3.08 913 3.16 917 3.19 893
INTEREST-BEARING LIABILITIES:
Checking with interest 0.11 4 0.11 4 0.09 4 0.06 2 0.06 2
Money market and savings 0.25 25 0.22 23 0.21 21 0.17 16 0.17 16
Term deposits 0.78 23 0.70 21 0.61 16 0.67 16 0.65 15
Total interest-bearing deposits 0.31 52 0.28 48 0.25 41 0.22 34 0.22 33
Interest-bearing deposits held for sale 0.21 2 0.23 2
Federal funds purchased and securities sold under
agreements to repurchase2 0.60 7 0.54 7 0.54 9 0.09 1 1.02 15
Other short-term borrowed funds 0.83 15 1.23 19 1.21 21 2.00 30 2.07 19
Long-term borrowed funds 3.27 32 3.83 27 4.39 22 4.63 17 4.61 16
Total borrowed funds 1.38 54 1.51 53 1.34 52 1.46 48 1.84 50
Total interest-bearing liabilities 0.50 106 0.49 101 0.45 93 0.43 84 0.45 85
INTEREST RATE SPREAD 2.62% 2.65% 2.63% 2.73% 2.74%
NET INTEREST MARGIN 2.77 2.80 2.77 2.87 2.89
Memo: Total deposit costs 0.22 52 0.20 48 0.18 41 0.15 36 0.16 35
1 Our SBO portfolio consists of loans and lines of credit that were originally serviced by others. We now service a portion of this portfolio internally.
2 Balances are net of certain short-term receivables associated with reverse repurchase agreements; interest expense includes the full cost of the repurchase agreements and certain hedging costs.
9
|
|
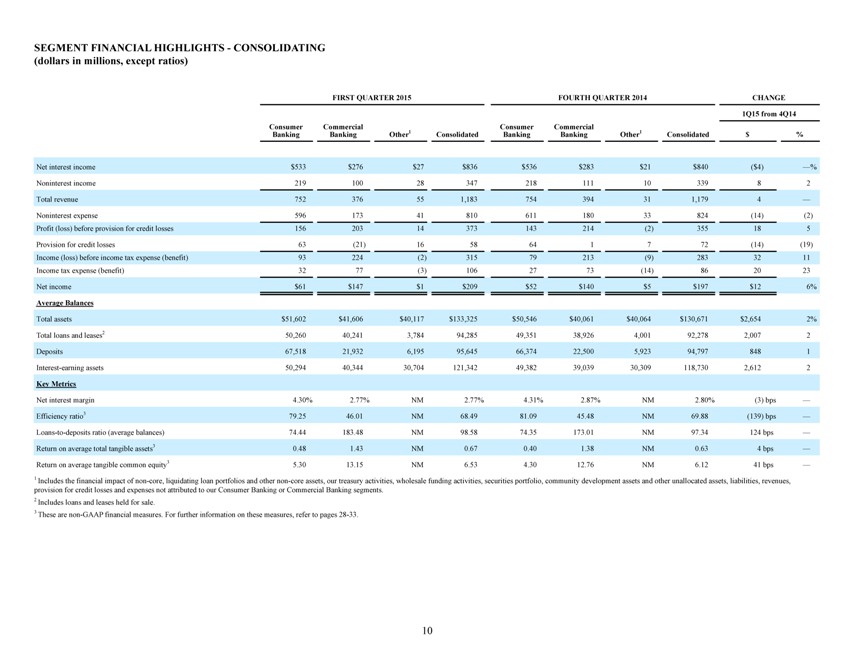
SEGMENT FINANCIAL HIGHLIGHTS—CONSOLIDATING
(dollars in millions, except ratios)
FIRST QUARTER 2015 FOURTH QUARTER 2014 CHANGE
1Q15 from 4Q14
Consumer Commercial Consumer Commercial
Banking Banking Other1 Consolidated Banking Banking Other1 Consolidated $%
Net interest income $533 $ 276 $27 $836 $536 $ 283 $21 $840($4) _%
Noninterest income 219 100 28 347 218 111 10 339 8 2
Total revenue 752 376 55 1,183 754 394 31 1,179 4 _
Noninterest expense 596 173 41 810 611 180 33 824(14)(2)
Profit (loss) before provision for credit losses 156 203 14 373 143 214(2) 355 18 5
Provision for credit losses 63(21) 16 58 64 1 7 72(14)(19)
Income (loss) before income tax expense (benefit) 93 224(2) 315 79 213(9) 283 32 11
Income tax expense (benefit) 32 77(3) 106 27 73(14) 86 20 23
Net income $61 $ 147 $1 $209 $52 $ 140 $5 $197 $12 6%
Average Balances
Total assets $51,602 $41,606 $40,117 $133,325 $50,546 $40,061 $40,064 $130,671 $2,654 2%
Total loans and leases2 50,260 40,241 3,784 94,285 49,351 38,926 4,001 92,278 2,007 2
Deposits 67,518 21,932 6,195 95,645 66,374 22,500 5,923 94,797 848 1
Interest-earning assets 50,294 40,344 30,704 121,342 49,382 39,039 30,309 118,730 2,612 2
Key Metrics
Net interest margin 4.30% 2.77% NM 2.77% 4.31% 2.87% NM 2.80%(3) bps _
Efficiency ratio3 79.25 46.01 NM 68.49 81.09 45.48 NM 69.88(139) bps _
Loans-to-deposits ratio (average balances) 74.44 183.48 NM 98.58 74.35 173.01 NM 97.34 124 bps _
Return on average total tangible assets3 0.48 1.43 NM 0.67 0.40 1.38 NM 0.63 4 bps _
Return on average tangible common equity3 5.30 13.15 NM 6.53 4.30 12.76 NM 6.12 41 bps _
1 Includes the financial impact of non-core, liquidating loan portfolios and other non-core assets, our treasury activities, wholesale funding activities, securities portfolio, community development assets and other unallocated assets, liabilities, revenues,
provision for credit losses and expenses not attributed to our Consumer Banking or Commercial Banking segments.
2 Includes loans and leases held for sale.
3 These are non-GAAP financial measures. For further information on these measures, refer to pages 28-33.
10
|
|
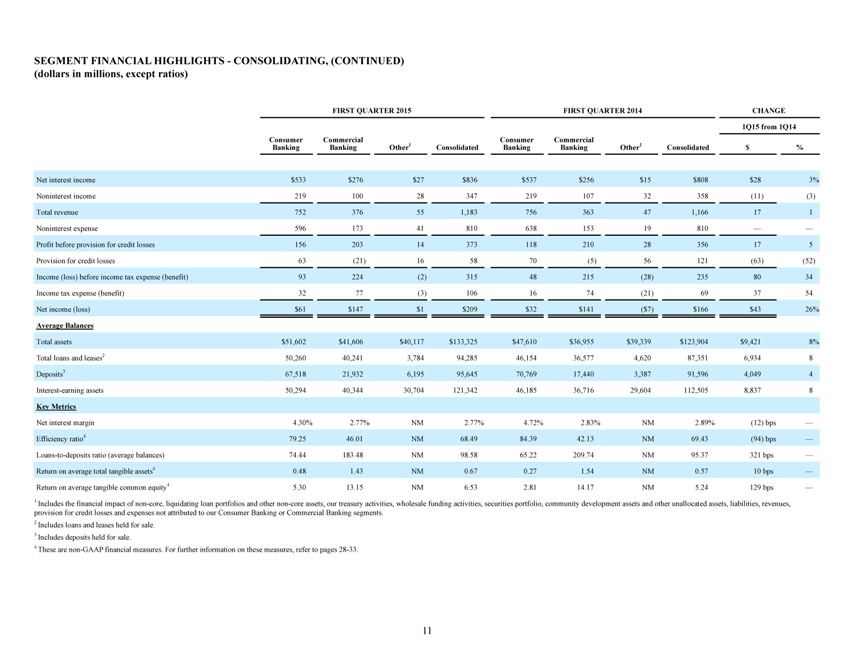
SEGMENT FINANCIAL HIGHLIGHTS—CONSOLIDATING, (CONTINUED)
(dollars in millions, except ratios)
FIRST QUARTER 2015 FIRST QUARTER 2014 CHANGE
1Q15 from 1Q14
Consumer Commercial Consumer Commercial
Banking Banking Other1 Consolidated Banking Banking Other1 Consolidated $%
Net interest income $533 $ 276 $27 $836 $537 $ 256 $15 $808 $28 3%
Noninterest income 219 100 28 347 219 107 32 358(11)(3)
Total revenue 752 376 55 1,183 756 363 47 1,166 17 1
Noninterest expense 596 173 41 810 638 153 19 810
Profit before provision for credit losses 156 203 14 373 118 210 28 356 17 5
Provision for credit losses 63(21) 16 58 70(5) 56 121(63)(52)
Income (loss) before income tax expense (benefit) 93 224(2) 315 48 215(28) 235 80 34
Income tax expense (benefit) 32 77(3) 106 16 74(21) 69 37 54
Net income (loss) $61 $ 147 $1 $209 $32 $ 141($7) $166 $43 26%
Average Balances
Total assets $51,602 $41,606 $40,117 $133,325 $47,610 $36,955 $39,339 $123,904 $9,421 8%
Total loans and leases2 50,260 40,241 3,784 94,285 46,154 36,577 4,620 87,351 6,934 8
Deposits3 67,518 21,932 6,195 95,645 70,769 17,440 3,387 91,596 4,049 4
Interest-earning assets 50,294 40,344 30,704 121,342 46,185 36,716 29,604 112,505 8,837 8
Key Metrics
Net interest margin 4.30% 2.77% NM 2.77% 4.72% 2.83% NM 2.89%(12) bps _
Efficiency ratio4 79.25 46.01 NM 68.49 84.39 42.13 NM 69.43(94) bps _
Loans-to-deposits ratio (average balances) 74.44 183.48 NM 98.58 65.22 209.74 NM 95.37 321 bps _
Return on average total tangible assets4 0.48 1.43 NM 0.67 0.27 1.54 NM 0.57 10 bps _
Return on average tangible common equity4 5.30 13.15 NM 6.53 2.81 14.17 NM 5.24 129 bps _
1 Includes the financial impact of non-core, liquidating loan portfolios and other non-core assets, our treasury activities, wholesale funding activities, securities portfolio, community development assets and other unallocated assets, liabilities, revenues,
provision for credit losses and expenses not attributed to our Consumer Banking or Commercial Banking segments.
2 Includes loans and leases held for sale.
3 Includes deposits held for sale.
4 These are non-GAAP financial measures. For further information on these measures, refer to pages 28-33.
11
|
|
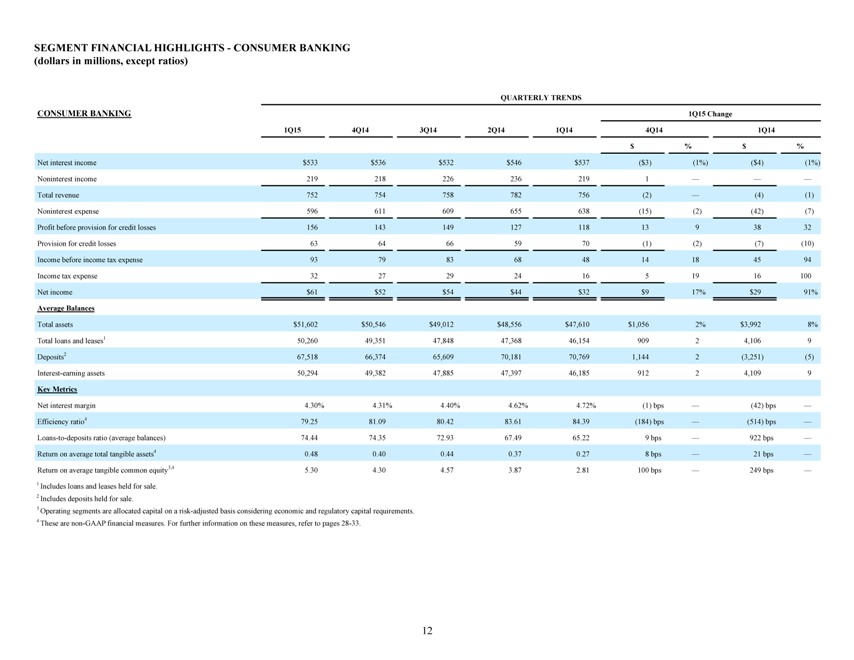
SEGMENT FINANCIAL HIGHLIGHTS—CONSUMER BANKING
(dollars in millions, except ratios)
QUARTERLY TRENDS
CONSUMER BANKING 1Q15 Change
1Q15 4Q14 3Q14 2Q14 1Q14 4Q14 1Q14
$% $%
Net interest income $533 $536 $532 $546 $537($3)(1%)($4)(1%)
Noninterest income 219 218 226 236 219 1
Total revenue 752 754 758 782 756(2) _(4)(1)
Noninterest expense 596 611 609 655 638(15)(2)(42)(7)
Profit before provision for credit losses 156 143 149 127 118 13 9 38 32
Provision for credit losses 63 64 66 59 70(1)(2)(7)(10)
Income before income tax expense 93 79 83 68 48 14 18 45 94
Income tax expense 32 27 29 24 16 5 19 16 100
Net income $61 $52 $54 $44 $32 $9 17% $29 91%
Average Balances
Total assets $51,602 $50,546 $49,012 $48,556 $47,610 $1,056 2% $3,992 8%
Total loans and leases1 50,260 49,351 47,848 47,368 46,154 909 2 4,106 9
Deposits2 67,518 66,374 65,609 70,181 70,769 1,144 2(3,251)(5)
Interest-earning assets 50,294 49,382 47,885 47,397 46,185 912 2 4,109 9
Key Metrics
Net interest margin 4.30% 4.31% 4.40% 4.62% 4.72%(1) bps _(42) bps _
Efficiency ratio4 79.25 81.09 80.42 83.61 84.39(184) bps _(514) bps _
Loans-to-deposits ratio (average balances) 74.44 74.35 72.93 67.49 65.22 9 bps _ 922 bps _
Return on average total tangible assets4 0.48 0.40 0.44 0.37 0.27 8 bps _ 21 bps _
Return on average tangible common equity3,4 5.30 4.30 4.57 3.87 2.81 100 bps _ 249 bps _
1 Includes loans and leases held for sale.
2 Includes deposits held for sale.
3 Operating segments are allocated capital on a risk-adjusted basis considering economic and regulatory capital requirements.
4 These are non-GAAP financial measures. For further information on these measures, refer to pages 28-33.
12
|
|
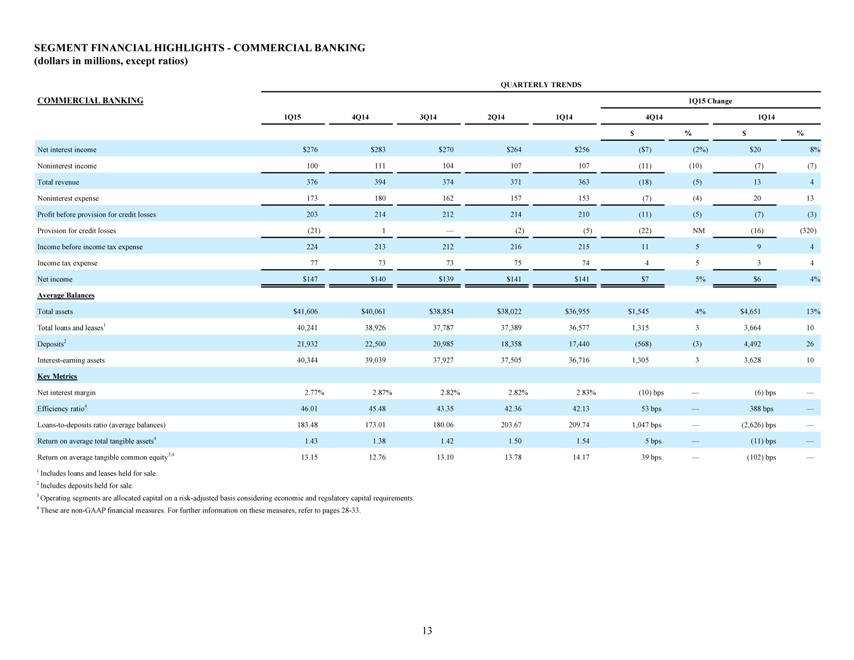
SEGMENT FINANCIAL HIGHLIGHTS—COMMERCIAL BANKING
(dollars in millions, except ratios)
QUARTERLY TRENDS
COMMERCIAL BANKING 1Q15 Change
1Q15 4Q14 3Q14 2Q14 1Q14 4Q14 1Q14
$% $%
Net interest income $276 $283 $270 $264 $256($7)(2%) $20 8%
Noninterest income 100 111 104 107 107(11)(10)(7)(7)
Total revenue 376 394 374 371 363(18)(5) 13 4
Noninterest expense 173 180 162 157 153(7)(4) 20 13
Profit before provision for credit losses 203 214 212 214 210(11)(5)(7)(3)
Provision for credit losses(21) 1 _(2)(5)(22) NM(16)(320)
Income before income tax expense 224 213 212 216 215 11 5 9 4
Income tax expense 77 73 73 75 74 4 5 3 4
Net income $147 $140 $139 $141 $141 $7 5% $6 4%
Average Balances
Total assets $41,606 $40,061 $38,854 $38,022 $36,955 $1,545 4% $4,651 13%
Total loans and leases1 40,241 38,926 37,787 37,389 36,577 1,315 3 3,664 10
Deposits2 21,932 22,500 20,985 18,358 17,440(568)(3) 4,492 26
Interest-earning assets 40,344 39,039 37,927 37,505 36,716 1,305 3 3,628 10
Key Metrics
Net interest margin 2.77% 2.87% 2.82% 2.82% 2.83%(10) bps _(6) bps _
Efficiency ratio4 46.01 45.48 43.35 42.36 42.13 53 bps _ 388 bps _
Loans-to-deposits ratio (average balances) 183.48 173.01 180.06 203.67 209.74 1,047 bps _(2,626) bps _
Return on average total tangible assets4 1.43 1.38 1.42 1.50 1.54 5 bps _(11) bps _
Return on average tangible common equity3,4 13.15 12.76 13.10 13.78 14.17 39 bps _(102) bps _
1 Includes loans and leases held for sale.
2 Includes deposits held for sale.
3 Operating segments are allocated capital on a risk-adjusted basis considering economic and regulatory capital requirements.
4 These are non-GAAP financial measures. For further information on these measures, refer to pages 28-33.
13
|
|
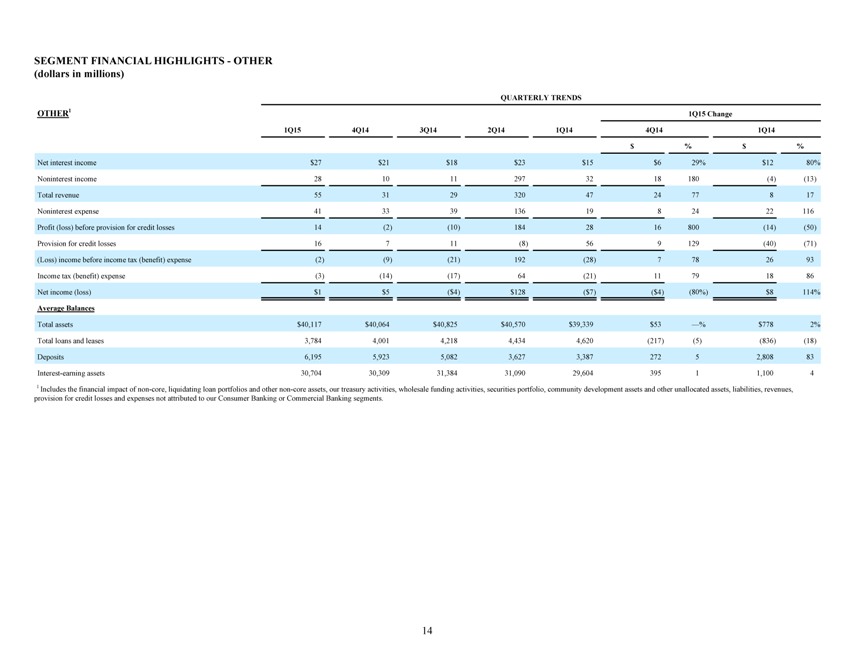
SEGMENT FINANCIAL HIGHLIGHTS—OTHER
(dollars in millions)
QUARTERLY TRENDS
OTHER1 1Q15 Change
1Q15 4Q14 3Q14 2Q14 1Q14 4Q14 1Q14
$% $%
Net interest income $27 $21 $18 $23 $15 $6 29% $12 80%
Noninterest income 28 10 11 297 32 18 180(4)(13)
Total revenue 55 31 29 320 47 24 77 8 17
Noninterest expense 41 33 39 136 19 8 24 22 116
Profit (loss) before provision for credit losses 14(2)(10) 184 28 16 800(14)(50)
Provision for credit losses 16 7 11(8) 56 9 129(40)(71)
(Loss) income before income tax (benefit) expense(2)(9)(21) 192(28) 7 78 26 93
Income tax (benefit) expense(3)(14)(17) 64(21) 11 79 18 86
Net income (loss) $1 $5($4) $128($7)($4)(80%) $8 114%
Average Balances
Total assets $40,117 $40,064 $40,825 $40,570 $39,339 $53 _% $778 2%
Total loans and leases 3,784 4,001 4,218 4,434 4,620(217)(5)(836)(18)
Deposits 6,195 5,923 5,082 3,627 3,387 272 5 2,808 83
Interest-earning assets 30,704 30,309 31,384 31,090 29,604 395 1 1,100 4
1 Includes the financial impact of non-core, liquidating loan portfolios and other non-core assets, our treasury activities, wholesale funding activities, securities portfolio, community development assets and other unallocated assets, liabilities, revenues,
provision for credit losses and expenses not attributed to our Consumer Banking or Commercial Banking segments.
14
|
|
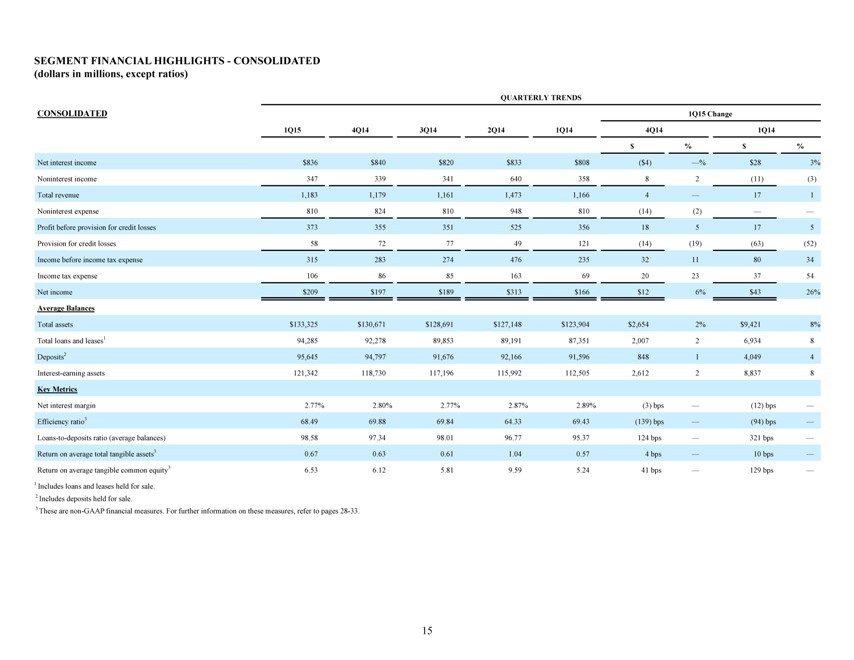
SEGMENT FINANCIAL HIGHLIGHTS—CONSOLIDATED
(dollars in millions, except ratios)
QUARTERLY TRENDS
CONSOLIDATED 1Q15 Change
1Q15 4Q14 3Q14 2Q14 1Q14 4Q14 1Q14
$% $%
Net interest income $836 $840 $820 $833 $808($4) _% $28 3%
Noninterest income 347 339 341 640 358 8 2(11)(3)
Total revenue 1,183 1,179 1,161 1,473 1,166 4 _ 17 1
Noninterest expense 810 824 810 948 810(14)(2)
Profit before provision for credit losses 373 355 351 525 356 18 5 17 5
Provision for credit losses 58 72 77 49 121(14)(19)(63)(52)
Income before income tax expense 315 283 274 476 235 32 11 80 34
Income tax expense 106 86 85 163 69 20 23 37 54
Net income $209 $197 $189 $313 $166 $12 6% $43 26%
Average Balances
Total assets $133,325 $130,671 $128,691 $127,148 $123,904 $2,654 2% $9,421 8%
Total loans and leases1 94,285 92,278 89,853 89,191 87,351 2,007 2 6,934 8
Deposits2 95,645 94,797 91,676 92,166 91,596 848 1 4,049 4
Interest-earning assets 121,342 118,730 117,196 115,992 112,505 2,612 2 8,837 8
Key Metrics
Net interest margin 2.77% 2.80% 2.77% 2.87% 2.89%(3) bps _(12) bps _
Efficiency ratio3 68.49 69.88 69.84 64.33 69.43(139) bps _(94) bps _
Loans-to-deposits ratio (average balances) 98.58 97.34 98.01 96.77 95.37 124 bps _ 321 bps _
Return on average total tangible assets3 0.67 0.63 0.61 1.04 0.57 4 bps _ 10 bps _
Return on average tangible common equity3 6.53 6.12 5.81 9.59 5.24 41 bps _ 129 bps _
1 Includes loans and leases held for sale.
2 Includes deposits held for sale.
3 These are non-GAAP financial measures. For further information on these measures, refer to pages 28-33.
15
|
|
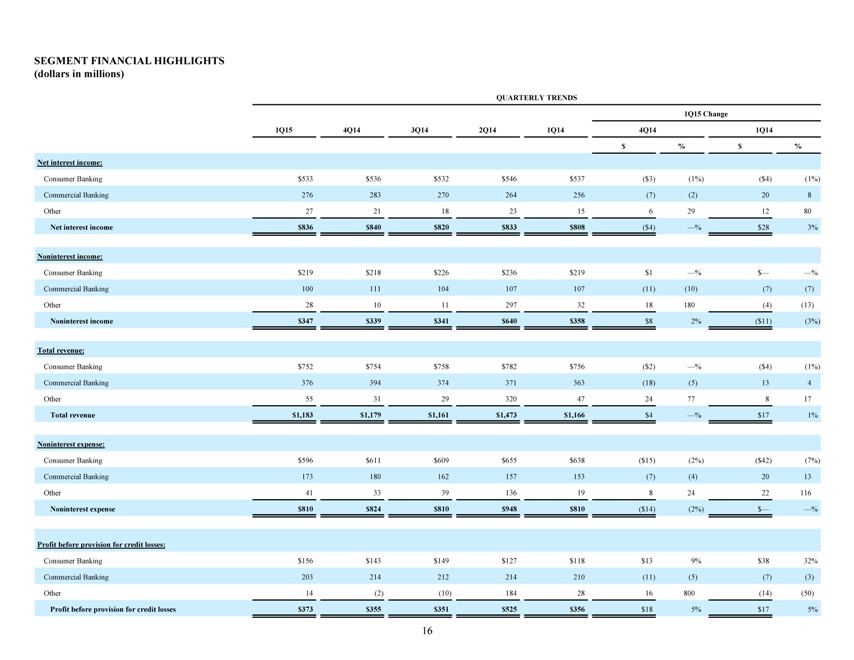
SEGMENT FINANCIAL HIGHLIGHTS
(dollars in millions)
QUARTERLY TRENDS
1Q15 Change
1Q15 4Q14 3Q14 2Q14 1Q14 4Q14 1Q14
$% $%
Net interest income:
Consumer Banking $533 $536 $532 $546 $537($3)(1%)($4)(1%)
Commercial Banking 276 283 270 264 256(7)(2) 20 8
Other 27 21 18 23 15 6 29 12 80
Net interest income $836 $840 $820 $833 $808($4) _% $28 3%
Noninterest income:
Consumer Banking $219 $218 $226 $236 $219 $1 _% $ %
Commercial Banking 100 111 104 107 107(11)(10)(7)(7)
Other 28 10 11 297 32 18 180(4)(13)
Noninterest income $347 $339 $341 $640 $358 $8 2%($11)(3%)
Total revenue:
Consumer Banking $752 $754 $758 $782 $756($2) _%($4)(1%)
Commercial Banking 376 394 374 371 363(18)(5) 13 4
Other 55 31 29 320 47 24 77 8 17
Total revenue $1,183 $1,179 $1,161 $1,473 $1,166 $4 _% $17 1%
Noninterest expense:
Consumer Banking $596 $611 $609 $655 $638($15)(2%)($42)(7%)
Commercial Banking 173 180 162 157 153(7)(4) 20 13
Other 41 33 39 136 19 8 24 22 116
Noninterest expense $810 $824 $810 $948 $810($14)(2%) $ %
Profit before provision for credit losses:
Consumer Banking $156 $143 $149 $127 $118 $13 9% $38 32%
Commercial Banking 203 214 212 214 210(11)(5)(7)(3)
Other 14(2)(10) 184 28 16 800(14)(50)
Profit before provision for credit losses $373 $355 $351 $525 $356 $18 5% $17 5%
16
|
|
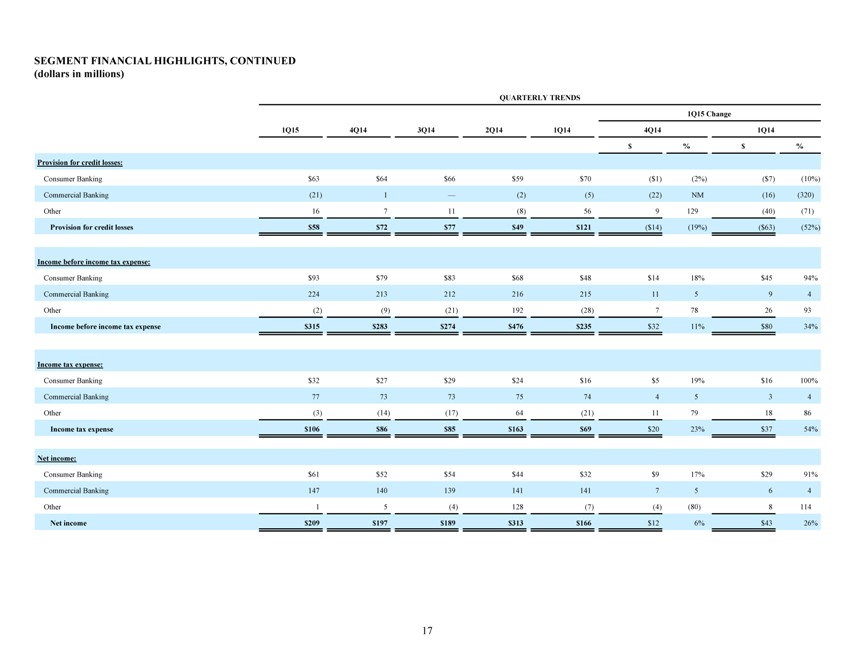
SEGMENT FINANCIAL HIGHLIGHTS, CONTINUED
(dollars in millions)
QUARTERLY TRENDS
1Q15 Change
1Q15 4Q14 3Q14 2Q14 1Q14 4Q14 1Q14
$% $%
Provision for credit losses:
Consumer Banking $63 $64 $66 $59 $70($1)(2%)($7)(10%)
Commercial Banking(21) 1 _(2)(5)(22) NM(16)(320)
Other 16 7 11(8) 56 9 129(40)(71)
Provision for credit losses $58 $72 $77 $49 $121($14)(19%)($63)(52%)
Income before income tax expense:
Consumer Banking $93 $79 $83 $68 $48 $14 18% $45 94%
Commercial Banking 224 213 212 216 215 11 5 9 4
Other(2)(9)(21) 192(28) 7 78 26 93
Income before income tax expense $315 $283 $274 $476 $235 $32 11% $80 34%
Income tax expense:
Consumer Banking $32 $27 $29 $24 $16 $5 19% $16 100%
Commercial Banking 77 73 73 75 74 4 5 3 4
Other(3)(14)(17) 64(21) 11 79 18 86
Income tax expense $106 $86 $85 $163 $69 $20 23% $37 54%
Net income:
Consumer Banking $61 $52 $54 $44 $32 $9 17% $29 91%
Commercial Banking 147 140 139 141 141 7 5 6 4
Other 1 5(4) 128(7)(4)(80) 8 114
Net income $209 $197 $189 $313 $166 $12 6% $43 26%
17
|
|
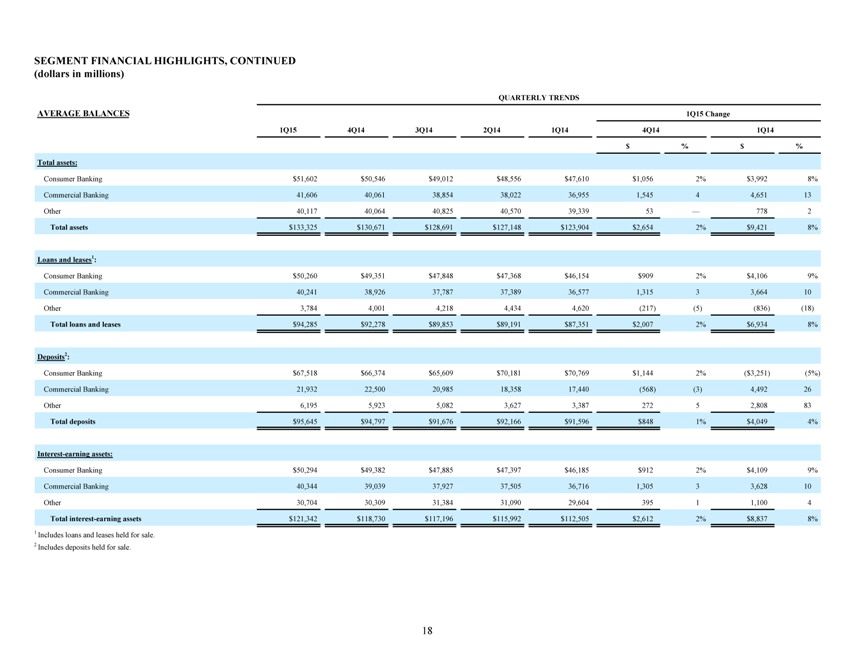
SEGMENT FINANCIAL HIGHLIGHTS, CONTINUED
(dollars in millions)
QUARTERLY TRENDS
AVERAGE BALANCES 1Q15 Change
1Q15 4Q14 3Q14 2Q14 1Q14 4Q14 1Q14
$% $%
Total assets:
Consumer Banking $51,602 $50,546 $49,012 $48,556 $47,610 $1,056 2% $ 3,992 8%
Commercial Banking 41,606 40,061 38,854 38,022 36,955 1,545 4 4,651 13
Other 40,117 40,064 40,825 40,570 39,339 53 _ 778 2
Total assets $133,325 $130,671 $128,691 $127,148 $123,904 $2,654 2% $ 9,421 8%
Loans and leases1:
Consumer Banking $50,260 $49,351 $47,848 $47,368 $46,154 $909 2% $ 4,106 9%
Commercial Banking 40,241 38,926 37,787 37,389 36,577 1,315 3 3,664 10
Other 3,784 4,001 4,218 4,434 4,620(217)(5)(836)(18)
Total loans and leases $94,285 $92,278 $89,853 $89,191 $87,351 $2,007 2% $ 6,934 8%
Deposits2:
Consumer Banking $67,518 $66,374 $65,609 $70,181 $70,769 $1,144 2%($ 3,251)(5%)
Commercial Banking 21,932 22,500 20,985 18,358 17,440(568)(3) 4,492 26
Other 6,195 5,923 5,082 3,627 3,387 272 5 2,808 83
Total deposits $95,645 $94,797 $91,676 $92,166 $91,596 $848 1% $ 4,049 4%
Interest-earning assets:
Consumer Banking $50,294 $49,382 $47,885 $47,397 $46,185 $912 2% $ 4,109 9%
Commercial Banking 40,344 39,039 37,927 37,505 36,716 1,305 3 3,628 10
Other 30,704 30,309 31,384 31,090 29,604 395 1 1,100 4
Total interest-earning assets $121,342 $118,730 $117,196 $115,992 $112,505 $2,612 2% $ 8,837 8%
1 Includes loans and leases held for sale.
2 Includes deposits held for sale.
18
|
|
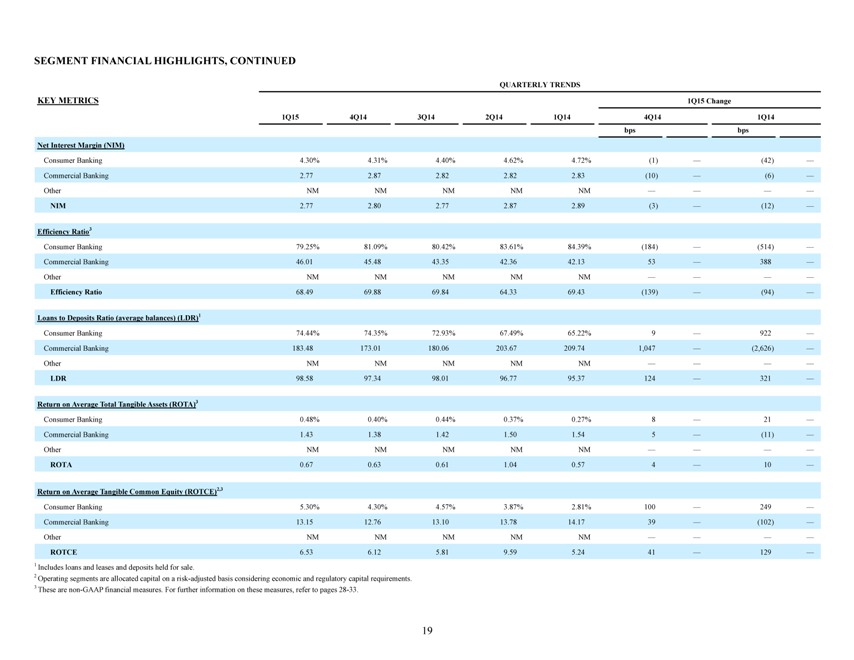
SEGMENT FINANCIAL HIGHLIGHTS, CONTINUED
QUARTERLY TRENDS
KEY METRICS 1Q15 Change
1Q15 4Q14 3Q14 2Q14 1Q14 4Q14 1Q14
bps bps
Net Interest Margin (NIM)
Consumer Banking 4.30% 4.31% 4.40% 4.62% 4.72%(1) _(42) _
Commercial Banking 2.77 2.87 2.82 2.82 2.83(10) _(6) _
Other NM NM NM NM NM
NIM 2.77 2.80 2.77 2.87 2.89(3) _(12) _
Efficiency Ratio3
Consumer Banking 79.25% 81.09% 80.42% 83.61% 84.39%(184) _(514) _
Commercial Banking 46.01 45.48 43.35 42.36 42.13 53 _ 388 _
Other NM NM NM NM NM
Efficiency Ratio 68.49 69.88 69.84 64.33 69.43(139) _(94) _
Loans to Deposits Ratio (average balances) (LDR)1
Consumer Banking 74.44% 74.35% 72.93% 67.49% 65.22% 9 _ 922 _
Commercial Banking 183.48 173.01 180.06 203.67 209.74 1,047 _(2,626) _
Other NM NM NM NM NM
LDR 98.58 97.34 98.01 96.77 95.37 124 _ 321 _
Return on Average Total Tangible Assets (ROTA)3
Consumer Banking 0.48% 0.40% 0.44% 0.37% 0.27% 8 _ 21 _
Commercial Banking 1.43 1.38 1.42 1.50 1.54 5 _(11) _
Other NM NM NM NM NM
ROTA 0.67 0.63 0.61 1.04 0.57 4 _ 10 _
Return on Average Tangible Common Equity (ROTCE)2,3
Consumer Banking 5.30% 4.30% 4.57% 3.87% 2.81% 100 _ 249 _
Commercial Banking 13.15 12.76 13.10 13.78 14.17 39 _(102) _
Other NM NM NM NM NM
ROTCE 6.53 6.12 5.81 9.59 5.24 41 _ 129 _
1 Includes loans and leases and deposits held for sale.
2 Operating segments are allocated capital on a risk-adjusted basis considering economic and regulatory capital requirements.
3 These are non-GAAP financial measures. For further information on these measures, refer to pages 28-33.
19
|
|
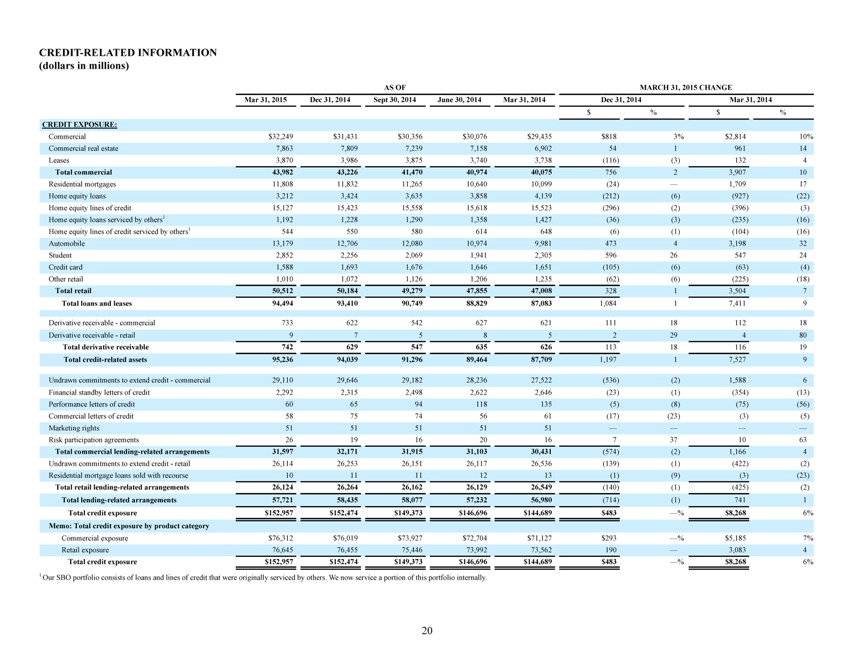
CREDIT-RELATED INFORMATION
(dollars in millions)
AS OF MARCH 31, 2015 CHANGE
Mar 31, 2015 Dec 31, 2014 Sept 30, 2014 June 30, 2014 Mar 31, 2014 Dec 31, 2014 Mar 31, 2014
$% $%
CREDIT EXPOSURE:
Commercial $32,249 $31,431 $30,356 $30,076 $29,435 $818 3% $ 2,814 10%
Commercial real estate 7,863 7,809 7,239 7,158 6,902 54 1 961 14
Leases 3,870 3,986 3,875 3,740 3,738(116)(3) 132 4
Total commercial 43,982 43,226 41,470 40,974 40,075 756 2 3,907 10
Residential mortgages 11,808 11,832 11,265 10,640 10,099(24) _ 1,709 17
Home equity loans 3,212 3,424 3,635 3,858 4,139(212)(6)(927)(22)
Home equity lines of credit 15,127 15,423 15,558 15,618 15,523(296)(2)(396)(3)
Home equity loans serviced by others1 1,192 1,228 1,290 1,358 1,427(36)(3)(235)(16)
Home equity lines of credit serviced by others1 544 550 580 614 648(6)(1)(104)(16)
Automobile 13,179 12,706 12,080 10,974 9,981 473 4 3,198 32
Student 2,852 2,256 2,069 1,941 2,305 596 26 547 24
Credit card 1,588 1,693 1,676 1,646 1,651(105)(6)(63)(4)
Other retail 1,010 1,072 1,126 1,206 1,235(62)(6)(225)(18)
Total retail 50,512 50,184 49,279 47,855 47,008 328 1 3,504 7
Total loans and leases 94,494 93,410 90,749 88,829 87,083 1,084 1 7,411 9
Derivative receivable—commercial 733 622 542 627 621 111 18 112 18
Derivative receivable—retail 9 7 5 8 5 2 29 4 80
Total derivative receivable 742 629 547 635 626 113 18 116 19
Total credit-related assets 95,236 94,039 91,296 89,464 87,709 1,197 1 7,527 9
Undrawn commitments to extend credit—commercial 29,110 29,646 29,182 28,236 27,522(536)(2) 1,588 6
Financial standby letters of credit 2,292 2,315 2,498 2,622 2,646(23)(1)(354)(13)
Performance letters of credit 60 65 94 118 135(5)(8)(75)(56)
Commercial letters of credit 58 75 74 56 61(17)(23)(3)(5)
Marketing rights 51 51 51 51 51
Risk participation agreements 26 19 16 20 16 7 37 10 63
Total commercial lending-related arrangements 31,597 32,171 31,915 31,103 30,431(574)(2) 1,166 4
Undrawn commitments to extend credit—retail 26,114 26,253 26,151 26,117 26,536(139)(1)(422)(2)
Residential mortgage loans sold with recourse 10 11 11 12 13(1)(9)(3)(23)
Total retail lending-related arrangements 26,124 26,264 26,162 26,129 26,549(140)(1)(425)(2)
Total lending-related arrangements 57,721 58,435 58,077 57,232 56,980(714)(1) 741 1
Total credit exposure $152,957 $152,474 $149,373 $146,696 $144,689 $483 _% $ 8,268 6%
Memo: Total credit exposure by product category
Commercial exposure $76,312 $76,019 $73,927 $72,704 $71,127 $293 _% $ 5,185 7%
Retail exposure 76,645 76,455 75,446 73,992 73,562 190 _ 3,083 4
Total credit exposure $152,957 $152,474 $149,373 $146,696 $144,689 $483 _% $ 8,268 6%
1 Our SBO portfolio consists of loans and lines of credit that were originally serviced by others. We now service a portion of this portfolio internally.
20
|
|
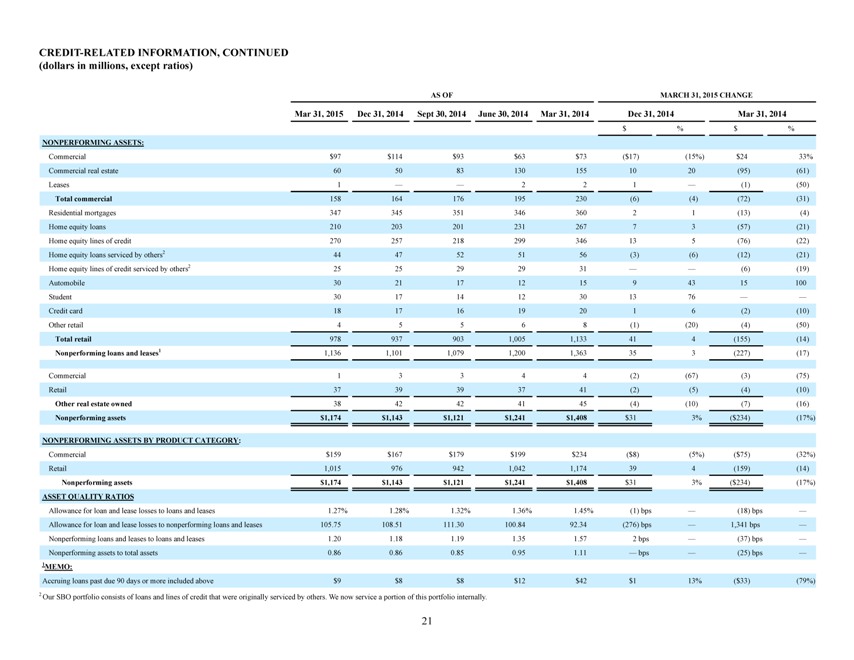
CREDIT-RELATED INFORMATION, CONTINUED
(dollars in millions, except ratios)
AS OF MARCH 31, 2015 CHANGE
Mar 31, 2015 Dec 31, 2014 Sept 30, 2014 June 30, 2014 Mar 31, 2014 Dec 31, 2014 Mar 31, 2014
$% $%
NONPERFORMING ASSETS:
Commercial $97 $114 $93 $63 $73($17)(15%) $24 33%
Commercial real estate 60 50 83 130 155 10 20(95)(61)
Leases 1 2 2 1 _(1)(50)
Total commercial 158 164 176 195 230(6)(4)(72)(31)
Residential mortgages 347 345 351 346 360 2 1(13)(4)
Home equity loans 210 203 201 231 267 7 3(57)(21)
Home equity lines of credit 270 257 218 299 346 13 5(76)(22)
Home equity loans serviced by others2 44 47 52 51 56(3)(6)(12)(21)
Home equity lines of credit serviced by others2 25 25 29 29 31 (6)(19)
Automobile 30 21 17 12 15 9 43 15 100
Student 30 17 14 12 30 13 76
Credit card 18 17 16 19 20 1 6(2)(10)
Other retail 4 5 5 6 8(1)(20)(4)(50)
Total retail 978 937 903 1,005 1,133 41 4(155)(14)
Nonperforming loans and leases1 1,136 1,101 1,079 1,200 1,363 35 3(227)(17)
Commercial 1 3 3 4 4(2)(67)(3)(75)
Retail 37 39 39 37 41(2)(5)(4)(10)
Other real estate owned 38 42 42 41 45(4)(10)(7)(16)
Nonperforming assets $1,174 $1,143 $1,121 $1,241 $1,408 $31 3%($234)(17%)
21
|
|
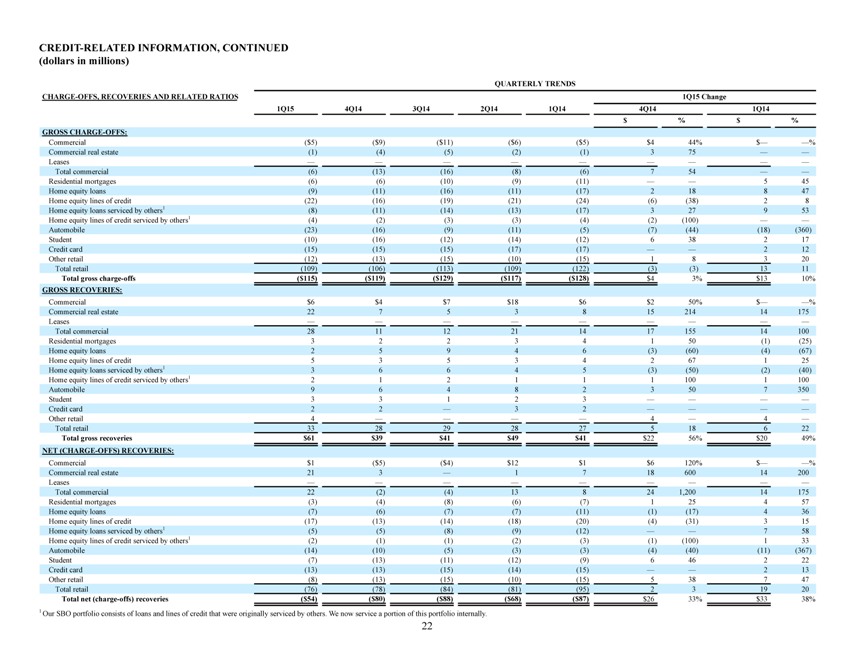
CREDIT-RELATED INFORMATION, CONTINUED
(dollars in millions)
QUARTERLY TRENDS
CHARGE-OFFS, RECOVERIES AND RELATED RATIOS 1Q15 Change
1Q15 4Q14 3Q14 2Q14 1Q14 4Q14 1Q14
$% $%
GROSS CHARGE-OFFS:
Commercial($5)($9)($11)($6)($5) $4 44% $ %
Commercial real estate(1)(4)(5)(2)(1) 3 75
Leases
Total commercial(6)(13)(16)(8)(6) 7 54
Residential mortgages(6)(6)(10)(9)(11) 5 45
Home equity loans(9)(11)(16)(11)(17) 2 18 8 47
Home equity lines of credit(22)(16)(19)(21)(24)(6)(38) 2 8
Home equity loans serviced by others1(8)(11)(14)(13)(17) 3 27 9 53
Home equity lines of credit serviced by others1(4)(2)(3)(3)(4)(2)(100)
Automobile(23)(16)(9)(11)(5)(7)(44)(18)(360)
Student(10)(16)(12)(14)(12) 6 38 2 17
Credit card(15)(15)(15)(17)(17) 2 12
Other retail(12)(13)(15)(10)(15) 1 8 3 20
Total retail(109)(106)(113)(109)(122)(3)(3) 13 11
Total gross charge-offs($115)($119)($129)($117)($128) $4 3% $13 10%
GROSS RECOVERIES:
Commercial $6 $4 $7 $18 $6 $2 50% $ %
Commercial real estate 22 7 5 3 8 15 214 14 175
Leases
Total commercial 28 11 12 21 14 17 155 14 100
Residential mortgages 3 2 2 3 4 1 50(1)(25)
Home equity loans 2 5 9 4 6(3)(60)(4)(67)
Home equity lines of credit 5 3 5 3 4 2 67 1 25
Home equity loans serviced by others1 3 6 6 4 5(3)(50)(2)(40)
Home equity lines of credit serviced by others1 2 1 2 1 1 1 100 1 100
Automobile 9 6 4 8 2 3 50 7 350
Student 3 3 1 2 3
Credit card 2 2 _ 3 2
Other retail 4 4 _ 4 _
Total retail 33 28 29 28 27 5 18 6 22
Total gross recoveries $61 $39 $41 $49 $41 $22 56% $20 49%
NET (CHARGE-OFFS) RECOVERIES:
Commercial $1($5)($4) $12 $1 $6 120% $ %
Commercial real estate 21 3 _ 1 7 18 600 14 200
Leases
Total commercial 22(2)(4) 13 8 24 1,200 14 175
Residential mortgages(3)(4)(8)(6)(7) 1 25 4 57
Home equity loans(7)(6)(7)(7)(11)(1)(17) 4 36
Home equity lines of credit(17)(13)(14)(18)(20)(4)(31) 3 15
Home equity loans serviced by others1(5)(5)(8)(9)(12) 7 58
Home equity lines of credit serviced by others1(2)(1)(1)(2)(3)(1)(100) 1 33
Automobile(14)(10)(5)(3)(3)(4)(40)(11)(367)
Student(7)(13)(11)(12)(9) 6 46 2 22
Credit card(13)(13)(15)(14)(15) 2 13
Other retail(8)(13)(15)(10)(15) 5 38 7 47
Total retail(76)(78)(84)(81)(95) 2 3 19 20
Total net (charge-offs) recoveries($54)($80)($88)($68)($87) $26 33% $33 38%
1 Our SBO portfolio consists of loans and lines of credit that were originally serviced by others. We now service a portion of this portfolio internally.
22
|
|
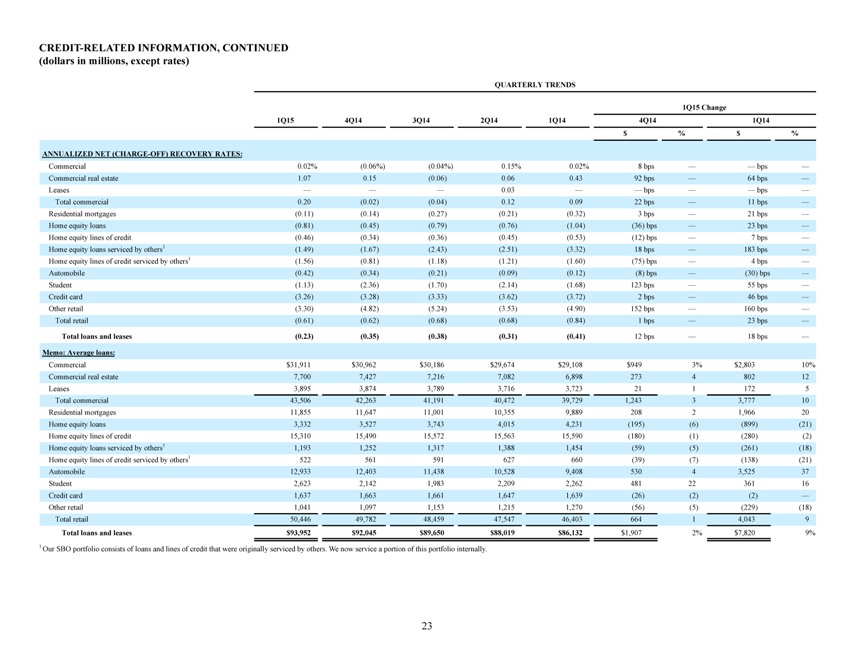
CREDIT-RELATED INFORMATION, CONTINUED
(dollars in millions, except rates)
QUARTERLY TRENDS
1Q15 Change
1Q15 4Q14 3Q14 2Q14 1Q14 4Q14 1Q14
$% $%
ANNUALIZED NET (CHARGE-OFF) RECOVERY RATES:
Commercial 0.02%(0.06%)(0.04%) 0.15% 0.02% 8 bps bps _
Commercial real estate 1.07 0.15(0.06) 0.06 0.43 92 bps _ 64 bps _
Leases 0.03 bps bps _
Total commercial 0.20(0.02)(0.04) 0.12 0.09 22 bps _ 11 bps _
Residential mortgages(0.11)(0.14)(0.27)(0.21)(0.32) 3 bps _ 21 bps _
Home equity loans(0.81)(0.45)(0.79)(0.76)(1.04)(36) bps _ 23 bps _
Home equity lines of credit(0.46)(0.34)(0.36)(0.45)(0.53)(12) bps _ 7 bps _
Home equity loans serviced by others1(1.49)(1.67)(2.43)(2.51)(3.32) 18 bps _ 183 bps _
Home equity lines of credit serviced by others1(1.56)(0.81)(1.18)(1.21)(1.60)(75) bps _ 4 bps _
Automobile(0.42)(0.34)(0.21)(0.09)(0.12)(8) bps _(30) bps _
Student(1.13)(2.36)(1.70)(2.14)(1.68) 123 bps _ 55 bps _
Credit card(3.26)(3.28)(3.33)(3.62)(3.72) 2 bps _ 46 bps _
Other retail(3.30)(4.82)(5.24)(3.53)(4.90) 152 bps _ 160 bps _
Total retail(0.61)(0.62)(0.68)(0.68)(0.84) 1 bps _ 23 bps _
Total loans and leases(0.23)(0.35)(0.38)(0.31)(0.41) 12 bps _ 18 bps _
Memo: Average loans:
Commercial $ 31,911 $ 30,962 $ 30,186 $ 29,674 $ 29,108 $949 3% $2,803 10%
Commercial real estate 7,700 7,427 7,216 7,082 6,898 273 4 802 12
Leases 3,895 3,874 3,789 3,716 3,723 21 1 172 5
Total commercial 43,506 42,263 41,191 40,472 39,729 1,243 3 3,777 10
Residential mortgages 11,855 11,647 11,001 10,355 9,889 208 2 1,966 20
Home equity loans 3,332 3,527 3,743 4,015 4,231(195)(6)(899)(21)
Home equity lines of credit 15,310 15,490 15,572 15,563 15,590(180)(1)(280)(2)
Home equity loans serviced by others1 1,193 1,252 1,317 1,388 1,454(59)(5)(261)(18)
Home equity lines of credit serviced by others1 522 561 591 627 660(39)(7)(138)(21)
Automobile 12,933 12,403 11,438 10,528 9,408 530 4 3,525 37
Student 2,623 2,142 1,983 2,209 2,262 481 22 361 16
Credit card 1,637 1,663 1,661 1,647 1,639(26)(2)(2) _
Other retail 1,041 1,097 1,153 1,215 1,270(56)(5)(229)(18)
Total retail 50,446 49,782 48,459 47,547 46,403 664 1 4,043 9
Total loans and leases $ 93,952 $ 92,045 $ 89,650 $ 88,019 $ 86,132 $1,907 2% $7,820 9%
1 Our SBO portfolio consists of loans and lines of credit that were originally serviced by others. We now service a portion of this portfolio internally.
23
|
|
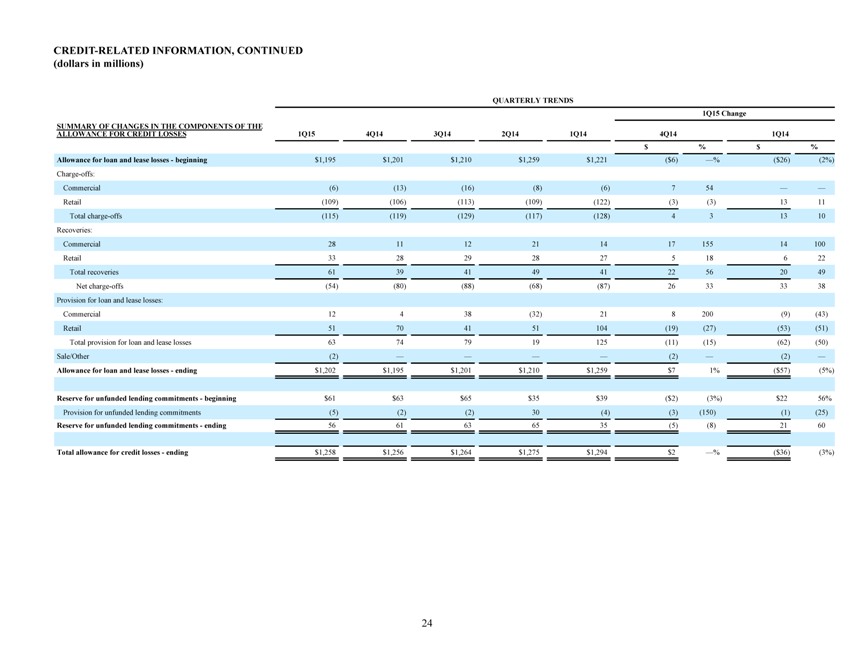
CREDIT-RELATED INFORMATION, CONTINUED
(dollars in millions)
QUARTERLY TRENDS
1Q15 Change
SUMMARY OF CHANGES IN THE COMPONENTS OF THE
ALLOWANCE FOR CREDIT LOSSES 1Q15 4Q14 3Q14 2Q14 1Q14 4Q14 1Q14
$% $%
Allowance for loan and lease losses—beginning $1,195 $1,201 $1,210 $1,259 $1,221($6) _%($26)(2%)
Charge-offs:
Commercial(6)(13)(16)(8)(6) 7 54
Retail(109)(106)(113)(109)(122)(3)(3) 13 11
Total charge-offs(115)(119)(129)(117)(128) 4 3 13 10
Recoveries:
Commercial 28 11 12 21 14 17 155 14 100
Retail 33 28 29 28 27 5 18 6 22
Total recoveries 61 39 41 49 41 22 56 20 49
Net charge-offs(54)(80)(88)(68)(87) 26 33 33 38
Provision for loan and lease losses:
Commercial 12 4 38(32) 21 8 200(9)(43)
Retail 51 70 41 51 104(19)(27)(53)(51)
Total provision for loan and lease losses 63 74 79 19 125(11)(15)(62)(50)
Sale/Other(2) (2) _(2) _
Allowance for loan and lease losses—ending $1,202 $1,195 $1,201 $1,210 $1,259 $7 1%($57)(5%)
Reserve for unfunded lending commitments—beginning $61 $63 $65 $35 $39($2)(3%) $22 56%
Provision for unfunded lending commitments(5)(2)(2) 30(4)(3)(150)(1)(25)
Reserve for unfunded lending commitments—ending 56 61 63 65 35(5)(8) 21 60
Total allowance for credit losses—ending $1,258 $1,256 $1,264 $1,275 $1,294 $2 _%($36)(3%)
24
|
|
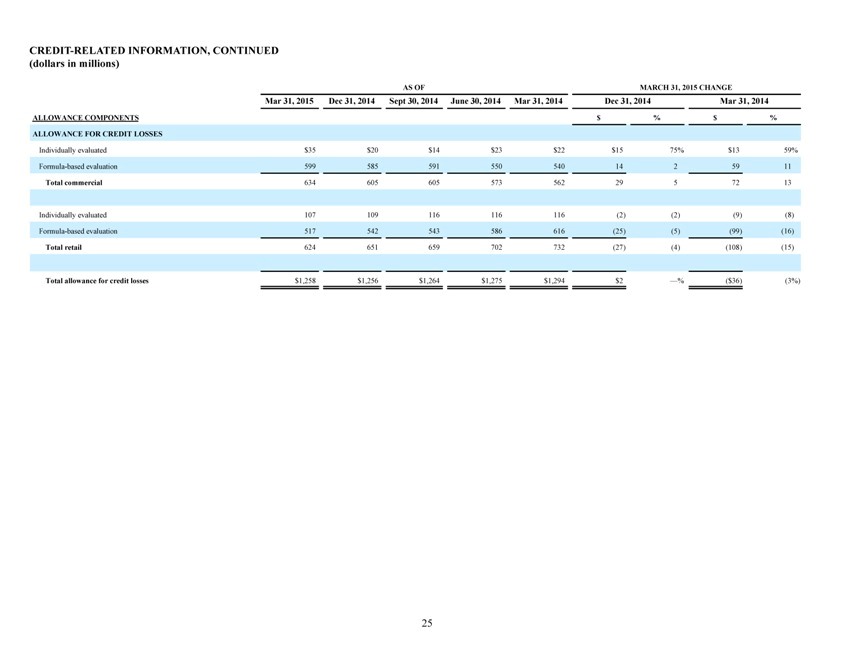
CREDIT-RELATED INFORMATION, CONTINUED
(dollars in millions)
AS OF MARCH 31, 2015 CHANGE
Mar 31, 2015 Dec 31, 2014 Sept 30, 2014 June 30, 2014 Mar 31, 2014 Dec 31, 2014 Mar 31, 2014
ALLOWANCE COMPONENTS $% $%
ALLOWANCE FOR CREDIT LOSSES
Individually evaluated $35 $20 $14 $23 $22 $15 75% $13 59%
Formula-based evaluation 599 585 591 550 540 14 2 59 11
Total commercial 634 605 605 573 562 29 5 72 13
Individually evaluated 107 109 116 116 116(2)(2)(9)(8)
Formula-based evaluation 517 542 543 586 616(25)(5)(99)(16)
Total retail 624 651 659 702 732(27)(4)(108)(15)
Total allowance for credit losses $1,258 $1,256 $1,264 $1,275 $1,294 $2 _%($36)(3%)
25
|
|
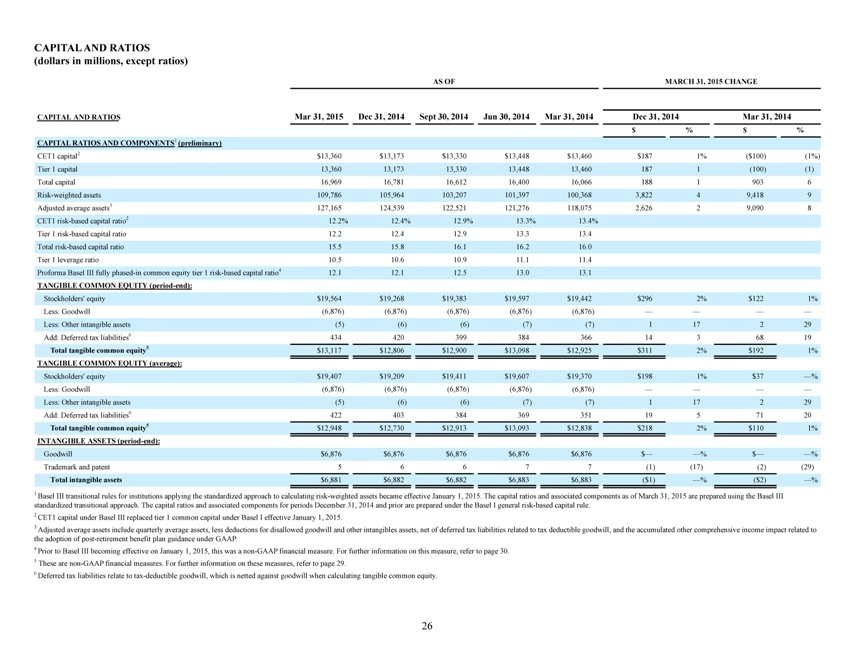
CAPITAL AND RATIOS
(dollars in millions, except ratios)
AS OF MARCH 31, 2015 CHANGE
CAPITAL AND RATIOS Mar 31, 2015 Dec 31, 2014 Sept 30, 2014 Jun 30, 2014 Mar 31, 2014 Dec 31, 2014 Mar 31, 2014
$% $%
CAPITAL RATIOS AND COMPONENTS1 (preliminary)
CET1 capital2 $13,360 $13,173 $13,330 $13,448 $13,460 $187 1%($100)(1%)
Tier 1 capital 13,360 13,173 13,330 13,448 13,460 187 1(100)(1)
Total capital 16,969 16,781 16,612 16,400 16,066 188 1 903 6
Risk-weighted assets 109,786 105,964 103,207 101,397 100,368 3,822 4 9,418 9
Adjusted average assets3 127,165 124,539 122,521 121,276 118,075 2,626 2 9,090 8
CET1 risk-based capital ratio2 12.2% 12.4% 12.9% 13.3% 13.4%
Tier 1 risk-based capital ratio 12.2 12.4 12.9 13.3 13.4
Total risk-based capital ratio 15.5 15.8 16.1 16.2 16.0
Tier 1 leverage ratio 10.5 10.6 10.9 11.1 11.4
Proforma Basel III fully phased-in common equity tier 1 risk-based capital ratio4 12.1 12.1 12.5 13.0 13.1
TANGIBLE COMMON EQUITY (period-end):
Stockholders’ equity $19,564 $19,268 $19,383 $19,597 $19,442 $296 2% $122 1%
Less: Goodwill(6,876)(6,876)(6,876)(6,876)(6,876)
Less: Other intangible assets(5)(6)(6)(7)(7) 1 17 2 29
Add: Deferred tax liabilities6 434 420 399 384 366 14 3 68 19
Total tangible common equity5 $13,117 $12,806 $12,900 $13,098 $12,925 $311 2% $192 1%
TANGIBLE COMMON EQUITY (average):
Stockholders’ equity $19,407 $19,209 $19,411 $19,607 $19,370 $198 1% $37 _%
Less: Goodwill(6,876)(6,876)(6,876)(6,876)(6,876)
Less: Other intangible assets(5)(6)(6)(7)(7) 1 17 2 29
Add: Deferred tax liabilities6 422 403 384 369 351 19 5 71 20
Total tangible common equity5 $12,948 $12,730 $12,913 $13,093 $12,838 $218 2% $110 1%
INTANGIBLE ASSETS (period-end):
Goodwill $6,876 $6,876 $6,876 $6,876 $6,876 $ % $ %
Trademark and patent 5 6 6 7 7(1)(17)(2)(29)
Total intangible assets $6,881 $6,882 $6,882 $6,883 $6,883($1) _%($2) _%
1 Basel III transitional rules for institutions applying the standardized approach to calculating risk-weighted assets became effective January 1, 2015. The capital ratios and associated components as of March 31, 2015 are prepared using the Basel III standardized transitional approach. The capital ratios and associated components for periods December 31, 2014 and prior are prepared under the Basel I general risk-based capital rule.
2 CET1 capital under Basel III replaced tier 1 common capital under Basel I effective January 1, 2015.
3 Adjusted average assets include quarterly average assets, less deductions for disallowed goodwill and other intangibles assets, net of deferred tax liabilities related to tax deductible goodwill, and the accumulated other comprehensive income impact related to the adoption of post-retirement benefit plan guidance under GAAP.
4 Prior to Basel III becoming effective on January 1, 2015, this was a non-GAAP financial measure. For further information on this measure, refer to page 30. 5 These are non-GAAP financial measures. For further information on these measures, refer to page 29.
6 Deferred tax liabilities relate to tax-deductible goodwill, which is netted against goodwill when calculating tangible common equity.
26
|
|
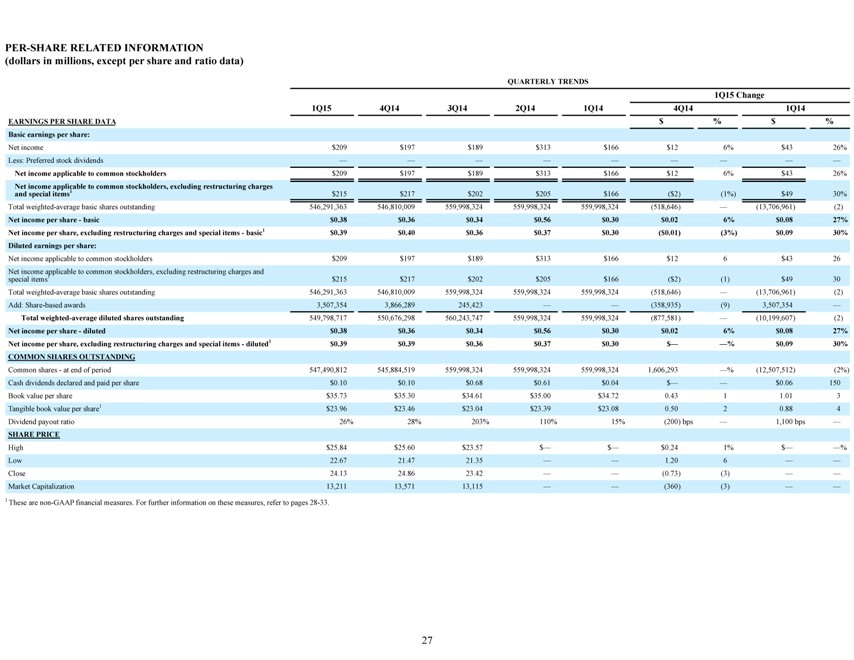
PER-SHARE RELATED INFORMATION
(dollars in millions, except per share and ratio data)
QUARTERLY TRENDS
1Q15 Change
1Q15 4Q14 3Q14 2Q14 1Q14 4Q14 1Q14
EARNINGS PER SHARE DATA $% $%
Basic earnings per share:
Net income $209 $197 $189 $313 $166 $12 6% $43 26%
Less: Preferred stock dividends
Net income applicable to common stockholders $209 $197 $189 $313 $166 $12 6% $43 26%
Net income applicable to common stockholders, excluding restructuring charges
and special items1 $215 $217 $202 $205 $166($2)(1%) $49 30%
Total weighted-average basic shares outstanding 546,291,363 546,810,009 559,998,324 559,998,324 559,998,324(518,646) _(13,706,961)(2)
Net income per share—basic $0.38 $0.36 $0.34 $0.56 $0.30 $0.02 6% $0.08 27%
Net income per share, excluding restructuring charges and special items—basic1 $0.39 $0.40 $0.36 $0.37 $0.30($0.01)(3%) $0.09 30%
Diluted earnings per share:
Net income applicable to common stockholders $209 $197 $189 $313 $166 $12 6 $43 26
Net income applicable to common stockholders, excluding restructuring charges and
special items1 $215 $217 $202 $205 $166($2)(1) $49 30
Total weighted-average basic shares outstanding 546,291,363 546,810,009 559,998,324 559,998,324 559,998,324(518,646) _(13,706,961)(2)
Add: Share-based awards 3,507,354 3,866,289 245,423 (358,935)(9) 3,507,354 _
Total weighted-average diluted shares outstanding 549,798,717 550,676,298 560,243,747 559,998,324 559,998,324(877,581) _(10,199,607)(2)
Net income per share—diluted $0.38 $0.36 $0.34 $0.56 $0.30 $0.02 6% $0.08 27%
Net income per share, excluding restructuring charges and special items—diluted1 $0.39 $0.39 $0.36 $0.37 $0.30 $ % $0.09 30%
COMMON SHARES OUTSTANDING
Common shares—at end of period 547,490,812 545,884,519 559,998,324 559,998,324 559,998,324 1,606,293 _%(12,507,512)(2%)
Cash dividends declared and paid per share $0.10 $0.10 $0.68 $0.61 $0.04 $ $0.06 150
Book value per share $35.73 $35.30 $34.61 $35.00 $34.72 0.43 1 1.01 3
Tangible book value per share1 $23.96 $23.46 $23.04 $23.39 $23.08 0.50 2 0.88 4
Dividend payout ratio 26% 28% 203% 110% 15%(200) bps _ 1,100 bps _
SHARE PRICE
High $25.84 $25.60 $23.57 $_ $_ $0.24 1% $ %
Low 22.67 21.47 21.35 1.20 6
Close 24.13 24.86 23.42 (0.73)(3)
Market Capitalization 13,211 13,571 13,115 (360)(3)
1 These are non-GAAP financial measures. For further information on these measures, refer to pages 28-33.
27
|
|
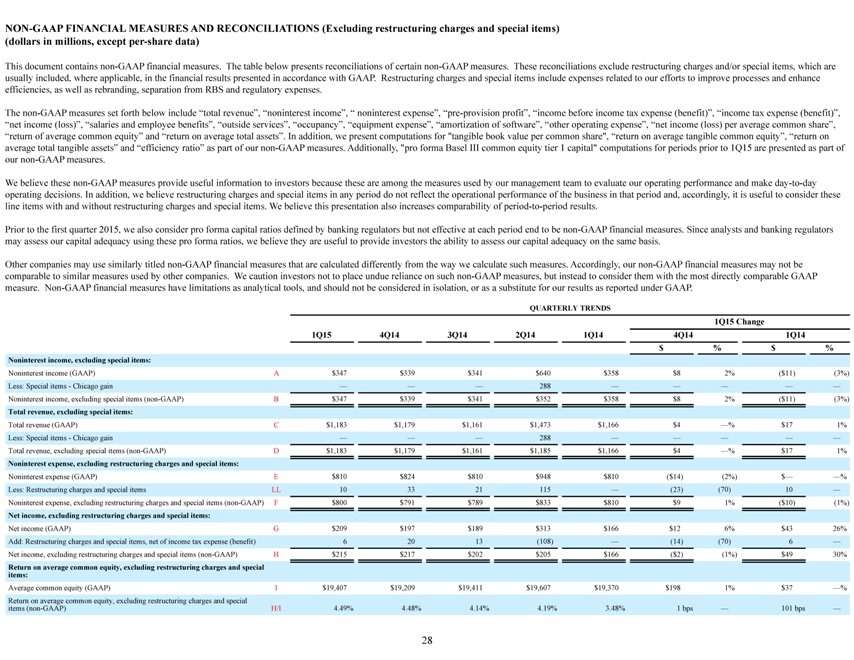
NON-GAAP FINANCIAL MEASURES AND RECONCILIATIONS (Excluding restructuring charges and special items) (dollars in millions, except per-share data)
This document contains non-GAAP financial measures. The table below presents reconciliations of certain non-GAAP measures. These reconciliations exclude restructuring charges and/or special items, which are usually included, where applicable, in the financial results presented in accordance with GAAP. Restructuring charges and special items include expenses related to our efforts to improve processes and enhance efficiencies, as well as rebranding, separation from RBS and regulatory expenses.
The non-GAAP measures set forth below include _total revenue_, _noninterest income_, _ noninterest expense_, _pre-provision profit_, _income before income tax expense (benefit)_, _income tax expense (benefit)_, _net income (loss)_, _salaries and employee benefits_, _outside services_, _occupancy_, _equipment expense_, _amortization of software_, _other operating expense_, _net income (loss) per average common share_, _return of average common equity_ and _return on average total assets_. In addition, we present computations for “tangible book value per common share”, _return on average tangible common equity_, _return on average total tangible assets_ and _efficiency ratio_ as part of our non-GAAP measures. Additionally, “pro forma Basel III common equity tier 1 capital” computations for periods prior to 1Q15 are presented as part of our non-GAAP measures.
We believe these non-GAAP measures provide useful information to investors because these are among the measures used by our management team to evaluate our operating performance and make day-to-day operating decisions. In addition, we believe restructuring charges and special items in any period do not reflect the operational performance of the business in that period and, accordingly, it is useful to consider these line items with and without restructuring charges and special items. We believe this presentation also increases comparability of period-to-period results.
Prior to the first quarter 2015, we also consider pro forma capital ratios defined by banking regulators but not effective at each period end to be non-GAAP financial measures. Since analysts and banking regulators may assess our capital adequacy using these pro forma ratios, we believe they are useful to provide investors the ability to assess our capital adequacy on the same basis.
Other companies may use similarly titled non-GAAP financial measures that are calculated differently from the way we calculate such measures. Accordingly, our non-GAAP financial measures may not be comparable to similar measures used by other companies. We caution investors not to place undue reliance on such non-GAAP measures, but instead to consider them with the most directly comparable GAAP measure. Non-GAAP financial measures have limitations as analytical tools, and should not be considered in isolation, or as a substitute for our results as reported under GAAP.
QUARTERLY TRENDS
1Q15 Change
1Q15 4Q14 3Q14 2Q14 1Q14 4Q14 1Q14
$% $%
Noninterest income, excluding special items:
Noninterest income (GAAP) A $347 $339 $341 $640 $358 $8 2%($ 11)(3%)
Less: Special items—Chicago gain 288
Noninterest income, excluding special items (non-GAAP) B $347 $339 $341 $352 $358 $8 2%($ 11)(3%)
Total revenue, excluding special items:
Total revenue (GAAP) C $1,183 $1,179 $1,161 $1,473 $1,166 $4 _% $ 17 1%
Less: Special items—Chicago gain 288
Total revenue, excluding special items (non-GAAP) D $1,183 $1,179 $1,161 $1,185 $1,166 $4 _% $ 17 1%
Noninterest expense, excluding restructuring charges and special items:
Noninterest expense (GAAP) E $810 $824 $810 $948 $810($14)(2%) $ %
Less: Restructuring charges and special items LL 10 33 21 115 _(23)(70) 10 _
Noninterest expense, excluding restructuring charges and special items (non-GAAP) F $800 $791 $789 $833 $810 $9 1%($ 10)(1%)
Net income, excluding restructuring charges and special items:
Net income (GAAP) G $209 $197 $189 $313 $166 $12 6% $ 43 26%
Add: Restructuring charges and special items, net of income tax expense (benefit) 6 20 13(108) _(14)(70) 6 _
Net income, excluding restructuring charges and special items (non-GAAP) H $215 $217 $202 $205 $166($2)(1%) $ 49 30%
Return on average common equity, excluding restructuring charges and special
items:
Average common equity (GAAP) I $19,407 $19,209 $19,411 $19,607 $19,370 $198 1% $ 37 _%
Return on average common equity, excluding restructuring charges and special
items (non-GAAP) H/I 4.49% 4.48% 4.14% 4.19% 3.48% 1 bps _ 101 bps _
28
|
|
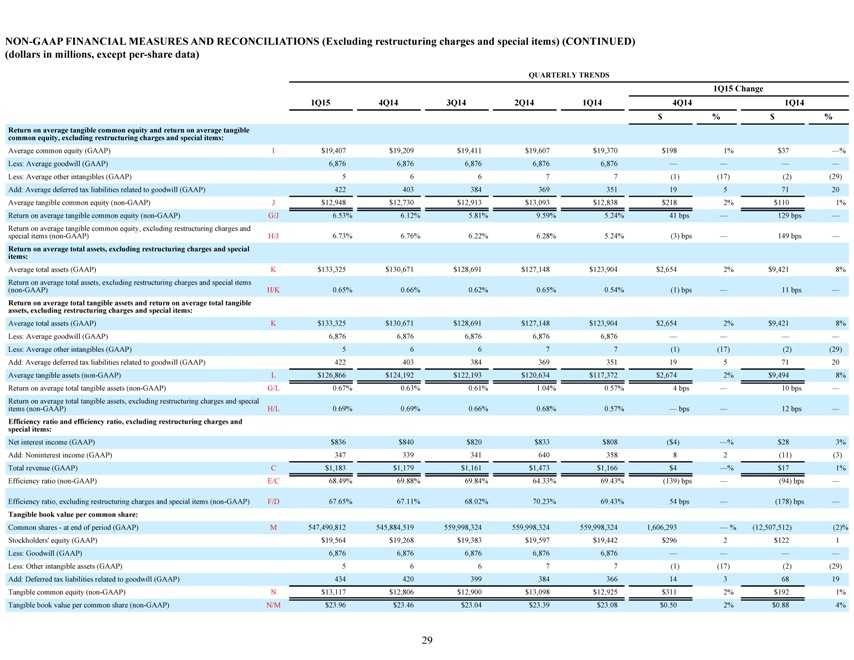
NON-GAAP FINANCIAL MEASURES AND RECONCILIATIONS (Excluding restructuring charges and special items) (CONTINUED) (dollars in millions, except per-share data)
QUARTERLY TRENDS
1Q15 Change
1Q15 4Q14 3Q14 2Q14 1Q14 4Q14 1Q14
$% $%
Return on average tangible common equity and return on average tangible
common equity, excluding restructuring charges and special items:
Average common equity (GAAP) I $19,407 $19,209 $19,411 $19,607 $19,370 $198 1% $37 _%
Less: Average goodwill (GAAP) 6,876 6,876 6,876 6,876 6,876
Less: Average other intangibles (GAAP) 5 6 6 7 7(1)(17)(2)(29)
Add: Average deferred tax liabilities related to goodwill (GAAP) 422 403 384 369 351 19 5 71 20
Average tangible common equity (non-GAAP) J $12,948 $12,730 $12,913 $13,093 $12,838 $218 2% $110 1%
Return on average tangible common equity (non-GAAP) G/J 6.53% 6.12% 5.81% 9.59% 5.24% 41 bps _ 129 bps _
Return on average tangible common equity, excluding restructuring charges and
special items (non-GAAP) H/J 6.73% 6.76% 6.22% 6.28% 5.24%(3) bps _ 149 bps _
Return on average total assets, excluding restructuring charges and special
items:
Average total assets (GAAP) K $133,325 $130,671 $128,691 $127,148 $123,904 $2,654 2% $9,421 8%
Return on average total assets, excluding restructuring charges and special items
(non-GAAP) H/K 0.65% 0.66% 0.62% 0.65% 0.54%(1) bps _ 11 bps _
Return on average total tangible assets and return on average total tangible
assets, excluding restructuring charges and special items:
Average total assets (GAAP) K $133,325 $130,671 $128,691 $127,148 $123,904 $2,654 2% $9,421 8%
Less: Average goodwill (GAAP) 6,876 6,876 6,876 6,876 6,876
Less: Average other intangibles (GAAP) 5 6 6 7 7(1)(17)(2)(29)
Add: Average deferred tax liabilities related to goodwill (GAAP) 422 403 384 369 351 19 5 71 20
Average tangible assets (non-GAAP) L $126,866 $124,192 $122,193 $120,634 $117,372 $2,674 2% $9,494 8%
Return on average total tangible assets (non-GAAP) G/L 0.67% 0.63% 0.61% 1.04% 0.57% 4 bps _ 10 bps _
Return on average total tangible assets, excluding restructuring charges and special
items (non-GAAP) H/L 0.69% 0.69% 0.66% 0.68% 0.57% _ bps _ 12 bps _
Efficiency ratio and efficiency ratio, excluding restructuring charges and
special items:
Net interest income (GAAP) $836 $840 $820 $833 $808($4) _% $28 3%
Add: Noninterest income (GAAP) 347 339 341 640 358 8 2(11)(3)
Total revenue (GAAP) C $1,183 $1,179 $1,161 $1,473 $1,166 $4 _% $17 1%
Efficiency ratio (non-GAAP) E/C 68.49% 69.88% 69.84% 64.33% 69.43%(139) bps _(94) bps _
Efficiency ratio, excluding restructuring charges and special items (non-GAAP) F/D 67.65% 67.11% 68.02% 70.23% 69.43% 54 bps _(178) bps _
Tangible book value per common share:
Common shares—at end of period (GAAP) M 547,490,812 545,884,519 559,998,324 559,998,324 559,998,324 1,606,293 _ %(12,507,512)(2)%
Stockholders’ equity (GAAP) $19,564 $19,268 $19,383 $19,597 $19,442 $296 2 $122 1
Less: Goodwill (GAAP) 6,876 6,876 6,876 6,876 6,876
Less: Other intangible assets (GAAP) 5 6 6 7 7(1)(17)(2)(29)
Add: Deferred tax liabilities related to goodwill (GAAP) 434 420 399 384 366 14 3 68 19
Tangible common equity (non-GAAP) N $13,117 $12,806 $12,900 $13,098 $12,925 $311 2% $192 1%
Tangible book value per common share (non-GAAP) N/M $23.96 $23.46 $23.04 $23.39 $23.08 $0.50 2% $0.88 4%
29
|
|
NON-GAAP FINANCIAL MEASURES AND RECONCILIATIONS (Excluding restructuring charges and special items) (CONTINUED)
(dollars in millions, except per-share data)
QUARTERLY TRENDS
1Q15 Change
1Q15 4Q14 3Q14 2Q14 1Q14 4Q14 1Q14
$% $%
Net income per average common share—basic and diluted, excluding
restructuring charges and special items:
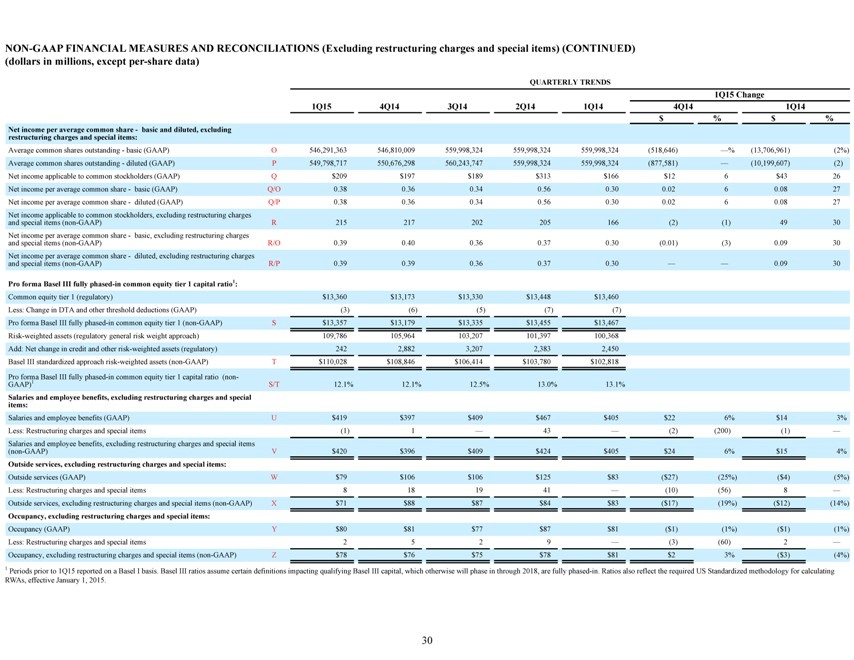
Average common shares outstanding—basic (GAAP) O 546,291,363 546,810,009 559,998,324 559,998,324 559,998,324(518,646) _%(13,706,961)(2%)
Average common shares outstanding—diluted (GAAP) P 549,798,717 550,676,298 560,243,747 559,998,324 559,998,324(877,581) _(10,199,607)(2)
Net income applicable to common stockholders (GAAP) Q $209 $197 $189 $313 $166 $12 6 $43 26
Net income per average common share—basic (GAAP) Q/O 0.38 0.36 0.34 0.56 0.30 0.02 6 0.08 27
Net income per average common share—diluted (GAAP) Q/P 0.38 0.36 0.34 0.56 0.30 0.02 6 0.08 27
Net income applicable to common stockholders, excluding restructuring charges
and special items (non-GAAP) R 215 217 202 205 166(2)(1) 49 30
Net income per average common share—basic, excluding restructuring charges
and special items (non-GAAP) R/O 0.39 0.40 0.36 0.37 0.30(0.01)(3) 0.09 30
Net income per average common share—diluted, excluding restructuring charges
and special items (non-GAAP) R/P 0.39 0.39 0.36 0.37 0.30 0.09 30
Pro forma Basel III fully phased-in common equity tier 1 capital ratio1:
Common equity tier 1 (regulatory) $13,360 $13,173 $13,330 $13,448 $13,460
Less: Change in DTA and other threshold deductions (GAAP)(3)(6)(5)(7)(7)
Pro forma Basel III fully phased-in common equity tier 1 (non-GAAP) S $13,357 $13,179 $13,335 $13,455 $13,467
Risk-weighted assets (regulatory general risk weight approach) 109,786 105,964 103,207 101,397 100,368
Add: Net change in credit and other risk-weighted assets (regulatory) 242 2,882 3,207 2,383 2,450
Basel III standardized approach risk-weighted assets (non-GAAP) T $110,028 $108,846 $106,414 $103,780 $102,818
Pro forma Basel III fully phased-in common equity tier 1 capital ratio (non-
GAAP)1 S/T 12.1% 12.1% 12.5% 13.0% 13.1%
Salaries and employee benefits, excluding restructuring charges and special
items:
Salaries and employee benefits (GAAP) U $419 $397 $409 $467 $405 $22 6% $14 3%
Less: Restructuring charges and special items(1) 1 _ 43 _(2)(200)(1) _
Salaries and employee benefits, excluding restructuring charges and special items
(non-GAAP) V $420 $396 $409 $424 $405 $24 6% $15 4%
Outside services, excluding restructuring charges and special items:
Outside services (GAAP) W $79 $106 $106 $125 $83($27)(25%)($4)(5%)
Less: Restructuring charges and special items 8 18 19 41 _(10)(56) 8 _
Outside services, excluding restructuring charges and special items (non-GAAP) X $71 $88 $87 $84 $83($17)(19%)($12)(14%)
Occupancy, excluding restructuring charges and special items:
Occupancy (GAAP) Y $80 $81 $77 $87 $81($1)(1%)($1)(1%)
Less: Restructuring charges and special items 2 5 2 9 _(3)(60) 2 _
Occupancy, excluding restructuring charges and special items (non-GAAP) Z $78 $76 $75 $78 $81 $2 3%($3)(4%)
1 Periods prior to 1Q15 reported on a Basel I basis. Basel III ratios assume certain definitions impacting qualifying Basel III capital, which otherwise will phase in through 2018, are fully phased-in. Ratios also reflect the required US Standardized methodology for calculating RWAs, effective January 1, 2015.
30
|
|
NON-GAAP FINANCIAL MEASURES AND RECONCILIATIONS (Excluding restructuring charges and special items) (CONTINUED) (dollars in millions, except per-share data)
QUARTERLY TRENDS
1Q15 Change
1Q15 4Q14 3Q14 2Q14 1Q14 4Q14 1Q15
$% $%
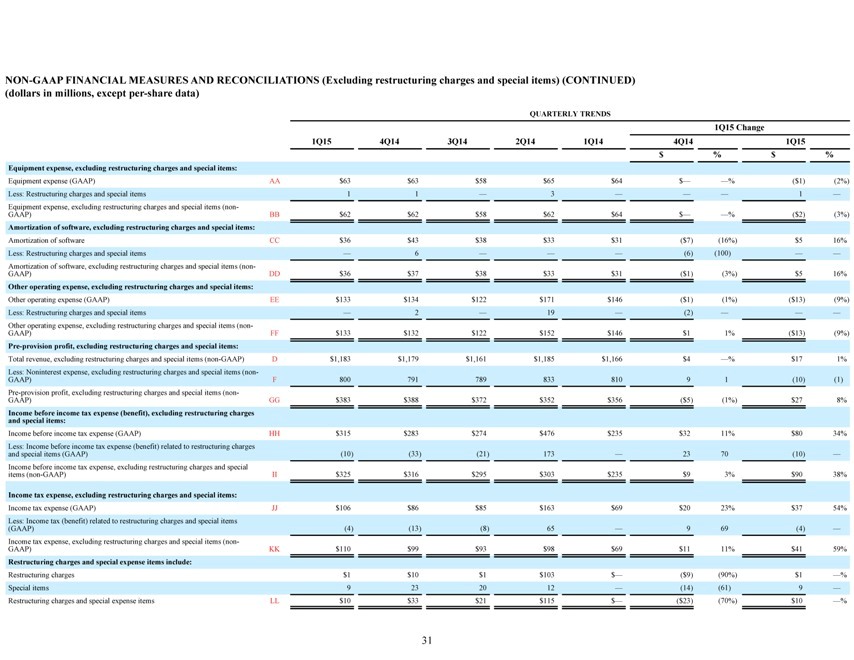
Equipment expense, excluding restructuring charges and special items:
Equipment expense (GAAP) AA $63 $63 $58 $65 $64 $ %($1)(2%)
Less: Restructuring charges and special items 1 1 _ 3 1 _
Equipment expense, excluding restructuring charges and special items (non-
GAAP) BB $62 $62 $58 $62 $64 $ %($2)(3%)
Amortization of software, excluding restructuring charges and special items:
Amortization of software CC $36 $43 $38 $33 $31($7)(16%) $5 16%
Less: Restructuring charges and special items _ 6 (6)(100)
Amortization of software, excluding restructuring charges and special items (non-
GAAP) DD $36 $37 $38 $33 $31($1)(3%) $5 16%
Other operating expense, excluding restructuring charges and special items:
Other operating expense (GAAP) EE $133 $134 $122 $171 $146($1)(1%)($13)(9%)
Less: Restructuring charges and special items _ 2 _ 19 _(2)
Other operating expense, excluding restructuring charges and special items (non-
GAAP) FF $133 $132 $122 $152 $146 $1 1%($13)(9%)
Pre-provision profit, excluding restructuring charges and special items:
Total revenue, excluding restructuring charges and special items (non-GAAP) D $1,183 $1,179 $1,161 $1,185 $1,166 $4 _% $17 1%
Less: Noninterest expense, excluding restructuring charges and special items (non-
GAAP) F 800 791 789 833 810 9 1(10)(1)
Pre-provision profit, excluding restructuring charges and special items (non-
GAAP) GG $383 $388 $372 $352 $356($5)(1%) $27 8%
Income before income tax expense (benefit), excluding restructuring charges
and special items:
Income before income tax expense (GAAP) HH $315 $283 $274 $476 $235 $32 11% $80 34%
Less: Income before income tax expense (benefit) related to restructuring charges
and special items (GAAP)(10)(33)(21) 173 _ 23 70(10) _
Income before income tax expense, excluding restructuring charges and special
items (non-GAAP) II $325 $316 $295 $303 $235 $9 3% $90 38%
Income tax expense, excluding restructuring charges and special items:
Income tax expense (GAAP) JJ $106 $86 $85 $163 $69 $20 23% $37 54%
Less: Income tax (benefit) related to restructuring charges and special items
(GAAP)(4)(13)(8) 65 _ 9 69(4) _
Income tax expense, excluding restructuring charges and special items (non-
GAAP) KK $110 $99 $93 $98 $69 $11 11% $41 59%
Restructuring charges and special expense items include:
Restructuring charges $1 $10 $1 $103 $_($9)(90%) $1 _%
Special items 9 23 20 12 _(14)(61) 9 _
Restructuring charges and special expense items LL $10 $33 $21 $115 $_($23)(70%) $10 _%
31
|
|
NON-GAAP FINANCIAL MEASURES AND RECONCILIATIONS—SEGMENTS
(dollars in millions)
Three Months Ended March 31, Three Months Ended December 31, Three Months Ended September 30,
2015 2014 2014
Consumer Commercial Consumer Commercial Consumer Commercial
Banking Banking Other Consolidated Banking Banking Other Consolidated Banking Banking Other Consolidated
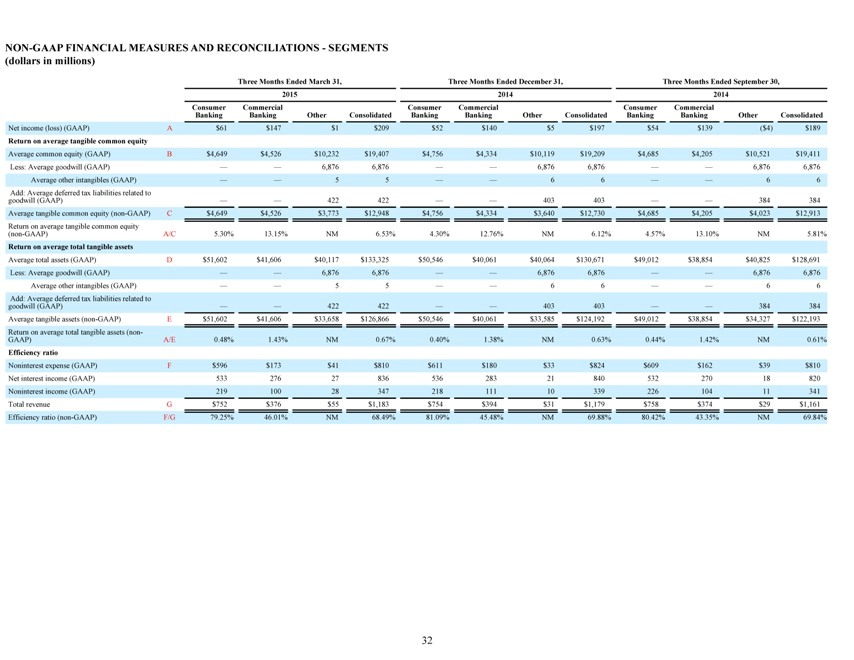
Net income (loss) (GAAP) A $61 $147 $1 $209 $52 $140 $5 $197 $54 $139($4) $189
Return on average tangible common equity
Average common equity (GAAP) B $4,649 $4,526 $10,232 $19,407 $4,756 $4,334 $10,119 $19,209 $4,685 $4,205 $10,521 $19,411
Less: Average goodwill (GAAP) 6,876 6,876 6,876 6,876 6,876 6,876
Average other intangibles (GAAP) 5 5 6 6 6 6
Add: Average deferred tax liabilities related to
goodwill (GAAP) 422 422 403 403 384 384
Average tangible common equity (non-GAAP) C $4,649 $4,526 $3,773 $12,948 $4,756 $4,334 $3,640 $12,730 $4,685 $4,205 $4,023 $12,913
Return on average tangible common equity
(non-GAAP) A/C 5.30% 13.15% NM 6.53% 4.30% 12.76% NM 6.12% 4.57% 13.10% NM 5.81%
Return on average total tangible assets
Average total assets (GAAP) D $51,602 $41,606 $40,117 $133,325 $50,546 $40,061 $40,064 $130,671 $49,012 $38,854 $40,825 $128,691
Less: Average goodwill (GAAP) 6,876 6,876 6,876 6,876 6,876 6,876
Average other intangibles (GAAP) 5 5 6 6 6 6
Add: Average deferred tax liabilities related to
goodwill (GAAP) 422 422 403 403 384 384
Average tangible assets (non-GAAP) E $51,602 $41,606 $33,658 $126,866 $50,546 $40,061 $33,585 $124,192 $49,012 $38,854 $34,327 $122,193
Return on average total tangible assets (non-
GAAP) A/E 0.48% 1.43% NM 0.67% 0.40% 1.38% NM 0.63% 0.44% 1.42% NM 0.61%
Efficiency ratio
Noninterest expense (GAAP) F $596 $173 $41 $810 $611 $180 $33 $824 $609 $162 $39 $810
Net interest income (GAAP) 533 276 27 836 536 283 21 840 532 270 18 820
Noninterest income (GAAP) 219 100 28 347 218 111 10 339 226 104 11 341
Total revenue G $752 $376 $55 $1,183 $754 $394 $31 $1,179 $758 $374 $29 $1,161
Efficiency ratio (non-GAAP) F/G 79.25% 46.01% NM 68.49% 81.09% 45.48% NM 69.88% 80.42% 43.35% NM 69.84%
32
|
|
NON-GAAP FINANCIAL MEASURES AND RECONCILIATIONS—SEGMENTS (CONTINUED)
(dollars in millions)
Three Months Ended June 30, Three Months Ended March 31,
2014 2014
Consumer Commercial Consumer Commercial
Banking Banking Other Consolidated Banking Banking Other Consolidated
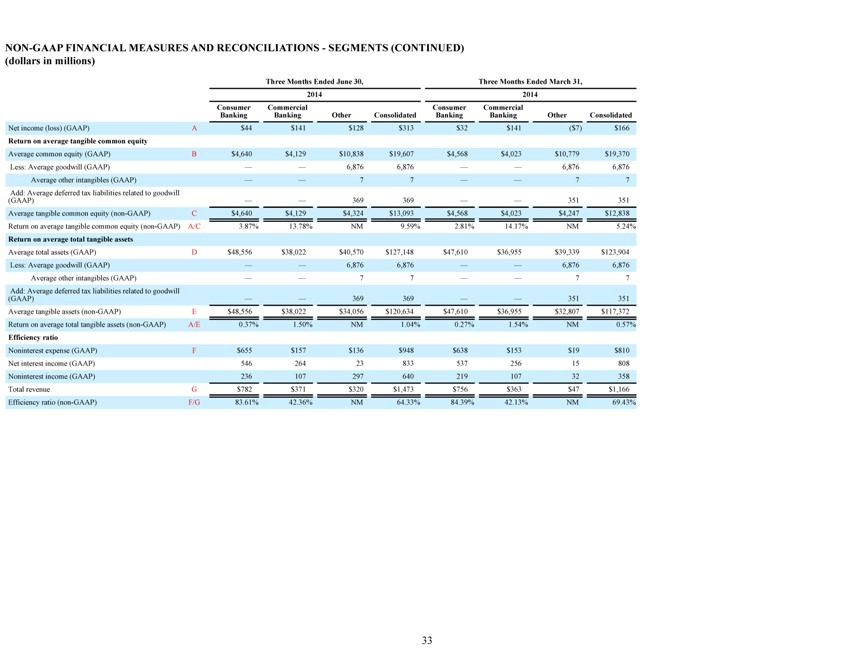
Net income (loss) (GAAP) A $44 $141 $128 $313 $32 $141($7) $166
Return on average tangible common equity
Average common equity (GAAP) B $4,640 $4,129 $10,838 $19,607 $4,568 $4,023 $10,779 $19,370
Less: Average goodwill (GAAP) 6,876 6,876 6,876 6,876
Average other intangibles (GAAP) 7 7 7 7
Add: Average deferred tax liabilities related to goodwill
(GAAP) 369 369 351 351
Average tangible common equity (non-GAAP) C $4,640 $4,129 $4,324 $13,093 $4,568 $4,023 $4,247 $12,838
Return on average tangible common equity (non-GAAP) A/C 3.87% 13.78% NM 9.59% 2.81% 14.17% NM 5.24%
Return on average total tangible assets
Average total assets (GAAP) D $48,556 $38,022 $40,570 $127,148 $47,610 $36,955 $39,339 $123,904
Less: Average goodwill (GAAP) 6,876 6,876 6,876 6,876
Average other intangibles (GAAP) 7 7 7 7
Add: Average deferred tax liabilities related to goodwill
(GAAP) 369 369 351 351
Average tangible assets (non-GAAP) E $48,556 $38,022 $34,056 $120,634 $47,610 $36,955 $32,807 $117,372
Return on average total tangible assets (non-GAAP) A/E 0.37% 1.50% NM 1.04% 0.27% 1.54% NM 0.57%
Efficiency ratio
Noninterest expense (GAAP) F $655 $157 $136 $948 $638 $153 $19 $810
Net interest income (GAAP) 546 264 23 833 537 256 15 808
Noninterest income (GAAP) 236 107 297 640 219 107 32 358
Total revenue G $782 $371 $320 $1,473 $756 $363 $47 $1,166
Efficiency ratio (non-GAAP) F/G 83.61% 42.36% NM 64.33% 84.39% 42.13% NM 69.43%
33
|
|
FORWARD-LOOKING STATEMENTS
This document contains forward-looking statements within the Private Securities Litigation Reform Act of 1995. Any statement that does not describe historical or current facts is a forward-looking statement. These statements often include the words _believes, expects, anticipates, estimates, intends, plans, goals, targets,
initiatives, potentially, probably, projects, outlook_ or similar expressions or future conditional verbs such as _may, will, should, would,_ and _could._
Forward-looking statements are based upon the current beliefs and expectations of management, and on information currently available to management. Our statements speak as of the date hereof, and we do not assume any obligation to update these statements or to update the reasons why actual results could differ from those contained in such statements in light of new information or future events. We caution you, therefore, against relying on any of these forward-looking statements. They are neither statements of historical fact nor guarantees or assurances of future performance. While there is no assurance that any list of risks and uncertainties or risk factors is complete, important factors that could cause actual results to differ materially from those in the forward-looking statements include the following, without limitation:
negative economic conditions that adversely affect the general economy, housing prices, the job market, consumer confidence and spending habits which may affect, among other things, the level of nonperforming assets, charge-offs and provision expense;
the rate of growth in the economy and employment levels, as well as general business and economic conditions;
our ability to implement our strategic plan, including the cost savings and efficiency components, and achieve our indicative performance targets;
our ability to remedy regulatory deficiencies and meet supervisory requirements and expectations;
liabilities resulting from litigation and regulatory investigations;
our capital and liquidity requirements (including under regulatory capital standards, such as the Basel III capital standards) and our ability to generate capital internally or raise capital on favorable terms;
the effect of the current low interest rate environment or changes in interest rates on our net interest income, net interest margin and our mortgage originations, mortgage servicing rights and mortgages held for sale;
changes in interest rates and market liquidity, as well as the magnitude of such changes, which may reduce interest margins, impact funding sources and affect the ability to originate and distribute financial products in the primary and secondary markets;
the effect of changes in the level of checking or savings account deposits on our funding costs and net interest margin;
financial services reform and other current, pending or future legislation or regulation that could have a negative effect on our revenue and businesses, including the Dodd-Frank Act and other legislation and regulation relating to bank products and services;
a failure in or breach of our operational or security systems or infrastructure, or those of our third party vendors or other service providers, including as a result of cyber attacks;
management_s ability to identify and manage these and other risks; and
any failure by us to successfully replicate or replace certain functions, systems and infrastructure provided by The Royal Bank of Scotland Group plc (RBS Group).
In addition to the above factors, we also caution that the amount and timing of any future common stock dividends or share repurchases will depend on our financial condition, earnings, cash needs, regulatory constraints, capital requirements (including requirements of our subsidiaries), and any other factors that our Board of Directors deems relevant in making such a determination. Therefore, there can be no assurance that we will pay any dividends to holders of our common stock, or as to the amount of any such dividends. In addition, the timing and manner of the sale of RBS Group_s remaining ownership of our common stock remains uncertain, and we have no control over the manner in which RBS Group may seek to divest such remaining shares. Any such sale would impact the price of our shares of common stock.
More information about factors that could cause actual results to differ materially from those described in the forward-looking statements can be found under _Risk Factors_ in Part I, Item 1A in our Annual Report on Form 10-K filed with the United States Securities and Exchange Commission on March 3, 2015.
34