Attached files
| file | filename |
|---|---|
| 8-K - Q1-2015 FORM 8K - ManpowerGroup Inc. | form_8k.htm |
| EX-99.1 - PRESS RELEASE DATED APRIL 21, 2015 - ManpowerGroup Inc. | exhibit_99-1.htm |
Exhibit 99.2

ManpowerGroup First Quarter Results April 21, 2015

FORWARD-LOOKING STATEMENT This presentation includes forward-looking statements which are subject to known and unknown risks and uncertainties. Actual results might differ materially from those projected in the forward-looking statements. Additional information concerning factors that could cause actual results to materially differ from those in the forward-looking statements can be found in the Company’s Annual Report on Form 10-K for the period ended December 31, 2013. Forward-looking statements can be identified by forward-looking words such as “expect,” “anticipate,” “intend,” “plan,” “may,” “will,” “believe,” “seek,” “estimate,” and similar expressions. In this presentation, references to road map and journey to 4% are also intended to be forward-looking statements. Please note that ManpowerGroup’s 2013 Annual report is available online at www.manpowergroup.com in the section titled “Investor Relations.” FORWARD-LOOKING STATEMENT This presentation contains statements, including financial projections, that are forward-looking in nature. These statements are based on managements’ current expectations or beliefs, and are subject to known and unknown risks and uncertainties regarding expected future results. Actual results might differ materially from those projected in the forward-looking statements. Additional information concerning factors that could cause actual results to materially differ from those in the forward-looking statements is contained in the ManpowerGroup Inc. Annual Report on Form 10-K dated December 31, 2014, which information is incorporated herein by reference, and such other factors as may be described from time to time in the Company’s SEC filings. Any forward-looking statements in this presentation speak only as of the date hereof. The Company assumes no obligation to update or revise any forward-looking statements. * ManpowerGroup | April 2015

* ManpowerGroup | April 2015 ManpowerGroup 2015 First Quarter Results Q1 Financial Highlights 7% Revenue $4.5B 7% CC Revenue $4.5B 10 bps Gross Margin 16.8% 3% Operating Profit $123M 17% CC Operating Profit $123M 10 bps OP Margin 2.7% 3% EPS $0.83 16% CC EPS $0.83 Throughout this presentation, the difference between reported variances and Constant Currency (CC) variances represents the impact of currency on our financial results. Constant Currency is further explained on our Web site. Consolidated Financial Highlights
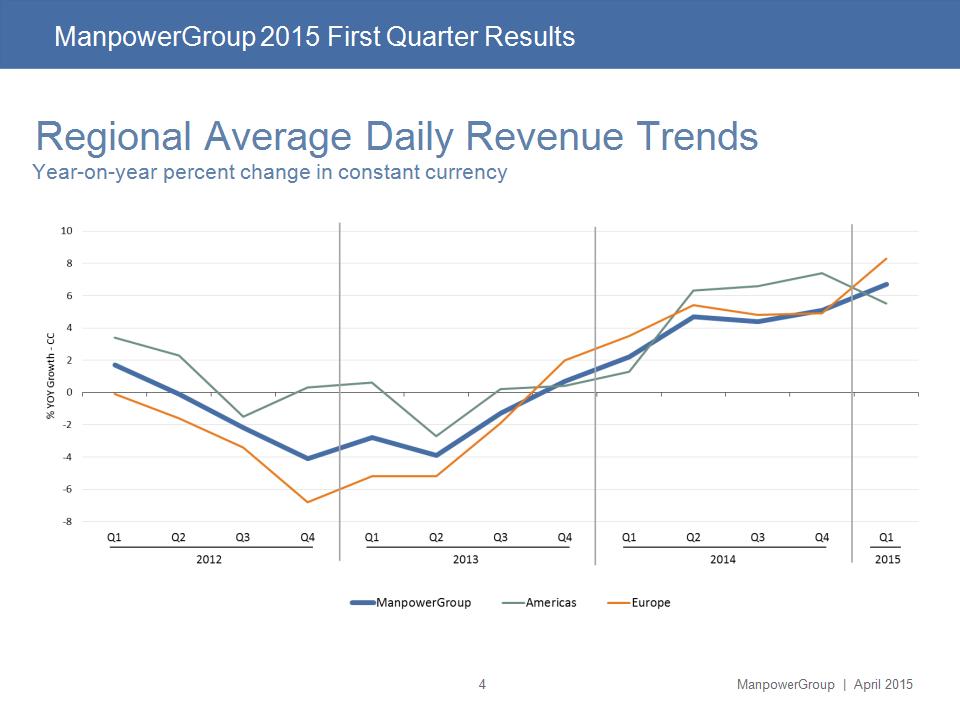
* ManpowerGroup | April 2015 ManpowerGroup 2015 First Quarter Results Regional Average Daily Revenue Trends Year-on-year percent change in constant currency

* ManpowerGroup | April 2015 ManpowerGroup 2015 First Quarter Results EPS Bridge – Q1 vs. Guidance Midpoint

* ManpowerGroup | April 2015 ManpowerGroup 2015 First Quarter Results Consolidated Gross Margin Change

* ManpowerGroup | April 2015 ManpowerGroup 2015 First Quarter Results Growth in CC % Business Line Gross Profit – Q1 2015 █ Manpower █ Experis █ ManpowerGroup - Total █ ManpowerGroup Solutions █ Right Management

* ManpowerGroup | April 2015 ManpowerGroup 2015 First Quarter Results SG&A Expense Bridge – Q1 YoY (in millions of USD) 14.1% % of Revenue 14.1% % of Revenue

* ManpowerGroup | April 2015 ManpowerGroup 2015 First Quarter Results Operating Unit Profit (OUP) is the measure that we use to evaluate segment performance. OUP is equal to segment revenues less direct costs and branch and national headquarters operating costs. Q1 Financial Highlights 1% Revenue $1.1B 6% CC Revenue $1.1B 16% OUP $30M 23% CC OUP $30M 40 bps OUP Margin 2.8% Americas Segment (24% of Revenue)

* ManpowerGroup | April 2015 ManpowerGroup 2015 First Quarter Results Americas – Q1 Revenue Growth YoY Revenue Growth - CC Revenue Growth % of Segment Revenue

* ManpowerGroup | April 2015 ManpowerGroup 2015 First Quarter Results Q1 Financial Highlights 11% Revenue $1.5B 8% CC Revenue $1.5B 1% OUP $69M 24% CC OUP $69M 50 bps OUP Margin 4.5% Southern Europe Segment (34% of Revenue)
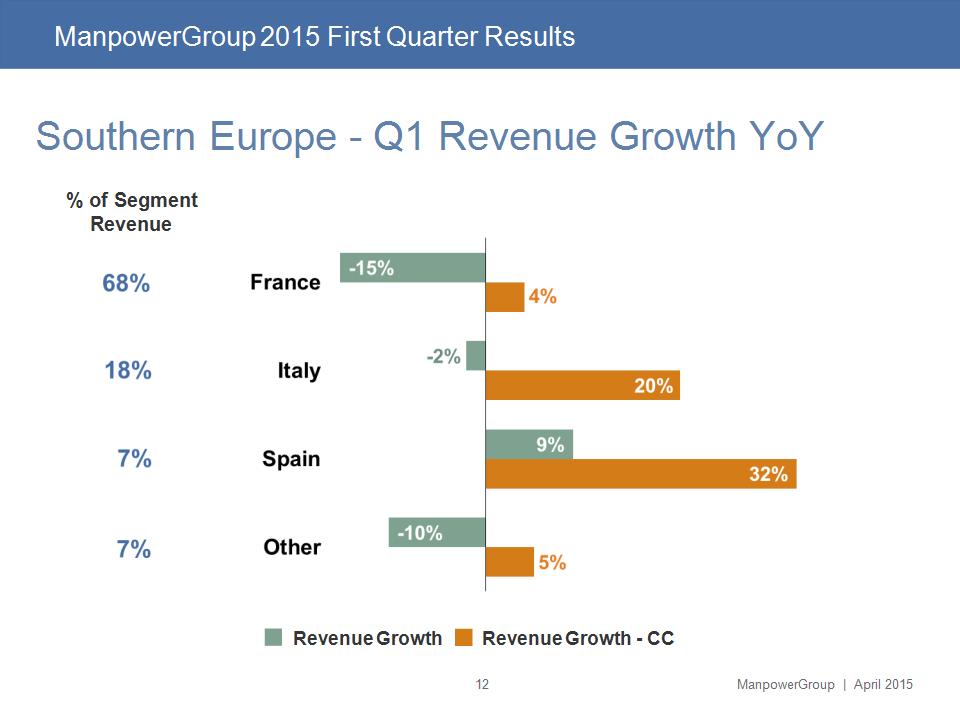
* ManpowerGroup | April 2015 ManpowerGroup 2015 First Quarter Results Southern Europe – Q1 Revenue Growth YoY Revenue Growth - CC Revenue Growth % of Segment Revenue

* ManpowerGroup | April 2015 ManpowerGroup 2015 First Quarter Results Q1 Financial Highlights 10% Revenue $1.3B 8% CC Revenue $1.3B 13% OUP $33M 2% CC OUP $33M 10 bps OUP Margin 2.5% Northern Europe Segment (29% of Revenue)

* ManpowerGroup | April 2015 ManpowerGroup 2015 First Quarter Results Northern Europe – Q1 Revenue Growth YoY Revenue Growth - CC Revenue Growth % of Segment Revenue
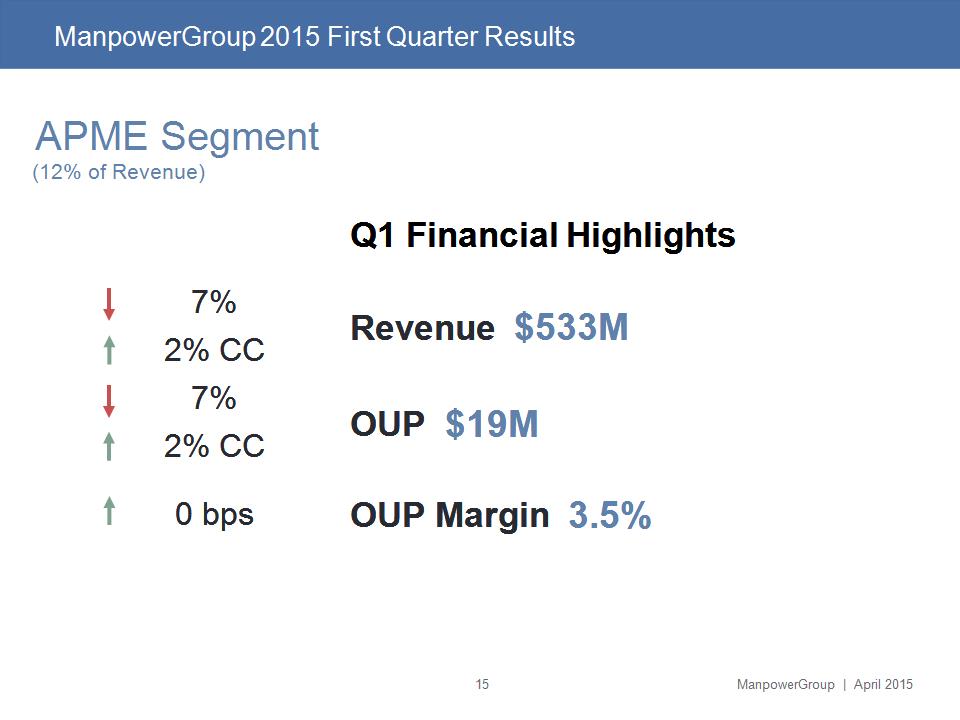
* ManpowerGroup | April 2015 ManpowerGroup 2015 First Quarter Results Q1 Financial Highlights 7% Revenue $533M 2% CC Revenue $533M 7% OUP $19M 2% CC OUP $19M 0 bps OUP Margin 3.5% APME Segment (12% of Revenue)

* ManpowerGroup | April 2015 ManpowerGroup 2015 First Quarter Results APME – Q1 Revenue Growth YoY Revenue Growth - CC Revenue Growth % of Segment Revenue
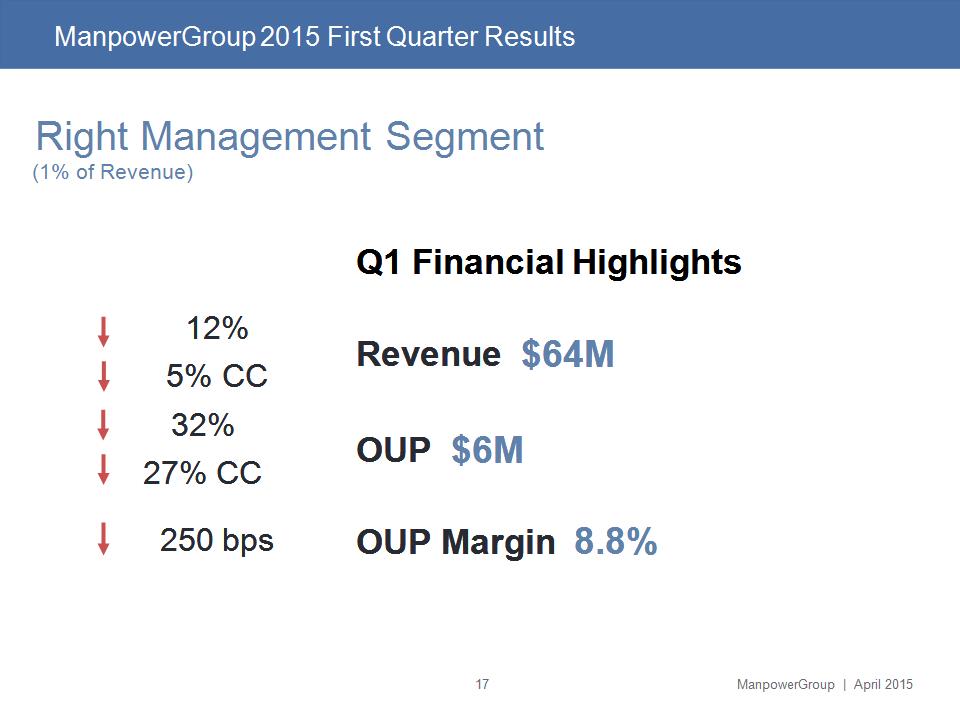
* ManpowerGroup | April 2015 ManpowerGroup 2015 First Quarter Results Right Management Segment (1% of Revenue) Q1 Financial Highlights 12% Revenue $64M 5% CC Revenue $64M 32% OUP $6M 27% CC OUP $6M 250 bps OUP Margin 8.8%
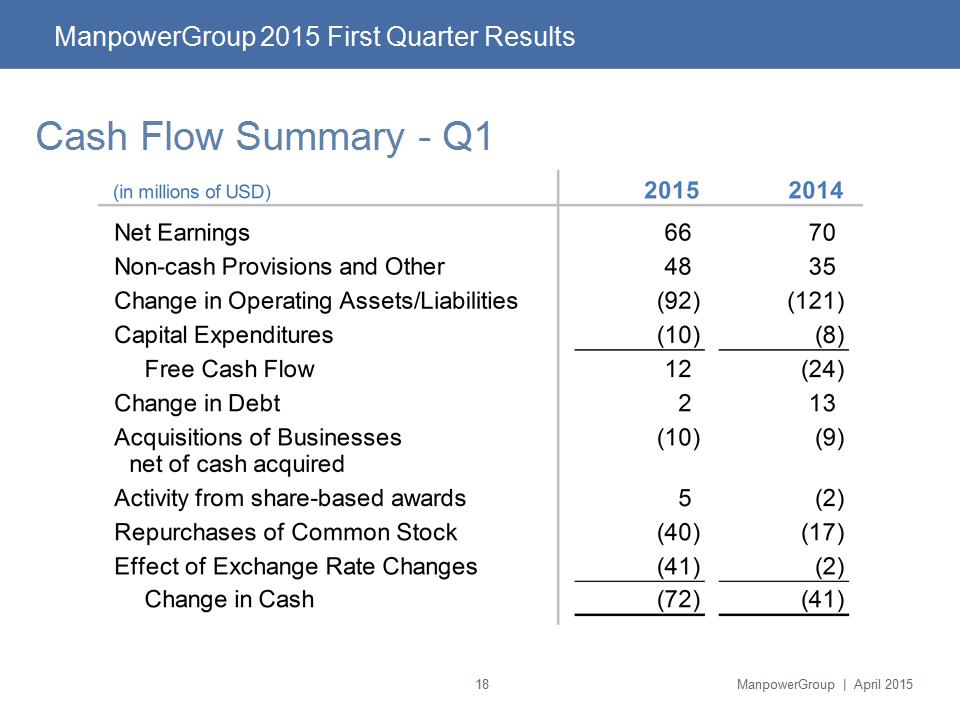
* ManpowerGroup | April 2015 ManpowerGroup 2015 First Quarter Results Cash Flow Summary – Q1

* ManpowerGroup | April 2015 ManpowerGroup 2015 First Quarter Results Balance Sheet Highlights Total Debt (in millions of USD) Total Debt to Total Capitalization Total Debt Net Debt (Cash)

* ManpowerGroup | April 2015 ManpowerGroup 2015 First Quarter Results Interest Rate Maturity Date Total Outstanding Remaining Available Euro Notes - €350M 4.505% Jun 2018 376 - Revolving Credit Agreement 1.25% Oct 2018 - 599 Uncommitted lines and Other Various Various 46 266 Total Debt 422 865 Credit Facilities – March 31, 2015 (in millions of USD) (1) (2) The $600M agreement requires that we comply with a Leverage Ratio (Debt-to-EBITDA) of not greater than 3.5 to 1 and a Fixed Charge Coverage Ratio of not less than 1.5 to 1, in addition to other customary restrictive covenants. As defined in the agreement, we had a Debt-to-EBITDA ratio of 0.24 and a fixed charge coverage ratio of 4.35 as of March 31, 2015. As of March 31, 2015, there were $0.9M of standby letters of credit issued under the agreement. Represents subsidiary uncommitted lines of credit & overdraft facilities, which total $312.1M. Total subsidiary borrowings are limited to $300M due to restrictions in our Revolving Credit Facility, with the exception of Q3 when subsidiary borrowings are limited to $600M.

* ManpowerGroup | April 2015 ManpowerGroup 2015 First Quarter Results Second Quarter Outlook

* ManpowerGroup | April 2015 ManpowerGroup 2015 First Quarter Results Key Take-Aways Strong financial and operational performance with disciplined execution and focus on our strategic initiatives. Currency headwind will impact reported earnings but not our underlying financial performance. First quarter saw early signs of improving European market conditions, although recovery is likely to be slow and somewhat volatile. Demand for services in the U.S. industrial market has moderated consistent with economic indicators. Well positioned for continued success with our strong global brands and unrivalled global footprint. Increasing client demand for our higher-value services and solutions.