Attached files
| file | filename |
|---|---|
| EX-10.6(B) - EXHIBIT 10.6(B) - ManpowerGroup Inc. | a10k2017exhibit106b.htm |
| EX-32.2 - EXHIBIT 32.2 - ManpowerGroup Inc. | a10k2017exhibit322.htm |
| EX-32.1 - EXHIBIT 32.1 - ManpowerGroup Inc. | a10k2017exhibit321.htm |
| EX-31.2 - EXHIBIT 31.2 - ManpowerGroup Inc. | a10k2017exhibit312.htm |
| EX-31.1 - EXHIBIT 31.1 - ManpowerGroup Inc. | a10k2017exhibit311.htm |
| EX-24 - EXHIBIT 24 - ManpowerGroup Inc. | a10k2017exhibit24.htm |
| EX-23.1 - EXHIBIT 23.1 - ManpowerGroup Inc. | a10k2017exhibit231.htm |
| EX-21 - EXHIBIT 21 - ManpowerGroup Inc. | a10k2017exhibit21.htm |
| EX-12.1 - EXHIBIT 12.1 - ManpowerGroup Inc. | a10k2017exhibit121.htm |
| EX-10.6(C) - EXHIBIT 10.6(C) - ManpowerGroup Inc. | a10k2017exhibit106c.htm |
UNITED STATES
SECURITIES AND EXCHANGE COMMISSION
Washington, D.C. 20549
FORM 10-K
x ANNUAL REPORT PURSUANT TO SECTION 13 OR 15(d) OF THE SECURITIES EXCHANGE ACT OF 1934:
For the fiscal year ended December 31, 2017
OR
□ TRANSITION REPORT PURSUANT TO SECTION 13 OR 15(d) OF THE SECURITIES EXCHANGE ACT OF 1934
Commission File No. 1-10686
MANPOWERGROUP INC.
(Exact name of registrant as specified in its charter)
WISCONSIN | 39-1672779 |
(State or other jurisdiction of incorporation or organization) | (I.R.S. Employer Identification No.) |
100 MANPOWER PLACE, MILWAUKEE, WISCONSIN | 53212 |
(Address of principal executive offices) | (Zip Code) |
Registrant’s telephone number, including area code: (414) 961-1000
Securities registered pursuant to Section 12(b) of the Act:
Title of each class | Name of Exchange on which registered |
Common Stock, $.01 par value | New York Stock Exchange |
Securities registered pursuant to Section 12(g) of the Act: None
Indicate by check mark if the registrant is a well-known seasoned issuer, as defined in Rule 405 of the Securities Act. Yes x No □
Indicate by check mark if the registrant is not required to file reports pursuant to Section 13 or Section 15(d) of the Act. Yes □ No x
Indicate by check mark whether the registrant (1) has filed all reports required to be filed by Section 13 or 15(d) of the Securities Exchange Act of 1934 during the preceding 12 months (or for such shorter period that the registrant was required to file such reports), and (2) has been subject to such filing requirements for the past 90 days. Yes x No □
Indicate by check mark whether the registrant has submitted electronically and posted on its corporate website, if any, every Interactive Data File required to be submitted and posted pursuant to Rule 405 of Regulation S-T (Section 232.405 of this chapter) during the preceding 12 months (or for such shorter period that the registrant was required to submit and post such files). Yes x No □
Indicate by check mark if disclosure of delinquent filers pursuant to Item 405 of Regulation S-K is not contained herein, and will not be contained, to the best of registrant’s knowledge, in definitive proxy or information statements incorporated by reference in Part III of this Form 10-K or any amendment to this Form 10-K. x
Indicate by check mark whether the registrant is a large accelerated filer, an accelerated filer, a non-accelerated filer, smaller reporting company, or an emerging growth company. See the definitions of “large accelerated filer,” “accelerated filer,” “smaller reporting company,” and “emerging growth company” in Rule 12b-2 of the Exchange Act.
Large accelerated filer x | Accelerated filer □ | Non-accelerated filer □ |
Smaller reporting company □ | Emerging growth company □ | (Do not check if a smaller reporting company) |
If an emerging growth company, indicate by check mark if the registrant has elected not to use the extended transition period for complying with any new or revised financial accounting standards provided pursuant to Section 13(a) of the Exchange Act.
Indicate by check mark whether the registrant is a shell company (as defined in Rule 12b-2 of the Exchange Act).
Yes □ No □
The aggregate market value of the voting stock held by nonaffiliates of the registrant was $7,447,212,427 as of June 30, 2017. As of February 20, 2018, there were 66,161,457 of the registrant’s shares of common stock outstanding.
DOCUMENTS INCORPORATED BY REFERENCE
Part III is incorporated by reference from the Proxy Statement for the Annual Meeting of Shareholders to be held on May 4, 2018.
ManpowerGroup Inc.
Form 10-K
For the Fiscal Year Ended December 31, 2017
TABLE OF CONTENTS
Page Number | ||
PART I
The terms “we,” “our,” “us,” "ManpowerGroup," or “the Company” refer to ManpowerGroup Inc. and its consolidated subsidiaries.
Item 1. Business
Introduction and History
ManpowerGroup Inc. is a world leader in innovative workforce solutions and services. Through our global network of nearly 2,700 offices in 80 countries and territories, we put millions of people to work a year with our global, multinational and local clients across all major industry segments. Our strong and connected brands provide innovative solutions that drive organizations forward, accelerate individual success and help build more sustainable communities. We power the future of work.
By offering a comprehensive range of workforce solutions and services, we help companies at varying stages in their evolution increase productivity, improve strategy, quality and efficiency, and reduce costs across their workforce to achieve their business goals. ManpowerGroup’s suite of innovative workforce solutions and services includes:
• | Recruitment and Assessment – By leveraging our trusted brands, industry knowledge and expertise, we identify the right talent in the right place to help our clients quickly access the people they need when they need them. Through our industry-leading assessments we help people and organizations understand their strengths and potential, resulting in better job matches, higher retention and a stronger workforce. |
• | Training and Development – Our unique insights into evolving employer needs and our expertise in training and development help us prepare candidates and associates to succeed in today’s competitive marketplace. We offer an extensive portfolio of training courses and leadership development solutions that help clients maximize talent and optimize performance. |
• | Career Management – We help individuals manage their career journey through outplacement services and targeted skills development. By helping individuals and organizations manage workforce transitions and career changes we unleash human potential. |
• | Outsourcing – We provide clients with outsourcing services related to human resources functions primarily in the areas of large-scale recruiting and workforce-intensive initiatives that are outcome-based, thereby sharing in the risk and reward with our clients. |
• | Workforce Consulting – We help clients create and align their workforce strategy to achieve their business strategy, increase business agility and flexibility, and accelerate personal and business success. |
This comprehensive and diverse business mix helps us to partially mitigate the cyclical effects of the economies in which we operate. Our family of brands and offerings includes:
• | Manpower – We are a global leader in contingent staffing and permanent recruitment. We provide businesses with rapid access to a highly qualified and productive pool of candidates to give them the flexibility and agility they need to respond to changing business needs. |
• | Experis – We are a global leader in professional resourcing and project-based solutions. With operations in over 50 countries and territories, we delivered 66 million hours of professional talent in 2017 specializing in Information Technology (IT), Engineering, and Finance. |
• | Right Management – We are global career experts dedicated to helping organizations and individuals become more agile and market-ready. By leveraging our expertise in assessment, development and coaching, we provide tailored solutions that deliver organizational efficiency, individual development, and career mobility, to increase productivity and optimize business performance. |
• | ManpowerGroup Solutions – We are a global leader in outsourcing services for large-scale recruiting. We are the world’s largest Recruitment Process Outsourcing (RPO) and our TAPFIN - Managed Service Provider |
3
(MSP) business is continually ranked as a top global MSP alongside our Talent Based Outsourcing (TBO). Our Proservia brand is a recognized leader within the Digital Services market and IT Infrastructure sector throughout Europe, specializing in infrastructure management and end-user support.
Our leadership position enables us to be a pathway to quality employment opportunities for people at all points in their career paths. Whether it is seasoned professionals, skilled laborers, temporary to permanent, parents returning to work, seniors wanting to supplement pensions, previously unemployed or underemployed youth and disabled individuals ManpowerGroup has been connecting people to meaningful work for 70 years. Similarly, governments in the nations in which we operate look to us to help provide employment opportunities and training to assist the unemployed in gaining the skills they need to enter the workforce. We provide a bridge to experience and employment, and help to build more sustainable communities.
We, and our predecessors, have been in business since 1948 when we were incorporated as a Wisconsin corporation, and have had our shares listed on the New York Stock Exchange since 1967.
Our Internet address is www.manpowergroup.com. We make available free of charge through our website our annual reports on Form 10-K, quarterly reports on Form 10-Q, current reports on Form 8-K, and amendments to those reports filed or furnished pursuant to Section 13(a) of the Securities Exchange Act of 1934 as soon as reasonably practicable after we electronically file such material with, or furnish it to, the Securities and Exchange Commission. In addition, we also make available through our Internet website:
•our amended and restated articles of incorporation and amended and restated bylaws;
•our ManpowerGroup code of business conduct and ethics;
•our corporate governance guidelines;
•our anti-corruption policy;
•the charters of the Audit, Executive Compensation and Human Resources and Nominating and Governance Committees of the Board of Directors;
•our guidelines for selecting board candidates;
•our categorical standards for relationships deemed not to impair independence of non-employee directors;
•independent auditors' services policy;
•executive officer stock ownership guidelines;
•outside director stock ownership guidelines; and
•our regular update on corporate social responsibility.
Documents available on the website are also available in print for any shareholder who requests them. Requests may be made by writing to Richard Buchband, Secretary, ManpowerGroup, 100 Manpower Place, Milwaukee, Wisconsin 53212. We are not including the information contained on or available through our website as a part of, or incorporating such information by reference into, this Annual Report on Form 10-K.
Our Operations
Client demand for workforce solutions and services is dependent on the overall strength of the labor market and secular trends toward greater workforce flexibility within each of the countries and territories in which we operate. Improving economic growth typically results in increasing demand for labor, resulting in greater demand for our staffing services while demand for our outplacement services typically declines. During periods of increased demand, as we saw in 2017, we are generally able to improve our profitability and operating leverage as our cost base can support some increase in business without a similar increase in selling and administrative expenses.
Correspondingly, during periods of weak economic growth or economic contraction, the demand for our staffing services typically declines, while demand for our outplacement services typically accelerates. When demand drops, our operating profit is typically impacted unfavorably as we experience a deleveraging of our selling and administrative expense base as expenses may not decline at the same pace as revenues. In periods of economic contraction, we may have more significant expense deleveraging, as we believe it is prudent not to reduce selling and administrative expenses to levels that could negatively impact the long-term potential of our branch network and brands.
4
The nature of our operations is such that our most significant current asset is accounts receivable, with an average days sales outstanding of between 50 and 60 days based on the markets where we do business. Our most significant current liabilities are payroll related costs, which are generally paid either weekly or monthly. As the demand for our services increases, we generally see an increase in our working capital needs, as we continue to pay our associates on a weekly or monthly basis while the related accounts receivable are outstanding for much longer, which may result in a decline in operating cash flows. Conversely, as the demand for our services declines, we generally see a decrease in our working capital needs, as the existing accounts receivable are collected and not replaced at the same level, resulting in a decline of our accounts receivable balance, with less of an effect on current liabilities due to the shorter cycle time of the payroll related items. This may result in an increase in our operating cash flows; however, any such increase would not be sustainable in the event that an economic downturn continued for an extended period.
Due to our industry’s sensitivity to economic factors, the inherent difficulty in forecasting the direction and strength of the economy and the short-term nature of staffing assignments, it is difficult to forecast future demand for our services with certainty. As a result, we monitor a number of economic indicators, as well as recent business trends, to predict future revenue trends for each of our reportable segments. Based upon these anticipated trends, we determine what level of personnel and office investments are necessary to take full advantage of growth opportunities.
During the last several years, secular trends toward greater workforce flexibility have helped drive demand for our innovative workforce solutions and services around the world. As companies attempt to increase the variability of their cost base, the workforce solutions we provide help them to effectively address the fluctuating demand for their products or services. As the global economy continues to grow and adapt with new technology, we are helping clients manage their workforce transformation and ensure they have the right skills now and in the future. Whether it is through workforce assessments, targeted training or by creating longer-term development paths, we help organizations and candidates future-proof their skills.
Our portfolio of recruitment services includes permanent, temporary and contract recruitment of professionals, as well as administrative and industrial positions. All of these services are provided under our Manpower and Experis brands. We have provided services under our core Manpower brand for almost 70 years with a primary focus on the areas of office, call center and industrial services and solutions. We provide services under our Experis brand, particularly in the areas of IT, Engineering, and Finance, that include high-impact solutions, and accelerate organizations’ growth by attracting, assessing and placing specialized expertise to deliver in-demand talent for mission-critical positions. Our experience and expertise allow us to accurately assess candidates’ workplace potential and technical skills to match them to the needs of our clients. We plan to continue to build our brand and attract the talent our clients need as skills shortages arise or continue.
ManpowerGroup Solutions specializes in the delivery of customized workforce strategies and outcome-based solutions. Through our RPO offering, we manage customized, large-scale recruiting and workforce productivity initiatives for clients through an exclusive outsourcing contract. We can manage a single element or all of a client's permanent recruiting and hiring processes, from job profiling to on-boarding, globally or in a single location. MSP services include overall program management, reporting and tracking, supplier selection and management and order distribution. The MSP and RPO offerings both provide specialty expertise in contingent workforce management and broader administrative functions. TBO and Proservia services also include management of financial and administrative processes, including call center and customer service activities.
Our career management services are counter-cyclical to our staffing services, which helps to offset the impact of an economic downturn on our overall financial results.
Americas
We provide services as Manpower, Experis and ManpowerGroup Solutions through both branch and franchise offices. The Americas segment had 581 branch and 179 franchise offices. In the United States, where we realized 63% of the Americas’ revenue, we had 391 branch and 164 franchise offices as of December 31, 2017, as well as on-site locations at clients with significant permanent, temporary and contract recruitment requirements. In Other Americas, the largest operations of which include Mexico and Argentina, we had 190 branch offices and 15 franchise offices. We provide a number of central support services to our branches and franchises, which enable
5
us to maintain consistent service quality throughout the region regardless of whether an office is a branch or franchise.
Our franchise agreements provide the franchisee with the right to use the Manpower® service mark in a specifically defined exclusive territory. In the United States, franchise fees generally range from 2% to 3% of franchise sales. Our franchise agreements provide that in the event of a proposed sale of a franchise to a third party, we have the right to acquire the franchise at the same price and on the same terms as proposed by the third party. We have exercised this right in the past and may do so in the future if opportunities arise with appropriate prices and terms.
Our Manpower and Experis operations provide a variety of workforce solutions and services, including permanent, temporary and contract recruitment, assessment and selection, and training. During 2017 in this segment, approximately 38% of temporary and contract recruitment revenues were derived from placing industrial staff, 24% from placing office staff, and 38% from placing professional and technical staff. For our United States operations in 2017, approximately 46% of the temporary and contract recruitment revenues were derived from placing industrial staff, 13% from placing office staff, and 41% from placing professional and technical staff.
Our ManpowerGroup Solutions operations provide a variety of outcome-based solutions including RPO, MSP and TBO. We also conduct business in the Americas under our Right Management brand as discussed below.
Southern Europe
We are a leading provider of permanent, temporary and contract recruitment, assessment and selection, training and outsourcing services throughout Europe. The Southern Europe segment had 1,092 branch offices and 49 franchise offices as of December 31, 2017. Our largest operations in this segment are in France (63% of the segment revenue) and Italy (17% of the segment revenue). The franchise offices are in Switzerland, where we own 49% of the franchise.
During 2017 for our Southern Europe operations, approximately 74% of temporary and contract recruitment revenues were derived from placing industrial staff, 14% from placing office staff, and 12% from placing professional and technical staff.
We conduct our operations in France and the surrounding region as a leading workforce solutions and service provider through 528 branch offices under the name of Manpower, Experis, ManpowerGroup Solutions or Proservia, and 135 branch offices under the name Supplay. The employment services market in France calls for a wide range of our services including permanent, temporary and contract recruitment, assessment and selection, and training. The temporary recruitment market is predominantly focused on recruitment for industrial positions. In 2017, we derived approximately 83% of our temporary recruitment revenues in France from the supply of industrial and construction workers, 16% from the supply of office staff, and 1% from the supply of professional and technical staff.
In Italy, we are a leading workforce solutions and services provider. As of December 31, 2017, ManpowerGroup Italy conducted operations through a network of 229 branch offices. It provides a comprehensive suite of workforce solutions and services offered through Manpower, Experis or ManpowerGroup Solutions, including permanent, temporary and contract recruitment, assessment and selection, training and outsourcing. In 2017, approximately 68% of our temporary and contract recruitment revenues in Italy were derived from placing industrial staff, 5% from placing office staff, including contact center staff, and 27% from placing professional and technical staff.
We also conduct business in Southern Europe under our Right Management brand as discussed below.
Northern Europe
Our largest operations in Northern Europe are in the United Kingdom, the Nordics, Germany and the Netherlands, providing a comprehensive suite of workforce solutions and services through Manpower, Experis, and ManpowerGroup Solutions. Collectively, we operate through 510 branch offices in this region.
During 2017 for our Northern Europe operations, approximately 42% of temporary and contract recruitment revenues were derived from placing industrial staff, 24% from placing office staff, and 34% from placing professional and technical staff.
In the United Kingdom, where we have the largest operation in this segment, we are a leading provider of workforce solutions and services. As of December 31, 2017, we conducted operations in the United Kingdom as
6
Manpower, Experis and ManpowerGroup Solutions through a network of 36 branch offices and also provided on-site services to clients who have significant permanent, temporary and contract recruitment requirements. During 2017, approximately 23% of our United Kingdom operation’s temporary recruitment revenues were derived from the supply of industrial staff, 28% from the supply of office staff, and 49% from the supply of professional and technical staff.
We also own Brook Street Bureau PLC, or Brook Street, which operates through a total of 60 branch offices. Its core business is secretarial, office and light industrial recruitment. Brook Street operates as a local network of branches and competes primarily with local or regional independents. Brook Street’s revenues are comprised of temporary and contract placements as well as permanent recruitment.
We also conduct business in Northern Europe under our Right Management brand as discussed below.
APME
We operate through 176 branch offices in the Asia Pacific Middle East (APME) region. The largest of these operations are located in Japan, Australia, Greater China, India and Korea, all of which operate through branch offices. Our APME operations provide a variety of workforce solutions and services offered through Manpower, Experis and ManpowerGroup Solutions, including permanent, temporary and contract recruitment, assessment and selection, training and outsourcing. During 2017, approximately 11% of our APME temporary and contract recruitment revenues were derived from placing industrial staff, 53% from placing office staff, and 36% from placing professional and technical staff.
We also conduct business in APME under our Right Management brand as discussed below.
Right Management
Right Management is a global expert in talent and career management workforce solutions. We design and deliver solutions to align talent strategy with business strategy. Our expertise spans Talent Assessment, Leader Development, Organizational Effectiveness, Employee Engagement, and Workforce Transition and Outplacement. With 81 offices in 50 countries and territories, we partner with companies of all sizes to help grow and engage their talent, increase productivity and optimize business performance.
Competition
We compete in the employment services industry by offering a broad range of services, including permanent, temporary and contract recruitment, project-based workforce solutions, assessment and selection, training, career and talent management, managed service solutions, outsourcing, consulting and professional services.
Our industry is large and fragmented, comprised of thousands of firms employing millions of people and generating billions of United States dollars in annual revenues. In most areas, no single company has a dominant share of the employment services market. In addition to us, the largest publicly owned companies specializing in recruitment services are The Adecco Group and Randstad. We also compete against a variety of regional or specialized companies such as Recruit Holdings, Kelly Services, Robert Half, Kforce, PageGroup, Korn/Ferry International and Alexander Mann. It is a highly competitive industry, reflecting several trends in the global marketplace such as the increasing demand for skilled people, employers’ desire for more flexible working models and consolidation among clients and in the employment services industry itself. We manage these trends by leveraging established strengths, including one of the employment services industry’s most recognized and respected brands; geographic diversification; size and service scope; an innovative product mix; recruiting and assessment expertise; and a strong client base. While staffing is an important aspect of our business, our strategy is focused on providing both the skilled employees our clients need and high-value workforce management, outsourcing and consulting solutions.
Our client mix consists of both small- and medium-size businesses, and large national and multinational client relationships, which comprised approximately 58% of our revenues in 2017. Client relationships with small- and medium-size businesses are based upon a local or regional relationship, and tend to rely less upon longer-term contracts, and the competitors for this business are primarily locally-owned businesses. The large national and multinational clients, on the other hand, will frequently enter into non-exclusive arrangements with several firms,
7
with the ultimate choice among them being left to the local managers. As a result, employment services firms with a large network of offices compete most effectively for this business which generally has agreed-upon pricing or mark-up on services performed.
Legal Regulations
The employment services industry is closely regulated in all of the major markets in which we operate, except the United States and Canada. Employment services firms are generally subject to one or more of the following types of government regulation:
• regulation of the employer/employee relationship between the firm and its temporary and contract employees;
• registration, licensing, record keeping and reporting requirements; and
• substantive limitations on the operations or the use of temporary and contract employees by clients.
In many markets, the existence or absence of collective bargaining agreements with labor organizations has a significant impact on our operations and the ability of clients to use our services. In some markets, labor agreements are structured on an industry-wide, rather than company-by-company, basis. Changes in these collective bargaining agreements have occurred in the past and are expected to occur in the future and may have a material impact on the operations of employment services firms, including us.
In many countries, including the United States and the United Kingdom, workforce solutions and services firms are considered the legal employers of temporary and contract workers. Therefore, laws regulating the employer/employee relationship, such as tax withholding or reporting, social security or retirement, anti-discrimination and workers’ compensation, govern the firm. In other countries, employment services firms, while not the direct legal employer of temporary and contract workers, are still responsible for collecting taxes and social security deductions and transmitting such amounts to the taxing authorities.
In many countries, particularly in continental Europe and Asia, entry into the employment services market is restricted by the requirement to register with, or obtain licenses from, a government agency. In addition, a wide variety of ministerial requirements may be imposed, such as record keeping, written contracts and reporting. The United States and Canada do not presently have any form of national registration or licensing requirement.
In addition to licensing or registration requirements, many countries impose substantive restrictions on the use of temporary and contract workers. Such restrictions include regulations affecting the types of work permitted, the maximum length of assignment, wage levels or reasons for which temporary and contract workers may be employed. In some countries, special taxes, fees or costs are imposed in connection with the use of temporary and contract workers. For example, temporary and contract workers in France are entitled to a 10% allowance for the uncertain duration of employment, which is eliminated if a full-time position is offered to them within three days after assignment termination. In some countries, the contract of employment with temporary and contract employees must differ from the length of assignment.
Our outplacement and consulting services generally are not subjected to governmental regulation in the markets in which we operate.
In the United States, we are subject to various federal and state laws relating to franchising, principally the Federal Trade Commission’s Franchise Rules and analogous state laws which impact our agreements with our franchised operations. These laws and related rules and regulations impose specific disclosure requirements. Virtually all states also regulate the termination of franchises.
Changes in applicable laws or regulations have occurred in the past and are expected in the future to affect the extent to which workforce solutions and services firms may operate. These changes could impose additional costs, taxes, record keeping or reporting requirements; restrict the tasks to which contingent workers may be assigned; limit the duration of or otherwise impose restrictions on the nature of the relationship (with us or the client); or otherwise adversely affect the industry.
Our results in France are affected by complementary health insurance costs, the Credit d’Impôt pour la Compétitivité et l’Emploi ("CICE"), and changes in social charges and our results in Italy are affected by subsidies.
8
In France, the government passed CICE legislation effective January 1, 2013 to improve the competitiveness and reduce employment costs by offering payroll tax credits to most French and foreign enterprises subject to corporate tax in France. This law provides credits based on a percentage of wages paid to employees receiving less than two-and-a-half times the French minimum wage. The payroll tax credit was equal to 4% of eligible wages in 2013, 6% of eligible wages from 2014 to 2016, 7% in 2017 and 6% starting in 2018. We have used, and intend to use, the credit to invest in employment opportunities and to improve our competitiveness, as required by the law. The CICE credit is accounted for as a reduction of our cost of services in the period earned, and has had a favorable impact on our consolidated gross profit margin, as well as margins in France and Southern Europe.
In Germany, the Confederation of German Trade Unions (representing eight German trade unions and over six million people) and the Employer’s Association of the Temporary Staffing Industry (representing two major temporary worker employers’ associations) entered into a Collective Labor Agreement (“CLA”), which was implemented in multiple phases between 2014 and 2017. The first phases of the CLA required higher wages to temporary employees and higher cost for vacation, sick pay, and temporary staff time accounts. The following phase went into effect in June 2016 with a 2.3% to 3.6% wage increase. A new CLA in 2017 required three additional wage increases through 2019, with wage increases of 2.5% to 4.8% in 2017, and required that the wage differences between the East and West be eliminated by 2021. There is also a mandate effective in January 2018 of equal pay for our associates after nine months on assignment, and a limitation effective in September 2018 of the assignment period to 18 months. These changes generally have an unfavorable impact on our gross profit margin in Germany, as we pass on many of these additional costs to the client without a mark-up, and the upcoming limitation of the assignment period may result in a higher associate turnover. To date, there has not been a significant impact on our consolidated or Northern Europe financial results due to these changes in Germany.
Trademarks
We maintain a number of registered trademarks, trade names and service marks in the United States and various other countries. We believe that many of these marks and trade names, including ManpowerGroup®, ManpowerGroup® Solutions, Manpower®, Experis®, Right Management®, Brook Street®, and Proservia® have significant value and are materially important to our business. In addition, we maintain other intangible property rights. The trademarks have been assigned an indefinite life based on our expectation of renewing the trademarks, as required, without material modifications and at a minimal cost, and our expectation of positive cash flows beyond the foreseeable future.
Employees
We had approximately 29,000 full-time equivalent employees as of December 31, 2017. In addition, we recruit millions of permanent, temporary and contract workers on a worldwide basis each year on behalf of our clients.
As described above, in most jurisdictions, we, as the employer of our temporary and contract workers or as otherwise required by applicable law, are responsible for employment administration. This administration includes collection of withholding taxes, employer contributions for social security or its equivalent outside the United States, unemployment tax, workers’ compensation and fidelity and liability insurance, and other governmental requirements imposed on employers. In most jurisdictions where such benefits are not legally required, including the United States, we provide health and life insurance, paid holidays and paid vacations to qualifying temporary and contract employees.
Financial Information about Foreign and Domestic Operations
Note 14 to our consolidated financial statements sets forth the information required for each segment and geographical area for the years ended December 31, 2017, 2016 and 2015. Such note is found in Item 8. "Financial Statements and Supplementary Data."
9
Item 1A. Risk Factors
FORWARD-LOOKING STATEMENTS
Statements made in this report that are not statements of historical fact are forward-looking statements. In addition, from time to time, we and our representatives may make statements that are forward-looking. All forward-looking statements involve risks and uncertainties. This section provides you with cautionary statements identifying, for purposes of the safe harbor provisions of the Private Securities Litigation Reform Act of 1995, important factors that could cause our actual results to differ materially from those contained in forward-looking statements made in this report or otherwise made by us or on our behalf. You can identify these forward-looking statements by forward-looking words such as “expect”, “anticipate”, “intend”, “plan”, “may”, “will”, “believe”, “seek”, “estimate”, and similar expressions. You are cautioned not to place undue reliance on these forward-looking statements. We caution that any forward-looking statement reflects only our belief at the time the statement is made. We undertake no obligation to update any forward-looking statements to reflect subsequent events or circumstances.
The following are some of the factors that could cause actual results to differ materially from estimates contained in our forward-looking statements:
• | volatile or uncertain economic conditions; |
• | any economic recovery may be short-lived and uneven, and may not result in increased demand for our services; |
• | inability to timely respond to the needs of our clients; |
• | competition in the worldwide employment services industry limiting our ability to maintain or increase market share or profitability; |
• | inability to effectively implement our business strategy or achieve our objectives; |
• | cyberattack or improper disclosure or loss of sensitive or confidential company, employee, associate or client data, including personal data; |
• | disruption and increased costs from outsourcing various aspects of our business; |
• | foreign currency fluctuations; |
• | a loss or reduction in revenues from one or more large clients; |
• | challenges meeting contractual obligations if we or third parties fail to deliver on performance commitments; |
• | failure to keep pace with technological change and marketplace demand in the development and implementation of our services and solutions; |
• | failure to implement strategic technology investments; |
• | loss of key personnel; |
• | competition in labor markets limiting our ability to attract, train and retain the personnel necessary to meet our clients’ staffing needs; |
• | political unrest, natural disasters, health crises, infrastructure disruptions, and other risks beyond our control; |
• | failure to comply with the legal regulations in places we do business or the regulatory prohibition or restriction of employment services or the imposition of additional licensing or tax requirements; |
• | failure to comply with anti-corruption and bribery laws; |
• | employment-related legal claims from clients or third parties; |
• | liability resulting from competition law; |
• | our ability to preserve our reputation in the marketplace; |
• | changes in client attitudes toward the use of our services; |
• | inability to maintain effective internal controls; |
• | costs or disruptions resulting from acquisitions we complete; |
• | limited ability to protect our thought leadership and other intellectual property; |
• | material adverse effects on our operating flexibility resulting from our debt levels; |
10
• | failure to comply with restrictive covenants under our revolving credit facilities and other debt instruments; |
• | inability to obtain credit on terms acceptable to us or at all; |
• | the performance of our subsidiaries and their ability to distribute cash to our parent company, ManpowerGroup, may vary; |
• | inability to secure guarantees or letters of credit on acceptable terms; |
• | changes in tax legislation; |
• | fluctuation of our stock price; |
• | provisions under Wisconsin law and our articles of incorporation and bylaws could make the takeover of our Company more difficult; |
• | the risk factors disclosed below; and |
• | other factors that may be disclosed from time to time in our SEC filings or otherwise. |
Some or all of these factors may be beyond our control. We caution you that any forward-looking statement reflects only our belief at the time the statement is made. We undertake no obligation to update any forward-looking statement to reflect events or circumstances after the date on which the statement is made.
RISK FACTORS
In addition to the other information set forth in this report, you should carefully consider the following factors which could materially adversely affect our business, financial condition, results of operations (including revenues and profitability) or stock price. Our business is also subject to general risks and uncertainties that may broadly affect companies. Additional risks and uncertainties not currently known to us or that we currently deem to be immaterial also could materially adversely affect our business, financial condition, results of operations or stock price.
Our results of operations could be materially adversely affected by volatile or uncertain economic conditions.
Our business is affected by global macroeconomic conditions, which at various times have included considerable uncertainty and volatility. In particular, we have experienced periods during which economic conditions have been unstable and difficult to predict globally, and during which many regions experienced volatile growth patterns. Even though many parts of the global economy are currently experiencing a period of synchronized growth and low volatility, there is a risk that conditions will change, and that the economic climate in the future will become more volatile, more uncertain, and difficult to predict. This could have a material adverse effect on our business and operating results.
Economic conditions in the countries where we do business may be affected by recent or emerging events, such as the rise of populism, changes in the ruling party or governmental leadership, protectionism or changes in global trade policies, the global refugee crisis, changes in immigration policy, changes in employment policy, rising interest rates, the impact of terrorist activity, or by other political or economic developments. We are particularly susceptible to changes in economic conditions in Europe, which represents two of our operating segments and approximately 67% of our revenue. During 2017, the various economies in Europe continued to experience slow growth, and there is a risk that some or many of the European economies may continue to be hampered by events which emerged in the past few years, including the United Kingdom referendum to exit the European Union. Similarly, a slowdown or other changes in economic conditions in regions outside Europe, including in emerging markets, could have an economic effect at the regional or global level. Any of these events or trends could have a material adverse effect on our business and operating results.
There is a risk that even when overall global economic conditions are positive, we could experience declines in all, or in portions, of our business. During past periods of recovery, we have experienced inconsistent results, with some geographical regions, or countries within a region, suffering declines or weakness in economic activity while others improve. Differing economic conditions and patterns of economic growth or contraction may affect demand for our solutions and services, and there is a risk that, even during times of strengthening global economic conditions, we may not experience uniform, or any, increases in demand for our solutions and services within the markets where our business is concentrated.
11
Even without uncertainty and volatility, it is difficult for us to forecast future demand for our services due to the inherent difficulty in forecasting the direction and strength of economic cycles, and the short-term nature of many of our staffing assignments. This situation can be exacerbated by uncertain and volatile economic conditions, which may cause clients to reduce or defer projects for which they utilize our services, thereby negatively affecting demand for them. When it is difficult for us to accurately forecast future demand, we may not be able to determine the optimal level of personnel and office investments necessary to profitably operate our business or take advantage of growth opportunities.
Furthermore, our profitability is sensitive to decreases in demand. When demand drops or remains low, our operating profit is typically impacted unfavorably as we experience a deleveraging of our selling and administrative expense base as expenses may not decline as quickly as revenues. In periods of decline, we may not be able to reduce selling and administrative expenses without negatively impacting the long-term potential of our branch network and brands. Additionally, during periods of decline or uncertainty, companies may slow the rate at which they pay their vendors, or they may become unable to pay their obligations. If our clients become unable to pay amounts owed to us, or pay us more slowly, then our cash flow and profitability may suffer.
We may lack the speed and agility to respond to the needs of our clients.
There is a risk we may not be able to respond with sufficient speed and agility to the needs of our clients, which may change rapidly as their businesses evolve. The size and breadth of our organization, comprising approximately 29,000 employees based out of nearly 2,700 offices in 80 countries and territories, may make it difficult for us to effectively manage our resources and provide coordinated solutions to our clients who require our services in multiple locations. For example, client demands for uniform service across borders may be difficult to satisfy because of variation in local laws and customs. We see a trend in more multi-country and enterprise-level relationships and we may have difficulty in profitably managing and delivering projects involving multiple countries. Also, our size and organizational structure may make it difficult to develop and implement new processes and tools across the enterprise in a consistent manner. If we are not effective at meeting the needs of our current and prospective clients, or our competitors are more agile or effective at doing so, our business and financial results could be materially adversely affected.
The worldwide employment services industry is highly competitive with limited barriers to entry, which could limit our ability to maintain or increase our market share or profitability.
The worldwide employment services industry is highly competitive with limited barriers to entry, and in recent years has undergone significant consolidation. We compete in markets throughout the world with full-service and specialized employment services agencies. Several of our global competitors, including The Adecco Group and Randstad, have very substantial marketing and financial resources, and may be better positioned in certain markets. Portions of our industry may become increasingly commoditized, with the result that competition in key areas could become more focused on pricing. We expect that we will continue to experience pressure on price from competitors and clients. There is a risk that we will not compete effectively, including on price, which could limit our ability to maintain or increase our market share and could materially adversely affect our financial results. This may worsen as clients increasingly take advantage of low-cost alternatives including using their own in-house resources rather than engaging a third party.
We may be unable to effectively implement our business strategy, and there can be no assurance that we will achieve our objectives.
Our business strategy focuses on growing revenues while improving our operating profits. An important element of our strategy is our effort to diversify our revenues beyond our core staffing and employment services through the sale of innovative workforce solutions designed to achieve higher operating margins. These workforce solutions are often unique, non-repeatable and tailored to a client’s needs, and present costs, risks and complexity that may be difficult to calculate. These solutions may be unprofitable if we are not able to accurately anticipate these costs and risks in our pricing for these solutions. For example, we may fail to structure and price our solutions in a manner that properly compensates us to create an adequate delivery model, to adequately manage new solutions, or to obtain adequate insurance coverage in amount or scope to cover potential risks arising from such solutions.
Our business strategy also includes continuing efforts to transform how we use personnel and technology to enhance our delivery of services. Our goal is to become a more agile and effective competitor, to reduce the cost of
12
operating our business and to increase our operating profit and operating profit margin. These efforts to transform how we do business may not be successful, and we may not succeed at reducing our operating costs or preventing the return of any costs that are eliminated. Additionally, reductions in personnel and other changes could materially adversely affect our ability to effectively operate our business. If, for these or other reasons, we are not successful in implementing our business strategy or achieving the anticipated results, our business, financial condition and results of operations could be materially adversely affected.
We could incur liabilities or our reputation could be damaged from a cyberattack or improper disclosure or loss of sensitive or confidential company, employee, associate, candidate or client data, including personal data.
In connection with the operation of our business, we store, process and transmit a large amount of data, including personnel and payment information, about our employees, clients, associates and candidates, a portion of which is confidential and/or personally identifiable and sensitive. We expect our use of data to increase, including through the use of analytics. In engaging in these activities, we rely on our own technology and systems, and those of third party vendors we use for a variety of processes, including cloud-based technology and systems, mobile technologies and social media. Unauthorized disclosure or loss of sensitive or confidential data may occur through a variety of methods. These include, but are not limited to, systems failure, employee negligence, fraud or misappropriation, or unauthorized access to or through our information systems, whether by our employees, vendors or third parties, including a cyberattack by hackers, members of organized crime and/or state-sponsored organizations, who may develop and deploy social engineering attacks, viruses, ransomware, worms or other malicious software programs.
Such disclosure, system failure, loss or security breach could harm our reputation and subject us to significant monetary damages or losses, litigation, negative publicity, regulatory enforcement actions, fines, criminal prosecution, as well as liability under our contracts and laws that protect personally identifiable and confidential information, resulting in increased costs or loss of revenues. More sophisticated and frequent cybersecurity threats are occurring, thereby increasing the difficulty of detecting and defending against them. In the past, we have experienced data security breaches resulting from unauthorized access to our systems and other fraudulent activities, such as social engineering, which to date have not had a material impact on our operations or financial results; however, there is no assurance that such impacts will not be material in the future.
It is possible that security controls over personally identifiable and confidential information and other practices we and our third party vendors use may not prevent the improper access to disclosure of, or loss of such information, or fraudulent activity. The potential risk of security breaches, fraud and cyberattacks may increase as we continue to introduce services and offerings, such as mobile applications. Additional services and offerings by us inevitably increase the opportunity for a cyberattack. Further, data privacy and security is subject to frequently changing rules and regulations, such as the European Union General Data Protection Regulation effective May 25, 2018, which are increasing in number, complexity, burden and potential financial penalties, and which often conflict among the various jurisdictions and countries in which we provide services.
Any failure or perceived failure to successfully manage the collection, use, disclosure, transfer, destruction or security of personal information or other privacy and security related matters, or any failure to comply with changing regulatory requirements in this area, or any failure to mitigate other cyberattacks or material vulnerabilities, could result in legal liability or impairment to our reputation in the marketplace. The continued growth of material vulnerabilities in various systems and components, along with the uncertainty concerning patches to those material vulnerabilities and the emergence of malware tied to those material vulnerabilities, may also have a detrimental effect on our cybersecurity posture and the ability to thwart a cyberattack. In addition, our liability insurance might not be sufficient in scope or amount to cover us against claims related to security breaches, social engineering, cyberattacks and other related data disclosure, loss or breach.
We have outsourced aspects of our business, which could result in disruption and increased costs.
We have outsourced important aspects of our business to third party vendors, which subjects us to risks that include increased costs and potential disruptions to our business operations. For example, we rely on third parties to host, manage and secure certain aspects of our data center information and technology infrastructure, to develop and maintain new technology for attracting, onboarding, managing, and analyzing our workforce, and to
13
provide certain back office support. Accordingly, we are subject to the risks associated with our vendors’ abilities to provide these services to meet our needs. Additionally, we replace these vendors from time to time, and there is a risk that we might suffer interruptions in service as we transition from one third party provider to another. Our operations depend significantly upon these vendors’ and our ability to protect our data and to make our servers, software applications and websites available. Despite our and our third party vendors’ implementation of security measures, our systems are vulnerable to damages from computer viruses, natural disasters, unauthorized access, cyberattack and other similar disruptions. Any system failure, accident or security breach could result in disruptions to our operations. A material network breach in the security of our technology systems could include the theft of confidential client information, personal information of our employees or associates, human resources information or other confidential matter. If the cost of our outsourced services is more than expected, or if there is a disruption or security breach of our outsourced services that results in a loss or damage to our data, in a deficiency of our internal operations or controls, or in an inappropriate disclosure of confidential, proprietary or customer information, or if our ability to deliver our services is interrupted, then our business and financial results could be materially adversely affected.
Foreign currency fluctuations may have a material adverse effect on our operating results.
Although we report our results of operations in United States dollars, the majority of our revenues and expenses are denominated in currencies other than the United States dollar, and unfavorable fluctuations in foreign currency exchange rates could have a material adverse effect on our reported financial results.
During 2017, approximately 87% of our revenues were generated outside of the United States, the majority of which were generated in Europe. Furthermore, $947.5 million of our outstanding indebtedness as of December 31, 2017 was denominated in foreign currencies. Increases or decreases in the value of the United States dollar against other major currencies, or the imposition of limitations on conversion of foreign currencies into United States dollars, could affect our revenues, operating profit and the value of balance sheet items denominated in foreign currencies. Our exposure to foreign currencies, in particular the Euro, could have a material adverse effect on our business, financial condition, cash flow and results of operations. Furthermore, the volatility of currencies may make year-over-year comparability of our financial results difficult.
A loss or reduction in revenues from large client accounts could have a material adverse effect on our business.
Our client mix consists of both small- and medium-size businesses, which are based upon a local or regional relationship with our presence in each market, and large national and multinational client relationships, which comprised approximately 58% of our revenues in 2017. These large national and multinational clients will frequently enter into non-exclusive arrangements with several firms, and the client is generally able to terminate our contracts on short notice without penalty. The deterioration of the financial condition or business prospects of one or more large national and/or multinational clients, or a change in their strategy around the use of our services, could reduce their need for our services and result in a significant decrease in the revenues and earnings we derive from them. A loss or reduction in revenues from our large national and multinational clients could have a material adverse effect on our business.
Our performance on contracts may be materially adversely affected if we or third parties fail to deliver on commitments.
Our contracts are increasingly complex and, in most instances, require that we partner with other parties to provide the workforce solutions required by our clients. Our ability to deliver these solutions and provide the services required by our clients is dependent on our and our partners' ability to meet our clients' delivery requirements and schedules. If we or our partners fail to deliver services on time and in accordance with contractual performance obligations, then our ability to successfully complete our contracts may be affected, which may have a material and adverse impact on our client relations, revenues and profitability.
Our results of operations and ability to grow could be materially negatively affected if we cannot successfully keep pace with technological changes in the development and implementation of our services and solutions.
Our success depends on our ability to keep pace with rapid technological changes in the development and implementation of our services and solutions. For example, rapid changes in the use of artificial intelligence and
14
robotics are having a significant impact on some of the industries we serve, and could have significant and unforeseen consequences for the workforce services industry and for our business.
Additionally, our business is reliant on a variety of technologies, including those which support applicant on-boarding and tracking systems, order management, billing, payroll, and client data analytics. There is a risk we will not sufficiently invest in technology or industry developments, or evolve our business with the right strategic investments, or at sufficient speed and scale, to adapt to changes in our marketplace. Similarly, from time to time we make strategic commitments to particular technologies to recruit, manage or analyze our workforce or support our business, and there is a risk they will be unsuccessful. These and similar risks could have a negative effect on our services and solutions, our results of operations, and our ability to develop and maintain a competitive advantage in the marketplace.
If we lose our key personnel, then our business may suffer.
Our operations are dependent on the continued efforts of our officers and executive management and the performance and productivity of headquarters management and staff, our local managers and field personnel. Our ability to attract and retain business is significantly affected by local relationships and the quality of service rendered. If we were to lose key personnel who have acquired significant experience in managing our business or managing companies on a global basis, it could have a significant impact on our operations. Additionally, some of our important client relationships may be dependent on the continued performance of individual managers or field personnel, and there is a risk that loss of those individuals could jeopardize key client relationships. From time to time, we have made reductions to our workforce at the staff and officer level, in both our headquarters and throughout our country operations. There is a risk that these and any future reductions in personnel could materially adversely affect operational performance, and therefore our business and financial results. In addition, it is part of our strategy to maintain a lean corporate structure and small executive team in order to manage our operating margins. There is a risk that we will not have developed sufficient executive talent internally to address any key leadership vacancies that might arise.
Intense competition may limit our ability to attract, train and retain the qualified personnel necessary for us to meet our clients’ staffing needs.
Our business depends on our ability to attract and retain qualified associates who possess the skills and experience necessary to meet the requirements of our clients. We must continually evaluate and upgrade our base of available qualified personnel through recruiting and training programs to keep pace with changing client needs and emerging technologies. Competition for individuals with proven professional skills is intense, and we expect demand for such individuals to remain very strong for the foreseeable future. Qualified personnel may not be available to us in sufficient numbers and on terms of employment acceptable to us. Furthermore, in many markets, we have been experiencing an unusually tight labor market, with historically low levels of unemployment, and there is a risk that we may be unable to meet our clients' requirements in identifying an adequate number of associates. Additionally, our clients may look to us for assistance in identifying and integrating into their organizations workers from diverse backgrounds, and who may represent different generations, geographical regions, and skillsets. These needs may change due to business requirements, or in response to geopolitical and societal trends. There is a risk that we may not be able to identify workers with the required attributes, or that our training programs may not succeed in developing effective or adequate skills. If we fail to recruit, train and retain qualified associates who meet the needs of our clients, our reputation, business and financial results could be materially adversely affected.
Our global operations subject us to certain risks beyond our control.
With operations in 80 countries and territories around the world, we are subject to numerous risks outside of our control, including risks arising from political unrest and other political events, regional and international hostilities and international responses to these hostilities, strikes and other worker unrest, natural disasters, acts of war, terrorism, international conflict, severe weather conditions, pandemics and other global health emergencies, disruptions of infrastructure and utilities, cyberattacks, and other events beyond our control. Although it is not possible to predict such events or their consequences, these events could materially adversely affect our reputation, business and financial results.
15
Government regulations may result in prohibition or restriction of certain types of employment services or the imposition of additional licensing or tax requirements that may reduce our future earnings.
In many jurisdictions in which we operate, such as France and Germany, the employment services industry is heavily regulated. For example, governmental regulations in Germany restrict the length of contracts and the industries in which our associates may be used. In some countries, special taxes, fees or costs are imposed in connection with the use of our associates. Additionally, in some countries, trade unions have used the political process to target our industry, in an effort to increase the regulatory burden and expense associated with offering or utilizing contingent workforce solutions.
The countries in which we operate may, among other things:
• | create additional regulations that prohibit or restrict the types of employment services that we currently provide; |
• | require new or additional benefits be paid to our associates; |
• | require us to obtain additional licensing to provide employment services; or |
• | increase taxes, such as sales or value-added taxes. |
Any future regulations may have a material adverse effect on our business and financial results because they may make it more difficult or expensive for us to continue to provide employment services, particularly if we cannot pass along increases in costs to our clients.
Failure to comply with antibribery and corruption laws could materially adversely affect our business.
We are additionally subject to numerous legal and regulatory requirements that prohibit bribery and corrupt acts. These include the Foreign Corrupt Practices Act and the UK Bribery Act 2010, as well as similar legislation in many of the countries in which we operate. Our employees (but not our associates) are required to participate in a global anticorruption compliance training program designed to ensure compliance with these laws and regulations. However, there are no assurances this program will be effective. In many countries where we operate, practices in the local business community may not conform to international business standards and could violate anticorruption law or regulations. Furthermore, we remain subject to the risk that one of our employees (or one of our associates on a temporary or contract-based assignment) could engage in business practices that are prohibited by our policies and these laws and regulations. Any such violations could materially adversely affect our business.
We may be exposed to employment-related claims and costs from clients or third parties that could materially adversely affect our business, financial condition and results of operations.
We are in the business of employing people and placing them in the workplaces of other businesses. Risks relating to these activities include:
• | claims by our associates of discrimination or harassment directed at them, including claims relating to actions of our clients; |
• | claims by our associates of wrongful termination or retaliation; |
• | claims arising out of the actions or inactions of our associates, including matters for which we may have indemnified a client; |
• | claims arising from violations of employment rights related to employment screening or privacy issues; |
• | claims related to classification of workers as employees or independent contractors; |
• | claims related to the employment of undocumented or illegal workers; |
• | payment of workers’ compensation claims and other similar claims; |
• | violations of employee pay and benefits requirements such as violations of wage and hour requirements; |
• | entitlement to employee benefits, including healthcare coverage; |
• | errors and omissions of our associates and other individuals working on our behalf in performing their jobs, such as accountants, IT professionals, engineers and other technical workers; and |
16
• | claims by our clients relating to our associates’ misuse of clients’ proprietary information, misappropriation of funds, other criminal activity or torts or other similar claims. |
We may incur fines and other losses or negative publicity with respect to these problems. In addition, some or all of these claims may give rise to litigation, which could be time-consuming to our management team and costly and could have a negative impact on our business. In the past several years, we devoted considerable time and expense to resolve several California-based “wage and hour” claims that asserted deficiencies in our payroll practices, and we cannot be certain we will not experience similar claims in the future.
We cannot be certain our insurance will be sufficient in amount or scope to cover all claims that may be asserted against us. Should the ultimate judgments or settlements exceed our insurance coverage, they could have a material effect on our results of operations, financial position and cash flows. We cannot be certain we will be able to obtain appropriate types or levels of insurance in the future, that adequate replacement policies will be available on acceptable terms, if at all, or that the companies from which we have obtained insurance will be able to pay claims we make under such policies.
Our business exposes us to competition law risk.
We are subject to antitrust and competition law in the United States, the European Union, and many other regions in which we operate. Some of our business models may carry a heightened risk of regulatory inquiry under relevant competition laws. Although we have put in place safeguards designed to maintain compliance with applicable competition laws, there can be no assurance these protections will be adequate, and there is a risk that we will be subject to regulatory investigation by relevant authorities. For example, in 2009, we were fined by the French Competition Council following a 2004 investigation, and in 2013 we were informed that the French competition authority had commenced an investigation, which remains ongoing, into us and a number of our competitors in France.
There is no assurance we will successfully defend against such regulatory inquiries, and they may consume substantial amounts of our financial and managerial resources, and result in adverse publicity, even if successfully resolved. An unfavorable outcome with respect to these matters and any future matters could, individually or in the aggregate, result in substantial liabilities that have a material adverse effect upon our business, financial condition or results of operations.
Our ability to attract and retain business and employees may depend on our reputation in the marketplace.
We believe our reputation, along with our brand equity in the ManpowerGroup name and our various other brands, are important corporate resources that help distinguish our services from those of competitors and also contribute to our efforts to recruit and retain talented employees. However, our corporate reputation is potentially susceptible to material damage by events such as disputes with clients, information technology security breaches, internal control deficiencies, delivery failures or compliance violations. Similarly, our reputation could be damaged by actions or statements of current or former clients, employees, competitors, vendors, adversaries in legal proceedings, government regulators, as well as members of the investment community or the media. There is a risk that negative information about ManpowerGroup, even if based on rumor or misunderstanding, could materially adversely affect our business. Damage to our reputation could be difficult, expensive and time-consuming to repair, could make potential or existing clients reluctant to select us for new engagements, resulting in a loss of business, and could materially adversely affect our recruitment and retention efforts. Damage to our reputation could also reduce the value and effectiveness of the ManpowerGroup name and our other brand names, and could reduce investor confidence in us, materially adversely affecting our share price.
Changes in sentiment toward the staffing industry could affect the marketplace for our services.
From time to time, the staffing industry has come under criticism from unions, works councils, regulatory agencies and other constituents that maintain that labor and employment protections, such as wage and benefits regulations, are subverted when clients use contingent staffing services. Our business is dependent on the continued acceptance of contingent staffing arrangements as a source of flexible labor for our clients. If attitudes or business practices in some locations change due to pressure from organized labor, political groups or regulatory agencies, it could have a material adverse effect on our business, results of operations and financial condition.
17
Our results of operations and share price could be materially adversely affected if we are unable to maintain effective internal controls.
The accuracy of our financial reporting is dependent on the effectiveness of our internal controls. We are required to provide a report from management to our shareholders on our internal control over financial reporting that includes an assessment of the effectiveness of these controls. Internal control over financial reporting has inherent limitations, including human error, the possibility that controls could be circumvented or become inadequate because of changed conditions, and fraud. Because of these inherent limitations, internal control over financial reporting might not prevent or detect all misstatements or fraud. If we cannot maintain and execute adequate internal control over financial reporting or implement required new or improved controls that provide reasonable assurance of the reliability of the financial reporting and preparation of our financial statements for external use, we could suffer harm to our reputation, fail to meet our public reporting requirements timely, be unable to properly report on our business and our results of operations, or be required to restate our financial statements. If any of these were to occur, the market price of our securities and our ability to obtain new business could be materially adversely affected.
Our acquisition strategy may have a material adverse effect on our business due to unexpected or underestimated costs.
From time to time, we make acquisitions of other companies or operating assets or enter into operating joint ventures. These activities involve significant risks, including:
• | difficulties in the assimilation of the operations, financial reporting, services and corporate culture of acquired companies; |
• | failure of any companies or assets that we acquire, or joint ventures that we form, to meet performance expectations, which could trigger payment obligations; |
• | over-valuation by us of any companies or assets that we acquire, or joint ventures that we form; |
• | disputes that arise with sellers; |
• | failure to effectively monitor compliance with corporate policies as well as regulatory requirements; |
• | insufficient indemnification from the selling parties for liabilities incurred by the acquired companies prior to the acquisitions; and |
• | diversion of management’s attention from other business concerns. |
These risks could have a material adverse effect on our business because they may result in substantial costs to us and disrupt our business. In addition, future acquisitions could materially adversely affect our business, financial condition, results of operations and liquidity. Possible impairment losses on goodwill and intangible assets with an indefinite life, or restructuring charges could also occur.
We have only a limited ability to protect our thought leadership and other intellectual property, which is important to our success.
Our success depends, in part, upon our ability to protect our proprietary methodologies and other intellectual property including the value of our brands. Existing laws of the various countries in which we provide services or solutions may offer only limited protection. We rely upon a combination of trade secrets, confidentiality and other contractual agreements, and patent, copyright, and trademark laws to protect our intellectual property rights. Our intellectual property rights may not prevent competitors from independently developing products, services and solutions similar to ours. Further, the steps we take might not be adequate to prevent or deter infringement or other misappropriation of our intellectual property by competitors, former employees or other third parties, which could materially adversely affect our business and financial results.
In addition, we cannot be sure that our services and solutions do not infringe on the intellectual property rights of third parties, and these third parties could claim that we or our clients are infringing upon their intellectual property rights. These claims could harm our reputation, cause us to incur substantial costs or prevent us from offering some services or solutions in the future.
18
We maintain debt that could materially adversely affect our operating flexibility and put us at a competitive disadvantage.
As of December 31, 2017, we had $947.5 million of total debt. Our level of debt and the limitations imposed on us by our credit agreements could have important consequences for investors, including the following:
• | we may not be able to obtain additional debt financing for future working capital, capital expenditures, significant acquisition opportunities, or other corporate purposes or may have to pay more for such financing; |
• | borrowings under our revolving credit facilities are at a variable interest rate, making us more vulnerable to increases in interest rates; and |
• | we could be less able to take advantage of significant business opportunities and to react to changes in market or industry conditions. |
Our failure to comply with restrictive covenants under our revolving credit facilities and other debt instruments could trigger prepayment obligations.
Our failure to comply with the restrictive covenants under our revolving credit facilities and other debt instruments could result in an event of default, which, if not cured or waived, could result in us being required to repay these borrowings before their due date. If we are forced to refinance these borrowings on less favorable terms, our results of operations and financial condition could be materially adversely affected by increased costs and rates.
The lenders under our and our subsidiaries’ credit facilities may be unwilling or unable to extend credit to us on acceptable terms or at all.
If our liquidity needs increase, we would expect to use our revolving credit facility, which is provided by a syndicate of banks. Each bank in the syndicate is responsible on a several, but not joint, basis for providing a portion of the loans under the facility. If any of the participants in the syndicate fails to satisfy its obligations to extend credit under the facility, the other participants refuse or are unable to assume its obligations and we are unable to find an alternative source of funding at comparable rates, our liquidity may be materially adversely affected or our interest expense may increase substantially.
Furthermore, a number of our subsidiaries maintain uncommitted lines of credit with various banks. Under the terms of these lines of credit, the bank is not obligated to make loans to the subsidiary or to make loans to the subsidiary at a particular interest rate. If any of these banks cancel these lines of credit or otherwise refuse to extend credit on acceptable terms, we may need to extend credit to those subsidiaries or the liquidity of our subsidiaries may be materially adversely affected.
The performance of our subsidiaries and their ability to distribute cash to our parent company may vary, negatively affecting our ability to service our debt at the parent company level or in other subsidiaries.
Since we conduct a significant portion of our operations through our subsidiaries, our cash flow and our consequent ability to service our debt depends in part upon the earnings of our subsidiaries and the distribution of those earnings to our parent company, or upon loans or other payments of funds by those subsidiaries to our parent company or to other subsidiaries. The payment of such dividends and the making of such loans and advances by our subsidiaries may be subject to legal or contractual restrictions, depend upon the earnings of those subsidiaries and working capital requirements, and be subject to various business considerations, including the ability of such subsidiaries to pay such dividends or make such loans and advances.
Our inability to secure guarantees or letters of credit on acceptable terms may substantially increase our cost of doing business in various countries.
In a number of countries in which we conduct business we are obligated to provide guarantees or letters of credit to secure licenses, lease space or for insurance coverage. We typically receive these guarantees and letters of credit from a number of financial institutions around the world. In the event that we are unable to secure these arrangements from a bank, lender or other third party on acceptable terms, our liquidity may be materially adversely affected, there could be a disruption to our business or there could be a substantial increase in cost for our business.
19
We could be subject to changes in tax rates, adoption of new United States or international tax legislation or tax audits that could result in additional income tax liabilities.
We are subject to income and other taxes in the United States and international jurisdictions where we have operations. The tax bases and rates of these respective tax jurisdictions change from time to time due to economic and political conditions. Our effective income tax rate is affected by changes in earnings in countries with differing tax rates, changes in valuation of deferred tax assets and liabilities or changes in the respective tax laws. Our other taxes are impacted by changes in local tax laws or changes in our business.
In addition, tax accounting involves complex matters and requires our judgment to determine our worldwide provision for income and other taxes and tax assets and liabilities. These complex matters include transfer pricing and reporting related to intercompany transactions. We are routinely subject to tax examinations by the United States Internal Revenue Service and other tax authorities. These audits may result in additional tax liabilities. Any increase in our income tax provision and other tax provision may have a material adverse effect on our financial results.
The price of our common stock may fluctuate significantly, which may result in losses for investors.
The market price for our common stock may be subject to significant volatility. For example, during 2017, the price of our common stock as reported on the New York Stock Exchange ranged from a high of $130.38 to a low of $89.81. Our stock price can fluctuate as a result of a variety of factors, including factors listed in these “Risk Factors” and others, many of which are beyond our control. These factors include:
• | actual or anticipated variations in our quarterly operating results; |
• | announcement of new services by us or our competitors; |
• | announcements relating to strategic relationships or acquisitions; |
• | changes in financial estimates or other statements by securities analysts; |
• | changes in general economic conditions; and |
• | changes in investor sentiment regarding the company arising from these or other events, or the economy in general. |
Wisconsin law and our articles of incorporation and bylaws contain provisions that could make the takeover of our company more difficult.
Certain provisions of Wisconsin law and our articles of incorporation and bylaws could have the effect of delaying or preventing a third party from acquiring us, even if a change in control would be beneficial to our shareholders. These provisions of our articles of incorporation and bylaws currently include:
• | permitting removal of directors only for cause; |
• | providing that vacancies on the board of directors will be filled by the remaining directors then in office; and |
• | requiring advance notice for shareholder proposals and director nominees. |
In addition, the Wisconsin control share acquisition statute and Wisconsin’s “fair price” and “business combination” provisions, in addition to other provisions of Wisconsin law, limit the ability of an acquiring person to engage in certain transactions or to exercise the full voting power of acquired shares under certain circumstances. As a result, offers to acquire us, which may represent a premium over the available market price of our common stock, may be withdrawn or otherwise fail to be realized. The provisions described above could cause our stock price to decline.
Item 1B. Unresolved Staff Comments
Not applicable.
Item 2. Properties
We own properties at various locations worldwide, none of which are material. Most of our operations are conducted from leased premises and we do not anticipate any difficulty in renewing these leases or in finding alternative sites in the ordinary course of business.
20
Item 3. Legal Proceedings
We are involved in litigation of a routine nature and various legal matters, which are being defended and handled in the ordinary course of business.
Item 4. Mine Safety Disclosures
Not applicable.
21
EXECUTIVE OFFICERS OF MANPOWERGROUP
(as of February 20, 2018)
Name of Officer | Office |
Jonas Prising Age 53 | Chairman of ManpowerGroup as of December 31, 2015. Chief Executive Officer of ManpowerGroup since May 2014. ManpowerGroup President from November 2012 to May 2014. Executive Vice President, President of ManpowerGroup - the Americas from January 2009 to October 2012. Executive Vice President, President – United States and Canadian Operations from January 2006 to December 2008. A director of ManpowerGroup since May 2014. An employee of ManpowerGroup since May 1999. A director of Kohl's Corporation since August 2015. |
Darryl Green Age 57 | President and Chief Operating Officer of ManpowerGroup since May 2014. ManpowerGroup President from November 2012 to May 2014. Executive Vice President, President of Asia Pacific and Middle East Operations from January 2009 to October 2012. Executive Vice President, President – Asia-Pacific Operations from May 2007 to December 2008. An employee of ManpowerGroup since May 2007. |
John T. McGinnis Age 51 | Executive Vice President, Chief Financial Officer of ManpowerGroup since February 2016. Global Controller of Morgan Stanley from January 2014 to February 2016. Chief Financial Officer, HSBC North America from July 2012 to January 2014. Chief Financial Officer, HSBC Bank USA from July 2010 to January 2014. An employee of ManpowerGroup since February 2016. |
Mara E. Swan Age 58 | Executive Vice President - Global Strategy and Talent since January 2009. Senior Vice President of Global Human Resources from August 2005 to December 2008. An employee of ManpowerGroup since August 2005. A director of GOJO Industries since November 2012. |
Sriram “Ram” Chandrashekar Age 51 | Executive Vice President, Operational Excellence and IT, and President of Asia Pacific Middle East Region since February 2014. Senior Vice President of Operational Excellence and IT from October 2012 to February 2014. Chief Operating Officer of Asia Pacific Middle East Region from April 2008 to October 2012. An employee of ManpowerGroup since April 2008. |
Richard D. Buchband Age 54 | Senior Vice President, General Counsel and Secretary of ManpowerGroup since January 2013. Prior to joining ManpowerGroup, a partner and Associate General Counsel for Accenture plc from 2006 to 2011. An employee of ManpowerGroup since January 2013. |
22
OTHER INFORMATION
Audit Committee Approval of Audit-Related and Non-Audit Services
The Audit Committee of our Board of Directors has approved the following audit-related and non-audit services performed or to be performed for us by our independent registered public accounting firm, Deloitte & Touche LLP and Affiliates, in 2017:
(a) Tax services consisted of assistance in the preparation and review of certain international tax returns, consultation regarding appropriate handling of items on the United States and international tax returns, assistance with tax audits and examinations, advice related to VAT and wage tax matters, due diligence related to a potential acquisition, advice regarding tax issues relating to our reorganizations and a transfer pricing study;
(b) Audit-related services consisted of audit reports for government subsidies, educational expenses for flex workers and certification fees; and
(c) Other services consisted of market research to benchmark certain aspects of our business.
23
PART II
Item 5. Market for Registrant’s Common Equity, Related Shareholder Matters and Issuer Purchases of Equity Securities
Common Stock Listing and Trading
The Company's common stock is listed for trading on the New York Stock Exchange under the symbol MAN.
Shareholders of Record
As of February 20, 2018, the Company's common stock was held by approximately 3,000 record holders.
Market Information for Common Stock
The table below presents the price range of our common stock on the New York Stock Exchange for each fiscal quarter during the last two fiscal years:
2017 | 2016 | ||||||||||||||
High | Low | High | Low | ||||||||||||
First Quarter | $ | 103.61 | $ | 89.81 | $ | 81.82 | $ | 70.33 | |||||||
Second Quarter | 111.65 | 97.54 | 85.38 | 59.90 | |||||||||||
Third Quarter | 119.93 | 105.21 | 72.61 | 60.67 | |||||||||||
Fourth Quarter | 130.38 | 119.68 | 92.83 | 71.50 | |||||||||||
Dividend Policy
Semi-annual cash dividends are declared by our Board of Directors and paid on or about June 15 and December 15 of each year. The aggregate amount of semi-annual dividends was $1.86 and $1.72 per share for 2017 and 2016, respectively. While we currently expect that comparable future semi-annual dividends will continue to be paid, our dividend policy is subject to review and change at the discretion of our Board of Directors and may depend upon, among other factors, earnings, financial condition, and other requirements.
Issuer Purchases of Equity Securities
In July 2016, the Board of Directors authorized the repurchase of 6.0 million shares of our common stock. We conduct share repurchases from time to time through a variety of methods, including open market purchases, block transactions, privately negotiated transactions or similar facilities. As of December 31, 2017, there were 2.8 million shares remaining authorized for repurchase under this authorization. The following table shows the total amount of shares repurchased under this authorization during the fourth quarter of 2017.
Total number of shares purchased | Average price paid per share | Total number of shares purchased as part of publicly announced plan or programs | Maximum number of shares that may yet be purchased under the plan or programs | ||||||||||
October 1 - 31, 2017 | — | $ | — | — | 3,038,620 | ||||||||
November 1 - 30, 2017 | 205,314 | 125.73 | 205,314 | 2,833,306 | |||||||||
December 1 - 31, 2017 | — | — | — | 2,833,306 | |||||||||
Total | 205,314 | $ | 125.73 | 205,314 | 2,833,306 | ||||||||
24
Performance Graph
Set forth below is a graph for the periods ending December 31, 2012–2017 comparing the cumulative total shareholder return on our common stock with the cumulative total return of companies in the Standard & Poor’s 400 Midcap Stock Index and the Standard & Poor’s Supercomposite Human Resources and Employment Services Index. We are included in the Standard & Poor’s Supercomposite Human Resources and Employment Services Index and we estimate that we constituted approximately 29% of the total market capitalization of the companies included in the index. The graph assumes a $100 investment on December 31, 2012 in our common stock, the Standard & Poor’s 400 Midcap Stock Index and the Standard & Poor’s Supercomposite Human Resources and Employment Services Index and assumes the reinvestment of all dividends.
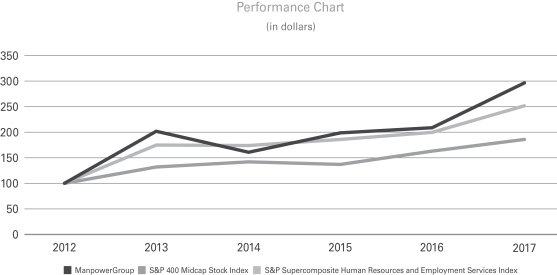
December 31 | 2017 | 2016 | 2015 | 2014 | 2013 | 2012 | ||||||||||||
ManpowerGroup | $ | 297 | $ | 209 | $ | 199 | $ | 161 | $ | 202 | $ | 100 | ||||||
S&P 400 Midcap Stock Index | 186 | 163 | 137 | 142 | 132 | 100 | ||||||||||||
S&P Supercomposite Human Resources and Employment Services Index | 252 | 200 | 186 | 174 | 175 | 100 | ||||||||||||
25
Item 6. Selected Financial Data
The selected five-year financial data presented below should be read in conjunction with the information contained in Item 7 "Management’s Discussion and Analysis of Financial Condition and Results of Operations," and the Company’s Consolidated Financial Statements and the Notes thereto contained in Item 8. "Financial Statements and Supplementary Data."
As of and for the Year Ended December 31 | |||||||||||||||
(in millions, except per share data) | 2017 | 2016 | 2015 | 2014 | 2013 | ||||||||||
Operations Data | |||||||||||||||
Revenues from services | $ | 21,034.3 | $ | 19,654.1 | $ | 19,329.9 | $ | 20,762.8 | $ | 20,250.5 | |||||
Gross profit | 3,484.6 | 3,333.8 | 3,295.8 | 3,488.2 | 3,366.7 | ||||||||||
Operating profit | 788.2 | 750.8 | 688.9 | 719.9 | 511.9 | ||||||||||
Net earnings | 545.4 | 443.7 | 419.2 | 427.6 | 288.0 | ||||||||||
Per Share Data | |||||||||||||||
Net earnings — basic | $ | 8.13 | $ | 6.33 | $ | 5.46 | $ | 5.38 | $ | 3.69 | |||||
Net earnings — diluted | 8.04 | 6.27 | 5.40 | 5.30 | 3.62 | ||||||||||
Dividends | 1.86 | 1.72 | 1.60 | 0.98 | 0.92 | ||||||||||
Balance Sheet Data | |||||||||||||||
Total assets | $ | 8,883.6 | $ | 7,574.2 | $ | 7,517.5 | $ | 7,181.2 | $ | 7,286.6 | |||||
Long-term debt | 478.1 | 785.6 | 810.9 | 422.6 | 480.2 | ||||||||||
Item 7. Management’s Discussion and Analysis of Financial Condition and Results of Operations
Financial Measures — Constant Currency And Organic Constant Currency
Changes in our financial results include the impact of changes in foreign currency exchange rates and acquisitions. We provide “constant currency” and “organic constant currency” calculations in this report to remove the impact of these items. We express year-over-year variances that are calculated in constant currency and organic constant currency as a percentage.
When we use the term “constant currency,” it means that we have translated financial data for a period into United States dollars using the same foreign currency exchange rates that we used to translate financial data for the previous period. We believe that this calculation is a useful measure, indicating the actual growth of our operations. We use constant currency results in our analysis of subsidiary or segment performance. We also use constant currency when analyzing our performance against that of our competitors. Substantially all of our subsidiaries derive revenues and incur expenses within a single country and, consequently, do not generally incur currency risks in connection with the conduct of their normal business operations. Changes in foreign currency exchange rates primarily impact reported earnings and not our actual cash flow unless earnings are repatriated.
When we use the term “organic constant currency,” it means that we have further removed the impact of acquisitions in the current period from our constant currency calculation. We believe that this calculation is useful because it allows us to show the actual growth of our pre-existing business.
The constant currency and organic constant currency financial measures are used to supplement those measures that are in accordance with United States Generally Accepted Accounting Principles (“GAAP”). These Non-GAAP financial measures may not provide information that is directly comparable to that provided by other companies in our industry, as other companies may calculate such financial results differently. These Non-GAAP financial measures are not measurements of financial performance under GAAP, and should not be considered as alternatives to measures presented in accordance with GAAP.
Constant currency and organic constant currency percent variances, along with a reconciliation of these amounts to certain of our reported results, are included on pages 38 and 39.
26
Results of Operations - Years Ended December 31, 2017, 2016 and 2015
During 2017, the United States dollar was weaker, on average, relative to the currencies in Europe, having a favorable impact on our reported results. While our reported revenues from services increased 7.0% from 2016 and our reported operating profit increased 5.0%, these results were impacted by the changes in foreign currency exchange rates and generally do not reflect the performance of our underlying business. The changes in the foreign currency exchange rates had a 1.0% favorable impact on revenues from services, a 1.9% favorable impact on operating profit, and an approximately $0.10 per share favorable impact on net earnings per share - diluted. Substantially all of our subsidiaries derive revenues from services and incur expenses within the same currency and generally do not have cross-currency transactions, and, therefore, changes in foreign currency exchange rates primarily impact reported earnings and not our actual cash flow unless earnings are repatriated. To understand the performance of our underlying business, we utilize constant currency or organic constant currency variances for our consolidated and segment results.
In 2017, we experienced constant currency revenue growth in most of our major markets. Our consolidated revenues were up 6.0% in constant currency (7.0% as reported) in 2017 compared to 2016. We experienced improving economic conditions in Europe and most of our major markets during the year. Our staffing/interim business had solid growth in 2017, along with an 8.1% constant currency increase (8.6% as reported) in our permanent recruitment business and strong growth in our ManpowerGroup Solutions business, mainly driven by our Proservia business. At Right Management, we have experienced decreased demand for both our outplacement services, due to the counter-cyclical nature of this business, and our talent management services.
Our gross profit margin in 2017 decreased compared to 2016 primarily due to the decline in our Manpower staffing gross profit margin, primarily due to changes in business mix and pricing pressures partially offset by the increase in the CICE subsidy, and decreased demand for our higher-margin Right Management services.
Our operating profit increased in 2017, up 3.1% in constant currency (5.0% as reported), however, our operating profit margin decreased 10 basis points compared to 2016. Included in 2017 was $34.5 million of restructuring costs primarily related to the integration of certain acquisitions and other office, back-office and delivery-model optimization. Excluding the restructuring costs in 2017, our operating profit was up 8.0% in constant currency with operating profit margin up 10 basis points compared to 2016. We continue to monitor expenses closely to ensure we maintain the benefit of our efforts to optimize our organizational and cost structures, while investing appropriately to support the growth in the business and enhance our productivity and technology and digital capabilities. We experienced improved operational leverage in 2017 as we were able to support the increase in revenues without a similar increase in expenses.
In December 2017, the French government released its 2018 budget, which introduced a reduction in the French CICE payroll tax credits rate from the 7% level in 2017 to 6% of eligible wages starting in January 2018. This reduction had an unfavorable impact of $3.1 million (€2.6 million) on our gross profit for the fourth quarter of 2017 due to the December wage payments that were made in January 2018, and is currently expected to have an additional unfavorable impact of approximately $34.2 million (€28.0 million) on our 2018 gross profit. We plan to mitigate this impact to the greatest extent possible with various pricing initiatives and productivity improvements. The French government has also indicated that beginning in 2019 the CICE will be replaced by a payroll tax subsidy ranging from 6.0% to 9.9% of eligible wages, for which the benefit will be reduced by both profit sharing and income taxes. The details of the payroll tax subsidy are still being finalized and may change significantly; therefore, we cannot yet estimate the impact that this change will have on our financial results subsequent to 2018.
27
Consolidated Results — 2017 Compared to 2016
The following table presents selected consolidated financial data for 2017 as compared to 2016.
(in millions, except per share data) | 2017 | 2016 | Reported Variance | Variance in Constant Currency | Variance in Organic Constant Currency | |||||||
Revenues from services | $ | 21,034.3 | $ | 19,654.1 | 7.0 | % | 6.0 | % | 5.5 | % | ||
Cost of services | 17,549.7 | 16,320.3 | 7.5 | 6.4 | ||||||||
Gross profit | 3,484.6 | 3,333.8 | 4.5 | 3.6 | 3.1 | |||||||
Gross profit margin | 16.6 | % | 17.0 | % | ||||||||
Selling and administrative expenses | 2,696.4 | 2,583.0 | 4.4 | 3.7 | 3.1 | |||||||
Selling and administrative expenses as a % of revenues | 12.8 | % | 13.1 | % | ||||||||
Operating profit | 788.2 | 750.8 | 5.0 | 3.1 | 3.3 | |||||||
Operating profit margin | 3.7 | % | 3.8 | % | ||||||||
Net interest expense | 33.4 | 34.3 | ||||||||||
Other expenses | 17.5 | 15.2 | ||||||||||
Earnings before income taxes | 737.3 | 701.3 | 5.1 | 3.5 | ||||||||
Provision for income taxes | 191.9 | 257.6 | (25.5 | ) | ||||||||
Effective income tax rate | 26.0 | % | 36.7 | % | ||||||||
Net earnings | $ | 545.4 | $ | 443.7 | 22.9 | 21.3 | ||||||
Net earnings per share — diluted | $ | 8.04 | $ | 6.27 | 28.2 | 26.6 | ||||||
Weighted average shares — diluted | 67.9 | 70.8 | (4.2 | )% | ||||||||
The year-over-year increase in revenues from services of 7.0% (6.0% in constant currency and 5.5% in organic constant currency) was attributed to:
• | increased demand for services in several of our markets within Southern Europe and Northern Europe, where in constant currency revenues increased 12.7% (15.5% as reported) and 3.4% (3.5% as reported; 2.6% in organic constant currency), respectively. This included a constant currency revenue increase in France of 10.6% (13.2% as reported), primarily due to strong growth in our large client accounts within the staffing market and growth in our Proservia business, and an 8.3% constant currency increase (10.5% as reported) in the permanent recruitment business. This increase also included a constant currency revenue increase in Italy of 23.3% (26.4% as reported) due to increased demand for our Manpower staffing services and a 23.7% constant currency increase (26.0% as reported) in the permanent recruitment business. We also experienced constant currency revenue growth in Germany, the Netherlands, the Nordics, Spain and Belgium of 10.1%, 12.6%, 6.6%, 12.3%, and 4.5%, respectively (12.5%, 15.2%, 7.6%, 15.1% and 6.8%, respectively, as reported; 8.4%, 5.1% and 5.2%, in organic constant currency in the Netherlands, the Nordics and Spain, respectively); |
• | a revenue increase in APME of 6.4% in constant currency (6.7% as reported; 6.1% in organic constant currency) primarily due to an increase in our staffing/interim revenues, an increase in our ManpowerGroup Solutions business and a 10.8% constant currency increase (12.1% as reported) in our permanent recruitment business; and |
• | our acquisitions in Southern Europe, Northern Europe and APME, which added approximately 0.5% revenue growth to our consolidated results on a constant currency basis; partially offset by |
• | a revenue decrease in the United States of 6.3% primarily driven by a decline in demand for our Manpower staffing services, mainly due to the prolonged weakness in the manufacturing sector of the economy, a decrease in our Experis interim services, specifically within the IT sector due to decreased demand at several large clients, and a decrease in our ManpowerGroup Solutions business, due to a specific client loss and roll off of certain project work; |
• | decreased demand for services at Right Management, where revenues decreased 15.6% in constant currency (-15.8% as reported), including a 14.9% constant currency decrease (-15.3% as reported) in our outplacement |
28
services as well as an 18.0% constant currency decline (-17.6% as reported) in our talent management business;
• | a 1.0% decrease due to the impact of changes in currency exchange rates; and |
• | the unfavorable impact of approximately 0.4% in constant currency due to one fewer billing day in the year. |
The year-over-year 40 basis point (-0.40%) decrease in gross profit margin was primarily attributed to:
• | a 30 basis point (-0.30%) unfavorable impact from the decline in our Manpower staffing margin, particularly in France, Italy, Germany, and the Nordics, due primarily to changes in business mix; and |
• | a 10 basis point (-0.10%) unfavorable impact from decreased demand in our outplacement business at Right Management. |
The 4.4% increase in selling and administrative expenses in 2017 (3.7% in constant currency; 3.1% in organic constant currency) was primarily attributed to:
• | restructuring costs of $34.5 million incurred in 2017, comprised of $6.3 million in the Americas, $23.8 million in Northern Europe, $1.4 million in APME, $2.0 million in Right Management and $1.0 million in corporate expenses; |
• | a 15.8% increase in constant currency (16.8% as reported; 14.6% in organic constant currency) in consulting costs primarily related to certain technology projects and back-office and delivery-model optimization activities; |
• | a 1.1% increase in constant currency (1.8% as reported) in organic salary-related costs, primarily because of additional headcount to support the increased demand for our services specifically in Southern Europe, Northern Europe and APME; |
• | the additional recurring selling and administrative costs of $16.6 million incurred as a result of acquisitions in Southern Europe, Northern Europe and APME; and |
• | the pension curtailment and favorable lease termination gains of $8.1 million in Northern Europe in 2016, which did not recur in 2017; and |
• | a 0.7% increase due to the impact of changes in the currency exchange rates; partially offset by |
• | a 1.1% constant currency decrease (-0.4% as reported) in other organic non-personnel related costs as a result of our strong focus on productivity and efficiency. |
Selling and administrative expenses as a percent of revenues decreased 30 basis points (-0.30%) in 2017 compared to 2016. The change in selling and administrative expenses as a percent of revenues consisted of:
• | a 40 basis point (-0.40%) favorable impact from better expense leverage as a result of our strong focus on productivity and efficiency; |
• | a 10 basis point (-0.10%) decrease due to the impact on business mix of changes in currency exchange rates; partially offset by |
• | a 20 basis point (0.20%) unfavorable impact due to the restructuring costs noted above. |
Interest and other expenses are comprised of interest, foreign exchange gains and losses and other miscellaneous non-operating income and expenses. Interest and other expenses were $50.9 million in 2017 compared to $49.5 million in 2016. Net interest expense decreased $0.9 million in 2017 to $33.4 million from $34.3 million in 2016 due to an increase in interest income as a result of higher interest rates on investments. Foreign exchange losses in 2017 were $0.8 million compared to $2.8 million in 2016. The foreign exchange losses in 2017 were primarily due to unfavorable foreign currency impacts from translation of amounts denominated in currencies other than functional currencies in a few of our reporting units, partially offset by translation gains resulting from intercompany transactions between our foreign subsidiaries and the United States. The foreign exchange losses in 2016 were primarily due to unfavorable foreign currency impacts from translation of amounts denominated in currencies other than functional currencies in a few of our reporting units, translation losses resulting from intercompany transactions between our foreign subsidiaries and the United States, and a foreign currency loss as a result of the change in the exchange rate in our Venezuela reporting unit. Miscellaneous expenses increased to $16.7 million in 2017 compared to $12.4 million in 2016. This increase is primarily due to an increase in expenses related to net earnings attributable to noncontrolling interests, partially offset by a gain on the sale of investments by our minority-owned Swiss Franchise recorded in 2017.
29
We recorded income tax expense at an effective rate of 26.0% in 2017, as compared to an effective rate of 36.7% in 2016. This decrease was primarily due to the $73.7 million net discrete tax benefit recorded in 2017 as a result of the tax benefit from the enactment of the United States Tax Cuts and Jobs Act of 2017 (“Tax Act”) offset by the tax expense from French tax reform. These enactments resulted in the net reduction of United States tax liabilities of $247.4 million offset by the United States transition tax expense of $170.2 million and a decrease in the French deferred tax assets of $3.5 million. Excluding the impact of these enactments, our rate would have been 36.0%. This is higher than the United States federal statutory rate of 35% due primarily to the French business tax and other permanents items, offset by the favorable impact from the adoption of the new accounting guidance for share-based payments effective January 1, 2017, the favorable settlement of an audit and the net release of valuation allowances. Effective January 1, 2018, the United States federal statutory rate changed from 35% to 21%. As a result of this decrease, we currently expect our 2018 effective tax rate to be between 27% and 28%, which does not include any impact from a change in our provisional transition tax. In 2019, we currently expect an increase in our effective tax rate to be between 33% and 34% due primarily to changes in the taxable nature of the French CICE.
Net earnings per share - diluted was $8.04 in 2017 compared to $6.27 in 2016. Foreign currency exchange rates favorably impacted net earnings per share - diluted by approximately $0.10 in 2017. The net tax benefits related to the Tax Act and the French tax reform positively impacted net earnings per share - diluted by approximately $1.09 per share in 2017. Restructuring costs recorded in 2017 negatively impacted net earnings per share - diluted by approximately $0.41 per share, net of tax. The tax benefit related to the favorable settlement of an audit and the adoption of the new accounting guidance for share-based payments positively impacted net earnings per share - diluted by approximately $0.13 and $0.09, respectively, in 2017. (See Note 3 to the Consolidated Financial Statements found in Item 8. "Financial Statements and Supplementary Data" for further information.)
Weighted average shares - diluted decreased 4.2% to 67.9 million in 2017 from 70.8 million in 2016. This decrease was due to the impact of share repurchases completed in 2017 and the full weighting of the repurchases completed in 2016, partially offset by shares issued as a result of exercises and vesting of share-based awards in 2017.
Consolidated Results — 2016 Compared to 2015
The following table presents selected consolidated financial data for 2016 as compared to 2015.
(in millions, except per share data) | 2016 | 2015 | Reported Variance | Variance in Constant Currency | Variance in Organic Constant Currency | |||||||
Revenues from services | $ | 19,654.1 | $ | 19,329.9 | 1.7 | % | 4.1 | % | 1.8 | % | ||
Cost of services | 16,320.3 | 16,034.1 | 1.8 | 4.3 | ||||||||
Gross profit | 3,333.8 | 3,295.8 | 1.2 | 3.3 | 0.4 | |||||||
Gross profit margin | 17.0 | % | 17.1 | % | ||||||||
Selling and administrative expenses | 2,583.0 | 2,606.9 | (0.9 | ) | 1.1 | (2.0 | ) | |||||
Selling and administrative expenses as a % of revenues | 13.1 | % | 13.5 | % | ||||||||
Operating profit | 750.8 | 688.9 | 9.0 | 11.4 | 9.4 | |||||||
Operating profit margin | 3.8 | % | 3.6 | % | ||||||||
Net interest expense | 34.3 | 33.5 | ||||||||||
Other expense (income) | 15.2 | (5.3 | ) | |||||||||
Earnings before income taxes | 701.3 | 660.7 | 6.1 | 8.5 | ||||||||
Provision for income taxes | 257.6 | 241.5 | 6.7 | |||||||||
Effective income tax rate | 36.7 | % | 36.5 | % | ||||||||
Net earnings | $ | 443.7 | $ | 419.2 | 5.8 | 8.4 | ||||||
Net earnings per share — diluted | $ | 6.27 | $ | 5.40 | 16.1 | 18.9 | ||||||
Weighted average shares — diluted | 70.8 | 77.7 | (8.9 | )% | ||||||||
30
The year-over-year increase in revenues from services of 1.7% (4.1% in constant currency and 1.8% in organic constant currency) was attributed to:
• | increased demand for services in several of our markets within Southern Europe and Northern Europe, where in constant currency revenues increased 3.0% (2.8% as reported) and 7.3% (1.9% as reported; 1.2% in organic constant currency), respectively. This included a constant currency revenue increase in France of 4.0% (3.8% as reported) primarily due to growth in the staffing market and strong permanent recruitment growth. We also experienced constant currency revenue growth in Germany, Spain, the Netherlands and Belgium of 32.9%, 10.1%, 25.0%, and 18.1%, respectively (32.6%, 9.9%, 24.7% and 17.7%, respectively, as reported; 5.9%, 17.1% and 14.4% in organic constant currency in Germany, the Netherlands and Belgium, respectively); |
• | a revenue increase in APME of 8.1% in constant currency (10.4% as reported; 5.8% in organic constant currency) primarily due to an increase in our staffing/interim revenues, an increase in our ManpowerGroup Solutions business and a 7.0% constant currency increase (6.0% as reported) in our permanent recruitment business; |
• | increased demand, particularly during the first half of the year, for outplacement services at Right Management, where revenues increased 3.2% in constant currency (1.1% as reported); and |
• | our acquisitions in the Americas, Southern Europe, Northern Europe and APME, which added approximately 2.3% of revenue growth to our consolidated results; partially offset by |
• | a revenue decrease in the United States of 5.6% primarily driven by a decline in demand for our staffing/interim services mainly in the industrial and IT sectors, partially offset by solid growth in our MSP and RPO offerings within the ManpowerGroup Solutions business and growth in our permanent recruitment business; |
• | a revenue decrease in Italy of 4.5% (-4.8% as reported) as a result of reduced demand for our Manpower staffing services and ManpowerGroup Solutions offerings primarily due to the non-recurrence of the Milan Expo related business, which ended in the fourth quarter of 2015, partially offset by growth in our permanent recruitment business; |
• | a revenue decrease of 19.5% in constant currency (-21.2% as reported) in our talent management business at Right Management; and |
• | a 2.4% decrease due to the impact of changes in the currency exchange rates. |
The year-over-year 10 basis point (-0.10%) decrease in gross profit margin was primarily attributed to:
• | a 30 basis point (-0.30%) unfavorable impact from the decline in our organic staffing/interim margin due primarily to direct cost increases, such as complementary health care costs for our staffing/interim associates in France as a result of new legislation, changes in business mix, and pricing pressure in certain markets such as France, the United Kingdom and the Netherlands; and |
• | a 10 basis point (-0.10%) decline from our other business offerings; partially offset by |
• | a 10 basis point (0.10%) favorable impact due to our acquisitions in the Americas, Southern Europe, Northern Europe and APME; |
• | a 10 basis point (0.10%) favorable impact due to the 9.3% constant currency growth (6.2% as reported) in our permanent recruitment business; and |
• | a 10 basis point (0.10%) increase due to the impact on business mix of the changes in currency exchange rates. |
The 0.9% decline in selling and administrative expenses in 2016 (increase of 1.1% in constant currency; decrease of -2.0% in organic constant currency) was attributed to:
• | a 10.0% constant currency decrease (-12.2% as reported) in organic variable incentive costs due to a decline in profitability in certain markets; |
• | a 2.3% constant currency decrease (-4.3% as reported) in organic other non-personnel related costs, excluding restructuring costs, as a result of a pension curtailment and favorable lease termination gains in Northern Europe, which totaled $8.1 million, a $7.5 million insurance settlement gain in corporate expenses, and a focus on driving productivity and efficiency throughout the business; |
31
• | a decrease in restructuring costs with zero in 2016 and $16.4 million incurred in 2015, comprised of $3.2 million in the Americas, $9.0 million in Northern Europe, $2.9 million in APME and $1.3 million at Right Management; and |
• | a 2.0% decrease due to the impact of changes in the currency exchange rates; partially offset by |
• | a 3.1% increase due to additional recurring selling and administrative costs incurred as a result of the acquisitions in the Americas, Southern Europe, Northern Europe and APME; and |
• | a 2.6% constant currency increase (0.5% as reported) in organic salary expenses primarily due to additional headcount to support the increased demand for our services in certain markets. |
Selling and administrative expenses as a percent of revenues decreased 40 basis points (-0.40%) in 2016 compared to 2015. The change in selling and administrative expenses as a percent of revenues consisted of:
• | 20 basis point (-0.20%) favorable impact due to the decrease in organic variable incentive costs; |
• | a 20 basis point (-0.20%) favorable impact due to the decrease of organic non-personnel related costs consisting of 10 basis points due to the pension curtailment, favorable lease termination and insurance settlement gains and 10 basis points due to the decrease in other organic non-personnel related costs as a result of a focus on driving productivity and efficiency throughout our businesses; and |
• | a 10 basis point (-0.10%) favorable impact due to the decrease of restructuring costs noted above; partially offset by |
• | a 10 basis point (0.10%) unfavorable impact due to our acquisitions in the Americas, Southern Europe, Northern Europe and APME. |
Interest and other expenses are comprised of interest, foreign exchange gains and losses and other miscellaneous non-operating income and expenses. Interest and other expenses were $49.5 million in 2016 compared to $28.2 million in 2015. Net interest expense increased $0.8 million in 2016 to $34.3 million from $33.5 million in 2015 due to higher debt levels as we issued €400.0 million Notes in September of 2015. Foreign exchange losses in 2016 were $2.8 million compared to foreign exchange gains of $4.7 million in 2015. The foreign exchange losses in 2016 were primarily due to unfavorable foreign currency impacts from translation of amounts denominated in currencies other than functional currencies in a few of our reporting units, translation losses resulting from intercompany transactions between our foreign subsidiaries and the United States, and a foreign currency loss as a result of the change in the exchange rate in our Venezuela reporting unit. The foreign exchange gains in 2015 were primarily due to a favorable foreign currency impact on an income tax settlement offset by translation losses from intercompany transactions between our foreign subsidiaries and the United States. Miscellaneous expense was $12.4 million in 2016 compared to miscellaneous income of $0.6 million in 2015. The variance between 2016 and 2015 is primarily due to an increase in expenses related to net earnings attributable to noncontrolling interests and a decrease in income related to our equity investments, including a 2015 gain on the sale of an equity investment.
We recorded income tax expense at an effective rate of 36.7% in 2016, as compared to an effective rate of 36.5% in 2015. The 36.7% effective tax rate for 2016 was higher than the United States federal statutory rate of 35% due primarily to the French business tax, expected repatriations, changes in valuation allowances and other permanent items, partially offset by the favorable impact of the United States Work Opportunity Tax Credit (“WOTC”), which was enacted in December of 2015 and extends through 2019.
Net earnings per share - diluted was $6.27 in 2016 compared to $5.40 in 2015. Foreign currency exchange rates unfavorably impacted net earnings per share - diluted by approximately $0.15 in 2016.
Weighted average shares - diluted decreased 8.9% to 70.8 million in 2016 from 77.7 million in 2015. This decrease was due to the impact of share repurchases completed in 2016, partially offset by shares issued as a result of exercises and vesting of share-based awards in 2016.
Segment Results
We evaluate performance based on operating unit profit (“OUP”), which is equal to segment revenues less direct costs and branch and national headquarters operating costs. This profit measure does not include goodwill and intangible asset impairment charges or amortization of intangible assets related to acquisitions, corporate expenses, interest and other income and expense amounts or income taxes.
32
Americas
In the Americas, revenues from services decreased 1.9% (-1.7% in constant currency) in 2017 compared to 2016. In the United States, revenues from services decreased 6.3% in 2017 compared to 2016, primarily driven by a decline in demand for our Manpower staffing services, mainly due to the reduced staffing volumes in the manufacturing sector of the economy, a decrease in our Experis interim services, specifically within the IT sector because of decreased demand by several large clients, a decrease in ManpowerGroup Solutions business due to a specific client loss and roll off of certain project work, and an unfavorable impact from one fewer billing day. In Other Americas, revenues from services increased 6.6% (7.1% in constant currency) in 2017 compared to 2016. We experienced revenue growth in Mexico, Canada, Argentina, Colombia and Peru of 11.1%, 4.4%, 4.9%, 6.9%, and 10.9%, respectively (12.0%, 2.3%, 17.5%, 3.7%, and 7.1%, respectively, in constant currency). The constant currency increase in Argentina was primarily due to inflation. These increases were partially offset by the decrease in Brazil of 10.4% (-17.0% in constant currency) due to the non-recurrence of the business associated with the Rio Olympics in 2016.
In 2016, revenues from services decreased 4.3% (increase of 0.9% in constant currency) compared to 2015. In the United States, revenues from services decreased 5.6% in 2016 compared to 2015, primarily driven by a decline in demand for our Manpower staffing services, mainly due to the weakness in the manufacturing sector of the economy, and a decrease in our Experis interim services, specifically within the IT sector, and the anniversarying of 2015 new business. This decline was partially offset by a 7.0% increase in our permanent recruitment business and solid growth in our MSP and RPO offerings within the ManpowerGroup Solutions business. In Other Americas, revenues from services decreased 1.7% (increase of 14.1% in constant currency) in 2016 compared to 2015. We experienced constant currency revenue growth in Mexico, Canada, Argentina, Colombia, Peru and Brazil of 7.6%, 35.0%, 15.5%, 9.4%, 19.2% and 39.5%, respectively (-8.5%, 30.4%, -27.7%, -2.0%, 12.6% and 36.8%, respectively, as reported; 1.7% in organic constant currency in Canada). The constant currency increase in Argentina was primarily due to inflation. The significant revenue increase in Brazil was due to increased business associated with the Rio Olympics.
Gross profit margin increased in 2017 compared to 2016 as a result of improved staffing/interim margin in the United States due to lower direct costs primarily related to workers' compensation and health care costs, partially offset by decreases in our staffing/interim margins within some of our markets in Other Americas because of business mix changes. In 2016, gross profit margin increased compared to 2015 as a result of the favorable impact from growth in our permanent recruitment and ManpowerGroup Solutions businesses, partially offset by decreases in our staffing/interim margins in the United States and within some of our markets in Other Americas due to business mix changes and general pricing pressures.
In 2017, selling and administrative expenses decreased 4.0% (-3.8% in constant currency), due primarily to strong cost management and a decline in salary-related expenses as a result of lower headcount. These decreases were partially offset by $6.3 million of restructuring costs incurred in 2017 primarily related to severance costs incurred in connection with United States back-office optimization and an increase in consulting costs primarily related to certain technology projects and back-office and delivery-model optimization activities. In 2016, selling and administrative expenses decreased 3.7% (flat in constant currency) primarily due to a decrease in our variable incentive-based costs due to the operating results of our staffing/interim services in the United States, $3.2 million of restructuring costs recorded in 2015 that did not recur in 2016, and the cost savings resulting from those restructuring actions. This decrease was partially offset by an increase in salary-related costs in certain markets within Other Americas because of additional headcount to support the increase in revenues and the additional recurring selling and administrative costs incurred as a result of acquisitions.
OUP margin in the Americas was 5.1%, 4.6% and 4.5% for 2017, 2016 and 2015, respectively. In the United States, OUP margin was 5.7%, 5.0% and 4.8% in 2017, 2016 and 2015, respectively. The margin increase in 2017 in the United States was primarily due to the improvement in the gross profit margin and strong cost management, partially offset by the restructuring costs incurred in 2017. Other Americas OUP margin was 3.9%, 3.7% and 3.8% in 2017, 2016 and 2015, respectively. The margin increased in Other Americas in 2017 compared to 2016 due to improved operating leverage on increased revenues, partially offset by the restructuring costs incurred in 2017. The margin increase in the Americas in 2016 was primarily due to the United States as a result of the improvement in
33
the gross profit margin, partially offset by expense deleveraging, as we were not able to decrease expenses at the same rate as the revenue decrease.
Southern Europe
In 2017, revenues from services in Southern Europe, which includes operations in France and Italy, increased 15.5% (12.7% in constant currency) compared to 2016. In 2017, revenues from services increased 13.2% (10.6% in constant currency) in France (which represents 63% of Southern Europe’s revenues) and increased 26.4% (23.3% in constant currency) in Italy (which represents 17% of Southern Europe’s revenues). The increase in France is primarily due to the strong growth in our large client accounts within the staffing market, growth in our Proservia business and an increase in our permanent recruitment business of 10.5% (8.3% in constant currency), partially offset by the unfavorable impact of one fewer billing day. The increase in Italy was mostly due to increased demand for our Manpower staffing services and a 26.0% increase (23.7% in constant currency) in the permanent recruitment business, partially offset by the unfavorable impact of two fewer billing days. In Other Southern Europe, revenues from services increased 14.2% (10.8% in constant currency) in 2017 compared to 2016, primarily due to increased demand for our Manpower staffing services, the 15.1% increase (12.3% in constant currency; 5.2% in organic constant currency) in Spain primarily due to the increase in our Experis business, an increase in our ManpowerGroup Solutions business and an increase in our permanent recruitment business of 27.5% (23.9% in constant currency), partially offset by the unfavorable impact of two fewer billing days.
In 2016, revenues from services in Southern Europe increased 2.8% (3.0% in constant currency) compared to 2015. In 2016, revenues from services increased 3.8% (4.0% in constant currency) in France and decreased 4.8% (-4.5% in constant currency) in Italy. The increase in France was primarily due to the growth in the staffing market and a 12.2% increase (12.5% in constant currency) in the permanent recruitment business. The decrease in Italy was due to decreased demand for our Manpower staffing services and ManpowerGroup Solutions offerings primarily due to the non-recurrence of the Milan Expo related business, which ended in the fourth quarter of 2015, partially offset by a 21.2% increase (21.3% in constant currency) in the permanent recruitment business. In Other Southern Europe, revenues from services increased 6.3% (6.5% in constant currency) in 2016 compared to 2015, primarily driven by the 9.9% increase (10.1% in constant currency) in Spain due to strong sales execution on an increasingly larger client base, and a 26.8% increase (27.0% in constant currency) in the permanent recruitment business.
Gross profit margin decreased in 2017 compared to 2016 primarily due to a decrease in France's staffing margin, as a result of business mix changes in a competitive pricing environment as we have experienced growth in our lower-margin large client accounts and pricing pressures, partially offset by the increase in the CICE subsidy effective January 1, 2017, and decreases in Italy's Manpower staffing margin primarily due to pricing pressures and business mix changes. These decreases were partially offset by an increase of 19.9% (17.3% in constant currency) in our permanent recruitment business. In 2016, gross profit margin decreased compared to 2015 primarily due to a decrease in France's staffing/interim margin primarily as a result of direct cost increases, such as complementary health care costs for our staffing/interim associates in France as a result of new legislation, a shift in business mix due to increased business volume with certain larger accounts with lower margins, and reduced pricing on certain accounts in response to market pressures, partially offset by lower Family Welfare Tax in France related to the Responsibility Pact that was effective April 1, 2016. This decrease was partially offset by an increase in Italy's staffing/interim margin, partly due to subsidies, and an increase of 14.3% (14.6% in constant currency) in our permanent recruitment business.
In 2017, selling and administrative expenses increased 8.9% (6.4% in constant currency; 5.7% in organic constant currency) compared to 2016, primarily due to an increase in organic salary-related expenses as a result of higher headcount to support the increase in revenues, and the additional recurring selling and administrative costs incurred as a result of the acquisitions in Spain. In 2016, selling and administrative expenses increased 1.2% (1.5% in constant currency) compared to 2015, primarily due to an increase in salary-related costs because of additional headcount to support the increase in revenues, partially offset by a decrease in variable incentive costs due to a decline in profitability in certain markets and a decrease in marketing expenses related to the non-recurrence of the Milan Expo in Italy.
OUP margin in Southern Europe was 5.1%, 5.0% and 5.1% in 2017, 2016 and 2015, respectively. France's OUP margin was 5.1%, 5.2% and 5.6% in 2017, 2016 and 2015, respectively. France's margin decrease in 2017 was
34
primarily due to the decline in gross profit margin, partially offset by improved operational leverage on increased revenues. Italy’s OUP margin was 7.1%, 6.8% and 5.8% in 2017, 2016 and 2015, respectively. Italy’s margin increase in 2017 was due to improved operating leverage on increased revenues, partially offset by a decline in the gross profit margin. Other Southern Europe’s OUP margin was 3.5%, 3.2% and 2.8% in 2017, 2016 and 2015, respectively. The margin increase in 2017 was due to an increase in the gross profit margin. The margin decrease in Southern Europe in 2016 was due to a decrease in the gross profit margin, partially offset by improved operational leverage, as we were able to support an increase in revenues without a similar increase in expenses.
Northern Europe
In Northern Europe, which includes operations in the United Kingdom, Germany, the Nordics, the Netherlands and Belgium (comprising 30%, 21%, 20%, 14% and 8%, respectively, of Northern Europe’s revenues), revenues from services increased 3.5% (3.4% in constant currency; 2.6% in organic constant currency) in 2017 as compared to 2016. We experienced revenue growth in Germany, the Nordics, the Netherlands and Belgium of 12.5%, 7.6%, 15.2% and 6.8%, respectively (10.1%, 6.6%, 12.6%, and 4.5%, respectively, in constant currency; 5.1% and 8.4% in organic constant currency in the Nordics and the Netherlands) and a decline in the United Kingdom of 11.1% (-6.5% in constant currency). The Northern Europe revenue increase is due to growth in our ManpowerGroup Solutions business, mostly within our Proservia business, increased demand for our Manpower staffing services and a 4.6% increase (5.7% in constant currency) in our permanent recruitment business. These increases were partially offset by reduced demand within our largest client accounts in the United Kingdom and the unfavorable impact of one fewer billing day.
In 2016, revenues from services increased 1.9% (7.3% in constant currency and 1.2% in organic constant currency) as compared to 2015. We experienced constant currency revenue growth in Germany, the Nordics, the Netherlands and Belgium of 32.9%, 1.1%, 25.0%, and 18.1%, respectively (32.6%, -1.1%, 24.7% and 17.7%, respectively, as reported; 5.9%, 0.2%, 17.1%, and 14.4% in organic constant currency) and a constant currency decline in the United Kingdom of 3.1% (-14.1% as reported; -4.9% in organic constant currency). The organic constant currency revenue increase was primarily due to a 3.2% organic constant currency increase (1.0% as reported; 8.1% in constant currency) in our permanent recruitment business, mostly due to growth in the United Kingdom, growth in our ManpowerGroup Solutions Proservia business due to a large client win in Germany, an increase in the Netherlands' and the Nordics' staffing/interim revenues due to recent client wins and the lower level of growth in the comparable prior year period, and an increase in Belgium's Manpower staffing revenues. These increases were partially offset by a decline in our Manpower staffing business in the United Kingdom due to lower demand under one of our large client contracts during the first three quarters of the year and decreased demand within the public sector.
Gross profit margin was flat in 2017 compared to 2016 as the increase in our higher-margin ManpowerGroup Solutions business and increase in our permanent recruitment business was offset by the decline in our staffing/interim margin, primarily as a result of business mix changes. In 2016, gross profit margin increased due primarily to the increases in our staffing/interim margin because of the 7S Group GmbH ("7S") acquisition in Germany in the third quarter of 2015. The organic gross profit margin decreased due to business mix changes, as higher growth came from our lower-margin clients and markets, and general pricing pressures in several markets, partially offset by the organic constant currency increase in our permanent recruitment business.
Selling and administrative expenses increased 9.3% (9.2% in constant currency; 8.0% in organic constant currency) in 2017 compared to 2016 due primarily to $23.8 million of restructuring costs incurred in 2017 primarily related to severance costs incurred in connection with the further integration of 7S in Germany, branch and back-office optimization in the United Kingdom and management and back-office optimization along with the integration of an Experis acquisition in the Netherlands. Excluding the restructuring costs, selling and administrative expenses increased 5.9% (5.5% in constant currency; 4.2% in organic constant currency), primarily due to an increase in organic salary-related expenses as a result of higher headcount in certain countries to support the increase in revenues, the pension curtailment and favorable lease termination gains of $8.1 million in 2016 that did not recur in 2017, the additional recurring selling and administrative costs incurred as a result of the acquisitions in the Nordics and the Netherlands and an increase in consulting costs primarily related to certain technology projects and back-office and delivery-model optimization activities. In 2016, selling and administrative expenses increased 1.1% (5.2% in constant currency; -3.2% in organic constant currency) compared to 2015 due to the additional recurring
35
selling and administrative costs incurred as a result of the acquisitions in Germany, the Netherlands, Norway and Belgium. The organic constant currency decrease in selling and administrative expenses in 2016 was due primarily to the pension curtailment and favorable lease termination gains recognized in 2016, restructuring costs of $9.0 million incurred in 2015 that did not recur in 2016, and the decrease in organic salary-related costs and non-personnel related costs as a result of these restructuring actions taken in 2015.
OUP margin for Northern Europe was 2.7%, 3.4% and 2.9% in 2017, 2016 and 2015, respectively. The decrease in 2017 was primarily due to the restructuring costs incurred in 2017, the pension curtailment and favorable lease termination gains in 2016 that did not recur in 2017 and the increase in consulting costs. The OUP margin increased in 2016 primarily due to the increase in the gross profit margin, the pension curtailment and favorable lease termination gains, and the restructuring costs in 2015.
APME
Revenues from services increased 6.7% (6.4% in constant currency; 6.1% in organic constant currency) in 2017 compared to 2016. In Japan (which represents 33% of APME’s revenues), revenues from services increased 1.0% (4.4% in constant currency) due to the increase in our staffing/interim business and a 10.7% increase (14.5% in constant currency) in our permanent recruitment business. In Australia (which represents 21% of APME’s revenues), revenue from services decreased 1.0% in constant currency (increase of 2.1% as reported) due to the decrease in demand for our Manpower staffing services in constant currency as we saw a slowing of new business and the unfavorable impact of one fewer billing day, partially offset by a 7.2% increase in constant currency (10.7% as reported) in our permanent recruitment business. The revenue increase in the remaining markets in APME is due to increased demand for our Manpower staffing services, mostly in Greater China, India, Singapore and Thailand, and growth in our ManpowerGroup Solutions and permanent recruitment businesses.
In 2016, revenues from services for APME increased 10.4% (8.1% in constant currency and 5.8% in organic constant currency) compared to 2015. In Japan and Australia, revenues from services increased 15.0% and 10.0%, respectively (3.1% and 11.1%, respectively, in constant currency; 0.5% in organic constant currency in Australia). The increase in Japan was due to the increase in our Manpower staffing services, partially offset by a decrease in our ManpowerGroup Solutions business. The organic constant currency increase in Australia was due to the increase in our ManpowerGroup Solutions business and stable demand for our Experis interim services, even though there are still challenges in the resources and energy related sectors within this economy, offset by a decrease in demand for our Manpower staffing services due to challenging economic conditions impacting various industrial sectors. The revenue increase in the remaining markets in APME was due to an increase in our Manpower staffing service revenues, primarily in Korea, India, Hong Kong, Taiwan and the Philippines, and growth in our ManpowerGroup Solutions and permanent recruitment businesses.
Gross profit margin increased in 2017 compared to 2016 due to an increase in our permanent recruitment business of 12.1% (10.8% in constant currency) and growth in our higher-margin ManpowerGroup Solutions business, partially offset by a decrease in our staffing/interim margins as a result of direct cost increases in certain markets and changes in business mix. In 2016, gross profit margin decreased compared to 2015 due to the decrease in our staffing/interim margins as a result of direct cost increases in certain markets and changes in business mix, partially offset by an increase of 6.0% in our permanent recruitment business (7.0% in constant currency; 5.2% in organic constant currency) and growth in our higher-margin ManpowerGroup Solutions business.
Selling and administrative expenses increased 6.0% (5.9% in constant currency; 5.5% in organic constant currency) in 2017 compared to 2016. The increase is primarily due to the increase in salary-related costs because of higher headcount to support the increases in revenues and due to $1.4 million of restructuring costs incurred in Australia in 2017 related to branch and back-office optimization. In 2016, selling and administrative expenses increased 7.3% (5.3% in constant currency and 3.3% in organic constant currency) compared to 2015. The increase was due to the increase in organic salary-related costs because of higher headcount to support the organic constant currency increase in revenues and additional recurring selling and administrative costs incurred as a result of acquisitions, partially offset by restructuring costs of $2.9 million incurred in 2015 that did not recur in 2016.
OUP margin for APME was 3.8%, 3.6% and 3.5% in 2017, 2016 and 2015, respectively. The OUP margin increased in 2017 due to the increase in our gross profit margin and better operational leverage, because we were
36
able to support an increase in revenues without a similar increase in expenses, partially offset by the restructuring costs incurred in 2017. The OUP margin increase in 2016 was due to good expense management and improved operational leverage, as we were able to support an increase in revenues without a similar increase in expenses, partially offset by a decline in our gross profit margin.
Right Management
In 2017, revenues from services for Right Management decreased 15.8% (-15.6% in constant currency). The decrease was primarily due to the decrease of 15.3% (-14.9% in constant currency) in our outplacement services as we experienced softer demand in many of our markets due to the counter-cyclical nature of this business and the non-recurrence of certain client activity within the United States. Our talent management business decreased 17.6% (-18.0% in constant currency) in 2017 compared to 2016 mostly due to softening demand in our Asian markets.
In 2016, revenues from services decreased 5.4% (-3.4% in constant currency). The decrease was primarily due to the 21.2% decrease (-19.5% in constant currency) in our talent management business compared to 2015 due to softening demand in all of our markets. Our outplacement services increased 1.1% (3.2% in constant currency) in 2016 compared to 2015 due mostly to growth in our Americas markets, primarily driven by strong sales execution in the United States and opportunities in the energy sector through the first half of the year, partially offset by softer demand in the second half of 2016.
Gross profit margin decreased in 2017 compared to 2016 due to decreases in both our outplacement and talent management business gross profit margins. In 2016, gross profit margin decreased due to a decrease in both the outplacement and talent management business gross profit margins, partially offset by the change in business mix as the higher-margin outplacement business represented a greater percentage of the revenue mix.
In 2017, selling and administrative expenses decreased 15.4% (-15.1% in constant currency) compared to 2016 due to reduced compensation-related expenses such as salaries and variable-incentive costs due to lower headcount and a decrease in office-related costs related to a decrease in the number of offices. These items were partially offset by $2.0 million of restructuring costs incurred in 2017 related to delivery model optimization activities. In 2016, selling and administrative expenses decreased 13.5% (-11.9% in constant currency) compared to 2015 due to the cost savings from more efficient delivery solutions and restructuring costs of $1.3 million incurred in 2015 that did not recur in 2016.
OUP margin for Right Management was 16.5%, 17.3% and 14.0% for 2017, 2016 and 2015, respectively. The OUP margin for 2017 decreased due to the decline in our gross profit margin and the restructuring costs incurred in 2017. The OUP margin for 2016 increased due primarily to improved operational leverage, partially offset by the decline in the gross profit margin.
37
Financial Measures
Constant Currency And Organic Constant Currency Reconciliation
Certain constant currency and organic constant currency percent variances are discussed throughout this report. A reconciliation of these Non-GAAP percent variances to the percent variances calculated based on our annual GAAP financial results is provided below. (See Constant Currency and Organic Constant Currency on page 25 for information.)
Amounts represent 2017 Percentages represent 2017 compared to 2016 | Reported Amount (in millions) | Reported Variance | Impact of Currency | Variance in Constant Currency | Impact of Acquisitions (in Constant Currency) | Organic Constant Currency Variance | |||||||
Revenues from Services | |||||||||||||
Americas: | |||||||||||||
United States | $ | 2,659.0 | (6.3 | )% | — | % | (6.3 | )% | — | % | (6.3 | )% | |
Other Americas | 1,557.4 | 6.6 | (0.5 | ) | 7.1 | — | 7.1 | ||||||
4,216.4 | (1.9 | ) | (0.2 | ) | (1.7 | ) | — | (1.7 | ) | ||||
Southern Europe: | |||||||||||||
France | 5,477.2 | 13.2 | 2.6 | 10.6 | — | 10.6 | |||||||
Italy | 1,475.9 | 26.4 | 3.1 | 23.3 | — | 23.3 | |||||||
Other Southern Europe | 1,703.9 | 14.2 | 3.4 | 10.8 | 2.6 | 8.2 | |||||||
8,657.0 | 15.5 | 2.8 | 12.7 | 0.6 | 12.1 | ||||||||
Northern Europe | 5,306.4 | 3.5 | 0.1 | 3.4 | 0.8 | 2.6 | |||||||
APME | 2,636.4 | 6.7 | 0.3 | 6.4 | 0.3 | 6.1 | |||||||
Right Management | 218.1 | (15.8 | ) | (0.2 | ) | (15.6 | ) | — | (15.6 | ) | |||
ManpowerGroup | $ | 21,034.3 | 7.0 | % | 1.0 | % | 6.0 | % | 0.5 | % | 5.5 | % | |
Gross Profit - ManpowerGroup | $ | 3,484.6 | 4.5 | % | 0.9 | % | 3.6 | % | 0.5 | % | 3.1 | % | |
Operating Unit Profit | |||||||||||||
Americas: | |||||||||||||
United States | $ | 152.5 | 6.7 | % | — | % | 6.7 | % | — | % | 6.7 | % | |
Other Americas | 61.2 | 14.1 | (0.6 | ) | 14.7 | — | 14.7 | ||||||
213.7 | 8.7 | (0.2 | ) | 8.9 | — | 8.9 | |||||||
Southern Europe: | |||||||||||||
France | 278.0 | 10.9 | 2.8 | 8.1 | — | 8.1 | |||||||
Italy | 104.5 | 32.1 | 3.5 | 28.6 | — | 28.6 | |||||||
Other Southern Europe | 59.4 | 26.0 | 3.1 | 22.9 | 5.2 | 17.7 | |||||||
441.9 | 17.2 | 3.0 | 14.2 | 0.6 | 13.6 | ||||||||
Northern Europe | 140.7 | (18.7 | ) | 1.9 | (20.6 | ) | (1.8 | ) | (18.8 | ) | |||
APME | 98.9 | 11.8 | (0.1 | ) | 11.9 | 1.2 | 10.7 | ||||||
Right Management | 36.0 | (19.4 | ) | 0.3 | (19.7 | ) | — | (19.7 | ) | ||||
Operating Profit — ManpowerGroup | $ | 788.2 | 5.0 | % | 1.9 | % | 3.1 | % | (0.2 | )% | 3.3 | % | |
38
Amounts represent 2016 Percentages represent 2016 compared to 2015 | Reported Amount (in millions) | Reported Variance | Impact of Currency | Variance in Constant Currency | Impact of Acquisitions (in Constant Currency) | Organic Constant Currency Variance | |||||||
Revenues from Services | |||||||||||||
Americas: | |||||||||||||
United States | $ | 2,836.8 | (5.6 | )% | — | % | (5.6 | )% | 0.7 | % | (6.3 | )% | |
Other Americas | 1,460.4 | (1.7 | ) | (15.8 | ) | 14.1 | 4.5 | 9.6 | |||||
4,297.2 | (4.3 | ) | (5.2 | ) | 0.9 | 2.0 | (1.1 | ) | |||||
Southern Europe: | |||||||||||||
France | 4,837.4 | 3.8 | (0.2 | ) | 4.0 | — | 4.0 | ||||||
Italy | 1,167.7 | (4.8 | ) | (0.3 | ) | (4.5 | ) | — | (4.5 | ) | |||
Other Southern Europe | 1,492.5 | 6.3 | (0.2 | ) | 6.5 | — | 6.5 | ||||||
7,497.6 | 2.8 | (0.2 | ) | 3.0 | — | 3.0 | |||||||
Northern Europe | 5,129.1 | 1.9 | (5.4 | ) | 7.3 | 6.1 | 1.2 | ||||||
APME | 2,471.3 | 10.4 | 2.3 | 8.1 | 2.3 | 5.8 | |||||||
Right Management | 258.9 | (5.4 | ) | (2.0 | ) | (3.4 | ) | — | (3.4 | ) | |||
ManpowerGroup | $ | 19,654.1 | 1.7 | % | (2.4 | )% | 4.1 | % | 2.3 | % | 1.8 | % | |
Gross Profit — ManpowerGroup | $ | 3,333.8 | 1.2 | % | (2.1 | )% | 3.3 | % | 2.9 | % | 0.4 | % | |
Operating Unit Profit | |||||||||||||
Americas: | |||||||||||||
United States | $ | 142.9 | (0.7 | )% | — | % | (0.7 | )% | 2.1 | % | (2.8 | )% | |
Other Americas | 53.6 | (5.9 | ) | (16.3 | ) | 10.4 | 7.7 | 2.7 | |||||
196.5 | (2.1 | ) | (4.6 | ) | 2.5 | 3.8 | (1.3 | ) | |||||
Southern Europe: | |||||||||||||
France | 250.6 | (3.2 | ) | (0.1 | ) | (3.1 | ) | — | (3.1 | ) | |||
Italy | 79.1 | 11.6 | — | 11.6 | — | 11.6 | |||||||
Other Southern Europe | 47.2 | 18.4 | 0.1 | 18.3 | (0.6 | ) | 18.9 | ||||||
376.9 | 2.0 | — | 2.0 | (0.1 | ) | 2.1 | |||||||
Northern Europe | 173.0 | 19.6 | (5.8 | ) | 25.4 | 7.7 | 17.7 | ||||||
APME | 88.5 | 11.5 | 2.4 | 9.1 | 1.8 | 7.3 | |||||||
Right Management | 44.7 | 16.7 | (2.1 | ) | 18.8 | — | 18.8 | ||||||
Operating Profit — ManpowerGroup | $ | 750.8 | 9.0 | % | (2.4 | )% | 11.4 | % | 2.0 | % | 9.4 | % | |
Cash Sources and Uses
Cash used to fund our operations is primarily generated through operating activities and provided by our existing credit facilities. We believe our available cash and existing credit facilities are sufficient to cover our cash needs for the foreseeable future. We assess and monitor our liquidity and capital resources globally. We use a global cash pooling arrangement, intercompany lending, and some local credit lines to meet funding needs and allocate our capital resources among our various entities. As of December 31, 2017, we had $455.3 million of cash held by foreign subsidiaries. We have historically made and anticipate future cash repatriations to the United States from certain foreign subsidiaries to fund domestic operations. As of December 31, 2017, provisional deferred taxes related to non-United States withholding taxes were provided on $1,746.3 million of unremitted earnings of non-United States subsidiaries that may be remitted to the United States. We have an additional $264.3 million of unremitted earnings of non-United States subsidiaries for which we have not currently provided deferred taxes. As of December 31, 2017 and 2016, we have recorded a deferred tax liability of $5.5 million and $164.8 million, respectively, related to these non-United States earnings that may be remitted. The deferred tax liability decreased as we have no longer provided United States federal income taxes on unremitted earnings of non-United States subsidiaries that are not considered permanently invested.
39
Our principal ongoing cash needs are to finance working capital, capital expenditures, debt payments, interest expense, dividends, share repurchases and acquisitions. Working capital is primarily in the form of trade receivables, which generally increase as revenues increase. The amount of financing necessary to support revenue growth depends on receivables turnover, which differs in each market where we operate.
Cash provided by operating activities was $400.9 million, $600.0 million and $511.5 million for 2017, 2016 and 2015, respectively. Changes in operating assets and liabilities utilized $78.9 million of cash in 2017, as compared to $49.7 million and $116.6 million in 2016 and 2015, respectively. The change in 2017 from 2016 was primarily attributable to an increase in accounts receivable due to the growth in the business and changes in business mix, partially offset by the timing of collections and payments. The change in 2016 from 2015 was primarily attributable to the timing of collections and payments.
The CICE payroll tax credit is creditable against our current French income tax payable, with any remaining amount being paid after three years. Given the amount of our current income taxes payable, we would generally receive the vast majority of the CICE credits after the three-year period. In March 2017, March 2016 and July 2015, we sold a portion of our CICE earned in 2016, 2015 and 2014, respectively, for net proceeds of $143.5 million (€133.0 million), $143.1 million (€129.9 million) and $132.8 million (€120.1 million), respectively. We derecognized these receivables upon the sale as the terms of the agreement are such that the transaction qualifies for sale treatment according to the accounting guidance on the transfer and servicing of assets. The discount on the sale of these receivables was recorded as a reduction of the payroll tax credits earned in the respective years in cost of services.
Accounts receivable increased to $5,370.5 million as of December 31, 2017 from $4,413.1 million as of December 31, 2016. This increase is mostly due to the increase in revenues and a higher Days Sales Outstanding ("DSO"), which was up approximately two days from December 31, 2016 due primarily to the timing of month-end collections. Utilizing exchange rates as of December 31, 2016, the December 31, 2017 balance would have been approximately $420.7 million lower than reported.
Capital expenditures were $54.7 million, $56.9 million and $52.3 million during 2017, 2016 and 2015, respectively. These expenditures were primarily comprised of purchases of computer equipment, office furniture and other costs related to office openings and refurbishments, as well as capitalized software costs of $1.7 million in 2017, $0.9 million in 2016 and $3.4 million in 2015.
From time to time, we acquire and invest in companies throughout the world, including franchises. The total cash consideration paid for acquisitions, net of cash acquired, for the years ended December 31, 2017, 2016 and 2015 was $32.7 million, $57.6 million and $260.5 million, respectively. As of December 31, 2017, goodwill and intangible assets resulting from the 2017 acquisitions were $35.0 million and $13.3 million, respectively, the majority of which took place in India and Hong Kong. In addition, during the year ended December 31, 2017, we made payments of $13.0 million for contingent consideration related to previous acquisitions, including our 2015 acquisition of 7S.
As of December 31, 2016, goodwill and intangible assets resulting from the 2016 acquisitions were $24.4 million and $6.6 million, respectively, the majority of which took place in the Netherlands and Norway. During the year ended December 31, 2016, we made payments of $2.9 million for contingent consideration related to previous acquisitions.
In September 2015, we acquired 7S for total consideration, net of cash acquired, of $140.4 million (€125.3 million) plus contingent consideration of $10.3 million (€9.6 million) paid in the first quarter of 2017 based on the financial results of the company and other factors. In addition, we incurred approximately $3.4 million of transaction costs associated with the acquisition during the year ended December 31, 2015, which have been recorded in selling and administrative expenses. Based primarily in Germany, 7S is a highly specialized provider of human resource services focusing on a number of core sectors including skilled trades, engineering and IT.
Of the $153.0 million (€136.5 million) of net acquired assets from the 7S acquisition, $48.8 million (€43.5 million) was recorded as finite-lived intangible assets, of which $44.2 million (€39.4 million) was assigned to customer relationships and will be amortized over 10 years using the straight line method. The customer relationships were $36.0 million (€34.2 million) and $36.3 million (€30.2 million) as of December 31, 2016 and 2017, respectively. Total amortization expense related to this intangible asset in each of the next five years is $4.8 million. The fair value of $119.1 million (€106.2 million), which was not directly attributable to any specific assets or liabilities, was assigned to goodwill as part of the Germany reporting unit.
40
During the third quarter of 2015, we entered into a joint venture to expand our business in the Greater China region. We contributed a majority of the net assets from our China, Hong Kong, Macau and Taiwan operations and the noncontrolling shareholder contributed cash. The joint venture is included in our Consolidated Balance Sheets as we have a controlling financial interest. The noncontrolling equity interest is included in noncontrolling interests in total shareholders’ equity in our Consolidated Balance Sheets.
Net debt borrowings were $5.2 million for 2017, compared to net repayments of $6.7 million for 2016 and to net borrowings of $456.1 million in 2015. In September 2015, we offered and sold €400.0 million aggregate principal amount of the Company's 1.875% notes due September 11, 2022. (See the "Euro Notes" section below for further information.) We use excess cash to pay down borrowings under facilities when appropriate.
In both July 2016 and October 2015, the Board of Directors authorized the repurchase of 6.0 million shares of our common stock. Share repurchases may be made from time to time through a variety of methods, including open market purchases, block transactions, privately negotiated transactions or similar facilities. In 2017, we repurchased a total of 1.9 million shares at a total cost of $203.9 million under the 2016 authorization. In 2016, we repurchased a total of 6.6 million shares, comprised of 5.3 million shares under the 2015 authorization and 1.3 million shares under the 2016 authorization, at a total cost of $482.2 million. In 2015, we repurchased a total of 6.7 million shares, comprised of 6.0 million shares under a previous authorization and 0.7 million shares under the 2015 authorization, at a total cost of $587.9 million, including a nominal amount of shares at a cost of $7.7 million that settled in January 2016. As of December 31, 2017, there were 2.8 million shares remaining authorized for repurchase under the 2016 authorization and no shares remaining under the 2015 authorization.
We have aggregate commitments of $2,074.5 million related to debt, operating leases, severances and office closure costs, transition tax resulting from the Tax Act and certain other commitments, as follows:
(in millions) | Total | 2018 | 2019–2020 | 2021–2022 | Thereafter | ||||||||||
Long-term debt including interest | $961.4 | $447.8 | $18.0 | $495.6 | $— | ||||||||||
Short-term borrowings | 49.1 | 49.1 | — | — | — | ||||||||||
Operating leases | 632.0 | 167.3 | 216.6 | 123.0 | 125.1 | ||||||||||
Severances and other office closure costs | 13.5 | 12.3 | 0.8 | 0.4 | — | ||||||||||
Transition tax resulting from the Tax Act | 170.2 | 13.8 | 26.9 | 26.7 | 102.8 | ||||||||||
Other | 248.3 | 88.9 | 103.0 | 23.8 | 32.6 | ||||||||||
$2,074.5 | $779.2 | $365.3 | $669.5 | $260.5 | |||||||||||
Our liability for gross unrecognized tax benefits, including related interest and penalties, of $66.5 million is excluded from the commitments above as we cannot determine the years in which these positions might ultimately be settled.
We recorded net restructuring costs of $34.5 million in 2017 in selling and administrative expenses, primarily related to severances and office closures and consolidations in multiple countries. During 2017 and 2016, we made payments of $25.5 million and $11.9 million, respectively, out of our restructuring reserve. We expect a majority of the remaining $13.5 million reserve will be paid by the end of 2018.
We have entered into guarantee contracts and stand-by letters of credit that total approximately $201.9 million and $177.6 million as of December 31, 2017 and 2016, respectively ($149.3 million and $130.7 million for guarantees, respectively, and $52.6 million and $46.9 million for stand-by letters of credit, respectively). Guarantees primarily relate to bank accounts, operating leases and indebtedness. The stand-by letters of credit relate to workers’ compensation, operating leases and indebtedness. If certain conditions were met under these arrangements, we would be required to satisfy our obligation in cash. Due to the nature of these arrangements and our historical experience, we do not expect to make any significant payments under these arrangements. Therefore, they have been excluded from our aggregate commitments identified above. The cost of these guarantees and letters of credit was $1.9 million and $1.7 million in 2017 and 2016, respectively.
Total capitalization as of December 31, 2017 was $3,805.1 million, comprised of $947.5 million in debt and $2,857.6 million in equity. Debt as a percentage of total capitalization was 25% as of both December 31, 2017 and 2016, and 24% as of December 31, 2015.
41
Euro Notes
On September 11, 2015, we offered and sold €400.0 million aggregate principal amount of the Company's 1.875% notes due September 11, 2022 (the "€400.0 million Notes"). The net proceeds from the €400.0 million Notes of €397.4 million were used for general corporate purposes, including share repurchases and the acquisition of an investment in complementary businesses or other assets. The €400.0 million Notes were issued at a price of 99.753% to yield an effective interest rate of 1.913%. Interest on the €400.0 million Notes is payable in arrears on September 11 of each year. We may redeem the €400.0 million Notes, in whole but not in part, at our option at any time for a redemption price determined in accordance with the term of the €400.0 million Notes.
We also have €350.0 million aggregate principal amount 4.50% notes due June 22, 2018 (the “€350.0 million Notes”), which were issued at a price of 99.974% to yield an effective interest rate of 4.505%. Interest on the €350.0 million Notes is payable in arrears on June 22 of each year. We may redeem the €350.0 million Notes, in whole but not in part, at our option at any time for a redemption price determined in accordance with the term of the €350.0 million Notes.
When the €400.0 million Notes and €350.0 million Notes mature, we plan to repay the amounts with available cash, borrowings under our $600.0 million revolving credit facility or a new borrowing. The credit terms, including interest rate and facility fees, of any replacement borrowings will be dependent upon the condition of the credit markets at that time. We currently do not anticipate any problems accessing the credit markets should we decide to replace either the €400.0 million Notes or the €350.0 million Notes.
Both the €400.0 million Notes and €350.0 million Notes contain certain customary non-financial restrictive covenants and events of default and are unsecured senior obligations and rank equally with all of our existing and future senior unsecured debt and other liabilities. A portion of these notes has been designated as a hedge of our net investment in our foreign subsidiaries with a Euro-functional currency as of December 31, 2017. For this portion of the Euro-denominated notes, since our net investment in these subsidiaries exceeds the respective amount of the designated borrowings, both net of taxes, the related translation gains or losses are included as a component of accumulated other comprehensive loss. (See the Significant Matters Affecting Results of Operations section and Notes 7 and 12 to the Consolidated Financial Statements found in Item 8. "Financial Statements and Supplementary Data" for further information.)
Revolving Credit Agreement
We have a Five Year Credit Agreement (the “Credit Agreement”) with a syndicate of commercial banks with a termination date of September 16, 2020. The Credit Agreement allows for borrowing of $600.0 million in various currencies, and up to $150.0 million may be used for the issuance of stand-by letters of credit. We had no borrowings but had $0.8 million of outstanding letters of credit issued under the Credit Agreement as of both December 31, 2017 and 2016. Additional borrowings of $599.2 million were available to us under the facility as of both December 31, 2017 and 2016.
Under the Credit Agreement, a credit ratings-based pricing grid determines the facility fee and the credit spread that we add to the applicable interbank borrowing rate on all borrowings. At our current credit rating, the annual facility fee is 12.5 basis points paid on the entire facility and the credit spread is 100.0 basis points on any borrowings. A downgrade from both credit agencies would unfavorably impact our facility fees and result in additional costs ranging from approximately $0.2 million to $0.8 million annually.
The Credit Agreement contains customary restrictive covenants pertaining to our management and operations, including limitations on the amount of subsidiary debt that we may incur and limitations on our ability to pledge assets, as well as financial covenants requiring, among other things, that we comply with a leverage ratio (Net Debt-to-Net Earnings before interest and other expenses, provision for income taxes, intangible asset amortization expense, depreciation and amortization expense ("EBITDA")) of not greater than 3.5 to 1 and a fixed charge coverage ratio of not less than 1.5 to 1. The Credit Agreement also contains customary events of default, including, among others, payment defaults, material inaccuracy of representations and warranties, covenant defaults, bankruptcy or involuntary proceedings, certain monetary and non-monetary judgments, change of control and customary ERISA defaults.
42
As defined in the Credit Agreement, we had a net Debt-to-EBITDA ratio of 0.73 to 1 (compared to the maximum allowable ratio of 3.5 to 1) and a Fixed Charge Coverage ratio of 5.22 to 1 (compared to the minimum required ratio of 1.5 to 1) as of December 31, 2017.
Other
In addition to the previously mentioned facilities, we maintain separate bank credit lines with financial institutions to meet working capital needs of our subsidiary operations. As of December 31, 2017, such uncommitted credit lines totaled $324.1 million, of which $274.4 million was unused. Under the Credit Agreement, total subsidiary borrowings cannot exceed $300.0 million in the first, second and fourth quarters, and $600.0 million in the third quarter of each year. Due to these limitations, additional borrowings of $250.3 million could have been made under these lines as of December 31, 2017.
Our long-term debt has a rating of Baa1 from Moody's Investor Services and BBB from Standard and Poor's, both with a stable outlook. Both of the credit ratings are investment grade. Rating agencies use proprietary methodology in determining their ratings and outlook which includes, among other things, financial ratios based upon debt levels and earnings performance.
Application of Critical Accounting Policies
The preparation of our financial statements in conformity with accounting principles generally accepted in the United States requires us to make estimates and assumptions that affect the reported amounts. A discussion of the more significant estimates follows. Management has discussed the development, selection and disclosure of these estimates and assumptions with the Audit Committee of our Board of Directors.
Employment-Related Items
The employment of contingent workers and permanent staff throughout the world results in the recognition of liabilities related to defined benefit pension plans, social program remittances and payroll tax audit exposures that require us to make estimates and assumptions in determining the proper reserve levels. These reserves involve significant estimates or judgments that are material to our financial statements.
Defined Benefit Pension Plans
We sponsor several qualified and nonqualified pension plans covering permanent employees. The most significant plans are located in the United Kingdom, the Netherlands, Germany and France. Annual expense relating to these plans is currently recorded in selling and administrative expenses and was $11.2 million, $3.4 million and $11.4 million in 2017, 2016 and 2015, respectively, and is estimated to be approximately $13.4 million in 2018. Based on new accounting guidance effective January 1, 2018, we will start to record non-service cost components of net benefit cost in interest and other expenses and will reclassify a cost of $1.0 million and a credit of $5.3 million from selling and administrative expenses to interest and other expenses for 2017 and 2016, respectively. (See Note 1 to the Consolidated Financial Statements found in Item 8. "Financial Statements and Supplementary Data" for further information.) The lower expense in 2016 resulted mainly from a $6.9 million curtailment and settlement gain as we terminated a defined benefit plan in Northern Europe and transitioned our employees to a defined contribution plan effective July 1, 2016.
The calculations of annual pension expense and the pension liability required at year-end include various actuarial assumptions such as discount rates, expected rate of return on plan assets, compensation increases and employee turnover rates. We review the actuarial assumptions on an annual basis and make modifications to the assumptions as necessary. We review market data and historical rates, on a country-by-country basis, to check for reasonableness in setting both the discount rate and the expected return on plan assets. We determine the discount rate based on an index of high-quality corporate bond yields and matched-funding yield curve analysis as of the end of each fiscal year. The expected return on plan assets is determined based on the expected returns of the various investment asset classes held in the plans. We estimate compensation increases and employee turnover rates for each plan based on the historical rates and the expected future rates for each respective country. Changes to any of these assumptions will impact the level of annual expense recorded related to the plans.
In determining the estimated 2018 pension expense for non-United States plans, we used a weighted-average discount rate of 2.1% compared to 2.2% for 2017, reflecting the current interest rate environment. We have
43
selected a weighted-average expected return on plan assets of 2.6% for the non-United States plans in determining the 2018 estimated pension expense compared to 2.8% used for the calculation of the 2017 pension expense. Absent any other changes, a 25 basis point change in the weighted-average discount rate and the weighted-average expected return on plan assets would impact the 2018 consolidated pension expense by approximately $1.0 million and $0.9 million, respectively. Changes to these assumptions have historically not been significant in any jurisdiction for any reporting period, and no significant adjustments to the amounts recorded have been required in the past or are expected in the future. (See Note 8 to the Consolidated Financial Statements found in Item 8. "Financial Statements and Supplementary Data" for further information.)
Social Program Remittances and Payroll Tax Audit Exposure
On a routine basis, various governmental agencies in some of the countries and territories in which we operate audit our payroll tax calculations and our compliance with other payroll-related regulations. These audits focus primarily on documentation requirements and our support for our payroll tax remittances. Due to the nature of our business, the number of people that we employ, and the complexity of some payroll tax regulations, we may have some adjustments to the payroll tax remittances as a result of these audits.
We make an estimate of the additional remittances that may be required on a country-by-country basis, and record the estimate as a component of cost of services or selling and administrative expenses, as appropriate. Each country’s estimate is based on the results of past audits and the number of years that have not yet been audited, with consideration for changing business volumes and changes to the payroll tax regulations. To the extent that our actual experience differs from our estimates, we will need to make adjustments to our reserve balance, which will impact the results of the related operation and the operating segment in which it is reported. Other than France, we have not had any significant adjustments to the amounts recorded as a result of any payroll tax audits, and we do not expect any significant adjustments to the recorded amounts in the near term.
Income Taxes
We account for income taxes in accordance with the accounting guidance on income taxes. Deferred tax assets and liabilities are recognized for the future tax consequences attributable to differences between financial statement carrying amounts of existing assets and liabilities and their respective tax basis, and net operating loss and tax credit carryforwards. Deferred tax assets and liabilities are measured using enacted tax rates expected to apply to taxable income in the years in which those temporary differences are expected to be recovered or settled. We record a valuation allowance against deferred tax assets for which utilization of the asset is not likely.
The accounting guidance related to uncertain tax positions requires an evaluation process for all tax positions taken that involves a review of probability for sustaining a tax position. If the probability for sustaining a tax position is more likely than not, which is a 50% threshold, then the tax position is warranted and the largest amount, based on cumulative probability, that is greater than 50% likely of being realized upon settlement is recognized. An uncertain tax position, one which does not meet the 50% threshold, will not be recognized in the financial statements.
Our judgment is required in determining our deferred tax assets and liabilities and any valuation allowances recorded. Our net deferred tax assets may need to be adjusted in the event that tax rates are modified, or our estimates of future taxable income change, such that deferred tax assets or liabilities are expected to be recovered or settled at a different tax rate than currently estimated. In addition, valuation allowances may need to be adjusted in the event that our estimates of future taxable income change. We have unrecognized tax benefits related to items in various countries and territories. To the extent these items are settled for an amount different than we currently expect, the unrecognized tax benefit will be adjusted.
We provide for income taxes on a quarterly basis based on an estimated annual tax rate. In determining this rate, we make estimates about taxable income for each of our largest locations worldwide, as well as the tax rate that will be in effect for each location. To the extent these estimates change during the year, or actual results differ from these estimates, our estimated annual tax rate may change between quarterly periods and may differ from the actual effective tax rate for the year.
On December 22, 2017, the United States enacted the Tax Act, which made broad changes to the tax code including a reduction of the United States federal corporate income tax rate from 35% to 21% effective January 1,
44
2018 as well as a transition to a Territorial Tax regime. As part of this transition, a tax was imposed on our unremitted post-1986 non-United States earnings. We have currently estimated and recorded this transition tax at $170.2 million, which is a provisional estimate of the amount due and may change as additional guidance becomes available. The tax is payable in installments over eight years beginning April 2018 with 8 percent of the liability due in each of the first five years, 15 percent due in year six, 20 percent due in year seven and the remaining 25 percent due in year eight.
We have analyzed the new Global Intangible Low-Taxed Income (“GILTI”) tax regime created as part of the Tax Act. Under GILTI, income earned after December 31, 2017 by certain non-United States subsidiaries must be included currently in the gross income of the United States parent company. Because of the complexity of the new GILTI tax rules and lack of guidance as to how to calculate the tax, we are continuing to evaluate this provision of the Tax Act and its impact on us. In accordance with accounting guidance on income taxes, we are allowed to make an accounting policy choice of either (1) treating taxes due on future inclusions in taxable income related to GILTI as a current-period expense (the “period cost method”) or (2) considering such amounts into a company’s measurement of its deferred taxes (the “deferred method”). When additional guidance is available, we will make a policy decision regarding whether to record deferred taxes on GILTI.
The Tax Act contains additional, prospective provisions including the Base Erosion Anti-abuse Tax (“BEAT”) and a Foreign Derived Intangible Income (“FDII”) tax benefit. BEAT requires companies to determine its United States federal tax liability without regard to deductions for certain payments to non-United States affiliates. FDII provides a potential benefit via a preferential deduction on certain license and service fee income earned from non-United States operations. BEAT and FDII did not have any impact on our 2017 results. We will continue to evaluate the prospective tax rate impact of BEAT and FDII as further guidance is provided by United States authorities.
French tax reform was also enacted at the end of December 2017, which will gradually reduce the French corporate income tax rate from the current 33.3%, without surtax, to 25% in 2022. We have reduced the value of our French deferred tax assets to recognize the lower realization of future tax deductions.
See Note 5 to our Consolidated Financial Statements for further information on the impacts of the Tax Act and French tax reform. Such note is found in Item 8. “Financial Statements and Supplementary Data.”
Goodwill Impairment
In accordance with the accounting guidance on goodwill, we perform an annual impairment test of goodwill at our reporting unit level during the third quarter, or more frequently if events or circumstances change that would more likely than not reduce the fair value of our reporting units below their carrying value.
We performed our annual impairment test of our goodwill during the third quarter of 2017, 2016 and 2015, and there was no impairment of our goodwill as a result of our annual tests.
Significant assumptions used in our annual goodwill impairment test during the third quarter of 2017 included: expected future revenue growth rates, operating unit profit margins, working capital levels, discount rates ranging from 10.1% to 13.3%, and a terminal value multiple. The expected future revenue growth rates and operating unit profit margins were determined after taking into consideration our historical revenue growth rates and operating unit profit margins, our assessment of future market potential, and our expectations of future business performance.
The table below provides our reporting units’ estimated fair values and carrying values, determined as part of our annual goodwill impairment test performed in the third quarter, representing approximately 77% of our consolidated goodwill balance as of September 30, 2017.
(in millions) | France | United States | United Kingdom | Germany | Right Management | Netherlands | ||||||||||||
Estimated fair values | $2,480.0 | $1,113.8 | $377.1 | $335.8 | $293.2 | $217.8 | ||||||||||||
Carrying values | 966.1 | 630.7 | 303.9 | 258.5 | 125.1 | 146.6 | ||||||||||||
45
Item 7A. Quantitative and Qualitative Disclosures about Market Risk
Significant Matters Affecting Results of Operations
Market Risks
We are exposed to the impact of foreign currency exchange rate fluctuations and interest rate changes.
Exchange Rates
Our exposure to foreign currency exchange rates relates primarily to our foreign subsidiaries and our Euro-denominated borrowings. For our foreign subsidiaries, exchange rates impact the United States dollar value of our reported earnings, our investments in the subsidiaries and the intercompany transactions with the subsidiaries.
Approximately 87% of our revenues and profits are generated outside of the United States, with 50% generated from our European operations with a Euro-functional currency. As a result, fluctuations in the value of foreign currencies against the United States dollar, particularly the Euro, may have a significant impact on our reported results. Revenues and expenses denominated in foreign currencies are translated into United States dollars at the average exchange rates each month. Consequently, as the value of the United States dollar changes relative to the currencies of our major markets, our reported results vary.
The United States dollar generally weakened against many of the currencies of our major markets during 2017, whereas it generally strengthened during 2016. Revenues from services in constant currency were 1.0% lower and 2.4% higher than reported revenues in 2017 and 2016, respectively. A change in the strength of the United States dollar by an additional 10% would have impacted our revenues from services by approximately 8.7% and 8.5% from the amounts reported in 2017 and 2016, respectively.
Fluctuations in currency exchange rates also impact the United States dollar amount of our shareholders’ equity. The assets and liabilities of our non-United States subsidiaries are translated into United States dollars at the exchange rates in effect at year-end. The resulting translation adjustments are recorded in shareholders’ equity as a component of accumulated other comprehensive loss. The United States dollar weakened relative to many foreign currencies as of December 31, 2017 compared to December 31, 2016. Consequently, shareholders’ equity increased by $141.6 million as a result of the foreign currency translation as of December 31, 2017. If the United States dollar had strengthened an additional 10% as of December 31, 2017, resulting translation adjustments recorded in shareholders’ equity would have increased by approximately $136.2 million from the amounts reported.
As of December 31, 2016, the United States dollar strengthened relative to many foreign currencies compared to December 31, 2015. Consequently, shareholders’ equity decreased by $123.3 million as a result of the foreign currency translation as of December 31, 2016. If the United States dollar had strengthened an additional 10% as of December 31, 2016, resulting translation adjustments recorded in shareholders’ equity would have decreased by approximately $250.0 million from the amounts reported.
Although currency fluctuations impact our reported results and shareholders’ equity, such fluctuations generally do not affect our cash flow or result in actual economic gains or losses. Substantially all of our subsidiaries derive revenues and incur expenses within a single country and, consequently, do not generally incur currency risks in connection with the conduct of their normal business operations. We generally have few cross-border transfers of funds, except for transfers to the United States for payment of license fees and interest expense on intercompany loans, working capital loans made between the United States and our foreign subsidiaries, dividends from our foreign subsidiaries, and payments between certain countries and territories for services provided. To reduce the currency risk related to these transactions, we may borrow funds in the relevant foreign currency under our revolving credit agreement or we may enter into a forward contract to hedge the transfer.
On occasion, forward contracts are designated as an economic hedge of our net investment in our foreign subsidiaries. As of December 31, 2017, we had a translation loss of $4.2 million included in accumulated other comprehensive loss, net of taxes, as the net investment hedge was deemed effective.
46
As of December 31, 2017, there were £2.9 ($3.9) million of forward contracts that relate to cash flows owed to our foreign subsidiaries in 2018. For our forward contracts that are not designated as hedges, any gain or loss resulting from the change in fair value is recognized in the current period earnings.
As of December 31, 2017, we had outstanding $897.8 million in principal amount of Euro-denominated notes (€750.0 million). A portion of the notes has been designated as a hedge of our net investment in subsidiaries with a Euro-functional currency as of December 31, 2017. For this portion of the Euro-denominated notes, since our net investment in these subsidiaries exceeds the respective amount of the designated borrowings, both net of tax, the related translation gains or losses are included as a component of accumulated other comprehensive loss. Shareholders’ equity decreased by $64.7 million, net of tax, due to changes in accumulated other comprehensive loss during 2017 due to the currency impact on these designated borrowings.
Interest Rates
Our exposure to market risk for changes in interest rates relates primarily to our variable rate long-term debt obligations. We have historically managed interest rates through the use of a combination of fixed- and variable-rate borrowings. As of December 31, 2017, we had the following fixed- and variable-rate borrowings:
(in millions) | Amount | Weighted- Average Interest Rate(1) | |||
Variable-rate borrowings | $49.1 | 7.9 | % | ||
Fixed-rate borrowings | 898.4 | 3.1 | |||
Total debt | $947.5 | 3.4 | % | ||
(1) The rates are impacted by currency exchange rate movements.
Sensitivity Analysis
The following tables summarize our debt and derivative instruments that are sensitive to foreign currency exchange rate and interest rate movements. All computations below are based on the United States dollar spot rate as of December 31, 2017 and 2016. The exchange rate computations assume a 10% appreciation or 10% depreciation of the Euro, British pound, and Argentine Peso to the United States dollar.
The hypothetical impact on 2017 and 2016 net earnings and total other comprehensive (loss) income of the stated change in rates is as follows:
2017 (in millions) | Movements in Exchange Rates | |||||||
Market Sensitive Instrument | 10% Depreciation | 10% Appreciation | ||||||
Euro Notes: | ||||||||
€400.0, 1.91% Notes due September 2022 | $48.0 | (1) | ($48.0 | ) | (1) | |||
€350.0, 4.51% Notes due June 2018 | 42.0 | (1) | (42.0 | ) | (1) | |||
Forward contracts: | ||||||||
£2.9 to $3.9 | (0.4 | ) | 0.4 | |||||
47
2016 (in millions) | Movements in Exchange Rates | |||||||
Market Sensitive Instrument | 10% Depreciation | 10% Appreciation | ||||||
Euro Notes: | ||||||||
€400.0, 1.91% Notes due September 2022 | $42.1 | (1) | ($42.1 | ) | (1) | |||
€350.0, 4.51% Notes due June 2018 | 36.8 | (1) | (36.8 | ) | (1) | |||
Forward contracts: | ||||||||
£4.0 to $5.0 | 0.5 | (0.5 | ) | |||||
ARS 10,500.0 to $0.6 | (0.1 | ) | 0.1 | |||||
(1) Exchange rate movements are recorded through accumulated other comprehensive loss as these instruments have been designated as an economic hedge of our net investment in subsidiaries with a Euro-functional currency.
The hypothetical (increases)/decreases in the fair value of our market sensitive instruments due to changes in our Euro Notes' quoted prices and changes in foreign currency exchange rates for the forward contracts are as follows:
As of December 31, 2017 Market Sensitive Instrument (in millions) | 10% Decrease | 10% Increase | ||||||
Euro Notes: | ||||||||
€400.0, 1.91% Notes due September 2022 | $51.0 | (1) | ($51.0 | ) | (1) | |||
€350.0, 4.51% Notes due June 2018 | 43.0 | (1) | (43.0 | ) | (1) | |||
Forward contracts: | ||||||||
£2.9 to $3.9 | (0.4 | ) | 0.4 | |||||
As of December 31, 2016 Market Sensitive Instrument (in millions) | 10% Decrease | 10% Increase | ||||||
Euro Notes: | ||||||||
€400.0, 1.91% Notes due September 2022 | $44.0 | (1) | ($44.0 | ) | (1) | |||
€350.0, 4.51% Notes due June 2018 | 39.2 | (1) | (39.2 | ) | (1) | |||
Forward contracts: | ||||||||
£4.0 to $5.0 | 0.5 | (0.5 | ) | |||||
ARS 10,500.0 to $0.6 | (0.1 | ) | 0.1 | |||||
(1) This (increase)/decrease in fair value is not recorded in the Consolidated Financial Statements; however, disclosure of the fair value is included in Note 1 to the Consolidated Financial Statements found in Item 8. "Financial Statements and Supplementary Data."
Impact of Economic Conditions
One of the principal attractions of using workforce solutions and service providers is to maintain a flexible supply of labor to meet changing economic conditions. Therefore, the industry has been and remains sensitive to economic cycles. To help minimize the effects of these economic cycles, we offer clients a continuum of services to meet their needs throughout the business cycle. We believe that the breadth of our operations and the diversity of our service mix cushion us against the impact of an adverse economic cycle in any single country or industry. However, adverse economic conditions in any of our largest markets, or in several markets simultaneously, would have a material impact on our consolidated financial results.
Recently Issued Accounting Standards
See Note 1 to the Consolidated Financial Statements found in Item 8. "Financial Statements and Supplementary Data."
48
Item 8. Financial Statements and Supplementary Data
Page Number | ||
Index to Consolidated Financial Statements: | ||
Report of Independent Registered Public Accounting Firm | ||
Consolidated Statements of Operations for the years ended December 31, 2017, 2016 and 2015 | ||
Consolidated Statements of Comprehensive Income for the years ended December 31, 2017, 2016 and 2015 | ||
Consolidated Balance Sheets as of December 31, 2017 and 2016 | ||
Consolidated Statements of Cash Flows for the years ended December 31, 2017, 2016 and 2015 | ||
Consolidated Statements of Shareholders’ Equity for the years ended December 31, 2017, 2016 and 2015 | ||
Notes to Consolidated Financial Statements | ||
49
Report of Independent Registered Public Accounting Firm
To the Board of Directors and Shareholders of ManpowerGroup Inc.
Opinion on Internal Control over Financial Reporting
We have audited the internal control over financial reporting of ManpowerGroup Inc. and subsidiaries (the "Company") as of December 31, 2017, based on criteria established in Internal Control - Integrated Framework (2013) issued by the Committee of Sponsoring Organizations of the Treadway Commission (COSO). In our opinion, the Company maintained, in all material respects, effective internal control over financial reporting as of December 31, 2017, based on the criteria established in Internal Control - Integrated Framework (2013) issued by COSO.
We have also audited, in accordance with the standards of the Public Company Accounting Oversight Board (United States) (PCAOB), the consolidated financial statements as of and for the year ended December 31, 2017 of the Company and our report dated February 23, 2018 expressed an unqualified opinion on those consolidated financial statements.
Basis for Opinion
The Company's management is responsible for maintaining effective internal control over financial reporting and for its assessment of the effectiveness of internal control over financial reporting, included in the accompanying Management Report on Internal Control over Financial Reporting. Our responsibility is to express an opinion on the Company's internal control over financial reporting based on our audit. We are a public accounting firm registered with the PCAOB and are required to be independent with respect to the Company in accordance with the U.S. federal securities laws and the applicable rules and regulations of the Securities and Exchange Commission and the PCAOB.
We conducted our audit in accordance with the standards of the PCAOB. Those standards require that we plan and perform the audit to obtain reasonable assurance about whether effective internal control over financial reporting was maintained in all material respects. Our audit included obtaining an understanding of internal control over financial reporting, assessing the risk that a material weakness exists, testing and evaluating the design and operating effectiveness of internal control based on the assessed risk, and performing such other procedures as we considered necessary in the circumstances. We believe that our audit provides a reasonable basis for our opinion.
Definition and Limitations of Internal Control over Financial Reporting
A company's internal control over financial reporting is a process designed to provide reasonable assurance regarding the reliability of financial reporting and the preparation of financial statements for external purposes in accordance with generally accepted accounting principles. A company's internal control over financial reporting includes those policies and procedures that (1) pertain to the maintenance of records that, in reasonable detail, accurately and fairly reflect the transactions and dispositions of the assets of the company; (2) provide reasonable assurance that transactions are recorded as necessary to permit preparation of financial statements in accordance with generally accepted accounting principles, and that receipts and expenditures of the company are being made only in accordance with authorizations of management and directors of the company; and (3) provide reasonable assurance regarding prevention or timely detection of unauthorized acquisition, use, or disposition of the company's assets that could have a material effect on the financial statements.
Because of its inherent limitations, internal control over financial reporting, may not prevent or detect misstatements. Also, projections of any evaluation of the effectiveness to future periods are subject to the risk that the controls may become inadequate because of changes in conditions, or that the degree of compliance with the policies or procedures may deteriorate.
/s/ Deloitte & Touche LLP
Milwaukee, Wisconsin
February 23, 2018
50
Report of Independent Registered Public Accounting Firm
To the Board of Directors and Shareholders of ManpowerGroup Inc.
Opinion on the Financial Statements
We have audited the accompanying consolidated balance sheets of ManpowerGroup Inc. and subsidiaries (the “Company”) as of December 31, 2017 and 2016, and the related consolidated statements of operations, comprehensive income, shareholders’ equity, and cash flows for each of the three years in the period ended December 31, 2017, and the related notes and the schedule listed in the Index at Item 15(a)(2) (collectively referred to as the “financial statements”). In our opinion, the financial statements present fairly, in all material respects, the financial position of the Company as of December 31, 2017 and 2016, and the results of its operations and its cash flows for each of the three years in the period ended December 31, 2017, in conformity with accounting principles generally accepted in the United States of America.
We have also audited, in accordance with the standards of the Public Company Accounting Oversight Board (United States) (PCAOB), the Company’s internal control over financial reporting as of December 31, 2017, based on criteria established in Internal Control - Integrated Framework (2013) issued by the Committee of Sponsoring Organizations of the Treadway Commission and our report dated February 23, 2018 expressed an unqualified opinion on the Company’s internal control over financial reporting.
Basis for Opinion
These financial statements are the responsibility of the Company's management. Our responsibility is to express an opinion on the Company's financial statements based on our audits. We are a public accounting firm registered with the PCAOB and are required to be independent with respect to the Company in accordance with the U.S. federal securities laws and the applicable rules and regulations of the Securities and Exchange Commission and the PCAOB.
We conducted our audits in accordance with the standards of the PCAOB. Those standards require that we plan and perform the audit to obtain reasonable assurance about whether the financial statements are free of material misstatement, whether due to error or fraud. Our audits included performing procedures to assess the risk of material misstatement of the financial statements whether due to error or fraud, and performing procedures that respond to those risks. Such procedures included examining, on a test basis, evidence regarding the amounts and disclosures in the financial statements. Our audits also included evaluating the accounting principles used and significant estimates made by management, as well as evaluating the overall presentation of the financial statements. We believe that our audits provide a reasonable basis for our opinion.
/s/ Deloitte & Touche LLP
Milwaukee, Wisconsin
February 23, 2018
We have served as the Company's auditor since 2005.
51
CONSOLIDATED STATEMENTS OF OPERATIONS
in millions, except per share data
Year Ended December 31 | 2017 | 2016 | 2015 | ||||||
Revenues from services | $ | 21,034.3 | $ | 19,654.1 | $ | 19,329.9 | |||
Cost of services | 17,549.7 | 16,320.3 | 16,034.1 | ||||||
Gross profit | 3,484.6 | 3,333.8 | 3,295.8 | ||||||
Selling and administrative expenses | 2,696.4 | 2,583.0 | 2,606.9 | ||||||
Operating profit | 788.2 | 750.8 | 688.9 | ||||||
Interest and other expenses | 50.9 | 49.5 | 28.2 | ||||||
Earnings before income taxes | 737.3 | 701.3 | 660.7 | ||||||
Provision for income taxes | 191.9 | 257.6 | 241.5 | ||||||
Net earnings | $ | 545.4 | $ | 443.7 | $ | 419.2 | |||
Net earnings per share — basic | $ | 8.13 | $ | 6.33 | $ | 5.46 | |||
Net earnings per share — diluted | $ | 8.04 | $ | 6.27 | $ | 5.40 | |||
Weighted average shares — basic | 67.1 | 70.1 | 76.8 | ||||||
Weighted average shares — diluted | 67.9 | 70.8 | 77.7 | ||||||
The accompanying Notes to Consolidated Financial Statements are an integral part of these statements.
CONSOLIDATED STATEMENTS OF COMPREHENSIVE INCOME
in millions
Year Ended December 31 | 2017 | 2016 | 2015 | ||||||
Net earnings | $ | 545.4 | $ | 443.7 | $ | 419.2 | |||
Other comprehensive income (loss): | |||||||||
Foreign currency translation | 201.4 | (79.9 | ) | (182.8 | ) | ||||
Translation adjustments on net investment hedge, net of income taxes of $(34.3), $8.4 and $19.2, respectively | (64.7 | ) | 14.8 | 34.5 | |||||
Translation adjustments on long-term intercompany loans | 4.9 | (58.2 | ) | (2.1 | ) | ||||
Unrealized (loss) gain on investments, net of income taxes of $(0.8), $0.4 and $0.1, respectively | (3.3 | ) | 1.6 | 0.3 | |||||
Defined benefit pension plans and retiree health care plan, net of income taxes of $(0.1), $(5.8) and $7.8, respectively | (0.4 | ) | (18.4 | ) | 19.3 | ||||
Total other comprehensive income (loss) | $ | 137.9 | $ | (140.1 | ) | $ | (130.8 | ) | |
Comprehensive income | $ | 683.3 | $ | 303.6 | $ | 288.4 | |||
The accompanying Notes to Consolidated Financial Statements are an integral part of these statements.
52
CONSOLIDATED BALANCE SHEETS
in millions, except share and per share data
December 31 | 2017 | 2016 | ||||
ASSETS | ||||||
Current Assets | ||||||
Cash and cash equivalents | $ | 689.0 | $ | 598.5 | ||
Accounts receivable, less allowance for doubtful accounts of $110.8 and $98.2, respectively | 5,370.5 | 4,413.1 | ||||
Prepaid expenses and other assets | 111.7 | 121.3 | ||||
Total current assets | 6,171.2 | 5,132.9 | ||||
Other Assets | ||||||
Goodwill | 1,343.0 | 1,239.9 | ||||
Intangible assets, less accumulated amortization of $339.9 and $299.8, respectively | 284.0 | 294.4 | ||||
Other assets | 927.7 | 759.7 | ||||
Total other assets | 2,554.7 | 2,294.0 | ||||
Property and Equipment | ||||||
Land, buildings, leasehold improvements and equipment | 633.4 | 567.0 | ||||
Less: accumulated depreciation and amortization | 475.7 | 419.7 | ||||
Net property and equipment | 157.7 | 147.3 | ||||
Total assets | $ | 8,883.6 | $ | 7,574.2 | ||
LIABILITIES AND SHAREHOLDERS' EQUITY | ||||||
Current Liabilities | ||||||
Accounts payable | $ | 2,279.4 | $ | 1,914.4 | ||
Employee compensation payable | 230.6 | 208.1 | ||||
Accrued liabilities | 490.9 | 398.6 | ||||
Accrued payroll taxes and insurance | 794.7 | 649.2 | ||||
Value added taxes payable | 545.4 | 448.7 | ||||
Short-term borrowings and current maturities of long-term debt | 469.4 | 39.8 | ||||
Total current liabilities | 4,810.4 | 3,658.8 | ||||
Other liabilities | ||||||
Long-term debt | 478.1 | 785.6 | ||||
Other long-term liabilities | 737.5 | 683.4 | ||||
Total other liabilities | 1,215.6 | 1,469.0 | ||||
Shareholders’ Equity | ||||||
Preferred stock, $.01 par value, authorized 25,000,000 shares, none issued | — | — | ||||
Common stock, $.01 par value, authorized 125,000,000 shares, issued 116,303,729 and 115,115,748 shares, respectively | 1.2 | 1.2 | ||||
Capital in excess of par value | 3,302.6 | 3,227.2 | ||||
Retained earnings | 2,713.0 | 2,291.3 | ||||
Accumulated other comprehensive loss | (288.2 | ) | (426.1 | ) | ||
Treasury stock at cost, 50,226,525 and 48,146,658 shares, respectively | (2,953.7 | ) | (2,731.7 | ) | ||
Total ManpowerGroup shareholders' equity | 2,774.9 | 2,361.9 | ||||
Noncontrolling interests | 82.7 | 84.5 | ||||
Total shareholders’ equity | 2,857.6 | 2,446.4 | ||||
Total liabilities and shareholders’ equity | $ | 8,883.6 | $ | 7,574.2 | ||
The accompanying Notes to Consolidated Financial Statements are an integral part of these statements.
53
CONSOLIDATED STATEMENTS OF CASH FLOWS
in millions
Year Ended December 31 | 2017 | 2016 | 2015 | ||||||
Cash Flows from Operating Activities | |||||||||
Net earnings | $ | 545.4 | $ | 443.7 | $ | 419.2 | |||
Adjustments to reconcile net earnings to net cash provided by operating activities: | |||||||||
Depreciation and amortization | 84.4 | 85.3 | 77.7 | ||||||
Deferred income taxes | (196.8 | ) | 74.0 | 91.2 | |||||
Provision for doubtful accounts | 18.1 | 20.4 | 16.3 | ||||||
Share-based compensation | 28.7 | 27.1 | 31.1 | ||||||
Excess tax benefit on exercise of share-based awards | — | (0.8 | ) | (7.4 | ) | ||||
Change in operating assets and liabilities, excluding the impact of acquisitions: | |||||||||
Accounts receivable | (544.9 | ) | (317.2 | ) | (369.8 | ) | |||
Other assets | (68.6 | ) | (75.3 | ) | (59.7 | ) | |||
Other liabilities | 534.6 | 342.8 | 312.9 | ||||||
Cash provided by operating activities | 400.9 | 600.0 | 511.5 | ||||||
Cash Flows from Investing Activities | |||||||||
Capital expenditures | (54.7 | ) | (56.9 | ) | (52.3 | ) | |||
Acquisitions of businesses, net of cash acquired | (32.7 | ) | (57.6 | ) | (260.5 | ) | |||
Proceeds from the sale of investments, property and equipment | 12.9 | 4.1 | 14.7 | ||||||
Cash used in investing activities | (74.5 | ) | (110.4 | ) | (298.1 | ) | |||
Cash Flows from Financing Activities | |||||||||
Net change in short-term borrowings | 5.5 | (0.3 | ) | 4.1 | |||||
Proceeds from long-term debt | 0.1 | — | 454.0 | ||||||
Repayments of long-term debt | (0.4 | ) | (6.4 | ) | (2.0 | ) | |||
Payments for debt issuance costs | — | — | (2.5 | ) | |||||
Payments of contingent consideration for acquisitions | (13.0 | ) | (2.9 | ) | — | ||||
Proceeds from share-based awards and other equity transactions | 44.2 | 18.0 | 104.1 | ||||||
Payments to noncontrolling interests | (10.0 | ) | — | — | |||||
Other share-based award transactions | (18.1 | ) | (5.4 | ) | (0.7 | ) | |||
Repurchases of common stock | (203.9 | ) | (482.2 | ) | (580.2 | ) | |||
Dividends paid | (123.7 | ) | (118.4 | ) | (121.0 | ) | |||
Cash used in financing activities | (319.3 | ) | (597.6 | ) | (144.2 | ) | |||
Effect of exchange rate changes on cash | 83.4 | (24.0 | ) | (37.9 | ) | ||||
Net increase (decrease) in cash and cash equivalents | 90.5 | (132.0 | ) | 31.3 | |||||
Cash and cash equivalents, beginning of year | 598.5 | 730.5 | 699.2 | ||||||
Cash and cash equivalents, end of year | $ | 689.0 | $ | 598.5 | $ | 730.5 | |||
Supplemental Cash Flow Information | |||||||||
Interest paid | $ | 37.0 | $ | 36.6 | $ | 32.2 | |||
Income taxes paid, net | $ | 127.1 | $ | 163.9 | $ | 75.9 | |||
The accompanying Notes to Consolidated Financial Statements are an integral part of these statements.
54
CONSOLIDATED STATEMENTS OF SHAREHOLDERS’ EQUITY
in millions, except share and per share data
ManpowerGroup Shareholders | Non- controlling Interests | ||||||||||||||||||||||||
Common Stock | Capital in Excess of Par Value | Retained Earnings | Accumulated Other Comprehensive (Loss) Income | Treasury Stock | Total | ||||||||||||||||||||
Shares Issued | Par Value | ||||||||||||||||||||||||
Balance, January 1, 2015 | 112,876,552 | $ | 1.1 | $ | 3,084.2 | $ | 1,667.8 | $ | (155.2 | ) | $ | (1,654.9 | ) | $ | — | $ | 2,943.0 | ||||||||
Net earnings | 419.2 | 419.2 | |||||||||||||||||||||||
Other comprehensive loss | (130.8 | ) | (130.8 | ) | |||||||||||||||||||||
Issuances under equity plans, including tax benefits | 1,628,376 | 0.1 | 77.5 | (8.1 | ) | 69.5 | |||||||||||||||||||
Share-based compensation expense | 31.1 | 31.1 | |||||||||||||||||||||||
Dividends ($1.60 per share) | (121.0 | ) | (121.0 | ) | |||||||||||||||||||||
Repurchases of common stock | (580.2 | ) | (580.2 | ) | |||||||||||||||||||||
Contribution from a noncontrolling interest and other noncontrolling interest transactions | (6.1 | ) | 67.8 | 61.7 | |||||||||||||||||||||
Balance, December 31, 2015 | 114,504,928 | 1.2 | 3,186.7 | 1,966.0 | (286.0 | ) | (2,243.2 | ) | 67.8 | 2,692.5 | |||||||||||||||
Net earnings | 443.7 | 443.7 | |||||||||||||||||||||||
Other comprehensive loss | (140.1 | ) | (140.1 | ) | |||||||||||||||||||||
Issuances under equity plans, including tax benefits | 610,820 | 20.5 | (6.3 | ) | 14.2 | ||||||||||||||||||||
Share-based compensation expense | 27.1 | 27.1 | |||||||||||||||||||||||
Dividends ($1.72 per share) | (118.4 | ) | (118.4 | ) | |||||||||||||||||||||
Repurchases of common stock | (482.2 | ) | (482.2 | ) | |||||||||||||||||||||
Noncontrolling interest transactions | (7.1 | ) | 16.7 | 9.6 | |||||||||||||||||||||
Balance, December 31, 2016 | 115,115,748 | 1.2 | 3,227.2 | 2,291.3 | (426.1 | ) | (2,731.7 | ) | 84.5 | 2,446.4 | |||||||||||||||
Net earnings | 545.4 | 545.4 | |||||||||||||||||||||||
Other comprehensive income | 137.9 | 137.9 | |||||||||||||||||||||||
Issuances under equity plans | 1,187,981 | 44.2 | (18.1 | ) | 26.1 | ||||||||||||||||||||
Share-based compensation expense | 28.7 | 28.7 | |||||||||||||||||||||||
Dividends ($1.86 per share) | (123.7 | ) | (123.7 | ) | |||||||||||||||||||||
Repurchases of common stock | (203.9 | ) | (203.9 | ) | |||||||||||||||||||||
Noncontrolling interest transactions | 2.5 | (1.8 | ) | 0.7 | |||||||||||||||||||||
Balance, December 31, 2017 | 116,303,729 | $ | 1.2 | $ | 3,302.6 | $ | 2,713.0 | $ | (288.2 | ) | $ | (2,953.7 | ) | $ | 82.7 | $ | 2,857.6 | ||||||||
The accompanying Notes to Consolidated Financial Statements are an integral part of these statements.
55
NOTES TO CONSOLIDATED FINANCIAL STATEMENTS
in millions, except share and per share data
(1) Summary of Significant Accounting Policies
Nature of Operations
ManpowerGroup Inc. is a world leader in the innovative workforce solutions and services industry. Our global network of nearly 2,700 offices in 80 countries and territories allows us to meet the needs of our global, multinational and local clients across all major industry segments. Our largest operations, based on revenues, are located in France, the United States, the United Kingdom and Italy. We specialize in permanent, temporary and contract recruitment and assessment; training and development; outsourcing; career management and workforce consulting services. We provide services to a wide variety of clients, none of which individually comprise a significant portion of revenues for us as a whole.
Use of Estimates
The preparation of financial statements in conformity with accounting principles generally accepted in the United States requires us to make estimates and assumptions that affect the reported amounts of assets and liabilities and disclosure of contingent assets and liabilities at the date of the financial statements and the reported amounts of revenues and expenses for the reporting period. Actual results could differ from these estimates.
Basis of Consolidation
The Consolidated Financial Statements include our operating results and the operating results of all of our majority-owned subsidiaries and entities in which we have a controlling financial interest. We have a controlling financial interest if we own a majority of the outstanding voting common stock and the noncontrolling shareholders do not have substantive participating rights, or we have significant control over an entity through contractual or economic interests in which we are the primary beneficiary. For subsidiaries in which we have an ownership interest of 50% or less, but more than 20%, the Consolidated Financial Statements reflect our ownership share of those earnings using the equity method of accounting. These investments, as well as certain other relationships, are also evaluated for consolidation under the accounting guidance on consolidation of variable interest entities. These investments were $158.7 and $145.8 as of December 31, 2017 and 2016, respectively, and are included in other assets in the Consolidated Balance Sheets. Included in shareholders’ equity as of December 31, 2017 and 2016 are $103.9 and $88.9, respectively, of unremitted earnings from investments accounted for using the equity method. All significant intercompany accounts and transactions have been eliminated in consolidation.
Revenues
We generate revenues from sales of services by our company-owned branch operations and from fees earned on sales of services by our franchise operations. Revenues are recognized as services are performed. The majority of our revenues are generated by our recruitment business, where billings are generally negotiated and invoiced on a per-hour basis. Accordingly, as contingent workers are placed, we record revenues based on the hours worked. Permanent recruitment revenues are recorded as placements are made. Provisions for sales allowances, based on historical experience, are recognized at the time the related sale is recognized.
Our franchise agreements generally state that franchise fees are calculated based on a percentage of revenues. We record franchise fee revenues monthly based on the amounts due under the franchise agreements for that month. Franchise fees, which are included in revenues from services, were $23.7, $23.3 and $24.2 for the years ended December 31, 2017, 2016 and 2015, respectively.
In our outplacement business, we recognize revenues from individual programs and for large projects over the estimated period in which services are rendered to candidates. In our consulting business, revenues are recognized upon the performance of the service under the consulting service contract. For performance-based contracts, we defer recognizing revenues until the performance criteria have been met.
56
The amounts billed for outplacement, consulting services and performance-based contracts in excess of the amount recognized as revenues are recorded as deferred revenue and included in accrued liabilities for the current portion and other long-term liabilities for the long-term portion in our Consolidated Balance Sheets. As of December 31, 2017 and 2016, the current portion of deferred revenue was $46.5 and $38.7, respectively, and the long-term portion of deferred revenue was $1.5 and $2.4, respectively.
We record revenues from sales of services and the related direct costs in accordance with the accounting guidance on reporting revenue gross as a principal versus net as an agent. In situations where we act as a principal in the transaction, we report gross revenues and cost of services. When we act as an agent, we report the revenues on a net basis. Amounts billed to clients for out-of-pocket or other cost reimbursements are included in revenues from services, and the related costs are included in cost of services.
Allowance for Doubtful Accounts
We have an allowance for doubtful accounts recorded as an estimate of the accounts receivable balance that may not be collected. This allowance is calculated on an entity-by-entity basis with consideration for historical write-off experience, the current aging of receivables and a specific review for potential bad debts. Items that affect this balance mainly include bad debt expense and the write-off of accounts receivable balances.
Bad debt expense is recorded as selling and administrative expenses in our Consolidated Statements of Operations and was $18.1, $20.4 and $16.3 in 2017, 2016 and 2015, respectively. Factors that would cause this provision to increase primarily relate to increased bankruptcies by our clients and other difficulties collecting amounts billed. On the other hand, an improved write-off experience and aging of receivables would result in a decrease to the provision. Write-offs were $17.6, $16.9 and $20.3 for 2017, 2016 and 2015, respectively.
Advertising Costs
We expense production costs of advertising as they are incurred. Advertising expenses were $26.6, $24.4 and $28.8 in 2017, 2016 and 2015, respectively.
Restructuring Costs
We recorded net restructuring costs of $34.5 in 2017 in selling and administrative expenses, primarily related to severances and office closures and consolidations in multiple countries and territories. During 2017 and 2016, we made payments of $25.5 and $11.9, respectively, out of our restructuring reserve. We expect a majority of the remaining $13.5 reserve will be paid by the end of 2018. Changes in the restructuring liability balances for each reportable segment and Corporate were as follows:
Americas(1) | Southern Europe(2) | Northern Europe | APME | Right Management | Corporate | Total | |||||||||||||||
Balance, January 1, 2016 | $3.5 | $1.7 | $8.5 | $1.7 | $0.8 | $0.2 | $16.4 | ||||||||||||||
Costs paid or utilized | (3.1 | ) | (0.4 | ) | (5.9 | ) | (1.6 | ) | (0.7 | ) | (0.2 | ) | (11.9 | ) | |||||||
Balance, December 31, 2016 | 0.4 | 1.3 | 2.6 | 0.1 | 0.1 | — | 4.5 | ||||||||||||||
Severance costs | 5.8 | — | 15.6 | 0.9 | 1.4 | 1.0 | 24.7 | ||||||||||||||
Office closure costs | 0.5 | — | 8.2 | 0.5 | 0.6 | — | 9.8 | ||||||||||||||
Costs paid or utilized | (5.0 | ) | (0.4 | ) | (16.8 | ) | (1.5 | ) | (0.9 | ) | (0.9 | ) | (25.5 | ) | |||||||
Balance, December 31, 2017 | $1.7 | $0.9 | $9.6 | $— | $1.2 | $0.1 | $13.5 | ||||||||||||||
(1) Balance related to United States was $2.9 as of January 1, 2016. In 2016, United States paid/utilized $2.5, leaving a $0.4 liability as of December 31, 2016. In 2017, United States incurred $3.7 for severance costs and $0.5 for office closure costs and paid/utilized $3.1, leaving a $1.5 liability as of December 31, 2017.
(2) Balance related to France was $1.5 as of January 1, 2016. In 2016, France paid/utilized $0.2, leaving a $1.3 liability as of December 31, 2016. In 2017, France paid/utilized $0.4, leaving a $0.9 liability as of December 31, 2017. Italy had no restructuring reserves recorded as of either January 1, 2016, December 31, 2016 or December 31, 2017.
57
Income Taxes
We account for income taxes in accordance with the accounting guidance on income taxes. Deferred tax assets and liabilities are recognized for the future tax consequences attributable to differences between financial statement carrying amounts of existing assets and liabilities and their respective tax basis, and net operating loss and tax credit carryforwards. Deferred tax assets and liabilities are measured using enacted tax rates expected to apply to taxable income in the years in which those temporary differences are expected to be recovered or settled. We record a valuation allowance against deferred tax assets to reduce the assets to the amounts more likely than not to be realized.
In December 2017, the United States enacted the Tax Cuts and Jobs Act of 2017 (“Tax Act”), and the Securities and Exchange Commission staff issued guidance on accounting for the tax effects of the Tax Act, which allows for a measurement period up to one year from the Tax Act enactment date for companies to complete the accounting. In accordance with the guidance, a company must reflect the income tax effects of those aspects of the Tax Act for which the accounting is complete. To the extent that a company’s accounting for certain income tax effects of the Tax Act is incomplete, but the company is able to determine a reasonable estimate, it must record a provisional estimate in the financial statements. If a company cannot determine a provisional estimate to be included in the financial statements, it should continue to apply current guidance on the basis of the provisions of the tax laws that were in effect immediately before the enactment of the Tax Act. (See Note 5 to our Consolidated Financial Statements for further information on the impacts of the Tax Act.)
Fair Value Measurements
The assets and liabilities measured and recorded at fair value on a recurring basis were as follows:
Fair Value Measurements Using | Fair Value Measurements Using | ||||||||||||||||||||||||
December 31, 2017 | Quoted Prices in Active Markets for Identical Assets (Level 1) | Significant Other Observable Inputs (Level 2) | Significant Unobservable Inputs (Level 3) | December 31, 2016 | Quoted Prices in Active Markets for Identical Assets (Level 1) | Significant Other Observable Inputs (Level 2) | Significant Unobservable Inputs (Level 3) | ||||||||||||||||||
Assets | |||||||||||||||||||||||||
Deferred compensation plan assets | $99.1 | $99.1 | $— | $— | $86.8 | $86.8 | $— | $— | |||||||||||||||||
$99.1 | $99.1 | $— | $— | $86.8 | $86.8 | $— | $— | ||||||||||||||||||
Liabilities | |||||||||||||||||||||||||
Foreign currency forward contracts | $0.1 | $— | $0.1 | $— | $0.2 | $— | $0.2 | $— | |||||||||||||||||
$0.1 | $— | $0.1 | $— | $0.2 | $— | $0.2 | $— | ||||||||||||||||||
We determine the fair value of our deferred compensation plan assets, comprised of publicly traded securities, by using market quotes as of the last day of the period. The fair value of the foreign currency forward contracts is measured at the value from either directly or indirectly observable third parties.
The carrying values of cash and cash equivalents, accounts receivable, accounts payable, and other current assets and liabilities approximate their fair values because of the short-term nature of these instruments. The carrying value of our variable-rate long-term debt approximates fair value. The fair value of the Euro-denominated notes, as observable at commonly quoted intervals (Level 2 inputs), was $939.9 and $831.6 as of December 31, 2017 and 2016, respectively, compared to a carrying value of $897.8 and $785.2, respectively.
58
Goodwill and Other Intangible Assets
We had goodwill, finite-lived intangible assets and indefinite-lived intangible assets as follows:
December 31, 2017 | December 31, 2016 | ||||||||||||||||||||||
Gross | Accumulated Amortization | Net | Gross | Accumulated Amortization | Net | ||||||||||||||||||
Goodwill(1) | $ | 1,343.0 | $ | — | $ | 1,343.0 | $ | 1,239.9 | $ | — | $ | 1,239.9 | |||||||||||
Intangible assets: | |||||||||||||||||||||||
Finite-lived: | |||||||||||||||||||||||
Customer relationships | $ | 453.6 | $ | 325.2 | $ | 128.4 | $ | 426.2 | $ | 287.2 | $ | 139.0 | |||||||||||
Other | 19.3 | 14.7 | 4.6 | 17.2 | 12.6 | 4.6 | |||||||||||||||||
472.9 | 339.9 | 133.0 | 443.4 | 299.8 | 143.6 | ||||||||||||||||||
Indefinite-lived: | |||||||||||||||||||||||
Tradenames(2) | 52.0 | — | 52.0 | 52.0 | — | 52.0 | |||||||||||||||||
Reacquired franchise rights | 99.0 | — | 99.0 | 98.8 | — | 98.8 | |||||||||||||||||
151.0 | — | 151.0 | 150.8 | — | 150.8 | ||||||||||||||||||
Total intangible assets | $ | 623.9 | $ | 339.9 | $ | 284.0 | $ | 594.2 | $ | 299.8 | $ | 294.4 | |||||||||||
(1) Balances were net of accumulated impairment loss of $513.4 as of both December 31, 2017 and 2016.
(2) Balances were net of accumulated impairment loss of $139.5 as of both December 31, 2017 and 2016.
Amortization expense related to intangibles was $34.6, $36.0 and $32.8 in 2017, 2016 and 2015, respectively. Amortization expense expected in each of the next five years related to acquisitions completed as of December 31, 2017 is as follows: 2018 - $34.5, 2019 - $29.7, 2020 - $24.8, 2021 - $13.8 and 2022 - $10.2. The weighted-average useful lives of the customer relationships and other are approximately 13 and 4 years, respectively. The tradenames have been assigned an indefinite life based on our expectation of renewing the tradenames, as required, without material modifications and at a minimal cost, and our expectation of positive cash flows beyond the foreseeable future. The reacquired franchise rights result from our franchise acquisitions in the United States and Canada completed prior to 2009.
In accordance with the accounting guidance on goodwill and other intangible assets, we perform an annual impairment test of goodwill at our reporting unit level and indefinite-lived intangible assets at our unit of account level during the third quarter, or more frequently if events or circumstances change that would more likely than not reduce the fair value of our reporting units below their carrying value. We performed our annual impairment test of our goodwill and indefinite-lived intangible assets during the third quarter of 2017, 2016 and 2015, and determined that there was no impairment of our goodwill or indefinite-lived intangible as a result of our annual tests.
For our goodwill impairment testing procedures, we determined the fair value of each reporting unit generally by utilizing an income approach derived from a discounted cash flow methodology. For certain of our reporting units, a combination of the income approach (weighted 75%) and the market approach (weighted 25%) derived from comparable public companies was utilized. The income approach is developed from management’s forecasted cash flow data. Therefore, it represents an indication of fair market value reflecting management’s internal outlook for the reporting unit. The market approach utilizes the Guideline Public Company Method to quantify the respective reporting unit’s fair value based on revenues and earnings multiples realized by similar public companies. The market approach is more volatile as an indicator of fair value as compared to the income approach. We believe that each approach has its merits. However, in the instances where we have utilized both approaches, we have weighted the income approach more heavily than the market approach because we believe that management’s assumptions generally provide greater insight into the reporting unit’s fair value.
Significant assumptions used in our goodwill impairment tests during 2017, 2016 and 2015 included: expected revenue growth rates, operating unit profit margins, working capital levels, discount rates ranging from 10.1% to 13.3% for 2017, and a terminal value multiple. The expected future revenue growth rates and the expected
59
operating unit profit margins were determined after taking into consideration our historical revenue growth rates and operating unit profit margins, our assessment of future market potential, and our expectations of future business performance.
We would record a goodwill impairment charge by the amount for which a reporting unit's carrying value exceeds its fair value, not to exceed the carrying amount of the goodwill.
Under the current accounting guidance, we are also required to test our indefinite-lived intangible assets for impairment by comparing the fair value of the intangible asset with its carrying value. If the intangible asset’s fair value is less than its carrying value, an impairment loss is recognized for the difference.
Marketable Securities
We account for our marketable security investments in accordance with the accounting guidance on investments in debt and equity securities, and have historically determined that all such investments are classified as available-for-sale. Accordingly, unrealized gains and unrealized losses that are determined to be temporary, net of related income taxes, are included in accumulated other comprehensive loss, which is a separate component of shareholders’ equity. Realized gains and losses, and unrealized losses determined to be other-than-temporary, are recorded in our Consolidated Statements of Operations.
We hold a 49% interest in our Swiss franchise, accounted for under the equity method of accounting, which maintained an investment portfolio with a market value of $234.8 and $207.0 as of December 31, 2017 and 2016, respectively. This portfolio is comprised of a wide variety of European and United States debt and equity securities as well as various professionally-managed funds, all of which are classified as available-for-sale. Our share of net realized gains and losses, and declines in value determined to be other-than-temporary, are included in our Consolidated Statements of Operations. For the years ended December 31, 2017, 2016 and 2015, realized gains totaled $14.7, $2.9 and $2.3, respectively, and realized losses totaled $3.8, $1.0 and $1.1, respectively. Other-than-temporary impairment amounts were net gains of $1.6, $0.3 and $0.2 for 2017, 2016 and 2015, respectively, as previously impaired investments were sold for a gain. Our share of net unrealized gains and unrealized losses that are determined to be temporary related to these investments are included in accumulated other comprehensive loss, with the offsetting amount increasing or decreasing our investment in the franchise.
Capitalized Software for Internal Use
We capitalize purchased software as well as internally developed software. Internal software development costs are capitalized from the time the internal use software is considered probable of completion until the software is ready for use. Business analysis, system evaluation, selection and software maintenance costs are expensed as incurred. Capitalized software costs are amortized using the straight-line method over the estimated useful life of the software which ranges from 3 to 10 years. The net capitalized software balance of $3.5 and $3.2 as of December 31, 2017 and 2016, respectively, is included in other assets in the Consolidated Balance Sheets. Amortization expense related to the capitalized software costs was $1.3, $1.9 and $1.7 for 2017, 2016 and 2015, respectively.
Property and Equipment
A summary of property and equipment as of December 31 is as follows:
2017 | 2016 | |||||
Land | $ | 3.4 | $ | 5.5 | ||
Buildings | 14.5 | 16.2 | ||||
Furniture, fixtures, and autos | 172.3 | 157.6 | ||||
Computer equipment | 137.1 | 117.8 | ||||
Leasehold improvements | 306.1 | 269.9 | ||||
Property and equipment | $ | 633.4 | $ | 567.0 | ||
60
Property and equipment are stated at cost and are depreciated using primarily the straight-line method over the following estimated useful lives: buildings - up to 40 years; furniture, fixtures, autos and computer equipment - 2 to 15 years; leasehold improvements - lesser of life of asset or expected lease term. Expenditures for renewals and betterments are capitalized whereas expenditures for repairs and maintenance are charged to income as incurred. Upon sale or disposition of property and equipment, the difference between the unamortized cost and the proceeds is recorded as either a gain or a loss and is included in our Consolidated Statements of Operations. Long-lived assets are evaluated for impairment in accordance with the provisions of the accounting guidance on the impairment or disposal of long-lived assets.
Derivative Financial Instruments
We account for our derivative instruments in accordance with the accounting guidance on derivative instruments and hedging activities. Derivative instruments are recorded on the balance sheet as either an asset or liability measured at their fair value. If the derivative is designated as a fair value hedge, the changes in the fair value of the derivative and of the hedged item attributable to the hedged risk are recognized in earnings. If the derivative is designated as a cash flow hedge, the effective portions of the changes in the fair value of the derivative are recorded as a component of accumulated other comprehensive loss and recognized in the Consolidated Statements of Operations when the hedged item affects earnings. The ineffective portions of the changes in the fair value of cash flow hedges are recognized in earnings.
Foreign Currency Translation
The financial statements of our non-United States subsidiaries have been translated in accordance with the accounting guidance on foreign currency translation. Under the accounting guidance, asset and liability accounts are translated at the current exchange rates and income statement items are translated at the average exchange rates each month. The resulting translation adjustments are recorded as a component of accumulated other comprehensive loss, which is included in shareholders’ equity.
A portion of our Euro-denominated notes is accounted for as a hedge of our net investment in our subsidiaries with a Euro-functional currency. For this portion of the Euro-denominated notes, since our net investment in these subsidiaries exceeds the amount of the related borrowings, net of tax, the related translation gains or losses are included as a component of accumulated other comprehensive loss.
Shareholders’ Equity
In both July 2016 and October 2015, the Board of Directors authorized the repurchase of 6.0 million shares of our common stock. Share repurchases may be made from time to time through a variety of methods, including open market purchases, block transactions, privately negotiated transactions or similar facilities. In 2017, we repurchased a total of 1.9 million shares at a total cost of $203.9 under the 2016 authorization. In 2016, we repurchased a total of 6.6 million shares, comprised of 5.3 million shares under the 2015 authorization and 1.3 million shares under the 2016 authorization, at a total cost of $482.2. In 2015, we repurchased a total of 6.7 million shares, comprised of 6.0 million shares under a previous authorization and 0.7 million shares under the 2015 authorization, at a total cost of $587.9, including a nominal amount of shares at a cost of $7.7 that settled in January 2016. The share repurchases that settled in January were not reflected in the treasury stock in our Consolidated Balance Sheets as of December 31, 2015. As of December 31, 2017, there were 2.8 million shares remaining authorized for repurchase under the 2016 authorization and no shares remaining under the 2015 authorization.
During 2017, 2016 and 2015, the Board of Directors declared total cash dividends of $1.86, $1.72 and $1.60 per share, respectively, resulting in total dividend payments of $123.7, $118.4 and $121.0, respectively.
Noncontrolling interests, included in total shareholders' equity in our Consolidated Balance Sheets, represent amounts related to majority-owned subsidiaries in which we have a controlling financial interest.
Net earnings attributable to these noncontrolling interests were $6.5, $10.1 and $6.6 for the year ended December 31, 2017, 2016 and 2015, respectively, which were recorded as expenses in interest and other expenses in our Consolidated Statements of Operations.
61
Cash and Cash Equivalents
We consider all highly liquid investments with an original maturity of three months or less when purchased to be cash equivalents.
Payroll Tax Credit
In January 2013, the French government passed legislation, Credit d’Impôt pour la Compétitivité et l’Emploi (“CICE”), that provides payroll tax credits based on a percentage of wages paid to employees receiving less than two-and-a-half times the French minimum wage. The payroll tax credit was equal to 4% of eligible wages in 2013, 6% of eligible wages from 2014 to 2016, and 7% starting in 2017. The CICE payroll tax credit is accounted for as a reduction of our cost of services in the period earned.
The payroll tax credit is creditable against our current French income tax payable, with any remaining amount being paid after three years. Given the amount of our current income taxes payable, we would generally receive the vast majority of these payroll tax credits after the three-year period. In March 2017, March 2016 and July 2015, we entered into an agreement to sell a portion of the credits earned in 2016, 2015 and 2014, respectively, for net proceeds of $143.5 (€133.0), $143.1 (€129.9) and $132.8 (€120.1), respectively. We derecognized these receivables upon the sale as the terms of the agreement are such that the transaction qualifies for sale treatment according to the accounting guidance on the transfer and servicing of assets. The discount on the sale of these receivables was recorded in cost of services as a reduction of the payroll tax credits earned in the respective year.
Recently Issued Accounting Standards
In May 2014, the FASB issued new accounting guidance on revenue from contracts with customers. The core principle of this amendment is that an entity should recognize revenue to depict the transfer of promised goods or services to customers in an amount that reflects the consideration to which the entity expects to be entitled to in exchange for those goods or services. As amended, the new guidance is effective for us in 2018 and can be adopted either retrospectively to each prior reporting period presented or as a cumulative-effect adjustment as of the date of adoption ("modified retrospective approach"). We have completed our adoption plan and analysis of how we currently recognize revenue compared to the accounting treatment required under the new guidance. This plan included a review of client contracts and revenue transactions to determine the impact of the accounting treatment under the new guidance, evaluation of the adoption method, and completion of a rollout plan for the new guidance. We have concluded that the guidance will not have a material impact on our Consolidated Financial Statements or internal controls other than expanded disclosures. We will adopt the new guidance beginning January 1, 2018 and will use the modified retrospective approach.
In January 2016, the FASB issued new accounting guidance on financial instruments. The new guidance requires equity investments (except those accounted for under the equity method of accounting or those that result in consolidation of the investee) to be measured at fair value with changes in fair value recognized in net income. This new guidance impacts the accounting for our Swiss franchise's investment portfolio. Upon adoption in January 2018, we will recognize the cumulative unrealized gains or losses in our retained earnings, and subsequently, we will recognize all the fair value adjustments on the investment portfolio in the current period earnings as opposed to other comprehensive loss. As of December 31, 2017 and 2016, we had an unrecognized gain on investments, net of income taxes, of $15.3 and $18.6, respectively, recorded in accumulated other comprehensive loss.
In February 2016, the FASB issued new accounting guidance on leases. The new guidance requires that a lessee recognize assets and liabilities on the balance sheet for leases with lease terms longer than 12 months. The recognition, measurement and presentation of lease expenses and cash flows by a lessee will depend on its classification as a finance or operating lease. The guidance also includes new disclosure requirements providing information on the amounts recorded in the financial statements. The new guidance is effective for us in 2019. We are currently assessing the impact of the adoption of this guidance on our Consolidated Financial Statements.
In January 2017, the FASB issued new guidance that simplifies the accounting for goodwill impairment. The new guidance removes Step 2 of the current goodwill impairment test, which requires a hypothetical purchase price allocation. A goodwill impairment will now be the amount by which a reporting unit’s carrying value exceeds its fair
62
value, not to exceed the carrying amount of goodwill. All other goodwill impairment guidance will remain largely unchanged. We adopted this guidance effective April 1, 2017, and applied it to our annual impairment test in the third quarter of 2017. Adoption of this guidance had no impact on our Consolidated Financial Statements.
In March 2017, the FASB issued new guidance on the presentation of net periodic pension and postretirement benefit cost ("net benefit cost"). Under current GAAP, net benefit cost is reported as an employee cost within operating income. The amendment requires bifurcation of net benefit cost. The service cost component will be presented with other employee compensation cost in operating income or capitalized in assets in rare circumstances. The other components will be reported separately outside of operations, and will not be eligible for capitalization. The guidance is effective for us in 2018 and will be applied retrospectively. Non-service cost components of net benefit cost, which are to be reclassified to interest and other expenses upon adoption of the new guidance, will be a cost of $1.0 and a credit of $5.3 for 2017 and 2016, respectively.
In May 2017, the FASB issued new guidance on share-based payment awards. The new guidance clarifies when to account for a change to the terms or conditions of a share-based payment award as a modification. Under the new guidance, modification accounting is required only if the fair value, vesting conditions or the classification of the award (as equity or liability) changes as a result of the change in terms or conditions. The guidance is effective for us in 2018. We do not expect the adoption of this guidance to have a material impact on our Consolidated Financial Statements.
In August 2017, the FASB issued new guidance on hedge accounting. The amendments in this guidance include the elimination of the concept of recognizing periodic hedge ineffectiveness for cash flow and net investment hedges, recognition and presentation of changes in the fair value of the hedging instrument, recognition and presentation of components excluded from an entity's hedge effectiveness assessment, addition of the ability to elect to perform subsequent effectiveness assessments qualitatively, and addition of new disclosure requirements. The guidance is effective for us in 2019. We are currently assessing the impact of the adoption of this guidance on our Consolidated Financial Statements.
In February 2018, the FASB issued new guidance on reporting comprehensive income. The new guidance allows a reclassification from accumulated other comprehensive income to retained earnings for stranded tax effects resulting from the Tax Act. The guidance is effective for us in 2019. We are currently assessing the impact of the adoption of this guidance on our Consolidated Financial Statements.
Subsequent Events
We have evaluated events and transactions occurring after the balance sheet date through our filing date and noted no events that are subject to recognition or disclosure.
(2) Acquisitions
From time to time, we acquire and invest in companies throughout the world, including franchises. The total cash consideration paid for acquisitions, net of cash acquired, for the years ended December 31, 2017, 2016 and 2015 was $32.7, $57.6 and $260.5, respectively. As of December 31, 2017, goodwill and intangible assets resulting from the 2017 acquisitions were $35.0 and $13.3, respectively, the majority of which took place in India and Hong Kong. In addition, during the year ended December 31, 2017, we made payments of $13.0 for contingent consideration related to previous acquisitions, including our 2015 acquisition of 7S Group GmbH (“7S”) in Germany. As of December 31, 2016, goodwill and intangible assets resulting from the 2016 acquisitions were $24.4 and $6.6, respectively, the majority of which took place in the Netherlands and Norway. During the year ended December 31, 2016, we made payments of $2.9 for contingent consideration related to previous acquisitions.
In September 2015, we acquired 7S for total consideration, net of cash acquired, of $140.4 (€125.3) plus contingent consideration of $10.3 (€9.6) paid in the first quarter of 2017 based on the financial results of the company and other factors. In addition, we incurred approximately $3.4 of transaction costs associated with the acquisition during the year ended December 31, 2015, which have been recorded in selling and administrative expenses. Based primarily in Germany, 7S is a highly specialized provider of human resource services focusing on a number of core sectors including skilled trades, engineering and IT. Of the $153.0 (€136.5) of net acquired assets from the 7S acquisition, $48.8 (€43.5) was recorded as finite-lived intangible assets, of which $44.2 (€39.4) was assigned to customer relationships and will be amortized over 10 years using the straight line method. The customer relationships were $36.0 (€34.2) and $36.3 (€30.2) as of December 31, 2016 and 2017, respectively. Total amortization expense related to this intangible asset in each of the next five years is $4.8. The fair value of
63
$119.1 (€106.2), which was not directly attributable to any specific assets or liabilities, was assigned to goodwill as part of the Germany reporting unit.
(3) Share-Based Compensation Plans
We account for share-based payments according to the accounting guidance on share-based payments. During 2017, 2016 and 2015, we recognized $28.7, $27.1 and $31.1, respectively, in share-based compensation expense related to stock options, deferred stock, restricted stock and performance share units, all of which is recorded in selling and administrative expenses. Consideration received from share-based awards for 2017, 2016 and 2015 was $44.2, $19.7 and $70.1, respectively.
In January 2017, we adopted the new accounting guidance on share-based payments. This guidance requires all excess tax benefits and tax deficiencies from share-based compensation to be recognized on a prospective basis as income tax expense or benefit in the income statement rather than capital in excess of par value. The guidance also requires the excess tax benefit or deficiency to be classified as an operating activity rather than a financing activity in our Consolidated Statements of Cash Flows. To eliminate diversity in practice, the guidance also requires that cash payments to tax authorities in connection with shares withheld to meet employees' statutory tax withholding requirements are to be included retrospectively, for all periods presented, as financing activities in our Consolidated Statements of Cash Flows, consistent with our methodology. The total income tax benefit recognized related to share-based compensation during 2017, 2016 and 2015 was $23.7, $7.4 and $16.9, respectively. Included in the 2017 amount was an excess tax benefit of $6.2, or $0.09 per share, that would have been recorded in capital in excess of par value prior to the adoption of the new accounting guidance. The excess income tax benefit recognized related to share-based compensation awards, which was recorded in capital in excess of par value in 2016 and 2015 was approximately $0.8 and $7.4, respectively.
We recognize compensation expense on grants of share-based compensation awards on a straight-line basis over the vesting period of each award.
Stock Options
All share-based compensation is granted under the 2011 Equity Incentive Plan of Manpower Inc. (“2011 Plan”). Options and stock appreciation rights are granted at a price not less than 100% of the fair market value of the common stock at the date of grant. Generally, options are granted with a ratable vesting period of up to four years and expire ten years from date of grant. No stock appreciation rights had been granted or were outstanding as of December 31, 2017 or 2016.
64
A summary of stock option activity is as follows:
Shares (000) | Wtd. Avg. Exercise Price Per Share | Wtd. Avg. Remaining Contractual Term (years) | Aggregate Intrinsic Value (in millions) | ||||||
Outstanding, January 1, 2015 | 2,484 | $59 | |||||||
Granted | 147 | 77 | |||||||
Exercised | (1,255 | ) | 56 | $39 | |||||
Expired or cancelled | (104 | ) | 56 | ||||||
Outstanding, December 31, 2015 | 1,272 | $64 | 5.2 | $26 | |||||
Vested or expected to vest, December 31, 2015 | 1,267 | $64 | 5.2 | ||||||
Exercisable, December 31, 2015 | 911 | $62 | 4.0 | $20 | |||||
Outstanding, January 1, 2016 | 1,272 | $64 | |||||||
Granted | 166 | 75 | |||||||
Exercised | (279 | ) | 63 | $5 | |||||
Expired or cancelled | (32 | ) | 67 | ||||||
Outstanding, December 31, 2016 | 1,127 | $66 | 4.9 | $26 | |||||
Vested or expected to vest, December 31, 2016 | 1,122 | $66 | 4.9 | ||||||
Exercisable, December 31, 2016 | 756 | $62 | 3.3 | $20 | |||||
Outstanding, January 1, 2017 | 1,127 | $66 | |||||||
Granted | 145 | 97 | |||||||
Exercised | (680 | ) | 64 | $24 | |||||
Expired or cancelled | (18 | ) | 75 | ||||||
Outstanding, December 31, 2017 | 574 | $77 | 7.1 | $28 | |||||
Vested or expected to vest, December 31, 2017 | 571 | $77 | 7.1 | ||||||
Exercisable, December 31, 2017 | 220 | $65 | 5.3 | $14 | |||||
Options outstanding and exercisable as of December 31, 2017 were as follows:
Options Outstanding | Options Exercisable | |||||||||||
Exercise Price | Shares (000) | Weighted- Average Remaining Contractual Life (years) | Weighted- Average Exercise Price | Shares (000) | Weighted-Average Exercise Price | |||||||
$27-$49 | 35 | 2.8 | $39 | 35 | $39 | |||||||
$50-$59 | 59 | 3.8 | 53 | 59 | 53 | |||||||
$60-$75 | 163 | 7.8 | 75 | 39 | 73 | |||||||
$76-$97 | 317 | 7.8 | 87 | 87 | 78 | |||||||
574 | 7.1 | $77 | 220 | $65 | ||||||||
We have recognized expense of $3.7, $3.0 and $3.2 related to stock options for the years ended December 31, 2017, 2016 and 2015, respectively. The total fair value of options vested during the same periods was $2.3, $2.5 and $3.2, respectively. As of December 31, 2017, total unrecognized compensation cost was approximately $2.3, net of estimated forfeitures, which we expect to recognize over a weighted-average period of approximately 1.2 years.
65
We estimated the fair value of each stock option on the date of grant using the Black-Scholes option pricing model and the following assumptions:
Year Ended December 31 | 2017 | 2016 | 2015 | |||
Average risk-free interest rate | 2.0 | % | 1.4 | % | 1.6 | % |
Expected dividend yield | 2.0 | % | 2.1 | % | 1.5 | % |
Expected volatility | 31.0 | % | 33.0 | % | 32.0 | % |
Expected term (years) | 6.0 | 6.0 | 6.0 | |||
The average risk-free interest rate is based on United States Treasury security rates corresponding to the expected term in effect as of the grant date. The expected dividend yield is based on the expected annual dividend as a percentage of the market value of our common stock as of the grant date. We determined expected volatility using a weighted average of daily historical volatility (weighted 75%) of our stock price over the past five years and implied volatility (weighted 25%) based upon exchange traded options for our common stock. We believe that a blend of historical volatility and implied volatility better reflects future market conditions and better indicates expected volatility than considering purely historical volatility. We determined the expected term of the stock options using historical data. The weighted-average grant-date fair value per option granted during the year was $25.58, $19.68 and $21.66 in 2017, 2016 and 2015, respectively.
Deferred Stock
Our non-employee directors may elect to receive deferred stock in lieu of part or all of their annual cash retainer otherwise payable to them. The number of shares of deferred stock is determined pursuant to a formula set forth in the terms and conditions adopted under the 2011 Plan; the deferred stock is settled in shares of common stock according to these terms and conditions. As of December 31, 2017, 2016 and 2015, there were 43,442, 39,805 and 36,091, respectively, shares of deferred stock awarded under this arrangement, all of which are vested.
Non-employee directors also receive an annual grant of deferred stock (or restricted stock, if they so elect) as additional compensation for board service. The award vests in equal quarterly installments over one year and the vested portion of the deferred stock is settled in shares of common stock either upon a director’s termination of service or three years after the date of grant (which may in most cases be extended at the directors’ election) in accordance with the terms and conditions under the 2011 Plan. As of December 31, 2017, 2016 and 2015, there were 9,857, 8,388 and 7,920, respectively, shares of deferred stock and 9,792, 9,966 and 13,860, respectively, shares of restricted stock granted under this arrangement, all of which are vested except for 1,752 shares of restricted stock granted in 2015 that were cancelled. We recognized expense of $1.4, $1.1 and $0.8 related to deferred stock in 2017, 2016 and 2015, respectively.
Restricted Stock
We grant restricted stock and restricted stock unit awards to certain employees and to non-employee directors who may elect to receive restricted stock rather than deferred stock as described above. Restrictions lapse over periods ranging up to six years, and in some cases upon retirement. We value restricted stock awards at the closing market value of our common stock on the date of grant.
66
A summary of restricted stock activity is as follows:
Shares (000) | Wtd. Avg. Price Per Share | Wtd. Avg. Remaining Contractual Term (years) | Aggregate Intrinsic Value (in millions) | ||||||
Unvested, January 1, 2015 | 463 | $57 | 1.2 | ||||||
Granted | 179 | 76 | |||||||
Vested | (217 | ) | 59 | ||||||
Forfeited | (20 | ) | 60 | ||||||
Unvested, December 31, 2015 | 405 | $64 | 1.3 | ||||||
Granted | 232 | $75 | |||||||
Vested | (172 | ) | 62 | ||||||
Forfeited | (14 | ) | 76 | ||||||
Unvested, December 31, 2016 | 451 | $70 | 1.4 | ||||||
Granted | 167 | $98 | |||||||
Vested | (133 | ) | 79 | ||||||
Forfeited | (37 | ) | 80 | ||||||
Unvested, December 31, 2017 | 448 | $77 | 1.2 | $56 | |||||
During 2017, 2016 and 2015, we recognized $12.3, $13.8 and $9.9, respectively, of expense related to restricted stock awards. As of December 31, 2017, there was approximately $14.3 of total unrecognized compensation cost related to unvested restricted stock, which we expect to recognize over a weighted-average period of approximately 1.9 years.
Performance Share Units
Our 2011 Plan allows us to grant performance share units. We grant performance share units with a performance period ranging from one to three years. Vesting of units occurs at the end of the performance period or after a subsequent holding period, except in the case of termination of employment where the units are forfeited immediately. Upon retirement, a prorated number of units vest depending on the period worked from the grant date to retirement date or in certain cases all of the units vest. In the case of death or disability, the units immediately vest at the Target Award level if the death or disability date is during the performance period, or at the level determined by the performance criteria met during the performance period if the death or disability occurs during the subsequent holding period. The units are settled in shares of our common stock. A payout multiple is applied to the units awarded based on the performance criteria determined by the Executive Compensation and Human Resources Committee of the Board of Directors at the time of grant.
In the event the performance criteria exceeds the Target Award level, an additional number of shares, up to the Outstanding Award level, may be granted. In the event the performance criteria falls below the Target Award level, a reduced number of shares, as low as the Threshold Award level, may be granted. If the performance criteria falls below the Threshold Award level, no shares will be granted.
67
A summary of the performance share units detail by grant year is as follows:
2014 | 2015 | 2016 | 2017 | |||||
Grant Date(s) | February 11, 2014 and May 1, 2014 | February 11, 2015 | February 16, 2016 | February 9, 2017 | ||||
Performance Period (years) | 2014-2016 | 2015-2017 | 2016-2018 | 2017-2019 | ||||
Vesting Date | February 2017 | February 2018(a) | February 2019(a) | February 2020(a) | ||||
Payout Levels (in units): | ||||||||
Threshold Award | 94,608 | 82,298 | 65,141 | 57,563 | ||||
Target Award | 189,215 | 164,595 | 130,282 | 115,125 | ||||
Outstanding Award | 378,430 | 329,190 | 260,564 | 230,250 | ||||
Shares Issued in 2017 | 335,179 | — | — | — | ||||
Payout Achieved Over Performance Period | — | 219,519 | — | — | ||||
(a) 2015, 2016 and 2017 awards are scheduled to vest in February 2018, 2019, and 2020, respectively, when the Executive Compensation and Human Resources Committee of the Board of Directors determines the achievement of the performance criteria.
We recognize and adjust compensation expense based on the likelihood of the performance criteria specified in the award being achieved. The compensation expense is recognized over the performance and holding periods and is recorded in selling and administrative expenses. We have recognized total compensation expense of $10.8, $9.1 and $17.1 in 2017, 2016 and 2015, respectively, related to the performance share units.
Other Stock Plans
Under the 1990 Employee Stock Purchase Plan, designated employees meeting certain service requirements may purchase shares of our common stock through payroll deductions. These shares may be purchased at their fair market value on a monthly basis. The current plan is non-compensatory according to the accounting guidance on share-based payments.
We also maintain the Savings Related Share Option Scheme for United Kingdom employees with at least one year of service. The employees are offered the opportunity to obtain an option for a specified number of shares of common stock at not less than 85% of its market value on the day prior to the offer to participate in the plan. Options vest after either three, five or seven years, but may lapse earlier. Funds used to purchase the shares are accumulated through specified payroll deductions over a 60-month period. We recognized an expense of $0.5 for shares purchased under the plan in 2017, and an expense of $0.1 for shares purchased under the plan in both 2016 and 2015.
(4) Net Earnings Per Share
The calculation of net earnings per share - basic and net earnings per share - diluted were as follows:
Year Ended December 31 | 2017 | 2016 | 2015 | ||||||
Net earnings available to common shareholders: | $545.4 | $443.7 | $419.2 | ||||||
Weighted-average common shares outstanding (in millions): | |||||||||
Weighted-average common shares outstanding - basic | 67.1 | 70.1 | 76.8 | ||||||
Effect of dilutive securities - stock options | 0.2 | 0.2 | 0.5 | ||||||
Effect of other share-based awards | 0.6 | 0.5 | 0.4 | ||||||
Weighted-average common shares outstanding - diluted | 67.9 | 70.8 | 77.7 | ||||||
Net earnings per share - basic | $8.13 | $6.33 | $5.46 | ||||||
Net earnings per share - diluted | $8.04 | $6.27 | $5.40 | ||||||
68
There were no share-based awards excluded from the calculation of net earnings per share - diluted for the year ended December 31, 2017, however there were certain share-based awards excluded for the year ended December 31, 2016 and 2015, respectively, as the exercise prices for these awards were greater than the average market price of the common shares during the period. The number, exercise prices and weighted-average remaining life of these antidilutive awards were as follows:
2017 | 2016 | 2015 | |||||
Shares (in thousands) | — | 20 | 20 | ||||
Exercise price | $— | $93 | $93 | ||||
Weighted-average remaining life | 0.0 years | 0.4 years | 1.4 years | ||||
(5) Income Taxes
On December 22, 2017, the United States enacted the Tax Act, which made broad changes to the tax code including a reduction of the United States federal corporate income tax rate from 35% to 21% effective January 1, 2018 as well as a transition to a Territorial Tax regime.
The key provisions of the Tax Act and their related impacts, which totaled a $77.2 tax benefit, are as follows:
• | The deferred tax liability previously recorded for non-United States earnings that are not permanently invested was reduced with a corresponding benefit to tax expense of $275.8. This is comprised of the deferred tax liability recorded as of December 22, 2017, offset by $5.5 of tax expense related to non-United States withholding tax. The reporting for these amounts is provisional as we continue to evaluate various aspects of the Tax Act and gather additional information on our non-United States earnings. |
• | As part of the transition to a Territorial Tax regime, a tax was imposed on our unremitted post-1986 non-United States earnings. We have currently estimated and recorded this transition tax expense at $170.2, which is a provisional estimate of the amount due and may change as additional guidance becomes available. The tax is payable in installments over eight years beginning April 2018 with 8 percent of the liability due in each of the first five years, 15 percent due in year six, 20 percent due in year seven and the remaining 25 percent due in year eight. In addition to the transition tax, certain foreign tax credit benefits were disallowed resulting in tax expense of $3.8. |
• | The impact of the Tax Act on our deferred tax assets and liabilities balance, excluding the provision for unremitted earnings, was a tax expense of $1.2. The reporting for this amount is provisional as we continue to evaluate the state-level impacts of the Tax Act and other matters. |
• | The Tax Act negatively impacted our prior year unrecognized tax benefits resulting in tax expense of $23.4. The reporting for this amount is complete. |
• | The Tax Act creates a new Global Intangible Low-Taxed Income (“GILTI”) tax regime. Under GILTI, income earned after December 31, 2017 by certain non-United States subsidiaries must be included currently in the gross income of the United States parent company. Because of the complexity of the new GILTI tax rules and lack of guidance as to how to calculate the tax, we are continuing to evaluate this provision of the Tax Act and its impact on us. In accordance with accounting guidance on income taxes, we are allowed to make an accounting policy choice of either (1) treating taxes due on future inclusions in taxable income related to GILTI as a current-period expense (the “period cost method”) or (2) considering such amounts into a company’s measurement of its deferred taxes (the “deferred method”). When additional guidance is available, we will make a policy decision regarding whether to record deferred taxes on GILTI. |
French tax reform was also enacted at the end of December 2017, which will gradually reduce the French corporate income tax rate from the current 33.3%, without surtax, to 25% in 2022. We have reduced the value of our French deferred tax assets to recognize the lower realization of future tax deductions. The tax expense related to this revaluation was $3.5 for 2017.
69
The provision for income taxes was as follows:
Year Ended December 31 | 2017 | 2016 | 2015 | ||||||
Current | |||||||||
United States | |||||||||
Federal | $211.7 | $35.6 | ($8.4 | ) | |||||
State | 8.4 | 4.0 | — | ||||||
Non-United States | 168.6 | 144.0 | 158.7 | ||||||
Total current | 388.7 | 183.6 | 150.3 | ||||||
Deferred | |||||||||
United States | |||||||||
Federal | (178.2 | ) | 69.7 | 92.9 | |||||
State | (0.8 | ) | 0.5 | 1.8 | |||||
Non-United States | (17.8 | ) | 3.8 | (3.5 | ) | ||||
Total deferred | (196.8 | ) | 74.0 | 91.2 | |||||
Total provision | $191.9 | $257.6 | $241.5 | ||||||
Increase in the current United States federal tax expense is due to the transition tax expense resulting from the Tax Act. The change in the deferred United States federal tax benefit is due to the reversal of our deferred tax liability related to non-United States earnings that were deemed to be not permanently invested as a result of the Tax Act.
A reconciliation between taxes computed at the United States federal statutory rate of 35% and the consolidated effective tax rate is as follows:
Year Ended December 31 | 2017 | 2016 | 2015 | ||||||
Income tax based on statutory rate | $258.1 | $245.5 | $231.2 | ||||||
Increase (decrease) resulting from: | |||||||||
Non-United States tax rate difference: | |||||||||
French business tax(1) | 46.9 | 41.0 | 40.0 | ||||||
French CICE(2) | (77.1 | ) | — | — | |||||
Other(2) | (28.6 | ) | (23.5 | ) | (19.6 | ) | |||
Repatriation of non-United States earnings(2)(3) | 69.7 | (10.5 | ) | (16.9 | ) | ||||
State income taxes, net of federal benefit | 1.1 | 2.2 | 2.7 | ||||||
Change in valuation allowance | (6.9 | ) | (6.0 | ) | 3.3 | ||||
United States Tax Act and French tax reform(3) | (73.7 | ) | — | — | |||||
Other, net | 2.4 | 8.9 | 0.8 | ||||||
Tax provision | $191.9 | $257.6 | $241.5 | ||||||
(1) The French business tax is allowed as a deduction for French income tax purposes. The gross amount of the French business tax was $72.1, $63.1 and $61.5 for 2017, 2016 and 2015, respectively. The amounts in the table above of $46.9, $41.0 and $40.0, respectively, represent the French business tax expense net of the French tax benefit.
(2) The French CICE is a payroll tax credit that is tax-free for French tax purposes and increases French earnings. The French tax benefits related to the CICE were $58.9 and $56.2 for 2016 and 2015, respectively. Prior to the Tax Act, this increase in French earnings resulted in a United States tax expense as these French earnings were deemed to be not permanently invested, which is included in Repatriations of non-United States earnings. Included in Other Non-United States tax rate differences are benefits of $2.4, $1.8 and $1.5 for 2017, 2016 and 2015, respectively, that relate to French earnings that are deemed to be permanently invested.
(3) Prior to the enactment of the Tax Act on December 22, 2017, we recorded $83.3 of tax expense in 2017 related to non-United States earnings that were deemed to be not permanently invested. This amount is included in the Repatriation of non-United States earnings consistent with prior years. As a result of the Tax Act, this $83.3 was reversed as we are no longer recording United States federal income tax expense on these earnings, and this tax benefit is included in the United States Tax Act and French tax reform benefit of $73.7.
70
Deferred income taxes are recorded based on temporary differences at the tax rate expected to be in effect when the temporary differences reverse. The Tax Act significantly impacted our deferred income taxes. Temporary differences, which give rise to the deferred taxes, are as follows:
December 31 | 2017 | 2016 | ||||
Future Income Tax Benefits (Expense) | ||||||
Accrued payroll taxes and insurance | $17.3 | $30.6 | ||||
Employee compensation payable | 20.2 | 26.6 | ||||
Pension and postretirement benefits | 49.0 | 60.7 | ||||
Intangible assets | (103.0 | ) | (146.8 | ) | ||
Repatriation of non-United States earnings | (5.5 | ) | (164.8 | ) | ||
Intercompany loans denominated in foreign currencies | (13.5 | ) | (74.2 | ) | ||
Net operating losses | 104.1 | 92.7 | ||||
Other | 77.6 | 120.7 | ||||
Valuation allowance | (77.5 | ) | (86.3 | ) | ||
Total future tax benefits (expense) | $68.7 | ($140.8 | ) | |||
Deferred tax asset | $101.0 | $81.4 | ||||
Deferred tax liability | (32.3 | ) | (222.2 | ) | ||
Total future tax benefits (expense) | $68.7 | ($140.8 | ) | |||
Pre-tax earnings of non-United States operations were $514.9, $482.2 and $511.2 in 2017, 2016 and 2015, respectively. As of December 31, 2017, provisional deferred taxes related to non-United States withholding taxes were provided on $1,746.3 of unremitted earnings of non-United States subsidiaries that may be remitted to the United States. We have an additional $264.3 of unremitted earnings of non-United States subsidiaries for which we have not currently provided deferred taxes. As of December 31, 2017 and 2016, we have recorded a deferred tax liability of $5.5 and $164.8, respectively, related to these non-United States earnings that may be remitted. The deferred tax liability decreased as we have no longer provided United States federal income taxes on unremitted earnings of non-United States subsidiaries that are not considered permanently invested.
We had United States federal and non-United States net operating loss carryforwards and United States state net operating loss carryforwards totaling $401.2 and $198.7, respectively, as of December 31, 2017. The net operating loss carryforwards expire as follows:
United States Federal and Non-United States | United States State | |||||
2018 | $1.5 | $3.0 | ||||
2019 | 6.5 | 4.0 | ||||
2020 | 3.3 | 0.2 | ||||
2021 | 5.3 | 3.8 | ||||
2022 | 3.4 | — | ||||
Thereafter | 25.0 | 187.7 | ||||
No expirations | 356.2 | — | ||||
Total net operating loss carryforwards | $401.2 | $198.7 | ||||
We have recorded a deferred tax asset of $104.1 as of December 31, 2017, for the benefit of these net operating losses. Realization of this asset is dependent on generating sufficient taxable income prior to the expiration of the loss carryforwards. A related valuation allowance of $68.4 has been recorded as of December 31, 2017, as management believes that realization of certain net operating loss carryforwards is unlikely.
71
As of December 31, 2017, we had gross unrecognized tax benefits related to various tax jurisdictions, including interest and penalties, of $66.5 that would favorably affect the effective tax rate if recognized. Our prior year unrecognized tax benefits were negatively impacted by the Tax Act during 2017. We do not expect our unrecognized tax benefits to change significantly over the next year.
As of December 31, 2016, we had gross unrecognized tax benefits related to various tax jurisdictions, including interest and penalties, of $44.0.
We recognize accrued interest and penalties related to unrecognized tax benefits in income tax expense. We accrued net interest and penalties of $0.2, $0.3 and $12.1 in 2017, 2016 and in 2015, respectively.
The following table summarizes the activity related to our unrecognized tax benefits during 2017, 2016 and 2015:
2017 | 2016 | 2015 | |||||||
Gross unrecognized tax benefits, beginning of year | $23.8 | $19.0 | $23.0 | ||||||
Increases in prior year tax positions | 27.1 | 4.1 | 2.3 | ||||||
Decreases in prior year tax positions | (1.2 | ) | (1.7 | ) | (0.5 | ) | |||
Increases for current year tax positions | 6.6 | 4.1 | 3.1 | ||||||
Expiration of statute of limitations and audit settlements | (10.2 | ) | (1.7 | ) | (8.9 | ) | |||
Gross unrecognized tax benefits, end of year | $46.1 | $23.8 | $19.0 | ||||||
Potential interest and penalties | 20.4 | 20.2 | 19.9 | ||||||
Balance, end of year | $66.5 | $44.0 | $38.9 | ||||||
We conduct business globally in various countries and territories. We are routinely audited by the tax authorities of the various tax jurisdictions in which we operate. Generally, the tax years that could be subject to examination are 2010 through 2017 for our major operations in France, Germany, Japan, the United Kingdom and the United States. As of December 31, 2017, we were subject to tax audits in Austria, Canada, Denmark, France, Germany, Italy and the United States. We believe that the resolution of these audits will not have a material impact on earnings.
(6) Goodwill
Changes in the carrying value of goodwill by reportable segment and Corporate were as follows:
Americas(1) | Southern Europe(2) | Northern Europe | APME | Right Management | Corporate(3) | Total(4) | |||||||||||||||
Balance, January 1, 2016 | $ | 515.7 | $ | 97.2 | $ | 441.9 | $ | 75.6 | $ | 62.1 | $ | 64.9 | $ | 1,257.4 | |||||||
Goodwill acquired | — | — | 22.3 | 1.5 | — | 0.6 | 24.4 | ||||||||||||||
Currency impact and other | 0.7 | (0.2 | ) | (42.3 | ) | (0.1 | ) | — | — | (41.9 | ) | ||||||||||
Balance, December 31, 2016 | 516.4 | 97.0 | 421.9 | 77.0 | 62.1 | 65.5 | 1,239.9 | ||||||||||||||
Goodwill acquired | — | 10.0 | 0.1 | 24.9 | — | — | 35.0 | ||||||||||||||
Currency impact and other | 2.8 | 14.9 | 46.1 | 4.3 | — | — | 68.1 | ||||||||||||||
Balance, December 31, 2017 | $ | 519.2 | $ | 121.9 | $ | 468.1 | $ | 106.2 | $ | 62.1 | $ | 65.5 | $ | 1,343.0 | |||||||
(1) Balances related to United States were $476.9, $476.5 and $476.5 as of January 1, 2016, December 31, 2016 and December 31, 2017, respectively.
(2) Balances related to France were $69.0, $66.8 and $76.3 as of January 1, 2016, December 31, 2016 and December 31, 2017, respectively. Balances related to Italy were $4.5, $4.4 and $5.0 as of January 1, 2016, December 31, 2016 and December 31, 2017, respectively.
(3) The majority of the Corporate balance as of December 31, 2017 relates to goodwill attributable to our acquisition of Jefferson Wells ($55.5) which is part of the United States reporting unit. For purposes of monitoring our total assets by segment, we do not allocate the Corporate balance to the respective reportable segments. We do, however, include these balances within the appropriate reporting units for our goodwill impairment testing. See the table below for the breakout of goodwill balances by reporting unit.
(4) Balances were net of accumulated impairment loss of $513.4 as of January 1, 2016, December 31, 2016 and December 31, 2017.
72
Goodwill balances by reporting unit were as follows:
December 31 | 2017 | 2016 | ||||
United States | $532.0 | $532.0 | ||||
Germany | 135.4 | 121.4 | ||||
Netherlands | 126.5 | 110.9 | ||||
United Kingdom | 89.2 | 81.4 | ||||
France | 76.3 | 66.8 | ||||
Right Management | 62.1 | 62.1 | ||||
Other reporting units | 321.5 | 265.3 | ||||
Total goodwill | $1,343.0 | $1,239.9 | ||||
(7) Debt
Information concerning short-term borrowings is as follows:
December 31 | 2017 | 2016 | ||||
Short-term borrowings | $49.1 | $39.5 | ||||
Weighted-average interest rates | 7.9 | % | 11.1 | % | ||
We maintain separate bank credit lines with financial institutions to meet working capital needs of our subsidiary operations. As of December 31, 2017, such uncommitted credit lines totaled $324.1, of which $274.4 was unused. Under our revolving credit agreement, total subsidiary borrowings cannot exceed $300.0 in the first, second and fourth quarters, and $600.0 in the third quarter of each year.
A summary of long-term debt is as follows:
December 31 | 2017 | 2016 | ||||
Euro-denominated notes: | ||||||
€400 due September 2022 | $477.8 | $417.7 | ||||
€350 due June 2018 | 420.0 | 367.5 | ||||
Other | 0.6 | 0.7 | ||||
898.4 | 785.9 | |||||
Less - current maturities | 420.3 | 0.3 | ||||
Long-term debt | $478.1 | $785.6 | ||||
Euro Notes
On September 11, 2015, we offered and sold €400.0 aggregate principal amount of the Company's 1.875% notes due September 11, 2022 (the "€400.0 Notes"). The net proceeds from the €400.0 Notes of €397.4 were used for general corporate purposes, including share repurchases and the acquisition of or investment in complementary businesses or other assets. The €400.0 Notes were issued at a price of 99.753% to yield an effective interest rate of 1.913%. Interest on the €400.0 Notes is payable in arrears on September 11 of each year. We may redeem the €400.0 Notes, in whole but not in part, at our option at any time for a redemption price determined in accordance with the term of the €400.0 Notes.
We also have €350.0 aggregate principal amount 4.50% notes due June 22, 2018 (the “€350.0 Notes”), which were issued at a price of 99.974% to yield an effective interest rate of 4.505%. Interest on the €350.0 Notes is payable in arrears on June 22 of each year. We may redeem the €350.0 Notes, in whole but not in part, at our option at any time for a redemption price determined in accordance with the term of the €350.0 Notes.
73
When the €400.0 Notes and €350.0 Notes mature, we plan to repay the amounts with available cash, borrowings under our $600.0 revolving credit facility or a new borrowing. The credit terms, including interest rate and facility fees, of any replacement borrowings will be dependent upon the condition of the credit markets at that time. We currently do not anticipate any problems accessing the credit markets should we decide to replace either the €400.0 Notes or the €350.0 Notes.
Both the €400.0 Notes and €350.0 Notes contain certain customary non-financial restrictive covenants and events of default and are unsecured senior obligations and rank equally with all of our existing and future senior unsecured debt and other liabilities. A portion of these notes has been designated as a hedge of our net investment in subsidiaries with a Euro-functional currency as of December 31, 2017. For this portion of the Euro-denominated notes, since our net investment in these subsidiaries exceeds the respective amount of the designated borrowings, the related translation gains or losses are included as a component of accumulated other comprehensive loss. (See Note 12 to the Consolidated Financial Statements for further information.)
Revolving Credit Agreement
We have a Five Year Credit Agreement (the “Credit Agreement”) with a syndicate of commercial banks with a termination date of September 16, 2020. The Credit Agreement allows for borrowing of $600.0 in various currencies, and up to $150.0 may be used for the issuance of stand-by letters of credit. We had no borrowings under this facility as of both December 31, 2017 and 2016. Outstanding letters of credit issued under the Credit Agreement totaled $0.8 as of both December 31, 2017 and 2016. Additional borrowings of $599.2 were available to us under the facility as of both December 31, 2017 and 2016.
Under the Credit Agreement, a credit ratings-based pricing grid determines the facility fee and the credit spread that we add to the applicable interbank borrowing rate on all borrowings. At our current credit rating, the annual facility fee is 12.5 basis points paid on the entire facility and the credit spread is 100.0 basis points on any borrowings.
The Credit Agreement contains customary restrictive covenants pertaining to our management and operations, including limitations on the amount of subsidiary debt that we may incur and limitations on our ability to pledge assets, as well as financial covenants requiring, among other things, that we comply with a leverage ratio (Net Debt-to-Net Earnings before interest and other expenses, provision for income taxes, intangible asset amortization expense, depreciation and amortization expense ("EBITDA")) of not greater than 3.5 to 1 and a fixed charge coverage ratio of not less than 1.5 to 1. The Credit Agreement also contains customary events of default, including, among others, payment defaults, material inaccuracy of representations and warranties, covenant defaults, bankruptcy or involuntary proceedings, certain monetary and non-monetary judgments, change of control and customary ERISA defaults.
Debt Maturities
The maturities of long-term debt payable within each of the four years subsequent to December 31, 2018 are as follows: 2019 — $0.3, 2020 — $0.0, 2021 — $0.0, 2022 — $477.8.
(8) Retirement and Deferred Compensation Plans
For all of our United States defined benefit and retiree health care plans, we adopted the Society of Actuaries’ RP-2006 mortality table with MP-2017 projection scale in determining the plans’ benefit obligations as of December 31, 2017.
Beginning in 2016, we changed the method we use to estimate the service and interest cost components of net periodic benefit cost for all of our United States defined benefit plans. Historically, the service and interest cost components had been estimated utilizing a single weighted-average discount rate derived from the yield curve used to measure the benefit obligation at the beginning of the year. Starting 2016, we have utilized a full yield curve approach to estimate these components by applying specific spot rates along the yield curve used in the determination of the benefit obligation to the relevant projected cash flows. We made this change to improve the correlation between projected benefit cash flows and the corresponding yield curve spot rates and to provide a more precise measurement of service and interest costs.
74
Defined Benefit Pension Plans
We sponsor several qualified and nonqualified pension plans covering permanent employees. During 2016, we transitioned an additional German plan associated with the employees who were transferred in as part of a new client contract. The unfunded portion of this plan was $61.8 and $56.8 as of December 31, 2017 and 2016, respectively, which will be partially funded by the client at the end of the contract. We have received a bank guarantee to cover the counterparty risk associated with this unfunded amount.
The reconciliation of the changes in the plans’ benefit obligations and the fair value of plan assets and the funded status of the plans are as follows:
United States Plans | Non-United States Plans | ||||||||||||
Year Ended December 31 | 2017 | 2016 | 2017 | 2016 | |||||||||
Change in Benefit Obligation | |||||||||||||
Benefit obligation, beginning of year | $53.1 | $53.1 | $416.0 | $326.1 | |||||||||
Service cost | — | — | 10.1 | 8.0 | |||||||||
Interest cost | 1.7 | 1.8 | 8.9 | 10.0 | |||||||||
Curtailment and settlement | — | — | — | (29.0 | ) | ||||||||
Transfers | — | — | 9.3 | 105.4 | |||||||||
Actuarial loss | 3.0 | 2.2 | 1.0 | 39.8 | |||||||||
Plan participant contributions | — | — | 0.2 | 0.2 | |||||||||
Benefits paid | (4.1 | ) | (4.0 | ) | (9.5 | ) | (7.7 | ) | |||||
Currency exchange rate changes | — | — | 53.5 | (36.8 | ) | ||||||||
Benefit obligation, end of year | $53.7 | $53.1 | $489.5 | $416.0 | |||||||||
United States Plans | Non-United States Plans | ||||||||||||
Year Ended December 31 | 2017 | 2016 | 2017 | 2016 | |||||||||
Change in Plan Assets | |||||||||||||
Fair value of plan assets, beginning of year | $37.3 | $37.2 | $324.5 | $314.7 | |||||||||
Actual return on plan assets | 3.0 | 1.7 | 13.4 | 44.6 | |||||||||
Settlement | — | — | — | (26.1 | ) | ||||||||
Transfers | — | — | 1.8 | 34.9 | |||||||||
Plan participant contributions | — | — | 0.2 | 0.2 | |||||||||
Company contributions | 2.5 | 2.4 | 7.9 | 0.5 | |||||||||
Benefits paid | (4.1 | ) | (4.0 | ) | (9.5 | ) | (7.7 | ) | |||||
Currency exchange rate changes | — | — | 38.4 | (36.6 | ) | ||||||||
Fair value of plan assets, end of year | $38.7 | $37.3 | $376.7 | $324.5 | |||||||||
Funded Status at End of Year | |||||||||||||
Funded status, end of year | ($15.0 | ) | ($15.8 | ) | ($112.8 | ) | ($91.5 | ) | |||||
Amounts Recognized | |||||||||||||
Noncurrent assets | $15.3 | $14.3 | $36.8 | $30.4 | |||||||||
Current liabilities | (2.5 | ) | (2.5 | ) | (0.4 | ) | (0.8 | ) | |||||
Noncurrent liabilities | (27.8 | ) | (27.6 | ) | (149.2 | ) | (121.1 | ) | |||||
Net amount recognized | ($15.0 | ) | ($15.8 | ) | ($112.8 | ) | ($91.5 | ) | |||||
75
Amounts recognized in accumulated other comprehensive loss, net of tax, consisted of:
United States Plans | Non-United States Plans | ||||||||||||
Year Ended December 31 | 2017 | 2016 | 2017 | 2016 | |||||||||
Net loss | $13.9 | $13.0 | $29.9 | $32.7 | |||||||||
Prior service cost | — | — | 6.7 | 4.7 | |||||||||
Total | $13.9 | $13.0 | $36.6 | $37.4 | |||||||||
The accumulated benefit obligation for our plans that have plan assets was $433.0 and $377.0 as of December 31, 2017 and 2016, respectively. The accumulated benefit obligation for certain of our plans exceeded the fair value of plan assets as follows:
December 31 | 2017 | 2016 | ||||
Accumulated benefit obligation | $135.9 | $107.9 | ||||
Plan assets | 65.5 | 47.9 | ||||
The projected benefit obligation for certain of our plans exceeded the fair value of plan assets as follows:
December 31 | 2017 | 2016 | ||||
Projected benefit obligation | $143.8 | $113.9 | ||||
Plan assets | 65.5 | 47.9 | ||||
By their nature, certain of our plans do not have plan assets. The accumulated benefit obligation for these plans was $86.7 and $74.3 as of December 31, 2017 and 2016, respectively.
The components of the net periodic benefit cost and other amounts recognized in other comprehensive loss for all plans were as follows:
Year Ended December 31 | 2017 | 2016 | 2015 | ||||||
Net Periodic Benefit Cost | |||||||||
Service cost | $10.1 | $8.0 | $7.2 | ||||||
Interest cost | 10.6 | 11.8 | 12.7 | ||||||
Expected return on assets | (10.8 | ) | (10.9 | ) | (12.9 | ) | |||
Curtailment and settlement | — | (6.9 | ) | — | |||||
Net loss | 0.9 | 1.0 | 4.0 | ||||||
Prior service cost | 0.4 | 0.4 | 0.4 | ||||||
Net periodic benefit cost | 11.2 | 3.4 | 11.4 | ||||||
Other Changes in Plan Assets and Benefit Obligation Recognized in Other Comprehensive Income/Loss | |||||||||
Net (gain) loss | (1.5 | ) | 24.7 | (22.9 | ) | ||||
Prior service cost | 2.9 | — | — | ||||||
Amortization of net loss | (0.9 | ) | (1.0 | ) | (4.0 | ) | |||
Amortization of prior service cost | (0.4 | ) | (0.4 | ) | (0.4 | ) | |||
Total recognized in other comprehensive loss | 0.1 | 23.3 | (27.3 | ) | |||||
Total recognized in net periodic benefit cost and other comprehensive income/loss | $11.3 | $26.7 | ($15.9 | ) | |||||
Effective July 1, 2016, we terminated a defined benefit plan in Northern Europe and transitioned our employees to a defined contribution plan, resulting in a curtailment and settlement gain of $6.9.
76
The estimated net loss and prior service cost for the defined benefit pension plans that will be amortized from accumulated other comprehensive loss into net periodic benefit cost during 2018 are $0.8 and $0.6, respectively. The weighted-average assumptions used in the measurement of the benefit obligation were as follows:
United States Plans | Non-United States Plans | ||||||||
Year Ended December 31 | 2017 | 2016 | 2017 | 2016 | |||||
Discount rate | 3.6 | % | 4.0 | % | 2.1 | % | 2.2 | % | |
Rate of compensation increase | 3.0 | % | 3.0 | % | 1.9 | % | 1.7 | % | |
The weighted-average assumptions used in the measurement of the net periodic benefit cost were as follows:
United States Plans | Non-United States Plans | ||||||||||||
Year Ended December 31 | 2017 | 2016 | 2015 | 2017 | 2016 | 2015 | |||||||
Discount rate - service cost | 4.1 | % | 4.4 | % | 3.9 | % | 2.2 | % | 3.2 | % | 2.9 | % | |
Discount rate - interest cost | 3.3 | % | 3.4 | % | 3.9 | % | 2.2 | % | 3.2 | % | 2.9 | % | |
Expected long-term return on plan assets | 4.8 | % | 5.3 | % | 5.5 | % | 2.8 | % | 3.4 | % | 3.2 | % | |
Rate of compensation increase | 3.0 | % | 3.0 | % | 3.0 | % | 1.7 | % | 2.2 | % | 2.6 | % | |
We determine our assumption for the discount rate based on an index of high-quality corporate bond yields and matched-funding yield curve analysis as of the end of each fiscal year.
Our overall expected long-term rate of return used in the measurement of the 2017 net periodic benefit cost on United States plan assets was 4.8%, while the rates of return on our non-United States plans varied by country and ranged from 1.3% to 4.0%. For a majority of our plans, a building block approach has been employed to establish this return. Historical markets are studied and long-term historical relationships between equity securities and fixed income instruments are preserved consistent with the widely accepted capital market principle that assets with higher volatility generate a greater return over time. Current market factors such as inflation and interest rates are evaluated before long-term capital market assumptions are determined. The long-term portfolio return is established with proper consideration of diversification and rebalancing. We also use guaranteed insurance contracts for four of our foreign plans. Peer data and historical returns are reviewed to check for reasonableness and appropriateness of our expected rate of return.
Projected salary levels utilized in the determination of the projected benefit obligation for the pension plans are based upon historical experience and the future expectations for each respective country.
Our plans’ investment policies are to optimize the long-term return on plan assets at an acceptable level of risk and to maintain careful control of the risk level within each asset class. Our long-term objective is to minimize plan expenses and contributions by outperforming plan liabilities. We have historically used a balanced portfolio strategy based primarily on a target allocation of equity securities and fixed-income instruments, which vary by location. These target allocations, which are similar to the 2017 allocations, are determined based on the favorable risk tolerance characteristics of the plan and, at times, may be adjusted within a specified range to advance our overall objective.
The fair values of our pension plan assets are primarily determined by using market quotes and other relevant information that is generated by market transactions involving identical or comparable assets, except for the insurance contracts, which are measured at the present value of expected future benefit payments primarily using the Deutsche National Bank interest curve.
77
The fair value of our pension plan assets by asset category was as follows:
United States Plans | Non-United States Plans | ||||||||||||||||||||||||
Fair Value Measurements Using | Fair Value Measurements Using | ||||||||||||||||||||||||
December 31, 2017 | Quoted Prices in Active Markets for Identical Assets (Level 1) | Significant Other Observable Inputs (Level 2) | Significant Unobservable Inputs (Level 3) | December 31, 2017 | Quoted Prices in Active Markets for Identical Assets (Level 1) | Significant Other Observable Inputs (Level 2) | Significant Unobservable Inputs (Level 3) | ||||||||||||||||||
Asset Category | |||||||||||||||||||||||||
Cash and cash equivalents(1) | $0.2 | $— | $0.2 | $— | $5.1 | $5.1 | $— | $— | |||||||||||||||||
Equity securities: | |||||||||||||||||||||||||
United States companies | 12.3 | 12.3 | — | — | 15.2 | 15.2 | — | — | |||||||||||||||||
International companies | — | — | — | — | 35.7 | 35.7 | — | — | |||||||||||||||||
Fixed income securities: | |||||||||||||||||||||||||
Government bonds(2) | 15.2 | — | 15.2 | — | 45.2 | — | 45.2 | — | |||||||||||||||||
Corporate bonds | 11.0 | — | 11.0 | — | 59.8 | — | 59.8 | — | |||||||||||||||||
Guaranteed insurance contracts | — | — | — | — | 17.6 | — | 17.6 | — | |||||||||||||||||
Annuity contract | — | — | — | — | 55.3 | — | 55.3 | — | |||||||||||||||||
Other types of investments: | |||||||||||||||||||||||||
Unitized funds(3) | — | — | — | — | 25.8 | 25.8 | — | — | |||||||||||||||||
Real estate funds | — | — | — | — | 8.2 | — | 8.2 | — | |||||||||||||||||
Insurance contracts | — | — | — | — | 108.8 | — | — | 108.8 | |||||||||||||||||
$38.7 | $12.3 | $26.4 | $— | $376.7 | $81.8 | $186.1 | $108.8 | ||||||||||||||||||
(1)This category includes a prime obligations money market portfolio.
(2)This category includes United States Treasury/Federal agency securities and foreign government securities.
(3)This category includes investments in approximately 60% equity securities, 30% fixed income securities and 10% cash.
78
United States Plans | Non-United States Plans | ||||||||||||||||||||||||
Fair Value Measurements Using | Fair Value Measurements Using | ||||||||||||||||||||||||
December 31, 2016 | Quoted Prices in Active Markets for Identical Assets (Level 1) | Significant Other Observable Inputs (Level 2) | Significant Unobservable Inputs (Level 3) | December 31, 2016 | Quoted Prices in Active Markets for Identical Assets (Level 1) | Significant Other Observable Inputs (Level 2) | Significant Unobservable Inputs (Level 3) | ||||||||||||||||||
Asset Category | |||||||||||||||||||||||||
Cash and cash equivalents(1) | $0.2 | $— | $0.2 | $— | $9.7 | $9.2 | $0.5 | $— | |||||||||||||||||
Equity securities: | |||||||||||||||||||||||||
United States companies | 12.1 | 12.1 | — | — | — | — | — | — | |||||||||||||||||
International companies | — | — | — | — | 17.7 | 17.7 | — | — | |||||||||||||||||
Fixed income securities: | |||||||||||||||||||||||||
Government bonds(2) | 14.7 | — | 14.7 | — | 27.5 | — | 27.5 | — | |||||||||||||||||
Corporate bonds | 10.3 | — | 10.3 | — | 49.6 | — | 49.6 | — | |||||||||||||||||
Guaranteed insurance contracts | — | — | — | — | 14.2 | — | 14.2 | — | |||||||||||||||||
Annuity contract | — | — | — | — | 49.5 | — | 49.5 | — | |||||||||||||||||
Other types of investments: | |||||||||||||||||||||||||
Unitized funds(3) | — | — | — | — | 23.1 | 23.1 | — | — | |||||||||||||||||
Real estate funds | — | — | — | — | 7.0 | — | 7.0 | — | |||||||||||||||||
Common contractual funds | — | — | — | — | 25.9 | — | — | 25.9 | |||||||||||||||||
Insurance contracts | — | — | — | — | 100.3 | — | — | 100.3 | |||||||||||||||||
$37.3 | $12.1 | $25.2 | $— | $324.5 | $50.0 | $148.3 | $126.2 | ||||||||||||||||||
(1) This category includes a prime obligations money market portfolio.
(2) This category includes United States Treasury/Federal agency securities and foreign government securities.
(3) This category includes investments in approximately 60% equity securities, 30% fixed income securities and 10% cash.
The following table summarizes the changes in fair value of the pension assets that are measured using Level 3 inputs. In 2016, we transferred in common contractual funds as part of the pension assets associated with the new German plan. During 2017, we transferred these funds to exchange-traded funds, for which the fair value is measured using either Level 1 or Level 2 inputs. We determined that transfers between fair-value-measurement levels occurred on the date of the event that caused the transfer.
Year Ended December 31 | 2017 | 2016 | ||||
Balance, beginning of year | $126.2 | $92.0 | ||||
Transfers | (25.4 | ) | 27.3 | |||
Actual return on plan assets | (5.3 | ) | 13.9 | |||
Purchases, sales and settlements, net | (0.6 | ) | (2.1 | ) | ||
Currency exchange rate changes | 13.9 | (4.9 | ) | |||
Balance, end of year | $108.8 | $126.2 | ||||
79
Retiree Health Care Plan
We provide medical and dental benefits to certain eligible retired employees in the United States. Due to the nature of the plan, there are no plan assets. The reconciliation of the changes in the plan’s benefit obligation and the statement of the funded status of the plan were as follows:
Year Ended December 31 | 2017 | 2016 | ||||
Change in Benefit Obligation | ||||||
Benefit obligation, beginning of year | $15.6 | $16.4 | ||||
Interest cost | 0.6 | 0.7 | ||||
Actuarial (gain) loss | (0.3 | ) | 0.2 | |||
Benefits paid | (1.0 | ) | (1.7 | ) | ||
Benefit obligation, end of year | $14.9 | $15.6 | ||||
Funded Status at End of Year | ||||||
Funded status, end of year | ($14.9 | ) | ($15.6 | ) | ||
Amounts Recognized | ||||||
Current liabilities | ($1.2 | ) | ($1.3 | ) | ||
Noncurrent liabilities | (13.7 | ) | (14.3 | ) | ||
Net amount recognized | ($14.9 | ) | ($15.6 | ) | ||
The amount recognized in accumulated other comprehensive loss, net of tax, consists of a net loss of $1.4 and $1.7 for 2017 and 2016, respectively, and a prior service credit of $4.8 and $5.4 in 2017 and 2016, respectively.
The discount rate used in the measurement of the benefit obligation was 3.5% and 4.0% in 2017 and 2016, respectively. The discount rate used in the measurement of net periodic benefit cost was 4.0%, 4.3% and 3.9% in 2017, 2016, and 2015, respectively. The components of net periodic benefit cost and other amounts recognized in other comprehensive loss for this plan were as follows:
2017 | 2016 | 2015 | |||||||
Net Periodic Benefit (Credit) Cost | |||||||||
Interest cost | $0.6 | $0.7 | $0.7 | ||||||
Net loss | 0.1 | 0.1 | 0.1 | ||||||
Prior service credit | (0.8 | ) | (0.8 | ) | (0.8 | ) | |||
Net periodic benefit (credit) cost | ($0.1 | ) | $— | $— | |||||
Other Changes in Plan Assets and Benefit Obligations Recognized in Other Comprehensive Income/Loss | |||||||||
Net (gain) loss | ($0.3 | ) | $0.2 | ($0.5 | ) | ||||
Amortization of net loss | (0.1 | ) | (0.1 | ) | (0.1 | ) | |||
Amortization of prior service credit | 0.8 | 0.8 | 0.8 | ||||||
Total recognized in other comprehensive loss | 0.4 | 0.9 | 0.2 | ||||||
Total recognized in net periodic benefit cost and other comprehensive income/loss | $0.3 | $0.9 | $0.2 | ||||||
The estimated prior service credit for the retiree health care plan that will be amortized from accumulated other comprehensive loss into net periodic benefit cost during 2018 is $0.8.
80
The health care cost trend rate is assumed to be 7.8% for 2018, decreasing gradually to an ultimate rate of 5.8% in 2022. Assumed health care cost trend rates could have a significant effect on the amounts reported. A one-percentage point change in the assumed health care cost trend rate would have the following effects:
1% Increase | 1% Decrease | |||||
Effect on total of service and interest cost components | $— | $— | ||||
Effect on benefit obligation | 0.2 | (0.2 | ) | |||
Future Contributions and Payments
During 2018, we plan to contribute approximately $4.0 to our pension plans and to fund our retiree health care payments as incurred. Projected benefit payments from the plans as of December 31, 2017 were estimated as follows:
Year | Pension Plans | Retiree Health Care Plan | ||||
2018 | $14.0 | $1.2 | ||||
2019 | 14.3 | 1.2 | ||||
2020 | 15.8 | 1.1 | ||||
2021 | 17.9 | 1.1 | ||||
2022 | 19.6 | 1.1 | ||||
2023–2027 | 127.8 | 5.0 | ||||
Total projected benefit payments | $209.4 | $10.7 | ||||
Defined Contribution Plans and Deferred Compensation Plans
We have defined contribution plans covering substantially all permanent United States employees and various other employees throughout the world. With our company-sponsored plans, employees may elect to contribute a portion of their salary to the plans and we match a portion of their contributions up to a maximum percentage of the employee’s salary. In addition, profit sharing contributions are made if a targeted earnings level is reached. The total expense for our match and any profit sharing contributions was $17.6, $21.4 and $19.6 for the years ended December 31, 2017, 2016 and 2015, respectively. In certain countries with statutory defined contribution plans, we pay a percentage of the employees' salary in pension premiums. The total expense for the statutory defined contribution plans was $35.6, $24.0 and $24.7 for the years ended December 31, 2017, 2016 and 2015, respectively.
We also have deferred compensation plans in the United States. One of the plans had an asset and liability of $98.0 and $85.7 as of December 31, 2017 and 2016, respectively, with the remaining plans holding immaterial amounts of assets and liabilities.
(9) Accumulated Other Comprehensive Loss
The components of accumulated other comprehensive loss, net of tax, were as follows:
December 31 | 2017 | 2016 | ||||
Foreign currency translation | $ | (87.7 | ) | $ | (289.1 | ) |
Translation (loss) gain on net investment hedge, net of income taxes of $(23.1) and $11.2, respectively | (39.9 | ) | 24.8 | |||
Translation loss on long-term intercompany loans | (128.8 | ) | (133.7 | ) | ||
Unrealized gain on investments, net of income taxes of $3.4 and $4.2, respectively | 15.3 | 18.6 | ||||
Defined benefit pension plans, net of income taxes of $(27.8) for both 2017 and 2016 | (50.5 | ) | (50.4 | ) | ||
Retiree health care plan, net of income taxes of $2.0 and $2.1, respectively | 3.4 | 3.7 | ||||
Accumulated other comprehensive loss | $ | (288.2 | ) | $ | (426.1 | ) |
81
(10) Leases
We lease property and equipment primarily under operating leases. Renewal options exist for substantially all leases. Future minimum payments, by year and in the aggregate, under noncancelable operating leases with any remaining terms consisted of the following as of December 31, 2017:
Year | |||
2018 | $167.3 | ||
2019 | 123.0 | ||
2020 | 93.6 | ||
2021 | 69.0 | ||
2022 | 54.0 | ||
Thereafter | 125.1 | ||
Total minimum lease payments | $632.0 | ||
Rental expense for all operating leases was $173.1, $166.5 and $174.9 for the years ended December 31, 2017, 2016 and 2015, respectively.
(11) Interest and Other Expenses
Interest and other expenses consisted of the following:
Year Ended December 31 | 2017 | 2016 | 2015 | ||||||
Interest expense | $38.2 | $37.9 | $36.0 | ||||||
Interest income | (4.8 | ) | (3.6 | ) | (2.5 | ) | |||
Foreign exchange loss (gain) | 0.8 | 2.8 | (4.7 | ) | |||||
Miscellaneous expense (income), net | 16.7 | 12.4 | (0.6 | ) | |||||
Interest and other expenses | $50.9 | $49.5 | $28.2 | ||||||
(12) Derivative Financial Instruments
We are exposed to various market risks relating to our ongoing business operations. The primary market risks, which are managed through the use of derivative instruments, are foreign currency exchange rate risk and interest rate risk. In certain circumstances, we enter into foreign currency forward exchange contracts (“forward contracts”) to reduce the effects of fluctuating foreign currency exchange rates on our cash flows denominated in foreign currencies. Our exposure to market risk for changes in interest rates relates primarily to our long-term debt obligations. We have historically managed interest rate risk through the use of a combination of fixed and variable rate borrowings. In accordance with the current accounting guidance for derivative instruments and hedging activities, we record all of our derivative instruments as either an asset or liability measured at their fair value.
Foreign Currency Exchange Rate Risk Management
A portion of the €400.0 Notes ($477.8) and €350.0 ($420.0) Notes was designated as a hedge of our net investment in our foreign subsidiaries with a Euro-functional currency as of December 31, 2017. For this portion of the Euro-denominated notes, the gain or loss associated with foreign currency translation is recorded as a component of accumulated other comprehensive loss, net of taxes. As of December 31, 2017 and 2016, we had an unrealized loss of $35.7 and an unrealized gain of $29.0, respectively, included in accumulated other comprehensive loss, net of taxes, as the net investment hedge was deemed effective.
On occasion, forward contracts are designated as a hedge of our net investment in our foreign subsidiaries. We had a translation loss of $4.2 as of both December 31, 2017 and 2016, included in accumulated other comprehensive loss, net of taxes, as the net investment hedge was deemed effective.
82
For our forward contracts that are not designated as hedges, any gain or loss resulting from the change in fair value is recognized in the current period earnings. These gains or losses are offset by the exposure related to receivables and payables with our foreign subsidiaries and to interest due on our Euro-denominated notes, which is paid annually in June and September. We recorded no gain, a loss of $1.6 and a gain of $0.6 for the years ended December 31, 2017, 2016 and 2015, respectively, associated with our forward contracts in interest and other expenses.
The fair value measurements of these items recorded in our Consolidated Balance Sheets as of December 31, 2017 and 2016 are disclosed in Note 1 to the Consolidated Financial Statements.
(13) Contingencies
Litigation
In the normal course of business, the Company is named as a defendant in various legal proceedings in which claims are asserted against the Company. We record accruals for loss contingencies based on the circumstances of each claim, when it is probable that a loss has been incurred as of the balance sheet date and can be reasonably estimated. Although the outcome of litigation cannot be predicted with certainty, we believe the ultimate resolution of these legal proceedings will not have a material effect on our business or financial condition.
In 2014, we recorded legal costs of $9.0 in the United States related to a settlement agreement in connection with a lawsuit in California involving allegations regarding our wage statements. The settlement agreement was approved by the court at a final hearing in June 2015. We believe that the settlement was in our best interest to avoid the costs and disruption of ongoing litigation.
On April 26, 2017, the sellers of 7S, a company we acquired in 2015, initiated a process under the acquisition agreement to dispute the contingent consideration related to the acquisition and are claiming an additional $25.0 (€20.8), plus interest. Under this process, the dispute has been submitted to an arbitration tribunal in Germany. We believe no further amounts are due and intend to vigorously dispute their claims in the arbitration. We are not currently able to predict the outcome of the arbitration or the timing of any resolution, and consequently, no amounts have been recorded in the Consolidated Financial Statements.
Guarantees
We have entered into certain guarantee contracts and stand-by letters of credit that total $201.9 ($149.3 for guarantees and $52.6 for stand-by letters of credit) as of December 31, 2017. The guarantees primarily relate to operating leases and indebtedness. The stand-by letters of credit relate to insurance requirements and debt facilities. If certain conditions were met under these arrangements, we would be required to satisfy our obligation in cash. Due to the nature of these arrangements and our historical experience, we do not expect to make any significant payments under these arrangements.
(14) Segment Data
We are organized and managed primarily on a geographic basis, with Right Management currently operating as a separate global business unit. Each country and business unit generally has its own distinct operations and management team, providing services under our global brands, and maintains its own financial reports. We have an executive sponsor for each global brand who is responsible for ensuring the integrity and consistency of delivery locally. We develop and implement global workforce solutions for our clients that deliver the outcomes that help them achieve their business strategy. Each operation reports directly or indirectly through a regional manager to a member of executive management. Given this reporting structure, all of our operations have been segregated into the following reporting segments: Americas, which includes United States and Other Americas; Southern Europe, which includes France, Italy and Other Southern Europe; Northern Europe; APME; and Right Management.
The Americas, Southern Europe, Northern Europe and APME segments derive a significant majority of their revenues from the placement of contingent workers. The remaining revenues within these segments are derived from other workforce solutions and services, including ManpowerGroup Solutions (Recruitment Process
83
Outsourcing (RPO), TAPFIN - Managed Service Provider (MSP), Proservia and Talent Based Outsourcing (TBO)), recruitment and assessment, and training and development. The Right Management segment revenues are derived from career management and talent management services. Segment revenues represent sales to external clients. We provide services to a wide variety of clients, none of which individually comprise a significant portion of revenues for us as a whole. Due to the nature of our business, we generally do not have export sales.
The accounting policies of the segments are the same as those described in the summary of significant accounting policies. We evaluate performance based on operating unit profit, which is equal to segment revenues less direct costs and branch and national headquarters operating costs. This profit measure does not include goodwill and intangible asset impairment charges or amortization of intangible assets related to acquisitions, corporate expenses, interest and other income and expense amounts or income taxes.
Total assets for the segments are reported after the elimination of investments in subsidiaries and intercompany accounts.
Year Ended December 31 | 2017 | 2016 | 2015 | ||||||
Revenues from Services(a) | |||||||||
Americas: | |||||||||
United States(b) | $ | 2,659.0 | $ | 2,836.8 | $ | 3,005.8 | |||
Other Americas | 1,557.4 | 1,460.4 | 1,486.2 | ||||||
4,216.4 | 4,297.2 | 4,492.0 | |||||||
Southern Europe: | |||||||||
France | 5,477.2 | 4,837.4 | 4,661.3 | ||||||
Italy | 1,475.9 | 1,167.7 | 1,226.1 | ||||||
Other Southern Europe | 1,703.9 | 1,492.5 | 1,404.1 | ||||||
8,657.0 | 7,497.6 | 7,291.5 | |||||||
Northern Europe | 5,306.4 | 5,129.1 | 5,033.7 | ||||||
APME | 2,636.4 | 2,471.3 | 2,239.1 | ||||||
Right Management | 218.1 | 258.9 | 273.6 | ||||||
$ | 21,034.3 | $ | 19,654.1 | $ | 19,329.9 | ||||
Operating Unit Profit | |||||||||
Americas: | |||||||||
United States | $ | 152.5 | $ | 142.9 | $ | 143.8 | |||
Other Americas | 61.2 | 53.6 | 57.0 | ||||||
213.7 | 196.5 | 200.8 | |||||||
Southern Europe: | |||||||||
France | 278.0 | 250.6 | 258.8 | ||||||
Italy | 104.5 | 79.1 | 70.9 | ||||||
Other Southern Europe | 59.4 | 47.2 | 39.9 | ||||||
441.9 | 376.9 | 369.6 | |||||||
Northern Europe | 140.7 | 173.0 | 144.7 | ||||||
APME | 98.9 | 88.5 | 79.3 | ||||||
Right Management | 36.0 | 44.7 | 38.3 | ||||||
931.2 | 879.6 | 832.7 | |||||||
Corporate expenses | (108.4 | ) | (92.8 | ) | (111.0 | ) | |||
Intangible asset amortization expense(c) | (34.6 | ) | (36.0 | ) | (32.8 | ) | |||
Interest and other expenses | (50.9 | ) | (49.5 | ) | (28.2 | ) | |||
Earnings before income taxes | $ | 737.3 | $ | 701.3 | $ | 660.7 | |||
84
(a) Further breakdown of revenues from services by geographical region was as follows:
Revenues from Services | 2017 | 2016 | 2015 | ||||||
United States | $ | 2,758.5 | $ | 2,950.2 | $ | 3,115.6 | |||
France | 5,493.9 | 4,857.3 | 4,684.1 | ||||||
Italy | 1,479.4 | 1,170.7 | 1,230.2 | ||||||
United Kingdom | 1,619.2 | 1,819.7 | 2,118.4 | ||||||
Total Foreign | 18,275.8 | 16,703.9 | 16,214.3 | ||||||
(b) The United States revenues above represent revenues from our company-owned branches and franchise fees received from our franchise operations, which were $14.8, $15.1 and $15.2 for 2017, 2016 and 2015, respectively.
(c) Intangible asset amortization related to acquisitions is excluded from operating costs within the reportable segments and corporate expenses, and shown separately.
Year Ended December 31 | 2017 | 2016 | 2015 | ||||||
Depreciation and Amortization Expense | |||||||||
Americas: | |||||||||
United States | $ | 9.3 | $ | 9.9 | $ | 9.3 | |||
Other Americas | 2.5 | 2.7 | 2.9 | ||||||
11.8 | 12.6 | 12.2 | |||||||
Southern Europe: | |||||||||
France | 12.3 | 11.0 | 10.1 | ||||||
Italy | 1.8 | 1.9 | 1.9 | ||||||
Other Southern Europe | 4.7 | 3.5 | 3.2 | ||||||
18.8 | 16.4 | 15.2 | |||||||
Northern Europe | 10.6 | 10.9 | 8.9 | ||||||
APME | 4.7 | 5.3 | 4.7 | ||||||
Right Management | 3.7 | 3.9 | 3.7 | ||||||
Corporate expenses | 0.2 | 0.2 | 0.2 | ||||||
Intangible asset amortization expense(a) | 34.6 | 36.0 | 32.8 | ||||||
$ | 84.4 | $ | 85.3 | $ | 77.7 | ||||
Earnings from Equity Investments | |||||||||
Americas: | |||||||||
United States | $ | — | $ | — | $ | — | |||
Other Americas | — | — | — | ||||||
— | — | — | |||||||
Southern Europe: | |||||||||
France | — | — | 0.4 | ||||||
Italy | — | — | — | ||||||
Other Southern Europe | 15.0 | 3.6 | 7.5 | ||||||
15.0 | 3.6 | 7.9 | |||||||
Northern Europe | — | — | 0.1 | ||||||
APME | — | — | — | ||||||
Right Management | — | — | — | ||||||
$ | 15.0 | $ | 3.6 | $ | 8.0 | ||||
(a) Intangible asset amortization related to acquisitions is excluded from operating costs within the reportable segments and corporate expenses, and shown separately.
85
As of December 31 | 2017 | 2016 | 2015 | ||||||
Total Assets | |||||||||
Americas: | |||||||||
United States | $ | 1,781.4 | $ | 1,718.9 | $ | 1,708.5 | |||
Other Americas | 329.2 | 314.4 | 304.9 | ||||||
2,110.6 | 2,033.3 | 2,013.4 | |||||||
Southern Europe: | |||||||||
France | 2,753.1 | 2,104.8 | 1,926.3 | ||||||
Italy | 436.7 | 294.9 | 267.1 | ||||||
Other Southern Europe | 596.2 | 490.1 | 484.7 | ||||||
3,786.0 | 2,889.8 | 2,678.1 | |||||||
Northern Europe | 1,569.0 | 1,292.4 | 1,197.7 | ||||||
APME | 780.7 | 612.8 | 533.6 | ||||||
Right Management | 138.1 | 136.6 | 143.9 | ||||||
Corporate(a) | 499.2 | 609.3 | 950.8 | ||||||
$ | 8,883.6 | $ | 7,574.2 | $ | 7,517.5 | ||||
Equity Investments | |||||||||
Americas: | |||||||||
United States | $ | — | $ | — | $ | — | |||
Other Americas | — | — | — | ||||||
— | — | — | |||||||
Southern Europe: | |||||||||
France | — | 0.2 | — | ||||||
Italy | 0.4 | 0.4 | 0.2 | ||||||
Other Southern Europe | 157.2 | 139.1 | 136.3 | ||||||
157.6 | 139.7 | 136.5 | |||||||
Northern Europe | — | 0.1 | 1.4 | ||||||
APME | 0.1 | — | — | ||||||
Right Management | — | — | — | ||||||
Corporate | 1.0 | 6.0 | — | ||||||
$ | 158.7 | $ | 145.8 | $ | 137.9 | ||||
(a) Corporate assets include assets that were not used in the operations of any segment, the most significant of which were purchased intangibles and cash.
86
As of and Year Ended December 31 | 2017 | 2016 | 2015 | ||||||
Long-lived Assets(a) | |||||||||
Americas: | |||||||||
United States | $ | 20.6 | $ | 27.7 | $ | 26.0 | |||
Other Americas | 6.1 | 6.3 | 7.3 | ||||||
26.7 | 34.0 | 33.3 | |||||||
Southern Europe: | |||||||||
France | 47.9 | 39.7 | 39.2 | ||||||
Italy | 4.9 | 4.4 | 4.7 | ||||||
Other Southern Europe | 24.3 | 18.3 | 14.2 | ||||||
77.1 | 62.4 | 58.1 | |||||||
Northern Europe | 28.0 | 25.4 | 30.5 | ||||||
APME | 21.4 | 17.9 | 19.4 | ||||||
Right Management | 8.0 | 10.7 | 10.5 | ||||||
Corporate | 0.1 | 0.2 | 0.4 | ||||||
$ | 161.3 | $ | 150.6 | $ | 152.2 | ||||
Additions to Long-Lived Assets | |||||||||
Americas: | |||||||||
United States | $ | 6.7 | $ | 11.9 | $ | 10.1 | |||
Other Americas | 2.4 | 1.9 | 2.4 | ||||||
9.1 | 13.8 | 12.5 | |||||||
Southern Europe: | |||||||||
France | 15.2 | 13.3 | 10.3 | ||||||
Italy | 1.7 | 1.7 | 2.4 | ||||||
Other Southern Europe | 8.8 | 8.9 | 5.4 | ||||||
25.7 | 23.9 | 18.1 | |||||||
Northern Europe | 11.8 | 8.5 | 12.1 | ||||||
APME | 6.3 | 3.9 | 4.5 | ||||||
Right Management | 1.0 | 4.5 | 4.7 | ||||||
Corporate | — | — | 0.4 | ||||||
$ | 53.9 | $ | 54.6 | $ | 52.3 | ||||
(a) Further breakdown of long-lived assets by geographical region was as follows:
Long-Lived Assets | 2017 | 2016 | 2015 | ||||||
United States | $ | 24.9 | $ | 33.9 | $ | 32.3 | |||
France | 49.1 | 40.9 | 40.4 | ||||||
Italy | 4.9 | 4.4 | 4.7 | ||||||
United Kingdom | 9.1 | 9.0 | 10.3 | ||||||
Total Foreign | 136.4 | 116.7 | 119.9 | ||||||
87
(15) Quarterly Data (Unaudited)
First Quarter | Second Quarter | Third Quarter | Fourth Quarter | Total | |||||||||||
Year Ended December 31, 2017 | |||||||||||||||
Revenues from services | $ | 4,757.2 | $ | 5,174.8 | $ | 5,464.8 | $ | 5,637.5 | $ | 21,034.3 | |||||
Gross profit | 787.8 | 861.7 | 900.6 | 934.5 | 3,484.6 | ||||||||||
Operating profit (a) | 127.0 | 194.6 | 227.9 | 238.7 | 788.2 | ||||||||||
Net earnings (b) | 74.4 | 117.0 | 137.7 | 216.3 | 545.4 | ||||||||||
Net earnings per share — basic | $ | 1.10 | $ | 1.74 | $ | 2.06 | $ | 3.26 | $ | 8.13 | |||||
Net earnings per share — diluted (c) | 1.09 | 1.72 | 2.04 | 3.22 | 8.04 | ||||||||||
Dividends per share | — | 0.93 | — | 0.93 | 1.86 | ||||||||||
Year Ended December 31, 2016 | |||||||||||||||
Revenues from services | $ | 4,587.7 | $ | 5,022.1 | $ | 5,088.2 | $ | 4,956.1 | $ | 19,654.1 | |||||
Gross profit | 773.8 | 860.7 | 858.3 | 841.0 | 3,333.8 | ||||||||||
Operating profit | 131.7 | 196.0 | 211.1 | 212.0 | 750.8 | ||||||||||
Net earnings | 71.7 | 115.4 | 129.2 | 127.4 | 443.7 | ||||||||||
Net earnings per share — basic | $ | 0.98 | $ | 1.61 | $ | 1.89 | $ | 1.89 | $ | 6.33 | |||||
Net earnings per share — diluted | 0.98 | 1.60 | 1.87 | 1.87 | 6.27 | ||||||||||
Dividends per share | — | 0.86 | — | 0.86 | 1.72 | ||||||||||
(a) Included restructuring costs of $24.0 and $10.5 recorded in the first and second quarter, respectively.
(b) Included net tax benefits related to the Tax Act and French tax reform of $73.7 in the fourth quarter.
(c) Included in the results are restructuring costs per diluted share of $(0.30) and $(0.10) for the first and second quarter, respectively, and net tax benefits per diluted share of $1.10 for the fourth quarter.
88
Item 9. Changes in and Disagreements with Accountants on Accounting and Financial Disclosure
Not applicable.
Item 9A. Controls and Procedures
Disclosure Controls and Procedures
We maintain a set of disclosure controls and procedures that are designed to ensure that information required to be disclosed by us in the reports filed by us under the Securities Exchange Act of 1934, as amended (the “Exchange Act”), is recorded, processed, summarized and reported within the time periods specified in the SEC’s rules and forms. Disclosure controls and procedures include, without limitation, controls and procedures designed to ensure that information required to be disclosed by us in the reports we file under the Exchange Act is accumulated and communicated to our management, including our principal executive and principal financial officers, or persons performing similar functions, as appropriate to allow timely decisions regarding required disclosure. We carried out an evaluation, under the supervision and with the participation of our management, including our Chief Executive Officer and our Executive Vice President and Chief Financial Officer, of the effectiveness of the design and operation of our disclosure controls and procedures at a reasonable assurance level pursuant to Rule 13a-15 of the Exchange Act. Based on that evaluation, our Chief Executive Officer and our Executive Vice President and Chief Financial Officer concluded that, as of the end of the period covered by this report, our disclosure controls and procedures were effective at the reasonable assurance level.
Management Report on Internal Control over Financial Reporting
We are responsible for establishing and maintaining effective internal control over financial reporting as defined in Rule 13a-15(f) under the Securities Exchange Act of 1934. Our internal control over financial reporting is a process designed to provide reasonable assurance to management and the Board of Directors regarding the reliability of financial reporting and the preparation of financial statements for external purposes in accordance with generally accepted accounting principles.
Because of its inherent limitations, internal control over financial reporting may not prevent or detect misstatements. Also, projections of any evaluation of effectiveness to future periods are subject to the risk that controls may become inadequate because of changes in conditions, or that the degree of compliance with the policies or procedures may deteriorate.
Under the supervision and with the participation of management, including our Chief Executive Officer and our Executive Vice President and Chief Financial Officer, we conducted an evaluation of the effectiveness of our internal control over financial reporting based on the framework in Internal Control — Integrated Framework (2013) issued by the Committee of Sponsoring Organizations of the Treadway Commission. This evaluation included review of the documentation of controls, evaluation of the design effectiveness of controls, testing of the operating effectiveness of controls and a conclusion on this evaluation. Based on our evaluation we have concluded that our internal control over financial reporting was effective as of December 31, 2017.
Deloitte & Touche LLP, our independent registered public accounting firm, issued an attestation report on the effectiveness of our internal control over financial reporting as of December 31, 2017, which is included herein.
Internal Control over Financial Reporting
There have been no changes in our internal control over financial reporting that occurred during our last fiscal quarter that have materially affected, or are reasonably likely to materially affect, our internal control over financial reporting. During 2017, we implemented internal controls to ensure we have adequately evaluated our contracts and properly assessed the impact of the new accounting standards related to revenue recognition on our financial
89
statements to facilitate the adoption on January 1, 2018. We do not expect significant changes to our internal control over financial reporting due to the adoption of the new standard.
Item 9B. Other Information
Not applicable.
90
PART III
Item 10. Directors, Executive Officers and Corporate Governance
(a) | Executive Officers. Reference is made to “Executive Officers of ManpowerGroup” in Part I after Item 4. |
(b) | Directors. The information required by this Item is set forth in our Proxy Statement for the Annual Meeting of Shareholders to be held on May 4, 2018 under the caption “Election of Directors,” which information is hereby incorporated herein by reference. |
(c) | The board of directors has determined that each of Gina R. Boswell, chairman of the audit committee, John F. Ferraro, Roberto Mendoza and Paul Read is an “audit committee financial expert.” Ms. Boswell, Mr. Ferraro, Mr. Mendoza and Mr. Read are all “independent” as that term is used in Item 7(d)(3)(iv) of Schedule 14A under the Securities Exchange Act of 1934. |
(d) | Audit Committee. The information required by this Item is set forth in our Proxy Statement for the Annual Meeting of Shareholders to be held on May 4, 2018 under the caption “Election of Directors - Meetings and Committees of the Board,” which information is hereby incorporated herein by reference. |
(e) | Section 16 Compliance. The information required by this Item is set forth in our Proxy Statement for the Annual Meeting of Shareholders to be held May 4, 2018 under the caption “Section 16(a) Beneficial Ownership Reporting Compliance,” which information is hereby incorporated herein by reference. |
(f) | We have adopted a Code of Business Conduct and Ethics that applies to our directors, officers and employees, including our principal executive officer, principal financial officer, principal accounting officer and controller. We have posted the Code on our Internet website at www.manpowergroup.com. We intend to satisfy our disclosure requirements under Item 5.05 of Form 8-K, regarding any amendments to, or waiver of, a provision of our Code of Business Conduct and Ethics that applies to our principal executive officer, principal financial officer, principal accounting officer and controller or our directors by posting such information at this location on our website. |
Item 11. Executive Compensation
The information required by this Item is set forth in our Proxy Statement for the Annual Meeting of Shareholders to be held on May 4, 2018, under the captions "Compensation Discussion and Analysis," "Compensation Tables" and "CEO Pay Ratio"; under the caption “Executive Compensation and Human Resources Committee Interlocks and Insider Participation”; and under the caption “Report of the Executive Compensation and Human Resources Committee of the Board of Directors,” which information is hereby incorporated herein by reference.
Item 12. Security Ownership of Certain Beneficial Owners and Management and Related Shareholder Matters
The information required by this Item is set forth in our Proxy Statement for the Annual Meeting of Shareholders to be held on May 4, 2018, under the caption “Security Ownership of Certain Beneficial Owners,” under the caption “Beneficial Ownership of Directors and Executive Officers,” which information is hereby incorporated herein by reference.
91
The following table sets forth information as of December 31, 2017 about shares of our common stock outstanding and available for issuance under our existing equity compensation plans.
Plan category | Number of securities to be issued upon exercise of outstanding options, warrants and rights as of December 31, 2017 | Weighted-average exercise price of outstanding options, warrants and rights as of December 31, 2017 ($) | Weighted-average contractual term of outstanding options, warrants and rights as of December 31, 2017 (years) | Number of securities remaining available for future issuance under equity compensation plans as of December 31, 2017 (excluding securities reflected in the first column)(1) | ||||||||
Equity compensation plans approved by security holders | 1,749,396 | 79.25 | 3.3 | 3,717,043 | ||||||||
Equity compensation plans not approved by security holders | — | — | — | — | ||||||||
Total | 1,749,396 | 79.25 | 3.3 | 3,717,043 | ||||||||
(1) Includes the number of shares remaining available for future issuance under the following plans: 1990 Employee Stock Purchase Plan – 122,034 shares; Savings Related Share Option Scheme – 656,262 shares; and 2011 Equity Incentive Plan – 2,938,747 shares.
Item 13. Certain Relationships and Related Transactions, and Director Independence
The information required by this Item is set forth in our Proxy Statement for the Annual Meeting of Shareholders to be held on May 4, 2018, under the caption “Board Independence and Related Party Transactions” and “Meetings and Committees of the Board,” which information is hereby incorporated herein by reference.
Item 14. Principal Accounting Fees and Services
The information required by this Item is set forth in our Proxy Statement for the Annual Meeting of Shareholders to be held on May 4, 2018, under the captions “Audit Fees,” “Audit-Related Fees,” “Tax Fees,” “All Other Fees” and “Approval Procedures” in the Audit Committee Report, which information is hereby incorporated herein by reference.
92
PART IV
Item 15. Exhibits and Financial Statement Schedules.
(a)(1) Financial Statements.
Page Number | ||
Consolidated Financial Statements: | ||
Report of Independent Registered Public Accounting Firm | ||
Consolidated Statements of Operations for the years ended December 31, 2017, 2016 and 2015 | ||
Consolidated Statements of Comprehensive Income for the years ended December 31, 2017, 2016 and 2015 | ||
Consolidated Balance Sheets as of December 31, 2017 and 2016 | ||
Consolidated Statements of Cash Flows for the years ended December 31, 2017, 2016 and 2015 | ||
Consolidated Statements of Shareholders’ Equity for the years ended December 31, 2017, 2016 and 2015 | ||
Notes to Consolidated Financial Statements | ||
(a)(2) Financial Statement Schedule.
SCHEDULE II—Valuation and Qualifying Accounts
For the years ended December 31, 2017, 2016 and 2015, in millions:
Allowance for Doubtful Accounts:
Balance at Beginning of Year | Provisions Charged to Earnings | Write-Offs | Translation Adjustments | Reclassifications and Other | Balance at End of Year | |||||||||||||||||||
2017 | $ | 98.2 | $ | 18.1 | $ | (17.6 | ) | $ | 12.4 | $ | (0.3 | ) | $ | 110.8 | ||||||||||
2016 | 98.1 | 20.4 | (16.9 | ) | (3.2 | ) | (0.2 | ) | 98.2 | |||||||||||||||
2015 | 111.4 | 16.3 | (20.3 | ) | (10.1 | ) | 0.8 | 98.1 | ||||||||||||||||
(a)(3) Exhibits.
See (c) below.
Pursuant to Regulation S-K, Item 601(b)(4)(iii), ManpowerGroup Inc. hereby agrees to furnish to the Commission, upon request, a copy of each instrument and agreement with respect to long-term debt of ManpowerGroup Inc. and its consolidated subsidiaries which does not exceed 10 percent of the total assets of ManpowerGroup Inc. and its subsidiaries on a consolidated basis.(c) Exhibits.
93
94
101 | The following materials from the Company’s Annual Report on Form 10-K for the year ended December 31, 2017, formatted in XBRL (Extensible Business Reporting Language): (i) Consolidated Balance Sheets, (ii) Consolidated Statements of Operations, (iii) Consolidated Statements of Comprehensive Income, (iv) Consolidated Statements of Cash Flows, (v) Consolidated Statements of Shareholders’ Equity, (vi) Notes to Consolidated Financial Statements and (vii) Schedule II – Valuation and Qualifying Accounts. |
** Management contract or compensatory plan or arrangement.
95
Item 16. Form 10-K summary
Not applicable.
SIGNATURES
Pursuant to the requirements of Section 13 or 15(d) of the Securities Exchange Act of 1934, the Registrant has duly caused this report to be signed on its behalf by the undersigned, thereunto duly authorized.
MANPOWERGROUP INC. | |||
By: | /s/ Jonas Prising | ||
Jonas Prising Chairman and Chief Executive Officer | |||
Date: | February 23, 2018 | ||
Pursuant to the requirements of the Securities Exchange Act of 1934, this report has been signed below by the following persons on behalf of the registrant and in the capacities and on the dates indicated.
Name | Title | Date | ||
/s/ Jonas Prising Jonas Prising | Chairman, Chief Executive Officer and a Director (Principal Executive Officer) | February 23, 2018 | ||
/s/ John T. McGinnis John T. McGinnis | Executive Vice President and Chief Financial Officer (Principal Financial Officer and Principal Accounting Officer) | February 23, 2018 | ||
Directors: Gina R. Boswell, Cari M. Dominguez, William Downe, John F. Ferraro, Patricia A. Hemingway Hall, Julie M. Howard, Roberto Mendoza, Ulice Payne, Jr., Paul Read, Elizabeth P. Sartain, Michael J. Van Handel, John R. Walter and Edward J. Zore
By: | /s/ Richard Buchband | ||
Richard Buchband Attorney-In-Fact* | |||
Date: | February 23, 2018 | ||
* Pursuant to authority granted by powers of attorney, copies of which are filed herewith.
96