Attached files
| file | filename |
|---|---|
| 8-K - 8-K - FIRST HORIZON CORP | d909879d8k.htm |
| EX-99.1 - EX-99.1 - FIRST HORIZON CORP | d909879dex991.htm |
 First Horizon
National Corporation First Quarter 2015 Earnings
April 17, 2015
Exhibit 99.2 |
 2
Portions of this presentation use non-GAAP financial information. Each of those portions is
so noted, and a reconciliation
of
that
non-GAAP
information
to
comparable
GAAP
information
is
provided
in
a
footnote
or
in
the
appendix at the end of this presentation.
This presentation contains forward-looking statements, which may include guidance,
involving significant risks and uncertainties
which
will
be
identified
by
words
such
as
“believe”,“expect”,“anticipate”,“intend”,“estimate”,
“should”,“is
likely”,“will”,“going
forward”
and
other
expressions
that
indicate
future
events
and
trends
and
may
be
followed by or reference cautionary statements.
A number of factors could cause actual results to differ materially
from those in the forward-looking information.
These factors are outlined in our recent earnings and other press
releases
and
in
more
detail
in
the
most
current
10-Q
and
10-K.
FHN
disclaims
any
obligation
to
update
any
such
factors or to publicly announce the result of any revisions to any of the forward-looking
statements included herein or therein to reflect future events or developments.
|
 Building Franchise
Value Executing “Blue Chip”
Priorities
Being easy to do business with
Providing differentiated customer service
Using the Bonefish to drive profitability
3 |
 4
All
Non-GAAP
numbers
are
reconciled
in
the
appendix.
1
Regional
Banking
pre-tax
pre-provision
net
revenue
is
a
Non-GAAP
number.
2
EPS
and
expenses
excluding
litigation
charge
are
Non-GAAP
numbers.
3
Revenue
excluding
positive
impact
of
mortgage
servicing
sale
was
$278mm
in
1Q14
and
excludes
$20mm
of
previously
unrecognized
servicing
fees
associated
with
the
MSR
sale.
This
number
is
Non-GAAP.
Regional Bank Pre-Tax, Pre-Provision Net Revenue (PPNR) up 13% year over
year
1
Regional Bank average loan growth of 14% year over year
Regional Bank average core deposits up 9% year over year
Capital markets’
pre-tax income increased ~50% year over year
EPS,
excluding
litigation
charge,
at
$0.18
2
First Quarter 2015 Accomplishments
Core Business
Strength
Improving
Productivity
& Efficiency
Deploying Capital
Prudently
Reached an agreement in principle with DOJ/HUD to settle potential claims
on FHA loans
Improved Regional Bank efficiency ratio 234 bps year over year
Revenues, excluding positive impact of mortgage servicing sale, up 3% year
over year
3
Expenses,
excluding
litigation
charge,
declined
2%
year
over
year
2
Repurchased $16 million or 1 million common shares in 1Q15
TrustAtlantic acquisition progressing |
 FINANCIAL
RESULTS 5 |
 1Q15 Consolidated
Financial Results 6
Net Interest Income
Fee Income
Expense
NIAC
Excluding
Litigation
Charge
(Non-GAAP)
1
$ in millions, except EPS
Financial Results
1Q15
$157
Loan Loss Provision
$130
$376
$5
$(77)
$(0.33)
1Q15 vs
+$5
-$16
+$158
-$5
-$122
-$0.52
4Q14
$159
$120
$207
$6
$47
$0.20
1Q14
$152
$146
$218
$10
$46
$0.19
4Q14
-$2
+$10
+$169
-$1
-$124
-$0.53
1Q14
Actuals
Revenue,
excluding
positive
impact
of
mortgage
servicing
sale,
up
3%
linked
quarter
and
year
over
year
2
Expense,
excluding
litigation
charge,
up
3%
linked
quarter
and
down
2%
year
over
year
1
Total average loans up 2% linked quarter and 7% year over year
Total average core deposits up 7% linked quarter and 11% year over year
Net interest income slightly down linked quarter due to fewer days in 1Q15 but up 3% year over
year Loan
loss
provision
of
$5mm
with
NCOs
of
$9mm
in
1Q15
vs
$6mm
of
provision
and
$12mm
of
NCOs
in
4Q14
Common
Equity
Tier
1
(CET1)
of
10.3%
3
Net Income Available to Common Shareholders (NIAC)
Expense
Excluding
Litigation
Charge
(Non-GAAP)
1
$214
EPS
$42
EPS
Excluding
Litigation
Charge
(Non-GAAP)
1
$0.18
Adjusted Financial Results
$46
$0.19
$207
$47
$0.20
$218
-$4
-$4
-$0.01
+$7
-$5
-$0.02
EPS
excluding
DOJ/HUD
settlement
is
based
on
diluted
share
count
of
235mm
FHN
would
have
reported
assuming
net
income
available
to
common
instead
of
net
loss
available
to
common.
Numbers
may
not
add
to
total
due
to
rounding.
1
Expense,
NIAC
and
EPS
excluding
litigation
charge
are
Non-GAAP
numbers
and
a
reconciliation
is
provided
in
the
appendix.
3
1Q15
Common
Equity
Tier
1
is
an
estimate.
This
number
is
Non-GAAP.
2
Revenue
excluding
positive
impact
of
mortgage
servicing
sale
was
$278mm
in
1Q14
and
excludes
$20mm
of
previously
unrecognized
servicing
fees
associated
with
the
MSR
sale. |
 1Q15 Segment
Highlights 7
1
Corporate and Consolidated show net income available to common, which reflects $3mm of
noncontrolling interest and $1.6mm of preferred stock dividends in each quarter. 2
Segment
EPS
impacts
are
Non-GAAP
numbers
and
reconciled
in
the
table.
EPS
impacts
are
calculated
using
the
1Q15
net
income
column
divided
by
the
233
million
diluted
shares
outstanding.
3
Regional Banking pre-tax pre-provision net revenue is a Non-GAAP number and a
reconciliation is provided in the appendix. Drivers and Impacts
Net Income
$ in millions,
except EPS
1Q15
Per Share
Impact
Regional
Banking
Capital
Markets
Corporate
Non-
Strategic
Total
4Q14
$51
$4
$(13)
$5
$47
1Q14
$36
$5
$(8)
$12
$46
1Q15
$48
$7
$(18)
$(114)
$(77)
$0.20
$0.03
$(0.07)
$(0.49)
$(0.33)
Fixed income ADR of $877k in 1Q15 vs $630k in 4Q14
Expenses up 18% linked quarter and 4% year over year, primarily due to
variable compensation
1Q15 included $163mm expense related to legal matters
Loan loss provision of $0.1mm in 1Q15 vs $0.4mm in 4Q14 and credit of
$3mm in 1Q14
PPNR up 13% year over year
NII up 9% year over year, but down 2% linked quarter primarily due to
day count
Average loans up 3% linked quarter and 14% year over year
1Q15 provision of $5mm vs 4Q14 provision of $6mm
Tax benefit of $12mm in 1Q15 vs $20mm in 4Q14
Security gains of $0.3 in 1Q15 vs $6mm in 1Q14
Numbers may not add to total due to rounding.
1
2
3
1
1 |
 Regional Banking
Financial Results 8
Net Interest Income
Fee Income
Expense
$ in millions
Financial Results
1Q15
$154
Loan Loss Provision
Pre-Provision Net Revenue
1
$60
$136
$79
$5
1Q15 vs
+$12
$0
+$3
+$9
-$8
4Q14
$158
$64
$138
$84
$6
1Q14
$142
$60
$133
$69
$13
4Q14
-$3
-$4
-$2
-$6
-$1
1Q14
Actuals
PPNR and net income up 13% and 31%, respectively, year over year, but down linked quarter
largely due to seasonal factors
Average loans increased 3% linked quarter and 14% year over year
Average core deposits up 6% linked quarter and up 9% year over year
Revenues down 3% linked quarter, but up 6% year over year
NII down 2% from fewer days in quarter, but up 9% year over year
Fee income down 6% linked quarter largely due to seasonal decline in deposit, brokerage and
trust fees Efficiency ratio improvement of 234
bps
year over year
1Q15 net charge-offs of $6mm,
or annualized 0.17%
of average loans, compared to $7mm, or annualized
0.20%, in 4Q14
Numbers may not add to total due to rounding.
Net Income
$48
$51
$36
+11
-$3
1
Regional Banking pre-tax pre-provision net revenue is a Non-GAAP number and a
reconciliation is provided in the appendix. |
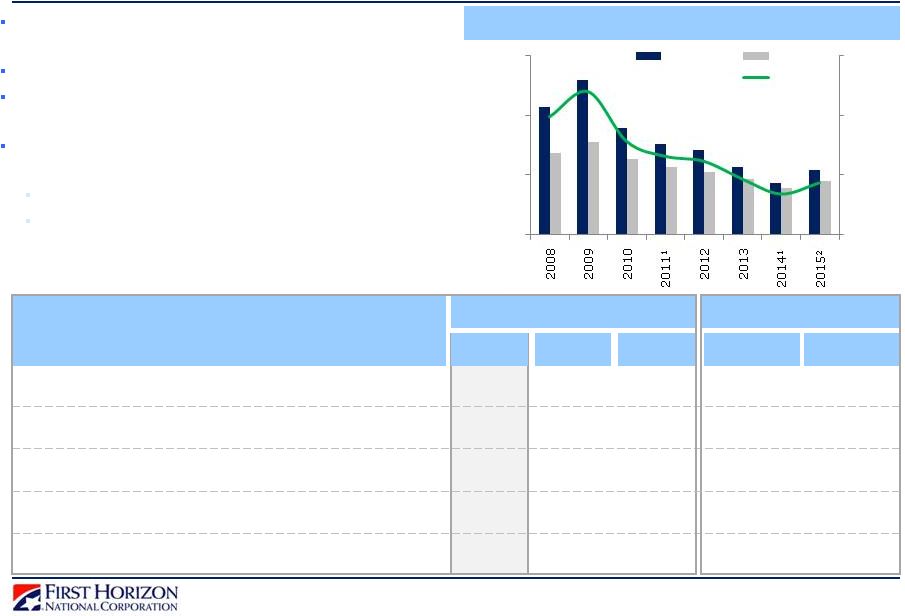
 9
1
Average Regional Banking loan growth from 4Q14 to 1Q15.
Profitable Growth Opportunities: Regional Banking
Double Digit Loan Growth Year over Year
Regional
Banking
Loan
Growth
by
Lending
Area
1
Regional Banking average loan growth of 14% year
over year and 3% linked quarter
Commercial loans up 15% year over year and 4%
linked quarter
Commercial loan utilization rate up ~300bps
linked quarter
Continued growth in specialty lending areas
Asset-based lending growth due to funding of
commitments
Loans to mortgage companies increase driven by
higher refi activity
+3%
Loans to Mortgage Companies
Commercial
Asset-Based Lending
Regional
Bank
Areas
of
Linked
Quarter
Loan
Growth
1
Commercial
Business
PC/WM
Retail
Loans to
Mortgage Cos
CRE
ABL
Other
Specialty
$3.26B
$3.39B
$0.76B
$0.76B
$1.86B
$1.88B
$2.13B
$2.11B
$0.93B
$1.04B
$1.24B
$1.24B
$1.37B
$1.44B
$1.58B
$1.66B
4Q14
1Q15
$0
$2
$4
$6
$8
$10
$12
$14B
12%
5%
4% |
 10
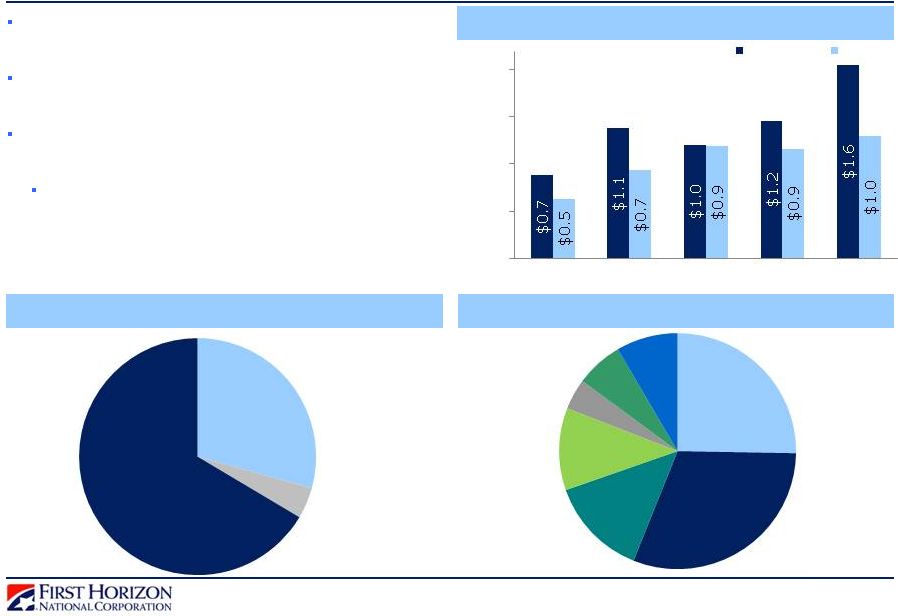
FTN Financial Capital Markets
Capital Markets’
Distribution Platform Demonstrates Strength
$750mm
Capital Markets Revenue and Expense
Fixed income average daily revenue at $877k in 1Q15, up
~40% linked quarter
Increased flows due to higher rate volatility
Expenses up linked quarter due to higher variable
compensation and seasonal FICA expense in 1Q15
Focused on investing in extensive fixed income distribution
platform:
Expansion of municipal products platform
Continued development of public finance capability
Numbers may not add to total due to rounding.
$3mm
Left Axis:
Right Axis:
NII
Fee Income
$ in millions, except ADR
Financial Results
1Q15
$4
Pre-Tax Income
$62
$11
1Q15 vs
+$1
+$5
+$4
4Q14
$4
$49
$6
1Q14
$3
$57
$8
4Q14
+$1
+$13
+$5
1Q14
Actuals
Expense
$55
+$2
$46
$53
+$8
Average Daily Revenue (ADR)
$877k
$630k
$813k
+$64k
+$247k
$0
$1
$2
$0
$250
$500
Revenue
Expense
ADR
2
1Q15 annualized.
These are Non-GAAP numbers and a reconciliation is provided in the appendix.
1
2011 excludes $36.7mm of expense associated with the Sentinel settlement. 2014 excludes the
$47mm recovery of the Sentinel settlement expense and legal fees. |
 11
Numbers may not add to total due to rounding.
1
NII sensitivity analysis uses FHN’s balance sheet as of 1Q15 and is Non-GAAP. Long
End +50bps assumes yield curve spreads widen ~50bps. Long end -50bps assumes yield curve spreads compress
~50bps. Bps impact assumes increase in Fed Funds rate. Non-Strategic is interest rate
neutral, thus nearly all the sensitivity impact would be allocated to the Core Businesses.
Net Interest Income Sensitivity Impact
1
NII and Net Interest Margin
Balance Sheet Positioned to Benefit from Rising Rates
Average core deposits up 7% linked quarter, 11% YOY
Regional Banking average deposit rate paid of 14bps in
1Q15 and 4Q14
Floating rate loans comprise 66% of loan portfolio vs
fixed rate loans at 34%
Attractive and stable low-cost funding mix in Regional
Banking with 58% DDA and interest checking deposits
Average Deposit Growth
15%
1Q15
$157
2.74%
NII and NIM Change Drivers
NII
NIM
($ in millions)
4Q14
$159
2.86%
Deposit Growth/Higher Fed Balances
Loan Fees & Cash Basis Income/Other
Commercial Loan Yields
Reduction of Non-Strategic Loans
Pre-Funding
of
Debt
Maturity
Increased Commercial Loan Volumes
+4%
+6%
+9%
+14%
Linked Quarter:
Year Over Year:
Consumer
Consumer
Commercial
Commercial
Fewer Days in Quarter
-$0.8
-5bp
-1bp
-$0.5
-1bp
$0.5
-$1.2
-6bp
1bp
$1.9
-
-
-$2.1
-
-1.7%
-$11mm
+1.5%
+$9mm
+6.3%
+$40mm
+12.2%
+$78mm
Long End
-50bps
Long End
+50bps
+100bps
+200bps
-3%
0%
3%
6%
9%
12% |
 12
Delivering Efficiencies
Expenses down 2% year over year
Annualized noninterest expense declined 22% since 2012
Ongoing efficiency opportunities:
Continued wind-down of Non-Strategic segment (decreased legal/professional fees,
credit, and repurchase expense)
Streamline end-to-end processes
Reduce corporate real estate footprint
Right-size branch network as consumer usage shifts to FHN’s expanded digital banking
platforms All
Non-GAAP
numbers
are
reconciled
in
the
appendix.
1
Expenses
excluding
litigation
charge
is
a
Non-GAAP
number.
2
1Q12 excludes ~$49mm in mortgage repurchase provision. 1Q13 excludes ~$5mm in litigation
expense. 1Q14 excludes ~$0.1mm in litigation expense, and 1Q15 excludes ~$163mm in
litigation expense. These are Non-GAAP numbers . 3
Non-Strategic excludes ~$0.1mm and ~$163mm in litigation expense in 2014 and 2015
respectively. These are Non-GAAP numbers. Annualized Noninterest Expense
-22%
Noninterest Expense Trends by Segment 1Q14-1Q15
Regional Banking
Capital Markets
Corporate
Non-Strategic
$1,090mm
$941mm
$872mm
$855mm
1Q12
1Q13
1Q14
1Q15
-41%
-
18%
4%
2%
Annualized
Annualized
Annualized
Annualized
3
2
1
2 |
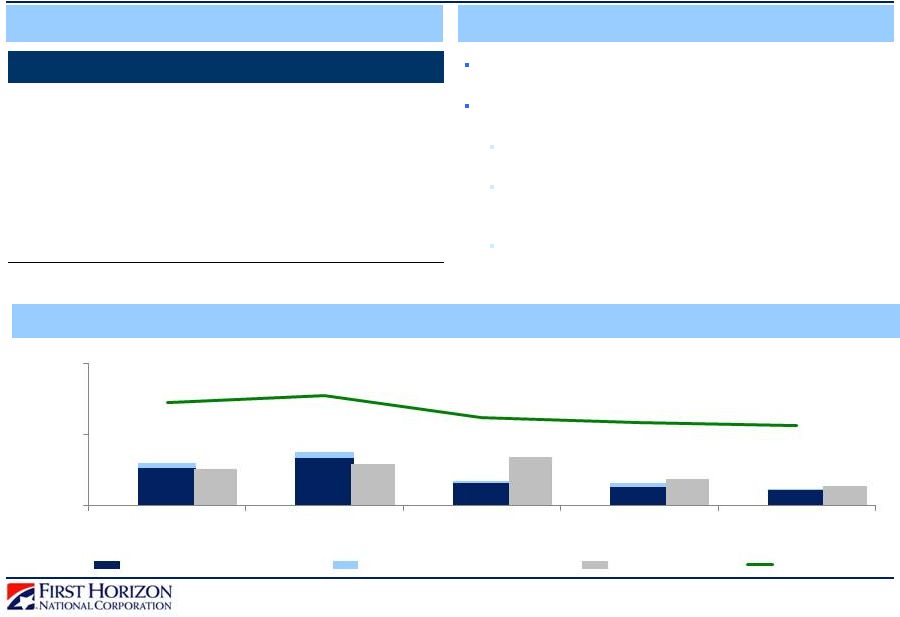
 13
Non-Performing Assets
Net Charge-Offs
Asset Quality Trends
Continued Improvement in Credit Trends
Reserves
Net charge-offs of $9mm in 1Q15, compared to
$12mm in 4Q14 and $17mm in 1Q14
Annualized net charge-off ratio improvement of 7
bps to 0.23% from 4Q14
NPL levels at $207mm, down 2% linked quarter and
32% year over year
Commercial
NPLs
down
2%
linked
quarter
and
30% year over year
Numbers may not add to total due to rounding.
1
Net charge-off % is annualized.
$0
$100
$200
$300
1Q14
2Q14
3Q14
4Q14
1Q15
NPLs
NPLs Held for Sale
ORE
1.00%
1.25%
1.50%
1.75%
2.00%
$200
$220
$240
1Q14
2Q14
3Q14
4Q14
1Q15
Reserves $
Reserves / Loans %
0.00%
0.13%
0.25%
0.38%
0.50%
$0
$5
$10
$15
1Q14
2Q14
3Q14
4Q14
1Q15
NCOs $
Provision $
NCO %¹
$400mm
$260mm
$20mm |
 Tier 1 Common to
Common Equity Tier 1: Remain Well Capitalized
14
Numbers
may
not
add
to
total
due
to
rounding
1
4Q14
Tier
1
Common
is
a
Non-GAAP
number
and
a
reconciliation
is
provided
in
the
appendix.
2
1Q15
Common
Equity
Tier
1
is
an
estimate.
4Q14
Tier 1
Common
1
1Q15
Common
Equity
Net Retained
Income
Excluding
After-tax
DOJ/HUD
Settlement
Phase-in of
Basel III
11.4%
-10bp
-60bp
10.3%
+10bp
DOJ/HUD
Settlement
Transition
to
Common
Equity
Tier
1
(CET1)
from
Tier
1
Common
due
to
phase-in
of
Basel
III
Utilizing excess capital via earning asset growth
Strong capital ratios provide continued flexibility
RWA Increase
from Earning
Asset Growth /
Other
-50bp
Tier 1
2
0%
2%
4%
6%
8%
10%
12% |
 15
1Q15
Consolidated
Core Businesses
4
Long-Term Targets
ROTCE
1,2
8.30%
8.99%
15.0 –
20.0%
ROA
1,2
0.73%
0.73%
1.25 -
1.45%
NIM
2.74%
2.81%
3.50 -
4.00%
CET1 (Consolidated) &
Allocated CET1 (Core)
10.3%
9.7%
8.0 –
9.0%
NCO / Average Loans
0.23%
0.17%
0.30 -
0.70%
Fee Income / Revenue
45%
47%
40 -
50%
Efficiency Ratio
75%
76%
60 -
65%
Building Long-Term Earnings Power: Bonefish Targets
Focused on Growing Our Company Selectively and Profitably While Positioning
Our Balance Sheet for Sustainable, Higher Returns in the Long Term
Annualized Net Charge-Offs
0.30% -
0.70%
% Fee Income
40% -
50%
Efficiency Ratio
60% -
65%
Return on Tangible
Common Equity
15% -
20%
Equity / Assets
Risk Adjusted Margin
Total Assets
Earning Assets
Pre-tax Income
Tax Rate
Common Equity
Tier 1
8% -
9%
Return on Assets
1.25% -
1.45%
Net Interest Margin
3.50% -
4.00%
1
3
1
2
2
Consolidated ROTCE, ROA and Efficiency Ratio are adjusted for litigation expense and are
Non-GAAP numbers. 3
Common Equity Tier 1 (CET1): Current quarter is an estimate. Allocated CET1 refers to implied
CET1 of ~9.7% in core businesses. 4
Core Businesses include Regional Banking, Capital Markets, and Corporate segments. Core data
is Non-GAAP. All Non-GAAP numbers are reconciled in the appendix. ¹ROTCE, ROA, NIM, and NCO / Average Loans are annualized. |
 16
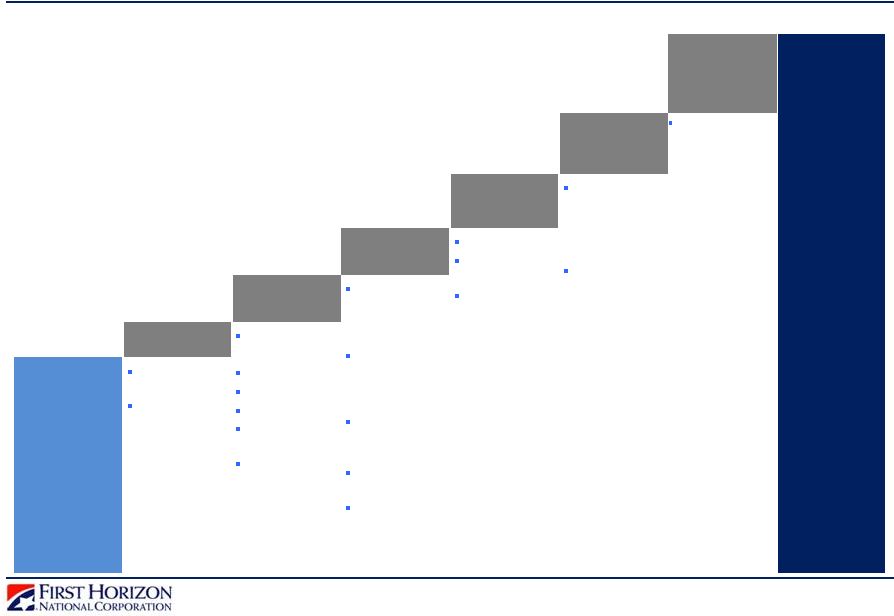
Closing the Gap to Bonefish Targets
Building a Foundation for Long-Term Earnings Power
Current
ROTCE /
EPS
Rise in
Interest
Rates
1
Target
Bonefish
ROTCE /
EPS
Growth
Opportunities
Economic
Profit
Improvement
Optimize/
Redeploy
Capital
Continued
Efficiencies
Non-Strategic
Wind-Down
Infrastructure
Reductions
Established
Market
Profitability/
Growth
Product/
Relationship
Profitability
Improvement
Sales
Productivity
Improvement
Process
Improvements
Branch
Network
Rationalization
Dividends
Share
Buybacks
M&A
Latent Income
Embedded in
Asset-Sensitive
Balance Sheet
Specialty
Lending
Mid-Atlantic
Middle TN
Houston
Wealth /
Investments
Municipals
(FTN
Financial)
1
Rise in interest rates represents cumulative growth rate in net interest income over a
3-year strategic time horizon. Chart illustrates a quantified path to long-term
goals; it contains no forecasts. 0.5% to 1.0%
1.0% to 1.5%
1.0% to 1.5%
1.0% to 1.5%
1.0% to 2.5%
3.0% to 3.8%
Latent Income
Embedded in
Fixed Income
Platform
Capacity
ADR at
$1.0-$1.5mm
Increased
Capital
Markets
Activity |
 17
Building a Foundation for Attractive Long-Term Earnings Power
Proven execution capabilities
Unique size, scope, and strengths
Focused
on
efficiency,
productivity,
economic
profitability,
and
growth
opportunities
Organizational alignment on the path to achieving long-term bonefish profitability
Breadth and depth of talent that will be able to profitably run and grow the company
Successfully Executing on Key Priorities
FHN is Well Positioned for Attractive Long-Term Earnings Power |
 APPENDIX
18 |
 Notable
Items 19
Impact to EPS²
Previously Unrecognized Servicing Fees
Associated with the MSR Sale
$12.3mm
After-Tax Amount¹
$0.05
Securities Gain on an Equity Investment
$3.4mm
$0.01
Notable Item
Pre-Tax Amount
$20.0mm
$5.6mm
Refer to financial supplements for other notable items.
1
After-tax
impact
assumes
a
tax
rate
of
~38.6%
in
1Q14,
~33.3%
in
2Q14,
~37%
in
3Q14,
and
~23.6%
in
1Q15,.
2
EPS impact calculated by dividing the after-tax impact by the 237mm diluted shares
outstanding in 1Q14-3Q14. 3
EPS impact of agreement in principle with DOJ/HUD is reconciled in the appendix.
Lease Abandonment & Other Restructuring
Charges
($3.5)mm
$(0.01)
$(5.7)mm
Held-for-Sale (Primarily NPL) Portfolio Valuation
Adjustment
$5.5mm
$0.02
$8.2mm
Net Impact from Resolution/ Collapse of On-
Balance Sheet Consumer Securitizations
($3.9)mm
$(0.02)
$(6.4)mm
Litigation Expense Recovery
$31.4mm
$0.13
$47.1mm
Gains on Sales of Held-for-Sale Loans in Non-
Strategic Portfolio
$25.2mm
$0.11
$39.7mm
Loss Accruals Related to Legal Matters
$(31.5)mm
$(0.13)
$(50.0)mm
Litigation Expense Recovery
$9.5mm
$0.04
$15.0mm
$(35.0)mm
$(22.0)mm
$(0.09)
Net Loss Accruals Related to Legal Matters
None
Agreement in principle with DOJ/HUD to settle
potential claims on FHA loans
$(162.5)mm
$(124.1)mm
$(0.51)³ |
 20
1Q15 Credit Quality Summary by Portfolio
Numbers
may
not
add
to
total
due
to
rounding.
Data
as
of
1Q15.
NM:
Not
meaningful.
($ in millions)
CRE
HE &
HELOC
Other
1
Total
Permanent
Mortgage
Commercial
(C&I & Other)
CRE
HE &
HELOC
Permanent
Mortgage
Other
2
Total
Period End Loans
$9,185
$1,320
$3,358
$337
$14,200
$123
$453
$1
$1,565
$379
$11
$16,732
30+ Delinquency
0.07%
0.32%
0.55%
1.29%
0.24%
3.41%
0.08%
14.87%
1.92%
2.50%
1.40%
0.47%
Dollars
$7
$4
$18
$4
$34
$4
$0
$0
$30
$9
$0
$78
NPL %
0.24%
1.00%
0.84%
0.15%
0.45%
2.29%
2.68%
18.31%
5.83%
7.82%
6.66%
1.20%
Dollars
$22
$13
$28
$0
$64
$3
$12
$0
$91
$30
$1
$200
Net Charge-offs
3
%
0.08%
0.03%
0.15%
3.22%
0.17%
NM
NM
2.64%
0.64%
0.59%
9.24%
0.23%
Dollars
$2
$0
$1
$3
$6
NM
$0
$0
$3
$1
$0
$9
Allowance
$63
$18
$33
$13
$126
NM
$5
$0
$77
$20
$1
$228
Allowance / Loans %
0.68%
1.33%
0.97%
3.88%
0.89%
NM
1.09%
8.22%
4.90%
5.32%
4.69%
1.36%
Allowance / Charge-offs
9.42x
52.33x
6.45x
1.16x
5.41x
NM
NM
1.06x
7.36x
8.82x
0.49x
6.17x
Regional Banking
Corporate
4
Non-Strategic
Commercial
(C&I & Other)
1
Creditcard,
Permanent
Mortgage,
and
Other.
2
Credit
card,OTC,
and
Other
Consumer.
3
Net
charge-offs
are
annualized.
4
Exercised
clean-up
calls
on
jumbo
securitizations
in
1Q13,
3Q12,
2Q11,
and
4Q10,
which
are
now
on
balance
sheet
in
the
Corporate
segment. |
 21
C&I and CRE Portfolio Detail
$9.6B C&I portfolio, diversified by industry, managed
primarily in Regional Banking
$1.3B CRE portfolio, comprising 8% of period-end
consolidated loans
Commercial (C&I and CRE) net charge-offs were $2mm
for the quarter
Charge-offs were $4.3mm with recoveries of
$2.6mm
Data as of 1Q15. Numbers may not add to total due to rounding.
CRE: Loan Type
CRE: Collateral Type
C&I: Loans to Mortgage Companies
Construction
29%
Land
4%
Mini-
Perm/Non-
Construction
66%
Retail
25%
Multi-Family
31%
Office
14%
Industrial
11%
Land
4%
Other
6%
Hospitality
8%
$0.0
$0.4
$0.8
$1.2
$1.6
1Q14
2Q14
3Q14
4Q14
1Q15
Period End
Average |
 22
Consumer Portfolio Overview
Data as of 1Q15. Numbers may not add to total due to rounding.
HELOC Draw vs
Repayment Balances
Percent of Home Equity Portfolio:
Months Left in Draw Period
Home Equity Portfolio Characteristics
Home Equity Geographic Distribution
Non-Strategic Consumer
Real Estate Run-Off
First
Second
Total
Balance
$2.8B
$2.1B
$4.9B
Original FICO
753
735
745
Refreshed FICO
752
723
739
Original CLTV
77%
81%
79%
Full Doc
93%
74%
85%
Owner Occupied
93%
95%
94%
HELOCs
$0.7B
$1.7B
$2.4B
Weighted Average
HELOC Utilization
47%
56%
54%
22%
15%
17%
8%
5%
32%
0%
5%
10%
15%
20%
25%
30%
35%
0-12
13-24
25-36
37-48
49-60
>60
$1.7
$0.7
$0.0
$0.5
$1.0
$1.5
In Draw
In
Repayment
19%
19%
21%
25%
28%
15%
18%
21%
24%
27%
30%
$0.0
$0.5
$1.0
$1.5
$2.0
1Q14
2Q14
3Q14
4Q14
1Q15
Period End Balance
Constant Pre-Payment Rate (Right Axis)
Core
Banking
Customers
TN
60%
CA
8%
VA
3%
GA
3%
Other
26%
$2.0B
$2.5B |
 23
Agency & Non-Agency Update
Repurchase Resolution Agreements with Both GSEs
Data
as
of
1Q15.
Numbers
may
not
add
to
total
due
to
rounding.
1
Based
on
UPB.
The
pipeline
represents
active
investor
claims
and
mortgage
insurance
(MI)
cancellations
under
review,
both
of
which
could occur on the same loan. Excludes MI cancellation notices that have been reviewed and
coverage has been lost. MI cancellations that have resulted in lost coverage are included in management’s
assessment
of
the
adequacy
of
repurchase
reserves.
1Q14,
2Q14,
3Q14,
4Q14,
and
1Q15
resolutions
include
$13.7mm,
$6.5mm,
$4.8mm,
$4.2mm,
and
$5.0mm
in
other
claims,
respectively,
that
pose
no risk to the repurchase reserve but require formal acknowledgment with Fannie.
Total
Pipeline
of
Repurchase
Requests
1
$300mm
Mortgage Repurchase Reserve
($ in millions)
Beginning Balance
Net Realized Losses
Ending Balance
Provision
2Q14
$145
$(4)
$141
$0
3Q14
$141
$(13)
$125
$(4)
4Q14
$125
$(6)
$119
$0
1Q14
$165
$(20)
$145
$0
Other Whole Loan Sales and Non-Agency
Represent 48% of all active repurchase/make whole
requests in 1Q15 pipeline
Some non-Agency FHN loans were bundled with other
companies’
loans and securitized by the purchasers
A trustee for a bundler has commenced a legal
action seeking repurchase of FHN loans
Certain purchasers have requested indemnity
related to FHN loans included in their
securitizations
Loan file review process regarding certain bundled
FHN loans has been initiated
1Q15
$119
$(3)
$116
$0
Loan Sales
$0
$2
$0
$0
$0
$0
$150
1Q14
2Q14
3Q14
4Q14
1Q15
GSE New Requests
Other New Requests
Resolved
Pipeline |
 FH Proprietary
Securitizations Litigation Certificate Breakdown
24
$627mm
FHAMS 2005-FA10
($ in millions)
Deal
FHASI 2007-AR2
1
(Schwab)
Senior
$50.0
$33.4
$14.3
$12.6
$1.7
$2.3
FHAMS 2006-FA6
(FDIC Alabama)
Senior
$11.1
$3.4
$6.2
$5.1
$1.1
$1.5
FHAMS 2006-FA6
(FDIC Alabama)
Senior
$15.2
$5.1
$8.9
$7.2
$1.7
$1.3
FHAMS 2006-FA7
(FDIC Alabama)
Senior
$20.7
$6.7
$11.4
$9.4
$2.0
$2.6
FHAMS 2007-FA4
1
(FDIC Alabama)
Senior
$14.4
$4.1
$8.3
$6.7
$1.6
$1.9
FHAMS 2007-FA1
(FDIC New York)
Senior
$44.5
$15.1
$23.2
$18.9
$4.3
$6.2
FHAMS 2007-FA2
(FDIC New York)
Senior
$34.9
$12.5
$17.9
$14.4
$3.5
$4.5
FHAMS 2005-FA8
(FHLB Indemnification)
Senior
$100.0
$79.6
$19.9
$17.7
$2.2
$0.5
FHAMS 2007-FA3
(MetLife Indemnification)
Senior
$103.0
$61.6
$33.0
$27.1
$5.9
$8.5
2
(Royal Park Indemnification)
Senior
$100.0
$66.3
$29.6
$26.1
$3.5
$4.1
FHAMS 2006-FA2
1
(Royal Park Indemnification)
Senior
$30.0
$23.5
$5.3
$4.5
$0.8
$1.2
FHAMS 2005-FA9
(Integra REC Indemnification)
Junior
$2.3
$0.1
$0.0
$0.0
$0.0
$2.2
FHAMS 2006-FA8
(Integra REC Indemnification)
Senior
$101.5
$63.4
$30.5
$25.3
$5.1
$7.6
Total
$627.5
$374.7
$208.4
$175.1
$33.3
$44.4
Cumulative
Loss
Certificate
Original
UPB
Paid
Off
Current
UPB
Performing
UPB
60D+
Delinquent
Paid Off
60%
Performing UPB
28%
60D+ Delinquent
³
5%
Cumulative Loss 7%
Numbers and percentages may not add to total due to rounding. Data source: March 2015 Trustee
Reports. Table excludes three FHAMS certificates at issue in the Tennessee CRS matter as to which FHN
is not a defendant but indemnity recently has been demanded. 1
The complainants only purchased a portion of these tranches. Original UPB estimated based on
the purchase price stated in the complaints. All other metrics prorated based on the ratio of
purchase price to the total original UPB of the entire tranche. ²Royal Park is asking for indemnification on $100mm of the $190mm tranche as stated in
the indemnification request. ³60D+
Delinquent defined as a delinquency status of 60 days or more and also bankruptcies,
foreclosures and REO in such status for 60 days or more. |
 Reconciliation to
GAAP Financials 25
Slides in this presentation use non-GAAP information of risk weighted assets, tangible
common equity, net income, non-controlling interest,
average
common
equity,
intangibles,
and
various
ratios
using
those
measures.
That
information
is
not
presented
according
to
generally
accepted
accounting
principles
(GAAP)
and
is
reconciled
to
GAAP
information
below.
Numbers may not add to total due to rounding.
1
Core Businesses include the Regional Banking, Capital Markets, and Corporate segments.
($ in millions)
1Q15
Core Businesses Return On Tangible Common Equity
(Segment equity based on internal risk-based methodology)
Corporate Average Equity (GAAP)
$1,145
Less: Corporate Non-Controlling Interest (GAAP)
$295
Less: Corporate Preferred Stock (GAAP)
$96
Corporate Average Common Equity (GAAP)
$754
Regional Banking Average Common Equity (GAAP)
$936
Capital Markets Average Common Equity (GAAP)
$156
Core
Businesses
Average
Common
Equity
(Non-GAAP)
1
$1,846
Non-Strategic Average Common Equity (GAAP)
$371
FHN Average Common Equity (GAAP)
$2,216
Regional Banking Average Intangible Assets (GAAP)
$62
Capital Markets Average Intangible Assets (GAAP)
$113
Coporate Average Intangible Assets (GAAP)
$0
Core
Businesses
Average
Intangible
Assets
(Non-GAAP)
1
$175
Non-Strategic Average Intangible Assets (GAAP)
$0
FHN Average Intangible Assets (GAAP)
$175
FHN Average Common Equity (GAAP)
$2,216
Less: FHN Average Intangible Assets (GAAP)
$175
FHN Average Tangible Common Equity (Non-GAAP)
$2,042
Core
Businesses
Average
Common
Equity
(Non-GAAP)
1
$1,846
Less: Core Businesses Average Intangible Assets (Non-GAAP)
$175
Core Businesses Average Tangible Common Equity (Non-GAAP)
$1,671
Core Businesses Net Income Available to Common
Corporate Net Income (GAAP)
-$13
Less: Corporate Non-Controlling Interest (GAAP)
$3
Less: Corporate Preferred Stock Dividends (GAAP)
$2
Corporate Net Income Available to Common (GAAP)
-$18
Regional Banking Net Income Available to Common (GAAP)
$48
Capital Markets Net Income Available to Common (GAAP)
$7
Core Businesses Net Income Available to Common (Non-GAAP)
$37
Non-Strategic Net Income Available to Common (GAAP)
-$114
FHN Net Income Available to Common (GAAP)
-$77
Core Businesses Return on Tangible Common Equity
FHN Annualized Return on Average Common Equity (Non-GAAP)
-15.24%
Core Businesses Annualized Return on Average Common Equity (Non-GAAP)
8.99%
1
1
1
1
1
1
1 |
 Reconciliation to
GAAP Financials 26
Numbers may not add to total due to rounding.
1
Core Businesses include the Regional Banking, Capital Markets, and Corporate segments.
2
All else equal, a 200bps rate shock results in ~$78mm increase in Core Businesses annual NII
(see slide 11), as Non-Strategic is interest rate neutral. Slides in this
presentation use non-GAAP information of expense, revenue, repurchase provision, and various ratios using one or
more of those measures. That information is not presented according to generally accepted
accounting principles (GAAP) and is reconciled to GAAP information below.
Net Interest Margin
($ in millions)
1Q15
4Q14
3Q14
2Q14
1Q14
Regional Banking Net Interest Income (GAAP)
$154
$158
$154
$149
$142
Regional Banking FTE Adjustment
$2
$2
$2
$2
$2
Regional Banking Net Interest Income Adjusted for Impact of FTE (Non-GAAP)
$157
$160
$156
$151
$144
Capital Markets Net Interest Income (GAAP)
$4
$4
$3
$3
$3
Capital Markets FTE Adjustment
$0
$0
$0
$0
$0
Capital Markets Net Interest Income Adjusted for Impact of FTE (Non-GAAP)
$5
$4
$3
$3
$4
Corporate Net Interest Income (GAAP)
-$16
-$18
-$14
-$12
-$10
Corporate FTE Adjustment
$0
$0
$0
$0
$0
Corporate Net Interest Income Adjusted for Impact of FTE (Non-GAAP)
-$16
-$18
-$14
-$12
-$10
Core Businesses Net Interest Income (Non-GAAP)
1
$143
$143
$143
$139
$136
Core Businesses FTE Adjustment (Non-GAAP)
1
$3
$3
$2
$2
$2
Core Businesses Net Interest Income Adjusted for Impact of FTE (Non-GAAP)
$145
$146
$145
$142
$138
Non-Strategic Net Interest Income (GAAP)
$14
$16
$17
$17
$17
Non-Strategic FTE Adjustment
$0
$0
$0
$0
$0
Non-Strategic Net Interest Income Adjusted for Impact of FTE (Non-GAAP)
$14
$16
$17
$17
$17
Consolidated Net Interest Income (GAAP)
$157
$159
$160
$157
$152
Consolidated FTE Adjustment
$3
$3
$2
$2
$2
Consolidated Net Interest Income Adjusted for Impact of FTE (Non-GAAP)
$159
$162
$162
$159
$154
Average Earning Assets
1Q15
Regional Banking Earning Assets (GAAP)
$13,561
Capital Markets Earning Assets (GAAP)
$2,147
Corporate Earning Assets (GAAP)
$5,162
Core Businesses Earning Assets (Non-GAAP)
$20,870
Non-Strategic Earning Assets (GAAP)
$2,604
Consolidated Earning Assets (GAAP)
$23,474
Core Businesses NIM with 200bps Rate Shock
1
1Q15
Annualized Core Businesses Net Interest Income Adjusted for Impact of FTE (Non-GAAP)
a
$589
Core Businesses Average Earning Assets (Non-GAAP)
b
$20,870
Core Businesses NIM (Non-GAAP)
a/b
2.81%
Core Businesses Additional Annual NII from a 200bps Rate Shock (Non-GAAP)
c
$78
Core Businesses NIM with 200bps Rate Shock (Non-GAAP)
(a+c)/b
3.19%
Annualized Consolidated Net Interest Income Adjusted for Impact of FTE (Non-GAAP)
d
$646
Consolidated Average Earning Assets (GAAP)
e
$23,474
Consolidated NIM (GAAP)
d/e
2.74%
Consolidated Additional Annual NII from a 200bps Rate Shock (Non-GAAP)
f
$78
Consolidated NIM with 200bps Rate Shock (Non-GAAP)
(d+f)/e
3.09%
²
²
1
1 |
 Reconciliation to
GAAP Financials 27
Numbers may not add to total due to rounding.
1
Includes goodwill and other intangible assets, net of
amortization.
2
Current quarter is an
estimate.
Slides in this presentation use non-GAAP information of expense, revenue, repurchase
provision, and various ratios using one or more of those measures. That information is
not presented according to generally accepted accounting principles (GAAP) and is
reconciled to GAAP information below.
($ in millions)
1Q15
4Q14
3Q14
2Q14
1Q14
Tangible Common Equity (Non-GAAP)
Total Equity (GAAP)
$2,499
$2,582
$2,615
$2,621
$2,542
Less: Noncontrolling Interest
$295
$295
$295
$295
$295
Less: Preferred Stock
$96
$96
$96
$96
$96
Total Common Equity
$2,108
$2,191
$2,224
$2,230
$2,151
$174
$175
$161
$162
$163
Tangible Common Equity (Non-GAAP)
$1,934
$2,015
$2,063
$2,068
$1,988
Tangible Assets (Non-GAAP)
Total Assets (GAAP)
$25,716
$25,668
$23,986
$24,225
$23,946
$174
$175
$161
$162
$163
Tangible Assets (Non-GAAP)
$25,542
$25,493
$23,825
$24,063
$23,783
Tier 1 Common (Non-GAAP)
Tier 1 Capital
$2,452
$2,814
$2,783
$2,752
$2,666
Less:
Noncontrolling
Interest
-
FTBNA
Preferred
Stock
N/A
$295
$295
$295
$295
Less: Preferred Stock
N/A
$96
$96
$96
$96
Less: Trust Preferred
N/A
$200
$200
$200
$200
Tier 1 Common (Non-GAAP)
N/A
$2,223
$2,193
$2,161
$2,076
Risk Weighted Assets
Risk Weighted Assets
$20,795
$19,453
$19,238
$19,400
$18,695
Ratios
Tangible Common Equity to Tangible Assets (TCE/TA) (Non-GAAP)
7.57%
7.90%
8.66%
8.60%
8.36%
Total Equity to Total Assets (GAAP)
9.72%
10.06%
10.90%
10.82%
10.61%
Tier 1 Common to Risk Weighted Assets (Non-GAAP)
N/A
11.43%
11.40%
11.14%
11.10%
Tier 1 Capital to Total Assets (GAAP)
9.54%
10.96%
11.60%
11.36%
11.14%
Less: Intangible Assets (GAAP)
Less: Intangible Assets (GAAP)
1
1
2
2
2
2
2 |
 28
Slides in this presentation use non-GAAP information of expense, revenue, repurchase
provision, and various ratios using one or more of those measures. That information is
not presented according to generally accepted accounting principles (GAAP) and is
reconciled to GAAP information below.
Numbers may not add to total due to rounding.
1
Core Businesses include the Regional Banking, Capital Markets, and Corporate segments.
2
ROA and Net Charge-offs / Average loans are annualized for 1Q15.
Reconciliation to GAAP Financials
($ in millions)
Net Interest Available to Common/EPS Excluding Litigation Charge
1Q15
-$95
$163
$68
$22
$46
$3
$2
$42
235
$0.18
Impact to EPS of Litigation Charge
Earnings Per Share (GAAP)
-$0.33
Less: Earnings Per Share Excluding Litigation Charge (Non-GAAP)
$0.18
Impact to EPS of Litigation Charge (Non-GAAP)
-$0.51
Adjusted Annualized Net Income Available to Common Shareholders Excluding Litigation Charge
(Non-GAAP) $169
FHN Average Tangible Common Equity (GAAP)
$2,042
Consolidated Return on Average Tangible Common Equity Excluding Litigation Charge
(Non-GAAP) 8.30%
$187
Average Total Assets (GAAP)
$25,645
Consolidated Return on Assets Excluding Litigation Charge (Non-GAAP)
0.73%
Consolidated Efficiency Ratio Excluding Litigation Charge
Adjusted Consolidated Noninterest Expense (Non-GAAP)
$214
Total Revenue Excluding Securities Gains (GAAP)
$286
Consolidated Efficiency Ratio Excluding Litigation Charge (Non-GAAP)
75%
Return
on Assets²
Net Interest
Margin
Regional Banking (GAAP)
1.35%
4.68%
Capital Markets (GAAP)
1.17%
0.83%
Corporate (GAAP)
-0.84%
-1.28%
Core Businesses (Non-GAAP)¹
0.73%
2.81%
Non-Strategic (GAAP)
-18.05%
2.19%
Consolidated (GAAP)
-1.15%
2.74%
Adjusted Annualized Consolidated Net Income Excluding Litigation Charge (Non-GAAP)
Less: Preferred Stock Dividends (GAAP)
Assumed Diluted Shares with Net Income Instead of Net Loss (Non-GAAP)
Consolidated Return on Assets Excluding Litigation Charge
Consolidated Return on Average Tangible Common Equity Excluding Litigation Charge
Key Ratios Excluding Litigation Charge
Earnings Per Share Excluding Litigation Charge (Non-GAAP)
Net Income Available to Common Shareholders Excluding Litigation Charge (Non-GAAP)
Consolidated Pre-tax Loss (GAAP)
Plus: Litigation Charge (GAAP)
Adjusted Consolidated Pre-tax Income (Non-GAAP)
Less: Adjusted Tax Using Estimated Tax Rate of ~32% (Non-GAAP)
Less: Net Income Attributable to Noncontrolling Interest (GAAP)
Adjusted Net Income Excluding Litigation Charge (Non-GAAP)
0.55%
15%
NM
0.23%
45%
NM
Net Charge-Offs/
Average Loans²
Fee Income /
Total Revenue
Efficiency
Ratio
0.17%
28%
63%
0.00%
93%
83%
NM
NM
NM
0.17%
47%
76% |
 29
Slides in this presentation use non-GAAP information of expense, revenue, repurchase
provision, and various ratios using one or more of those measures. That information is
not presented according to generally accepted accounting principles (GAAP) and is
reconciled to GAAP information below.
Numbers may not add to total due to rounding.
Reconciliation to GAAP Financials
($ in millions)
1Q15
4Q14
1Q14
Regional Banking Pre-Provision Net Revenue
$215
$222
$202
$136
$138
$133
$79
$84
$69
1Q15 Changes vs
Adjusted Consolidated Noninterest Expense
1Q15
1Q14
1Q13
1Q12
1Q14
1Q12
$376
$218
$241
$322
73%
17%
$0
$0
$0
$49
$163
$0
$5
$0
$214
$218
$235
$273
-2%
-22%
$855
$872
$941
$1,090
2014
2011
Capital Markets Noninterest Expense (GAAP)
$147
$321
Sentinel Noninterest Expense/(Recovery) (GAAP)
($47)
$37
Adjusted Capital Markets Noninterest Expense (Non-GAAP)
$194
$284
1Q15
1Q14
Change
$172
$16
$0
$0
$163
$0
$9
$15
-41%
Adjusted Capital Markets Noninterest Expense
Adjusted Annualized Noninterest Expense (Non-GAAP)
Regional Banking Total Revenue (GAAP)
Regional Banking Total Expense (GAAP)
Regional Banking Pre-Provision Net Revenue (Non-GAAP)
Consolidated Noninterest Expense (GAAP)
Less: Repurchase and Foreclosure Provision (GAAP)
Adjusted Non-Strategic
Adjusted Non-Strategic Noninterest Expense (Non-GAAP)
Less: Repurchase and Foreclosure Provision (GAAP)
Less: Litigation Charge (GAAP)
Less: Litigation Charge (GAAP)
Adjusted Consolidated Noninterest Expense (Non-GAAP)
Non-Strategic Noninterest Expense (GAAP) |