Attached files
| file | filename |
|---|---|
| 8-K - 8-K - FIRST HORIZON CORP | d909879d8k.htm |
| EX-99.2 - EX-99.2 - FIRST HORIZON CORP | d909879dex992.htm |
Exhibit 99.1

FIRST QUARTER 2015
FINANCIAL SUPPLEMENT
If you need further information, please contact:
Aarti Bowman, Investor Relations
901-523-4017
aagoorha@firsthorizon.com
| FHN TABLE OF CONTENTS
|
|
|||||
| Page | ||||||
| First Horizon National Corporation Segment Structure |
3 | |||||
| Performance Highlights |
4 | |||||
| Consolidated Results |
||||||
| Income Statement |
||||||
| Income Statement |
6 | |||||
| Other Income and Other Expense |
7 | |||||
| Balance Sheet |
||||||
| Period End Balance Sheet |
8 | |||||
| Average Balance Sheet |
9 | |||||
| Net Interest Income |
10 | |||||
| Average Balance Sheet: Yields and Rates |
11 | |||||
| Capital Highlights |
12 | |||||
| Business Segment Detail |
||||||
| Segment Highlights |
13 | |||||
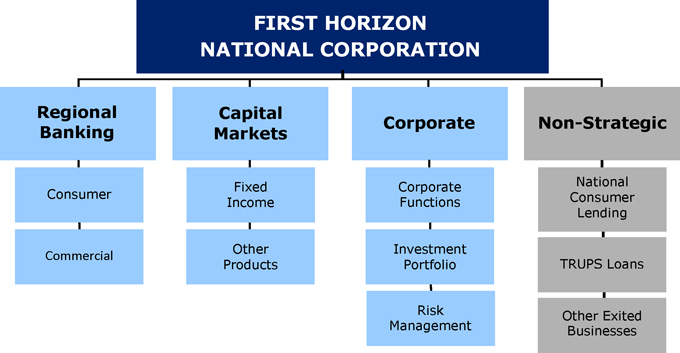
| Regional Banking |
14 | |||||
| Capital Markets and Corporate |
15 | |||||
| Non-Strategic |
16 | |||||
| Asset Quality |
||||||
| Asset Quality: Consolidated |
17 | |||||
| Asset Quality: Regional Banking and Corporate |
19 | |||||
| Asset Quality: Non-Strategic |
20 | |||||
| Portfolio Metrics |
21 | |||||
| Non-GAAP to GAAP Reconciliation |
22 | |||||
| Glossary of Terms |
23 | |||||
Other Information
This financial supplement contains forward-looking statements involving significant risks and uncertainties. A number of important factors could cause actual results to differ materially from those in the forward-looking information. Those factors include general economic and financial market conditions, including expectations of and actual timing and amount of interest rate movements including the slope of the yield curve, competition, customer and investor responses to these conditions, ability to execute business plans, geopolitical developments, recent and future legislative and regulatory developments, natural disasters, and items mentioned in this financial supplement and in First Horizon National Corporation’s (“FHN”) most recent press release, as well as critical accounting estimates and other factors described in FHN’s recent filings with the SEC. FHN disclaims any obligation to update any such factors or to publicly announce the result of any revisions to any of the forward-looking statements included herein or therein to reflect future events or developments.
Use of Non-GAAP Measures
Certain ratios are included in this financial supplement that are non-GAAP, meaning they are not presented in accordance with generally accepted accounting principles (“GAAP”) in the U.S. FHN’s management believes such ratios are relevant to understanding the capital position and results of the Company. The non-GAAP ratios presented in this financial supplement are tangible common equity (“TCE”) to tangible assets (“TA”), tangible book value per common share, tier 1 common to risk weighted assets (“RWA”) (for periods prior to first quarter 2015), pre-tax pre-provision net revenue (“PPNR”), net income available to common shareholders excluding litigation charges, and diluted earnings per share (“EPS”) excluding litigation charges. These ratios are reported to FHN’s management and Board of Directors through various internal reports. Additionally, disclosure of non-GAAP capital ratios provides a meaningful base for comparability to other financial institutions as demonstrated by their use by the various banking regulators in reviewing the capital adequacy of financial institutions. Non-GAAP measures are not formally defined by GAAP or codified in currently effective federal banking regulations, and other entities may use calculation methods that differ from those used by FHN. Tier 1 capital is a regulatory term and is generally defined as the sum of core capital (including common equity and instruments that can not be redeemed at the option of the holder) adjusted for certain items under risk based capital regulations. Also a regulatory term, risk weighted assets includes total assets adjusted for credit risk and is used to determine regulatory capital ratios. Refer to the tabular reconciliation of non-GAAP to GAAP measures and presentation of the most comparable GAAP items on page 22 of this financial supplement.
2
| FIRST HORIZON NATIONAL CORPORATION SEGMENT STRUCTURE |

|
3
FHN PERFORMANCE HIGHLIGHTS
First Quarter 2015 vs. Fourth Quarter 2014
Consolidated
| • | Net loss available to common shareholders was $76.7 million, or $.33 loss per diluted share in first quarter, compared to net income of $47.1 million, or $.20 per diluted share in fourth quarter |
| • | Reached an agreement in principle (“AIP”) with two federal agencies, the Department of Justice (“DOJ”) and the Department of Housing and Urban Development Office of Inspector General (“HUD”), to settle potential claims related to FHN’s underwriting and origination of FHA-insured mortgage loans which resulted in a $162.5 million pre-tax charge to litigation and regulatory matters |
| • | Excluding the litigation charge net income available to common shareholders would have been $41.8 million, or $.18 per diluted share in first quarter |
| • | Adopted ASU 2014-01, “Investments – Equity Method and Joint Ventures: Accounting for Investments in Qualified Affordable Housing Projects”. ASU 2014-01 allows for both pre-tax effects and related tax benefits for certain qualified investments in housing projects to be classified within tax expense provided certain technical requirements are met. Historically, such amounts were presented separately within other expense and tax expense. ASU 2014-01 required retrospective application. Accordingly all historical periods presented in this financial supplement have been revised to reflect this adoption |
| • | Net interest income (“NII”) was $156.9 million in first quarter compared to $159.1 million in fourth quarter; Net interest margin (“NIM”) decreased to 2.74 percent in first quarter from 2.86 percent in prior quarter |
| • | The decline in NIM was primarily driven by an increase in average excess cash held at the Fed during the quarter |
| • | Noninterest income (including securities gains) was $129.7 million in first quarter compared to $119.6 million in prior quarter |
| • | The increase in noninterest income was largely driven by an increase in capital markets fixed income sales revenue |
| • | Noninterest expense was $376.2 million in first quarter compared to $207.3 million in fourth quarter primarily due to an increase in litigation and regulatory loss accruals |
| • | Period-end loans grew 3 percent to $16.7 billion in first quarter; average loans were $16.1 billion and $15.9 billion in first and fourth quarters, respectively |
| • | Period-end core deposits increased to $18.2 billion in first quarter from $17.6 billion in prior quarter; Average core deposits increased 7 percent linked quarter to $17.8 billion in first quarter |
Regional Banking
| • | Pre-tax income was $73.9 million in first quarter compared to $78.8 million in fourth quarter; pre-tax, pre-provision net revenue was $78.8 million and $84.3 million in first and fourth quarters, respectively |
| • | Average loans increased 3 percent, or $383.6 million to $13.5 billion in first quarter primarily driven by higher balances of commercial loans including loans to mortgage companies and asset based lending; period-end loans increased 5 percent to $14.2 billion |
| • | Average core deposits increased 6 percent to $16.3 billion in first quarter from $15.3 billion in fourth quarter; period-end core deposits increased 6 percent linked quarter to $16.8 billion |
| • | Increase in average core deposits was largely driven by timing of commercial customer deposits, a new product offering, and a seasonal increase in public funds |
| • | Increase in period-end core deposits was largely driven by a new product offering which resulted in a shift in funding mix |
| • | NII was $154.4 million in first quarter compared to $157.6 million in fourth quarter; NIM decreased to 4.68 percent in first quarter from 4.78 percent in fourth quarter |
| • | The decrease in NII was primarily attributable to fewer days in first quarter compared to fourth quarter and lower loan fees relative to the prior quarter, which were somewhat offset by higher commercial loan balances |
| • | The decline in NIM was largely driven by the continuing impact of low rates and a decrease in commercial loan fees relative to fourth quarter |
| • | Provision for loan losses was $4.9 million in first quarter compared to $5.6 million in prior quarter |
| • | Noninterest income was $60.2 million in first quarter compared to $64.3 million in fourth quarter |
| • | Deposit fee income decreased primarily due to seasonality in non-sufficient funds (“NSF”) fee structure |
| • | Noninterest expense decreased to $135.8 million in first quarter from $137.5 million in prior quarter |
Capital Markets
| • | Pre-tax income increased to $11.2 million in first quarter from $6.0 million in fourth quarter |
| • | Fixed income revenue increased 37 percent to $53.5 million in first quarter from $39.0 million in fourth quarter |
| • | Fixed income average daily revenue (“ADR”) was $877 thousand in first quarter, up from $630 thousand in fourth quarter |
| • | Noninterest expense was $54.7 million in first quarter compared to $46.2 million in the prior quarter |
| • | The increase was primarily due to an increase in variable compensation costs and the seasonal first quarter FICA reset |
Corporate
| • | Pre-tax loss was $24.9 million in first quarter compared to a loss of $27.7 million in prior quarter |
| • | NII was negative $16.1 million in first quarter compared to negative $18.0 million in fourth quarter |
| • | Estimated effective duration of the securities portfolio was 2.5 years in first quarter compared to 3.0 years in fourth quarter |
| • | Estimated modified duration of the securities portfolio was 3.6 years in first quarter compared to 3.7 years in prior quarter |
| • | Noninterest income increased to $5.4 million in first quarter from $4.4 million in fourth quarter |
| • | Increase primarily relates to higher deferred compensation income driven by market conditions; changes in deferred compensation income are mirrored by changes in deferred compensation expense |
| • | Noninterest expense was relatively flat at $14.2 million in first quarter |
4
FHN PERFORMANCE HIGHLIGHTS (continued)
First Quarter 2015 vs. Fourth Quarter 2014 (continued)
Non-Strategic
| • | Pre-tax loss was $154.9 million in first quarter compared to pre-tax income of $8.3 million in fourth quarter |
| • | Noninterest expense increased to $171.6 million in first quarter from $9.5 million in fourth quarter |
| • | The increase was driven by $162.5 million of net loss accruals recognized in first quarter related to the AIP entered into to settle potential claims related to FHN’s underwriting and origination of FHA-insured mortgage loans |
| • | NII was $14.2 million in first quarter compared to $15.9 million in fourth quarter due to continued run-off of the non-strategic loan portfolios |
| • | Noninterest income was relatively flat at $2.5 million in first quarter |
Asset Quality
| • | Allowance for loan losses declined to $228.3 million in first quarter from $232.4 million in fourth quarter; the allowance to loans ratio was 136 basis points in first quarter compared to 143 basis points in fourth quarter |
| • | The decline in the allowance was primarily driven by a $4.2 million reduction of non-strategic consumer real estate reserves |
| • | Net charge-offs (“NCOs”) were $9.1 million in first quarter compared to $12.2 million in fourth quarter; annualized net charge-offs decreased to 23 basis points of average loans in first quarter from 30 basis points in prior quarter |
| • | Total commercial net charge-offs decreased to $1.7 million in the first quarter from $2.9 million in fourth quarter; total consumer net charge-offs decreased $1.8 million from the prior quarter |
| • | Nonperforming loans (“NPLs”) in the portfolio declined to $200.2 million in the first quarter from $203.4 million in fourth quarter |
| • | Nonperforming assets (“NPAs”), including loans held-for-sale, decreased to $236.8 million in first quarter from $241.5 million in the prior quarter |
| • | Decrease due to declines in both nonperforming loans and foreclosed assets |
| • | Total 30+ delinquencies increased to $78.0 million in first quarter compared to $75.8 million in prior quarter |
| • | Commercial delinquencies increased by $5.4 million, driven by a $2.7 million increase in regional bank C&I and a $2.5 million increase in regional bank commercial real estate which was driven by one relationship. The past due commercial real estate relationship is now current. |
| • | Consumer delinquencies declined by $3.2 million and was primarily driven by improvement in consumer real estate which more than offset an increase in permanent mortgage delinquencies |
| • | Troubled debt restructurings (“TDRs”) decreased to $395.8 million in first quarter from $411.3 million in prior quarter |
Taxes
| • | The effective tax rates for first quarter and fourth quarter were 23.52 percent and 20.97 percent, respectively. The rates reflect the favorable effect on the tax rate from permanent benefits. The rates are not comparable because of the different levels of pre-tax income |
| • | Permanent benefits primarily consist of: life insurance, tax-exempt income, and tax credit investments |
| • | The amortization of qualified tax credit investments is included in the effective tax rate for each period, under ASU 2014-01, which reduces the effective tax rate benefit from the credits |
| • | A reversal of the capital loss and the state NOL deferred tax valuation allowances lowered the rate in fourth quarter. The rate for fourth quarter was also reduced by discrete tax benefits realized during that period. |
Capital and Liquidity
| • | Paid $0.06 per common share quarterly dividend on April 1, 2015 |
| • | Paid preferred quarterly dividend of $1.6 million on April 10, 2015 |
| • | Repurchased shares costing $15.8 million in first quarter under the $100 million share repurchase program announced in January 2014 |
| • | Cumulative shares repurchased since the program’s inception are $54.3 million with a volume weighted average price of $12.79 per share (before $.02 per share broker commission) |
| • | Capital ratios (regulatory capital ratios estimated based on period-end balances under the new Basel III risk-based capital rules as phased in) |
| • | 7.57 percent for tangible common equity to tangible assets |
| • | 10.26 percent for Common Equity Tier 1 |
| • | 11.79 percent for Tier 1 |
| • | 14.00 percent for Total Capital |
| • | 9.59 percent for Leverage |
5
FHN CONSOLIDATED INCOME STATEMENT
Quarterly, Unaudited
| 1Q15 Changes vs. | ||||||||||||||||||||||||||||
| (Dollars in thousands, except per share data) | 1Q15 | 4Q14 | 3Q14 | 2Q14 | 1Q14 | 4Q14 | 1Q14 | |||||||||||||||||||||
| Interest income |
$178,068 | $179,448 | $178,858 | $177,359 | $173,584 | (1) | % | 3 | % | |||||||||||||||||||
| Less: interest expense |
21,202 | 20,398 | 19,317 | 20,591 | 21,225 | 4 | % | * | ||||||||||||||||||||
| Net interest income |
156,866 | 159,050 | 159,541 | 156,768 | 152,359 | (1) | % | 3 | % | |||||||||||||||||||
| Provision for loan losses |
5,000 | 6,000 | 6,000 | 5,000 | 10,000 | (17) | % | (50) | % | |||||||||||||||||||
| Net interest income after provision for loan losses |
151,866 | 153,050 | 153,541 | 151,768 | 142,359 | (1) | % | 7 | % | |||||||||||||||||||
| Noninterest income: |
||||||||||||||||||||||||||||
| Capital markets |
61,619 | 48,486 | 47,589 | 47,680 | 56,840 | 27 | % | 8 | % | |||||||||||||||||||
| Deposit transactions and cash management |
26,551 | 29,038 | 28,546 | 27,911 | 26,456 | (9) | % | * | ||||||||||||||||||||
| Brokerage, management fees and commissions |
11,399 | 11,647 | 12,333 | 12,843 | 12,276 | (2) | % | (7) | % | |||||||||||||||||||
| Mortgage banking (a) |
1,584 | 1,808 | 41,559 | 8,861 | 19,029 | (12) | % | (92) | % | |||||||||||||||||||
| Trust services and investment management |
6,698 | 6,945 | 6,779 | 7,309 | 6,744 | (4) | % | (1) | % | |||||||||||||||||||
| Bankcard income (b) |
5,186 | 5,737 | 5,521 | 7,919 | 4,520 | (10) | % | 15 | % | |||||||||||||||||||
| Bank-owned life insurance (c) |
3,462 | 3,503 | 3,547 | 3,312 | 6,032 | (1) | % | (43) | % | |||||||||||||||||||
| Other service charges |
2,848 | 2,830 | 3,064 | 3,143 | 2,845 | 1 | % | * | ||||||||||||||||||||
| Insurance commissions |
596 | 616 | 593 | 611 | 437 | (3) | % | 36 | % | |||||||||||||||||||
| Securities gains/(losses), net |
276 | - | (862) | (1,923) | 5,657 | NM | (95) | % | ||||||||||||||||||||
| Other (d) |
9,470 | 8,988 | 9,146 | 9,235 | 4,894 | 5 | % | 94 | % | |||||||||||||||||||
| Total noninterest income |
129,689 | 119,598 | 157,815 | 126,901 | 145,730 | 8 | % | (11) | % | |||||||||||||||||||
| Adjusted gross income after provision for loan losses |
281,555 | 272,648 | 311,356 | 278,669 | 288,089 | 3 | % | (2) | % | |||||||||||||||||||
| Noninterest expense: |
||||||||||||||||||||||||||||
| Employee compensation, incentives, and benefits |
131,444 | 118,529 | 120,742 | 119,659 | 119,229 | 11 | % | 10 | % | |||||||||||||||||||
| Repurchase and foreclosure provision (e) |
- | - | (4,300) | - | - | NM | NM | |||||||||||||||||||||
| Legal and professional fees (f) |
7,257 | 12,552 | 10,463 | 6,151 | 15,039 | (42) | % | (52) | % | |||||||||||||||||||
| Occupancy (g) |
12,218 | 12,077 | 12,405 | 11,944 | 17,592 | 1 | % | (31) | % | |||||||||||||||||||
| Computer software |
10,942 | 10,574 | 10,614 | 11,087 | 10,656 | 3 | % | 3 | % | |||||||||||||||||||
| Contract employment and outsourcing |
4,584 | 4,578 | 5,199 | 5,318 | 4,325 | * | 6 | % | ||||||||||||||||||||
| Operations services |
9,337 | 8,417 | 9,044 | 8,804 | 8,982 | 11 | % | 4 | % | |||||||||||||||||||
| Equipment rentals, depreciation, and maintenance |
7,220 | 7,523 | 7,150 | 7,442 | 7,849 | (4) | % | (8) | % | |||||||||||||||||||
| FDIC premium expense (h) |
3,448 | 2,881 | 3,456 | 1,136 | 3,991 | 20 | % | (14) | % | |||||||||||||||||||
| Advertising and public relations |
4,733 | 4,077 | 4,386 | 4,312 | 5,908 | 16 | % | (20) | % | |||||||||||||||||||
| Communications and courier |
3,876 | 4,274 | 3,628 | 3,948 | 4,224 | (9) | % | (8) | % | |||||||||||||||||||
| Foreclosed real estate |
(131) | 492 | 788 | 439 | 784 | NM | NM | |||||||||||||||||||||
| Amortization of intangible assets |
1,298 | 1,225 | 982 | 981 | 982 | 6 | % | 32 | % | |||||||||||||||||||
| Other (d) |
179,995 | 20,110 | 59,459 | (18,059) | 18,483 | NM | NM | |||||||||||||||||||||
| Total noninterest expense |
376,221 | 207,309 | 244,016 | 163,162 | 218,044 | 81 | % | 73 | % | |||||||||||||||||||
| Income/(loss) before income taxes |
(94,666) | 65,339 | 67,340 | 115,507 | 70,045 | NM | NM | |||||||||||||||||||||
| Provision/(benefit) for income taxes |
(22,261) | 13,699 | 16,842 | 33,578 | 20,066 | NM | NM | |||||||||||||||||||||
| Net income/(loss) |
(72,405) | 51,640 | 50,498 | 81,929 | 49,979 | NM | NM | |||||||||||||||||||||
| Net income attributable to noncontrolling interest |
2,758 | 2,980 | 2,875 | 2,859 | 2,813 | (7) | % | (2) | % | |||||||||||||||||||
| Net income/(loss) attributable to controlling interest |
(75,163) | 48,660 | 47,623 | 79,070 | 47,166 | NM | NM | |||||||||||||||||||||
| Preferred stock dividends |
1,550 | 1,550 | 1,550 | 1,550 | 1,550 | * | * | |||||||||||||||||||||
| Net income/(loss) available to common shareholders |
$(76,713) | $47,110 | $46,073 | $77,520 | $45,616 | NM | NM | |||||||||||||||||||||
| Common Stock Data |
||||||||||||||||||||||||||||
| EPS |
$(0.33) | $0.20 | $0.20 | $0.33 | $0.19 | NM | NM | |||||||||||||||||||||
| Shares (thousands)(i) |
232,816 | 233,693 | 235,329 | 235,797 | 235,183 | * | (1) | % | ||||||||||||||||||||
| Diluted EPS |
$(0.33) | $0.20 | $0.19 | $0.33 | $0.19 | NM | NM | |||||||||||||||||||||
| Diluted shares (thousands) |
232,816 | 235,448 | 236,862 | 237,250 | 237,401 | (1) | % | (2) | % | |||||||||||||||||||
| Key Ratios & Other |
||||||||||||||||||||||||||||
| Return on average assets (annualized) (j) |
(1.15) | % | 0.83 | % | 0.84 | % | 1.39 | % | 0.85 | % | ||||||||||||||||||
| Return on average common equity (annualized) (j) |
(14.04) | % | 8.26 | % | 8.14 | % | 14.30 | % | 8.63 | % | ||||||||||||||||||
| Fee income to total revenue (j) |
45.21 | % | 42.92 | % | 49.86 | % | 45.11 | % | 47.90 | % | ||||||||||||||||||
| Efficiency ratio (j) |
NM | 74.40 | % | 76.68 | % | 57.13 | % | 74.56 | % | |||||||||||||||||||
| Full time equivalent employees |
4,226 | 4,250 | 4,193 | 4,216 | 4,251 | |||||||||||||||||||||||
Certain previously reported amounts have been reclassified to agree with current presentation.
NM - Not meaningful
* Amount is less than one percent.
| (a) | 3Q14 includes a $39.7 million gain on the sales of mortgage loans HFS; 2Q14 includes an $8.2 million positive fair value adjustment to the held-for-sale portfolio; 1Q14 includes the receipt of previously unrecognized servicing fees in conjunction with transfers of servicing in 1Q14. |
| (b) | 2Q14 includes $2.8 million of Visa volume incentives. |
| (c) | 1Q14 includes $2.8 million of policy benefits received. |
| (d) | Refer to the Other Income and Other Expense table on page 7 for additional information. |
| (e) | 3Q14 expense reversal associated with the settlement of certain repurchase claims. |
| (f) | 2Q14 includes an $8.5 million expense reversal related to agreements with insurance companies for the recovery of Sentinel legal expenses. |
| (g) | 1Q14 includes $4.6 million of lease abandonment expense. |
| (h) | 2Q14 includes the effect of $3.3 million of FDIC premium refunds. |
| (i) | 1Q15, 4Q14 and 3Q14 decreases primarily relate to shares purchased under the share repurchase program. |
| (j) | See Glossary of Terms for definitions of Key Ratios. |
6
FHN OTHER INCOME AND OTHER EXPENSE
Quarterly, Unaudited
| 1Q15 Changes vs. | ||||||||||||||||||||||||||||
| (Thousands) | 1Q15 | 4Q14 | 3Q14 | 2Q14 | 1Q14 | 4Q14 | 1Q14 | |||||||||||||||||||||
| Other Income |
||||||||||||||||||||||||||||
| ATM and interchange fees |
$2,761 | $2,961 | $2,739 | $2,746 | $2,497 | (7) | % | 11 | % | |||||||||||||||||||
| Electronic banking fees |
1,428 | 1,561 | 1,560 | 1,535 | 1,534 | (9) | % | (7) | % | |||||||||||||||||||
| Letter of credit fees |
1,123 | 1,111 | 917 | 1,173 | 1,663 | 1 | % | (32) | % | |||||||||||||||||||
| Deferred compensation (a) |
1,033 | 242 | (41) | 1,184 | 657 | NM | 57 | % | ||||||||||||||||||||
| Gain /(loss) on extinguishment of debt (b) |
- | 184 | - | - | (4,350) | NM | NM | |||||||||||||||||||||
| Other |
3,125 | 2,929 | 3,971 | 2,597 | 2,893 | 7 | % | 8 | % | |||||||||||||||||||
| Total |
$9,470 | $8,988 | $9,146 | $9,235 | $4,894 | 5 | % | 94 | % | |||||||||||||||||||
| Other Expense |
||||||||||||||||||||||||||||
| Litigation and regulatory matters (c) |
$162,500 | $- | $35,390 | $(38,200) | $90 | NM | NM | |||||||||||||||||||||
| Other insurance and taxes |
3,329 | 2,722 | 3,909 | 3,209 | 3,060 | 22 | % | 9 | % | |||||||||||||||||||
| Tax credit investments (d) |
395 | 589 | 311 | 862 | 325 | (33) | % | 22 | % | |||||||||||||||||||
| Travel and entertainment |
1,614 | 2,462 | 2,164 | 2,645 | 1,824 | (34) | % | (12) | % | |||||||||||||||||||
| Employee training and dues |
1,132 | 1,258 | 1,194 | 1,200 | 866 | (10) | % | 31 | % | |||||||||||||||||||
| Customer relations |
1,314 | 1,397 | 1,406 | 1,680 | 1,243 | (6) | % | 6 | % | |||||||||||||||||||
| Miscellaneous loan costs |
361 | 540 | 597 | 839 | 714 | (33) | % | (49) | % | |||||||||||||||||||
| Supplies |
927 | 1,046 | 779 | 804 | 1,116 | (11) | % | (17) | % | |||||||||||||||||||
| Other (e) |
8,423 | 10,096 | 13,709 | 8,902 | 9,245 | (17) | % | (9) | % | |||||||||||||||||||
| Total |
$179,995 | $20,110 | $59,459 | $(18,059) | $18,483 | NM | NM | |||||||||||||||||||||
Certain previously reported amounts have been reclassified to agree with current presentation.
NM - Not meaningful
| (a) | Amounts driven by market conditions and are mirrored by changes in deferred compensation expense which is included in employee compensation expense. |
| (b) | 1Q14 loss associated with the collapse of two HELOC securitization trusts. |
| (c) | 1Q15 loss accruals relate to an AIP to settle potential claims related to FHN’s underwriting and origination of FHA-insured mortgage loans; 3Q14 includes $50.0 million of loss accruals related to legal matters, partially offset by $15.0 million of expense reversals associated with agreements with insurance companies for the recovery of expenses FHN incurred related to litigation losses in previous periods; 2Q14 includes $38.6 million expense recovery related to the Sentinel litigation matter which was settled in 2011. |
| (d) | Represents new market and historic tax credits and affordable housing projects which do not qualify for accounting changes allowed under ASU 2014-01. All historical periods have been revised. |
| (e) | 3Q14 and 1Q14 include $3.2 million and $2.3 million, respectively, of negative valuation adjustments associated with derivatives related to prior sales of Visa Class B shares. |
7
FHN CONSOLIDATED PERIOD-END BALANCE SHEET
Quarterly, Unaudited
| 1Q15 Changes vs. | ||||||||||||||||||||||||||||
| (Thousands) | 1Q15 | 4Q14 | 3Q14 | 2Q14 | 1Q14 | 4Q14 | 1Q14 | |||||||||||||||||||||
| Assets: |
||||||||||||||||||||||||||||
| Investment securities |
$3,676,630 | $3,560,905 | $3,538,957 | $3,580,821 | $3,575,453 | 3 | % | 3 | % | |||||||||||||||||||
| Loans held-for-sale (a) |
133,958 | 141,285 | 151,915 | 358,945 | 361,359 | (5) | % | (63) | % | |||||||||||||||||||
| Loans, net of unearned income |
16,732,123 | 16,230,166 | 15,812,017 | 15,795,709 | 15,119,461 | 3 | % | 11 | % | |||||||||||||||||||
| Federal funds sold |
43,052 | 63,080 | 55,242 | 51,537 | 16,555 | (32) | % | NM | ||||||||||||||||||||
| Securities purchased under agreements to resell |
831,541 | 659,154 | 561,802 | 624,477 | 605,276 | 26 | % | 37 | % | |||||||||||||||||||
| Interest-bearing cash (b) |
438,633 | 1,621,967 | 275,485 | 255,920 | 685,540 | (73) | % | (36) | % | |||||||||||||||||||
| Trading securities |
1,532,463 | 1,194,391 | 1,338,022 | 1,150,280 | 1,194,749 | 28 | % | 28 | % | |||||||||||||||||||
| Total earning assets |
23,388,400 | 23,470,948 | 21,733,440 | 21,817,689 | 21,558,393 | * | 8 | % | ||||||||||||||||||||
| Cash and due from banks |
282,800 | 349,171 | 292,687 | 417,108 | 450,270 | (19) | % | (37) | % | |||||||||||||||||||
| Capital markets receivables (c) |
190,662 | 42,488 | 197,507 | 174,224 | 51,082 | NM | NM | |||||||||||||||||||||
| Goodwill (d) |
145,932 | 145,932 | 141,943 | 141,943 | 141,943 | * | 3 | % | ||||||||||||||||||||
| Other intangible assets, net (d) |
28,220 | 29,518 | 19,044 | 20,025 | 21,007 | (4) | % | 34 | % | |||||||||||||||||||
| Premises and equipment, net (d) |
301,069 | 302,996 | 295,833 | 300,533 | 299,183 | (1) | % | 1 | % | |||||||||||||||||||
| Real estate acquired by foreclosure |
39,776 | 39,922 | 47,996 | 57,552 | 66,035 | * | (40) | % | ||||||||||||||||||||
| Allowance for loan losses |
(228,328) | (232,448) | (238,641) | (243,628) | (247,246) | (2) | % | (8) | % | |||||||||||||||||||
| Derivative assets |
148,153 | 134,088 | 137,742 | 162,067 | 166,465 | 10 | % | (11) | % | |||||||||||||||||||
| Other assets |
1,419,204 | 1,385,572 | 1,358,140 | 1,377,019 | 1,438,984 | 2 | % | (1) | % | |||||||||||||||||||
| Total assets |
$25,715,888 | $25,668,187 | $23,985,691 | $24,224,532 | $23,946,116 | * | 7 | % | ||||||||||||||||||||
| Liabilities and Equity: |
||||||||||||||||||||||||||||
| Deposits: |
||||||||||||||||||||||||||||
| Savings |
$7,428,000 | $7,455,354 | $6,371,156 | $6,317,197 | $6,630,142 | * | 12 | % | ||||||||||||||||||||
| Other interest-bearing deposits |
4,939,240 | 4,140,991 | 3,955,152 | 4,014,071 | 4,071,699 | 19 | % | 21 | % | |||||||||||||||||||
| Time deposits |
792,914 | 831,666 | 767,699 | 808,822 | 898,223 | (5) | % | (12) | % | |||||||||||||||||||
| Total interest-bearing core deposits |
13,160,154 | 12,428,011 | 11,094,007 | 11,140,090 | 11,600,064 | 6 | % | 13 | % | |||||||||||||||||||
| Noninterest-bearing deposits |
5,060,897 | 5,195,656 | 4,603,826 | 4,513,800 | 4,534,245 | (3) | % | 12 | % | |||||||||||||||||||
| Total core deposits (e) |
18,221,051 | 17,623,667 | 15,697,833 | 15,653,890 | 16,134,309 | 3 | % | 13 | % | |||||||||||||||||||
| Certificates of deposit $100,000 and more |
417,503 | 445,272 | 446,938 | 503,597 | 538,434 | (6) | % | (22) | % | |||||||||||||||||||
| Total deposits |
18,638,554 | 18,068,939 | 16,144,771 | 16,157,487 | 16,672,743 | 3 | % | 12 | % | |||||||||||||||||||
| Federal funds purchased |
703,352 | 1,037,052 | 928,159 | 947,946 | 1,135,665 | (32) | % | (38) | % | |||||||||||||||||||
| Securities sold under agreements to repurchase |
309,297 | 562,214 | 479,384 | 475,530 | 411,795 | (45) | % | (25) | % | |||||||||||||||||||
| Trading liabilities |
813,141 | 594,314 | 532,234 | 706,119 | 667,257 | 37 | % | 22 | % | |||||||||||||||||||
| Other short-term borrowings (f) |
158,745 | 157,218 | 790,080 | 1,073,250 | 204,023 | 1 | % | (22) | % | |||||||||||||||||||
| Term borrowings (g) |
1,573,215 | 1,880,105 | 1,491,138 | 1,501,209 | 1,507,048 | (16) | % | 4 | % | |||||||||||||||||||
| Capital markets payables (c) |
91,176 | 18,157 | 329,960 | 95,299 | 39,510 | NM | NM | |||||||||||||||||||||
| Derivative liabilities |
133,273 | 119,239 | 123,442 | 138,336 | 137,863 | 12 | % | (3) | % | |||||||||||||||||||
| Other liabilities |
795,878 | 649,359 | 551,615 | 507,894 | 628,420 | 23 | % | 27 | % | |||||||||||||||||||
| Total liabilities |
23,216,631 | 23,086,597 | 21,370,783 | 21,603,070 | 21,404,324 | 1 | % | 8 | % | |||||||||||||||||||
| Equity: |
||||||||||||||||||||||||||||
| Common stock (h) |
145,937 | 146,387 | 147,030 | 148,217 | 147,866 | * | (1) | % | ||||||||||||||||||||
| Capital surplus (h) |
1,370,711 | 1,380,809 | 1,390,081 | 1,416,012 | 1,417,170 | (1) | % | (3) | % | |||||||||||||||||||
| Undivided profits |
760,713 | 851,585 | 819,577 | 788,289 | 725,820 | (11) | % | 5 | % | |||||||||||||||||||
| Accumulated other comprehensive loss, net |
(169,159) | (188,246) | (132,835) | (122,111) | (140,119) | (10) | % | 21 | % | |||||||||||||||||||
| Preferred stock |
95,624 | 95,624 | 95,624 | 95,624 | 95,624 | * | * | |||||||||||||||||||||
| Noncontrolling interest (i) |
295,431 | 295,431 | 295,431 | 295,431 | 295,431 | * | * | |||||||||||||||||||||
| Total equity |
2,499,257 | 2,581,590 | 2,614,908 | 2,621,462 | 2,541,792 | (3) | % | (2) | % | |||||||||||||||||||
| Total liabilities and equity |
$25,715,888 | $25,668,187 | $23,985,691 | $24,224,532 | $23,946,116 | * | 7 | % | ||||||||||||||||||||
Certain previously reported amounts have been reclassified to agree with current presentation.
NM - Not meaningful
* Amount is less than one percent.
| (a) | 3Q14 decrease related to the sale of mortgage loans HFS. |
| (b) | Includes excess balances held at Fed. 4Q14 increase driven by inflow of customer deposits and proceeds from the issuance of senior notes. |
| (c) | Period-end balances fluctuate based on the level of pending unsettled trades. |
| (d) | 4Q14 increase related to the acquisition of bank branches. |
| (e) | 1Q15 average core deposits were $17.8 billion. |
| (f) | 3Q14 and 2Q14 include increased FHLB borrowings as a result of loan growth and deposit fluctuations. |
| (g) | In 1Q15 $304 million of FTBNA subordinated notes matured. In 4Q14 FTBNA issued $400 million of senior bank notes. |
| (h) | 1Q15, 4Q14 and 3Q14 decreases relate to shares purchased under the share repurchase program. |
| (i) | Consists of preferred stock of subsidiaries. |
8
FHN CONSOLIDATED AVERAGE BALANCE SHEET
Quarterly, Unaudited
| 1Q15 Changes vs. | ||||||||||||||||||||||||||||
| (Thousands) | 1Q15 | 4Q14 | 3Q14 | 2Q14 | 1Q14 | 4Q14 | 1Q14 | |||||||||||||||||||||
| Assets: |
||||||||||||||||||||||||||||
| Earning assets: |
||||||||||||||||||||||||||||
| Loans, net of unearned income: |
||||||||||||||||||||||||||||
| Commercial, financial, and industrial (C&I) |
$8,965,657 | $8,584,065 | $8,395,553 | $7,994,788 | $7,639,584 | 4 % | 17 % | |||||||||||||||||||||
| Commercial real estate |
1,290,246 | 1,287,816 | 1,260,715 | 1,203,631 | 1,139,749 | * | 13 % | |||||||||||||||||||||
| Consumer real estate |
4,988,532 | 5,087,104 | 5,173,088 | 5,230,107 | 5,305,596 | (2)% | (6)% | |||||||||||||||||||||
| Permanent mortgage |
526,616 | 552,065 | 581,876 | 607,296 | 637,642 | (5)% | (17)% | |||||||||||||||||||||
| Credit card and other |
351,503 | 357,321 | 352,133 | 345,748 | 336,454 | (2)% | 4 % | |||||||||||||||||||||
| Total loans, net of unearned income (a) |
16,122,554 | 15,868,371 | 15,763,365 | 15,381,570 | 15,059,025 | 2 % | 7 % | |||||||||||||||||||||
| Loans held-for-sale (b) |
138,373 | 144,061 | 318,743 | 355,822 | 367,899 | (4)% | (62)% | |||||||||||||||||||||
| Investment securities: |
||||||||||||||||||||||||||||
| U.S. treasuries |
100 | 100 | 26,764 | 39,995 | 41,828 | * | NM | |||||||||||||||||||||
| U.S. government agencies |
3,391,297 | 3,363,053 | 3,345,739 | 3,330,598 | 3,222,642 | 1 % | 5 % | |||||||||||||||||||||
| States and municipalities |
14,410 | 14,493 | 17,458 | 19,430 | 19,425 | (1)% | (26)% | |||||||||||||||||||||
| Other |
181,858 | 181,806 | 184,934 | 189,449 | 211,891 | * | (14)% | |||||||||||||||||||||
| Total investment securities |
3,587,665 | 3,559,452 | 3,574,895 | 3,579,472 | 3,495,786 | 1 % | 3 % | |||||||||||||||||||||
| Trading securities |
1,371,514 | 1,182,762 | 1,060,123 | 1,118,425 | 1,108,747 | 16 % | 24 % | |||||||||||||||||||||
| Other earning assets: |
||||||||||||||||||||||||||||
| Federal funds sold |
23,710 | 26,543 | 37,274 | 29,490 | 21,615 | (11)% | 10 % | |||||||||||||||||||||
| Securities purchased under agreements to resell |
777,989 | 672,764 | 644,022 | 664,194 | 622,466 | 16 % | 25 % | |||||||||||||||||||||
| Interest-bearing cash (c) |
1,451,826 | 1,011,983 | 288,192 | 363,674 | 972,537 | 43 % | 49 % | |||||||||||||||||||||
| Total other earning assets |
2,253,525 | 1,711,290 | 969,488 | 1,057,358 | 1,616,618 | 32 % | 39 % | |||||||||||||||||||||
| Total earning assets |
23,473,631 | 22,465,936 | 21,686,614 | 21,492,647 | 21,648,075 | 4 % | 8 % | |||||||||||||||||||||
| Allowance for loan losses |
(232,655) | (238,850) | (240,433) | (246,779) | (249,733) | (3)% | (7)% | |||||||||||||||||||||
| Cash and due from banks |
342,512 | 341,338 | 321,427 | 308,890 | 336,543 | * | 2 % | |||||||||||||||||||||
| Capital markets receivables |
48,937 | 63,384 | 55,937 | 46,864 | 54,654 | (23)% | (10)% | |||||||||||||||||||||
| Premises and equipment, net |
301,989 | 301,512 | 297,636 | 299,899 | 301,065 | * | * | |||||||||||||||||||||
| Derivative assets |
139,086 | 141,146 | 154,988 | 165,684 | 181,586 | (1)% | (23)% | |||||||||||||||||||||
| Other assets |
1,571,104 | 1,538,612 | 1,525,659 | 1,582,789 | 1,643,095 | 2 % | (4)% | |||||||||||||||||||||
| Total assets |
$25,644,604 | $24,613,078 | $23,801,828 | $23,649,994 | $23,915,285 | 4 % | 7 % | |||||||||||||||||||||
| Liabilities and equity: |
||||||||||||||||||||||||||||
| Interest-bearing liabilities: |
||||||||||||||||||||||||||||
| Interest-bearing deposits: |
||||||||||||||||||||||||||||
| Savings |
$7,377,045 | $6,929,750 | $6,327,556 | $6,427,265 | $6,683,749 | 6 % | 10 % | |||||||||||||||||||||
| Other interest-bearing deposits |
4,483,907 | 3,895,022 | 3,697,854 | 3,779,293 | 3,830,839 | 15 % | 17 % | |||||||||||||||||||||
| Time deposits |
812,749 | 830,412 | 785,154 | 859,551 | 924,025 | (2)% | (12)% | |||||||||||||||||||||
| Total interest-bearing core deposits |
12,673,701 | 11,655,184 | 10,810,564 | 11,066,109 | 11,438,613 | 9 % | 11 % | |||||||||||||||||||||
| Certificates of deposit $100,000 and more |
423,480 | 451,669 | 464,792 | 512,527 | 545,845 | (6)% | (22)% | |||||||||||||||||||||
| Federal funds purchased |
1,079,531 | 1,137,909 | 1,028,852 | 1,080,347 | 1,161,594 | (5)% | (7)% | |||||||||||||||||||||
| Securities sold under agreements to repurchase |
474,448 | 471,712 | 406,219 | 458,608 | 454,937 | 1 % | 4 % | |||||||||||||||||||||
| Capital markets trading liabilities |
728,553 | 634,375 | 621,880 | 671,930 | 607,114 | 15 % | 20 % | |||||||||||||||||||||
| Other short-term borrowings (d) |
165,408 | 302,353 | 1,093,014 | 540,389 | 184,721 | (45)% | (10)% | |||||||||||||||||||||
| Term borrowings (e) |
1,621,983 | 1,664,924 | 1,499,959 | 1,505,860 | 1,702,107 | (3)% | (5)% | |||||||||||||||||||||
| Total interest-bearing liabilities |
17,167,104 | 16,318,126 | 15,925,280 | 15,835,770 | 16,094,931 | 5 % | 7 % | |||||||||||||||||||||
| Noninterest-bearing deposits |
5,098,361 | 4,974,748 | 4,602,292 | 4,547,838 | 4,536,080 | 2 % | 12 % | |||||||||||||||||||||
| Capital markets payables |
34,800 | 40,273 | 36,762 | 34,293 | 33,144 | (14)% | 5 % | |||||||||||||||||||||
| Derivative liabilities |
124,305 | 124,530 | 130,997 | 138,282 | 152,596 | * | (19)% | |||||||||||||||||||||
| Other liabilities |
612,513 | 502,641 | 470,520 | 528,531 | 563,824 | 22 % | 9 % | |||||||||||||||||||||
| Total liabilities |
23,037,083 | 21,960,318 | 21,165,851 | 21,084,714 | 21,380,575 | 5 % | 8 % | |||||||||||||||||||||
| Equity: |
||||||||||||||||||||||||||||
| Common stock (f) |
146,225 | 146,789 | 147,820 | 148,085 | 147,751 | * | (1)% | |||||||||||||||||||||
| Capital surplus |
1,377,178 | 1,387,116 | 1,408,682 | 1,416,811 | 1,417,642 | (1)% | (3)% | |||||||||||||||||||||
| Undivided profits |
868,605 | 847,687 | 814,300 | 740,313 | 713,425 | 2 % | 22 % | |||||||||||||||||||||
| Accumulated other comprehensive loss, net |
(175,542) | (119,887) | (125,880) | (130,984) | (135,163) | 46 % | 30 % | |||||||||||||||||||||
| Preferred stock |
95,624 | 95,624 | 95,624 | 95,624 | 95,624 | * | * | |||||||||||||||||||||
| Noncontrolling interest (g) |
295,431 | 295,431 | 295,431 | 295,431 | 295,431 | * | * | |||||||||||||||||||||
| Total equity |
2,607,521 | 2,652,760 | 2,635,977 | 2,565,280 | 2,534,710 | (2)% | 3 % | |||||||||||||||||||||
| Total liabilities and equity |
$25,644,604 | $24,613,078 | $23,801,828 | $23,649,994 | $23,915,285 | 4 % | 7 % | |||||||||||||||||||||
Certain previously reported amounts have been reclassified to agree with current presentation.
NM - Not meaningful
| * | Amount is less than one percent. |
| (a) | Includes loans on nonaccrual status. |
| (b) | 4Q14 decrease related to the sale of mortgage loans HFS in third quarter. |
| (c) | Includes excess balances held at Fed. 1Q15 and 4Q14 increase driven by inflow of customer deposits and proceeds from the issuance of senior notes in fourth quarter. |
| (d) | 3Q14 and 2Q14 include increased FHLB borrowings as a result of loan growth and deposit fluctuations. |
| (e) | In 1Q15 $304 million of FTBNA subordinated notes matured. In 4Q14 FTBNA issued $400 million of senior bank notes. In 1Q14 FHN resolved the collateralized borrowings for three previously on-balance sheet consumer loan securitizations. |
| (f) | 1Q15, 4Q14 and 3Q14 decreases relate to shares repurchased under the share repurchase program. |
| (g) | Consists of preferred stock of subsidiaries. |
9
FHN CONSOLIDATED NET INTEREST INCOME (a)
Quarterly, Unaudited
| 1Q15 Changes vs. | ||||||||||||||||||||||||||||
| (Thousands) | 1Q15 | 4Q14 | 3Q14 | 2Q14 | 1Q14 | 4Q14 | 1Q14 | |||||||||||||||||||||
| Interest Income: |
||||||||||||||||||||||||||||
| Loans, net of unearned income (b) |
$146,192 | $148,078 | $146,931 | $144,975 | $140,487 | (1)% | 4 % | |||||||||||||||||||||
| Loans held-for-sale |
1,491 | 1,483 | 3,263 | 3,209 | 3,215 | 1 % | (54)% | |||||||||||||||||||||
| Investment securities: |
||||||||||||||||||||||||||||
| U.S. treasuries |
- | - | 5 | 7 | 5 | NM | NM | |||||||||||||||||||||
| U.S. government agencies |
20,955 | 21,317 | 21,376 | 21,530 | 20,837 | (2)% | 1 % | |||||||||||||||||||||
| States and municipalities |
125 | 159 | 109 | 97 | 117 | (21)% | 7 % | |||||||||||||||||||||
| Other |
1,876 | 1,875 | 1,866 | 2,103 | 2,281 | * | (18)% | |||||||||||||||||||||
| Total investment securities |
22,956 | 23,351 | 23,356 | 23,737 | 23,240 | (2)% | (1)% | |||||||||||||||||||||
| Trading securities |
9,281 | 8,701 | 7,944 | 7,839 | 8,222 | 7 % | 13 % | |||||||||||||||||||||
| Other earning assets: |
||||||||||||||||||||||||||||
| Federal funds sold |
57 | 69 | 92 | 73 | 53 | (17)% | 8 % | |||||||||||||||||||||
| Securities purchased under agreements to resell (c) |
(252) | (217) | (363) | (218) | (192) | (16)% | (31)% | |||||||||||||||||||||
| Interest-bearing cash |
874 | 611 | 134 | 182 | 546 | 43 % | 60 % | |||||||||||||||||||||
| Total other earning assets |
679 | 463 | (137) | 37 | 407 | 47 % | 67 % | |||||||||||||||||||||
| Interest income |
$180,599 | $182,076 | $181,357 | $179,797 | $175,571 | (1)% | 3 % | |||||||||||||||||||||
| Interest Expense: |
||||||||||||||||||||||||||||
| Interest-bearing deposits: |
||||||||||||||||||||||||||||
| Savings |
$3,307 | $3,087 | $2,600 | $2,792 | $3,083 | 7 % | 7 % | |||||||||||||||||||||
| Other interest-bearing deposits |
957 | 760 | 754 | 746 | 818 | 26 % | 17 % | |||||||||||||||||||||
| Time deposits (d) |
1,432 | 1,742 | 1,786 | 2,486 | 3,062 | (18)% | (53)% | |||||||||||||||||||||
| Total interest-bearing core deposits |
5,696 | 5,589 | 5,140 | 6,024 | 6,963 | 2 % | (18)% | |||||||||||||||||||||
| Certificates of deposit $100,000 and more (e) |
882 | 513 | 685 | 869 | 1,023 | 72 % | (14)% | |||||||||||||||||||||
| Federal funds purchased |
673 | 729 | 654 | 683 | 726 | (8)% | (7)% | |||||||||||||||||||||
| Securities sold under agreements to repurchase |
95 | 83 | 63 | 109 | 118 | 14 % | (19)% | |||||||||||||||||||||
| Capital markets trading liabilities |
3,914 | 3,950 | 3,782 | 4,087 | 3,571 | (1)% | 10 % | |||||||||||||||||||||
| Other short-term borrowings |
278 | 388 | 548 | 403 | 261 | (28)% | 7 % | |||||||||||||||||||||
| Term borrowings (f) |
9,664 | 9,146 | 8,445 | 8,416 | 8,563 | 6 % | 13 % | |||||||||||||||||||||
| Interest expense |
21,202 | 20,398 | 19,317 | 20,591 | 21,225 | 4 % | * | |||||||||||||||||||||
| Net interest income - tax equivalent basis |
159,397 | 161,678 | 162,040 | 159,206 | 154,346 | (1)% | 3 % | |||||||||||||||||||||
| Fully taxable equivalent adjustment |
(2,531) | (2,628) | (2,499) | (2,438) | (1,987) | 4 % | (27)% | |||||||||||||||||||||
| Net interest income |
$156,866 | $159,050 | $159,541 | $156,768 | $152,359 | (1)% | 3 % | |||||||||||||||||||||
NM - Not meaningful
* Amount is less than one percent.
| (a) | Net interest income adjusted to a fully taxable equivalent (“FTE”) basis assuming a statutory federal income tax of 35 percent and, where applicable, state income taxes. |
| (b) | Includes interest on loans in nonaccrual status. |
| (c) | Driven by negative market rates on reverse repurchase agreements. |
| (d) | 1Q15 includes the effect of amortizing the premium valuation adjustment for acquired time deposits related to branch acquisitions. |
| (e) | Prior to 1Q15 includes the effect of amortizing the premium valuation adjustment for acquired time deposits related to acquisitions. |
| (f) | 4Q14 increase related to the issuance of $400 million of senior notes. |
10
FHN CONSOLIDATED AVERAGE BALANCE SHEET: YIELDS AND RATES
Quarterly, Unaudited
| 1Q15 | 4Q14 | 3Q14 | 2Q14 | 1Q14 | ||||||||||||||||
| Assets: |
||||||||||||||||||||
| Earning assets (a): |
||||||||||||||||||||
| Loans, net of unearned income (b): |
||||||||||||||||||||
| Commercial loans |
3.50 % | 3.55 % | 3.51 % | 3.59 % | 3.60 % | |||||||||||||||
| Retail loans |
3.96 | 3.97 | 4.01 | 4.06 | 4.01 | |||||||||||||||
| Total loans, net of unearned income (c) |
3.67 | 3.71 | 3.70 | 3.78 | 3.77 | |||||||||||||||
| Loans held-for-sale |
4.31 | 4.12 | 4.09 | 3.61 | 3.50 | |||||||||||||||
| Investment securities: |
||||||||||||||||||||
| U.S. treasuries |
NM | NM | 0.07 | 0.07 | 0.05 | |||||||||||||||
| U.S. government agencies |
2.47 | 2.54 | 2.56 | 2.59 | 2.59 | |||||||||||||||
| States and municipalities |
3.46 | 4.38 | 2.50 | 1.99 | 2.41 | |||||||||||||||
| Other |
4.13 | 4.13 | 4.04 | 4.44 | 4.31 | |||||||||||||||
| Total investment securities |
2.56 | 2.62 | 2.61 | 2.65 | 2.66 | |||||||||||||||
| Trading securities |
2.71 | 2.94 | 3.00 | 2.80 | 2.97 | |||||||||||||||
| Other earning assets: |
||||||||||||||||||||
| Federal funds sold |
0.97 | 1.02 | 0.98 | 1.00 | 0.99 | |||||||||||||||
| Securities purchased under agreements to resell (d) |
(0.13) | (0.13) | (0.22) | (0.13) | (0.13) | |||||||||||||||
| Interest-bearing cash |
0.24 | 0.24 | 0.19 | 0.20 | 0.23 | |||||||||||||||
| Total other earning assets |
0.12 | 0.11 | (0.06) | 0.01 | 0.10 | |||||||||||||||
| Interest income/total earning assets |
3.11 % | 3.22 % | 3.33 % | 3.35 % | 3.27 % | |||||||||||||||
| Liabilities: |
||||||||||||||||||||
| Interest-bearing liabilities: |
||||||||||||||||||||
| Interest-bearing deposits: |
||||||||||||||||||||
| Savings |
0.18 % | 0.18 % | 0.16 % | 0.17 % | 0.19 % | |||||||||||||||
| Other interest-bearing deposits |
0.09 | 0.08 | 0.08 | 0.08 | 0.09 | |||||||||||||||
| Time deposits(e) |
0.71 | 0.83 | 0.90 | 1.16 | 1.34 | |||||||||||||||
| Total interest-bearing core deposits |
0.18 | 0.19 | 0.19 | 0.22 | 0.25 | |||||||||||||||
| Certificates of deposit $100,000 and more (f) |
0.84 | 0.45 | 0.59 | 0.68 | 0.76 | |||||||||||||||
| Federal funds purchased |
0.25 | 0.25 | 0.25 | 0.25 | 0.25 | |||||||||||||||
| Securities sold under agreements to repurchase |
0.08 | 0.07 | 0.06 | 0.10 | 0.11 | |||||||||||||||
| Capital markets trading liabilities |
2.18 | 2.47 | 2.41 | 2.44 | 2.39 | |||||||||||||||
| Other short-term borrowings |
0.68 | 0.51 | 0.20 | 0.30 | 0.57 | |||||||||||||||
| Term borrowings (g) |
2.39 | 2.20 | 2.25 | 2.24 | 2.01 | |||||||||||||||
| Interest expense/total interest-bearing liabilities |
0.50 | 0.50 | 0.48 | 0.52 | 0.53 | |||||||||||||||
| Net interest spread |
2.61 % | 2.72 % | 2.85 % | 2.83 % | 2.74 % | |||||||||||||||
| Effect of interest-free sources used to fund earning assets |
0.13 | 0.14 | 0.12 | 0.14 | 0.14 | |||||||||||||||
| Net interest margin |
2.74 % | 2.86 % | 2.97 % | 2.97 % | 2.88 % | |||||||||||||||
Yields are adjusted to a FTE basis assuming a statutory federal income tax rate of 35 percent and, where applicable, state income taxes.
NM - Not meaningful
| (a) | Earning assets yields are expressed net of unearned income. |
| (b) | Includes loan fees and cash basis interest income. |
| (c) | Includes loans on nonaccrual status. |
| (d) | Driven by negative market rates on reverse repurchase agreements. |
| (e) | 1Q15 rate includes the effect of amortizing the premium valuation adjustment for acquired time deposits related to branch acquisitions. |
| (f) | Rates prior to 1Q15 include the effect of amortizing the premium valuation adjustment for acquired time deposits related to acquisitions. |
| (g) | Rates are expressed net of unamortized debenture cost for term borrowings. |
11
FHN CAPITAL HIGHLIGHTS
Quarterly, Unaudited
| 1Q15 Changes vs. | ||||||||||||||||||||||||||||
| (Dollars and shares in thousands) | 1Q15 | 4Q14 | 3Q14 | 2Q14 | 1Q14 | 4Q14 | 1Q14 | |||||||||||||||||||||
| Common equity tier 1 capital (a) (c) |
2,133,336 | N/A | N/A | N/A | N/A | NM | NM | |||||||||||||||||||||
| Tier 1 capital (a) (b) (c) |
2,452,075 | $2,813,503 | $2,783,147 | $2,751,933 | $2,666,486 | (13)% | (8)% | |||||||||||||||||||||
| Total capital (a) (d) |
2,912,360 | $3,148,336 | $3,121,359 | $3,092,212 | $3,048,105 | (7)% | (4)% | |||||||||||||||||||||
| Risk-weighted assets (“RWA”) (a) |
20,795,400 | $19,452,656 | $19,238,109 | $19,400,096 | $18,694,719 | 7% | 11% | |||||||||||||||||||||
| Average assets for leverage (a) (c) |
25,569,095 | $24,625,820 | $23,748,667 | $23,579,425 | $23,828,049 | 4% | 7% | |||||||||||||||||||||
| Common equity tier 1 ratio (a) (c) |
10.26% | N/A | N/A | N/A | N/A | |||||||||||||||||||||||
| Tier 1 ratio (a) (c) |
11.79% | 14.46 % | 14.47 % | 14.19 % | 14.26 % | |||||||||||||||||||||||
| Total capital ratio (a) |
14.00% | 16.18 % | 16.22 % | 15.94 % | 16.30 % | |||||||||||||||||||||||
| Leverage ratio (a) |
9.59% | 11.43 % | 11.72 % | 11.67 % | 11.19 % | |||||||||||||||||||||||
| Tier 1 common to risk-weighted assets (c) (e) |
N/A | 11.43 % | 11.40 % | 11.14 % | 11.10 % | |||||||||||||||||||||||
| Total equity to total assets |
9.72 % | 10.06 % | 10.90 % | 10.82 % | 10.61 % | |||||||||||||||||||||||
| Tangible common equity/tangible assets (“TCE/TA”) (e) |
7.57 % | 7.90 % | 8.66 % | 8.60 % | 8.36 % | |||||||||||||||||||||||
| Period-end shares outstanding (f) |
233,499 | 234,220 | 235,249 | 237,147 | 236,586 | * | (1) % | |||||||||||||||||||||
| Cash dividends declared per common share |
$0.06 | $0.05 | $0.05 | $0.05 | $0.05 | 20 % | 20 % | |||||||||||||||||||||
| Book value per common share |
$9.03 | $9.35 | $9.45 | $9.41 | $9.09 | |||||||||||||||||||||||
| Tangible book value per common share (e) |
$8.28 | $8.60 | $8.77 | $8.72 | $8.40 | |||||||||||||||||||||||
| Market capitalization (millions) |
$3,336.7 | $3,180.7 | $2,888.9 | $2,812.6 | $2,919.5 | |||||||||||||||||||||||
Certain previously reported amounts have been reclassified to agree with current presentation.
| * | Amount is less than one percent. |
| (a) | Current quarter is an estimate and reflects revisions to regulatory capital definitions under the new Basel III risk-based capital rules as phased-in. |
| (b) | 1Q15 includes $50 million of Tier 1 qualifying trust preferred securities. All periods in 2014 include $200 million of Tier 1 qualifying trust preferred securities. |
| (c) | See Glossary of Terms for definition of ratio. |
| (d) | 1Q15 includes $150 million of Tier 2 qualifying trust preferred which are excluded from Tier 1 under Basel III. |
| (e) | Refer to the Non-GAAP to GAAP reconciliation on page 22 of this financial supplement. |
| (f) | 1Q15, 4Q14 and 3Q14 decreases relate to shares purchased under the share repurchase program. |
12
FHN BUSINESS SEGMENT HIGHLIGHTS
Quarterly, Unaudited
| 1Q15 Changes vs. | ||||||||||||||||||||||||||||
| (Thousands) | 1Q15 | 4Q14 | 3Q14 | 2Q14 | 1Q14 | 4Q14 | 1Q14 | |||||||||||||||||||||
| Regional Banking |
||||||||||||||||||||||||||||
| Net interest income |
$154,409 | $157,557 | $153,868 | $148,675 | $142,026 | (2)% | 9% | |||||||||||||||||||||
| Noninterest income |
60,204 | 64,331 | 64,155 | 66,227 | 59,992 | (6)% | * | |||||||||||||||||||||
| Total revenues |
214,613 | 221,888 | 218,023 | 214,902 | 202,018 | (3)% | 6% | |||||||||||||||||||||
| Provision for loan losses |
4,915 | 5,568 | 2,204 | 8,425 | 12,990 | (12)% | (62)% | |||||||||||||||||||||
| Noninterest expense |
135,780 | 137,546 | 135,903 | 132,996 | 132,543 | (1)% | 2% | |||||||||||||||||||||
| Income before income taxes |
73,918 | 78,774 | 79,916 | 73,481 | 56,485 | (6)% | 31% | |||||||||||||||||||||
| Provision for income taxes |
26,381 | 28,057 | 28,561 | 26,070 | 20,083 | (6)% | 31% | |||||||||||||||||||||
| Net income |
$47,537 | $50,717 | $51,355 | $47,411 | $36,402 | (6)% | 31% | |||||||||||||||||||||
| Capital Markets |
||||||||||||||||||||||||||||
| Net interest income |
$4,323 | $3,675 | $2,950 | $2,587 | $3,476 | 18% | 24% | |||||||||||||||||||||
| Noninterest income |
61,565 | 48,506 | 49,896 | 47,564 | 56,759 | 27% | 8% | |||||||||||||||||||||
| Total revenues |
65,888 | 52,181 | 52,846 | 50,151 | 60,235 | 26% | 9% | |||||||||||||||||||||
| Noninterest expense (a) |
54,683 | 46,218 | 47,915 | 116 | 52,598 | 18% | 4% | |||||||||||||||||||||
| Income before income taxes |
11,205 | 5,963 | 4,931 | 50,035 | 7,637 | 88% | 47% | |||||||||||||||||||||
| Provision for income taxes |
4,167 | 2,059 | 1,696 | 19,143 | 2,843 | NM | 47% | |||||||||||||||||||||
| Net income |
$7,038 | $3,904 | $3,235 | $30,892 | $4,794 | 80% | 47% | |||||||||||||||||||||
| Corporate |
||||||||||||||||||||||||||||
| Net interest income/(expense) |
$(16,084) | $(18,038) | $(14,246) | $(11,968) | $(9,923) | 11% | (62)% | |||||||||||||||||||||
| Noninterest income |
5,385 | 4,400 | 4,139 | 5,215 | 13,215 | 22% | (59)% | |||||||||||||||||||||
| Total revenues |
(10,699) | (13,638) | (10,107) | (6,753) | 3,292 | 22% | NM | |||||||||||||||||||||
| Noninterest expense |
14,169 | 14,017 | 16,511 | 13,532 | 17,327 | 1% | (18)% | |||||||||||||||||||||
| Loss before income taxes |
(24,868) | (27,655) | (26,618) | (20,285) | (14,035) | 10% | (77)% | |||||||||||||||||||||
| Benefit for income taxes |
(11,640) | (19,601) | (16,928) | (16,369) | (10,628) | 41% | (10)% | |||||||||||||||||||||
| Net loss |
$(13,228) | $(8,054) | $(9,690) | $(3,916) | $(3,407) | (64)% | NM | |||||||||||||||||||||
| Non-Strategic |
||||||||||||||||||||||||||||
| Net interest income |
$14,218 | $15,856 | $16,969 | $17,474 | $16,780 | (10)% | (15)% | |||||||||||||||||||||
| Noninterest income (b) |
2,535 | 2,361 | 39,625 | 7,895 | 15,764 | 7% | (84)% | |||||||||||||||||||||
| Total revenues |
16,753 | 18,217 | 56,594 | 25,369 | 32,544 | (8)% | (49)% | |||||||||||||||||||||
| Provision/(provision credit) for loan losses |
85 | 432 | 3,796 | (3,425) | (2,990) | (80)% | NM | |||||||||||||||||||||
| Noninterest expense (c) |
171,589 | 9,528 | 43,687 | 16,518 | 15,576 | NM | NM | |||||||||||||||||||||
| Income/(loss) before income taxes |
(154,921) | 8,257 | 9,111 | 12,276 | 19,958 | NM | NM | |||||||||||||||||||||
| Provision/(benefit) for income taxes |
(41,169) | 3,184 | 3,513 | 4,734 | 7,768 | NM | NM | |||||||||||||||||||||
| Net income/(loss) |
$(113,752) | $5,073 | $5,598 | $7,542 | $12,190 | NM | NM | |||||||||||||||||||||
| Total Consolidated |
||||||||||||||||||||||||||||
| Net interest income |
$156,866 | $159,050 | $159,541 | $156,768 | $152,359 | (1)% | 3% | |||||||||||||||||||||
| Noninterest income |
129,689 | 119,598 | 157,815 | 126,901 | 145,730 | 8% | (11)% | |||||||||||||||||||||
| Total revenues |
286,555 | 278,648 | 317,356 | 283,669 | 298,089 | 3% | (4)% | |||||||||||||||||||||
| Provision for loan losses |
5,000 | 6,000 | 6,000 | 5,000 | 10,000 | (17)% | (50)% | |||||||||||||||||||||
| Noninterest expense |
376,221 | 207,309 | 244,016 | 163,162 | 218,044 | 81% | 73% | |||||||||||||||||||||
| Income/(loss) before income taxes |
(94,666) | 65,339 | 67,340 | 115,507 | 70,045 | NM | NM | |||||||||||||||||||||
| Provision/(benefit) for income taxes |
(22,261) | 13,699 | 16,842 | 33,578 | 20,066 | NM | NM | |||||||||||||||||||||
| Net income/(loss) |
$(72,405) | $51,640 | $50,498 | $81,929 | $49,979 | NM | NM | |||||||||||||||||||||
Certain previously reported amounts have been reclassified to agree with current presentation.
NM - Not meaningful
| * | Amount is less than one percent. |
| (a) | 2Q14 includes $47.1 million related to agreements with insurance companies for the recovery of expenses FHN incurred in connection with the Sentinel litigation matter which was settled in 2011. |
| (b) | 3Q14 includes $39.7 million of gains on the sales of HFS mortgage loans. |
| (c) | 1Q15 includes $162.5 million of loss accruals related to an AIP to settle potential claims related to FHN’s underwriting and origination of FHA-insured mortgage loans; 3Q14 includes $50.0 million of loss accruals related to legal matters, partially offset by $15.0 million of expense reversals related to agreements with insurance companies for the recovery of expenses FHN incurred related to litigation losses in previous periods. |
13
FHN REGIONAL BANKING
Quarterly, Unaudited
| 1Q15 Changes vs. | ||||||||||||||||||||||||||||
| 1Q15 | 4Q14 | 3Q14 | 2Q14 | 1Q14 | 4Q14 | 1Q14 | ||||||||||||||||||||||
| Income Statement (thousands) |
||||||||||||||||||||||||||||
| Net interest income |
$154,409 | $157,557 | $153,868 | $148,675 | $142,026 | (2)% | 9% | |||||||||||||||||||||
| Provision for loan losses |
4,915 | 5,568 | 2,204 | 8,425 | 12,990 | (12)% | (62)% | |||||||||||||||||||||
| Noninterest income: |
||||||||||||||||||||||||||||
| NSF / Overdraft fees (a) |
9,144 | 11,619 | 11,425 | 10,636 | 9,156 | (21)% | * | |||||||||||||||||||||
| Cash management fees |
8,878 | 8,719 | 8,522 | 8,537 | 8,916 | 2% | * | |||||||||||||||||||||
| Debit card income |
3,064 | 3,117 | 2,945 | 2,934 | 2,655 | (2)% | 15% | |||||||||||||||||||||
| Other |
4,537 | 4,655 | 4,705 | 4,850 | 4,864 | (3)% | (7)% | |||||||||||||||||||||
| Total deposit transactions and cash management |
25,623 | 28,110 | 27,597 | 26,957 | 25,591 | (9)% | * | |||||||||||||||||||||
| Brokerage, management fees and commissions |
11,399 | 11,647 | 12,333 | 12,844 | 12,276 | (2)% | (7)% | |||||||||||||||||||||
| Trust services and investment management |
6,713 | 6,960 | 6,794 | 7,325 | 6,760 | (4)% | (1)% | |||||||||||||||||||||
| Bankcard income (b) |
4,915 | 5,469 | 5,224 | 7,648 | 4,255 | (10)% | 16% | |||||||||||||||||||||
| Other service charges |
2,422 | 2,395 | 2,630 | 2,628 | 2,356 | 1% | 3% | |||||||||||||||||||||
| Miscellaneous revenue |
9,132 | 9,750 | 9,577 | 8,825 | 8,754 | (6)% | 4% | |||||||||||||||||||||
| Total noninterest income |
60,204 | 64,331 | 64,155 | 66,227 | 59,992 | (6)% | * | |||||||||||||||||||||
| Noninterest expense: |
||||||||||||||||||||||||||||
| Employee compensation, incentives, and benefits |
48,272 | 46,175 | 46,259 | 46,055 | 44,945 | 5% | 7% | |||||||||||||||||||||
| Other |
87,508 | 91,371 | 89,644 | 86,941 | 87,598 | (4)% | * | |||||||||||||||||||||
| Total noninterest expense |
135,780 | 137,546 | 135,903 | 132,996 | 132,543 | (1)% | 2% | |||||||||||||||||||||
| Income before income taxes |
$73,918 | $78,774 | $79,916 | $73,481 | $56,485 | (6)% | 31% | |||||||||||||||||||||
| PPNR (Non-GAAP) (c) |
78,833 | 84,342 | 82,120 | 81,906 | 69,475 | (7)% | 13% | |||||||||||||||||||||
| Efficiency ratio (d) |
63.27% | 61.99% | 62.33% | 61.89% | 65.61% | |||||||||||||||||||||||
| Balance Sheet (millions) |
||||||||||||||||||||||||||||
| Average loans |
$13,513 | $13,129 | $12,886 | $12,372 | $11,897 | 3% | 14% | |||||||||||||||||||||
| Average other earning assets |
48 | 52 | 63 | 57 | 50 | (8)% | (4)% | |||||||||||||||||||||
| Total average earning assets |
13,561 | 13,181 | 12,949 | 12,429 | 11,947 | 3% | 14% | |||||||||||||||||||||
| Average core deposits |
16,263 | 15,335 | 14,639 | 14,808 | 14,857 | 6% | 9% | |||||||||||||||||||||
| Average other deposits |
423 | 452 | 464 | 513 | 546 | (6)% | (23)% | |||||||||||||||||||||
| Total average deposits |
16,686 | 15,787 | 15,103 | 15,321 | 15,403 | 6% | 8% | |||||||||||||||||||||
| Total period-end deposits |
17,240 | 16,373 | 15,119 | 15,418 | 15,723 | 5% | 10% | |||||||||||||||||||||
| Total period-end assets |
14,894 | 14,350 | 13,695 | 13,700 | 12,889 | 4% | 16% | |||||||||||||||||||||
| Net interest margin (e) |
4.68% | 4.78% | 4.74% | 4.82% | 4.84% | |||||||||||||||||||||||
| Net interest spread |
3.37 | 3.36 | 3.41 | 3.46 | 3.41 | |||||||||||||||||||||||
| Loan yield |
3.51 | 3.50 | 3.56 | 3.63 | 3.61 | |||||||||||||||||||||||
| Deposit average yield |
0.14 | 0.14 | 0.15 | 0.17 | 0.20 | |||||||||||||||||||||||
| Key Statistics |
||||||||||||||||||||||||||||
| Financial center locations (f) |
178 | 178 | 172 | 172 | 172 | * | 3% | |||||||||||||||||||||
Certain previously reported amounts have been reclassified to agree with current presentation.
* Amount is less than one percent.
| (a) | 1Q15 and 1Q14 levels primarily attributable to seasonality in NSF fees. |
| (b) | 2Q14 includes $2.8 million of Visa volume incentives. |
| (c) | Pre-tax, pre-provision, net revenue is a Non-GAAP number and is calculated by adding the provision/(provision credit) for loan losses (GAAP) to Income before income taxes (GAAP). |
| (d) | Noninterest expense divided by total revenue. |
| (e) | Net interest margin is computed using total net interest income adjusted for FTE assuming a statutory federal income tax rate of 35 percent and, where applicable, state income taxes. |
| (f) | 4Q14 increase related to the acquisition of bank branches. |
14
FHN CAPITAL MARKETS
Quarterly, Unaudited
| 1Q15 Changes vs. | ||||||||||||||||||||||||||||
| 1Q15 | 4Q14 | 3Q14 | 2Q14 | 1Q14 | 4Q14 | 1Q14 | ||||||||||||||||||||||
| Income Statement (thousands) |
||||||||||||||||||||||||||||
| Net interest income |
$4,323 | $3,675 | $2,950 | $2,587 | $3,476 | 18 | % | 24 | % | |||||||||||||||||||
| Noninterest income: |
||||||||||||||||||||||||||||
| Fixed income |
53,510 | 39,030 | 41,216 | 40,457 | 49,614 | 37 | % | 8 | % | |||||||||||||||||||
| Other |
8,055 | 9,476 | 8,680 | 7,107 | 7,145 | (15 | ) % | 13 | % | |||||||||||||||||||
| Total noninterest income |
61,565 | 48,506 | 49,896 | 47,564 | 56,759 | 27 | % | 8 | % | |||||||||||||||||||
| Noninterest expense (a) |
54,683 | 46,218 | 47,915 | 116 | 52,598 | 18 | % | 4 | % | |||||||||||||||||||
| Income before income taxes |
$11,205 | $5,963 | $4,931 | $50,035 | $7,637 | 88 | % | 47 | % | |||||||||||||||||||
| Efficiency ratio (b) |
82.99 | % | 88.57 | % | 90.67 | % | NM | 87.32 | % | |||||||||||||||||||
| Fixed income average daily revenue |
$877 | $630 | $644 | $642 | $813 | 39 | % | 8 | % | |||||||||||||||||||
| Balance Sheet (millions) |
||||||||||||||||||||||||||||
| Average trading inventory |
$1,366 | $1,177 | $1,054 | $1,112 | $1,102 | 16 | % | 24 | % | |||||||||||||||||||
| Average other earning assets |
781 | 677 | 648 | 668 | 628 | 15 | % | 24 | % | |||||||||||||||||||
| Total average earning assets |
2,147 | 1,854 | 1,702 | 1,780 | 1,730 | 16 | % | 24 | % | |||||||||||||||||||
| Total period-end assets |
2,808 | 2,138 | 2,338 | 2,197 | 2,095 | 31 | % | 34 | % | |||||||||||||||||||
| Net interest margin (c) |
0.83 | % | 0.85 | % | 0.75 | % | 0.61 | % | 0.82 | % | ||||||||||||||||||
Certain previously reported amounts have been reclassified to agree with current presentation.
NM - Not meaningful
| (a) | 2Q14 includes $47.1 million related to agreements with insurance companies for the recovery of expenses FHN incurred in connection with the Sentinel litigation matter which was settled in 2011. |
| (b) | Noninterest expense divided by total revenue. |
| (c) | Net interest margin is computed using total net interest income adjusted for FTE assuming a statutory federal income tax rate of 35 percent and, where applicable, state income taxes. |
FHN CORPORATE
Quarterly, Unaudited
| 1Q15 Changes vs. | ||||||||||||||||||||||||||||
| 1Q15 | 4Q14 | 3Q14 | 2Q14 | 1Q14 | 4Q14 | 1Q14 | ||||||||||||||||||||||
| Income Statement (thousands) |
||||||||||||||||||||||||||||
| Net interest income/(expense) |
$(16,084) | $(18,038) | $(14,246) | $(11,968) | $(9,923) | 11% | (62)% | |||||||||||||||||||||
| Noninterest income excluding securities gains/(losses) |
5,109 | 4,400 | 4,005 | 5,139 | 7,558 | 16% | (32)% | |||||||||||||||||||||
| Securities gains/(losses), net (a) |
276 | - | 134 | 76 | 5,657 | NM | (95)% | |||||||||||||||||||||
| Noninterest expense |
14,169 | 14,017 | 16,511 | 13,532 | 17,327 | 1% | (18)% | |||||||||||||||||||||
| Loss before income taxes |
$(24,868) | $(27,655) | $(26,618) | $(20,285) | $(14,035) | 10% | (77)% | |||||||||||||||||||||
| Average Balance Sheet (millions) |
||||||||||||||||||||||||||||
| Average loans |
$138 | $148 | $153 | $159 | $169 | (7)% | (18)% | |||||||||||||||||||||
| Total earning assets |
$5,162 | $4,703 | $3,999 | $4,082 | $4,617 | 10% | 12% | |||||||||||||||||||||
| Net interest margin (b) |
(1.28)% | (1.40)% | (1.25)% | (1.04)% | (0.81)% | |||||||||||||||||||||||
Certain previously reported amounts have been reclassified to agree with current presentation.
NM - Not meaningful
| (a) | 1Q14 includes a gain of $5.6 million on the sale of cost method investments. |
| (b) | Net interest margin is computed using total net interest income adjusted for FTE assuming a statutory federal income tax rate of 35 percent and, where applicable, state income taxes. |
15
FHN NON-STRATEGIC
Quarterly, Unaudited
| 1Q15 Changes vs. | ||||||||||||||||||||||||||||
| 1Q15 | 4Q14 | 3Q14 | 2Q14 | 1Q14 | 4Q14 | 1Q14 | ||||||||||||||||||||||
| Income Statement (thousands) |
||||||||||||||||||||||||||||
| Net interest income |
$14,218 | $15,856 | $16,969 | $17,474 | $16,780 | (10)% | (15)% | |||||||||||||||||||||
| Noninterest income: |
||||||||||||||||||||||||||||
| Mortgage warehouse valuation (a) |
1,228 | 1,240 | 41,287 | 8,213 | 1,045 | (1)% | 18 % | |||||||||||||||||||||
| Miscellaneous revenue (b) |
1,307 | 1,121 | (667) | 1,682 | 14,719 | 17 % | (91)% | |||||||||||||||||||||
| Total noninterest income excluding securities gains/(losses) |
2,535 | 2,361 | 40,620 | 9,895 | 15,764 | 7 % | (84)% | |||||||||||||||||||||
| Securities gains/(losses), net |
- | - | (995) | (2,000) | - | NM | NM | |||||||||||||||||||||
| Noninterest expense: |
||||||||||||||||||||||||||||
| Repurchase and foreclosure provision (c) |
- | - | (4,300) | - | - | NM | NM | |||||||||||||||||||||
| Other expenses (d) |
171,589 | 9,528 | 47,987 | 16,518 | 15,576 | NM | NM | |||||||||||||||||||||
| Total noninterest expense |
171,589 | 9,528 | 43,687 | 16,518 | 15,576 | NM | NM | |||||||||||||||||||||
| Provision/(provision credit) for loan losses |
85 | 432 | 3,796 | (3,425) | (2,990) | (80)% | NM | |||||||||||||||||||||
| Income/(loss) before income taxes |
$(154,921) | $8,257 | $9,111 | $12,276 | $19,958 | NM | NM | |||||||||||||||||||||
| Average Balance Sheet (millions) |
||||||||||||||||||||||||||||
| Loans |
$2,472 | $2,592 | $2,724 | $2,851 | $2,993 | (5)% | (17)% | |||||||||||||||||||||
| Loans held-for-sale (e) |
120 | 125 | 298 | 335 | 344 | (4)% | (65)% | |||||||||||||||||||||
| Trading securities |
5 | 6 | 6 | 7 | 7 | (17)% | (29)% | |||||||||||||||||||||
| Allowance for loan losses |
(105) | (110) | (111) | (117) | (126) | (5)% | (17)% | |||||||||||||||||||||
| Other assets |
63 | 72 | 78 | 102 | 186 | (13)% | (66)% | |||||||||||||||||||||
| Total assets |
2,555 | 2,685 | 2,995 | 3,178 | 3,404 | (5)% | (25)% | |||||||||||||||||||||
| Net interest margin (f) |
2.19 % | 2.32 % | 2.23 % | 2.18 % | 2.01 % | |||||||||||||||||||||||
| Efficiency ratio (g) |
NM | 52.30 % | 75.86 % | 60.35 % | 47.86 % | |||||||||||||||||||||||
| Mortgage Warehouse - Period-end (millions) |
||||||||||||||||||||||||||||
| Ending warehouse balance (loans held-for-sale) (e) |
$108 | $115 | $120 | $330 | $332 | (6)% | (67)% | |||||||||||||||||||||
| Key Servicing Metric |
||||||||||||||||||||||||||||
| Ending servicing portfolio (millions) (h) |
$966 | $1,013 | $1,090 | $1,456 | $1,679 | (5)% | (42)% | |||||||||||||||||||||
Certain previously reported amounts have been reclassified to agree with current presentation.
NM - Not meaningful
| (a) | 3Q14 includes $39.7 million of gains on the sale of HFS mortgage loans; 2Q14 fair value adjustments reflect new information on market pricing for similar assets primarily related to the non-performing portion of the held-for-sale portfolio. |
| (b) | 1Q14 includes the receipt of previously unrecognized servicing fees in conjunction with transfers of servicing in 1Q14. |
| (c) | 3Q14 expense reversal associated with the settlement of certain repurchase claims. |
| (d) | 1Q15 includes $162.5 million of loss accruals related to an AIP to settle potential claims related to FHN’s underwriting and origination of FHA-insured mortgage loans; 3Q14 includes $50.0 million of loss accruals related to legal matters, partially offset by $15.0 million of expense reversals associated with agreements with insurance companies for the recovery of expenses FHN incurred related to litigation losses in previous periods. |
| (e) | 4Q14 and 3Q14 decreases relate to the sale of mortgage loans HFS late in third quarter. |
| (f) | Net interest margin is computed using total net interest income adjusted for FTE assuming a statutory federal income tax rate of 35 percent and, where applicable, state income taxes. |
| (g) | Noninterest expense divided by total revenue excluding securities gains/(losses). |
| (h) | Includes mortgage loans serviced from FHN’s legacy mortgage banking business, legacy equity lending serviced for others, and mortgage loans in portfolio and warehouse. |
16
FHN ASSET QUALITY: CONSOLIDATED
Quarterly, Unaudited
| 1Q15 Changes vs. | ||||||||||||||||||||||||||||
| (Thousands) | 1Q15 | 4Q14 | 3Q14 | 2Q14 | 1Q14 | 4Q14 | 1Q14 | |||||||||||||||||||||
| Allowance for Loan Losses Walk-Forward |
||||||||||||||||||||||||||||
| Beginning reserve |
$232,448 | $238,641 | $243,628 | $247,246 | $253,809 | (3)% | (8)% | |||||||||||||||||||||
| Provision |
5,000 | 6,000 | 6,000 | 5,000 | 10,000 | (17)% | (50)% | |||||||||||||||||||||
| Charge-offs |
(17,999) | (23,306) | (23,684) | (18,764) | (24,692) | (23)% | (27)% | |||||||||||||||||||||
| Recoveries |
8,879 | 11,113 | 12,697 | 10,146 | 8,129 | (20)% | 9% | |||||||||||||||||||||
| Ending balance |
$228,328 | $232,448 | $238,641 | $243,628 | $247,246 | (2)% | (8)% | |||||||||||||||||||||
| Reserve for unfunded commitments |
4,135 | 4,770 | 2,313 | 2,209 | 2,882 | (13)% | 43% | |||||||||||||||||||||
| Total allowance for loan losses plus reserve for unfunded commitments |
$232,463 | $237,218 | $240,954 | $245,837 | $250,128 | (2)% | (7)% | |||||||||||||||||||||
| Allowance for Loan Losses |
||||||||||||||||||||||||||||
| Regional Banking |
$125,982 | $126,812 | $127,873 | $131,801 | $128,234 | (1)% | (2)% | |||||||||||||||||||||
| Non-Strategic |
102,346 | 105,636 | 110,768 | 111,827 | 119,012 | (3)% | (14)% | |||||||||||||||||||||
| Corporate (a) |
NM | NM | NM | NM | NM | NM | NM | |||||||||||||||||||||
| Total allowance for loan losses |
$228,328 | $232,448 | $238,641 | $243,628 | $247,246 | (2)% | (8)% | |||||||||||||||||||||
| Nonperforming Assets |
||||||||||||||||||||||||||||
| Regional Banking |
||||||||||||||||||||||||||||
| Nonperforming loans |
$63,620 | $64,654 | $70,805 | $89,191 | $83,275 | (2)% | (24)% | |||||||||||||||||||||
| Foreclosed real estate (b) |
19,704 | 20,451 | 25,404 | 26,598 | 27,705 | (4)% | (29)% | |||||||||||||||||||||
| Total Regional Banking |
$83,324 | $85,105 | $96,209 | $115,789 | $110,980 | (2)% | (25)% | |||||||||||||||||||||
| Non-Strategic |
||||||||||||||||||||||||||||
| Nonperforming loans (c) |
$133,804 | $135,740 | $139,038 | $138,789 | $153,972 | (1)% | (13)% | |||||||||||||||||||||
| Nonperforming loans held-for-sale after fair value adjustments (d) |
6,888 | 7,643 | 7,931 | 69,184 | 61,631 | (10)% | (89)% | |||||||||||||||||||||
| Foreclosed real estate (b) |
9,977 | 9,979 | 9,857 | 12,183 | 15,265 | * | (35)% | |||||||||||||||||||||
| Total Non-Strategic |
$150,669 | $153,362 | $156,826 | $220,156 | $230,868 | (2)% | (35)% | |||||||||||||||||||||
| Corporate |
||||||||||||||||||||||||||||
| Nonperforming loans |
$2,805 | $3,045 | $3,903 | $3,636 | $3,672 | (8)% | (24)% | |||||||||||||||||||||
| Total nonperforming assets |
$236,798 | $241,512 | $256,938 | $339,581 | $345,520 | (2)% | (31)% | |||||||||||||||||||||
| Net Charge-Offs |
||||||||||||||||||||||||||||
| Regional Banking |
$5,745 | $6,629 | $6,132 | $4,858 | $5,783 | (13)% | (1)% | |||||||||||||||||||||
| Non-Strategic |
3,375 | 5,564 | 4,855 | 3,760 | 10,780 | (39)% | (69)% | |||||||||||||||||||||
| Total net charge-offs |
$9,120 | $12,193 | $10,987 | $8,618 | $16,563 | (25)% | (45)% | |||||||||||||||||||||
| Consolidated Key Ratios (e) |
||||||||||||||||||||||||||||
| NPL % |
1.20 % | 1.25 % | 1.35 % | 1.47 % | 1.59 % | |||||||||||||||||||||||
| NPA % |
1.37 | 1.44 | 1.57 | 1.71 | 1.87 | |||||||||||||||||||||||
| Net charge-offs % |
0.23 | 0.30 | 0.28 | 0.22 | 0.45 | |||||||||||||||||||||||
| Allowance / loans |
1.36 | 1.43 | 1.51 | 1.54 | 1.64 | |||||||||||||||||||||||
| Allowance / NPL |
1.14 | x | 1.14 | x | 1.12 | x | 1.05 | x | 1.03 | x | ||||||||||||||||||
| Allowance / NPA |
0.99 | x | 0.99 | x | 0.96 | x | 0.90 | x | 0.87 | x | ||||||||||||||||||
| Allowance / charge-offs |
6.17 | x | 4.81 | x | 5.47 | x | 7.05 | x | 3.68 | x | ||||||||||||||||||
| Other |
||||||||||||||||||||||||||||
| Loans past due 90 days or more (f) |
$46,889 | $50,699 | $57,786 | $68,369 | $63,747 | (8)% | (26)% | |||||||||||||||||||||
| Guaranteed portion (f) |
18,552 | 24,036 | 27,020 | 32,782 | 35,063 | (23)% | (47)% | |||||||||||||||||||||
| Foreclosed real estate from government insured loans |
10,096 | 9,492 | 12,735 | 18,771 | 23,065 | 6% | (56)% | |||||||||||||||||||||
| Period-end loans, net of unearned income (millions) |
16,732 | 16,230 | 15,812 | 15,796 | 15,119 | 3% | 11% | |||||||||||||||||||||
NM - Not meaningful
* Amount is less than one percent.
| (a) | The valuation adjustment taken upon exercise of clean-up calls included expected losses. |
| (b) | Excludes foreclosed real estate from government-insured mortgages. |
| (c) | 2Q14 decrease is primarily related to a TRUPS sale. |
| (d) | 3Q14 decrease is related to the sale of held-for-sale mortgage loans. |
| (e) | See Glossary of Terms for definitions of Consolidated Key Ratios. |
| (f) | Includes loans held-for-sale. |
17
FHN ASSET QUALITY: CONSOLIDATED
Quarterly, Unaudited
| 1Q15 Changes vs. | ||||||||||||||||||||||||||||
| 1Q15 | 4Q14 | 3Q14 | 2Q14 | 1Q14 | 4Q14 | 1Q14 | ||||||||||||||||||||||
| Key Portfolio Details |
||||||||||||||||||||||||||||
| C&I |
||||||||||||||||||||||||||||
| Period-end loans ($ millions) |
$9,638 | $9,007 | $8,477 | $8,403 | $7,753 | 7% | 24% | |||||||||||||||||||||
| 30+ Delinq. % (a) |
0.07 | % | 0.05 | % | 0.10 | % | 0.19 | % | 0.27 | % | ||||||||||||||||||
| NPL % |
0.35 | 0.36 | 0.49 | 0.58 | 0.68 | |||||||||||||||||||||||
| Charge-offs % (qtr. annualized) |
0.07 | 0.19 | NM | 0.20 | 0.22 | |||||||||||||||||||||||
| Allowance / loans % |
0.70 | % | 0.74 | % | 0.82 | % | 0.82 | % | 0.94 | % | ||||||||||||||||||
| Allowance / charge-offs |
10.41 | x | 4.05 | x | NM | 4.35 | x | 4.27 | x | |||||||||||||||||||
| Commercial Real Estate |
||||||||||||||||||||||||||||
| Period-end loans ($ millions) |
$1,321 | $1,278 | $1,278 | $1,232 | $1,152 | 3% | 15% | |||||||||||||||||||||
| 30+ Delinq. % (a) |
0.33 | % | 0.14 | % | 0.33 | % | 1.10 | % | 1.61 | % | ||||||||||||||||||
| NPL % |
1.01 | 1.20 | 1.11 | 1.14 | 1.30 | |||||||||||||||||||||||
| Charge-offs % (qtr. annualized) |
0.03 | NM | 0.47 | NM | 0.12 | |||||||||||||||||||||||
| Allowance / loans % |
1.34 | % | 1.45 | % | 1.21 | % | 1.28 | % | 1.35 | % | ||||||||||||||||||
| Allowance / charge-offs |
45.39 | x | NM | 2.64 | x | NM | 10.97 | x | ||||||||||||||||||||
| Consumer Real Estate |
||||||||||||||||||||||||||||
| Period-end loans ($ millions) |
$4,923 | $5,048 | $5,131 | $5,219 | $5,258 | (2)% | (6)% | |||||||||||||||||||||
| 30+ Delinq. % (a) |
0.98 | % | 1.10 | % | 1.04 | % | 0.93 | % | 1.01 | % | ||||||||||||||||||
| NPL % |
2.43 | 2.39 | 2.41 | 2.51 | 2.51 | |||||||||||||||||||||||
| Charge-offs % (qtr. annualized) |
0.31 | 0.38 | 0.60 | 0.20 | 0.56 | |||||||||||||||||||||||
| Allowance / loans % |
2.22 | % | 2.24 | % | 2.31 | % | 2.26 | % | 2.35 | % | ||||||||||||||||||
| Allowance / charge-offs |
7.06 | x | 5.85 | x | 3.83 | x | 11.30 | x | 4.17 | x | ||||||||||||||||||
| Permanent Mortgage |
||||||||||||||||||||||||||||
| Period-end loans ($ millions) |
$512 | $539 | $573 | $594 | $622 | (5)% | (18)% | |||||||||||||||||||||
| 30+ Delinq. % (a) |
2.76 | % | 1.72 | % | 2.73 | % | 1.71 | % | 1.44 | % | ||||||||||||||||||
| NPL % |
6.43 | 6.32 | 5.93 | 6.23 | 6.46 | |||||||||||||||||||||||
| Charge-offs % (qtr. annualized) |
0.44 | 1.00 | 0.25 | 0.12 | 1.04 | |||||||||||||||||||||||
| Allowance / loans % |
3.94 | % | 3.55 | % | 3.53 | % | 3.99 | % | 3.62 | % | ||||||||||||||||||
| Allowance / charge-offs |
8.80 | x | 3.46 | x | 14.17 | x | 31.85 | x | 3.39 | x | ||||||||||||||||||
| Credit Card and Other |
||||||||||||||||||||||||||||
| Period-end loans ($ millions) |
$338 | $358 | $353 | $348 | $334 | (6)% | 1% | |||||||||||||||||||||
| 30+ Delinq. % (a) |
1.20 | % | 1.42 | % | 1.44 | % | 1.39 | % | 1.30 | % | ||||||||||||||||||
| NPL % |
0.22 | 0.21 | 0.20 | 0.39 | 0.42 | |||||||||||||||||||||||
| Charge-offs % (qtr. annualized) |
3.51 | 3.33 | 3.19 | 3.35 | 3.71 | |||||||||||||||||||||||
| Allowance / loans % |
4.01 | % | 4.11 | % | 4.17 | % | 5.01 | % | 3.91 | % | ||||||||||||||||||
| Allowance / charge-offs |
1.10 | x | 1.24 | x | 1.31 | x | 1.51 | x | 1.05 | x | ||||||||||||||||||
NM - Not meaningful
| (a) | 30+ Delinquency % includes all accounts delinquent more than one month and still accruing interest. |
18
FHN ASSET QUALITY: REGIONAL BANKING
Quarterly, Unaudited
| 1Q15 Changes vs. | ||||||||||||||||||||||||||||
| 1Q15 | 4Q14 | 3Q14 | 2Q14 | 1Q14 | 4Q14 | 1Q14 | ||||||||||||||||||||||
| Total Regional Banking |
||||||||||||||||||||||||||||
| Period-end loans ($ millions) |
$14,200 | $13,568 | $13,002 | $12,853 | $12,042 | 5 % | 18 | % | ||||||||||||||||||||
| 30+ Delinq. % (a) |
0.24 | % | 0.22 | % | 0.29 | % | 0.43 | % | 0.52 | % | ||||||||||||||||||
| NPL % |
0.45 | 0.48 | 0.54 | 0.69 | 0.69 | |||||||||||||||||||||||
| Charge-offs % (qtr. annualized) |
0.17 | 0.20 | 0.19 | 0.16 | 0.20 | |||||||||||||||||||||||
| Allowance / loans % |
0.89 | % | 0.93 | % | 0.98 | % | 1.03 | % | 1.06 | % | ||||||||||||||||||
| Allowance / charge-offs |
5.41 | x | 4.82 | x | 5.26 | x | 6.76 | x | 5.47 | x | ||||||||||||||||||
| Key Portfolio Details |
||||||||||||||||||||||||||||
| C&I |
||||||||||||||||||||||||||||
| Period-end loans ($ millions) |
$9,185 | $8,553 | $8,022 | $7,947 | $7,287 | 7 | % | 26 | % | |||||||||||||||||||
| 30+ Delinq. % (a) |
0.07 | % | 0.05 | % | 0.09 | % | 0.20 | % | 0.26% | |||||||||||||||||||
| NPL % |
0.24 | 0.24 | 0.37 | 0.57 | 0.55 | |||||||||||||||||||||||
| Charge-offs % (qtr. annualized) |
0.08 | 0.21 | NM | 0.09 | 0.07 | |||||||||||||||||||||||
| Allowance / loans % |
0.68 | % | 0.72 | % | 0.81 | % | 0.84 | % | 0.93 | % | ||||||||||||||||||
| Allowance / charge-offs |
9.42 | x | 3.62 | x | NM | 10.12 | x | 13.74 | x | |||||||||||||||||||
| Commercial Real Estate |
||||||||||||||||||||||||||||
| Period-end loans ($ millions) |
$1,320 | $1,273 | $1,274 | $1,226 | $1,145 | 4 | % | 15 | % | |||||||||||||||||||
| 30+ Delinq. % (a) (b) |
0.32 | % | 0.14 | % | 0.33 | % | 1.10 | % | 1.62 | % | ||||||||||||||||||
| NPL % |
1.00 | 1.14 | 1.04 | 1.06 | 1.05 | |||||||||||||||||||||||
| Charge-offs % (qtr. annualized) |
0.03 | NM | 0.49 | NM | 0.10 | |||||||||||||||||||||||
| Allowance / loans % |
1.33 | % | 1.43 | % | 1.18 | % | 1.25 | % | 1.31 | % | ||||||||||||||||||
| Allowance / charge-offs |
52.33 | x | NM | 2.46 | x | NM | 13.38 | x | ||||||||||||||||||||
| Consumer Real Estate |
||||||||||||||||||||||||||||
| Period-end loans ($ millions) |
$3,358 | $3,385 | $3,356 | $3,334 | $3,280 | (1) | % | 2 | % | |||||||||||||||||||
| 30+ Delinq. % (a) |
0.55 | % | 0.57 | % | 0.61 | % | 0.64 | % | 0.62 | % | ||||||||||||||||||
| NPL % |
0.84 | 0.86 | 0.83 | 0.90 | 0.92 | |||||||||||||||||||||||
| Charge-offs % (qtr. annualized) |
0.15 | 0.11 | 0.39 | 0.18 | 0.18 | |||||||||||||||||||||||
| Allowance / loans % |
0.97 | % | 0.95 | % | 0.99 | % | 0.97 | % | 0.99 | % | ||||||||||||||||||
| Allowance / charge-offs |
6.45 | x | 8.55 | x | 2.55 | x | 5.32 | x | 5.42 | x | ||||||||||||||||||
| Credit Card, Permanent Mortgage, and Other |
||||||||||||||||||||||||||||
| Period-end loans ($ millions) |
$337 | $357 | $351 | $346 | $330 | (6) | % | 2 | % | |||||||||||||||||||
| 30+ Delinq. % (a) |
1.29 | % | 1.51 | % | 1.49 | % | 1.43 | % | 1.38 | % | ||||||||||||||||||
| NPL % |
0.15 | 0.14 | 0.15 | 0.14 | 0.27 | |||||||||||||||||||||||
| Charge-offs % (qtr. annualized) |
3.22 | 3.00 | 3.01 | 3.05 | 3.43 | |||||||||||||||||||||||
| Allowance / loans % |
3.88 | % | 4.06 | % | 4.07 | % | 4.98 | % | 3.91 | % | ||||||||||||||||||
| Allowance / charge-offs |
1.16 | x | 1.36 | x | 1.36 | x | 1.64 | x | 1.13 | x | ||||||||||||||||||
| ASSET QUALITY: CORPORATE |
||||||||||||||||||||||||||||
| Permanent Mortgage |
||||||||||||||||||||||||||||
| Period-end loans ($ millions) |
$123 | $136 | $147 | $155 | $164 | (10) | % | (25) | % | |||||||||||||||||||
| 30+ Delinq. % (a) |
3.41 | % | 2.32 | % | 2.24 | % | 1.91 | % | 1.83 | % | ||||||||||||||||||
| NPL % |
2.29 | 2.25 | 2.65 | 2.34 | 2.24 | |||||||||||||||||||||||
| Charge-offs % (qtr. annualized) |
NM | NM | NM | NM | NM | |||||||||||||||||||||||
| Allowance / loans % |
NM | NM | NM | NM | NM | |||||||||||||||||||||||
| Allowance / charge-offs |
NM | NM | NM | NM | NM | |||||||||||||||||||||||
NM - Not meaningful
| (a) | 30+ Delinquency % includes all accounts delinquent more than one month and still accruing interest. |
| (b) | 1Q15 increase was primarily driven by one relationship |
19
FHN ASSET QUALITY: NON-STRATEGIC
Quarterly, Unaudited
| 1Q15 Changes vs. | ||||||||||||||||||||||||||
| 1Q15 | 4Q14 | 3Q14 | 2Q14 | 1Q14 | 4Q14 | 1Q14 | ||||||||||||||||||||
| Total Non-Strategic |
||||||||||||||||||||||||||
| Period-end loans ($ millions) |
$2,409 | $2,527 | $2,663 | $2,788 | $2,913 | (5)% | (17)% | |||||||||||||||||||
| 30+ Delinq. % (a) |
1.67 | % | 1.67 | % | 1.73 | % | 1.24 | % | 1.38 | % | ||||||||||||||||
| NPL % (b) |
5.55 | 5.37 | 5.22 | 4.98 | 5.28 | |||||||||||||||||||||
| Charge-offs % (qtr. annualized) |
0.55 | 0.85 | 0.71 | 0.53 | 1.46 | |||||||||||||||||||||
| Allowance / loans % |
4.25 | % | 4.18 | % | 4.16 | % | 4.01 | % | 4.08 | % | ||||||||||||||||
| Allowance / charge-offs |
7.48 | x | 4.79 | x | 5.75 | x | 7.41 | x | 2.72 | x | ||||||||||||||||
| Key Portfolio Details |
||||||||||||||||||||||||||
| C&I |
||||||||||||||||||||||||||
| Period-end loans ($ millions) |
$453 | $454 | $456 | $456 | $466 | * | (3)% | |||||||||||||||||||
| 30+ Delinq. % (a) |
0.08 | % | 0.05 | % | 0.23 | % | 0.02 | % | 0.43 | % | ||||||||||||||||
| NPL % (b) |
2.68 | 2.64 | 2.64 | 0.58 | 2.64 | |||||||||||||||||||||
| Charge-offs % (qtr. annualized) |
NM | NM | NM | 1.99 | 2.48 | |||||||||||||||||||||
| Allowance / loans % |
1.09 | % | 1.10 | % | 1.01 | % | 0.38 | % | 1.02 | % | ||||||||||||||||
| Allowance / charge-offs |
NM | NM | NM | 0.19 | x | 0.39 | x | |||||||||||||||||||
| Commercial Real Estate |
||||||||||||||||||||||||||
| Period-end loans ($ millions) |
$1 | $5 | $5 | $5 | $7 | (80)% | (86)% | |||||||||||||||||||
| 30+ Delinq. % (a) |
14.87 | % | - | % | - | % | - | % | - | % | ||||||||||||||||
| NPL % |
18.31 | 17.47 | 20.01 | 19.34 | 40.93 | |||||||||||||||||||||
| Charge-offs % (qtr. annualized) |
2.64 | 6.91 | NM | NM | 3.46 | |||||||||||||||||||||
| Allowance / loans % |
8.22 | % | 9.25 | % | 9.36 | % | 9.41 | % | 7.43 | % | ||||||||||||||||
| Allowance / charge-offs |
1.06 | x | 1.27 | x | NM | NM | 1.80 | x | ||||||||||||||||||
| Consumer Real Estate |
||||||||||||||||||||||||||
| Period-end loans ($ millions) |
$1,565 | $1,663 | $1,775 | $1,885 | $1,978 | (6)% | (21)% | |||||||||||||||||||
| 30+ Delinq. % (a) |
1.92 | % | 2.17 | % | 1.84 | % | 1.45 | % | 1.65 | % | ||||||||||||||||
| NPL % |
5.83 | 5.51 | 5.40 | 5.35 | 5.14 | |||||||||||||||||||||
| Charge-offs % (qtr. annualized) |
0.64 | 0.91 | 0.98 | 0.23 | 1.17 | |||||||||||||||||||||
| Allowance / loans % |
4.90 | % | 4.86 | % | 4.79 | % | 4.54 | % | 4.60 | % | ||||||||||||||||
| Allowance / charge-offs |
7.36 | x | 5.19 | x | 4.76 | x | 19.65 | x | 3.86 | x | ||||||||||||||||
| Permanent Mortgage |
||||||||||||||||||||||||||
| Period-end loans ($ millions) |
$379 | $393 | $415 | $427 | $446 | (4)% | (15)% | |||||||||||||||||||
| 30+ Delinq. % (a) |
2.50 | % | 1.40 | % | 2.88 | % | 1.59 | % | 1.21 | % | ||||||||||||||||
| NPL % |
7.82 | 7.78 | 7.13 | 7.71 | 7.99 | |||||||||||||||||||||
| Charge-offs % (qtr. annualized) |
0.59 | 1.44 | 0.29 | 0.15 | 1.46 | |||||||||||||||||||||
| Allowance / loans % |
5.32 | % | 4.83 | % | 4.84 | % | 5.52 | % | 5.00 | % | ||||||||||||||||
| Allowance / charge-offs |
8.82 | x | 3.30 | x | 16.57 | x | 35.18 | x | 3.36 | x | ||||||||||||||||
| Other Consumer |
||||||||||||||||||||||||||
| Period-end loans ($ millions) |
$11 | $12 | $12 | $15 | $16 | (8)% | (31)% | |||||||||||||||||||
| 30+ Delinq. % (a) |
1.40 | % | 2.48 | % | 2.24 | % | 1.79 | % | 1.95 | % | ||||||||||||||||
| NPL % |
6.66 | 6.22 | 5.38 | 9.16 | 9.03 | |||||||||||||||||||||
| Charge-offs % (qtr. annualized) |
9.24 | 8.21 | 6.74 | 7.81 | 6.83 | |||||||||||||||||||||
| Allowance / loans % |
4.69 | % | 3.43 | % | 4.48 | % | 2.94 | % | 2.12 | % | ||||||||||||||||
| Allowance / charge-offs |
0.49 | x | 0.41 | x | 0.63 | x | 0.36 | x | 0.30 | x | ||||||||||||||||
NM - Not meaningful
| * | Amount is less than one percent. |
| (a) | 30+ Delinquency % includes all accounts delinquent more than one month and still accruing interest. |
| (b) | 3Q14 increase related to interest deferral elected by an insurance TRUPS; 2Q14 NPL decrease related to TRUPS sales. |
20
FHN: PORTFOLIO METRICS
Unaudited
| C&I Portfolio: $9.6 Billion (57.6% of Total Loans) as of March 31, 2015 | ||||
| % OS | ||||
| General Corporate, Commercial, and Business Banking Loans |
78% | |||
| Loans to Mortgage Companies |
17% | |||
| Trust Preferred Loans |
4% | |||
| Bank Holding Company Loans |
1% | |||
Consumer Real Estate (primarily Home Equity) Portfolio: $4.9 Billion (29.4% of Total Loans)
| Origination LTV and FICO for Portfolio as of March 31, 2015 | Loan-to-Value | |||||||||||||||||||
| (excludes whole loan insurance) | <=60% | >60% - <=80% | >80% - 90% | >90% | ||||||||||||||||
| FICO score greater than or equal to 740 |
11% | 23 | % | 17 | % | 9% | ||||||||||||||
| FICO score 720-739 |
2% | 4 | % | 4 | % | 3% | ||||||||||||||
| FICO score 700-719 |
1% | 3 | % | 4 | % | 2% | ||||||||||||||
| FICO score 660-699 |
1% | 4 | % | 3 | % | 3% | ||||||||||||||
| FICO score 620-659 |
1% | 1 | % | 1 | % | 1% | ||||||||||||||
| FICO score less than 620 |
-% | 1 | % | - | % | 1% | ||||||||||||||
| Origination LTV and FICO for Portfolio - Regional Bank as of March 31, 2015 | Loan-to-Value | |||||||||||||||||||
| (excludes whole loan insurance) | <=60% | >60% - <=80% | >80% - 90% | >90% | ||||||||||||||||
| FICO score greater than or equal to 740 |
12 | % | 24 | % | 18 | % | 11 | % | ||||||||||||
| FICO score 720-739 |
1 | % | 4 | % | 4 | % | 3 | % | ||||||||||||
| FICO score 700-719 |
1 | % | 3 | % | 2 | % | 2 | % | ||||||||||||
| FICO score 660-699 |
1 | % | 3 | % | 3 | % | 2 | % | ||||||||||||
| FICO score 620-659 |
1 | % | 1 | % | 1 | % | 1 | % | ||||||||||||
| FICO score less than 620 |
- | % | 1 | % | - | % | 1 | % | ||||||||||||
| Origination LTV and FICO for Portfolio - Non-Strategic as of March 31, 2015 | Loan-to-Value | |||||||||||||||||||
| (excludes whole loan insurance) | <=60% | >60% - <=80% | >80% - 90% | >90% | ||||||||||||||||
| FICO score greater than or equal to 740 |
8 | % | 21 | % | 15 | % | 5 | % | ||||||||||||
| FICO score 720-739 |
2 | % | 6 | % | 6 | % | 2 | % | ||||||||||||
| FICO score 700-719 |
2 | % | 6 | % | 6 | % | 2 | % | ||||||||||||
| FICO score 660-699 |
2 | % | 5 | % | 4 | % | 3 | % | ||||||||||||
| FICO score 620-659 |
- | % | 1 | % | 1 | % | 1 | % | ||||||||||||
| FICO score less than 620 |
- | % | - | % | - | % | 2 | % | ||||||||||||
| Consumer Real Estate Portfolio Detail: | ||||||||||||
| Origination Characteristics | ||||||||||||
| Vintage | Balances ($B) | W/A Age (mo.) | CLTV | FICO | % TN | % 1st lien | ||||||
| pre-2003 |
$0.1 | 158 | 78% | 702 | 42% | 30% | ||||||
| 2003 |
$0.1 | 141 | 77% | 718 | 30% | 36% | ||||||
| 2004 |
$0.3 | 128 | 80% | 720 | 19% | 27% | ||||||
| 2005 |
$0.5 | 116 | 81% | 728 | 16% | 16% | ||||||
| 2006 |
$0.5 | 105 | 79% | 732 | 22% | 18% | ||||||
| 2007 |
$0.5 | 93 | 81% | 737 | 26% | 19% | ||||||
| 2008 |
$0.2 | 82 | 75% | 745 | 72% | 50% | ||||||
| 2009 |
$0.1 | 70 | 72% | 748 | 87% | 57% | ||||||
| 2010 |
$0.2 | 56 | 80% | 750 | 91% | 73% | ||||||
| 2011 |
$0.4 | 44 | 77% | 759 | 89% | 86% | ||||||
| 2012 |
$0.7 | 33 | 77% | 763 | 90% | 91% | ||||||
| 2013 |
$0.6 | 22 | 78% | 756 | 86% | 85% | ||||||
| 2014 |
$0.6 | 9 | 81% | 757 | 86% | 89% | ||||||
| 2015 |
$0.1 | 1 | 77% | 757 | 86% | 91% | ||||||
| Total |
$4.9 | 66 | 79% | 745 | 60% | 57% | ||||||
| (a) | 745 average portfolio origination FICO; 739 weighted average portfolio FICO (refreshed). |
21
FHN NON-GAAP TO GAAP RECONCILIATION
Quarterly, Unaudited
| (Dollars and shares in thousands, except per share data) | 1Q15 | 4Q14 | 3Q14 | 2Q14 | 1Q14 | |||||||||||||||
| Tangible Common Equity (Non-GAAP) |
||||||||||||||||||||
| (A) Total equity (GAAP) |
$2,499,257 | $2,581,590 | $2,614,908 | $2,621,462 | $2,541,792 | |||||||||||||||
| Less: Noncontrolling interest (a) |
295,431 | 295,431 | 295,431 | 295,431 | 295,431 | |||||||||||||||
| Less: Preferred stock |
95,624 | 95,624 | 95,624 | 95,624 | 95,624 | |||||||||||||||
| (B) Total common equity |
$2,108,202 | $2,190,535 | $2,223,853 | $2,230,407 | $2,150,737 | |||||||||||||||
| Less: Intangible assets (GAAP) (b) |
174,152 | 175,450 | 160,987 | 161,968 | 162,950 | |||||||||||||||
| (C) Tangible common equity (Non-GAAP) |
$1,934,050 | $2,015,085 | $2,062,866 | $2,068,439 | $1,987,787 | |||||||||||||||
| Tangible Assets (Non-GAAP) |
||||||||||||||||||||
| (D) Total assets (GAAP) |
$25,715,888 | $25,668,187 | $23,985,691 | $24,224,532 | $23,946,116 | |||||||||||||||
| Less: Intangible assets (GAAP) (b) |
174,152 | 175,450 | 160,987 | 161,968 | 162,950 | |||||||||||||||
| (E) Tangible assets (Non-GAAP) |
$25,541,736 | $25,492,737 | $23,824,704 | $24,062,564 | $23,783,166 | |||||||||||||||
| Period-end Shares Outstanding |
||||||||||||||||||||
| (F) Period-end shares outstanding |
233,499 | 234,220 | 235,249 | 237,147 | 236,586 | |||||||||||||||
| Tier 1 Common (Non-GAAP) |
||||||||||||||||||||
| (G) Tier 1 capital (c) (d) |
$2,452,075 | $2,813,503 | $2,783,147 | $2,751,933 | $2,666,486 | |||||||||||||||
| Less: Noncontrolling interest - FTBNA preferred stock (a) (e) |
N/A | 294,816 | 294,816 | 294,816 | 294,816 | |||||||||||||||
| Less: Preferred Stock |
N/A | 95,624 | 95,624 | 95,624 | 95,624 | |||||||||||||||
| Less: Trust preferred (f) |
N/A | 200,000 | 200,000 | 200,000 | 200,000 | |||||||||||||||
| (H) Tier 1 common (Non-GAAP) |
N/A | $2,223,063 | $2,192,707 | $2,161,493 | $2,076,046 | |||||||||||||||
| Risk Weighted Assets |
||||||||||||||||||||
| (I) Risk weighted assets (c) (d) |
$20,795,400 | $19,452,656 | $19,238,109 | $19,400,096 | $18,694,719 | |||||||||||||||
| Ratios |
||||||||||||||||||||
| (C)/(E) Tangible common equity to tangible assets (“TCE/TA”) (Non-GAAP) |
7.57 | % | 7.90 | % | 8.66 | % | 8.60 | % | 8.36 % | |||||||||||
| (A)/(D) Total equity to total assets (GAAP) |
9.72 | % | 10.06 | % | 10.90 | % | 10.82 | % | 10.61 % | |||||||||||
| (C)/(F) Tangible book value per common share (Non-GAAP) |
$8.28 | $8.60 | $8.77 | $8.72 | $8.40 | |||||||||||||||
| (B)/(F) Book value per common share (GAAP) |
$9.03 | $9.35 | $9.45 | $9.41 | $9.09 | |||||||||||||||
| (H)/(I) Tier 1 common to risk weighted assets (Non-GAAP) (c) |
N/A | 11.43 | % | 11.40 | % | 11.14 | % | 11.10 % | ||||||||||||
| (G)/(D) Tier 1 capital to total assets (GAAP) (c) |
9.54 | % | 10.96 | % | 11.60 | % | 11.36 | % | 11.14 % | |||||||||||
| Net Income Available to Common Shareholders Excluding Litigation Charges (Non-GAAP) |
||||||||||||||||||||
| Income/(loss) before income taxes (GAAP) |
$(94,666) | |||||||||||||||||||
| Less: Litigation and regulatory matters expense (GAAP) |
(162,500) | |||||||||||||||||||
| Adjusted income/(loss) before income taxes (Non-GAAP) |
67,834 | |||||||||||||||||||
| Adjusted provision/(benefit) for income taxes (Non-GAAP) (g) |
21,754 | |||||||||||||||||||
| Adjusted net income/(loss) (Non-GAAP) |
46,080 | |||||||||||||||||||
| Net income attributable to noncontrolling interest (GAAP) |
2,758 | |||||||||||||||||||
| Preferred stock dividends (GAAP) |
1,550 | |||||||||||||||||||
| Adjusted net income/(loss) available to common shareholders (Non-GAAP) |
$41,772 | |||||||||||||||||||
| Adjusted diluted shares (thousands) (Non-GAAP) (h) |
235,120 | |||||||||||||||||||
| Adjusted diluted EPS (Non-GAAP) |
$0.18 | |||||||||||||||||||
Certain previously reported amounts have been reclassified to agree with current presentation.
| (a) | Included in Total equity on the Consolidated Balance Sheet. |
| (b) | Includes goodwill and other intangible assets, net of amortization. |
| (c) | Current quarter is an estimate and reflects revisions to regulatory capital definitions under the new Basel III risk-based capital rules as phased-in. |
| (d) | Defined by and calculated in conformity with bank regulations. |
| (e) | Represents FTBNA preferred stock included in noncontrolling interest. |
| (f) | Included in Term borrowings on the Consolidated Balance Sheet. |
| (g) | Calculated using an effective tax rate of 32.07 percent. |
| (h) | Because FHN recognized a net loss available to common shareholders in first quarter 2015, potentially issuable shares are excluded from diluted shares because they are antidilutive. Excluding the litigation charge, FHN would have recognized net income available to common shareholders. As a result, adjusted shares are presented in order to include the dilute impact of potentially issuable shares. |
22
FHN GLOSSARY OF TERMS
Average Assets for Leverage: The amount of assets a company uses to calculate the leverage ratio, which includes average total assets less disallowed portions of goodwill, other intangibles, and deferred tax assets, as well as certain other regulatory adjustments made to Tier 1 capital.
Common Equity Tier 1: A measure of a company’s capital position under U.S. Basel III capital rules first applicable to FHN in 2015, which includes common equity less goodwill, other intangibles and certain other required regulatory deductions as defined in those rules. Common Equity Tier 1 capital under U.S. Basel III in 2015 is not the same as the non-regulatory Tier 1 Common capital commonly used prior to 2015; comparisons between the two are not meaningful.
Core Businesses: Management considers regional banking, capital markets, and corporate as FHN’s core businesses. Non-strategic has significant legacy assets and operations that are being wound down.
Fully Taxable Equivalent (“FTE”): Reflects the amount of tax-exempt income adjusted to a level that would yield the same after-tax income had that income been subject to taxation.
Tier 1 Capital Ratio: Ratio consisting of shareholders’ equity adjusted for certain unrealized gains/(losses) on available-for-sale securities, reduced by goodwill, certain other intangible assets, the disallowable portion of mortgage servicing rights and other disallowed assets divided by risk-adjusted assets. The components of Tier 1 capital, including the risk-adjustment of assets, changed significantly for FHN beginning in 2015 so that comparisons of a Tier 1 capital ratio after 2014 with a ratio prior to 2015 may not be meaningful.
Tier 1 Common: A measure of a company’s capital position associated with U.S. capital rules applicable to FHN prior to 2015, which includes Tier 1 capital as then defined less preferred stock amounts.
Troubled Debt Restructuring (“TDR”): A restructuring of debt whereby a creditor for economic or legal reasons related to the borrower’s financial difficulties grants a concession to the borrower that it would not otherwise consider. Such concession is granted in an attempt to protect as much of the creditor’s investment as possible by increasing the probability of repayment.
Key Ratios
Return on Average Assets: Ratio is annualized net income to average total assets.
Return on Average Common Equity: Ratio is annualized net income available to common shareholders to average common equity.
Fee Income to Total Revenue: Ratio is fee income excluding securities gains/(losses) to total revenue excluding securities gains/(losses).
Efficiency Ratio: Ratio is noninterest expense to total revenue excluding securities gains/(losses).
Asset Quality - Consolidated Key Ratios
NPL %: Ratio is nonperforming loans in the loan portfolio to total period-end loans.
NPA %: Ratio is nonperforming assets related to the loan portfolio to total period-end loans plus foreclosed real estate and other assets.
Net charge-offs %: Ratio is annualized net charge-offs to total average loans.
Allowance / loans: Ratio is allowance for loan losses to total period-end loans.
Allowance / NPL: Ratio is allowance for loan losses to nonperforming loans in the loan portfolio.
Allowance / NPA: Ratio is allowance for loan losses to nonperforming assets related to the loan portfolio.
Allowance / charge-offs: Ratio is allowance for loan losses to annualized net charge-offs.
23