Attached files
| file | filename |
|---|---|
| 8-K - 8-K - Bluerock Residential Growth REIT, Inc. | v406745_8k.htm |
Exhibit 99.1

April 6, 2015

Forward - Looking Statements The information in this presentation has been prepared solely for informational purposes by Bluerock Residential Growth REIT, Inc . (“BRG”) and does not constitute an offer to sell or the solicitation of an offer to purchase any securities . Neither the U . S . Securities and Exchange Commission (“Commission”) nor any other regulatory body has approved or disapproved or passed upon the accuracy or adequacy of this presentation . Any representation to the contrary is a criminal offense . This presentation is not, and should not be assumed to be, complete . This presentation has been prepared to assist interested parties in making their own evaluation of BRG and does not purport to contain all of the information that may be relevant . In all cases, interested parties should conduct their own investigation and analysis of BRG and the data set forth in this presentation and other information provided by or on behalf of BRG . In addition, certain of the information contained herein may be derived from information provided by industry sources . BRG believes that such information is accurate and that the sources from which it has been obtained are reliable . BRG cannot guarantee the accuracy of such information, however, and has not independently verified such information . Statements in this presentation are made as of the date of this presentation unless stated otherwise . This presentation also contains statements that, to the extent they are not recitations of historical fact, constitute “forward - looking statements . ” Forward - looking statements are typically identified by the use of terms such as “may,” “should,” “expect,” “could,” “intend,” “plan,” “anticipate,” “estimate,” “believe,” “continue,” “predict,” “potential” or the negative of such terms and other comparable terminology . The forward - looking statements included herein are based upon BRG’s current expectations, plans, estimates, assumptions and beliefs that involve numerous risks and uncertainties . Assumptions relating to the foregoing involve judgments with respect to, among other things, future economic, competitive and market conditions and future business decisions, all of which are difficult or impossible to predict accurately and many of which are beyond BRG’s control . Although BRG believes that the expectations reflected in such forward - looking statements are based on reasonable assumptions, BRG’s actual results and performance and the value of its securities could differ materially from those set forth in the forward - looking statements due to the impact of many factors including, but not limited to, the uncertainties of real estate development, acquisition and disposition activity, the ability of our joint venture partners to satisfy their obligations, the costs and availability of financing, the effects of local economic and market conditions, the effects of acquisitions and dispositions, the impact of newly adopted accounting principles on BRG’s accounting policies and on period - to - period comparisons of financial results, regulatory changes and other risks and uncertainties detailed in Item 1 A . (Risk Factors) of BRG’s Annual Report on Form 10 - K filed by BRG with the Commission on March 4 , 2015 , and other discussions of risk factors as detailed in subsequent filings by BRG with the Commission, including periodic reports . BRG claims the safe harbor protection for forward looking statements contained in the Private Securities Litigation Reform Act of 1995 . BRG undertakes no obligation to update or revise any such information for any reason after the date of this presentation, unless required by law . - 2 -

Investment Highlights - 3 - ▪ Differentiated Value Creation Strategy » Building a Class A portfolio in growth m arkets » Executing as ‘ l ocal s harpshooter’ with leading regional and local p artners » Creating value at asset l evel ▪ Deep, Experienced Management Team ▪ Deployed IPO and Follow - On Proceeds Ahead of Target ▪ Class A Portfolio with Embedded Value, plus Robust Accretive Pipeline ▪ 8.7% Dividend Yield Supported by Portfolio (1) ARIUM Grande Lakes , Orlando Resort - Style Pool, Lansbrook, Tampa Sky Deck, MDA Apartments, Chicago (1) As of the close on 4 /6/15

Experienced Team * “BRGM” refers to BRG Manager, LLC - 4 - Ramin Kamfar Chairman, CEO & President of BRG Gary Kachadurian Vice Chairman of BRGM Director - Chair of Investment Committee James G. Babb, III Chief Investment Officer of BRGM Jordan Ruddy President of BRGM ▪ Co - Founder of Bluerock Real Estate – 2002 ▪ Acquisition of close to 10,000 apartment units and 2.5 million square feet of office space ▪ 25 years in real estate, private equity, investment banking ▪ Previously, Lehman Brothers ▪ 34 years experience in real estate ▪ Previously, RREEF / Deutsche Bank – Head of National Acquisitions and Multifamily Value - Add & Development Groups; Member of Investment and Policy Committees ▪ Previously, Lincoln Property Company – Partner, Chairman - NMHC ▪ 25 years experience in real estate ▪ Previously, Starwood Capital – Founding Member; Co - Managed Starwood Multifamily and Office effort for 12 years ▪ Involved in creation of Equity Residential; Starwood Hotels; iStar Financial ▪ Co - Founder of Bluerock Real Estate – 2002 ▪ 25 years experience in real estate, capital markets ▪ Previously, Bank of America, JP Morgan Chase, Smith Barney
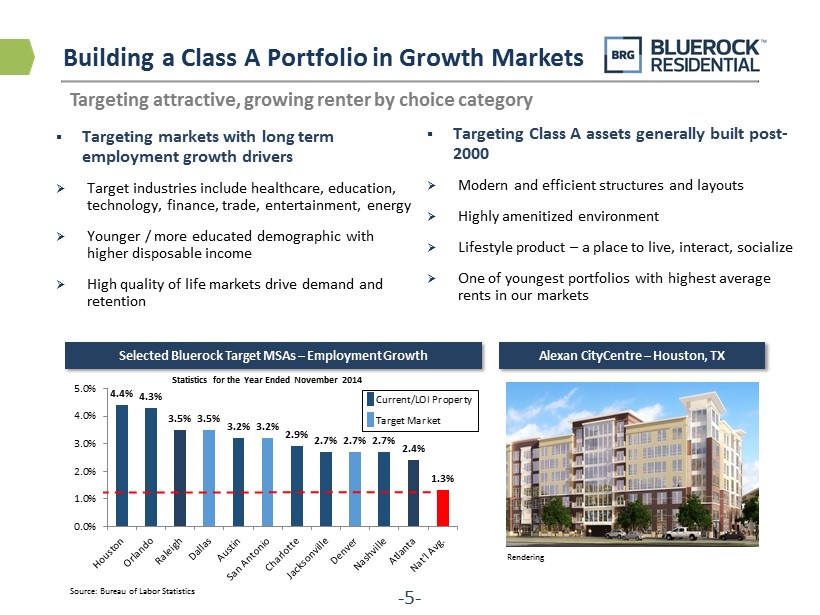
- 5 - ▪ Targeting Class A assets generally built post - 2000 » Modern and efficient structures and layouts » Highly amenitized environment » Lifestyle product – a place to live, interact, socialize » One of youngest portfolios with highest average rents in our markets Source: Bureau of Labor Statistics Statistics for the Year Ended November 2014 ▪ Targeting markets with long t erm e mployment g rowth d rivers » Target industries include healthcare , education, technology, finance, trade, entertainment, energy » Younger / more educated demographic with higher disposable income » High quality of life markets drive demand and retention Selected Bluerock Target MSAs – Employment Growth Alexan CityCentre – Houston, TX Targeting attractive, growing renter by choice category Building a Class A Portfolio in Growth Markets Current/LOI Property Target Market 4.4% 4.3% 3.5% 3.5% 3.2% 3.2% 2.9% 2.7% 2.7% 2.7% 2.4% 1.3% 0.0% 1.0% 2.0% 3.0% 4.0% 5.0% Rendering
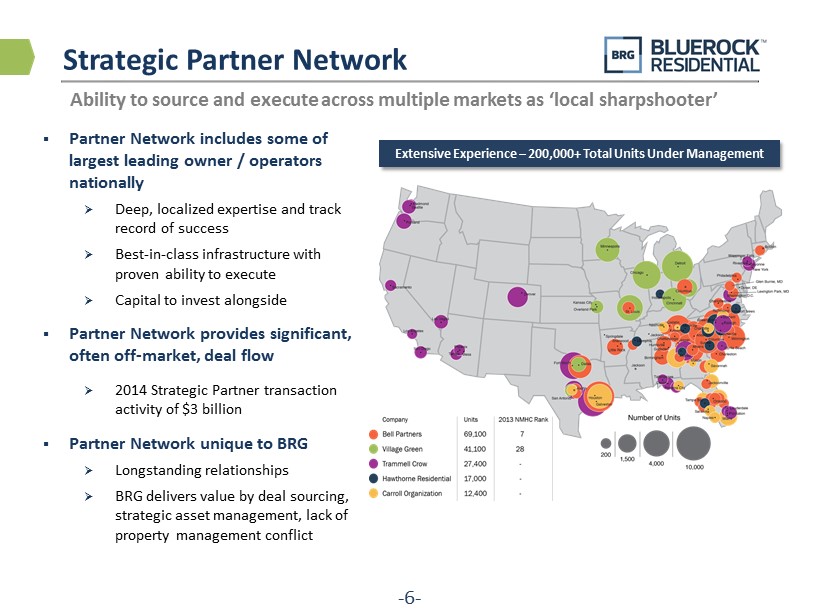
Strategic Partner Network Ability to source and execute across multiple markets as ‘local sharpshooter’ - 6 - Extensive Experience – 200,000+ Total Units Under Management ▪ Partner Network includes some of largest leading owner / operators nationally » Deep, localized expertise and track record of success » Best - in - class infrastructure with proven ability to execute » Capital to invest alongside ▪ Partner Network provides significant, often off - market, deal flow » 2014 Strategic Partner transaction activity of $3 billion ▪ Partner Network unique to BRG » Longstanding relationships » BRG delivers value by deal sourcing, strategic asset management, lack of property management conflict

BRG Creates Value ▪ Acquire properties primarily through off - market and relationship transactions » Focus on capturing discount to inherent value ▪ Target assets with high NOI growth potential through repositioning, renovation or redevelopment » Discount purchase of complex assets such as fractured condos or ‘broken capital structure’ as opportunity to create value ▪ Selectively invest in development deals with significant value creation » Structured as Convertible Preferred Equity to generate income during development; convertible into ownership at BRG option upon stabilization - 7 - Focus on discount purchase and post - acquisition value creation potential Recent Dispositions Asset Location Units Deal Type Cost (M) Sale Price (M) IRR (1) Equity Multiple (1) 23Hundred@Berry Hill Nashville, TN 266 Development $34 $61 60% 2.8x Grove at Waterford Hendersonville, TN 252 Value - Add $30 $38 91% 1.6x Estates at Perimeter Augusta, GA 240 Stabilized $25 $26 6% 1.2x Creekside Chattanooga, TN 192 Value - Add $14 $19 29% 2.5x Weighted Average 53% 2.2x (1) IRR and equity multiple calculated on BRG’s investment

- 8 - (1) For a discussion of the assumptions underlying this estimate, see BRG’s Current Report on Form 8 - k filed with the SEC on Feb ruary 26, 2015 Note: Stabilized and market cap rates based on Company projections and estimates Significant Progress Since IPO ▪ Demonstrating strength in operational results ▪ Investing IPO and follow - on proceeds into accretive transactions Q1 2014 I P O Q2 2014 Q3 2014 Q4 2014 G U I D A N C E Q1 - Pro Forma (1) Revenues (in millions) $3.3 $7.8 $9.6 $9.8 $11.6 - $11.8 Average Occupancy 91.6% 93.4% 95.5% 95.2% - Same Store NOI Growth (YoY) (9.4%) 7.6% 5.7% 13.8% - G&A / Revenues 19.6% 7.7% 6.9% 3.5% 3.3% - 3.2% AFFO per Share ($0.45) $0.13 $0.22 $0.19 $0.26 - $0.28 Property Market Units Stabilized Cap Rate Market Cap Rate Notes Lansbrook Village Tampa, FL 581 8.00% 5.50 - 5.75% Fractured Condo Alexan CityCentre Houston, TX 340 7.00% 4.50 - 4.75% Land Assemblage; Development UCF Orlando Orlando, FL 296 7.50% 5.25 - 5.50% Land Rezoning; Development Enders Place Orlando, FL 220 6.25% 5.25 - 5.50% Fractured Condo; Recapitalization ARIUM Grande Lakes Orlando, FL 306 6.00% 5.25 - 5.50% Core - Plus; Recapitalization Alexan Blaire House Houston, TX 270 7.00 - 7.50% 4.75 - 5.00% Relationship; Development Park & Kingston Charlotte, NC 153 5.25% 4.50 - 4.75% Relationship; Core - Plus Fox Hill Austin, TX 288 6.25% 5.00 - 5.25% Relationship; Value - Add Total 2,454

(1) Based on information as of December 31, 2014; excludes properties subsequently sold (2) MDA was built in 1929 as an office building and underwent a gut rehabilitation in 2006 (3) Alexan CityCentre is currently under development. Leasing is expected to begin December 2016, rent is projected (4) Alexan Blaire House is currently under development. Leasing is expected to begin December 2016, rent is projected (5) UCF Orlando is currently under development. Leasing is expected to begin April, 2015 , rent is projected (6) Phase II (15 units) to be acquired at c/o; estimated 4Q 2015 (7) Pro Forma includes UCF Orlando, Alexan Blair e House, and Alexan CityCentre projected units and rents (8) For further detail on pipeline, please see page 11 Current Portfolio (1) - 9 - Property Name Location Units Year Built / Renovated Monthly Rent Occupancy Sourcing MDA Apartments Chicago, IL 190 2006 (2) $ 2,210 92% off - market Alexan CityCentre (3) Houston, TX 340 2016 2,144 - off - market Alexan Blaire House (4) Houston, TX 269 2016 2,012 - off - market Enders Place at Baldwin Park Orlando, FL 220 2003 1,494 97% relationship UCF Orlando (5) Orlando, FL 296 2015 1,211 - off - market ARIUM Grande Lakes Orlando, FL 306 2005 1,081 93% off - market Lansbrook Village Tampa, FL 588 1998 - 2004 1,105 93% auction/ relat . Village Green Ann Arbor, MI 520 1989 - 1992 1,085 96% off - market North Park Towers Southfield, MI 313 1967/2000 1,028 94% relationship Villas at Oak Crest Chattanooga, TN 209 1985, 1999 796 98% relationship Springhouse at Newport News Newport News, VA 432 1985 800 94% off - market Park & Kingston (6) Charlotte, NC 153 2014 1,220 94% relationship Fox Hill Austin, TX 288 2010 1,137 96% relationship Total/Average (Current) 3,219 $ 1,196 94% Total/Average (Pro Forma ) (7) 4,124 $ 1,333 Total/Average (Pro Forma with Pipeline ) (8) 5,158 $ 1,331 MDA Apartments Lansbrook Village

Portfolio Comparison (as of Q4 2014) Average Asset Age (Q4) Same Store NOI Growth (Q4) Average Monthly Rent Per Unit (Q4) Portfolio Occupancy (Q4) - 10 - Source: SNL & Company filings *BRG average a sset a ge uses major renovation dates at North Park Towers and MDA Apartments One of the youngest, most productive multifamily portfolios $ 1,277 $1,165 $1,059 $1,020 $788 $600 $800 $1,000 $1,200 AEC BRG APTS TSRE IRT 14.2% 13.8% 6.6% 1.9% N/A 0.0% 4.0% 8.0% 12.0% 16.0% TSRE BRG APTS AEC IRT 11 13 14 17 24 0 10 20 30 APTS TSRE BRG* AEC IRT 95.7% 95.2% 94.4% 93.0% 92.7% 91.0% 93.0% 95.0% 97.0% TSRE BRG AEC APTS IRT

Accretive Pipeline Targeted for Investment Faster than Projections - 11 - (1) Based on information currently available to Management, Management does not deem these investments to be probable as of t he date of presentation. The consummation of these transactions may not occur on the terms described herein, or at all 4 Class A properties with 1,034 units and total BRG equity of $52 million (1) Jacksonville Charlotte Recap Phase I Charlotte Recap Phase II Atlanta Status Under Sponsor Contract Under Sponsor LOI Under Sponsor LOI Under Sponsor Contract Location Jacksonville, FL Charlotte, NC Charlotte, NC Atlanta, GA Year Built 2017 2013 2015 2016 – 2017 Units 276 322 151 285 Anticipated Cost $50 million $45 million $22 million $48 million Sourcing Strategy Relat. / Off - Mkt Off - Mkt Off - Mkt Off - Mkt Investment Strategy Invest - to - Own Discount Recap Discount Recap Invest - to - Own Est. Bluerock Equity $17 million $14 million $6 million $15 million Stabilized Cap Rate 7.0 - 7.5 % 6.2% 5.8% 7.2% Market Cap Rate 4.75 - 5.25% 5.25 - 5.75% 5.25 - 5.75% 5.00 - 5.25%

23Hundred@Berry Hill – Nashville, TN Investment Summary Year Built 2014 Construction Start October 2012 Units 266 Partner Stonehenge – 17.5% Sourcing Strategy Off - Market - 12 - ▪ Identified emerging Melrose / Berry Hill submarket through our deep, localized expertise in market ▪ Purchased commercial lot, executed rezoning, entitlement, development of a Class A urban infill apartment community tailored to the Nashville renter by choice demographic » Lifestyle amenities include a top floor songwriter’s lounge with panoramic views, an entertainment stage, a Fusion Fit Club, an oversized pool and a cyber café ▪ Underwrote project at 7.5% return on cost, with a 5.5% potential market value ▪ Delivered project at 8.6% return on cost, under contract to sell property at a sub - 5.0% cap rate ▪ Development Cost of $34 million vs. sale price of $61 million, representing IRR of 60% and return of 2.8x our invested equity

Lansbrook Village – Tampa, FL Investment Summary Year Built 1998 - 2004 Acquisition Date May 2014 Units at Acquisition/Current 573/585 Partner Carroll – 10% Sourcing Strategy Relationship - 13 - ▪ Identified opportunity to purchase a Class A fractured condominium community in attractive Palm Harbor submarket from a financial owner at end of fund life ▪ Purchased 573 (of 774) units at $103k per unit vs replacement cost of $150k per unit » Underwrote return on cost of 6.25% vs comparable cap rates of 5.50 – 5.75% ▪ Value - add opportunities projected to grow return on cost to 8.0%+ » Improved operations: a chieving 6.65% return on cost based on current Net Operating Income » Purchase of remaining 190+ units at cap rates of 8 – 11%; purchased 12 units to date » Unit / amenity upgrades and lifestyle initiatives to drive rental rates

Attractive Metrics Relative to Peers - 14 - Source: SNL Financial; BRG Price/2015 AFFOx based on 1Q pro forma AFFO guidance of $0.26 - $0.28 per share; stock price as of 4 /6/15 Note: NAV and AFFO metrics based solely on third party estimates. Company management expresses no opinion on the accuracy of such estimates and is not providing valuation or earnings guidance Ticker Price Mkt Cap Avg. Unit Avg. Age Yield Price / NAV Price/ 2015 AFFOx Notes ($ 000’s) Rent (years) AEC $24.79 $1,435 $1,277 17 3.4% 101% 21.4 Midwest Portfolio / Mgt. Turmoil TSRE $7.12 $261 $1,020 13 5.3% 87% 18.6 Closest Comp IRT $9.63 $307 $788 24 7.5% 90% 12.7 B/C Class Apartments in Inferior Mkts Average $668 $1,169 18 4.3% 97% 19.7 BRG $13.40 $177 $1,165 14 8.7% 76% 12.0 - 12.9 BRG Price at Average Metrics $27.13 $17.19 $20.49 - $22.07