Attached files
| file | filename |
|---|---|
| EX-23.1 - EX-23.1 - WILLIAMS SONOMA INC | d851953dex231.htm |
| EXCEL - IDEA: XBRL DOCUMENT - WILLIAMS SONOMA INC | Financial_Report.xls |
| EX-31.1 - EX-31.1 - WILLIAMS SONOMA INC | d851953dex311.htm |
| EX-10.1 - EX-10.1 - WILLIAMS SONOMA INC | d851953dex101.htm |
| EX-32.2 - EX-32.2 - WILLIAMS SONOMA INC | d851953dex322.htm |
| EX-32.1 - EX-32.1 - WILLIAMS SONOMA INC | d851953dex321.htm |
| EX-21.1 - EX-21.1 - WILLIAMS SONOMA INC | d851953dex211.htm |
| EX-31.2 - EX-31.2 - WILLIAMS SONOMA INC | d851953dex312.htm |
| EX-10.19 - EX-10.19 - WILLIAMS SONOMA INC | d851953dex1019.htm |
Table of Contents
UNITED STATES
SECURITIES AND EXCHANGE COMMISSION
WASHINGTON, D.C. 20549
FORM 10-K
(Mark One):
| x | ANNUAL REPORT PURSUANT TO SECTION 13 OR 15(d) OF THE SECURITIES EXCHANGE ACT OF 1934 |
For the fiscal year ended February 1, 2015.
OR
| ¨ | TRANSITION REPORT PURSUANT TO SECTION 13 OR 15(d) OF THE SECURITIES EXCHANGE ACT OF 1934 |
For the transition period from to
Commission file number 001-14077
WILLIAMS-SONOMA, INC.
(Exact name of registrant as specified in its charter)
| Delaware | 94-2203880 | |
| (State or other jurisdiction of incorporation or organization) |
(I.R.S. Employer Identification No.) | |
| 3250 Van Ness Avenue, San Francisco, CA | 94109 | |
| (Address of principal executive offices) | (Zip Code) | |
Registrant’s telephone number, including area code: (415) 421-7900
Securities registered pursuant to Section 12(b) of the Act:
| Common Stock, $.01 par value | New York Stock Exchange, Inc. | |
| (Title of class) | (Name of each exchange on which registered) |
Securities registered pursuant to Section 12(g) of the Act: None
Indicate by check mark if the registrant is a well-known seasoned issuer, as defined in Rule 405 of the Securities Act. Yes x No ¨
Indicate by check mark if the registrant is not required to file reports pursuant to Section 13 or Section 15(d) of the Act. Yes ¨ No x
Indicate by check mark whether the registrant (1) has filed all reports required to be filed by Section 13 or 15(d) of the Securities Exchange Act of 1934 during the preceding 12 months (or for such shorter period that the registrant was required to file such reports), and (2) has been subject to such filing requirements for the past 90 days. Yes x No ¨
Indicate by check mark whether the registrant has submitted electronically and posted on its corporate Web site, if any, every Interactive Data File required to be submitted and posted pursuant to Rule 405 of Regulation S-T (§232.405 of this chapter) during the preceding 12 months (or for such shorter period that the registrant was required to submit and post such files). Yes x No ¨
Indicate by check mark if disclosure of delinquent filers pursuant to Item 405 of Regulation S-K (§229.405 of this chapter) is not contained herein, and will not be contained, to the best of registrant’s knowledge, in definitive proxy or information statements incorporated by reference in Part III of this Form 10-K or any amendment to this Form 10-K. ¨
Indicate by check mark whether the registrant is a large accelerated filer, an accelerated filer, a non-accelerated filer or a smaller reporting company. See definitions of “large accelerated filer,” “accelerated filer” and “smaller reporting company” in Rule 12b-2 of the Exchange Act. (Check one):
Large accelerated filer x Accelerated filer ¨ Non-accelerated filer ¨ (Do not check if a smaller
reporting company) Smaller reporting company ¨
Indicate by check mark whether the registrant is a shell company (as defined in Rule 12b-2 of the Act). Yes ¨ No x
As of August 3, 2014, the approximate aggregate market value of the registrant’s common stock held by non-affiliates was 6,206,368,000. It is assumed for purposes of this computation that an affiliate includes all persons as of August 3, 2014 listed as executive officers and directors with the Securities and Exchange Commission. This aggregate market value includes all shares held in the Williams-Sonoma, Inc. Stock Fund within the registrant’s 401(k) Plan.
As of March 30, 2015, 91,642,370 shares of the registrant’s common stock were outstanding.
Table of Contents
DOCUMENTS INCORPORATED BY REFERENCE
Portions of our definitive Proxy Statement for the 2015 Annual Meeting of Stockholders, also referred to in this Annual Report on Form 10-K as our Proxy Statement, which will be filed with the Securities and Exchange Commission, or SEC, have been incorporated in Part III hereof.
FORWARD-LOOKING STATEMENTS
This Annual Report on Form 10-K and the letters to stockholders contained in this Annual Report contain forward-looking statements within the “safe harbor” provisions of the Private Securities Litigation Reform Act of 1995 that involve risks and uncertainties, as well as assumptions that, if they do not fully materialize or prove incorrect, could cause our business and operating results to differ materially from those expressed or implied by such forward-looking statements. Such forward-looking statements include, without limitation, statements related to: projections of earnings, revenues, growth and other financial items; the strength and growth of our business and our brands; our beliefs about our competitive position, relative performance and our ability to leverage our competitive advantages; the plans, strategies, initiatives and objectives of management for future operations; our brands and our products, including our ability to introduce new brands, new products and product lines and bring in new customers; our belief that our direct-mail catalogs and the Internet act as a cost-efficient means of testing market acceptance of new products and new brands; the complementary nature of our e-commerce and retail channels; our marketing efforts; our global business, including franchising and other third party arrangements in the Middle East, the Philippines and Mexico, and operations in Australia and the United Kingdom; our ability to attract new customers; the seasonal variations in demand; our ability to recruit, retain and motivate skilled personnel; our belief in the reasonableness of the steps taken to protect the security and confidentiality of the information we collect; our belief in the adequacy of our facilities and the availability of suitable additional or substitute space; our belief in the ultimate resolution of current legal proceedings; the payment of dividends; our stock repurchase program; our long-term strategic growth initiatives; investing in our e-commerce platform, our supply chain initiatives and new stores; our longer-term growth initiatives; the growth opportunities of our brands and overall business; penetration of our e-commerce channel; our position to deliver on our growth initiatives; our capital allocation strategy in fiscal 2015; our planned use of cash in fiscal 2015; our compliance with financial covenants; our belief that our cash on hand and available credit facilities will provide adequate liquidity for our business operations over the next 12 months; our belief regarding the effects of potential losses under our indemnification obligations; the impact of inflation; the effects of changes in our inventory reserves; the impact of new accounting pronouncements; and statements of belief and statements of assumptions underlying any of the foregoing. You can identify these and other forward-looking statements by the use of words such as “will,” “may,” “should,” “expects,” “plans,” “anticipates,” “believes,” “estimates,” “predicts,” “intends,” “potential,” “continue,” or the negative of such terms, or other comparable terminology.
The risks, uncertainties and assumptions referred to above that could cause our results to differ materially from the results expressed or implied by such forward-looking statements include, but are not limited to, those discussed under the heading “Risk Factors” in Item 1A hereto and the risks, uncertainties and assumptions discussed from time to time in our other public filings and public announcements. All forward-looking statements included in this document are based on information available to us as of the date hereof, and we assume no obligation to update these forward-looking statements.
1
Table of Contents
WILLIAMS-SONOMA, INC.
ANNUAL REPORT ON FORM 10-K
FISCAL YEAR ENDED FEBRUARY 1, 2015
2
Table of Contents
| ITEM 1. | BUSINESS |
OVERVIEW
Williams-Sonoma, Inc., incorporated in 1973, is a multi-channel specialty retailer of high quality products for the home.
In 1956, our founder, Chuck Williams, turned a passion for cooking and eating with friends into a small business with a big idea. He opened a store in Sonoma, California, to sell the French cookware that intrigued him while visiting Europe but that could not be found in America. Chuck’s business, which set a standard for customer service, took off and helped fuel a revolution in American cooking and entertaining that continues today.
In the decades that followed, the quality of our products, our ability to identify new opportunities in the market and our people-first approach to business have facilitated our expansion beyond the kitchen into nearly every area of the home. Additionally, by embracing new technologies and customer-engagement strategies as they emerge, we are able to continually refine our best-in-class approach to multi-channel retailing.
Today, Williams-Sonoma, Inc. is one of the United States’ largest e-commerce retailers with some of the best known and most beloved brands in home furnishings. We currently operate retail stores in the United States, Canada, Puerto Rico, Australia, and the United Kingdom, and franchise our brands to third parties in a number of countries in the Middle East and the Philippines. Our products are also available to customers through our catalogs and online worldwide.
Williams-Sonoma
From the beginning, our namesake brand, Williams-Sonoma, has been bringing people together around food. A leading specialty retailer of high-quality products for the kitchen and home, the brand seeks to provide world-class service and an engaging customer experience. Williams-Sonoma products include everything for cooking, dining and entertaining, including: cookware, tools, electrics, cutlery, tabletop and bar, outdoor, furniture and a vast library of cookbooks. The brand also includes Williams-Sonoma Home, a premium concept that offers classic home furnishings and decorative accessories, extending the Williams-Sonoma lifestyle beyond the kitchen into every room of the home.
Pottery Barn
Established in 1949 and acquired by Williams-Sonoma, Inc. in 1986, Pottery Barn is a premier multi-channel home furnishings retailer. The brand was founded on the idea that home furnishings should be exceptional in comfort, quality, style and value. Pottery Barn stores, website, and catalogs are specially designed to make shopping an enjoyable experience, with inspirational lifestyle displays dedicated to every space in the home. Pottery Barn products include furniture, bedding, bathroom accessories, rugs, curtains, lighting, tabletop, outdoor and decorative accessories.
Pottery Barn Kids
Launched in 1999, Pottery Barn Kids serves as an inspirational destination for creating childhood memories by decorating nurseries, bedrooms and play spaces. Pottery Barn Kids offers exclusive, innovative and high-quality products designed specifically for creating magical spaces where children can play, laugh, learn and grow.
West Elm
Since its launch in 2002, West Elm has been helping customers express their personal style at home with authentic, affordable and approachable products. Each season, West Elm’s talented in-house team of designers create a collection that cannot be found anywhere else, and work with artists and independent designers both globally and locally to develop collaborations that are exclusive to the brand. The brand also works closely with organizations that support the development of craft and artisan skills to offer handcrafted and one-of-a-kind discoveries from around the world. West Elm offers a complete assortment of products including furniture, bedding, bathroom accessories, rugs, curtains, lighting, decorative accessories, dinnerware, kitchen essentials, and gifts.
3
Table of Contents
PBteen
Launched in 2003, PBteen is the first home concept to focus exclusively on the teen market. The brand offers a complete line of furniture, bedding, lighting, decorative accents and more for teen bedrooms, dorm rooms, study spaces and lounges. PBteen’s innovative products are specifically designed to help teens create a comfortable and stylish room that reflects their own individual aesthetic.
Rejuvenation
Rejuvenation, founded in 1977 with a passion for old buildings, vintage lighting and house parts and great design, was acquired by Williams-Sonoma, Inc. in 2011. Inspired by history and period authenticity, Rejuvenation’s lighting and home-goods product lines span periods back to the 1870s. With manufacturing facilities in Portland, Oregon, Rejuvenation offers a wide assortment of high-quality lights, hardware, furniture and home décor.
Mark and Graham
Launched in late 2012, Mark and Graham is designed to be a premier destination for personalized gift buying. With over 100 monograms and font types to choose from, a Mark and Graham purchase is uniquely personal. The brand’s product lines include women’s and men’s accessories, small leather goods, jewelry, key item apparel, paper, entertaining and bar, home décor, and seasonal items.
E-COMMERCE OPERATIONS
Prior to the third quarter of fiscal 2014, we referred to the e-commerce channel as the direct-to-customer channel. As of February 1, 2015, the e-commerce channel had the following merchandising strategies: Williams-Sonoma, Pottery Barn, Pottery Barn Kids, West Elm, PBteen, Williams-Sonoma Home, Rejuvenation and Mark and Graham, which sell our products through our e-commerce websites and direct-mail catalogs. We offer shipping from many of our brands to countries worldwide, while our catalogs reach customers across the U.S. and Australia. Of our merchandising strategies, the Pottery Barn brand and its extensions continue to be the largest source of revenue in the e-commerce channel. The e-commerce channel complements the retail channel by building brand awareness and acting as an effective advertising vehicle. In addition, we believe that our e-commerce websites and our direct-mail catalogs act as a cost-efficient means of testing market acceptance of new products and new brands. Leveraging these insights and our multi-channel positioning, our marketing efforts, including the use of online advertising and the circulation of catalogs, are targeted toward driving sales to all of our channels, including retail. Consistent with our published privacy policies, we send our catalogs to addresses from our proprietary customer list, as well as to addresses from lists of other mail order direct marketers, magazines and companies with which we establish a business relationship. In accordance with prevailing industry practice and our privacy policies, we may also rent our list to select mailers. Our customer mailings are continually updated to include new prospects and to eliminate non-responders.
Detailed financial information about the e-commerce channel is found in Note L to our Consolidated Financial Statements.
RETAIL STORES
As of February 1, 2015, the retail channel had the following merchandising strategies: Williams-Sonoma, Pottery Barn, Pottery Barn Kids, West Elm and Rejuvenation, operating 601 stores comprised of 562 stores in 44 states, Washington, D.C., and Puerto Rico, 25 stores in Canada, 13 stores in Australia and 1 store in the United Kingdom. This represents 243 Williams-Sonoma, 199 Pottery Barn, 85 Pottery Barn Kids, 69 West Elm and 5 Rejuvenation stores.
We also have multi-year franchise agreements with third parties that currently operate 30 franchised stores in a number of countries in the Middle East and the Philippines. Additionally, in fiscal 2014, we entered into a franchise agreement with an unaffiliated franchisee to operate stores and e-commerce websites in Mexico, beginning in 2015. The retail business complements the e-commerce business by building brand awareness and attracting new customers to our brands. Our retail stores serve as billboards for our brands, which we believe inspires our customers to shop online and through our catalogs.
4
Table of Contents
Detailed financial information about the retail channel is found in Note L to our Consolidated Financial Statements.
SUPPLIERS
We purchase our merchandise from numerous foreign and domestic manufacturers and importers, the largest of which accounted for approximately 4% of our purchases during fiscal 2014. Approximately 64% of our merchandise purchases in fiscal 2014 were sourced from foreign vendors in 51 countries, predominantly in Asia and Europe, of which approximately 98% were negotiated and paid for in U.S. dollars.
COMPETITION AND SEASONALITY
The specialty retail business is highly competitive. Our specialty retail stores, e-commerce websites and direct-mail catalogs compete with other retailers, including large department stores, discount retailers, other specialty retailers offering home-centered assortments, other e-commerce websites and other direct-mail catalogs. The substantial sales growth in the direct-to-customer industry within the last decade, particularly in e-commerce, has encouraged the entry of many new competitors and an increase in competition from established companies. In addition, we face increased competition from discount retailers who, in the past, may not have competed with us or to this degree. We compete on the basis of our brand authority, the quality of our merchandise, service to our customers, our proprietary customer list, our e-commerce websites and our marketing capabilities, as well as the location and appearance of our stores. We believe that we compare favorably with many of our current competitors with respect to some or all of these factors.
Our business is subject to substantial seasonal variations in demand. Historically, a significant portion of our net revenues and net earnings have been realized during the period from October through January, and levels of net revenues and net earnings have typically been lower during the period from February through September. We believe this is the general pattern associated with the retail industry. In anticipation of our holiday selling season, we hire a substantial number of additional temporary employees in our retail stores, customer care centers and distribution centers, and incur significant fixed catalog production and mailing costs.
EMPLOYEES
As of February 1, 2015, we had approximately 26,800 employees, of whom approximately 8,700 were full-time. During the fiscal 2014 holiday selling season (defined as the period from October through December), we hired approximately 8,800 temporary employees primarily in our retail stores, customer care centers and distribution centers.
TRADEMARKS, COPYRIGHTS, PATENTS AND DOMAIN NAMES
We own and/or have applied to register 75 separate trademarks and service marks. We own and/or have applied to register our key brand names as trademarks in the U.S. and 91 additional jurisdictions. Exclusive rights to the trademarks and service marks are held by Williams-Sonoma, Inc. and are used by our subsidiaries and franchisees under license. These marks include our core brand names as well as brand names for selected products and services. The core brand names in particular, including “Williams-Sonoma,” the Williams-Sonoma Grande Cuisine logo, “Pottery Barn,” “pottery barn kids,” “PBteen,” “west elm,” “Williams-Sonoma Home,” “Rejuvenation” and “Mark and Graham” are of material importance to us. Trademarks are generally valid as long as they are in use and/or their registrations are properly maintained, and they have not been found to have become generic. Trademark registrations can generally be renewed indefinitely so long as the marks are in use. We own numerous copyrights and trade dress rights for our products, product packaging, catalogs, books, house publications, website designs and store designs, among other things, which are also used by our subsidiaries and franchisees under license. We hold patents on certain product functions and product designs. Patents are generally valid for 14 to 20 years as long as their registrations are properly maintained. In addition, we have registered and maintain numerous Internet domain names, including “williams-sonoma.com,” “potterybarn.com,”
5
Table of Contents
“potterybarnkids.com,” “pbteen.com,” “westelm.com,” “wshome.com,” “williams-sonomainc.com,” “rejuvenation.com” and “markandgraham.com.” Collectively, the trademarks, copyrights, trade dress rights and domain names that we hold are of material importance to us.
AVAILABLE INFORMATION
We file annual reports on Form 10-K, quarterly reports on Form 10-Q, current reports on Form 8-K, proxy and information statements and amendments to reports filed or furnished pursuant to Sections 13(a), 14 and 15(d) of the Securities Exchange Act of 1934, as amended. The public may read and copy these materials at the SEC’s Public Reference Room at 100 F Street, N.E., Washington, D.C. 20549-0213. The public may obtain information on the operation of the Public Reference Room by calling the SEC at 1-800-SEC-0330. The SEC also maintains a website at www.sec.gov that contains reports, proxy and information statements and other information regarding Williams-Sonoma, Inc. and other companies that file materials electronically with the SEC. Our annual reports, Forms 10-K, Forms 10-Q, Forms 8-K and proxy and information statements are also available, free of charge, on our website at www.williams-sonomainc.com.
| ITEM 1A. | RISK FACTORS |
A description of the risks and uncertainties associated with our business is set forth below. You should carefully consider such risks and uncertainties, together with the other information contained in this report and in our other public filings. If any of such risks and uncertainties actually occurs, our business, financial condition or operating results could differ materially from the plans, projections and other forward-looking statements included in the section titled “Management’s Discussion and Analysis of Financial Condition and Results of Operations” and elsewhere in this report and in our other public filings. In addition, if any of the following risks and uncertainties, or if any other risks and uncertainties, actually occurs, our business, financial condition or operating results could be harmed substantially, which could cause the market price of our stock to decline, perhaps significantly.
Declines in general economic conditions, and the resulting impact on consumer confidence and consumer spending, could adversely impact our results of operations.
Our financial performance is subject to declines in general economic conditions and the impact of such economic conditions on levels of consumer confidence and consumer spending. Consumer confidence and consumer spending may deteriorate significantly, and could remain depressed for an extended period of time. Consumer purchases of discretionary items, including our merchandise, generally decline during periods when disposable income is limited, unemployment rates increase or there is economic uncertainty. An uncertain economic environment could also cause our vendors to go out of business or our banks to discontinue lending to us or our vendors, or it could cause us to undergo restructurings, any of which would adversely impact our business and operating results.
We are unable to control many of the factors affecting consumer spending, and declines in consumer spending on home furnishings and kitchen products in general could reduce demand for our products.
Our business depends on consumer demand for our products and, consequently, is sensitive to a number of factors that influence consumer spending, including general economic conditions, consumer disposable income, fuel prices, recession and fears of recession, unemployment, war and fears of war, inclement weather, availability of consumer credit, consumer debt levels, conditions in the housing market, interest rates, sales tax rates and rate increases, inflation, consumer confidence in future economic conditions and political conditions, and consumer perceptions of personal well-being and security. In particular, past economic downturns have led to decreased discretionary spending, which adversely impacted our business. In addition, periods of decreased home purchases typically lead to decreased consumer spending on home products. These factors have affected, and may in the future affect, our various brands and channels differently. Adverse changes in factors affecting discretionary consumer spending have reduced and may in the future reduce consumer demand for our products, thus reducing our sales and harming our business and operating results.
6
Table of Contents
If we are unable to identify and analyze factors affecting our business, anticipate changing consumer preferences and buying trends, and manage our inventory commensurate with customer demand, our sales levels and operating results may decline.
Our success depends, in large part, upon our ability to identify and analyze factors affecting our business and to anticipate and respond in a timely manner to changing merchandise trends and customer demands. For example, in the specialty home products business, style and color trends are constantly evolving. Consumer preferences cannot be predicted with certainty and may change between selling seasons. Changes in customer preferences and buying trends may also affect our brands differently. We must be able to stay current with preferences and trends in our brands and address the customer tastes for each of our target customer demographics. We must also be able to identify and adjust the customer offerings in our brands to cater to customer demands. For example, a change in customer preferences for children’s room furnishings may not correlate to a similar change in buying trends for other home furnishings. If we misjudge either the market for our merchandise or our customers’ purchasing habits, our sales may decline significantly or may be delayed while we work to fill backorders. We may be required to mark down certain products to sell any excess inventory or to sell such inventory through our outlet stores or other liquidation channels at prices which are significantly lower than our retail prices, any of which would negatively impact our business and operating results.
In addition, we must manage our inventory effectively and commensurate with customer demand. Much of our inventory is sourced from vendors located outside of the United States. Thus, we usually must order merchandise, and enter into contracts for the purchase and manufacture of such merchandise, up to twelve months in advance of the applicable selling season and frequently before trends are known. The extended lead times for many of our purchases may make it difficult for us to respond rapidly to new or changing trends. Our vendors also may not have the capacity to handle our demands or may go out of business in times of economic crisis. In addition, the seasonal nature of the specialty home products business requires us to carry a significant amount of inventory prior to peak selling season. As a result, we are vulnerable to demand and pricing shifts and to misjudgments in the selection and timing of merchandise purchases. If we do not accurately predict our customers’ preferences and acceptance levels of our products, our inventory levels will not be appropriate, and our business and operating results may be negatively impacted.
We may be exposed to cybersecurity risks and costs associated with credit card fraud and identity theft that could cause us to incur unexpected expenses and loss of revenue.
A significant portion of our customer orders are placed through our e-commerce websites or through our customer care centers. In addition, a significant portion of sales made through our retail channel require the collection of certain customer data, such as credit card information. In order for our sales channels to function successfully, we and other parties involved in processing customer transactions must be able to transmit confidential information, including credit card information and other personal information on our customers, securely over public and private networks. Third parties may have or develop the technology or knowledge to breach, disable, disrupt or interfere with our systems or processes or those of our vendors. Although we take the security of our systems and the privacy of our customers’ confidential information seriously, and we believe we take reasonable steps to protect the security and confidentiality of the information we collect, we cannot guarantee that our security measures will effectively prevent others from obtaining unauthorized access to our information and our customers’ information. The techniques used to obtain unauthorized access to systems change frequently and are not often recognized until after they have been launched. Any person who circumvents our security measures could destroy or steal valuable information or disrupt our operations. Any security breach could cause consumers to lose confidence in the security of our information systems, including our e-commerce websites or stores, and choose not to purchase from us. Any security breach could also expose us to risks of data loss, litigation, regulatory investigations and other significant liabilities. Such a breach could also seriously disrupt, slow or hinder our operations and harm our reputation and customer relationships, any of which could harm our business.
In addition, states and the federal government are increasingly enacting laws and regulations to protect consumers against identity theft. As our business expands globally, we are subject to data privacy and other similar laws in various foreign jurisdictions. If we are the target of a cybersecurity attack resulting in
7
Table of Contents
unauthorized disclosure of our customer data, we may be required to undertake costly notification procedures. Compliance with these laws will likely increase the costs of doing business. If we fail to implement appropriate safeguards or to detect and provide prompt notice of unauthorized access as required by some of these laws, we could be subject to potential claims for damages and other remedies, which could be significantly in excess of our insurance coverage and could harm our business.
If we are unable to effectively manage our e-commerce business, our reputation and operating results may be harmed.
Our e-commerce channel has been our fastest growing business over the last several years and is a significant part of our sales and profits. The success of our e-commerce business depends, in part, on third parties and factors over which we have limited control. We must continually respond to changing consumer preferences and buying trends relating to e-commerce usage. Our success in e-commerce has been strengthened in part by our ability to understand the buying trends of visitors to our websites and to personalize the experience they have with us. We also utilize interest-based advertising to target internet users whose behavior indicates they might be interested in our products. Current or future legislation may reduce or restrict our ability to use these certain techniques, which could reduce the effectiveness of our marketing efforts.
We are also vulnerable to certain additional risks and uncertainties associated with our e-commerce websites, including: changes in required technology interfaces; website downtime and other technical failures; internet connectivity issues; costs and technical issues as we upgrade our website software; computer viruses; changes in applicable federal and state regulations; security breaches; and consumer privacy concerns. In addition, we must keep up to date with competitive technology trends, including the use of new or improved technology, evolving creative user interfaces and other e-commerce marketing trends such as paid search, re-targeting, and the proliferation of mobile usage, among others, which may increase our costs and which may not succeed in increasing sales or attracting customers. Our failure to successfully respond to these risks and uncertainties might adversely affect the sales or margin in our e-commerce business, as well as damage our reputation and brands.
Our dependence on foreign vendors and our increased global operations subject us to a variety of risks and uncertainties that could impact our operations and financial results.
Approximately 64% of our merchandise purchases in fiscal 2014 were sourced from foreign venders in 51 countries, predominantly in Asia and Europe. Our dependence on foreign vendors means that we may be affected by changes in the value of the U.S. dollar relative to other foreign currencies. For example, any upward valuation in the Chinese yuan, the euro, or any other foreign currency against the U.S. dollar may result in higher costs to us for those goods. Although approximately 98% of our foreign purchases of merchandise are negotiated and paid for in U.S. dollars, declines in foreign currencies and currency exchange rates might negatively affect the profitability and business prospects of one or more of our foreign vendors. This, in turn, might cause such foreign vendors to demand higher prices for merchandise in their effort to offset any lost profits associated with any currency devaluation, delay merchandise shipments to us, or discontinue selling to us, any of which could ultimately reduce our sales or increase our costs. In addition, the rising cost of labor in the countries in which our foreign vendors operate has resulted in increases in our costs of doing business. Any further increases in the cost of living in such countries may result in additional increases in our costs or in our foreign vendors going out of business.
We, and our foreign vendors, are also subject to other risks and uncertainties associated with changing economic and political conditions outside of the United States. These risks and uncertainties include import duties and quotas, compliance with anti-dumping regulations, work stoppages, economic uncertainties and adverse economic conditions (including inflation and recession), foreign government regulations, employment matters, wars and fears of war, political unrest, natural disasters, regulations to address climate change and other trade restrictions. We cannot predict whether any of the countries from which our raw materials or products are sourced, or in which our products are currently manufactured or may be manufactured in the future, will be subject to trade restrictions imposed by the U.S. or foreign governments or the likelihood, type or effect of any such restrictions. Any event causing a disruption or delay of imports from foreign vendors, including labor disputes resulting in work disruption
8
Table of Contents
(such as the disruptions at the west coast ports in early 2015), the imposition of additional import restrictions, restrictions on the transfer of funds and/or increased tariffs or quotas, or both, could increase the cost, reduce the supply of merchandise available to us, or result in excess inventory if merchandise is received after the planned or appropriate selling season, all of which could adversely affect our business, financial condition and operating results. Furthermore, some or all of our foreign vendors’ operations may be adversely affected by political and financial instability resulting in the disruption of trade from exporting countries, restrictions on the transfer of funds and/or other trade disruptions. In addition, an economic downturn, or failure of foreign markets, may result in financial instabilities for our foreign vendors, which may cause our foreign vendors to decrease production, discontinue selling to us, or cease operations altogether. Our global operations in Asia, Australia and Europe could also be affected by changing economic and political conditions in foreign countries, either of which could have a negative effect on our business, financial condition and operating results.
Although we continue to improve our global compliance program, there remains a risk that one or more of our foreign vendors will not adhere to our global compliance standards, such as fair labor standards and the prohibition on child labor. Non-governmental organizations might attempt to create an unfavorable impression of our sourcing practices or the practices of some of our foreign vendors that could harm our image. If either of these events occurs, we could lose customer goodwill and favorable brand recognition, which could negatively affect our business and operating results.
We depend on foreign vendors and third party agents for timely and effective sourcing of our merchandise, and we may not be able to acquire products in sufficient quantities and at acceptable prices to meet our needs, which would impact our operations and financial results.
Our performance depends, in part, on our ability to purchase our merchandise in sufficient quantities at competitive prices. We purchase our merchandise from numerous foreign and domestic manufacturers and importers. We have no contractual assurances of continued supply, pricing or access to new products, and any vendor could change the terms upon which it sells to us, discontinue selling to us, or go out of business at any time. We may not be able to acquire desired merchandise in sufficient quantities on terms acceptable to us. Better than expected sales demand may also lead to customer backorders and lower in-stock positions of our merchandise, which could negatively affect our business and operating results. In addition, our vendors may have difficulty adjusting to our changing demands and growing business.
Any inability to acquire suitable merchandise on acceptable terms or the loss of one or more of our foreign vendors or third party agents could have a negative effect on our business and operating results because we would be missing products that we felt were important to our assortment, unless and until alternative supply arrangements are secured. We may not be able to develop relationships with new third party agents or vendors, and products from alternative sources, if any, may be of a lesser quality and/or more expensive than those we currently purchase.
In addition, we are subject to certain risks that could limit our vendors’ ability to provide us with quality merchandise on a timely basis and at prices that are commercially acceptable, including risks related to the availability of raw materials, labor disputes, work disruptions or stoppages, union organizing activities, vendor financial liquidity, inclement weather, natural disasters, general economic and political conditions and regulations to address climate change.
If our vendors fail to adhere to our quality control standards, we may delay a product launch or recall a product, which could damage our reputation and negatively affect our operations and financial results.
Our vendors might not adhere to our quality control standards, and we might not identify the deficiency before merchandise ships to our stores or customers. Our vendors’ failure to manufacture or import quality merchandise in a timely and effective manner could damage our reputation and brands, and could lead to an increase in customer litigation against us and an increase in our routine insurance and litigation costs. Further, any merchandise that we receive, even if it meets our quality standards, could become subject to a recall, which could damage our reputation and brands, and harm our business. Additionally, changes to the legislative or regulatory framework regarding product safety or quality may subject companies like ours to more product recalls and result
9
Table of Contents
in higher recall-related expenses. Any recalls or other safety issues could harm our brands’ images and negatively affect our business and operating results.
Our efforts to expand globally may not be successful and could negatively impact the value of our brands.
We are currently growing our business and increasing our global presence by opening new stores outside of the United States, expanding our franchise operations, and offering shipping globally through third party vendors. In fiscal 2013 we opened our first company-owned retail stores and launched e-commerce sites outside of North America as part of our overall global expansion strategy. While our global expansion to date has been a small part of our business, we plan to continue to increase the number of stores we open both directly and through our franchise arrangements. We have limited experience with global sales, understanding consumer preferences and anticipating buying trends in different countries, and marketing to customers overseas. Moreover, global awareness of our brands and our products may not be high. Consequently, we may not be able to successfully compete with established brands in these markets and our global sales may not result in the revenues we anticipate. Also, our products may not be accepted, either due to foreign legal requirements or due to different consumer tastes and trends. If our global growth initiatives are not successful, or if we or any of our third party vendors fail to comply with any applicable regulations or laws, the value of our brands may be harmed and our future opportunities for global growth may be negatively affected. Further, the administration of our global expansion may divert management attention and require more resources than we expect. In addition, we are exposed to foreign currency exchange rate risk with respect to our operations denominated in currencies other than the U.S. dollar. Our retail stores in Canada, Australia and the United Kingdom, and our operations throughout Asia and Europe expose us to market risk associated with foreign currency exchange rate fluctuations. Although we use instruments to hedge certain foreign currency risks, such hedges may not succeed in offsetting all of the impact of foreign currency rate volatility and generally only delay such impact on our business and financial results. Further, because we do not hedge against all of our foreign currency exposure our business will continue to be susceptible to foreign currency fluctuations. Our ultimate realized loss or gain with respect to currency fluctuations will generally depend on the size and type of the transactions that we enter into, the currency exchange rates associated with these exposures, changes in those rates and whether we have entered into foreign currency hedge contracts to offset these exposures. All of these factors could materially impact our results of operations, financial position and cash flows.
We have two franchise agreements with unaffiliated franchisees to operate stores in the Middle East and the Philippines. Under these agreements, our franchisees operate stores that sell goods purchased from us under our brand names. In fiscal 2014, we entered into a franchise agreement with an additional unaffiliated franchisee to operate stores and e-commerce websites in Mexico, beginning in 2015. We continue to seek out and identify new select franchise partnerships for select countries. The effect of these franchise arrangements on our business and results of operations is uncertain and will depend upon various factors, including the demand for our products in new global markets. In addition, certain aspects of our franchise arrangements are not directly within our control, such as the ability of each franchisee to meet its projections regarding store openings and sales. Moreover, while the agreements we have entered into may provide us with certain termination rights, to the extent that our franchisees do not operate their stores in a manner consistent with our requirements regarding our brand identities and customer experience standards, the value of our brands could be impaired. In addition, in connection with these franchise arrangements, we have and will continue to implement certain new processes that may subject us to additional regulations and laws, such as U.S. export regulations. Failure to comply with any applicable regulations or laws could have an adverse effect on our results of operations.
We have limited experience operating on a global basis and our failure to effectively manage the risks and challenges inherent in a global business could adversely affect our business, operating results and financial condition and growth prospects.
We operate several retail businesses, subsidiaries and branch offices throughout Asia, Australia and Europe, which includes managing overseas employees, and plan to continue expanding these overseas operations in the future. We have limited experience operating overseas subsidiaries and managing non-U.S. employees and, as a
10
Table of Contents
result, may encounter cultural challenges with local practices and customs that may result in harm to our reputation and the value of our brands. Our global presence exposes us to the laws and regulations of these jurisdictions, including those related to marketing, privacy, data protection, employment, and product safety and testing. We may be unable to keep current with government requirements as they change from time to time. Our failure to comply with such laws and regulations may harm our reputation, adversely affect our future opportunities for growth and expansion in these countries, and harm our business and operating results.
Moreover, our global operations subject us to a variety of risks and challenges, including:
| • | increased management, infrastructure and legal compliance costs, including the cost of real estate and labor in those markets; |
| • | increased financial accounting and reporting requirements and complexities; |
| • | increased operational complexities, including managing our inventory globally; |
| • | the diversion of management attention away from our core business; |
| • | general economic conditions, changes in diplomatic and trade relationships and political and social instability in each country or region; |
| • | economic uncertainty around the world; |
| • | compliance with foreign laws and regulations and the risks and costs of non-compliance with such laws and regulations; |
| • | compliance with U.S. laws and regulations for foreign operations; |
| • | dependence on certain third parties, including vendors and other service providers, with whom we do not have extensive experience; |
| • | fluctuations in foreign currency exchange rates and the related effect on our financial results, and the use of foreign exchange hedging programs to mitigate such risks; |
| • | growing cash balances in foreign jurisdictions which may be subject to repatriation restrictions; |
| • | reduced or varied protection for intellectual property rights in some countries and practical difficulties of enforcing such rights abroad; and |
| • | compliance with the laws of foreign taxing jurisdictions and the overlapping of different tax regimes. |
Any of these risks could adversely affect our global operations, reduce our revenues or increase our operating costs, which in turn could adversely affect our business, operating results, financial condition and growth prospects. Some of our vendors and our franchisees also have global operations and are subject to the risks described above. Even if we are able to successfully manage the risks of our global operations, our business may be adversely affected if our vendors and franchisees are not able to successfully manage these risks.
In addition, as we continue to expand our global operations, we are subject to certain U.S. laws, including the Foreign Corrupt Practices Act, in addition to the laws of the foreign countries in which we operate. We must ensure that our employees and third party agents comply with these laws. If any of our overseas operations, or our employees or third party agents, violates such laws, we could become subject to sanctions or other penalties that could negatively affect our reputation, business and operating results.
A number of factors that affect our ability to successfully open new stores or close existing stores are beyond our control, and these factors may harm our ability to expand or contract our retail operations and harm our ability to increase our sales and profits.
Approximately 50% of our net revenues are generated by our retail stores. Our ability to open additional stores or close existing stores successfully will depend upon a number of factors, including:
| • | general economic conditions; |
| • | our identification of, and the availability of, suitable store locations; |
| • | our success in negotiating new leases and amending or terminating existing leases on acceptable terms; |
| • | the success of other retail stores in and around our retail locations; |
| • | our ability to secure required governmental permits and approvals; |
| • | our hiring and training of skilled store operating personnel, especially management; |
| • | the availability of financing on acceptable terms, if at all; and |
| • | the financial stability of our landlords and potential landlords. |
11
Table of Contents
Many of these factors are beyond our control. For example, for the purpose of identifying suitable store locations, we rely, in part, on demographic surveys regarding the location of consumers in our target market segments. While we believe that the surveys and other relevant information are helpful indicators of suitable store locations, we recognize that these information sources cannot predict future consumer preferences and buying trends with complete accuracy. In addition, changes in demographics, in the types of merchandise that we sell and in the pricing of our products, may reduce the number of suitable store locations. Further, time frames for lease negotiations and store development vary from location to location and can be subject to unforeseen delays or unexpected cancellations. We may not be able to open new stores or, if opened, operate those stores profitably. Construction and other delays in store openings could have a negative impact on our business and operating results. Additionally, we may not be able to renegotiate the terms of our current leases or close our underperforming stores, either of which could negatively impact our operating results.
Our sales may be negatively impacted by increasing competition from companies with brands or products similar to ours.
The specialty e-commerce and retail businesses are highly competitive. We compete with other retailers that market lines of merchandise similar to ours. We compete with national, regional and local businesses that utilize a similar retail store strategy, as well as traditional furniture stores, department stores and specialty stores. The substantial sales growth in the e-commerce industry within the last decade has encouraged the entry of many new competitors, new business models, and an increase in competition from established companies. In addition, the decline in the global economic environment has led to increased competition from discount retailers selling similar products at reduced prices. The competitive challenges facing us include:
| • | anticipating and quickly responding to changing consumer demands or preferences better than our competitors; |
| • | maintaining favorable brand recognition and achieving customer perception of value; |
| • | effectively marketing and competitively pricing our products to consumers in several diverse market segments; |
| • | effectively managing and controlling our costs; |
| • | effectively managing increasingly competitive promotional activity; |
| • | developing new innovative shopping experiences, like mobile and tablet applications that effectively engage today’s digital customers; |
| • | developing innovative, high-quality products in colors and styles that appeal to consumers of varying age groups, tastes and regions, and in ways that favorably distinguish us from our competitors; and |
| • | effectively managing our supply chain and distribution strategies in order to provide our products to our consumers on a timely basis and minimize returns, replacements and damaged products. |
In light of the many competitive challenges facing us, we may not be able to compete successfully. Increased competition could reduce our sales and harm our operating results and business.
Our business and operating results may be harmed if we are unable to timely and effectively deliver merchandise to our stores and customers.
We continue to insource furniture delivery hubs in certain geographies and continue with the regionalization of our retail fulfillment capabilities. If we are unable to effectively manage our inventory levels and responsiveness of our supply chain, including predicting the appropriate levels and type of inventory to stock within each of our distribution centers, our business and operating results may be harmed. Further, we cannot control all of the various factors that might affect our e-commerce fulfillment rates and timely and effective merchandise delivery to our stores. We rely upon third party carriers for our merchandise shipments and reliable data regarding the timing of those shipments, including shipments to our customers and to and from our stores. In addition, we are heavily dependent upon two carriers for the delivery of our merchandise to our customers. Accordingly, we are subject to risks, including labor disputes (such as the disruptions at the west coast ports in early 2015), union organizing activity, inclement weather, natural disasters, the closure of such carriers’ offices or a reduction in operational hours due to an economic slowdown, possible acts of terrorism affecting such carriers’ ability to
12
Table of Contents
provide delivery services to meet our shipping needs, disruptions or increased fuel costs, and costs associated with any regulations to address climate change. Failure to deliver merchandise in a timely and effective manner could damage our reputation and brands. In addition, fuel costs have been volatile and airline and other transportation companies continue to struggle to operate profitably, which could lead to increased fulfillment expenses. Any rise in fulfillment expenses could negatively affect our business and operating results.
Our failure to successfully manage our order-taking and fulfillment operations could have a negative impact on our business and operating results.
Our e-commerce business depends, in part, on our ability to maintain efficient and uninterrupted order-taking and fulfillment operations in our customer care centers and on our e-commerce websites. Disruptions or slowdowns in these areas could result from disruptions in telephone or network services, power outages, inadequate system capacity, system hardware or software issues, computer viruses, security breaches, human error, changes in programming, union organizing activity, disruptions in our third party labor contracts, natural disasters or adverse weather conditions. Industries that are particularly seasonal, such as the home furnishings business, face a higher risk of harm from operational disruptions during peak sales seasons. These problems could result in a reduction in sales as well as increased selling, general and administrative expenses.
In addition, we face the risk that we cannot hire enough qualified employees to support our e-commerce operations, or that there will be a disruption in the workforce we hire from our third party providers, especially during our peak season. The need to operate with fewer employees could negatively impact our customer service levels and our operations.
Our facilities and systems, as well as those of our vendors, are vulnerable to natural disasters and other unexpected events, any of which could result in an interruption in our business and harm our operating results.
Our retail stores, corporate offices, distribution centers, infrastructure and e-commerce operations, as well as the operations of our vendors from which we receive goods and services, are vulnerable to damage from earthquakes, tornadoes, hurricanes, fires, floods or other volatile weather, power losses, telecommunications failures, hardware and software failures, computer viruses and similar events. If any of these events result in damage to our facilities or systems, or those of our vendors, we may experience interruptions in our business until the damage is repaired, resulting in the potential loss of customers and revenues. In addition, we may incur costs in repairing any damage beyond our applicable insurance coverage.
Our failure to successfully manage the costs and performance of our catalog mailings might have a negative impact on our business.
Catalog mailings are an important component of our business. Postal rate increases, such as the recent increases that went into effect in the U.S. in 2013 and 2014, affect the cost of our catalog mailings. We rely on discounts from the basic postal rate structure, which could be changed or discontinued at any time. Further, the U.S. Postal Service may raise rates in the future, which could negatively impact our business. The cost of paper, printing and catalog distribution also impacts our catalog business. We recently consolidated all of our catalog printing work with one printer. Our dependence on one vendor subjects us to various risks if the vendor fails to perform under our agreement. Paper costs have also fluctuated significantly in the past and may continue to fluctuate in the future. Also, consolidation within the paper industry has reduced the number of potential suppliers capable of meeting our paper requirements, and further consolidation could limit our ability in the future to obtain favorable terms including price, custom paper quality, paper quantity, and service. Future increases in postal rates, paper costs or printing costs could have a negative impact on our operating results to the extent that we are unable to offset such increases by raising prices, implementing more efficient printing, mailing, delivery and order fulfillment systems, or through the use of alternative direct-mail formats. In addition, if the performance of our catalogs declines, if we misjudge the correlation between our catalog circulation and net sales, or if our catalog strategy overall does not continue to be successful, our results of operations could be negatively impacted.
13
Table of Contents
We have historically experienced fluctuations in our customers’ response to our catalogs. Customer response to our catalogs is substantially dependent on merchandise assortment, merchandise availability and creative presentation, as well as the selection of customers to whom the catalogs are mailed, changes in mailing strategies, the size of our mailings, timing of delivery of our mailings, as well as the general retail sales environment and current domestic and global economic conditions. In addition, environmental organizations and other consumer advocacy groups may attempt to create an unfavorable impression of our paper use in catalogs and our distribution of catalogs generally, which may have a negative effect on our sales and our reputation. In addition, we depend upon external vendors to print and mail our catalogs. The failure to effectively produce or distribute our catalogs could affect the timing of catalog delivery. The timing of catalog delivery has been and can be affected by postal service delays and may be impacted in the future by changes in the services provided by the post office. Any delays in the timing of catalog delivery could cause customers to forego or defer purchases, negatively impacting our business and operating results.
Declines in our comparable brand revenues may harm our operating results and cause a decline in the market price of our common stock.
Various factors affect comparable brand revenues, including the number, size and location of stores we open, close, remodel or expand in any period, the overall economic and general retail sales environment, consumer preferences and buying trends, changes in sales mix among distribution channels, our ability to efficiently source and distribute products, changes in our merchandise mix, competition (including competitive promotional activity and discount retailers), current local and global economic conditions, the timing of our releases of new merchandise and promotional events, the success of marketing programs, the cannibalization of existing store sales by our new stores, changes in catalog circulation and in our e-commerce business and fluctuations in foreign exchange rates. Among other things, weather conditions have affected, and may continue to affect, comparable brand revenues by limiting our ability to deliver our products to our stores, altering consumer behavior, or requiring us to close certain stores temporarily and thus reducing store traffic. Even if stores are not closed, many customers may decide to avoid going to stores in bad weather. These factors have caused and may continue to cause our comparable brand revenue results to differ materially from prior periods and from earnings guidance we have provided. For example, the overall economic and general retail sales environment, as well as local and global economic conditions, has caused a significant decline in our comparable brand revenue results in the past.
Our comparable brand revenues have fluctuated significantly in the past on an annual, quarterly and monthly basis, and we expect that comparable brand revenues will continue to fluctuate in the future. In addition, past comparable brand revenues are not necessarily an indication of future results and comparable brand revenues may decrease in the future. Our ability to improve our comparable brand revenue results depends, in large part, on maintaining and improving our forecasting of customer demand and buying trends, selecting effective marketing techniques, effectively driving traffic to our stores, e-commerce websites and direct-mail catalogs through marketing and various promotional events, providing an appropriate mix of merchandise for our broad and diverse customer base and using effective pricing strategies. Any failure to meet the comparable brand revenue expectations of investors and securities analysts in one or more future periods could significantly reduce the market price of our common stock.
Our failure to successfully anticipate merchandise returns might have a negative impact on our business.
We record a reserve for merchandise returns based on historical return trends together with current product sales performance in each reporting period. If actual returns are greater than those projected and reserved for by management, additional sales returns might be recorded in the future. In addition, to the extent that returned merchandise is damaged, we often do not receive full retail value from the resale or liquidation of the merchandise. Further, the introduction of new merchandise, changes in merchandise mix, changes in consumer confidence, or other competitive and general economic conditions may cause actual returns to differ from merchandise return reserves. Any significant increase in merchandise returns that exceeds our reserves could harm our business and operating results.
14
Table of Contents
If we are unable to successfully manage the complexities associated with a multi-channel and multi-brand business, we may suffer declines in our existing business and our ability to attract new business.
With the expansion of our e-commerce business, the development of new brands, acquired brands, and brand extensions, our overall business has become substantially more complex. The changes in our business have forced us to develop new expertise and face new challenges, risks and uncertainties. For example, we face the risk that our e-commerce business, including our catalog circulation, might cannibalize a significant portion of our retail sales. While we recognize that our e-commerce sales cannot be entirely incremental to sales through our retail channel, we seek to attract as many new customers as possible to our e-commerce websites. We continually analyze the business results of our channels and the relationships among the channels in an effort to find opportunities to build incremental sales.
If we are unable to introduce new brands and brand extensions successfully, or to reposition or close existing brands, our business and operating results may be negatively impacted.
We have in the past and may in the future introduce new brands and brand extensions, reposition brands, close existing brands, or acquire new brands, especially as we continue to expand globally. Our newest brands and brand extensions — Williams-Sonoma Home, PBteen and Mark and Graham, and any other new brands, as well as our acquired brand, Rejuvenation, or our expansion into new lines of business, including commercial furniture, may not grow as we project and plan for. The work involved with integrating new brands into our existing systems and operations could be time consuming, require significant amounts of management time and result in the diversion of substantial operational resources. Further, if we devote time and resources to new brands, acquired brands, brand extensions, brand repositioning, or new lines of business and those businesses are not as successful as we planned, then we risk damaging our overall business results or incurring impairment charges to write off any existing goodwill associated with previously acquired brands. Alternatively, if our new brands, acquired brands, brand extensions, repositioned brands or new lines of business prove to be very successful, we risk hurting our other existing brands through the potential migration of existing brand customers to the new businesses. In addition, we may not be able to introduce new brands and brand extensions, integrate newly acquired brands, reposition existing brands, develop new lines of business or expand our brands globally, in a manner that improves our overall business and operating results and may therefore be forced to close the brands or new lines of business, which may damage our reputation and negatively impact our operating results.
Fluctuations in our tax obligations and effective tax rate may result in volatility of our operating results.
We are subject to income taxes in many U.S. and certain foreign jurisdictions. Our provision for income taxes is subject to volatility and could be adversely impacted by a number of factors that require significant judgment and estimation. Although we believe our estimates are reasonable, actual results may materially differ from our estimates and adversely affect our financial condition or operating results. We record tax expense based on our estimates of future payments, which include reserves for estimates of probable settlements of foreign and domestic tax examinations. At any one time, many tax years are subject to audit by various taxing jurisdictions. The results of these audits and negotiations with taxing authorities may affect the ultimate settlement of these issues. As a result, we expect that throughout the year there could be ongoing variability in our quarterly tax rates as taxable events occur and exposures are evaluated.
In addition, our effective tax rate in a given financial statement period may be materially impacted by changes in the mix and level of earnings or losses in countries with differing statutory tax rates or by changes to existing laws or regulations.
Our inability to obtain commercial insurance at acceptable rates or our failure to adequately reserve for self-insured exposures might increase our expenses and have a negative impact on our business.
We believe that commercial insurance coverage is prudent in certain areas of our business for risk management. Insurance costs may increase substantially in the future and may be affected by natural catastrophes, fear of terrorism, financial irregularities, cybersecurity breaches and other fraud at publicly-traded companies,
15
Table of Contents
intervention by the government and a decrease in the number of insurance carriers. In addition, the carriers with which we hold our policies may go out of business or be otherwise unable to fulfill their contractual obligations, or may disagree with our interpretation of the coverage or the amounts owed. In addition, for certain types or levels of risk, such as risks associated with natural disasters or terrorist attacks, we may determine that we cannot obtain commercial insurance at acceptable rates, if at all. Therefore, we may choose to forego or limit our purchase of relevant commercial insurance, choosing instead to self-insure one or more types or levels of risks. We are primarily self-insured for workers’ compensation, employment practices liability, employee health benefits, and product and general liability claims, among others. If we suffer a substantial loss that is not covered by commercial insurance or our self-insurance reserves, the loss and related expenses could harm our business and operating results. In addition, exposures exist for which no insurance may be available and for which we have not reserved.
Our inability or failure to protect our intellectual property would have a negative impact on our brands, reputation and operating results.
We may not be able to adequately protect our intellectual property in the U.S. or in foreign jurisdictions, particularly as we continue to expand globally. Our trademarks, service marks, copyrights, trade dress rights, trade secrets, domain names and other intellectual property are valuable assets that are critical to our success. The unauthorized reproduction, theft or other misappropriation of our intellectual property could diminish the value of our brands or reputation and cause a decline in our sales. Protection of our intellectual property and maintenance of distinct branding are particularly important as they distinguish our products and services from our competitors. In addition, the costs of defending our intellectual property may adversely affect our operating results.
We may be subject to legal proceedings that could be time consuming, result in costly litigation, require significant amounts of management time and result in the diversion of significant operational resources.
We are involved in lawsuits, claims and proceedings incident to the ordinary course of our business. Litigation is inherently unpredictable. Any claims against us, whether meritorious or not, could be time consuming, result in costly litigation, require significant amounts of management time and result in the diversion of significant operational resources. There has been a rise in the number of lawsuits against companies like us that gather information in order to market to consumers online or through the mail and, along with other retailers, we have been named in lawsuits for gathering zip code information from our customers. We believe that we have meritorious defenses against these actions, and we will continue to vigorously defend against them. There have also been a growing number of e-commerce-related patent infringement lawsuits and employment-related lawsuits in recent years. From time to time, we have been subject to these types of lawsuits. The cost of defending against all these types of claims against us or the ultimate resolution of such claims, whether by settlement or adverse court decision, may harm our business and operating results. In addition, the increasingly regulated business environment may result in a greater number of enforcement actions and private litigation. This could subject us to increased exposure to stockholder lawsuits.
Our operating results may be harmed by unsuccessful management of our employment, occupancy and other operating costs, and the operation and growth of our business may be harmed if we are unable to attract qualified personnel.
To be successful, we need to manage our operating costs and continue to look for opportunities to reduce costs. We recognize that we may need to increase the number of our employees, especially during holiday selling seasons, and incur other expenses to support new brands and brand extensions and the growth of our existing brands, including the opening of new stores. Alternatively, if we are unable to make substantial adjustments to our cost structure during times of uncertainty, such as an economic downturn, we may incur unnecessary expenses or we may have inadequate resources to properly run our business, and our business and operating results may be negatively impacted. From time to time, we may also experience union organizing activity in currently non-union facilities, including in our stores. Union organizing activity may result in work slowdowns
16
Table of Contents
or stoppages and higher labor costs. In addition, there appears to be a growing number of wage-and-hour lawsuits and other employment-related lawsuits against retail companies, especially in California. State, federal and global laws and regulations regarding employment change frequently and the ultimate cost of compliance cannot be precisely estimated. Further, there have been and may continue to be increases in minimum wage and health care requirements. Any changes in regulations, the imposition of additional regulations, or the enactment of any new or more stringent legislation that impacts employment and labor, trade, or health care, could have an adverse impact on our financial condition and results of operations.
We contract with various agencies to provide us with qualified personnel for our workforce. Any negative publicity regarding these agencies, such as in connection with immigration issues or employment practices, could damage our reputation, disrupt our ability to obtain needed labor or result in financial harm to our business, including the potential loss of business-related financial incentives in the jurisdictions where we operate. Although we strive to secure long-term contracts on favorable terms with our service providers and other vendors, we may not be able to avoid unexpected operating cost increases in the future, such as those associated with minimum wage increases or enhanced health care requirements. Further, we incur substantial costs to warehouse and distribute our inventory. In fiscal 2014, we continued to insource furniture delivery hubs in certain geographies and continued with the regionalization of our retail fulfillment capabilities. Significant increases in our inventory levels may result in increased warehousing and distribution costs, such as costs related to additional distribution centers, which we may not be able to lease on acceptable terms, if at all. Such increases in inventory levels may also lead to increases in costs associated with inventory that is lost, damaged or aged. Higher than expected costs, particularly if coupled with lower than expected sales, would negatively impact our business and operating results. In addition, in times of economic uncertainty, these long-term contracts may make it difficult to quickly reduce our fixed operating costs, which could negatively impact our business and operating results.
We are undertaking certain systems changes that might disrupt our business operations.
Our success depends, in part, on our ability to source, sell and distribute merchandise efficiently through appropriate systems and procedures. We are in the process of substantially modifying our information technology systems, which involves updating or replacing legacy systems with successor systems over the course of several years. There are inherent risks associated with replacing our core systems, including supply chain and merchandising systems disruptions, that could affect our ability to get the correct products into the appropriate stores and delivered to customers. We may not successfully launch these new systems, or the launch of such systems may result in disruptions to our business operations. In addition, changes to any of our software implementation strategies could result in the impairment of software-related assets. We are also subject to the risks associated with the ability of our vendors to provide information technology solutions to meet our needs. Any disruptions could negatively impact our business and operating results.
We outsource certain aspects of our business to third party vendors and are in the process of insourcing certain business functions from third party vendors, both of which subject us to risks, including disruptions in our business and increased costs.
We outsource certain aspects of our business to third party vendors that subject us to risks of disruptions in our business as well as increased costs. For example, we utilize outside vendors for such things as payroll processing, email marketing and various distribution center services. Accordingly, we are subject to the risks associated with their ability to successfully provide the necessary services to meet our needs. If our vendors are unable to adequately protect our data and information is lost, our ability to deliver our services is interrupted, or our vendors’ fees are higher than expected, then our business and operating results may be negatively impacted.
In addition, we are in the process of insourcing certain aspects of our business, including the management of certain furniture manufacturing and delivery, and the management of our global vendors, each of which were previously outsourced to third party providers. We may also need to continue to insource other aspects of our business in the future in order to control our costs and to stay competitive. This may cause disruptions in our business and result in increased cost to us. In addition, if we are unable to perform these functions better than, or at least as well as, our third party providers, our business may be harmed.
17
Table of Contents
If our operating and financial performance in any given period does not meet the guidance that we have provided to the public or the expectations of our investors and analysts, our stock price may decline.
We provide public guidance on our expected operating and financial results for future periods. Although we believe that this guidance provides investors and analysts with a better understanding of management’s expectations for the future and is useful to our stockholders and potential stockholders, such guidance is comprised of forward-looking statements subject to the risks and uncertainties described in this report and in our other public filings and public statements. Our actual results may not always be in line with or exceed the guidance we have provided or the expectations of our investors and analysts, especially in times of economic uncertainty. In the past, when we have reduced our previously provided guidance, the market price of our common stock has declined. If, in the future, our operating or financial results for a particular period do not meet our guidance or the expectations of our investors and analysts or if we reduce our guidance for future periods, the market price of our common stock may decline.
A variety of factors, including seasonality and the economic environment, may cause our quarterly operating results to fluctuate, leading to volatility in our stock price.
Our quarterly results have fluctuated in the past and may fluctuate in the future, depending upon a variety of factors, including changes in economic conditions, shifts in the timing of holiday selling seasons, including Valentine’s Day, Easter, Halloween, Thanksgiving and Christmas, as well as timing shifts due to 53-week fiscal years, which occur approximately every five years. Historically, a significant portion of our net revenues and net earnings have typically been realized during the period from October through January each year, our peak selling season. In anticipation of increased holiday sales activity, we incur certain significant incremental expenses prior to and during peak selling seasons, including fixed catalog production and mailing costs and the costs associated with hiring a substantial number of temporary employees to supplement our existing workforce.
We may require funding from external sources, which may cost more than we expect, or not be available at the levels we require and, as a consequence, our expenses and operating results could be negatively affected.
We regularly review and evaluate our liquidity and capital needs. Although we have a growing balance of cash that is held offshore, we currently believe that our available cash, cash equivalents and cash flow from operations will be sufficient to finance our operations and expected capital requirements for at least the next 12 months. However, we might experience periods during which we encounter additional cash needs and we might need additional external funding to support our operations. Although we were able to amend and increase our line of credit facility during fiscal 2014 on acceptable terms, in the event we require additional liquidity from our lenders, such funds may not be available to us or may not be available to us on acceptable terms. For example, in the event we were to breach any of our financial covenants, our banks would not be required to provide us with additional funding, or they may require us to renegotiate our existing credit facility on less favorable terms. In addition, we may not be able to renew our letters of credit that we use to help pay our suppliers on terms that are acceptable to us, or at all, as the availability of letter of credit facilities may become limited. Further, the providers of such credit may reallocate the available credit to other borrowers. If we are unable to access credit at the levels we require, or the cost of credit is greater than expected, it could adversely affect our operating results.
Disruptions in the financial markets may adversely affect our liquidity and capital resources and our business.
Global financial markets can experience extreme volatility, disruption and credit contraction, which adversely affect global economic conditions. Turmoil in the financial and credit markets or other changes in economic conditions could adversely affect sources of liquidity available to us or our costs of capital. We have access to capital through our revolving line of credit facility. Each financial institution, which is part of the syndicate for our revolving line of credit facility, is responsible for providing a portion of the loans to be made under the facility. If any lender, or group of lenders, with a significant portion of the commitments in our revolving line of credit facility fails to satisfy its obligations to extend credit under the facility and we are unable to find a replacement for such lender or group of lenders on a timely basis, if at all, our liquidity and our business may be materially adversely affected.
18
Table of Contents
If we are unable to pay quarterly dividends or repurchase our stock at intended levels, our reputation and stock price may be harmed.
We currently have a $750,000,000 stock repurchase program, of which we have $287,000,000 remaining. In addition, in March 2015, we announced that our Board of Directors had authorized an increase in our quarterly cash dividend from $0.33 to $0.35 per common share for an annual cash dividend of $1.40 per share. The stock repurchase program and dividend may require the use of a significant portion of our cash earnings. As a result, we may not retain a sufficient amount of cash to fund our operations or finance future growth opportunities, new product development initiatives and unanticipated capital expenditures, which could adversely affect our financial performance. Further, our Board of Directors may, at its discretion, decrease the intended level of dividends or entirely discontinue the payment of dividends at any time. The stock repurchase program does not have an expiration date and may be limited at any time. Our ability to pay dividends and repurchase stock will depend on our ability to generate sufficient cash flows from operations in the future. This ability may be subject to certain economic, financial, competitive and other factors that are beyond our control. Any failure to pay dividends or repurchase stock after we have announced our intention to do so may negatively impact our reputation and investor confidence in us, and may negatively impact our stock price.
If we fail to maintain proper and effective internal controls, our ability to produce accurate and timely financial statements could be impaired and our investors’ views of us could be harmed.
We have evaluated and tested our internal controls in order to allow management to report on, and our registered independent public accounting firm to attest to, the effectiveness of our internal controls, as required by Section 404 of the Sarbanes-Oxley Act of 2002. If we are not able to continue to meet the requirements of Section 404 in a timely manner, or with adequate compliance, we would be required to disclose material weaknesses if they develop or are uncovered and we may be subject to sanctions or investigation by regulatory authorities, such as the Securities and Exchange Commission or the New York Stock Exchange. In addition, our internal controls may not prevent or detect all errors and fraud on a timely basis, if at all. A control system, no matter how well designed and operated, is based upon certain assumptions and can provide only reasonable assurance that the objectives of the control system will be met. If any of the above were to occur, our business and the perception of us in the financial markets could be negatively impacted.
Changes to accounting rules or regulations may adversely affect our operating results.
Changes to existing accounting rules or regulations may impact our future operating results. A change in accounting rules or regulations may even affect our reporting of transactions completed before the change is effective. The introduction of new accounting rules or regulations and varying interpretations of existing accounting rules or regulations have occurred and may occur in the future. Future changes to accounting rules or regulations, or the questioning of current accounting practices, may adversely affect our operating results.
Changes to estimates related to our cash flow projections may cause us to incur impairment charges related to our retail store locations and other property and equipment, including information technology systems, as well as goodwill.
We make estimates and projections in connection with impairment analyses for our retail store locations and other property and equipment, including information technology systems, as well as goodwill. These analyses require us to make a number of estimates and projections of future results. If these estimates or projections change or prove incorrect, we may be, and have been, required to record impairment charges on certain store locations and other property and equipment, including information technology systems. These impairment charges have been significant in the past and may be significant in the future and, as a result of these charges, our operating results have been and may, in the future, be adversely affected.
If we fail to attract and retain key personnel, our business and operating results may be harmed.
Our future success depends to a significant degree on the skills, experience and efforts of key personnel in our senior management, whose vision for our company, knowledge of our business and expertise would be difficult
19
Table of Contents
to replace. If any one of our key employees leaves, is seriously injured or unable to work, or fails to perform and we are unable to find a qualified replacement, we may be unable to execute our business strategy. We may not be successful in recruiting, retaining and motivating skilled personnel domestically or globally who have the requisite experience to achieve our global business goals.
In addition, our main offices are located in the San Francisco Bay Area, where competition for personnel with retail and technology skills can be intense. If we fail to identify, attract, retain and motivate these skilled personnel, our business may be harmed. Further, in the event we need to hire additional personnel, we may experience difficulties in attracting and successfully hiring such individuals due to competition for highly skilled personnel, as well as the significantly higher cost of living expenses in our market.
ITEM 1B. UNRESOLVED STAFF COMMENTS
None.
We lease store locations, distribution centers, corporate facilities and customer care centers for our U.S. and foreign operations for original terms ranging generally from 3 to 22 years. Certain leases contain renewal options for periods of up to 20 years.
For our store locations, our gross leased store space, as of February 1, 2015, totaled approximately 5,965,000 square feet for 601 stores compared to approximately 5,838,000 square feet for 585 stores as of February 2, 2014.
Leased Properties
The following table summarizes the location and size of our leased distribution centers, corporate facilities and customer care centers occupied as of February 1, 2015:
| Location | Occupied Square Footage (Approximate) | |||
| Distribution Centers |
||||
| Olive Branch, Mississippi |
2,105,000 | |||
| South Brunswick, New Jersey |
2,103,000 | |||
| City of Industry, California |
1,180,000 | |||
| Arlington, Texas |
822,000 | |||
| Memphis, Tennessee1 |
571,000 | |||
| Claremont, North Carolina |
412,000 | |||
| Other |
453,000 | |||
| Corporate Facilities |
||||
| Brisbane, California |
194,000 | |||
| Brooklyn, New York |
132,000 | |||
| Portland, Oregon |
132,000 | |||
| San Francisco, California |
29,000 | |||
| Customer Care Centers |
||||
| Las Vegas, Nevada |
36,000 | |||
| Oklahoma City, Oklahoma |
36,000 | |||
| Other |
24,000 | |||
| 1 | See Note F to our Consolidated Financial Statements for more information. |
In addition to the above contracts, we enter into other agreements for offsite storage needs for our distribution centers and our retail store locations. As of February 1, 2015, the total leased space relating to these properties was not material to us and is not included in the occupied square footage reported above.
20
Table of Contents
Owned Properties
The following table summarizes the location and size of our owned facilities occupied as of February 1, 2015:
| Location | Occupied Square Footage (Approximate) | |||
| San Francisco, California |
412,000 | |||
| Rocklin, California |
42,000 | |||
| Other |
17,000 | |||
We believe that all of our facilities are adequate for our current needs and that suitable additional or substitute space will be available in the future to replace our existing facilities, or to accommodate the expansion of our operations, if necessary.
We are involved in lawsuits, claims and proceedings incident to the ordinary course of our business. These disputes, which are not currently material, are increasing in number as our business expands and our company grows larger. We review the need for any loss contingency reserves and establish reserves when, in the opinion of management, it is probable that a matter would result in liability, and the amount of loss, if any, can be reasonably estimated. In view of the inherent difficulty of predicting the outcome of these matters, it may not be possible to determine whether any loss is probable or to reasonably estimate the amount of the loss until the case is close to resolution, in which case no reserve is established until that time. Any claims against us, whether meritorious or not, could be time consuming, result in costly litigation, require significant amounts of management time and result in the diversion of significant operational resources. The results of these lawsuits, claims and proceedings cannot be predicted with certainty. However, we believe that the ultimate resolution of these current matters will not have a material adverse effect on our consolidated financial statements taken as a whole.
ITEM 4. MINE SAFETY DISCLOSURES
Not applicable.
21
Table of Contents
| ITEM 5. | MARKET FOR REGISTRANT’S COMMON EQUITY, RELATED STOCKHOLDER MATTERS AND ISSUER PURCHASES OF EQUITY SECURITIES |
MARKET INFORMATION
Our common stock is traded on the New York Stock Exchange, or the NYSE, under the symbol WSM. The following table sets forth the high and low selling prices of our common stock on the NYSE for the periods indicated:
| Fiscal 2014 | High | Low | ||||||||
| 4th Quarter |
$ | 80.99 | $ | 64.17 | ||||||
| 3rd Quarter |
$ | 75.69 | $ | 62.35 | ||||||
| 2nd Quarter |
$ | 73.45 | $ | 60.47 | ||||||
| 1st Quarter |
$ | 68.05 | $ | 52.46 | ||||||
| Fiscal 2013 | High | Low | ||||||||
| 4th Quarter |
$ | 60.07 | $ | 51.91 | ||||||
| 3rd Quarter |
$ | 61.56 | $ | 51.70 | ||||||
| 2nd Quarter |
$ | 60.72 | $ | 51.98 | ||||||
| 1st Quarter |
$ | 54.57 | $ | 43.63 | ||||||
The closing price of our common stock on the NYSE on March 30, 2015 was $79.11.
STOCKHOLDERS
The number of stockholders of record of our common stock as of March 30, 2015 was 360. This number excludes stockholders whose stock is held in nominee or street name by brokers.
22
Table of Contents
PERFORMANCE GRAPH
This graph compares the cumulative total stockholder return for our common stock with those of the NYSE Composite Index and the S&P Retailing Index, our peer group index. The cumulative total return listed below assumed an initial investment of $100 and reinvestment of dividends. The graph shows historical stock price performance, including reinvestment of dividends, and is not necessarily indicative of future performance.
COMPARISON OF FIVE YEAR CUMULATIVE TOTAL RETURN*
Among Williams-Sonoma, Inc., the NYSE Composite Index,
and the S&P Retailing Index
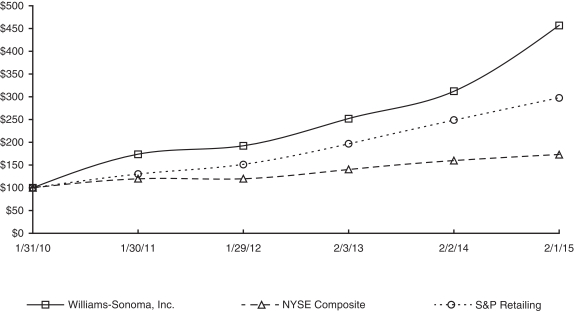
| 1/31/10 | 1/30/11 | 1/29/12 | 2/3/13 | 2/2/14 | 2/1/15 | |||||||
| Williams-Sonoma, Inc. |
100.00 | 173.67 | 192.26 | 251.95 | 312.16 | 456.75 | ||||||
| NYSE Composite Index |
100.00 | 119.83 | 119.92 | 140.23 | 159.80 | 173.01 | ||||||
| S&P Retailing Index |
100.00 | 130.27 | 151.31 | 196.75 | 248.60 | 297.50 |
* Notes:
| A. | The lines represent monthly index levels derived from compounded daily returns that include all dividends. |
| B. | The indices are re-weighted daily, using the market capitalization on the previous trading day. |
| C. | If the monthly interval, based on the fiscal year-end, is not a trading day, the preceding trading day is used. |
23
Table of Contents
DIVIDENDS
In fiscal 2014, fiscal 2013 and fiscal 2012, total cash dividends declared were approximately $125,378,000, or $1.32 per common share, $121,688,000, or $1.24 per common share, and $88,452,000, or $0.88 per common share, respectively. In March 2015, we announced that our Board of Directors had authorized a 6% increase in our quarterly cash dividend, from $0.33 to $0.35 per common share, subject to capital availability. Our quarterly cash dividend may be limited or terminated at any time.
STOCK REPURCHASE PROGRAMS
During fiscal 2014, we repurchased 3,331,557 shares of our common stock at an average cost of $67.35 per share and a total cost of $224,377,000. During fiscal 2013, we repurchased 4,344,962 shares of our common stock at an average cost of $55.07 per share and a total cost of $239,274,000. During fiscal 2012, we repurchased 3,962,034 shares of our common stock at an average cost of $39.14 per share and a total cost of $155,080,000.
The following table summarizes our repurchases of shares of our common stock during the fourth quarter of fiscal 2014 under our current $750,000,000 stock repurchase program:
| Fiscal period | |
Total Number of Shares Purchased |
|
|
Average Price Paid Per Share |
|
|
Total Number of Shares Purchased as Part of a Publicly Announced Program |
|
|
Maximum Dollar Value of Shares That May Yet Be Purchased Under the Program |
| ||||
| November 3, 2014 – November 30, 2014 |
181,129 | $ | 71.79 | 181,129 | $ | 302,984,000 | ||||||||||
| December 1, 2014 – December 28, 2014 |
106,168 | $ | 73.38 | 106,168 | $ | 295,193,000 | ||||||||||
| December 29, 2014 – February 1, 2015 |
108,507 | $ | 76.94 | 108,507 | $ | 286,845,000 | ||||||||||
| Total |
395,804 | $ | 73.63 | 395,804 | $ | 286,845,000 |
Stock repurchases under this program may be made through open market and privately negotiated transactions at times and in such amounts as management deems appropriate. The timing and actual number of shares repurchased will depend on a variety of factors including price, corporate and regulatory requirements, capital availability and other market conditions. This stock repurchase program does not have an expiration date and may be limited or terminated at any time without prior notice.
24
Table of Contents
ITEM 6. SELECTED FINANCIAL DATA
Five-Year Selected Financial Data
| In thousands, except percentages, per share amounts and retail stores data |
Fiscal 2014 (52 Weeks) |
Fiscal 2013 (52 Weeks) |
Fiscal 2012 (53 Weeks) |
Fiscal 2011 (52 Weeks) |
Fiscal 2010 (52 Weeks) |
|||||||||||||||
| Results of Operations |
||||||||||||||||||||
| Net revenues |
$ | 4,698,719 | $ | 4,387,889 | $ | 4,042,870 | $ | 3,720,895 | $ | 3,504,158 | ||||||||||
| Net revenue growth |
7.1% | 8.5% | 8.7% | 6.2% | 12.9% | |||||||||||||||
| Comparable brand revenue growth1 |
7.1% | 8.8% | 6.1% | 7.3% | 13.9% | |||||||||||||||
| Gross profit |
$ | 1,800,504 | $ | 1,704,216 | $ | 1,592,476 | $ | 1,459,856 | $ | 1,373,859 | ||||||||||
| Gross margin |
38.3% | 38.8% | 39.4% | 39.2% | 39.2% | |||||||||||||||
| Operating income |
$ | 502,265 | $ | 452,098 | $ | 409,163 | $ | 381,732 | $ | 323,414 | ||||||||||
| Operating margin2 |
10.7% | 10.3% | 10.1% | 10.3% | 9.2% | |||||||||||||||
| Net earnings |
$ | 308,854 | $ | 278,902 | $ | 256,730 | $ | 236,931 | $ | 200,227 | ||||||||||
| Basic earnings per share |
$ | 3.30 | $ | 2.89 | $ | 2.59 | $ | 2.27 | $ | 1.87 | ||||||||||
| Diluted earnings per share |
$ | 3.24 | $ | 2.82 | $ | 2.54 | $ | 2.22 | $ | 1.83 | ||||||||||
| Weighted average basic shares outstanding during the period |
93,634 | 96,669 | 99,266 | 104,352 | 106,956 | |||||||||||||||
| Weighted average diluted shares outstanding during the period |
95,200 | 98,765 | 101,051 | 106,582 | 109,522 | |||||||||||||||
| Financial Position |
||||||||||||||||||||
| Working capital |
$ | 515,975 | $ | 558,007 | $ | 659,645 | $ | 704,567 | $ | 735,878 | ||||||||||
| Total assets |
$ | 2,330,277 | $ | 2,336,734 | $ | 2,187,679 | $ | 2,060,838 | $ | 2,131,762 | ||||||||||
| Return on assets |
13.2% | 12.3% | 12.0% | 11.3% | 9.5% | |||||||||||||||
| Net cash provided by operating activities |
$ | 461,697 | $ | 453,769 | $ | 364,127 | $ | 291,334 | $ | 355,989 | ||||||||||
| Capital expenditures |
$ | 204,800 | $ | 193,953 | $ | 205,404 | $ | 130,353 | $ | 61,906 | ||||||||||
| Long-term debt and other long-term obligations |
$ | 62,698 | $ | 61,780 | $ | 50,216 | $ | 52,015 | $ | 59,048 | ||||||||||
| Stockholders’ equity |
$ | 1,224,706 | $ | 1,256,002 | $ | 1,309,138 | $ | 1,255,262 | $ | 1,258,863 | ||||||||||
| Stockholders’ equity per share (book value) |
$ | 13.33 | $ | 13.35 | $ | 13.39 | $ | 12.50 | $ | 12.00 | ||||||||||
| Return on equity |
24.9% | 21.7% | 20.0% | 18.8% | 16.2% | |||||||||||||||
| Annual dividends declared per share |
$ | 1.32 | $ | 1.24 | $ | 0.88 | $ | 0.73 | $ | 0.58 | ||||||||||
| E-commerce Net Revenues |
||||||||||||||||||||
| E-commerce net revenue growth |
12.1% | 13.1% | 14.5% | 12.4% | 18.6% | |||||||||||||||
| E-commerce net revenues as a percent of net revenues |
50.5% | 48.2% | 46.2% | 43.9% | 41.5% | |||||||||||||||
| Retail Net Revenues |
||||||||||||||||||||
| Retail net revenue growth |
2.4% | 4.6% | 4.1% | 1.8% | 9.2% | |||||||||||||||
| Retail net revenues as a percent of net revenues |
49.5% | 51.8% | 53.8% | 56.1% | 58.5% | |||||||||||||||
| Number of stores at year-end |
601 | 585 | 581 | 576 | 592 | |||||||||||||||
| Store selling square footage at year-end |
3,684,000 | 3,590,000 | 3,548,000 | 3,535,000 | 3,609,000 | |||||||||||||||
| Store leased square footage at year-end |
5,965,000 | 5,838,000 | 5,778,000 | 5,743,000 | 5,831,000 | |||||||||||||||
| 1 | Comparable brand revenue is calculated on a 52-week to 52-week basis, with the exception of fiscal 2012 which was calculated on a 53-week to 53-week basis. See definition of comparable brand revenue within “Management’s Discussion and Analysis of Financial Condition and Results of Operations.” |
| 2 | Operating margin is defined as operating income as a percent of net revenues. |
The information set forth above is not necessarily indicative of future operations and should be read in conjunction with “Management’s Discussion and Analysis of Financial Condition and Results of Operations” and the Consolidated Financial Statements and notes thereto in this Annual Report on Form 10-K.
25
Table of Contents
| ITEM 7. | MANAGEMENT’S DISCUSSION AND ANALYSIS OF FINANCIAL CONDITION AND RESULTS OF OPERATIONS |
The following discussion and analysis of our financial condition, results of operations, and liquidity and capital resources for the 52 weeks ended February 1, 2015 (“fiscal 2014”), the 52 weeks ended February 2, 2014 (“fiscal 2013”), and the 53 weeks ended February 3, 2013 (“fiscal 2012”) should be read in conjunction with our Consolidated Financial Statements and notes thereto. All explanations of changes in operational results are discussed in order of magnitude.
OVERVIEW
In fiscal 2014, our net revenues increased 7.1% to $4,698,719,000, compared to $4,387,889,000 in fiscal 2013, with comparable brand revenue growth of 7.1%. Diluted earnings per share increased to $3.24 in fiscal 2014 (including a $0.04 benefit from our share of the VISA/MasterCard antitrust litigation settlement), versus $2.82 in fiscal 2013 (including a $0.02 charge related to the retirement of one of our former brand presidents), and we returned $350,135,000 to our stockholders through stock repurchases and dividends.
E-commerce net revenues in fiscal 2014 increased by $255,672,000, or 12.1%, compared to fiscal 2013, with increases across all brands, led by West Elm, Pottery Barn and Williams-Sonoma. E-commerce net revenues generated more than 50% of our total company net revenues in fiscal 2014 versus 48% in fiscal 2013.
Retail net revenues in fiscal 2014 increased by $55,158,000, or 2.4%, compared to fiscal 2013, led by West Elm and Pottery Barn, partially offset by a decrease in Williams-Sonoma due to store closures at the end of fiscal 2013.
During fiscal 2014, we had net revenue growth in all of our brands and across channels. In Pottery Barn, our largest brand, comparable brand revenues increased 5.8% in fiscal 2014, on top of an increase of 10.4% in fiscal 2013. This growth was primarily driven by our upholstery and leather furniture collections. In the Williams-Sonoma brand, comparable brand revenues increased 3.8% in fiscal 2014 compared to fiscal 2013, with solid performance across our cookware, food, entertaining and tabletop product categories. In West Elm, comparable brand revenues grew 18.2% in fiscal 2014, on top of an increase of 17.4% in fiscal 2013. Growth in the brand was broad-based across all categories. In Pottery Barn Kids, comparable brand revenues increased 5.9% in fiscal 2014 compared to fiscal 2013, led by our nursery, furniture, seasonal and school gear collections. In PBteen, comparable brand revenues increased 5.7% in fiscal 2014, on top of an increase of 14.1% in fiscal 2013, driven by our textiles and furniture collections.
In fiscal 2014, we made progress against our long-term strategic growth initiatives, including strengthening our brands; laying the foundation for global expansion and new business development; investing in our supply chain to reduce cost and improve service; and investing in e-commerce, as well as the technologies and infrastructure underlying all of our initiatives.
As we look to fiscal 2015, we plan to invest in those areas where we see sustainable, long-term returns for our stockholders by making investments in: our e-commerce platform; our supply chain initiatives; new stores, particularly in the West Elm brand; and our longer-term growth initiatives, including our newer businesses and global expansion. Looking ahead, we see opportunities for continued growth and believe we are well positioned to deliver on all of our long-term strategic growth initiatives.
26
Table of Contents
Results of Operations
NET REVENUES
Net revenues consist of e-commerce net revenues and retail net revenues. E-commerce net revenues include sales of merchandise to customers through our e-commerce websites and our catalogs, as well as shipping fees. Retail net revenues include sales of merchandise to customers at our retail stores, as well as shipping fees on any products shipped to our customers’ homes. Shipping fees consist of revenue received from customers for delivery of merchandise to their homes. Revenues are presented net of sales returns and other discounts.
| In thousands | Fiscal 2014 (52 Weeks) |
% Total | Fiscal 2013 (52 Weeks) |
% Total | Fiscal 2012 (53 Weeks) |
% Total | ||||||||||||||||||
| E-commerce net revenues |
$ | 2,370,694 | 50.5% | $ | 2,115,022 | 48.2% | $ | 1,869,386 | 46.2% | |||||||||||||||
| Retail net revenues |
2,328,025 | 49.5% | 2,272,867 | 51.8% | 2,173,484 | 53.8% | ||||||||||||||||||
| Net revenues |
$ | 4,698,719 | 100.0% | $ | 4,387,889 | 100.0% | $ | 4,042,870 | 100.0% | |||||||||||||||
Net revenues in fiscal 2014 increased by $310,830,000, or 7.1%, compared to fiscal 2013, with comparable brand revenue growth of 7.1%. This increase was primarily driven by the West Elm and Pottery Barn brands.
Net revenues in fiscal 2013 increased by $345,019,000, or 8.5%, compared to fiscal 2012, with comparable brand revenue growth of 8.8%. This increase was primarily driven by the Pottery Barn, West Elm and Pottery Barn Kids brands, partially offset by the loss of the additional week of net revenues in fiscal 2012.
The following table summarizes our net revenues by brand for fiscal 2014, fiscal 2013 and fiscal 2012.
| In thousands | Fiscal 2014 (52 Weeks) |
Fiscal 2013 (52 Weeks) |
Fiscal 2012 (53 Weeks) |
|||||||||
| Pottery Barn |
$ | 2,022,331 | $ | 1,910,978 | $ | 1,752,997 | ||||||
| Williams-Sonoma |
994,651 | 978,002 | 980,709 | |||||||||
| West Elm |
669,074 | 531,305 | 430,099 | |||||||||
| Pottery Barn Kids |
624,594 | 597,628 | 557,516 | |||||||||
| PBteen |
260,617 | 246,449 | 220,081 | |||||||||
| Other |
127,452 | 123,527 | 101,468 | |||||||||
| Total |
$ | 4,698,719 | $ | 4,387,889 | $ | 4,042,870 | ||||||
Comparable Brand Revenue
Comparable brand revenue includes retail comparable store sales and e-commerce sales, as well as shipping fees, sales returns and other discounts associated with current period sales. Outlet comparable store net revenues are included in their respective brands. Comparable brand revenue excludes sales from certain operations until such time that we believe those sales are meaningful to evaluating the performance of the brand. Sales related to our international franchised stores have also been excluded as they are not operated by us.
Comparable stores are defined as permanent stores where gross square footage did not change by more than 20% in the previous 12 months and which have been open for at least 12 consecutive months without closure for seven or more consecutive days.
| Comparable brand revenue growth (decline) | Fiscal 2014 (52 Weeks) |
Fiscal 2013 (52 Weeks) |
Fiscal 2012 (53 Weeks) |
|||||||||
| Pottery Barn |
5.8% | 10.4% | 8.5% | |||||||||
| Williams-Sonoma |
3.8% | 1.5% | (1.7% | ) | ||||||||
| West Elm |
18.2% | 17.4% | 17.4% | |||||||||
| Pottery Barn Kids |
5.9% | 7.8% | 5.6% | |||||||||
| PBteen |
5.7% | 14.1% | 1.7% | |||||||||
| Total |
7.1% | 8.8% | 6.1% | |||||||||
27
Table of Contents
E-COMMERCE NET REVENUES
| In thousands | Fiscal 2014 (52 Weeks) |
Fiscal 2013 (52 Weeks) |
Fiscal 2012 (53 Weeks) |
|||||||||
| E-commerce net revenues |
$ | 2,370,694 | $ | 2,115,022 | $ | 1,869,386 | ||||||
| E-commerce net revenue growth |
12.1% | 13.1% | 14.5% | |||||||||
E-commerce net revenues in fiscal 2014 increased by $255,672,000, or 12.1%, compared to fiscal 2013, with increases across all brands, led by West Elm, Pottery Barn and Williams-Sonoma. E-commerce net revenues generated more than 50% of our total company net revenues in fiscal 2014 versus 48% in fiscal 2013.
E-commerce net revenues in fiscal 2013 increased by $245,636,000, or 13.1%, compared to fiscal 2012, with growth across all brands, primarily led by Pottery Barn, West Elm, Pottery Barn Kids and PBteen, partially offset by the loss of the additional week of net revenues in fiscal 2012.
RETAIL NET REVENUES AND OTHER DATA
| In thousands | Fiscal 2014 (52 Weeks) |
Fiscal 2013 (52 Weeks) |
Fiscal 2012 (53 Weeks) |
|||||||||
| Retail net revenues |
$ | 2,328,025 | $ | 2,272,867 | $ | 2,173,484 | ||||||
| Retail net revenue growth |
2.4% | 4.6% | 4.1% | |||||||||
| Store count – beginning of year |
585 | 581 | 576 | |||||||||
| Store openings |
35 | 30 | 30 | |||||||||
| Store closings |
(19 | ) | (26 | ) | (25 | ) | ||||||
| Store count – end of year |
601 | 585 | 581 | |||||||||
| Store selling square footage at year-end |
3,684,000 | 3,590,000 | 3,548,000 | |||||||||
| Store leased square footage (“LSF”) at year-end |
5,965,000 | 5,838,000 | 5,778,000 | |||||||||
| Fiscal 2014 | Fiscal 2013 | Fiscal 2012 | ||||||||||||||||||||||
| Store Count |
Avg. LSF Per Store |
Store Count |
Avg. LSF Per Store |
Store Count |
Avg. LSF Per Store |
|||||||||||||||||||
| Williams-Sonoma |
243 | 6,600 | 248 | 6,600 | 253 | 6,600 | ||||||||||||||||||
| Pottery Barn |
199 | 13,700 | 194 | 13,800 | 192 | 13,900 | ||||||||||||||||||
| Pottery Barn Kids |
85 | 7,600 | 81 | 7,900 | 84 | 8,100 | ||||||||||||||||||
| West Elm |
69 | 13,700 | 58 | 14,100 | 48 | 14,900 | ||||||||||||||||||
| Rejuvenation |
5 | 10,000 | 4 | 13,200 | 4 | 13,200 | ||||||||||||||||||
| Total |
601 | 9,900 | 585 | 10,000 | 581 | 9,900 | ||||||||||||||||||
Retail net revenues in fiscal 2014 increased by $55,158,000, or 2.4%, compared to fiscal 2013, led by West Elm and Pottery Barn, partially offset by a decrease in Williams-Sonoma due to store closures at the end of fiscal 2013.
Retail net revenues in fiscal 2013 increased by $99,383,000, or 4.6%, compared to fiscal 2012. This increase was primarily driven by Pottery Barn, West Elm and our international franchise operations, partially offset by a decrease in Williams-Sonoma and the loss of the additional week of net revenues in fiscal 2012.
COST OF GOODS SOLD
| In thousands | Fiscal 2014 (52 Weeks) |
% Net Revenues |
Fiscal 2013 (52 Weeks) |
% Net Revenues |
Fiscal 2012 (53 Weeks) |
% Net Revenues |
||||||||||||||||||
| Cost of goods sold1 |
$ | 2,898,215 | 61.7% | $ | 2,683,673 | 61.2% | $ | 2,450,394 | 60.6% | |||||||||||||||
| 1 | Includes occupancy expenses of $603,357,000, $561,586,000 and $517,300,000 in fiscal 2014, fiscal 2013 and fiscal 2012, respectively. |
28
Table of Contents
Cost of goods sold includes cost of goods, occupancy expenses and shipping costs. Cost of goods consists of cost of merchandise, inbound freight expenses, freight-to-store expenses and other inventory related costs such as shrinkage, damages and replacements. Occupancy expenses consist of rent, depreciation and other occupancy costs, including common area maintenance, property taxes and utilities. Shipping costs consist of third party delivery services and shipping materials.
Our classification of expenses in cost of goods sold may not be comparable to other public companies, as we do not include non-occupancy related costs associated with our distribution network in cost of goods sold. These costs, which include distribution network employment, third party warehouse management and other distribution related administrative expenses, are recorded in selling, general and administrative expenses.
Within our reportable segments, the e-commerce channel does not incur freight-to-store or store occupancy expenses, and typically operates with lower markdowns and inventory shrinkage than the retail channel. However, the e-commerce channel incurs higher customer shipping, damage and replacement costs than the retail channel.
Fiscal 2014 vs. Fiscal 2013
Cost of goods sold increased by $214,542,000, or 8.0%, in fiscal 2014 compared to fiscal 2013. Cost of goods sold as a percentage of net revenues increased to 61.7% in fiscal 2014 from 61.2% in fiscal 2013. This increase was primarily driven by lower selling margins.
In the e-commerce channel, cost of goods sold as a percentage of net revenues increased in fiscal 2014 compared to fiscal 2013 primarily driven by lower selling margins and an increase in occupancy expenses.
In the retail channel, cost of goods sold as a percentage of net revenues remained relatively flat in fiscal 2014 compared to fiscal 2013 due to an increase in occupancy expenses offset by higher selling margins.
Fiscal 2013 vs. Fiscal 2012
Cost of goods sold increased by $233,279,000, or 9.5%, in fiscal 2013 compared to fiscal 2012. Cost of goods sold as a percentage of net revenues increased to 61.2% in fiscal 2013 from 60.6% in fiscal 2012. This increase was primarily driven by lower selling margins.
In the e-commerce channel, cost of goods sold as a percentage of net revenues remained relatively flat in fiscal 2013 compared to fiscal 2012.
In the retail channel, cost of goods sold as a percentage of net revenues increased in fiscal 2013 compared to fiscal 2012 primarily driven by lower selling margins and occupancy deleverage primarily from the capital investments in our business, including the investments in our company-owned global expansion and the loss of revenues from the additional week in fiscal 2012.
SELLING, GENERAL AND ADMINISTRATIVE EXPENSES
| In thousands | Fiscal 2014 (52 Weeks) |
% Net Revenues |
Fiscal 2013 (52 Weeks) |
% Net Revenues |
Fiscal 2012 (53 Weeks) |
% Net Revenues |
||||||||||||||||||
| Selling, general and administrative expenses |
$ | 1,298,239 | 27.6% | $ | 1,252,118 | 28.5% | $ | 1,183,313 | 29.3% | |||||||||||||||
Selling, general and administrative expenses consist of non-occupancy related costs associated with our retail stores, distribution warehouses, customer care centers, supply chain operations (buying, receiving and inspection) and corporate administrative functions. These costs include employment, advertising, third party credit card processing and other general expenses.
We experience differing employment and advertising costs as a percentage of net revenues within the retail and e-commerce channels due to their distinct distribution and marketing strategies. Store employment costs represent a greater percentage of retail net revenues than employment costs as a percentage of net revenues within the e-commerce channel. However, advertising expenses are higher within the e-commerce channel than in the retail channel.
29
Table of Contents
Fiscal 2014 vs. Fiscal 2013
Selling, general and administrative expenses for fiscal 2014 increased by $46,121,000, or 3.7%, compared to fiscal 2013. Selling, general and administrative expenses as a percentage of net revenues decreased to 27.6% in fiscal 2014 from 28.5% in fiscal 2013. This decrease as a percentage of net revenues was primarily driven by greater advertising efficiency, lower general expenses, including litigation settlement income recorded of $7,414,000, and the leverage of employment costs.
In the e-commerce channel, selling, general and administrative expenses as a percentage of net revenues decreased in fiscal 2014 compared to fiscal 2013 primarily driven by greater advertising efficiency.
In the retail channel, selling, general and administrative expenses as a percentage of net revenues increased in fiscal 2014 compared to fiscal 2013 primarily driven by employment cost deleverage, partially offset by lower general expenses.
Fiscal 2013 vs. Fiscal 2012
Selling, general and administrative expenses for fiscal 2013 increased by $68,805,000, or 5.8%, compared to fiscal 2012. Including employee separation charges of $2,932,000, selling, general and administrative expenses as a percentage of net revenues decreased to 28.5% for fiscal 2013 from 29.3% for fiscal 2012 (which included employee separation charges of $6,935,000 and asset impairment charges of $6,071,000). This decrease as a percentage of net revenues was primarily driven by greater advertising efficiency due to increasing net revenues, as well as a reduction in year-over-year asset impairment and employee separation charges.
In the e-commerce channel, selling, general and administrative expenses as a percentage of net revenues decreased for fiscal 2013 compared to fiscal 2012 primarily driven by greater advertising efficiency due to increasing net revenues.
In the retail channel, selling, general and administrative expenses as a percentage of net revenues decreased for fiscal 2013 compared to fiscal 2012 primarily driven by a reduction in year-over-year asset impairment charges and the leverage of employment costs due to increasing net revenues.
INCOME TAXES
Our effective income tax rate was 38.5% for fiscal 2014, 38.4% for fiscal 2013, and 37.4% for fiscal 2012. The increase in the effective income tax rate in fiscal 2013 over fiscal 2012 was primarily driven by certain favorable income tax resolutions and credits in fiscal 2012.
LIQUIDITY AND CAPITAL RESOURCES
As of February 1, 2015, we held $222,927,000 in cash and cash equivalents, the majority of which is held in demand deposit accounts, of which $81,124,000 was held by our foreign subsidiaries. As is consistent within our industry, our cash balances are seasonal in nature, with the fourth quarter historically representing a significantly higher level of cash than other periods.
Throughout the fiscal year, we utilize our cash balances to build our inventory levels in preparation for our fourth quarter holiday sales. In fiscal 2015, we plan to use our cash resources to fund our inventory and inventory related purchases, advertising and marketing initiatives, stock repurchases, dividend payments and purchases of property and equipment. In addition to our cash balances on hand, we have a $500,000,000 unsecured revolving line of credit (“credit facility”) that may be used to borrow revolving loans or to request the issuance of letters of credit. We may, upon notice to the administrative agent, request existing or new lenders to increase the credit facility by up to $250,000,000, at such lenders’ option, to provide for a total of $750,000,000 of unsecured revolving credit. During fiscal 2014, we had borrowings of $90,000,000 under the credit facility, all of which were repaid in the fourth quarter of fiscal 2014. During fiscal 2013, we had no borrowings under the credit facility.
During fiscal 2014, we redeemed restricted cash deposits of $14,289,000 previously held under collateralized trust agreements. These deposits, which secured potential liabilities associated with our workers’ compensation
30
Table of Contents
and other insurance programs, were replaced with standby letters of credit. As of February 1, 2015, a total of $14,760,000 in issued but undrawn standby letters of credit was outstanding under the credit facility. Additionally, as of February 1, 2015, we had three unsecured letter of credit reimbursement facilities, which were amended during the year, for a total of $70,000,000, of which an aggregate of $9,651,000 was outstanding. These letter of credit facilities represent only a future commitment to fund inventory purchases to which we had not taken legal title. We are currently in compliance with all of our financial covenants under the credit facility and, based on our current projections, we expect to remain in compliance throughout fiscal 2015. We believe our cash on hand, in addition to our available credit facilities, will provide adequate liquidity for our business operations over the next 12 months.
Cash Flows from Operating Activities
For fiscal 2014, net cash provided by operating activities was $461,697,000 compared to $453,769,000 in fiscal 2013. For fiscal 2014, net cash provided by operating activities was primarily attributable to net earnings adjusted for non-cash items and an increase in customer deposits, partially offset by an increase in merchandise inventories. This represents an increase in net cash provided compared to fiscal 2013 primarily due to a decrease in inventory purchases and an increase in net earnings adjusted for non-cash items, partially offset by the timing of payments associated with accounts payable and accrued liabilities.
For fiscal 2013, net cash provided by operating activities was $453,769,000 compared to $364,127,000 in fiscal 2012. For fiscal 2013, net cash provided by operating activities was primarily attributable to an increase in net earnings adjusted for non-cash items and an increase in accounts payable and accrued liabilities, partially offset by an increase in merchandise inventories. This represents an increase in net cash provided compared to fiscal 2012 primarily due to the timing of payments associated with accounts payable and accrued liabilities, partially offset by an increase in inventory purchases.
Cash Flows from Investing Activities
For fiscal 2014, net cash used in investing activities was $188,600,000 compared to $190,624,000 for fiscal 2013, and was primarily attributable to purchases of property and equipment. Net cash used compared to fiscal 2013 decreased primarily due to the redemption of restricted cash deposits, partially offset by an increase in purchases of property and equipment.
For fiscal 2013, net cash used in investing activities was $190,624,000 compared to $206,815,000 for fiscal 2012, and was primarily attributable to purchases of property and equipment. Net cash used compared to fiscal 2012 decreased primarily due to a decrease in purchases of property and equipment.
Cash Flows from Financing Activities
For fiscal 2014, net cash used in financing activities was $379,020,000 compared to $355,376,000 in fiscal 2013. For fiscal 2014, net cash used in financing activities was primarily attributable to the repurchase of common stock of $224,377,000 and the payment of dividends of $125,758,000. Net cash used compared to fiscal 2013 increased primarily due to an increase in tax withholding payments related to stock-based awards.
For fiscal 2013, net cash used in financing activities was $355,376,000 compared to $236,445,000 in fiscal 2012. For fiscal 2013, net cash used in financing activities was primarily attributable to the repurchase of common stock of $239,274,000 and the payment of dividends of $111,581,000. Net cash used compared to fiscal 2012 increased primarily due to an increase in the repurchase of common stock.
Dividends
See section titled Dividends within Part II, Item 5 of this Annual Report on Form 10-K for further information.
Stock Repurchase Programs
See section titled Stock Repurchase Programs within Part II, Item 5 of this Annual Report on Form 10-K for further information.
31
Table of Contents
Contractual Obligations
The following table provides summary information concerning our future contractual obligations as of February 1, 2015:
| Payments Due by Period1 | ||||||||||||||||||||
| In thousands | Fiscal 2015 | Fiscal 2016 to Fiscal 2018 |
Fiscal 2019 to Fiscal 2020 |
Thereafter | Total | |||||||||||||||
| Operating leases2 |
$ | 237,975 | $ | 602,787 | $ | 289,372 | $ | 464,191 | $ 1,594,325 | |||||||||||
| Purchase obligations3 |
792,816 | 9,792 | — | — | 802,608 | |||||||||||||||
| Memphis-based distribution facilities obligation4 |
1,968 | — | — | — | 1,968 | |||||||||||||||
| Interest |
191 | — | — | — | 191 | |||||||||||||||
| Total |
$ | 1,032,950 | $ | 612,579 | $ | 289,372 | $ | 464,191 | $ 2,399,092 | |||||||||||
| 1 | This table excludes $16.8 million of liabilities for unrecognized tax benefits associated with uncertain tax positions as we are not able to reasonably estimate when and if cash payments for these liabilities will occur. This amount, however, has been recorded as a liability in our accompanying Consolidated Balance Sheet as of February 1, 2015. |
| 2 | Projected payments include only those amounts that are fixed and determinable as of the reporting date. See Note E to our Consolidated Financial Statements for discussion of our operating leases. |
| 3 | Represents estimated commitments at year-end to purchase inventory and other goods and services in the normal course of business to meet operational requirements. |
| 4 | Represents bond-related debt pertaining to the consolidation of our Memphis-based distribution facility. See Note F to our Consolidated Financial Statements. |
Other Contractual Obligations
We have other liabilities reflected in our Consolidated Balance Sheet. The payment obligations associated with these liabilities are not reflected in the table above due to the absence of scheduled maturities. The timing of these payments cannot be determined, except for amounts estimated to be payable in fiscal 2015, which are included in our current liabilities as of February 1, 2015.
We are party to a variety of contractual agreements under which we may be obligated to indemnify the other party for certain matters. These contracts primarily relate to our commercial contracts, operating leases, trademarks, intellectual property, financial agreements and various other agreements. Under these contracts, we may provide certain routine indemnification relating to representations and warranties or personal injury matters. The terms of these indemnifications range in duration and may not be explicitly defined. Historically, we have not made significant payments for these indemnifications. We believe that if we were to incur a loss in any of these matters, the loss would not have a material effect on our financial condition or results of operations.
Commercial Commitments
The following table provides summary information concerning our outstanding commercial commitments as of February 1, 2015:
| Amount of Outstanding Commitment Expiration By Period1 | ||||||||||||||||||||
| In thousands | Fiscal 2015 | Fiscal 2016 to Fiscal 2018 |
Fiscal 2019 to Fiscal 2020 |
Thereafter | Total | |||||||||||||||
| Standby letters of credit |
$ | 14,760 | — | — | — | $ | 14,760 | |||||||||||||
| Letter of credit facilities |
9,651 | — | — | — | 9,651 | |||||||||||||||
| Credit facility |
— | — | — | — | — | |||||||||||||||
| Total |
$ | 24,411 | — | — | — | $ | 24,411 | |||||||||||||
| 1 | See Note C to our Consolidated Financial Statements for discussion of our borrowing arrangements. |
32
Table of Contents
IMPACT OF INFLATION
The impact of inflation (or deflation) on our results of operations for the past three fiscal years has not been significant. However, we cannot be certain of the effect inflation (or deflation) may have on our results of operations in the future.
CRITICAL ACCOUNTING POLICIES
Management’s Discussion and Analysis of Financial Condition and Results of Operations is based on our Consolidated Financial Statements, which have been prepared in accordance with accounting principles generally accepted in the United States of America. The preparation of these Consolidated Financial Statements requires us to make estimates and assumptions that affect the reported amounts of assets, liabilities, revenues and expenses and related disclosures of contingent assets and liabilities. These estimates and assumptions are evaluated on an ongoing basis and are based on historical experience and various other factors that we believe to be reasonable under the circumstances. Actual results could differ from these estimates.
We believe the following critical accounting policies used in the preparation of our Consolidated Financial Statements include significant estimates and assumptions.
Merchandise Inventories
Merchandise inventories, net of an allowance for excess quantities and obsolescence, are stated at the lower of cost (weighted average method) or market. To determine if the value of our inventory should be marked down below cost, we consider current and anticipated demand, customer preferences and age of the merchandise. The significant estimates used in inventory valuation are obsolescence (including excess and slow-moving inventory and lower of cost or market reserves) and estimates of inventory shrinkage. We reserve for obsolescence based on historical trends, aging reports, specific identification and our estimates of future sales and selling prices.
Reserves for shrinkage are estimated and recorded throughout the year, at the brand and channel level, as a percentage of net sales based on historical shrinkage results, expectations of future shrinkage and current inventory levels. Actual shrinkage is recorded at year-end based on the results of our physical inventory count and can vary from our estimates due to such factors as changes in operations, the mix of our inventory (which ranges from large furniture to small tabletop items) and execution against loss prevention initiatives in our stores, distribution centers, off-site storage locations, and with our third party warehouse and transportation providers. Accordingly, there is no shrinkage reserve at year-end.
Our obsolescence and shrinkage reserve calculations contain estimates that require management to make assumptions and to apply judgment regarding a number of factors, including market conditions, the selling environment, historical results and current inventory trends. If actual obsolescence or shrinkage estimates change from our original estimate, we will adjust our reserves accordingly throughout the year. We have made no material changes to our assumptions included in the calculations of the obsolescence and shrinkage reserves throughout the year. In addition, we do not believe a 10% change in our inventory reserves would have a material effect on net earnings. As of February 1, 2015 and February 2, 2014, our inventory obsolescence reserves were $10,244,000 and $10,406,000, respectively.
Advertising and Prepaid Catalog Expenses
Advertising expenses consist of media and production costs related to catalog mailings, e-commerce advertising and other direct marketing activities. All advertising costs are expensed as incurred, or upon the release of the initial advertisement, with the exception of prepaid catalog expenses. Prepaid catalog expenses consist primarily of third party incremental direct costs, including creative design, paper, printing, postage and mailing costs for all of our direct response catalogs. Such costs are capitalized as prepaid catalog expenses and are amortized over their expected period of future benefit. Such amortization is based upon the ratio of estimated e-commerce revenues for the period to the total estimated e-commerce revenues over the life of the catalog on an individual catalog basis. Estimated e-commerce revenues over the life of the catalog are based upon various factors such as
33
Table of Contents
the total number of catalogs and pages circulated, the probability and magnitude of consumer response and the assortment of merchandise offered. Each catalog is generally fully amortized over a six to nine month period, with the majority of the amortization occurring within the first four to five months. Prepaid catalog expenses are evaluated for realizability on a monthly basis by comparing the carrying amount associated with each catalog to the estimated probable future profitability (net revenues less merchandise cost of goods sold, selling expenses and catalog-related costs) of that catalog. If the estimated future profitability of the catalog is below its carrying amount, the catalog is impaired accordingly.
Total advertising expenses (including catalog advertising, e-commerce advertising and all other advertising costs) were approximately $330,070,000, $325,708,000 and $318,338,000 in fiscal 2014, fiscal 2013 and fiscal 2012, respectively.
Property and Equipment
Property and equipment is stated at cost. Depreciation is computed using the straight-line method over the estimated useful lives of the assets.
We review the carrying value of all long-lived assets for impairment, primarily at a store level, whenever events or changes in circumstances indicate that the carrying value of an asset may not be recoverable. Our impairment analyses determine whether projected cash flows from operations are sufficient to recover the carrying value of these assets. Impairment may result when the carrying value of the asset exceeds the estimated undiscounted future cash flows over its remaining useful life. For store impairment, our estimate of undiscounted future cash flows over the store lease term is based upon our experience, historical operations of the stores and estimates of future store profitability and economic conditions. The future estimates of store profitability and economic conditions require estimating such factors as sales growth, gross margin, employment rates, lease escalations, inflation and the overall economics of the retail industry, and are therefore subject to variability and difficult to predict. Actual future results may differ from those estimates. If a long-lived asset is found to be impaired, the amount recognized for impairment is equal to the difference between the asset’s net carrying value and its fair value. Long-lived assets are measured at fair value on a nonrecurring basis using Level 3 inputs as defined in the fair value hierarchy. The fair value is based on the present value of estimated future cash flows using a discount rate that approximates our weighted average cost of capital.
During fiscal 2014, fiscal 2013 and fiscal 2012, we recorded expense of approximately $241,000, $561,000 and $6,071,000, respectively, associated with asset impairment charges primarily related to retail stores, all of which is recorded within selling, general and administrative expenses.
Goodwill
Goodwill is not amortized, but rather is subject to impairment testing annually (on the first day of the fourth quarter), or between annual tests whenever events or changes in circumstances indicate that the fair value of a reporting unit may be below its carrying amount. The first step of the impairment test requires determining the fair value of the reporting unit. We use the income approach, whereby we calculate the fair value based on the present value of estimated future cash flows using a discount rate that approximates our weighted average cost of capital. The process of evaluating the potential impairment of goodwill is subjective and requires significant estimates and assumptions about the future such as sales growth, gross margins, employment rates, capital expenditures, inflation and future economic and market conditions. Actual future results may differ from those estimates. If the carrying value of the reporting unit’s assets and liabilities, including goodwill, is in excess of its fair value, goodwill may be impaired, and we must perform a second step of comparing the implied fair value of the goodwill to its carrying value to determine the impairment charge, if any. At February 1, 2015 and February 2, 2014, we had goodwill of $18,740,000 and $18,946,000, respectively, included in other assets, primarily related to our fiscal 2011 acquisition of Rejuvenation Inc. We did not recognize any goodwill impairment in fiscal 2014, fiscal 2013 or fiscal 2012.
Self-Insured Liabilities
We are primarily self-insured for workers’ compensation, employee health benefits and product and general liability claims. We record self-insurance liabilities based on claims filed, including the development of those
34
Table of Contents
claims, and an estimate of claims incurred but not yet reported. Factors affecting these estimates include future inflation rates, changes in severity, benefit level changes, medical costs and claim settlement patterns. Should a different amount of claims occur compared to what was estimated, or costs of the claims increase or decrease beyond what was anticipated, reserves may need to be adjusted accordingly. We determine our workers’ compensation liability and product and general liability claims reserves based on an actuarial analysis of historical claims data. Self-insurance reserves for employee health benefits, workers’ compensation and product and general liability claims were $24,901,000 and $21,755,000 as of February 1, 2015 and February 2, 2014, respectively.
Income Taxes
Income taxes are accounted for using the asset and liability method. Under this method, deferred income taxes arise from temporary differences between the tax basis of assets and liabilities and their reported amounts in our Consolidated Financial Statements. We record reserves for our estimates of probable settlements of foreign and domestic tax examinations. At any one time, many tax years are subject to audit by various taxing jurisdictions. The results of these examinations and negotiations with taxing authorities may affect the ultimate settlement of these issues. Additionally, our effective tax rate in a given financial statement period may be materially impacted by changes in the mix and level of our earnings in various taxing jurisdictions.
35
Table of Contents
| ITEM 7A. | QUANTITATIVE AND QUALITATIVE DISCLOSURES ABOUT MARKET RISK |
We are exposed to market risks, which include significant deterioration of the U.S. and foreign markets, changes in U.S. interest rates, foreign currency exchange rates, including the devaluation of the U.S. dollar, and the effects of economic uncertainty which may affect the prices we pay our vendors in the foreign countries in which we do business. We do not engage in financial transactions for trading or speculative purposes.
Interest Rate Risk
Our line of credit is the only instrument we hold with a variable interest rate which subjects us to interest rate risk. During fiscal 2014, we had borrowings of $90,000,000 under the credit facility, all of which were repaid in the fourth quarter of fiscal 2014. If the interest rate on this existing variable rate debt instrument rose 10% our results from operations and cash flows would not be materially affected.
In addition, we have fixed and variable income investments consisting of short-term investments classified as cash and cash equivalents, which are also affected by changes in market interest rates. As of February 1, 2015, our investments, made primarily in demand deposit accounts, are stated at cost and approximate their fair values.
Foreign Currency Risks
We purchase a significant amount of inventory from vendors outside of the U.S. in transactions that are denominated in U.S. dollars. Approximately 2% of our international purchase transactions are in currencies other than the U.S. dollar, primarily the euro. Any foreign currency impact related to these international purchase transactions was not significant to us during fiscal 2014 or fiscal 2013. Since we pay for the majority of our international purchases in U.S. dollars, however, a decline in the U.S. dollar relative to other foreign currencies would subject us to risks associated with increased purchasing costs from our vendors in their effort to offset any lost profits associated with any currency devaluation. We cannot predict with certainty the effect these increased costs may have on our financial statements or results of operations.
In addition, our retail and e-commerce businesses in Canada, Australia and the United Kingdom, and our operations throughout Asia and Europe, expose us to market risk associated with foreign currency exchange rate fluctuations. Substantially all of our purchases and sales are denominated in U.S. dollars, which limits our exposure to this risk. While the impact of foreign currency exchange rate fluctuations was not material to us in fiscal 2014, we have continued to see volatility in the exchange rates in the countries in which we do business. As we continue to expand globally, the foreign currency exchange risk related to the transactions of our foreign subsidiaries may increase. To mitigate this risk, we hedge a portion of our foreign currency exposure with foreign currency forward contracts in accordance with our risk management policies (see Note M to our Consolidated Financial Statements).
36
Table of Contents
| ITEM 8. FINANCIAL | STATEMENTS AND SUPPLEMENTARY DATA |
Williams-Sonoma, Inc.
Consolidated Statements of Earnings
| Fiscal Year Ended | ||||||||||||
| In thousands, except per share amounts |
|
Feb. 1, 2015 (52 Weeks |
) |
|
Feb. 2, 2014 (52 Weeks |
) |
|
Feb. 3, 2013 (53 Weeks |
) | |||
| Net revenues |
$ 4,698,719 | $ 4,387,889 | $ 4,042,870 | |||||||||
| Cost of goods sold |
2,898,215 | 2,683,673 | 2,450,394 | |||||||||
| Gross profit |
1,800,504 | 1,704,216 | 1,592,476 | |||||||||
| Selling, general and administrative expenses |
1,298,239 | 1,252,118 | 1,183,313 | |||||||||
| Operating income |
502,265 | 452,098 | 409,163 | |||||||||
| Interest (income) expense, net |
62 | (584 | ) | (793 | ) | |||||||
| Earnings before income taxes |
502,203 | 452,682 | 409,956 | |||||||||
| Income taxes |
193,349 | 173,780 | 153,226 | |||||||||
| Net earnings |
$ 308,854 | $ 278,902 | $ 256,730 | |||||||||
| Basic earnings per share |
$ 3.30 | $ 2.89 | $ 2.59 | |||||||||
| Diluted earnings per share |
$ 3.24 | $ 2.82 | $ 2.54 | |||||||||
| Shares used in calculation of earnings per share: |
||||||||||||
| Basic |
93,634 | 96,669 | 99,266 | |||||||||
| Diluted |
95,200 | 98,765 | 101,051 | |||||||||
|
See Notes to Consolidated Financial Statements.
Williams-Sonoma, Inc. Consolidated Statements of Comprehensive Income |
| |||||||||||
| Fiscal Year Ended | ||||||||||||
|
In thousands |
|
Feb. 1, 2015 (52 Weeks |
) |
|
Feb. 2, 2014 (52 Weeks |
) |
|
Feb. 3, 2013 (53 Weeks |
) | |||
| Net earnings |
$ 308,854 | $ 278,902 | $ 256,730 | |||||||||
| Other comprehensive income (loss): |
||||||||||||
| Foreign currency translation adjustments |
(9,305 | ) | (7,850 | ) | 1,043 | |||||||
| Change in fair value of derivative financial instruments, net of tax |
806 | 870 | 0 | |||||||||
| Reclassification adjustment for realized gains on derivative financial instruments |
(573 | ) | (129 | ) | 0 | |||||||
| Comprehensive income |
$ 299,782 | $ 271,793 | $ 257,773 | |||||||||
See Notes to Consolidated Financial Statements.
37
Table of Contents
Williams-Sonoma, Inc.
Consolidated Balance Sheets
| In thousands, except per share amounts | Feb. 1, 2015 | Feb. 2, 2014 | ||||||
| ASSETS |
||||||||
| Current assets |
||||||||
| Cash and cash equivalents |
$ | 222,927 | $ | 330,121 | ||||
| Restricted cash |
0 | 14,289 | ||||||
| Accounts receivable, net |
67,465 | 60,330 | ||||||
| Merchandise inventories, net |
887,701 | 813,160 | ||||||
| Prepaid catalog expenses |
33,942 | 33,556 | ||||||
| Prepaid expenses |
36,265 | 35,309 | ||||||
| Deferred income taxes, net |
130,618 | 121,486 | ||||||
| Other assets |
13,005 | 10,852 | ||||||
| Total current assets |
1,391,923 | 1,419,103 | ||||||
| Property and equipment, net |
883,012 | 849,293 | ||||||
| Non-current deferred income taxes, net |
4,265 | 13,824 | ||||||
| Other assets, net |
51,077 | 54,514 | ||||||
| Total assets |
$ | 2,330,277 | $ | 2,336,734 | ||||
| LIABILITIES AND STOCKHOLDERS’ EQUITY |
||||||||
| Current liabilities |
||||||||
| Accounts payable |
$ | 397,037 | $ | 404,791 | ||||
| Accrued salaries, benefits and other |
136,012 | 138,181 | ||||||
| Customer deposits |
261,679 | 228,193 | ||||||
| Income taxes payable |
32,488 | 49,365 | ||||||
| Current portion of long-term debt |
1,968 | 1,785 | ||||||
| Other liabilities |
46,764 | 38,781 | ||||||
| Total current liabilities |
875,948 | 861,096 | ||||||
| Deferred rent and lease incentives |
166,925 | 157,856 | ||||||
| Long-term debt |
0 | 1,968 | ||||||
| Other long-term obligations |
62,698 | 59,812 | ||||||
| Total liabilities |
1,105,571 | 1,080,732 | ||||||
| Commitments and contingencies – See Note J |
||||||||
| Stockholders’ equity |
||||||||
| Preferred stock: $.01 par value; 7,500 shares authorized; none issued |
0 | 0 | ||||||
| Common stock: $.01 par value; 253,125 shares authorized; |
||||||||
| 91,891 and 94,049 shares issued and outstanding at February 1, 2015 and February 2, 2014, respectively |
919 | 941 | ||||||
| Additional paid-in capital |
527,261 | 522,595 | ||||||
| Retained earnings |
701,214 | 729,043 | ||||||
| Accumulated other comprehensive income |
(2,548 | ) | 6,524 | |||||
| Treasury stock, at cost |
(2,140 | ) | (3,101 | ) | ||||
| Total stockholders’ equity |
1,224,706 | 1,256,002 | ||||||
| Total liabilities and stockholders’ equity | $ | 2,330,277 | $ | 2,336,734 | ||||
See Notes to Consolidated Financial Statements.
38
Table of Contents
Williams-Sonoma, Inc.
Consolidated Statements of Stockholders’ Equity
| Common Stock | Additional Capital |
Retained Earnings |
Accumulated Other Income |
Treasury Stock |
Total Stockholders’ Equity |
|||||||||||||||||||||||
| In thousands | Shares | Amount | ||||||||||||||||||||||||||
| Balance at January 29, 2012 |
100,451 | $ | 1,005 | $ | 478,720 | $ | 762,947 | $ | 12,590 | $ | — | $ | 1,255,262 | |||||||||||||||
| Net earnings |
— | — | — | 256,730 | — | — | 256,730 | |||||||||||||||||||||
| Foreign currency translation adjustments |
— | — | — | — | 1,043 | — | 1,043 | |||||||||||||||||||||
| Exercise of stock-based awards and related tax effect |
506 | 5 | 27,225 | — | — | — | 27,230 | |||||||||||||||||||||
| Conversion/release of stock-based awards1 |
739 | 7 | (18,644 | ) | — | — | — | (18,637 | ) | |||||||||||||||||||
| Repurchases of common stock |
(3,962 | ) | (40 | ) | (14,741 | ) | (140,299 | ) | — | — | (155,080 | ) | ||||||||||||||||
| Stock-based compensation expense |
— | — | 31,056 | (14 | ) | — | — | 31,042 | ||||||||||||||||||||
| Dividends declared |
— | — | — | (88,452 | ) | — | — | (88,452 | ) | |||||||||||||||||||
|
|
||||||||||||||||||||||||||||
| Balance at February 3, 2013 |
97,734 | 977 | 503,616 | 790,912 | 13,633 | — | 1,309,138 | |||||||||||||||||||||
| Net earnings |
— | — | — | 278,902 | — | — | 278,902 | |||||||||||||||||||||
| Foreign currency translation adjustments |
— | — | — | — | (7,850 | ) | — | (7,850 | ) | |||||||||||||||||||
| Change in fair value of derivative instruments |
— | — | — | — | 741 | — | 741 | |||||||||||||||||||||
| Exercise of stock-based awards and related tax effect |
201 | 2 | 15,339 | — | — | — | 15,341 | |||||||||||||||||||||
| Conversion/release of stock-based awards1 |
459 | 5 | (18,101 | ) | — | — | — | (18,096 | ) | |||||||||||||||||||
| Repurchases of common stock |
(4,345 | ) | (43 | ) | (17,047 | ) | (219,083 | ) | — | (3,101 | ) | (239,274 | ) | |||||||||||||||
| Stock-based compensation expense |
— | — | 38,788 | — | — | — | 38,788 | |||||||||||||||||||||
| Dividends declared |
— | — | — | (121,688 | ) | — | — | (121,688 | ) | |||||||||||||||||||
|
|
||||||||||||||||||||||||||||
| Balance at February 2, 2014 |
94,049 | 941 | 522,595 | 729,043 | 6,524 | (3,101 | ) | 1,256,002 | ||||||||||||||||||||
| Net earnings |
— | — | — | 308,854 | — | — | 308,854 | |||||||||||||||||||||
| Foreign currency translation adjustments |
— | — | — | — | (9,305 | ) | — | (9,305 | ) | |||||||||||||||||||
| Change in fair value of derivative instruments |
— | — | — | — | 233 | — | 233 | |||||||||||||||||||||
| Exercise of stock-based awards and related tax effect |
116 | 1 | 31,021 | — | — | — | 31,022 | |||||||||||||||||||||
| Conversion/release of stock-based awards1 |
1,058 | 10 | (56,053 | ) | — | — | — | (56,043 | ) | |||||||||||||||||||
| Repurchases of common stock |
(3,332 | ) | (33 | ) | (13,776 | ) | (210,568 | ) | — | — | (224,377 | ) | ||||||||||||||||
| Reissuance of treasury stock under share-based compensation plans1 |
— | — | (1,158 | ) | (737 | ) | 961 | (934 | ) | |||||||||||||||||||
| Stock-based compensation expense |
— | — | 44,632 | — | — | — | 44,632 | |||||||||||||||||||||
| Dividends declared |
— | — | — | (125,378 | ) | — | — | (125,378 | ) | |||||||||||||||||||
|
|
||||||||||||||||||||||||||||
| Balance at February 1, 2015 |
91,891 | $ | 919 | $ | 527,261 | $ | 701,214 | $ | (2,548 | ) | $ | (2,140 | ) | $ | 1,224,706 | |||||||||||||
| 1 | Amounts are shown net of shares withheld for employee taxes. |
See Notes to Consolidated Financial Statements.
39
Table of Contents
Williams-Sonoma, Inc.
Consolidated Statements of Cash Flows
| Fiscal Year Ended | ||||||||||||
| In thousands | Feb. 1, 2015 (52 Weeks) |
Feb. 2, 2014 (52 Weeks) |
Feb. 3, 2013 (53 Weeks) |
|||||||||
| Cash flows from operating activities: |
||||||||||||
| Net earnings | $ | 308,854 | $ | 278,902 | $ | 256,730 | ||||||
| Adjustments to reconcile net earnings to net cash provided by (used in) operating activities: |
||||||||||||
| Depreciation and amortization |
162,273 | 149,795 | 134,453 | |||||||||
| Loss on disposal/impairment of assets |
2,410 | 2,764 | 8,388 | |||||||||
| Amortization of deferred lease incentives |
(24,419 | ) | (25,382 | ) | (26,694 | ) | ||||||
| Deferred income taxes |
(248 | ) | (28,344 | ) | (9,029 | ) | ||||||
| Tax benefit related to stock-based awards |
26,952 | 8,817 | 12,725 | |||||||||
| Excess tax benefit related to stock-based awards |
(26,560 | ) | (8,743 | ) | (12,683 | ) | ||||||
| Stock-based compensation expense |
44,632 | 38,788 | 31,042 | |||||||||
| Other |
595 | 0 | 0 | |||||||||
| Changes in: |
||||||||||||
| Accounts receivable |
(9,366 | ) | 786 | (16,408 | ) | |||||||
| Merchandise inventories |
(76,964 | ) | (174,664 | ) | (85,981 | ) | ||||||
| Prepaid catalog expenses |
(386 | ) | 3,675 | (2,937 | ) | |||||||
| Prepaid expenses and other assets |
(61 | ) | (13,649 | ) | (12,204 | ) | ||||||
| Accounts payable |
4,455 | 135,095 | 22,461 | |||||||||
| Accrued salaries, benefits and other current and long-term liabilities |
8,867 | 43,635 | 9,147 | |||||||||
| Customer deposits |
34,400 | 21,578 | 16,962 | |||||||||
| Deferred rent and lease incentives |
23,297 | 13,238 | 18,803 | |||||||||
| Income taxes payable |
(17,034 | ) | 7,478 | 19,352 | ||||||||
| Net cash provided by operating activities |
461,697 | 453,769 | 364,127 | |||||||||
| Cash flows from investing activities: |
||||||||||||
| Purchases of property and equipment |
(204,800 | ) | (193,953 | ) | (205,404 | ) | ||||||
| Restricted cash receipts (deposits) |
14,289 | 1,766 | (1,323 | ) | ||||||||
| Proceeds from insurance reimbursements |
1,644 | 1,518 | 115 | |||||||||
| Other |
267 | 45 | (203 | ) | ||||||||
| Net cash used in investing activities |
(188,600 | ) | (190,624 | ) | (206,815 | ) | ||||||
| Cash flows from financing activities: |
||||||||||||
| Repurchase of common stock |
(224,377 | ) | (239,274 | ) | (155,080 | ) | ||||||
| Payment of dividends |
(125,758 | ) | (111,581 | ) | (87,847 | ) | ||||||
| Borrowings under revolving line of credit |
90,000 | 0 | 0 | |||||||||
| Repayments of borrowings under revolving line of credit |
(90,000 | ) | 0 | 0 | ||||||||
| Tax withholdings related to stock-based awards |
(56,977 | ) | (18,096 | ) | (18,637 | ) | ||||||
| Excess tax benefit related to stock-based awards |
26,560 | 8,743 | 12,683 | |||||||||
| Net proceeds related to stock-based awards |
4,077 | 6,614 | 14,637 | |||||||||
| Repayments of long-term obligations |
(1,785 | ) | (1,724 | ) | (1,796 | ) | ||||||
| Other |
(760 | ) | (58 | ) | (405 | ) | ||||||
| Net cash used in financing activities |
(379,020 | ) | (355,376 | ) | (236,445 | ) | ||||||
| Effect of exchange rates on cash and cash equivalents |
(1,271 | ) | (2,203 | ) | 931 | |||||||
| Net decrease in cash and cash equivalents |
(107,194 | ) | (94,434 | ) | (78,202 | ) | ||||||
| Cash and cash equivalents at beginning of year |
330,121 | 424,555 | 502,757 | |||||||||
| Cash and cash equivalents at end of year |
$ | 222,927 | $ | 330,121 | $ | 424,555 | ||||||
| Supplemental disclosure of cash flow information: |
||||||||||||
| Cash paid during the year for interest |
$ | 1,269 | $ | 1,270 | $ | 1,651 | ||||||
| Cash paid during the year for income taxes, net of refunds |
$ | 172,305 | $ | 186,968 | $ | 131,440 | ||||||
See Notes to Consolidated Financial Statements.
40
Table of Contents
Williams-Sonoma, Inc.
Notes to Consolidated Financial Statements
Note A: Summary of Significant Accounting Policies
We are a specialty retailer of high-quality products for the home. These products, representing distinct merchandise strategies – Williams-Sonoma, Pottery Barn, Pottery Barn Kids, West Elm, PBteen, Williams-Sonoma Home, Rejuvenation, and Mark and Graham – are marketed through e-commerce websites, direct mail catalogs and 601 stores. We have retail and e-commerce businesses in the U.S., Canada, Australia and the United Kingdom, and ship our products to customers worldwide. Our catalogs reach customers throughout the U.S. and Australia. In addition, we have unaffiliated franchisees that operate stores in the Middle East and the Philippines.
Intercompany transactions and accounts have been eliminated.
Fiscal Year
Our fiscal year ends on the Sunday closest to January 31, based on a 52 or 53-week year. Fiscal 2014, a 52-week year, ended on February 1, 2015; Fiscal 2013, a 52-week year, ended on February 2, 2014; and fiscal 2012, a 53-week year, ended on February 3, 2013.
Use of Estimates
The preparation of financial statements in accordance with accounting principles generally accepted in the United States of America requires us to make estimates and assumptions that affect the reported amounts of assets, liabilities, revenues and expenses and related disclosures of contingent assets and liabilities. These estimates and assumptions are evaluated on an ongoing basis and are based on historical experience and various other factors that we believe to be reasonable under the circumstances. Actual results could differ from these estimates.
Cash Equivalents
Cash equivalents include highly liquid investments with an original maturity of three months or less. As of February 1, 2015, we were invested primarily in demand deposit accounts. Book cash overdrafts issued, but not yet presented to the bank for payment, are reclassified to accounts payable.
Restricted Cash
Restricted cash represents deposits held in trusts to secure our liabilities associated with our workers’ compensation and other insurance programs. During fiscal 2014, we redeemed restricted cash deposits of $14,289,000 previously held under collateralized trust agreements.
Accounts Receivable and Allowance for Doubtful Accounts
Accounts receivable are stated at their carrying values, net of an allowance for doubtful accounts. Accounts receivable consist primarily of credit card, franchisee and landlord receivables for which collectability is reasonably assured. Receivables are evaluated for collectability on a regular basis and an allowance for doubtful accounts is recorded, if necessary. Our allowance for doubtful accounts was not material to our financial statements as of February 1, 2015 and February 2, 2014.
Merchandise Inventories
Merchandise inventories, net of an allowance for excess quantities and obsolescence, are stated at the lower of cost (weighted average method) or market. To determine if the value of our inventory should be marked down below cost, we consider current and anticipated demand, customer preferences and age of the merchandise. The significant estimates used in inventory valuation are obsolescence (including excess and slow-moving inventory and lower of cost or market reserves) and estimates of inventory shrinkage. We reserve for obsolescence based on historical trends, aging reports, specific identification and our estimates of future sales and selling prices.
Reserves for shrinkage are estimated and recorded throughout the year, at the brand and channel level, as a percentage of net sales based on historical shrinkage results, expectations of future shrinkage and current
41
Table of Contents
inventory levels. Actual shrinkage is recorded at year-end based on the results of our physical inventory count and can vary from our estimates due to such factors as changes in operations, the mix of our inventory (which ranges from large furniture to small tabletop items) and execution against loss prevention initiatives in our stores, distribution centers, off-site storage locations, and with our third party warehouse and transportation providers. Accordingly, there is no shrinkage reserve at year-end.
Our obsolescence and shrinkage reserve calculations contain estimates that require management to make assumptions and to apply judgment regarding a number of factors, including market conditions, the selling environment, historical results and current inventory trends. If actual obsolescence or shrinkage estimates change from our original estimate, we will adjust our reserves accordingly throughout the year. We have made no material changes to our assumptions included in the calculations of the obsolescence and shrinkage reserves throughout the year. In addition, we do not believe a 10% change in our inventory reserves would have a material effect on net earnings. As of February 1, 2015 and February 2, 2014, our inventory obsolescence reserves were $10,244,000 and $10,406,000, respectively.
Advertising and Prepaid Catalog Expenses
Advertising expenses consist of media and production costs related to catalog mailings, e-commerce advertising and other direct marketing activities. All advertising costs are expensed as incurred, or upon the release of the initial advertisement, with the exception of prepaid catalog expenses. Prepaid catalog expenses consist primarily of third party incremental direct costs, including creative design, paper, printing, postage and mailing costs for all of our direct response catalogs. Such costs are capitalized as prepaid catalog expenses and are amortized over their expected period of future benefit. Such amortization is based upon the ratio of estimated e-commerce revenues for the period to the total estimated e-commerce revenues over the life of the catalog on an individual catalog basis. Estimated e-commerce revenues over the life of the catalog are based upon various factors such as the total number of catalogs and pages circulated, the probability and magnitude of consumer response and the assortment of merchandise offered. Each catalog is generally fully amortized over a six to nine month period, with the majority of the amortization occurring within the first four to five months. Prepaid catalog expenses are evaluated for realizability on a monthly basis by comparing the carrying amount associated with each catalog to the estimated probable future profitability (net revenues less merchandise cost of goods sold, selling expenses and catalog-related costs) of that catalog. If the estimated future profitability of the catalog is below its carrying amount, the catalog is impaired accordingly.
Total advertising expenses (including catalog advertising, e-commerce advertising and all other advertising costs) were approximately $330,070,000, $325,708,000 and $318,338,000 in fiscal 2014, fiscal 2013 and fiscal 2012, respectively.
Property and Equipment
Property and equipment is stated at cost. Depreciation is calculated using the straight-line method over the following estimated useful lives:
| Leasehold improvements |
Shorter of estimated useful life or lease term (generally 3 – 22 years) | |
| Fixtures and equipment |
2 – 20 years | |
| Buildings and building improvements |
10 – 40 years | |
| Capitalized software |
2 – 10 years |
We review the carrying value of all long-lived assets for impairment, primarily at a store level, whenever events or changes in circumstances indicate that the carrying value of an asset may not be recoverable. Our impairment analyses determine whether projected cash flows from operations are sufficient to recover the carrying value of these assets. Impairment may result when the carrying value of the asset exceeds the estimated undiscounted future cash flows over its remaining useful life. For store impairment, our estimate of undiscounted future cash flows over the store lease term is based upon our experience, historical operations of the stores and estimates of
42
Table of Contents
future store profitability and economic conditions. The future estimates of store profitability and economic conditions require estimating such factors as sales growth, gross margin, employment rates, lease escalations, inflation and the overall economics of the retail industry, and are therefore subject to variability and difficult to predict. Actual future results may differ from those estimates. If a long-lived asset is found to be impaired, the amount recognized for impairment is equal to the difference between the asset’s net carrying value and its fair value. Long-lived assets are measured at fair value on a nonrecurring basis using Level 3 inputs as defined in the fair value hierarchy. The fair value is based on the present value of estimated future cash flows using a discount rate that approximates our weighted average cost of capital.
For any store or facility closure where a lease obligation still exists, we record the estimated future liability associated with the rental obligation on the cease use date.
During fiscal 2014, fiscal 2013 and fiscal 2012, we recorded expense of approximately $241,000, $561,000 and $6,071,000, respectively, associated with asset impairment charges primarily related to retail stores, all of which is recorded within selling, general and administrative expenses.
Goodwill
Goodwill is not amortized, but rather is subject to impairment testing annually (on the first day of the fourth quarter), or between annual tests whenever events or changes in circumstances indicate that the fair value of a reporting unit may be below its carrying amount. The first step of the impairment test requires determining the fair value of the reporting unit. We use the income approach, whereby we calculate the fair value based on the present value of estimated future cash flows using a discount rate that approximates our weighted average cost of capital. The process of evaluating the potential impairment of goodwill is subjective and requires significant estimates and assumptions about the future, such as sales growth, gross margins, employment rates, capital expenditures, inflation and future economic and market conditions. Actual future results may differ from those estimates. If the carrying value of the reporting unit’s assets and liabilities, including goodwill, is in excess of its fair value, goodwill may be impaired, and we must perform a second step of comparing the implied fair value of the goodwill to its carrying value to determine the impairment charge, if any. At February 1, 2015 and February 2, 2014, we had goodwill of $18,740,000 and $18,946,000, respectively, included in other assets, primarily related to our fiscal 2011 acquisition of Rejuvenation Inc. We did not recognize any goodwill impairment in fiscal 2014, fiscal 2013 or fiscal 2012.
Self-Insured Liabilities
We are primarily self-insured for workers’ compensation, employee health benefits and product and general liability claims. We record self-insurance liabilities based on claims filed, including the development of those claims, and an estimate of claims incurred but not yet reported. Factors affecting these estimates include future inflation rates, changes in severity, benefit level changes, medical costs and claim settlement patterns. Should a different amount of claims occur compared to what was estimated, or costs of the claims increase or decrease beyond what was anticipated, reserves may need to be adjusted accordingly. We determine our workers’ compensation liability and product and general liability claims reserves based on an actuarial analysis of historical claims data. Self-insurance reserves for employee health benefits, workers’ compensation and product and general liability claims were $24,901,000 and $21,755,000 as of February 1, 2015 and February 2, 2014, respectively.
Customer Deposits
Customer deposits are primarily comprised of unredeemed gift cards and merchandise credits and deferred revenue related to undelivered merchandise. We maintain a liability for unredeemed gift cards and merchandise credits until the earlier of redemption, escheatment or four years as we have concluded that the likelihood of our gift cards being redeemed beyond four years from the date of issuance is remote.
Deferred Rent and Lease Incentives
For leases that contain fixed escalations of the minimum annual lease payment during the original term of the lease, we recognize rental expense on a straight-line basis over the lease term, including the construction period,
43
Table of Contents
and record the difference between rent expense and the amount currently payable as deferred rent. Deferred lease incentives include construction allowances received from landlords, which are amortized on a straight-line basis over the lease term, including the construction period.
Fair Value of Financial Instruments
The carrying values of cash and cash equivalents, restricted cash, accounts receivable, accounts payable and debt approximate their estimated fair values. We use derivative instruments to hedge against foreign currency exchange rate fluctuations. The assets or liabilities associated with our derivative financial instruments are recorded at fair value in either other current assets or other current liabilities. The fair value of our foreign currency derivative instruments is measured using the income approach whereby we use observable market data at the measurement date and standard valuation techniques to convert future amounts to a single present value amount. These observable inputs include spot rates, forward rates, interest rates and credit derivative market rates (refer to Notes M and N for additional information).
Revenue Recognition
We recognize revenues and the related cost of goods sold (including shipping costs) at the time the products are delivered to our customers. Revenue is recognized for retail sales (excluding home-delivered merchandise) at the point of sale in the store and, for home-delivered merchandise and e-commerce sales, when the merchandise is delivered to the customer. Discounts provided to customers are accounted for as a reduction of sales. We record a reserve for estimated product returns in each reporting period. Shipping and handling fees charged to the customer are recognized as revenue at the time the products are delivered to the customer. Revenues are presented net of any taxes collected from customers and remitted to governmental authorities.
Sales Returns Reserve
Our customers may return purchased items for an exchange or refund. We record a reserve for estimated product returns, net of cost of goods sold, based on historical return trends together with current product sales performance. A summary of activity in our sales returns reserve is as follows:
| In thousands | Fiscal 20141 (52 Weeks) |
Fiscal 20131 (52 Weeks) |
Fiscal 20121 (53 Weeks) |
|||||||||
| Balance at beginning of year |
$ | 15,954 | $ | 14,397 | $ | 14,151 | ||||||
| Provision for sales returns |
311,911 | 293,929 | 270,156 | |||||||||
| Actual sales returns |
(313,083 | ) | (292,372 | ) | (269,910 | ) | ||||||
| Balance at end of year |
$ | 14,782 | $ | 15,954 | $ | 14,397 | ||||||
| 1 | Amounts are shown net of cost of goods sold. |
Vendor Allowances
We receive allowances or credits from certain vendors for volume rebates. We treat such volume rebates as an offset to the cost of the product or services provided at the time the expense is recorded. These allowances and credits received are recorded in both cost of goods sold and in selling, general and administrative expenses.
Cost of Goods Sold
Cost of goods sold includes cost of goods, occupancy expenses and shipping costs. Cost of goods consists of cost of merchandise, inbound freight expenses, freight-to-store expenses and other inventory related costs such as shrinkage, damages and replacements. Occupancy expenses consist of rent, depreciation and other occupancy costs, including common area maintenance, property taxes and utilities. Shipping costs consist of third party delivery services and shipping materials.
Selling, General and Administrative Expenses
Selling, general and administrative expenses consist of non-occupancy related costs associated with our retail stores, distribution warehouses, customer care centers, supply chain operations (buying, receiving and inspection)
44
Table of Contents
and corporate administrative functions. These costs include employment, advertising, third party credit card processing and other general expenses.
Stock-Based Compensation
We account for stock-based compensation arrangements by measuring and recognizing compensation expense in our Consolidated Financial Statements for all stock-based awards using a fair value based method. Restricted stock units are valued using the closing price of our stock on the date prior to the date of grant. The fair value of each stock-based award is amortized over the requisite service period.
Foreign Currency Translation
As of February 1, 2015, our retail stores in Canada, Australia and the United Kingdom, and our operations throughout Asia and Europe expose us to market risk associated with foreign currency exchange rate fluctuations.
Additionally, some of our foreign operations have a functional currency different than the U.S. dollar, such as those in Canada (Canadian dollar), Europe (euro or British pound) and Australia (Australian dollar). Assets and liabilities are translated into U.S. dollars using the current exchange rates in effect at the balance sheet date, while revenues and expenses are translated at the average exchange rates during the period. The resulting translation adjustments are recorded as other comprehensive income within stockholders’ equity. While the gains and losses resulting from foreign currency exchange rate fluctuations have not been material to us, we have continued to see volatility in the exchange rates in the countries in which we do business. These gains and losses are included in selling, general and administrative expenses (except for those discussed in Note M).
Earnings Per Share
Basic earnings per share is computed as net earnings divided by the weighted average number of common shares outstanding for the period. Diluted earnings per share is computed as net earnings divided by the weighted average number of common shares outstanding for the period plus common stock equivalents. Common stock equivalents consist of shares subject to stock-based awards with exercise prices less than or equal to the average market price of our common stock for the period, to the extent their inclusion would be dilutive.
Income Taxes
Income taxes are accounted for using the asset and liability method. Under this method, deferred income taxes arise from temporary differences between the tax basis of assets and liabilities and their reported amounts in our Consolidated Financial Statements. We record reserves for our estimates of the additional income tax liability that is more likely than not to result from the ultimate resolution of foreign and domestic tax examinations. At any one time, many tax years are subject to examination by various taxing jurisdictions. The results of these examinations and negotiations with taxing authorities may affect the ultimate settlement of these issues. We review and update the estimates used in the accrual for uncertain tax positions as more definitive information becomes available from taxing authorities, upon completion of tax examination, upon expiration of statutes of limitation, or upon occurrence of other events.
In order to compute the tax on an interim basis, we estimate what our effective tax rate will be for the full fiscal year and adjust these estimates throughout the year as necessary. Adjustments to our income tax provision due to changes in our estimated effective tax rate are recorded in the interim period in which the change occurs. The tax (or benefit) related to items other than ordinary income is individually computed and recognized when the items occur. Our effective tax rate in a given financial statement period may be materially impacted by changes in the mix and level of our earnings in various taxing jurisdictions.
New Accounting Pronouncements
In May 2014, the Financial Accounting Standards Board (“FASB”) issued Accounting Standards Update (“ASU”) 2014-09, Revenue from Contracts with Customers, to clarify the principles of recognizing revenue and
45
Table of Contents
create common revenue recognition guidance between U.S. Generally Accepted Accounting Principles and International Financial Reporting Standards. This ASU is effective retrospectively for fiscal years and interim periods within those years beginning after December 15, 2016. We are currently assessing the potential impact of this ASU on our Consolidated Financial Statements.
Note B: Property and Equipment
Property and equipment consists of the following:
| In thousands | Feb. 1, 2015 | Feb. 2, 2014 | ||||||
| Leasehold improvements |
$ | 852,372 | $ | 847,351 | ||||
| Fixtures and equipment |
691,001 | 698,275 | ||||||
| Capitalized software |
431,259 | 419,432 | ||||||
| Land and buildings |
192,841 | 188,498 | ||||||
| Corporate systems projects in progress 1 |
91,885 | 72,693 | ||||||
| Construction in progress 2 |
10,119 | 5,519 | ||||||
| Total |
2,269,477 | 2,231,768 | ||||||
| Accumulated depreciation |
(1,386,465 | ) | (1,382,475 | ) | ||||
| Property and equipment, net |
$ | 883,012 | $ | 849,293 | ||||
| 1 | Corporate systems projects in progress as of February 1, 2015 and February 2, 2014 include approximately $56.8 million and $40.1 million, respectively, for the portion of our new inventory and order management system currently under development and not ready for its intended use. |
| 2 | Construction in progress primarily consists of leasehold improvements and furniture and fixtures related to new, expanded or remodeled retail stores where construction had not been completed as of year-end. |
Note C: Borrowing Arrangements
Long-term debt consists of the following:
| In thousands | Feb. 1, 2015 | Feb. 2, 2014 | ||||||
| Memphis-based distribution facility obligation (see Note F) |
$ | 1,968 | $ | 3,753 | ||||
| Less current maturities |
(1,968 | ) | (1,785 | ) | ||||
| Total long-term debt |
$ | 0 | $ | 1,968 | ||||
Credit Facility
We have a $500,000,000 unsecured revolving line of credit (“credit facility”) that may be used to borrow revolving loans or request the issuance of letters of credit. We may, upon notice to the administrative agent, request existing or new lenders to increase the credit facility by up to $250,000,000, at such lenders’ option, to provide for a total of $750,000,000 of unsecured revolving credit. As of February 1, 2015, we were in compliance with our financial covenants under the credit facility and, based on current projections, we expect to remain in compliance throughout fiscal 2015. The credit facility matures on November 19, 2019, at which time all outstanding borrowings must be repaid and all outstanding letters of credit must be cash collateralized.
We may elect interest rates calculated at (i) Bank of America’s prime rate (or, if greater, the average rate on overnight federal funds plus one-half of one percent, or a rate based on LIBOR plus one percent) plus a margin based on our leverage ratio or (ii) LIBOR plus a margin based on our leverage ratio. During fiscal 2014, we had borrowings of $90,000,000 under the credit facility, all of which were repaid in the fourth quarter of fiscal 2014, and no amounts were outstanding as of February 1, 2015. During fiscal 2013, we had no borrowings under the credit facility, and no amounts were outstanding as of February 2, 2014. Additionally, as of February 1, 2015, $14,760,000 in issued but undrawn standby letters of credit was outstanding under the credit facility. The standby letters of credit were issued to secure the liabilities associated with workers’ compensation and other insurance programs.
46
Table of Contents
Letter of Credit Facilities
We have three unsecured letter of credit reimbursement facilities for a total of $70,000,000, each of which matures on August 28, 2015. The letter of credit facilities contain covenants that are consistent with our unsecured revolving line of credit. Interest on unreimbursed amounts under the letter of credit facilities accrues at the lender’s prime rate (or, if greater, the average rate on overnight federal funds plus one-half of one percent) plus 2.0%. As of February 1, 2015, an aggregate of $9,651,000 was outstanding under the letter of credit facilities, which represents only a future commitment to fund inventory purchases to which we had not taken legal title. The latest expiration possible for any future letters of credit issued under the facilities is January 25, 2016.
Note D: Income Taxes
The components of earnings before income taxes, by tax jurisdiction, are as follows:
| Fiscal Year Ended | ||||||||||||
| In thousands | Feb. 1, 2015 (52 Weeks) |
Feb. 2, 2014 (52 Weeks) |
Feb. 3, 2013 (53 Weeks) |
|||||||||
| United States |
$ | 482,739 | $ | 448,764 | $ | 401,542 | ||||||
| Foreign |
19,464 | 3,918 | 8,414 | |||||||||
| Total earnings before income taxes |
$ | 502,203 | $ | 452,682 | $ | 409,956 | ||||||
|
The provision for income taxes consists of the following: |
||||||||||||
| Fiscal Year Ended | ||||||||||||
| In thousands | Feb. 1, 2015 (52 Weeks) |
Feb. 2, 2014 (52 Weeks) |
Feb. 3, 2013 (53 Weeks) |
|||||||||
| Current |
||||||||||||
| Federal |
$ | 157,227 | $ | 173,686 | $ | 136,742 | ||||||
| State |
31,959 | 25,748 | 22,072 | |||||||||
| Foreign |
4,411 | 2,690 | 3,441 | |||||||||
| Total current |
193,597 | 202,124 | 162,255 | |||||||||
| Deferred |
||||||||||||
| Federal |
2,719 | (26,324 | ) | (7,827 | ) | |||||||
| State |
(2,547 | ) | (1,277 | ) | (1,202 | ) | ||||||
| Foreign |
(420 | ) | (743 | ) | (0 | ) | ||||||
| Total deferred |
(248 | ) | (28,344 | ) | (9,029 | ) | ||||||
| Total provision |
$ | 193,349 | $ | 173,780 | $ | 153,226 | ||||||
We have historically elected not to provide for U.S. income taxes with respect to the undistributed earnings of our foreign subsidiaries as we intended to utilize those earnings in our foreign operations for an indefinite period of time. As of February 1, 2015 the accumulated undistributed earnings of all foreign subsidiaries were approximately $43,300,000 and are sufficient to support our anticipated future cash needs for our foreign operations. We currently intend to utilize those undistributed earnings for an indefinite period of time and will only repatriate such earnings when it is tax effective to do so. It is currently not practical to estimate the tax liability that might be payable if these foreign earnings were to be repatriated.
A reconciliation of income taxes at the federal statutory corporate rate to the effective rate is as follows:
| Fiscal Year Ended | ||||||||||||
| Feb. 1, 2015 (52 Weeks) |
Feb. 2, 2014 (52 Weeks) |
Feb. 3, 2013 (53 Weeks) |
||||||||||
| Federal income taxes at the statutory rate |
35.0% | 35.0% | 35.0% | |||||||||
| State income tax rate |
4.0% | 3.7% | 3.3% | |||||||||
| Other |
(0.5% | ) | (0.3% | ) | (0.9% | ) | ||||||
| Effective tax rate |
38.5% | 38.4% | 37.4% | |||||||||
47
Table of Contents
Significant components of our deferred tax accounts are as follows:
| In thousands | Feb. 1, 2015 | Feb. 2, 2014 | ||||||||
| Current: |
||||||||||
| Compensation |
$ | 15,968 | $ | 14,378 | ||||||
| Merchandise inventories |
30,328 | 27,337 | ||||||||
| Accrued liabilities |
28,866 | 26,461 | ||||||||
| Customer deposits |
60,989 | 58,479 | ||||||||
| Prepaid catalog expenses |
(12,753 | ) | (12,576 | ) | ||||||
| Other |
7,220 | 7,407 | ||||||||
| Total current |
130,618 | 121,486 | ||||||||
| Non-current: |
||||||||||
| Depreciation |
(9,888 | ) | (4,216 | ) | ||||||
| Deferred rent |
18,925 | 17,500 | ||||||||
| Deferred lease incentives |
(37,098 | ) | (33,065 | ) | ||||||
| Stock-based compensation |
19,857 | 28,948 | ||||||||
| Executive deferral plan |
5,437 | 5,699 | ||||||||
| Uncertainties |
7,061 | 4,378 | ||||||||
| Valuation allowance |
(1,568 | ) | (1,048 | ) | ||||||
| Other |
1,539 | (4,372 | ) | |||||||
| Total non-current |
4,265 | 13,824 | ||||||||
| Total deferred tax assets, net |
$ | 134,883 | $ | 135,310 | ||||||
The following table summarizes the activity related to our gross unrecognized tax benefits:
| In thousands |
Fiscal 2014 (52 Weeks) |
Fiscal 2013 (52 Weeks) |
Fiscal 2012 (53 Weeks) |
|||||||||
| Balance at beginning of year |
$ | 10,765 | $ | 8,990 | $ | 10,023 | ||||||
| Increases related to current year tax positions |
3,093 | 3,351 | 2,188 | |||||||||
| Increases related to prior years’ tax positions |
2,007 | 328 | 936 | |||||||||
| Decreases related to prior years’ tax positions |
(138 | ) | (42 | ) | (171 | ) | ||||||
| Settlements |
(1,144 | ) | (170 | ) | (1,069 | ) | ||||||
| Lapses in statute of limitations |
(224 | ) | (1,692 | ) | (2,917 | ) | ||||||
| Balance at end of year |
$ | 14,359 | $ | 10,765 | $ | 8,990 | ||||||
As of February 1, 2015, we had $14,359,000 of gross unrecognized tax benefits, of which $9,602,000 would, if recognized, affect the effective tax rate.
We accrue interest and penalties related to unrecognized tax benefits in the provision for income taxes. As of February 1, 2015 and February 2, 2014, our accruals for the payment of interest and penalties totaled $2,412,000 and $2,231,000, respectively, primarily related to interest.
Due to the potential resolution of state issues, it is reasonably possible that the balance of our gross unrecognized tax benefits could decrease within the next twelve months by a range of $0 to $1,900,000.
We file income tax returns in the U.S. federal jurisdiction and various states and foreign jurisdictions. The Internal Revenue Service (IRS) had concluded examination of our U.S. federal income tax returns for years prior to fiscal 2011 without any significant adjustments. Substantially all material state, local and foreign income tax examinations have been concluded through fiscal 2004.
48
Table of Contents
Note E: Accounting for Leases
Operating Leases
We lease store locations, distribution centers, customer care centers, corporate facilities and certain equipment for original terms ranging generally from 3 to 22 years. Certain leases contain renewal options for periods up to 20 years. The rental payment requirements in our store leases are typically structured as either: minimum rent; rent based on a percentage of store sales; minimum rent plus additional rent based on a percentage of store sales; or rent based on a percentage of store sales if a specified store sales threshold or contractual obligation of the landlord has not been met. Contingent rental payments, including rental payments that are based on a percentage of sales, cannot be predicted with certainty at the onset of the lease term. Accordingly, such contingent rental payments are recorded as incurred each period and are excluded from our calculation of deferred rent liability.
Total rental expense for all operating leases was as follows:
| Fiscal Year Ended | ||||||||||||
| In thousands | Feb. 1, 2015 (52 Weeks) |
Feb. 2, 2014 (52 Weeks) |
Feb. 3, 2013 (53 Weeks) |
|||||||||
| Rent expense |
$ | 215,221 | $ | 201,727 | $ | 189,060 | ||||||
| Contingent rent expense |
32,699 | 34,608 | 35,634 | |||||||||
| Rent expense before deferred lease incentive income |
247,920 | 236,335 | 224,694 | |||||||||
| Deferred lease incentive income |
(24,420 | ) | (25,385 | ) | (26,694 | ) | ||||||
| Less: sublease rental income |
(560 | ) | (536 | ) | (535 | ) | ||||||
| Total rent expense1 |
$ | 222,940 | $ | 210,414 | $ | 197,465 | ||||||
| 1 | Excludes all other occupancy-related costs including depreciation, common area maintenance, utilities and property taxes. |
The aggregate future minimum annual cash rental payments under non-cancelable operating leases (excluding the Memphis-based distribution facility consolidated by us, see Note F) in effect at February 1, 2015 were as follows:
| In thousands |
Lease Commitments1,2 | |||
| Fiscal 2015 |
$ | 237,975 | ||
| Fiscal 2016 |
225,951 | |||
| Fiscal 2017 |
198,483 | |||
| Fiscal 2018 |
178,353 | |||
| Fiscal 2019 |
158,431 | |||
| Thereafter |
595,132 | |||
| Total |
$ | 1,594,325 |
| 1 | Represents future projected cash payments and, therefore, is not necessarily representative of future expected rental expense. |
| 2 | Projected cash payments include only those amounts that are fixed and determinable as of the reporting date. We currently pay rent for certain store locations based on a percentage of store sales. As future store sales cannot be predicted with certainty, projected payments for these locations are based on minimum rent, which is generally higher than rent based on a percentage of store sales. We incur other lease obligation expenses, such as common area maintenance and other executory costs, which are not fixed in nature and are thus not included in the future projected cash payments reflected above. In addition, projected cash payments do not include any benefit from deferred lease incentive income, which is reflected within “Total rent expense” above. |
49
Table of Contents
Note F: Memphis-Based Distribution Facilities
Our Memphis-based distribution facilities include an operating lease entered into in July 1983 for a distribution facility in Memphis, Tennessee. The lessor is a general partnership (“Partnership 1”) comprised of the estate of W. Howard Lester (“Mr. Lester”), our former Chairman of the Board and Chief Executive Officer, and the estate of James A. McMahan (“Mr. McMahan”), a former Director Emeritus and significant stockholder. Partnership 1 does not have operations separate from the leasing of this distribution facility and does not have lease agreements with any unrelated third parties. The terms of the lease automatically renewed until the bonds that financed the construction of the facility were fully repaid in December 2010, at which time we continued to rent the facility on a month-to-month basis. We subsequently agreed to lease the facilities from Partnership 1 through February 2014, at which time the lease was terminated and we vacated the facility. We made annual rental payments of approximately $28,000 in fiscal 2014, and $618,000 in both fiscal 2013 and fiscal 2012.
Our other Memphis-based distribution facility includes an operating lease entered into in August 1990 for another distribution facility that is adjoined to the Partnership 1 facility in Memphis, Tennessee. The lessor is a general partnership (“Partnership 2”) comprised of the estate of Mr. Lester, the estate of Mr. McMahan and two unrelated parties. Partnership 2 does not have operations separate from the leasing of this distribution facility and does not have lease agreements with any unrelated third parties. The term of the lease automatically renews on an annual basis until the bonds that financed the construction of the facility are fully repaid in August 2015. As of February 1, 2015, $1,968,000 was outstanding under the Partnership 2 bonds. We made annual rental payments of approximately $2,432,000, $2,448,000 and $2,473,000 including applicable taxes, insurance and maintenance expenses in fiscal 2014, fiscal 2013 and fiscal 2012, respectively.
As of February 1, 2015, Partnership 2 qualifies as a variable interest entity and is consolidated by us due to its related party relationship and our obligation to renew the lease until the bonds are fully repaid. As such, as of February 1, 2015, our Consolidated Balance Sheet includes $10,658,000 in assets (primarily buildings), $1,968,000 in debt and $8,690,000 in other long-term liabilities related to the consolidation of the Partnership 2 distribution facility.
Note G: Earnings Per Share
The following is a reconciliation of net earnings and the number of shares used in the basic and diluted earnings per share computations:
| In thousands, except per share amounts | Net Earnings | Weighted Average Shares |
Earnings Per Share |
|||||||||
| 2014 (52 Weeks) |
||||||||||||
| Basic |
$ | 308,854 | 93,634 | $ | 3.30 | |||||||
| Effect of dilutive stock-based awards |
1,566 | |||||||||||
| Diluted |
$ | 308,854 | 95,200 | $ | 3.24 | |||||||
| 2013 (52 Weeks) |
||||||||||||
| Basic |
$ | 278,902 | 96,669 | $ | 2.89 | |||||||
| Effect of dilutive stock-based awards |
2,096 | |||||||||||
| Diluted |
$ | 278,902 | 98,765 | $ | 2.82 | |||||||
| 2012 (53 Weeks) |
||||||||||||
| Basic |
$ | 256,730 | 99,266 | $ | 2.59 | |||||||
| Effect of dilutive stock-based awards |
1,785 | |||||||||||
| Diluted |
$ | 256,730 | 101,051 | $ | 2.54 | |||||||
Stock-based awards of 21,000 and 1,313,000 were excluded from the computation of diluted earnings per share in fiscal 2014 and fiscal 2012, respectively, as their inclusion would be anti-dilutive. There were no stock-based awards excluded from the computation of diluted earnings per share in fiscal 2013.
50
Table of Contents
Note H: Stock-Based Compensation
Equity Award Programs
Our Amended and Restated 2001 Long-Term Incentive Plan (the “Plan”) provides for grants of incentive stock options, nonqualified stock options, stock-settled stock appreciation rights (collectively, “option awards”), restricted stock awards, restricted stock units (including those that are performance-based), deferred stock awards (collectively, “stock awards”) and dividend equivalents up to an aggregate of 25,760,000 shares. As of February 1, 2015, there were approximately 4,354,000 shares available for future grant. Awards may be granted under the Plan to officers, employees and non-employee members of the board of directors of the company (the “Board”) or any parent or subsidiary. Shares issued as a result of award exercises or releases are primarily funded with the issuance of new shares.
Option Awards
Annual grants of option awards are limited to 1,000,000 shares on a per person basis and have a maximum term of seven years. The exercise price of these option awards is not less than 100% of the closing price of our stock on the day prior to the grant date. Option awards granted to employees generally vest over a period of four years for service-based awards. Certain option awards contain vesting acceleration clauses resulting from events including, but not limited to, retirement, merger or a similar corporate event.
Stock Awards
Annual grants of stock awards are limited to 400,000 shares on a per person basis. Stock awards granted to employees generally vest evenly over a period of four years for service-based awards. Certain performance-based awards, which have variable payout conditions based on predetermined financial targets, vest three years from the date of grant. Certain stock awards and other agreements contain vesting acceleration clauses resulting from events including, but not limited to, retirement, merger or a similar corporate event. Stock awards granted to non-employee Board members generally vest in one year. Non-employee Board members automatically receive stock awards on the date of their initial election to the Board and annually thereafter on the date of the annual meeting of stockholders (so long as they continue to serve as a non-employee Board member).
Stock-Based Compensation Expense
We measure and record stock-based compensation expense for all employee stock-based awards using a fair value based method. During fiscal 2014, fiscal 2013 and fiscal 2012, we recognized total stock-based compensation expense, as a component of selling, general and administrative expenses, of $44,632,000, $38,788,000 and $31,042,000, respectively. As of February 1, 2015, there was $52,317,000 of unrecognized stock-based compensation expense (net of estimated forfeitures), which we expect to recognize on a straight-line basis over a weighted average remaining service period of approximately two years. At each reporting period, all compensation expense attributable to vested awards has been fully recognized.
Stock Options
The following table summarizes our stock option activity during fiscal 2014:
| Shares | Weighted Exercise |
Weighted Average Contractual Term Remaining (Years) |
Intrinsic Value1 |
|||||||||||
| Balance at February 2, 2014 (100% vested) |
222,488 | $ | 37.11 | |||||||||||
| Granted |
0 | 0 | ||||||||||||
| Exercised |
(115,488 | ) | 35.30 | |||||||||||
| Cancelled |
0 | 0 | ||||||||||||
| Balance at February 1, 2015 (100% vested) |
107,000 | $ | 39.05 | 0.81 | $ | 4,194,000 | ||||||||
| 1 | Intrinsic value for outstanding and vested options is based on the excess of the market value of our common stock on the last business day of the fiscal year (or $78.25) over the exercise price. |
51
Table of Contents
No stock options were granted in fiscal 2014, fiscal 2013 or fiscal 2012. The total intrinsic value of stock options exercised was $3,564,000 for fiscal 2014, $3,834,000 for fiscal 2013 and $5,497,000 for fiscal 2012. Intrinsic value for options exercised is based on the excess of the market value over the exercise price on the date of exercise.
Stock-Settled Stock Appreciation Rights
A stock-settled stock appreciation right is an award that allows the recipient to receive common stock equal to the appreciation in the fair market value of our common stock between the grant date and the conversion date for the number of shares converted.
The following table summarizes our stock-settled stock appreciation right activity during fiscal 2014:
| Shares | Weighted Average Conversion |
Weighted Average Contractual Term |
Intrinsic Value2 |
|||||||||||
| Balance at February 2, 2014 |
1,859,762 | $ | 29.19 | |||||||||||
| Granted |
0 | 0 | ||||||||||||
| Converted into common stock |
(674,338 | ) | 28.47 | |||||||||||
| Cancelled |
(25,476 | ) | 40.19 | |||||||||||
| Balance at February 1, 2015 |
1,159,948 | $ | 29.36 | 3.27 | $ | 56,711,000 | ||||||||
| Vested at February 1, 2015 |
892,712 | $ | 26.06 | 3.29 | $ | 46,590,000 | ||||||||
| Vested plus expected to vest at February 1, 2015 |
1,086,001 | $ | 28.62 | 3.27 | $ | 53,903,000 | ||||||||
| 1 | Conversion price is equal to the market value on the date of grant. |
| 2 | Intrinsic value for outstanding and vested rights is based on the excess of the market value of our common stock on the last business day of the fiscal year (or $78.25) over the conversion price. |
No stock-settled stock appreciation rights were granted in fiscal 2014, fiscal 2013 or fiscal 2012. The total intrinsic value of awards converted to common stock was $26,837,000 for fiscal 2014, $18,046,000 for fiscal 2013 and $31,569,000 for fiscal 2012. Intrinsic value for conversions is based on the excess of the market value over the conversion price on the date of conversion.
Restricted Stock Units
The following table summarizes our restricted stock unit activity during fiscal 2014:
| Shares | Weighted Fair Value |
Weighted Average Contractual Term |
Intrinsic Value1 |
|||||||||||
| Balance at February 2, 2014 |
3,079,651 | $ | 40.11 | |||||||||||
| Granted |
965,217 | 63.18 | ||||||||||||
| Released |
(1,548,779 | ) | 35.12 | |||||||||||
| Cancelled |
(182,612 | ) | 47.87 | |||||||||||
| Balance at February 1, 2015 |
2,313,477 | $ | 52.47 | 2.52 | $ | 181,030,000 | ||||||||
| Vested plus expected to vest at February 1, 2015 |
1,571,376 | $ | 52.70 | 2.61 | $ | 122,960,000 | ||||||||
| 1 | Intrinsic value for outstanding and unvested restricted stock units is based on the market value of our common stock on the last business day of the fiscal year (or $78.25). |
52
Table of Contents
The following table summarizes additional information about restricted stock units:
| Fiscal 2014 | Fiscal 2013 | Fiscal 2012 | ||||||||||
| Weighted average grant date fair value per share of awards granted |
$ | 63.18 | $ | 53.59 | $ | 37.94 | ||||||
| Intrinsic value of awards released 1 |
$ | 101,189,000 | $ | 24,568,000 | $ | 16,730,000 | ||||||
| 1 | Intrinsic value for releases is based on the market value on the date of release. |
Tax Effect
We present tax benefits resulting from the settlement of stock-based awards as operating cash flows in our Consolidated Statements of Cash Flows. Tax deductions in excess of the cumulative compensation cost recognized for stock-based awards settled are presented as a financing cash inflow and an operating cash outflow. During fiscal 2014, fiscal 2013 and fiscal 2012, net proceeds from the exercise of stock-based awards was $4,077,000, $6,614,000 and $14,637,000, respectively, and the current tax benefit related to stock-based awards totaled $52,798,000, $17,940,000 and $21,477,000, respectively.
Note I: Williams-Sonoma, Inc. 401(k) Plan and Other Employee Benefits
We have a defined contribution retirement plan, the Williams-Sonoma, Inc. 401(k) Plan (the “401(k) Plan”), which is intended to be qualified under Internal Revenue Code Sections 401(a), 401(k), 401(m) and 4975(e)(7). The 401(k) Plan permits eligible employees to make salary deferral contributions up to 75% of their eligible compensation each pay period (7% for highly-compensated employees). Employees designate the funds in which their contributions are invested. Each participant may choose to have his or her salary deferral contributions and earnings thereon invested in one or more investment funds, including our company stock fund.
Our matching contribution is equal to 50% of each participant’s salary deferral contribution, taking into account only those contributions that do not exceed 6% of the participant’s eligible pay for the pay period. Each participant’s matching contribution is earned on a semi-annual basis with respect to eligible salary deferrals for those employees that are employed with the company on June 30th or December 31st of the year in which the deferrals are made. Each associate must complete one year of service prior to receiving company matching contributions. For the first five years of the participant’s employment, all matching contributions vest at the rate of 20% per year of service, measuring service from the participant’s hire date. Thereafter, all matching contributions vest immediately. Our contributions to the plan were $6,038,000, $5,538,000 and $5,517,000 in fiscal 2014, fiscal 2013 and fiscal 2012, respectively.
The 401(k) Plan consists of two parts: a profit sharing plan portion and a stock bonus plan/employee stock ownership plan (the “ESOP”). The ESOP portion is the portion that is invested in the Williams-Sonoma, Inc. Stock Fund. The profit sharing and ESOP components of the 401(k) Plan are considered a single plan under Code section 414(l).
We also have a nonqualified executive deferred compensation plan that provides supplemental retirement income benefits for a select group of management. This plan permits eligible employees to make salary and bonus deferrals that are 100% vested. We have an unsecured obligation to pay in the future the value of the deferred compensation adjusted to reflect the performance, whether positive or negative, of selected investment measurement options chosen by each participant during the deferral period. As of February 1, 2015 and February 2, 2014, $14,446,000 and $15,190,000, respectively, is included in other long-term obligations related to these deferred compensation liabilities. Additionally, we have purchased life insurance policies on certain participants to potentially offset these unsecured obligations. The cash surrender value of these policies was $17,422,000 and $16,652,000 as of February 1, 2015 and February 2, 2014, respectively, and is included in other assets, net.
Note J: Commitments and Contingencies
We are involved in lawsuits, claims and proceedings incident to the ordinary course of our business. These disputes, which are not currently material, are increasing in number as our business expands and our company grows larger. We review the need for any loss contingency reserves and establish reserves when, in the opinion
53
Table of Contents
of management, it is probable that a matter would result in liability, and the amount of loss, if any, can be reasonably estimated. In view of the inherent difficulty of predicting the outcome of these matters, it may not be possible to determine whether any loss is probable or to reasonably estimate the amount of the loss until the case is close to resolution, in which case no reserve is established until that time. Any claims against us, whether meritorious or not, could be time consuming, result in costly litigation, require significant amounts of management time and result in the diversion of significant operational resources. The results of these lawsuits, claims and proceedings cannot be predicted with certainty. However, we believe that the ultimate resolution of these current matters will not have a material adverse effect on our consolidated financial statements taken as a whole.
Note K: Stock Repurchase Program and Dividends
During fiscal 2014, we repurchased 3,331,557 shares of our common stock at an average cost of $67.35 per share and a total cost of approximately $224,377,000 under our current $750,000,000 stock repurchase program. As of February 1, 2015, we held treasury stock of $2,140,000 which represents the cost of shares available for issuance in certain foreign jurisdictions as a result of future stock-based award settlements.
During fiscal 2013, we repurchased 4,344,962 shares of our common stock at an average cost of $55.07 per share and a total cost of approximately $239,274,000. During fiscal 2012, we repurchased 3,962,034 shares of our common stock at an average cost of $39.14 per share and a total cost of approximately $155,080,000.
Stock repurchases under this program may be made through open market and privately negotiated transactions at times and in such amounts as management deems appropriate. The timing and actual number of shares repurchased will depend on a variety of factors including price, corporate and regulatory requirements, capital availability and other market conditions. This stock repurchase program does not have an expiration date and may be limited or terminated at any time without prior notice.
Total cash dividends declared in fiscal 2014, fiscal 2013 and fiscal 2012, were approximately $125,378,000, or $1.32 per common share, $121,688,000, or $1.24 per common share and $88,452,000, or $0.88 per common share, respectively. In March 2015, we announced that our Board of Directors had authorized a 6% increase in our quarterly cash dividend, from $0.33 to $0.35 per common share, subject to capital availability. Our quarterly cash dividend may be limited or terminated at any time.
Note L: Segment Reporting
We have two reportable segments, e-commerce (formerly direct-to-customer) and retail. The e-commerce segment has the following merchandising strategies: Williams-Sonoma, Pottery Barn, Pottery Barn Kids, West Elm, PBteen, Williams-Sonoma Home, Rejuvenation and Mark and Graham, which sell our products through our e-commerce websites and direct-mail catalogs. Our e-commerce merchandising strategies are operating segments, which have been aggregated into one reportable segment, e-commerce. The retail segment has the following merchandising strategies: Williams-Sonoma, Pottery Barn, Pottery Barn Kids, West Elm and Rejuvenation, which sell our products through our retail stores. Our retail merchandising strategies are operating segments, which have been aggregated into one reportable segment, retail. Management’s expectation is that the overall economic characteristics of each of our operating segments will be similar over time based on management’s judgment that the operating segments have had similar historical economic characteristics and are expected to have similar long-term financial performance in the future.
These reportable segments are strategic business units that offer similar home-centered products. They are managed separately because the business units utilize two distinct distribution and marketing strategies. Based on management’s best estimate, our operating segments include allocations of certain expenses, including advertising and employment costs, to the extent they have been determined to benefit both channels. These operating segments are aggregated at the channel level for reporting purposes due to the fact that our brands are interdependent for economies of scale and we do not maintain fully allocated income statements at the brand level. As a result, material financial decisions related to the brands are made at the channel level. Furthermore, it is not practicable for us to report revenue by product group.
54
Table of Contents
We use operating income to evaluate segment profitability. Operating income is defined as earnings (loss) before net interest income or expense and income taxes. Unallocated costs before interest and income taxes include corporate employee-related costs, occupancy expenses (including depreciation expense), administrative costs and third party service costs, primarily in our corporate administrative and systems departments. Unallocated assets include corporate cash and cash equivalents, deferred income taxes, the net book value of corporate facilities and related information systems, and other corporate long-lived assets.
Income tax information by reportable segment has not been included as income taxes are calculated at a company-wide level and are not allocated to each reportable segment.
Segment Information
| In thousands | E-commerce | Retail | Unallocated | Total | ||||||||||||
| 2014 (52 Weeks) |
||||||||||||||||
| Net revenues1 |
$ | 2,370,694 | $ | 2,328,025 | $ | 0 | $ | 4,698,719 | ||||||||
| Depreciation and amortization expense |
32,116 | 80,154 | 50,003 | 162,273 | ||||||||||||
| Operating income |
560,396 | 248,535 | (306,666 | ) | 502,265 | |||||||||||
| Assets2 |
600,503 | 1,028,293 | 701,481 | 2,330,277 | ||||||||||||
| Capital expenditures |
41,633 | 97,247 | 65,920 | 204,800 | ||||||||||||
| 2013 (52 Weeks) |
||||||||||||||||
| Net revenues1 |
$ | 2,115,022 | $ | 2,272,867 | $ | 0 | $ | 4,387,889 | ||||||||
| Depreciation and amortization expense |
25,588 | 78,423 | 45,784 | 149,795 | ||||||||||||
| Operating income |
502,143 | 248,894 | (298,939 | ) | 452,098 | |||||||||||
| Assets2 |
517,086 | 975,994 | 843,654 | 2,336,734 | ||||||||||||
| Capital expenditures |
38,195 | 89,331 | 66,427 | 193,953 | ||||||||||||
| 2012 (53 Weeks) |
||||||||||||||||
| Net revenues1 |
$ | 1,869,386 | $ | 2,173,484 | $ | 0 | $ | 4,042,870 | ||||||||
| Depreciation and amortization expense |
23,164 | 72,994 | 38,295 | 134,453 | ||||||||||||
| Operating income |
418,836 | 262,899 | (272,572 | ) | 409,163 | |||||||||||
| Assets2 |
397,285 | 939,672 | 850,722 | 2,187,679 | ||||||||||||
| Capital expenditures |
30,585 | 86,776 | 88,043 | 205,404 | ||||||||||||
| 1 | Includes net revenues of approximately $235.8 million, $215.5 million and $166.6 million in fiscal 2014, fiscal 2013 and fiscal 2012, respectively, related to our foreign operations. |
| 2 | Includes long-term assets of approximately $58.3 million, $61.4 million and $42.6 million in fiscal 2014, fiscal 2013 and fiscal 2012, respectively, related to our foreign operations. |
Note M: Derivative Financial Instruments
We have retail and e-commerce businesses in Canada, Australia and the United Kingdom, and operations throughout Asia and Europe, which expose us to market risk associated with foreign currency exchange rate fluctuations. Substantially all of our purchases and sales are denominated in U.S. dollars, which limits our exposure to this risk. While the impact of foreign currency exchange rate fluctuations was not significant to us in fiscal 2014, we have continued to see volatility in the exchange rates in the countries in which we do business. As we continue to expand globally, the foreign currency exchange risk related to the transactions of our foreign subsidiaries may increase. To mitigate this risk, we hedge a portion of our foreign currency exposure with foreign currency forward contracts in accordance with our risk management policies. We do not enter into such contracts for speculative purposes.
The assets or liabilities associated with the derivative instruments are measured at fair value and recorded in either other current assets or other current liabilities. As discussed below, the accounting for gains and losses resulting from changes in fair value depends on whether the derivative instrument is designated as a hedge and qualifies for hedge accounting in accordance with ASC 815, Derivatives and Hedging.
55
Table of Contents
Cash Flow Hedges
We enter into foreign currency forward contracts designated as cash flow hedges for forecasted inventory purchases in U.S. dollars by our foreign subsidiaries. These hedges generally have terms of up to 12 months. All hedging relationships are formally documented, and the forward contracts are designed to mitigate foreign currency exchange risk on hedged transactions. We record the effective portion of changes in the fair value of our cash flow hedges in other comprehensive income (“OCI”) until the earlier of when the hedged forecasted inventory purchase occurs or the respective contract reaches maturity. Subsequently, as the inventory is sold to the customer, we reclassify amounts previously recorded in OCI to cost of goods sold. Changes in the fair value of the forward contract related to interest charges or “forward points” are excluded from the assessment and measurement of hedge effectiveness and are recorded immediately in other income (expense), net. Based on the rates in effect as of February 1, 2015, we expect to reclassify a net gain of approximately $1,321,000 from OCI to cost of goods sold over the next 12 months.
We also enter into non-designated foreign currency forward contracts to reduce the exchange risk associated with our assets and liabilities denominated in a foreign currency. Any foreign exchange gains (losses) related to these contracts are recognized in other income (expense), net.
As of February 1, 2015, and February 2, 2014, we had foreign currency forward contracts outstanding (in U.S. dollars) as follows:
| In thousands | Feb. 1, 2015 | Feb. 2, 2014 | ||||||
| Contracts to sell Canadian dollars and buy U.S. dollars |
||||||||
| Contracts designated as cash flow hedges |
$ | 15,900 | $ | 16,500 | ||||
| Contracts not designated as cash flow hedges 1 |
$ | 0 | $ | 3,500 | ||||
| Contracts to sell Australian dollars and buy U.S. dollars |
||||||||
| Contracts not designated as cash flow hedges |
$ | 21,000 | $ | 5,500 | ||||
| 1 | These contracts are no longer designated as cash flow hedges as the related inventory purchases have occurred. |
Hedge effectiveness is evaluated prospectively at inception, on an ongoing basis, as well as retrospectively using regression analysis. Any measureable ineffectiveness of the hedge is recorded in other income (expense), net. During fiscal 2014 and fiscal 2013, no gain or loss was recognized for cash flow hedges due to hedge ineffectiveness. All hedges were deemed effective for assessment purposes as of February 1, 2015 and February 2, 2014.
The effect of derivative instruments in our Consolidated Financial Statements, pre tax, was as follows:
| In thousands | Fiscal 2014 (52 Weeks) |
Fiscal 2013 (52 Weeks) |
||||||
| Net gain recognized in OCI |
$ | 1,153 | $ | 870 | ||||
| Net gain reclassified from OCI into cost of goods sold |
$ | 573 | $ | 129 | ||||
| Net foreign exchange gain (loss) recognized in other income (expense): |
||||||||
| Instruments designated as cash flow hedges1 |
$ | (155 | ) | $ | (109 | ) | ||
| Instruments not designated or de-designated2 |
$ | (1,795 | ) | $ | 906 | |||
| 1 | Changes in fair value of the forward contract related to interest charges or “forward points.” |
| 2 | Changes in fair value subsequent to de-designation for instruments no longer designated as cash flow hedges, and changes in fair value related to instruments not designated as cash flow hedges. |
56
Table of Contents
The fair values of our derivative financial instruments are presented below. All fair values were measured using Level 2 inputs as defined by the fair value hierarchy described in Note N.
| In thousands | Balance sheet location | Feb. 1, 2015 | Feb. 2, 2014 | |||||||||
| Derivatives designated as hedging instruments: |
||||||||||||
| Cash flow hedge foreign currency forward contracts |
Other current assets | $ | 1,015 | $ | 485 | |||||||
| Cash flow hedge foreign currency forward contracts |
Other current liabilities | (9 | ) | 0 | ||||||||
| Total, net |
$ | 1,006 | $ | 485 | ||||||||
| Derivatives not designated as hedging instruments: |
||||||||||||
| Foreign currency forward contracts |
Other current assets | $ | 427 | $ | 222 | |||||||
| Foreign currency forward contracts |
Other current liabilities | 0 | (40 | ) | ||||||||
| Total, net |
$ | 427 | $ | 182 | ||||||||
We record all derivative assets and liabilities on a gross basis. They do not meet the balance sheet netting criteria as discussed in ASC 210, Balance Sheet, because we do not have master netting agreements established with our derivative counterparties that would allow for net settlement.
Amounts recorded within accumulated other comprehensive income (“AOCI”) associated with our derivative instruments, pre-tax, were as follows:
| In thousands | Fiscal 2014 (52 Weeks) |
Fiscal 2013 (52 Weeks) |
||||||
| AOCI beginning balance amount of gain (loss) |
$ | 741 | $ | 0 | ||||
| Amounts recognized in OCI before reclassifications |
1,153 | 870 | ||||||
| Amounts reclassified from OCI into cost of goods sold |
(573 | ) | (129 | ) | ||||
| AOCI ending balance amount of gain (loss) |
$ | 1,321 | $ | 741 | ||||
Note N: Fair Value Measurements
Fair value is the price that would be received from selling an asset or paid to transfer a liability in an orderly transaction between market participants at the measurement date.
We determine the fair value of financial and non-financial assets and liabilities using the fair value hierarchy established by ASC 820, Fair Value Measurement, which defines three levels of inputs that may be used to measure fair value, as follows:
| • | Level 1: inputs which include quoted prices in active markets for identical assets or liabilities; |
| • | Level 2: inputs which include observable inputs other than Level 1 inputs, such as quoted prices in active markets for similar assets or liabilities; quoted prices for identical or similar assets or liabilities in markets that are not active; or other inputs that are observable or can be corroborated by observable market data for substantially the full term of the asset or liability; and |
| • | Level 3: inputs which include unobservable inputs that are supported by little or no market activity and that are significant to the fair value of the underlying asset or liability. |
The fair values of our cash and cash equivalents are based on Level 1 inputs, which include quoted prices in active markets for identical assets.
Foreign Currency Derivatives and Hedging Instruments
We use the income approach to value our derivatives using observable Level 2 market data at the measurement date and standard valuation techniques to convert future amounts to a single present value amount, assuming that participants are motivated but not compelled to transact. Level 2 inputs are limited to quoted prices that are
57
Table of Contents
observable for the assets and liabilities, which include interest rates and credit risk ratings. We use mid-market pricing as a practical expedient for fair value measurements. Key inputs for currency derivatives are the spot rates, forward rates, interest rates and credit derivative market rates.
The counterparties associated with our foreign currency forward contracts are large credit-worthy financial institutions, and the derivatives transacted with these entities are relatively short in duration, therefore, we do not consider counterparty concentration and non-performance to be material risks at this time. Both we and our counterparties are expected to perform under the contractual terms of the instruments. None of the derivative contracts entered into are subject to credit risk-related contingent features or collateral requirements.
There were no transfers between Level 1 and Level 2 categories during fiscal 2014.
58
Table of Contents
REPORT OF INDEPENDENT REGISTERED PUBLIC ACCOUNTING FIRM
To the Board of Directors and Stockholders of Williams-Sonoma, Inc.:
We have audited the accompanying consolidated balance sheets of Williams-Sonoma, Inc. and subsidiaries (the “Company”) as of February 1, 2015 and February 2, 2014, and the related consolidated statements of earnings, comprehensive income, stockholders’ equity, and cash flows for each of the three years in the period ended February 1, 2015. We also have audited the Company’s internal control over financial reporting as of February 1, 2015, based on criteria established in Internal Control — Integrated Framework (2013) issued by the Committee of Sponsoring Organizations of the Treadway Commission. The Company’s management is responsible for these consolidated financial statements, for maintaining effective internal control over financial reporting, and for its assessment of the effectiveness of internal control over financial reporting, included in the accompanying “Management’s Report on Internal Control Over Financial Reporting.” Our responsibility is to express an opinion on these consolidated financial statements and an opinion on the Company’s internal control over financial reporting based on our audits.
We conducted our audits in accordance with the standards of the Public Company Accounting Oversight Board (United States). Those standards require that we plan and perform the audit to obtain reasonable assurance about whether the financial statements are free of material misstatement and whether effective internal control over financial reporting was maintained in all material respects. Our audits of the financial statements included examining, on a test basis, evidence supporting the amounts and disclosures in the financial statements, assessing the accounting principles used and significant estimates made by management, and evaluating the overall financial statement presentation. Our audit of internal control over financial reporting included obtaining an understanding of internal control over financial reporting, assessing the risk that a material weakness exists, and testing and evaluating the design and operating effectiveness of internal control based on the assessed risk. Our audits also included performing such other procedures as we considered necessary in the circumstances. We believe that our audits provide a reasonable basis for our opinions.
A company’s internal control over financial reporting is a process designed by, or under the supervision of, the company’s principal executive and principal financial officers, or persons performing similar functions, and effected by the company’s board of directors, management, and other personnel to provide reasonable assurance regarding the reliability of financial reporting and the preparation of financial statements for external purposes in accordance with generally accepted accounting principles. A company’s internal control over financial reporting includes those policies and procedures that (1) pertain to the maintenance of records that, in reasonable detail, accurately and fairly reflect the transactions and dispositions of the assets of the company; (2) provide reasonable assurance that transactions are recorded as necessary to permit preparation of financial statements in accordance with generally accepted accounting principles, and that receipts and expenditures of the company are being made only in accordance with authorizations of management and directors of the company; and (3) provide reasonable assurance regarding prevention or timely detection of unauthorized acquisition, use, or disposition of the company’s assets that could have a material effect on the financial statements.
Because of the inherent limitations of internal control over financial reporting, including the possibility of collusion or improper management override of controls, material misstatements due to error or fraud may not be prevented or detected on a timely basis. Also, projections of any evaluation of the effectiveness of the internal control over financial reporting to future periods are subject to the risk that the controls may become inadequate because of changes in conditions, or that the degree of compliance with the policies or procedures may deteriorate.
59
Table of Contents
In our opinion, the consolidated financial statements referred to above present fairly, in all material respects, the financial position of Williams-Sonoma, Inc. and subsidiaries as of February 1, 2015 and February 2, 2014, and the results of their operations and their cash flows for each of the three years in the period ended February 1, 2015, in conformity with accounting principles generally accepted in the United States of America. Also, in our opinion, the Company maintained, in all material respects, effective internal control over financial reporting as of February 1, 2015, based on the criteria established in Internal Control — Integrated Framework (2013) issued by the Committee of Sponsoring Organizations of the Treadway Commission.
/s/ DELOITTE & TOUCHE LLP
San Francisco, California
April 2, 2015
60
Table of Contents
Quarterly Financial Information (Unaudited)
| In thousands, except per share amounts | ||||||||||||||||||||
| Fiscal 2014 (52 Weeks) |
|
First Quarter |
|
|
Second Quarter |
|
|
Third Quarter |
|
|
Fourth Quarter |
|
|
Full Year |
| |||||
| Net revenues |
$974,330 | $ | 1,039,102 | $ | 1,143,162 | $ | 1,542,125 | $ | 4,698,719 | |||||||||||
| Gross profit |
368,408 | 382,098 | 431,407 | 618,591 | 1,800,504 | |||||||||||||||
| Operating income |
74,326 | 85,336 | 104,720 | 237,883 | 502,265 | |||||||||||||||
| Net earnings |
46,162 | 50,747 | 64,908 | 147,037 | 308,854 | |||||||||||||||
| Basic earnings per share1 |
$ 0.49 | $ | 0.54 | $ | 0.70 | $ | 1.60 | $ | 3.30 | |||||||||||
| Diluted earnings per share1 |
$ 0.48 | $ | 0.53 | $ | 0.68 | $ | 1.57 | $ | 3.24 | |||||||||||
| Fiscal 2013 (52 Weeks) |
|
First Quarter |
|
|
Second Quarter |
|
|
Third Quarter |
|
|
Fourth Quarter |
|
|
Full Year |
| |||||
| Net revenues |
$887,808 | $ | 982,209 | $ | 1,051,548 | $ | 1,466,324 | $ | 4,387,889 | |||||||||||
| Gross profit |
334,185 | 368,924 | 405,388 | 595,719 | 1,704,216 | |||||||||||||||
| Operating income |
63,783 | 78,086 | 92,494 | 217,735 | 452,098 | |||||||||||||||
| Net earnings |
39,466 | 48,919 | 56,719 | 133,798 | 278,902 | |||||||||||||||
| Basic earnings per share1 |
$ 0.40 | $ | 0.50 | $ | 0.59 | $ | 1.42 | $ | 2.89 | |||||||||||
| Diluted earnings per share1 |
$ 0.40 | $ | 0.49 | $ | 0.58 | $ | 1.38 | $ | 2.82 | |||||||||||
| 1 | Due to differences between quarterly and full year weighted average share count calculations, and the effect of quarterly rounding to the nearest cent per share, full year earnings per share may not equal the sum of the quarters. |
| ITEM 9. | CHANGES IN AND DISAGREEMENTS WITH ACCOUNTANTS ON ACCOUNTING AND FINANCIAL DISCLOSURE |
None.
| ITEM 9A. | CONTROLS AND PROCEDURES |
Evaluation of Disclosure Controls and Procedures
As of February 1, 2015, an evaluation was performed by management, with the participation of our Chief Executive Officer (“CEO”) and our Chief Financial Officer (“CFO”), of the effectiveness of our disclosure controls and procedures. Based on that evaluation, our management, including our CEO and CFO, concluded that our disclosure controls and procedures are effective to ensure that information we are required to disclose in reports that we file or submit under the Securities Exchange Act of 1934 is accumulated and communicated to our management, including our CEO and CFO, as appropriate, to allow for timely discussions regarding required disclosures, and that such information is recorded, processed, summarized and reported within the time periods specified in the rules and forms of the SEC.
Management’s Report on Internal Control Over Financial Reporting
Our management is responsible for establishing and maintaining adequate internal control over the company’s financial reporting. There are inherent limitations in the effectiveness of any internal control, including the possibility of human error and the circumvention or overriding of controls. Accordingly, even effective internal control can provide only reasonable assurance with respect to the reliability of financial reporting and the preparation of our financial statements in accordance with generally accepted accounting principles. Further, because of changes in conditions, the effectiveness of any internal control may vary over time.
Our management assessed the effectiveness of the company’s internal control over financial reporting as of February 1, 2015. In making this assessment, we used the criteria set forth by the Committee of Sponsoring Organizations of the Treadway Commission (COSO) in Internal Control-Integrated Framework (2013). Based
61
Table of Contents
on our assessment using those criteria, our management concluded that, as of February 1, 2015, our internal control over financial reporting is effective.
Our independent registered public accounting firm audited the Consolidated Financial Statements included in this Annual Report on Form 10-K and the Company’s internal control over financial reporting. Their audit report appears on pages 59 through 60 of this Annual Report on Form 10-K.
Changes in Internal Control Over Financial Reporting
There was no change in our internal control over financial reporting that occurred during our most recent fiscal quarter that has materially affected, or is reasonably likely to materially affect, our internal control over financial reporting.
| ITEM 9B. | OTHER INFORMATION |
None.
62
Table of Contents
| ITEM 10. | DIRECTORS, EXECUTIVE OFFICERS AND CORPORATE GOVERNANCE |
Information required by this Item is incorporated by reference herein to information under the headings “Election of Directors,” “Information Concerning Executive Officers,” “Audit and Finance Committee Report,” “Corporate Governance—Corporate Governance Guidelines and Code of Business Conduct and Ethics,” “Corporate Governance—Audit and Finance Committee” and “Section 16(a) Beneficial Ownership Reporting Compliance” in our Proxy Statement.
| ITEM 11. | EXECUTIVE COMPENSATION |
Information required by this Item is incorporated by reference herein to information under the headings “Corporate Governance—Compensation Committee,” “Corporate Governance—Director Compensation,” and “Executive Compensation” in our Proxy Statement.
| ITEM 12. | SECURITY OWNERSHIP OF CERTAIN BENEFICIAL OWNERS AND MANAGEMENT AND RELATED STOCKHOLDER MATTERS |
Information required by this Item is incorporated by reference herein to information under the headings “Security Ownership of Principal Stockholders and Management” and “Equity Compensation Plan Information” in our Proxy Statement.
| ITEM 13. | CERTAIN RELATIONSHIPS AND RELATED TRANSACTIONS, AND DIRECTOR INDEPENDENCE |
Information required by this Item is incorporated by reference herein to information under the heading “Certain Relationships and Related Transactions” in our Proxy Statement.
| ITEM 14. | PRINCIPAL ACCOUNTANT FEES AND SERVICES |
Information required by this Item is incorporated by reference herein to information under the headings “Committee Reports–Audit and Finance Committee Report” and “Proposal 4—Ratification of Selection of Independent Registered Public Accounting Firm—Deloitte Fees and Services” in our Proxy Statement.
63
Table of Contents
| ITEM 15. | EXHIBITS AND FINANCIAL STATEMENT SCHEDULES |
| (a)(1) | Financial Statements: |
The following Consolidated Financial Statements of Williams-Sonoma, Inc. and subsidiaries and the related notes are filed as part of this report pursuant to Item 7:
Consolidated Statements of Earnings for the fiscal years ended February 1, 2015, February 2, 2014 and February 3, 2013
Consolidated Statements of Comprehensive Income for the fiscal years ended February 1, 2015, February 2, 2014 and February 3, 2013
Consolidated Balance Sheets as of February 1, 2015 and February 2, 2014
Consolidated Statements of Stockholders’ Equity for the fiscal years ended February 1, 2015, February 2, 2014 and February 3, 2013
Consolidated Statements of Cash Flows for the fiscal years ended February 1, 2015, February 2, 2014 and February 3, 2013
Notes to Consolidated Financial Statements
Report of Independent Registered Public Accounting Firm
Quarterly Financial Information
| (a)(2) | Financial Statement Schedules: Schedules have been omitted because they are not required or because the required information, where material, is included in the financial statements, notes, or supplementary financial information. |
| (a)(3) | Exhibits: See Exhibit Index on pages 66 through 71. |
| (b) | Exhibits: See Exhibit Index on pages 66 through 71. |
| (c) | Financial Statement Schedules: Schedules have been omitted because they are not required or are not applicable. |
64
Table of Contents
SIGNATURES
Pursuant to the requirements of Section 13 or 15(d) of the Securities Exchange Act of 1934, the registrant has duly caused this report to be signed on its behalf by the undersigned, thereunto duly authorized.
| WILLIAMS-SONOMA, INC. | ||||||||
| Date: April 2, 2015 |
By | /s/ LAURA J. ALBER | ||||||
| Chief Executive Officer | ||||||||
Pursuant to the requirements of the Securities Exchange Act of 1934, as amended, this report has been signed below by the following persons on behalf of the registrant and in the capacities and on the dates indicated.
| Date: April 2, 2015 | /s/ ADRIAN D.P. BELLAMY | |
| Adrian D.P. Bellamy | ||
| Chairman of the Board of Directors | ||
| Date: April 2, 2015 | /s/ LAURA J. ALBER | |
| Laura J. Alber | ||
| Chief Executive Officer | ||
| (principal executive officer) | ||
| Date: April 2, 2015 | /s/ JULIE P. WHALEN | |
| Julie P. Whalen | ||
| Chief Financial Officer | ||
| (principal financial officer and principal accounting officer) | ||
| Date: April 2, 2015 | /s/ ROSE MARIE BRAVO | |
| Rose Marie Bravo | ||
| Director | ||
| Date: April 2, 2015 | /s/ PATRICK J. CONNOLLY | |
| Patrick J. Connolly | ||
| Director | ||
| Date: April 2, 2015 | /s/ ADRIAN T. DILLON | |
| Adrian T. Dillon | ||
| Director | ||
| Date: April 2, 2015 | /s/ ANTHONY A. GREENER | |
| Anthony A. Greener | ||
| Director | ||
| Date: April 2, 2015 | /s/ TED W. HALL | |
| Ted W. Hall | ||
| Director | ||
| Date: April 2, 2015 | /s/ MICHAEL R. LYNCH | |
| Michael R. Lynch | ||
| Director | ||
| Date: April 2, 2015 | /s/ SABRINA SIMMONS | |
| Sabrina Simmons | ||
| Director | ||
| Date: April 2, 2015 | /s/ LORRAINE TWOHILL | |
| Lorraine Twohill | ||
| Director | ||
65
Table of Contents
EXHIBIT INDEX TO ANNUAL REPORT ON FORM 10-K
FOR THE
FISCAL YEAR ENDED FEBRUARY 1, 2015
| EXHIBIT NUMBER | EXHIBIT DESCRIPTION | |
| CERTIFICATE OF INCORPORATION AND BYLAWS | ||
| 3.1 | Amended and Restated Certificate of Incorporation (incorporated by reference to Exhibit 3.1 to the Company’s Current Report on Form 8-K as filed with the Commission on May 25, 2011, File No. 001-14077) | |
| 3.2 | Amended and Restated Bylaws (incorporated by reference to Exhibit 3.2 to the Company’s Current Report on Form 8-K as filed with the Commission on May 25, 2011, File No. 001-14077) | |
| INSTRUMENTS DEFINING THE RIGHTS OF SECURITY HOLDERS, INCLUDING INDENTURES | ||
| 4.1 | Form of Common Stock Certificate (incorporated by reference to Exhibit 4.1 to the Company’s Current Report on Form 8-K as filed with the Commission on May 25, 2011, File No. 001-14077) | |
| FINANCING AGREEMENTS | ||
| 10.1* | Sixth Amended and Restated Credit Agreement, dated November 19, 2014, between the Company and Bank of America, N.A., as administrative agent, letter of credit issuer and swingline lender, Wells Fargo Bank, National Association, as syndication agent, JPMorgan Chase Bank, N.A., MUFG Union Bank, NA and U.S. Bank, National Association, as co-documentation agents, and the lenders party thereto | |
| 10.2 | Reimbursement Agreement between the Company, Williams-Sonoma Singapore Pte. Ltd. and Bank of America, N.A., dated as of August 30, 2013 (incorporated by reference to Exhibit 10.1 to the Company’s Quarterly Report on Form 10-Q for the period ended November 3, 2013 as filed with the Commission on December 12, 2013, File No. 001-14077) | |
| 10.3 | First Amendment to Reimbursement Agreement between the Company, Williams-Sonoma Singapore Pte. Ltd. and Bank of America, N.A., dated as of August 29, 2014 (incorporated by reference to Exhibit 10.1 to the Company’s Quarterly Report on Form 10-Q for the period ended November 2, 2014 as filed with the Commission on December 5, 1014, File No. 001-14077) | |
| 10.4 | Reimbursement Agreement between the Company, Williams-Sonoma Singapore Pte. Ltd. and Wells Fargo Bank, N.A., dated as of August 30, 2013 (incorporated by reference to Exhibit 10.2 to the Company’s Quarterly Report on Form 10-Q for the period ended November 3, 2013 as filed with the Commission on December 12, 2013, File No. 001-14077) | |
| 10.5 | First Amendment to Reimbursement Agreement between the Company, Williams-Sonoma Singapore Pte. Ltd. and Wells Fargo Bank, N.A., dated as of August 29, 2014 (incorporated by reference to Exhibit 10.2 to the Company’s Quarterly Report on Form 10-Q for the period ended November 2, 2014 as filed with the Commission on December 5, 2014, File No. 001-14077) | |
| 10.6 | Reimbursement Agreement between the Company, Williams-Sonoma Singapore Pte. Ltd. and U.S. Bank National Association, dated as of August 30, 2013 (incorporated by reference to Exhibit 10.3 to the Company’s Quarterly Report on Form 10-Q for the fiscal quarter ended November 3, 2013 as filed with the Commission on December 12, 2013, File No. 001-14077) | |
66
Table of Contents
| EXHIBIT NUMBER | EXHIBIT DESCRIPTION | |
| 10.7 | First Amendment to Reimbursement Agreement between the Company, Williams-Sonoma Singapore Pte. Ltd. and U.S. Bank National Association, dated as of August 29, 2014 (incorporated by reference to Exhibit 10.3 to the Company’s Quarterly Report on Form 10-Q for the fiscal quarter ended November 2, 2014 as filed with the Commission on December 5, 2014, File No. 001-14077) | |
| STOCK PLANS | ||
| 10.8+ | Williams-Sonoma, Inc. 2000 Nonqualified Stock Option Plan (incorporated by reference to Exhibit 4 to the Company’s Registration Statement on Form S-8 as filed with the Commission on October 27, 2000, File No. 333-48750) | |
| 10.9+ | Williams-Sonoma, Inc. 2001 Long-Term Incentive Plan, as amended (incorporated by reference to Exhibit D to the Company’s definitive proxy statement on Schedule A as filed on April 7, 2011, File No. 001-14077) | |
| 10.10+ | Forms of Notice of Grant and Stock Option Agreement under the Company’s 2000 Nonqualified Stock Option Plan and 2001 Long-Term Incentive Plan (incorporated by reference to Exhibit 10.2 to the Company’s Quarterly Report on Form 10-Q for the period ended October 31, 2004 as filed with the Commission on December 10, 2004, File No. 001-14077) | |
| 10.11+ | Form of Williams-Sonoma, Inc. 2001 Long-Term Incentive Plan Stock-Settled Stock Appreciation Right Award Agreement for Director Grants (incorporated by reference to Exhibit 10.31 to the Company’s Annual Report on Form 10-K for the fiscal year ended February 3, 2008 as filed with the Commission on April 3, 2008, File No. 001-14077) | |
| 10.12+ | Form of Williams-Sonoma, Inc. 2001 Long-Term Incentive Plan Stock-Settled Stock Appreciation Right Award Agreement for Employee Grants (incorporated by reference to Exhibit 10.2 to the Company’s Current Report on Form 8-K filed with the Commission on March 22, 2010, File No. 001-14077) | |
| 10.13+ | Williams-Sonoma, Inc. 2001 Long-Term Incentive Plan Stock-Settled Stock Appreciation Right Award Agreement for CEO Grant (incorporated by reference to Exhibit 10.38 to the Company’s Annual Report on Form 10-K for the fiscal year ended February 1, 2009 as filed with the Commission on April 2, 2009, File No. 001-14077) | |
| 10.14+ | Form of Williams-Sonoma, Inc. 2001 Long-Term Incentive Plan Restricted Stock Unit Award Agreement for Grants to Non-Employee Directors (incorporated by reference to Exhibit 10.1 to the Company’s Quarterly Report on Form 10-Q for the period ended May 4, 2014 as filed with the Commission on June 12, 2014, File No. 001-14077) | |
| 10.15+ | Form of Williams-Sonoma, Inc. 2001 Long-Term Incentive Plan Restricted Stock Unit Award Agreement for Grants to Employees (incorporated by reference to Exhibit 10.2 to the Company’s Quarterly Report on Form 10-Q for the period ended May 4, 2014 as filed with the Commission on June 12, 2014, File No. 001-14077) | |
| 10.16+ | Form of Williams-Sonoma, Inc. 2001 Long Term Incentive Plan Performance Stock Unit Award Agreement for Grants to Employees (incorporated by reference to Exhibit 10.15 to the Company’s Annual Report on Form 10-K for the fiscal year ended February 2, 2014 as filed with the Commission on April 3, 2014, File No. 001-14077) | |
67
Table of Contents
| EXHIBIT NUMBER | EXHIBIT DESCRIPTION | |
| OTHER INCENTIVE PLANS | ||
| 10.17+ | Williams-Sonoma, Inc. 2001 Incentive Bonus Plan, as amended (incorporated by reference to the Company’s Definitive Proxy Statement on Schedule 14A as filed with the Commission on April 6, 2012, File No. 001-14077) | |
| 10.18+ | Williams-Sonoma, Inc. Pre-2005 Executive Deferral Plan (incorporated by reference to Exhibit 10.40 to the Company’s Annual Report on Form 10-K for the fiscal year ended February 1, 2009 as filed with the Commission on April 2, 2009, File No. 001-14077) | |
| 10.19+* | Williams-Sonoma, Inc. Amended and Restated Executive Deferred Compensation Plan | |
| 10.20+ | Williams-Sonoma, Inc. 401(k) Plan, as amended and restated effective January 1, 2002, except as otherwise noted, and including amendments effective through August 1, 2007 (incorporated by reference to Exhibit 10.34 to the Company’s Annual Report on Form 10-K for the fiscal year ended February 3, 2008 as filed with the Commission on April 3, 2008, File No. 001-14077) | |
| 10.21+ | Amendment to the Williams-Sonoma, Inc. 401(k) Plan dated November 6, 2008 (incorporated by reference to Exhibit 10.43 to the Company’s Annual Report on Form 10-K for the fiscal year ended February 1, 2009 as filed with the Commission on April 2, 2009, File No. 001-14077) | |
| 10.22+ | January 2009 Amendment to the Williams-Sonoma, Inc. 401(k) Plan dated January 20, 2009 (incorporated by reference to Exhibit 10.44 to the Company’s Annual Report on Form 10-K for the fiscal year ended February 1, 2009 as filed with the Commission on April 2, 2009, File No. 001-14077) | |
| PROPERTIES | ||
| 10.23 | Warehouse – Distribution Facility lease dated July 1, 1983, between the Company as lessee and the Lester-McMahan Partnership as lessor (incorporated by reference to Exhibit 10.1 to the Company’s Quarterly Report on Form 10-Q for the period ended September 30, 1983 as filed with the Commission on October 14, 1983, File No. 000-12704) | |
| 10.24 | First Amendment, dated December 1, 1985, to the Warehouse – Distribution Facility lease dated July 1, 1983, between the Company as lessee and the Lester-McMahan Partnership as lessor (incorporated by reference to Exhibit 10.48 to the Company’s Annual Report on Form 10-K for the fiscal year ended February 2, 1986 as filed with the Commission on May 2, 1986, File No. 000-12704) | |
| 10.25 | Second Amendment, dated December 1, 1993, to the Warehouse – Distribution Facility lease dated July 1, 1983 between the Company as lessee and the Lester-McMahan Partnership as lessor (incorporated by reference to Exhibit 10.27 to the Company’s Annual Report on Form 10-K for the fiscal year ended January 30, 1994 as filed with the Commission on April 29, 1994, File No. 000-12704) | |
| 10.26 | Sublease for the Distribution Facility at 4600 and 4650 Sonoma Cove, Memphis, Tennessee, dated as of August 1, 1990, by and between Hewson-Memphis Partners and the Company (incorporated by reference to Exhibit 10 to the Company’s Quarterly Report on Form 10-Q for the period ended October 28, 1990 as filed with the Commission on December 12, 1990, File No. 000-12704) | |
68
Table of Contents
| EXHIBIT NUMBER | EXHIBIT DESCRIPTION | |
| 10.27 | First Amendment, dated December 22, 1993, to Sublease for the Distribution Facility at 4600 and 4650 Sonoma Cove, Memphis, Tennessee between the Company and Hewson-Memphis Partners, dated as of August 1, 1990 (incorporated by reference to Exhibit 10.7 to the Company’s Annual Report on Form 10-K for the fiscal year ended January 28, 2001 as filed with the Commission on April 26, 2001, File No. 001-14077) | |
| 10.28 | Second Amendment, dated September 1, 1994, to Sublease for the Distribution Facility at 4600 and 4650 Sonoma Cove, Memphis, Tennessee, dated as of August 1, 1990 between the Company and Hewson-Memphis Partners (incorporated by reference to Exhibit 10.38 to the Company’s Quarterly Report on Form 10-Q for the period ended October 30, 1994 as filed with the Commission on December 13, 1994, File No. 000-12704) | |
| 10.29 | Third Amendment, dated October 24, 1995, to Sublease for the Distribution Facility at 4600 and 4650 Sonoma Cove, Memphis, Tennessee, dated as of August 1, 1990 between the Company and Hewson-Memphis Partners (incorporated by reference to Exhibit 10.2E to the Company’s Quarterly Report on Form 10-Q for the period ended October 29, 1995 as filed with the Commission on December 13, 1995, File No. 000-12704) | |
| 10.30 | Fourth Amendment, dated February 1, 1996, to Sublease for the Distribution Facility at 4600 and 4650 Sonoma Cove, Memphis, Tennessee, dated as of August 1, 1990 between the Company and Hewson-Memphis Partners (incorporated by reference to Exhibit 10.16 to the Company’s Annual Report on Form 10-K for the fiscal year ended January 28, 2001 as filed with the Commission on April 26, 2001, File No. 001-14077) | |
| 10.31 | Fifth Amendment to Sublease, dated March 1, 1999, incorrectly titled Fourth Amendment to Sublease for the Distribution Facility at 4600 and 4650 Sonoma Cove, Memphis, Tennessee, dated as of August 1, 1990 between the Company and Hewson-Memphis Partners (incorporated by reference to Exhibit 10.43 to the Company’s Annual Report on Form 10-K for the fiscal year ended February 3, 2002 as filed with the Commission on April 29, 2002, File No. 001-14077) | |
| 10.32 | Memorandum of Understanding between the Company and the State of Mississippi, Mississippi Business Finance Corporation, Desoto County, Mississippi, the City of Olive Branch, Mississippi and Hewson Properties, Inc., dated August 24, 1998 (incorporated by reference to Exhibit 10.6 to the Company’s Quarterly Report on Form 10-Q for the period ended August 2, 1998 as filed with the Commission on September 14, 1998, File No. 001-14077) | |
| 10.33 | Olive Branch Distribution Facility Lease, dated December 1, 1998, between the Company as lessee and WSDC, LLC (the successor-in-interest to Hewson/Desoto Phase I, L.L.C.) as lessor (incorporated by reference to Exhibit 10.3D to the Company’s Annual Report on Form 10-K for the fiscal year ended January 31, 1999 as filed with the Commission on April 30, 1999, File No. 001-14077) | |
| 10.34 | First Amendment, dated September 1, 1999, to the Olive Branch Distribution Facility Lease between the Company as lessee and WSDC, LLC (the successor-in-interest to Hewson/Desoto Phase I, L.L.C.) as lessor, dated December 1, 1998 (incorporated by reference to Exhibit 10.3B to the Company’s Annual Report on Form 10-K for the fiscal year ended January 30, 2000 as filed with the Commission on May 1, 2000, File No. 001-14077) | |
69
Table of Contents
| EXHIBIT NUMBER | EXHIBIT DESCRIPTION | |
| 10.35 | Lease for an additional Company distribution facility located in Olive Branch, Mississippi between Williams-Sonoma Retail Services, Inc. as lessee and SPI WS II, LLC (the successor-in-interest to Hewson/Desoto Partners, L.L.C.) as lessor, dated November 15, 1999 (incorporated by reference to Exhibit 10.14 to the Company’s Annual Report on Form 10-K for the fiscal year ended January 30, 2000 as filed with the Commission on May 1, 2000, File No. 001-14077) | |
| EMPLOYMENT AGREEMENTS | ||
| 10.36+ | Amended and Restated Employment Agreement with Laura Alber, dated September 6, 2012 (incorporated by reference to Exhibit 10.4 to the Company’s Quarterly Report on Form 10-Q for the period ended October 28, 2012 as filed with the Commission December 7, 2012, File No. 001-14077) | |
| 10.37+ | Amended and Restated Management Retention Agreement with Laura Alber, dated September 6, 2012 (incorporated by reference to Exhibit 10.5 to the Company’s Quarterly Report on Form 10-Q for the period ended October 28, 2012 as filed with the Commission December 7, 2012, File No. 001-14077) | |
| 10.38+ | Form of Management Retention Agreement for Executive Vice Presidents and Brand Presidents, approved May 25, 2010 (incorporated by reference to Exhibit 10.2 to the Company’s Current Report on Form 8-K as filed with the Commission on June 1, 2010, File No. 001-14077) | |
| 10.39+ | Form of Management Retention Agreement for Senior Vice Presidents, approved May 25, 2010 (incorporated by reference to Exhibit 10.67 to the Company’s Annual Report on Form 10-K for the fiscal year ended January 30, 2011 as filed with the Commission on March 31, 2011, File No. 001-14077) | |
| 10.40+ | 2012 EVP Level Management Retention Plan (incorporated by reference to Exhibit 10.63 to the Company’s Annual Report on Form 10-K for the fiscal year ended February 3, 2013 as filed with the Commission on April 4, 2013, File No. 001-14077) | |
| 10.41+ | Separation Agreement and General Release with Richard Harvey dated May 3, 2013 (incorporated by reference to Exhibit 10.3 to the Company’s Quarterly Report on Form 10-Q for the period ended May 5, 2013 as filed with the Commission on June 14, 2013, File No. 001-14077) | |
| 10.42+ | Employment Agreement with Janet Hayes, dated August 9, 2013 (incorporated by reference to Exhibit 10.42 to the Company’s Annual Report on Form 10-K for the fiscal year ended February 2, 2014 as filed with the Commission on April 3, 2014, File No. 001-14077) | |
| OTHER AGREEMENTS | ||
| 10.43+ | Form of Williams-Sonoma, Inc. Indemnification Agreement (incorporated by reference to Exhibit 10.1 to the Company’s Quarterly Report on Form 10-Q for the quarter ended July 31, 2011 as filed with the Commission on September 9, 2011, File No. 001-14077) | |
| OTHER EXHIBITS | ||
| 21.1* | Subsidiaries | |
| 23.1* | Consent of Independent Registered Public Accounting Firm | |
70
Table of Contents
| EXHIBIT NUMBER | EXHIBIT DESCRIPTION | |
| CERTIFICATIONS | ||
| 31.1* | Certification of Chief Executive Officer, pursuant to Rule 13a-14(a) and Rule 15d-14(a) of the Securities Exchange Act, as amended | |
| 31.2* | Certification of Chief Financial Officer, pursuant to Rule 13a-14(a) and Rule 15d-14(a) of the Securities Exchange Act, as amended | |
| 32.1* | Certification of Chief Executive Officer, pursuant to 18 U.S.C. Section 1350, as adopted pursuant to Section 906 of the Sarbanes-Oxley Act of 2002 | |
| 32.2* | Certification of Chief Financial Officer, pursuant to 18 U.S.C. Section 1350, as adopted pursuant to Section 906 of the Sarbanes-Oxley Act of 2002 | |
| XBRL | ||
| 101.INS* | XBRL Instance Document | |
| 101.SCH* | XBRL Taxonomy Extension Schema Document | |
| 101.CAL* | XBRL Taxonomy Extension Calculation Linkbase Document | |
| 101.DEF* | XBRL Taxonomy Extension Definition Linkbase Document | |
| 101.LAB* | XBRL Taxonomy Extension Label Linkbase Document | |
| 101.PRE* | XBRL Taxonomy Extension Presentation Linkbase Document | |
| * | Filed herewith. |
| + | Indicates a management contract or compensatory plan or arrangement. |
71