Attached files
| file | filename |
|---|---|
| EX-99.1 - EX-99.1 - Freshpet, Inc. | frpt-ex991_201504016.htm |
| 8-K/A - 8-K/A - Freshpet, Inc. | frpt-8ka_20150401.htm |
Investor Relations Presentation April 2015
Forward Looking Statements and Non-GAAP Financial Measures Forward Looking Statements Certain statements in this presentation may constitute "forward-looking" statements. These statements are based on management's current opinions, expectations, beliefs, plans, objectives, assumptions or projections regarding future events or future results. These forward-looking statements are only predictions, not historical fact, and involve certain risks and uncertainties, as well as assumptions. Actual results, levels of activity, performance, achievements and events could differ materially from those stated, anticipated or implied by such forward-looking statements. While Freshpet, Inc. (“Freshpet” or “the Company”) believes that its assumptions are reasonable, it is very difficult to predict the impact of known factors, and, of course, it is impossible to anticipate all factors that could affect actual results. There are a number of risks and uncertainties that could cause actual results to differ materially from forward-looking statements made herein including, most prominently, the risks discussed under the heading "Risk Factors" in the Company's prospectus filed with the Securities and Exchange Commission pursuant to Rule 424(b) under the Securities Act of 1933, as amended (the "Securities Act") on November 10, 2014 ("Prospectus") and in the Company’s annual report filed on Form 10-K for the year ended December 31, 2014, filed with the SEC on March 31, 2015. Such forward-looking statements are made only as of the date of this release. Freshpet undertakes no obligation to publicly update or revise any forward-looking statement as a result of new information, future events or otherwise, except as otherwise required by law. If Freshpet does update one or more forward-looking statements, no inference should be made that Freshpet will make additional updates with respect to those or other forward-looking statements. Non-GAAP Financial Measures Management believes that adjusted net loss, pro forma cash, EBITDA, and Adjusted EBITDA, which are non-GAAP measurements, are meaningful to investors because they provide a view of the Company with respect to ongoing operating results. Adjusted items from net loss represent significant charges that are no longer recorded after the IPO (such as the guarantee fee), or charges that are not as significant after the IPO (such as interest expense). Pro forma cash takes into account certain significant transactions that occurred in connection with the IPO that had an impact on cash. EBITDA, which represents net loss plus depreciation and amortization, interest expense (including fees on debt guarantee), and income tax expense, and Adjusted EBITDA, which represents EBITDA plus loss on disposal of equipment, new plant startup expenses and processing, share based compensation, launch expenses, and warrant expenses, are shown as supplemental disclosures because these figures are widely used by the investment community for analysis and comparative evaluation and each of these measures provides an additional metric to evaluate the Company's operations and, when considered with both the Company's U.S. GAAP results and the reconciliation to net loss, provides a more complete understanding of the Company's business than could be obtained absent this disclosure. EBITDA and Adjusted EBITDA are not and should not be considered alternatives to net loss or any other figure calculated in accordance with U.S. GAAP, or as an indicator of operating performance. The Company's calculation of EBITDA and Adjusted EBITDA may differ from methods used by other companies. Management believes that these non-GAAP measurements are important to an understanding of the Company's overall operating results in the periods presented. Such non-GAAP measurements are not recognized in accordance with generally accepted accounting principles (GAAP) and should not be viewed as an alternative to GAAP measures of performance. We have not reconciled our expected Adjusted EBITDA to net income under “Guidance and Long-term Financial Targets" because we have not finalized our calculations of several factors necessary to provide the reconciliation, including net income, interest expense and income tax expense. In addition, certain items that impact net income and other reconciling metrics are out of our control and/or cannot be reasonably predicted at this time.
Introduction & Overview
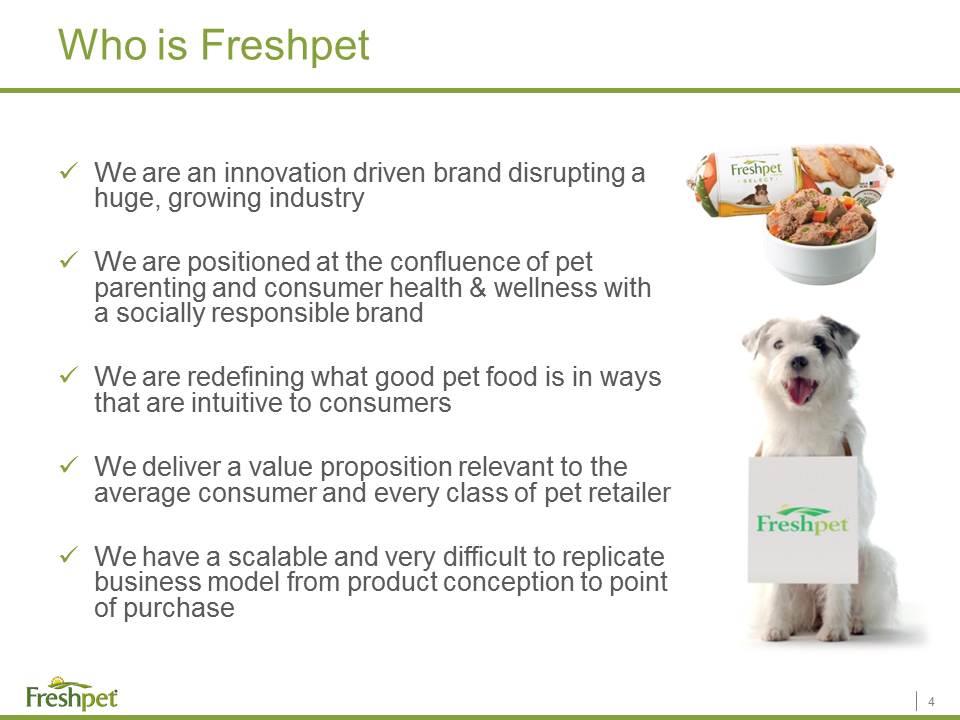
Who is Freshpet We are an innovation driven brand disrupting a huge, growing industry We are positioned at the confluence of pet parenting and consumer health & wellness with a socially responsible brand We are redefining what good pet food is in ways that are intuitive to consumers We deliver a value proposition relevant to the average consumer and every class of pet retailer We have a scalable and very difficult to replicate business model from product conception to point of purchase
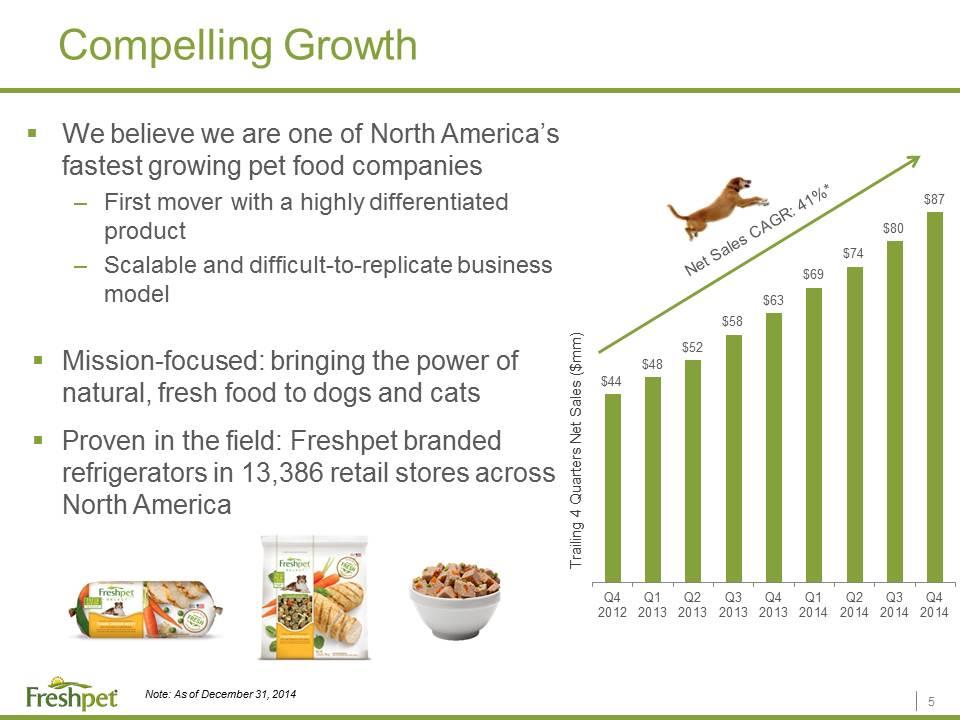
Compelling Growth We believe we are one of North America’s fastest growing pet food companies First mover with a highly differentiated product Scalable and difficult-to-replicate business model Mission-focused: bringing the power of natural, fresh food to dogs and cats Proven in the field: Freshpet branded refrigerators in 13,386 retail stores across North America Trailing 4 Quarters Net Sales ($mm) Net Sales CAGR: 41%* Note: As of December 31, 2014
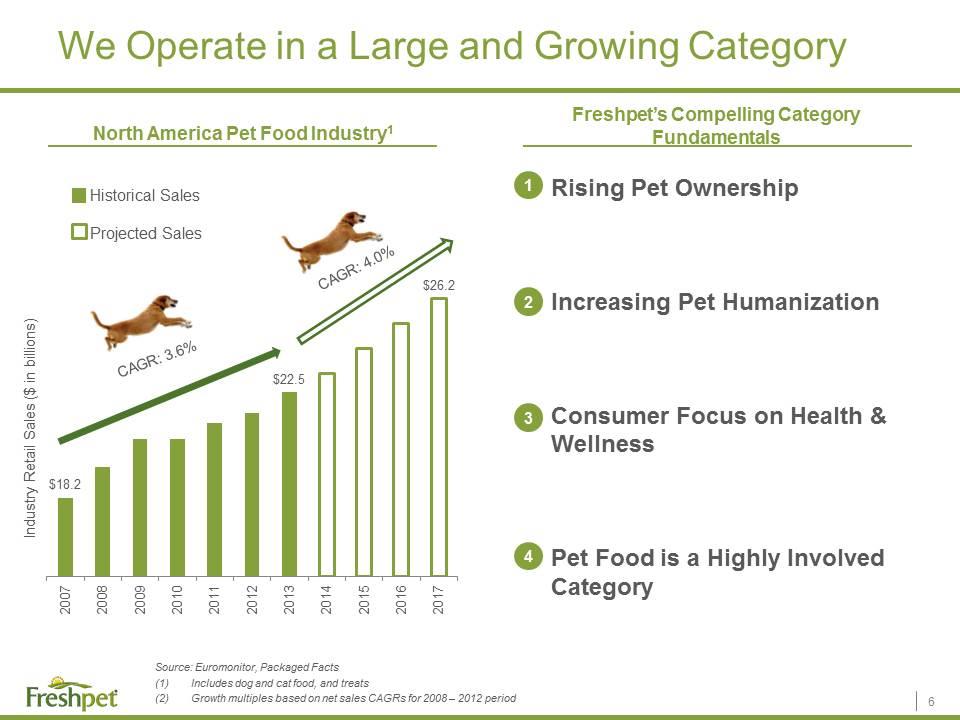
We Operate in a Large and Growing Category Source: Euromonitor, Packaged Facts Includes dog and cat food, and treats Growth multiples based on net sales CAGRs for 2008 – 2012 period Rising Pet Ownership Increasing Pet Humanization Consumer Focus on Health & Wellness Pet Food is a Highly Involved Category Freshpet’s Compelling Category Fundamentals North America Pet Food Industry1 1 2 3 4 CAGR: 3.6% CAGR: 4.0% Industry Retail Sales ($ in billions) Historical Sales Projected Sales
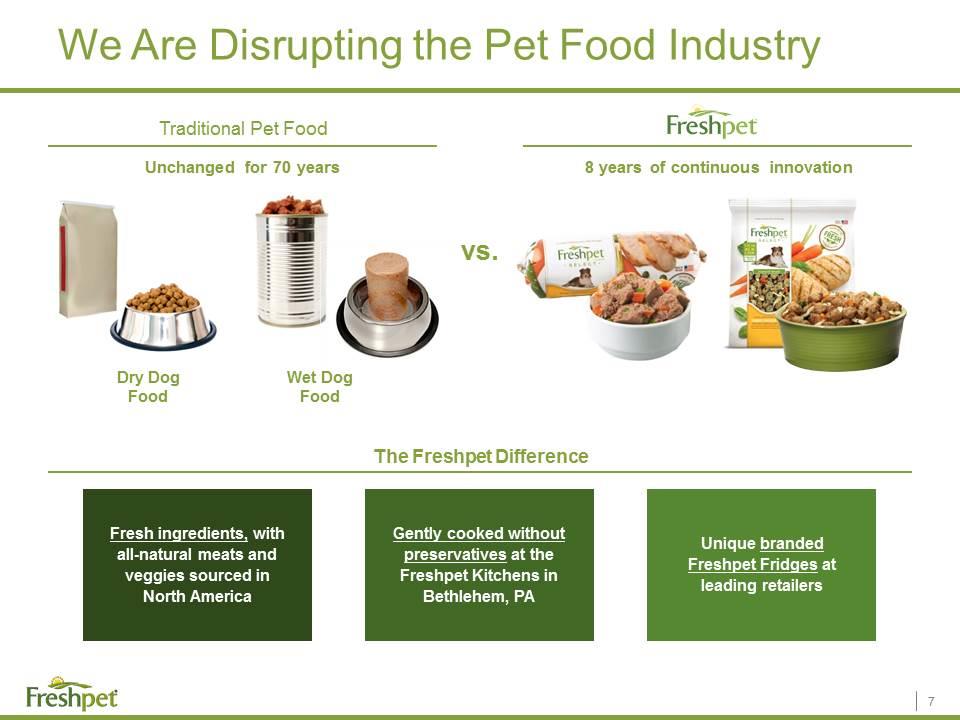
We Are Disrupting the Pet Food Industry Traditional Pet Food The Freshpet Difference Unchanged for 70 years 8 years of continuous innovation Wet Dog Food Dry Dog Food Fresh ingredients, with all-natural meats and veggies sourced in North America Gently cooked without preservatives at the Freshpet Kitchens in Bethlehem, PA Unique branded Freshpet Fridges at leading retailers vs.
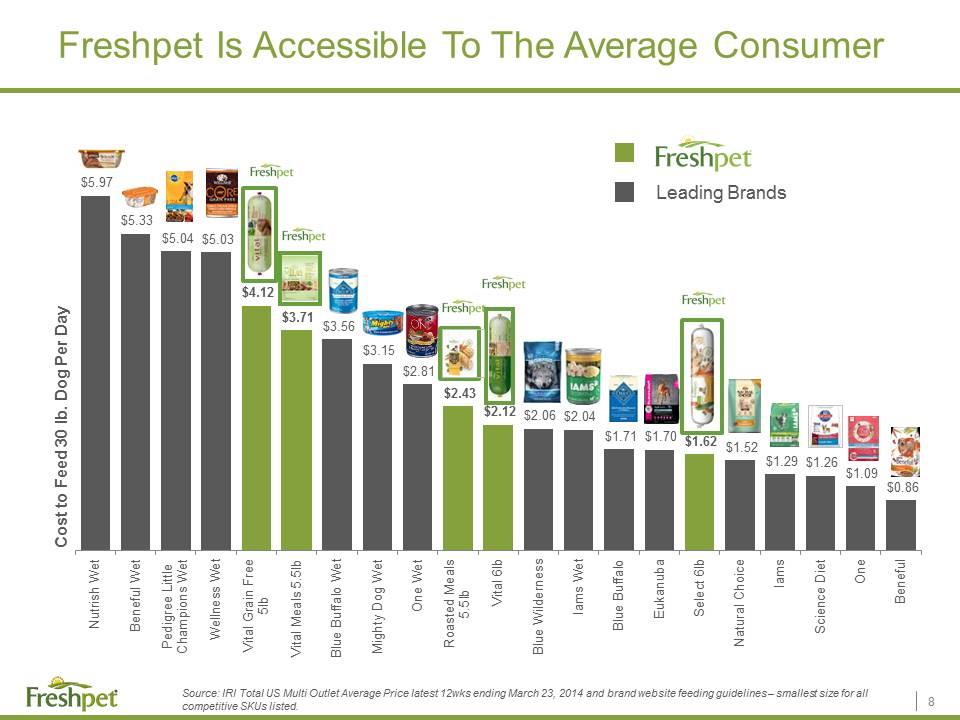
Freshpet Is Accessible To The Average Consumer Source: IRI Total US Multi Outlet Average Price latest 12wks ending March 23, 2014 and brand website feeding guidelines – smallest size for all competitive SKUs listed. Leading Brands
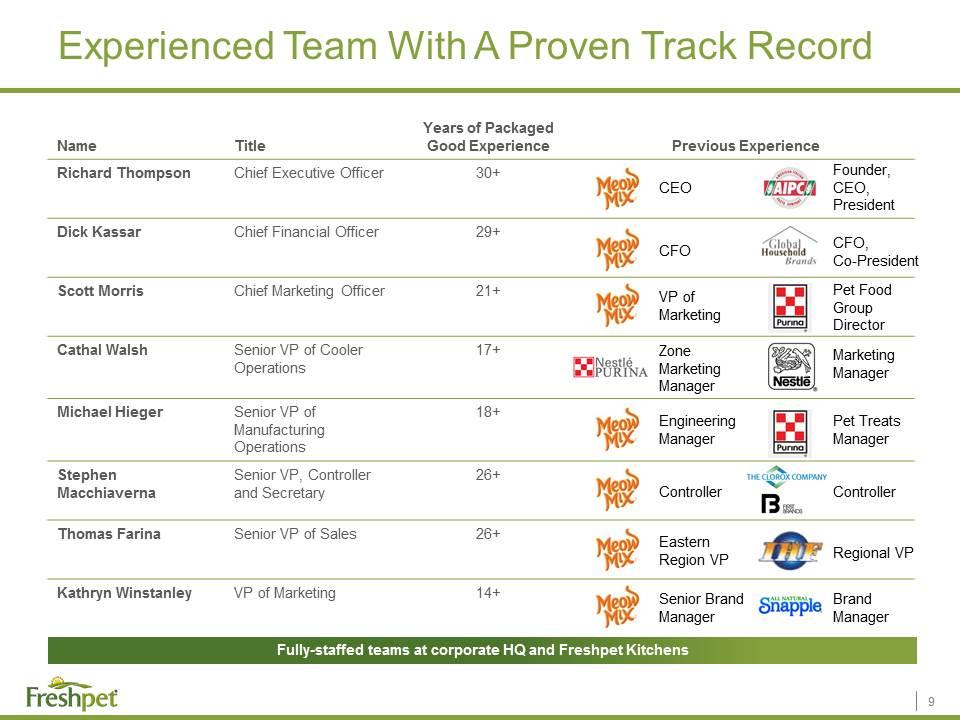
Experienced Team With A Proven Track Record Name Title Years of Packaged Good Experience Previous Experience Richard Thompson Chief Executive Officer 30+ Dick Kassar Chief Financial Officer 29+ Scott Morris Chief Marketing Officer 21+ Cathal Walsh Senior VP of Cooler Operations 17+ Michael Hieger Senior VP of Manufacturing Operations 18+ Stephen Macchiaverna Senior VP, Controller and Secretary 26+ Thomas Farina Senior VP of Sales 26+ Kathryn Winstanley VP of Marketing 14+ VP of Marketing Zone Marketing Manager Engineering Manager Controller Eastern Region VP Senior Brand Manager CEO CFO Pet Food Group Director Marketing Manager Pet Treats Manager Controller Regional VP Brand Manager Founder, CEO, President CFO, Co-President Fully-staffed teams at corporate HQ and Freshpet Kitchens
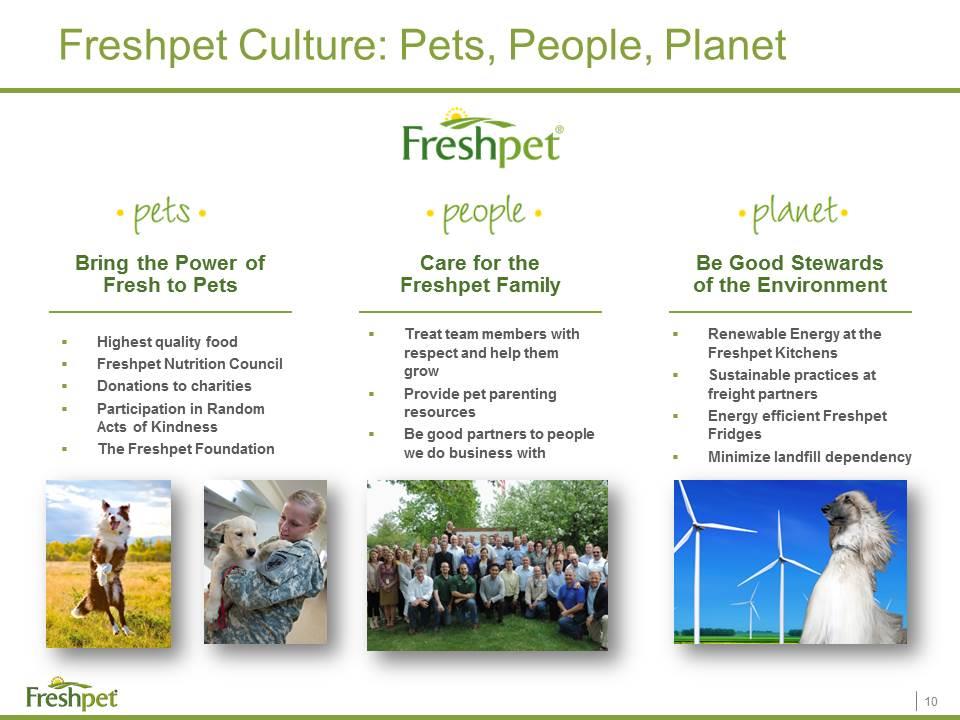
Freshpet Culture: Pets, People, Planet Bring the Power of Fresh to Pets Care for the Freshpet Family Be Good Stewards of the Environment Highest quality food Freshpet Nutrition Council Donations to charities Participation in Random Acts of Kindness The Freshpet Foundation Treat team members with respect and help them grow Provide pet parenting resources Be good partners to people we do business with Renewable Energy at the Freshpet Kitchens Sustainable practices at freight partners Energy efficient Freshpet Fridges Minimize landfill dependency
Value Proposition
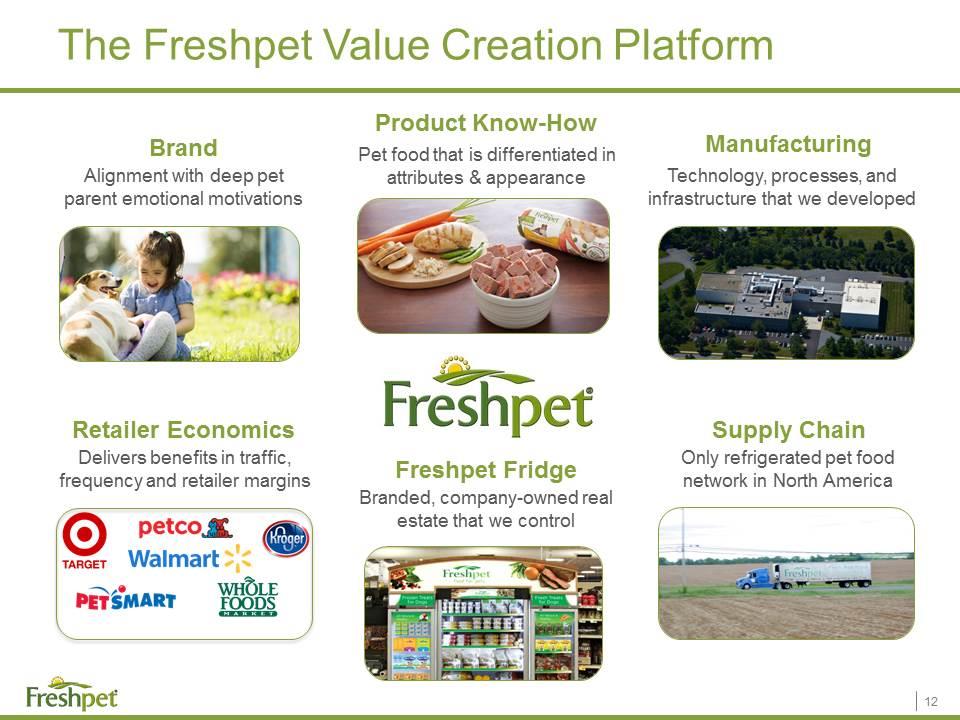
The Freshpet Value Creation Platform Delivers benefits in traffic, frequency and retailer margins Alignment with deep pet parent emotional motivations Pet food that is differentiated in attributes & appearance Technology, processes, and infrastructure that we developed Only refrigerated pet food network in North America Branded, company-owned real estate that we control Brand Product Know-How Manufacturing Freshpet Fridge Retailer Economics Supply Chain
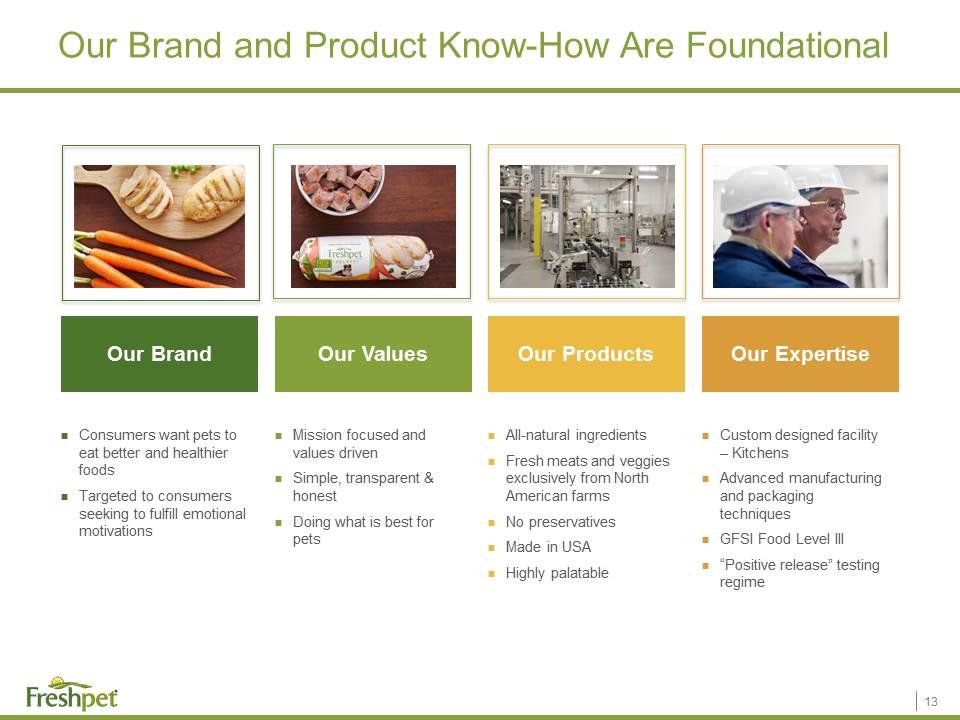
Our Brand and Product Know-How Are Foundational Our Brand Our Values Our Products Our Expertise Consumers want pets to eat better and healthier foods Targeted to consumers seeking to fulfill emotional motivations Mission focused and values driven Simple, transparent & honest Doing what is best for pets All-natural ingredients Fresh meats and veggies exclusively from North American farms No preservatives Made in USA Highly palatable Custom designed facility – Kitchens Advanced manufacturing and packaging techniques GFSI Food Level III “Positive release” testing regime
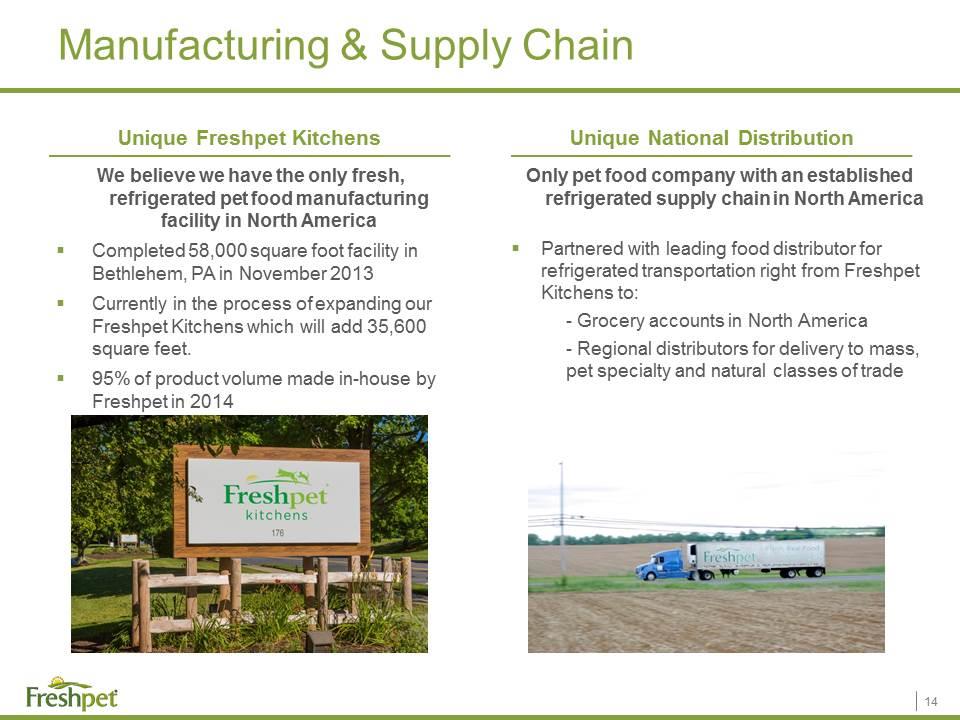
Manufacturing & Supply Chain Unique National Distribution Unique Freshpet Kitchens Only pet food company with an established refrigerated supply chain in North America Partnered with leading food distributor for refrigerated transportation right from Freshpet Kitchens to: - Grocery accounts in North America - Regional distributors for delivery to mass, pet specialty and natural classes of trade We believe we have the only fresh, refrigerated pet food manufacturing facility in North America Completed 58,000 square foot facility in Bethlehem, PA in November 2013 Currently in the process of expanding our Freshpet Kitchens which will add 35,600 square feet. 95% of product volume made in-house by Freshpet in 2014
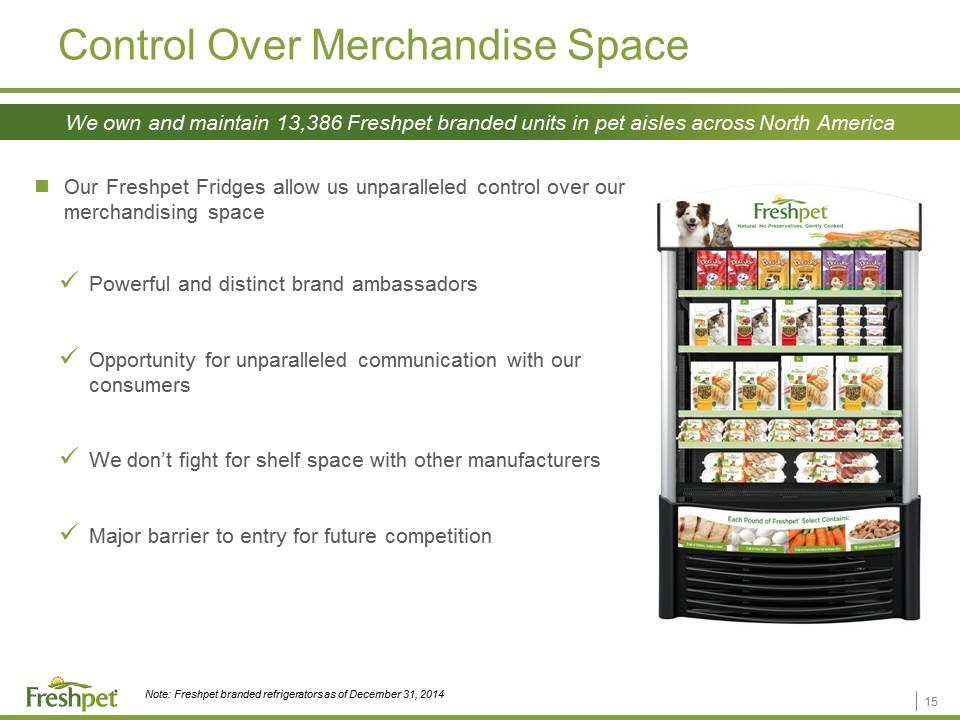
Control Over Merchandise Space Our Freshpet Fridges allow us unparalleled control over our merchandising space Powerful and distinct brand ambassadors Opportunity for unparalleled communication with our consumers We don’t fight for shelf space with other manufacturers Major barrier to entry for future competition Note: Freshpet branded refrigerators as of December 31, 2014 We own and maintain 13,386 Freshpet branded units in pet aisles across North America
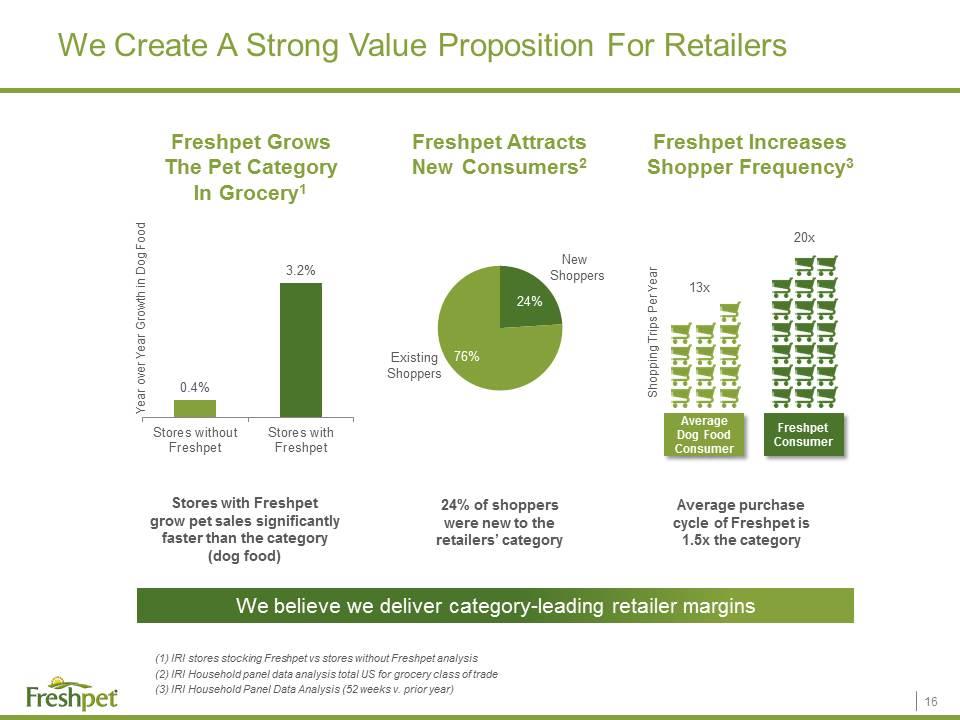
We Create A Strong Value Proposition For Retailers Freshpet Attracts New Consumers2 Freshpet Grows The Pet Category In Grocery1 Freshpet Increases Shopper Frequency3 24% of shoppers were new to the retailers’ category Average purchase cycle of Freshpet is 1.5x the category Stores with Freshpet grow pet sales significantly faster than the category (dog food) We believe we deliver category-leading retailer margins Year over Year Growth in Dog Food New Shoppers Existing Shoppers Average Dog Food Consumer 13x 20x Freshpet Consumer Shopping Trips Per Year (1) IRI stores stocking Freshpet vs stores without Freshpet analysis (2) IRI Household panel data analysis total US for grocery class of trade (3) IRI Household Panel Data Analysis (52 weeks v. prior year)
Growth Strategy
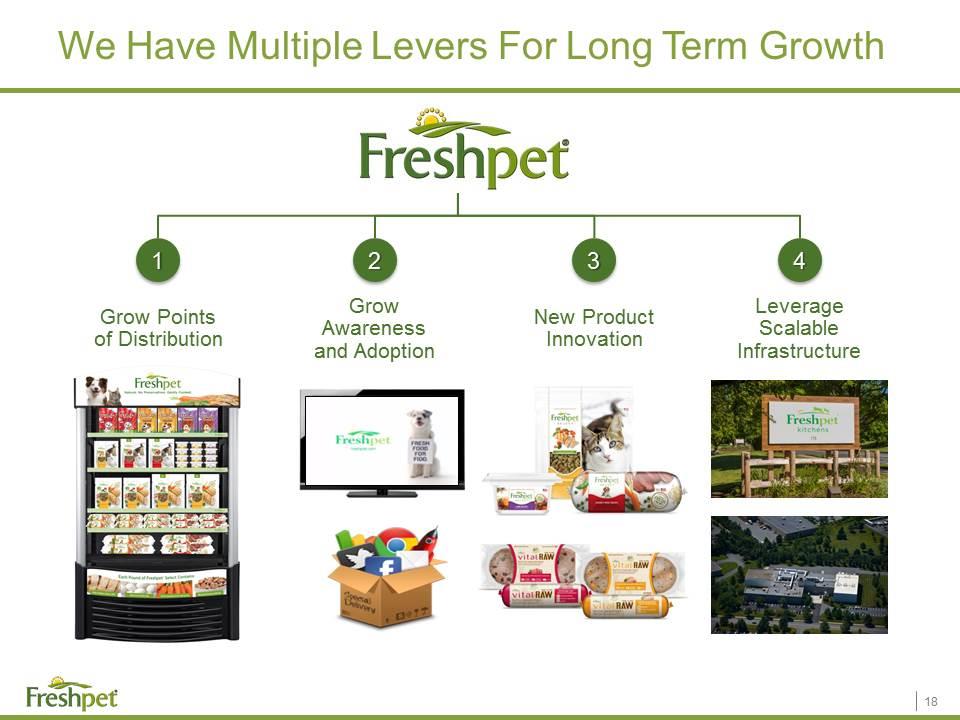
We Have Multiple Levers For Long Term Growth Grow Points of Distribution Grow Awareness and Adoption New Product Innovation Leverage Scalable Infrastructure 1 2 3 4
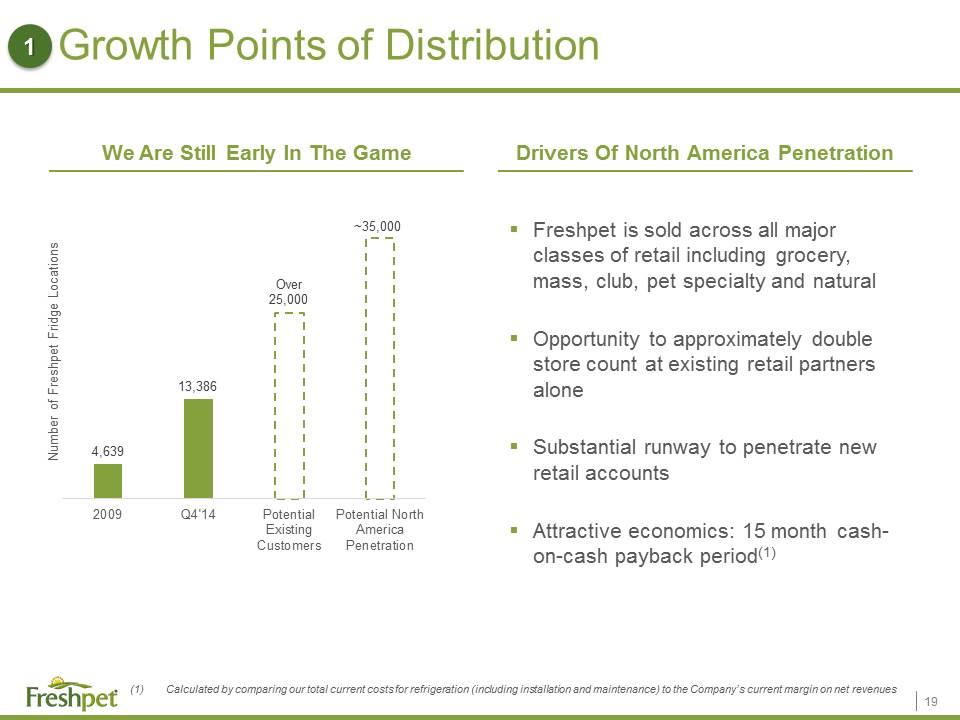
Growth Points of Distribution Freshpet is sold across all major classes of retail including grocery, mass, club, pet specialty and natural Opportunity to approximately double store count at existing retail partners alone Substantial runway to penetrate new retail accounts Attractive economics: 15 month cash-on-cash payback period(1) We Are Still Early In The Game Drivers Of North America Penetration Calculated by comparing our total current costs for refrigeration (including installation and maintenance) to the Company’s current margin on net revenues Number of Freshpet Fridge Locations 1
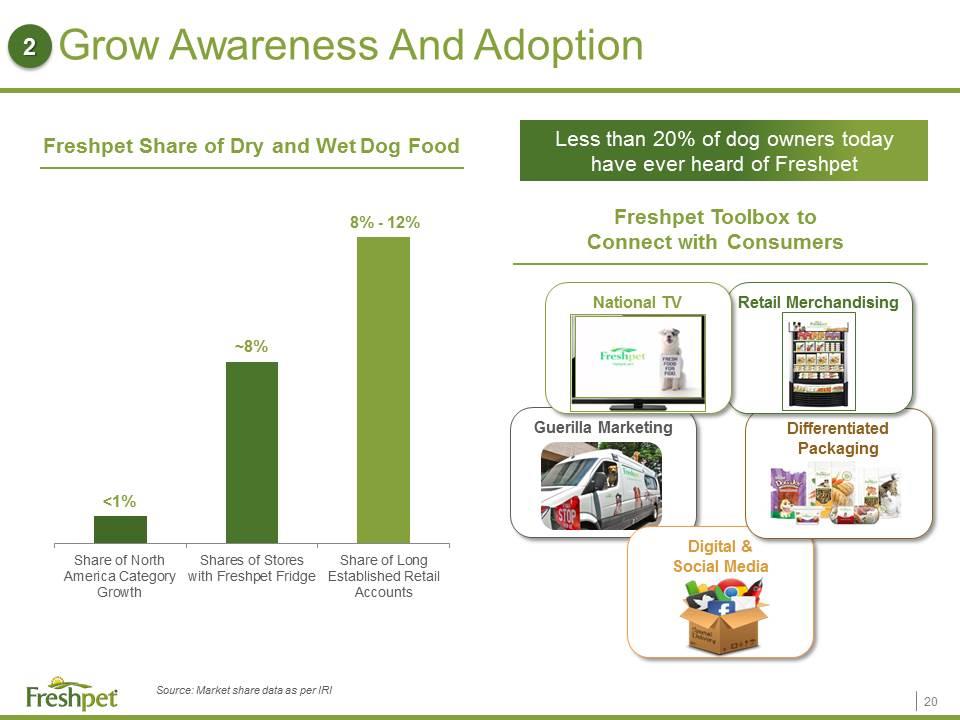
Grow Awareness And Adoption Guerilla Marketing Digital & Social Media Differentiated Packaging Retail Merchandising Freshpet Toolbox to Connect with Consumers National TV Advertising Less than 20% of dog owners today have ever heard of Freshpet Freshpet Share of Dry and Wet Dog Food Source: Market share data as per IRI 2
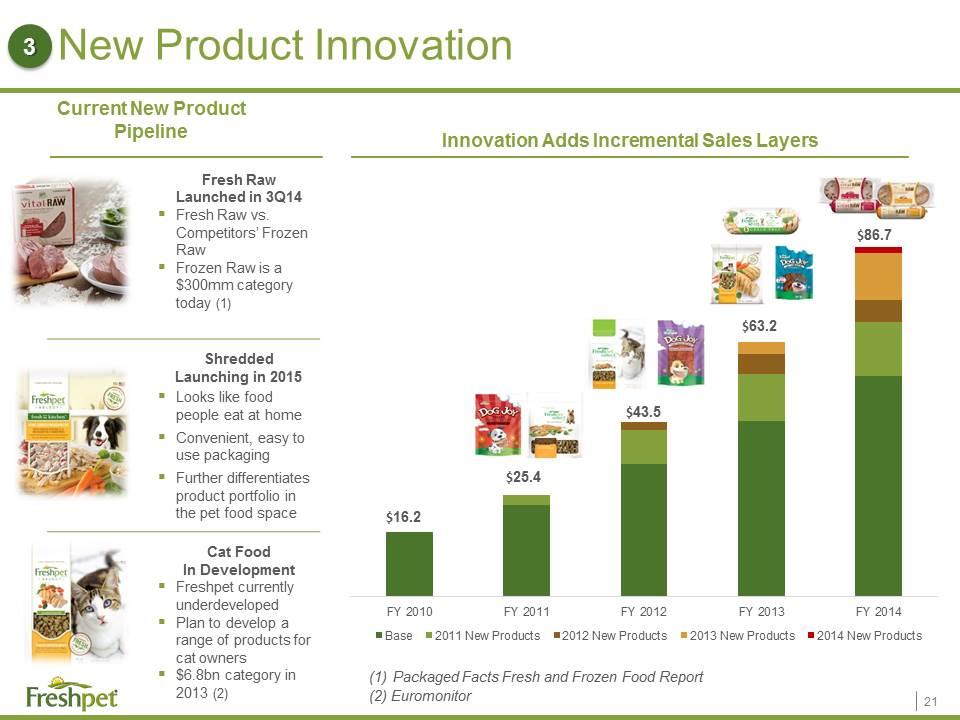
New Product Innovation Fresh Raw Launched in 3Q14 Fresh Raw vs. Competitors’ Frozen Raw Frozen Raw is a $300mm category today (1) Shredded Launching in 2015 Looks like food people eat at home Convenient, easy to use packaging Further differentiates product portfolio in the pet food space Cat Food In Development Freshpet currently underdeveloped Plan to develop a range of products for cat owners $6.8bn category in 2013 (2) Current New Product Pipeline Innovation Adds Incremental Sales Layers 3 Packaged Facts Fresh and Frozen Food Report (2) Euromonitor
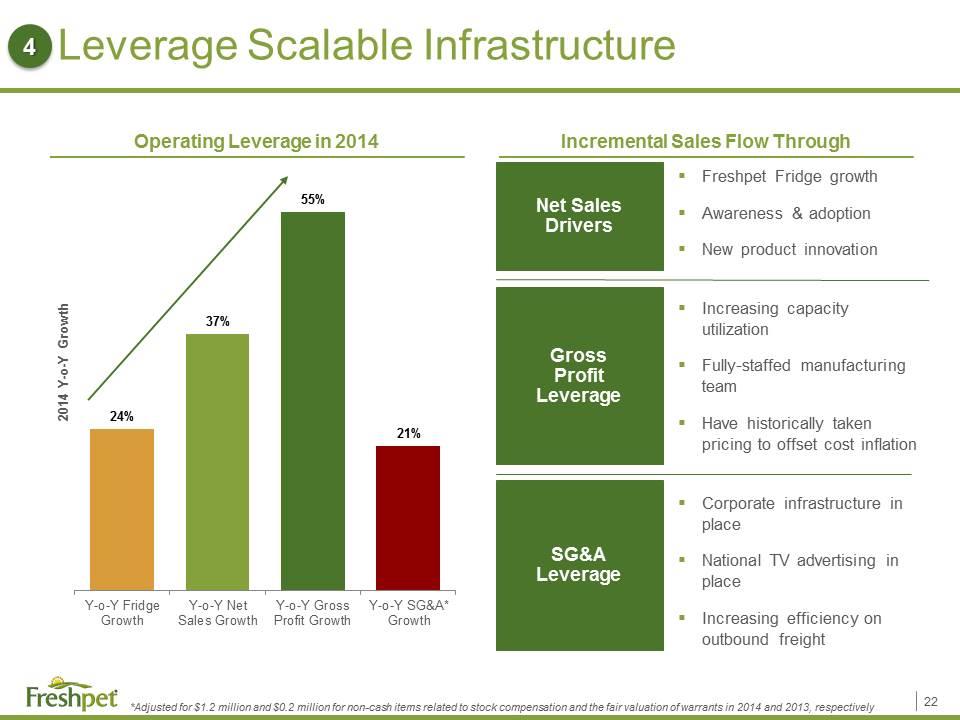
Leverage Scalable Infrastructure Freshpet Fridge growth Awareness & adoption New product innovation Operating Leverage in 2014 Incremental Sales Flow Through Increasing capacity utilization Fully-staffed manufacturing team Have historically taken pricing to offset cost inflation Corporate infrastructure in place National TV advertising in place Increasing efficiency on outbound freight Net Sales Drivers Gross Profit Leverage SG&A Leverage 4 *Adjusted for $1.2 million and $0.2 million for non-cash items related to stock compensation and the fair valuation of warrants in 2014 and 2013, respectively
Financial Performance
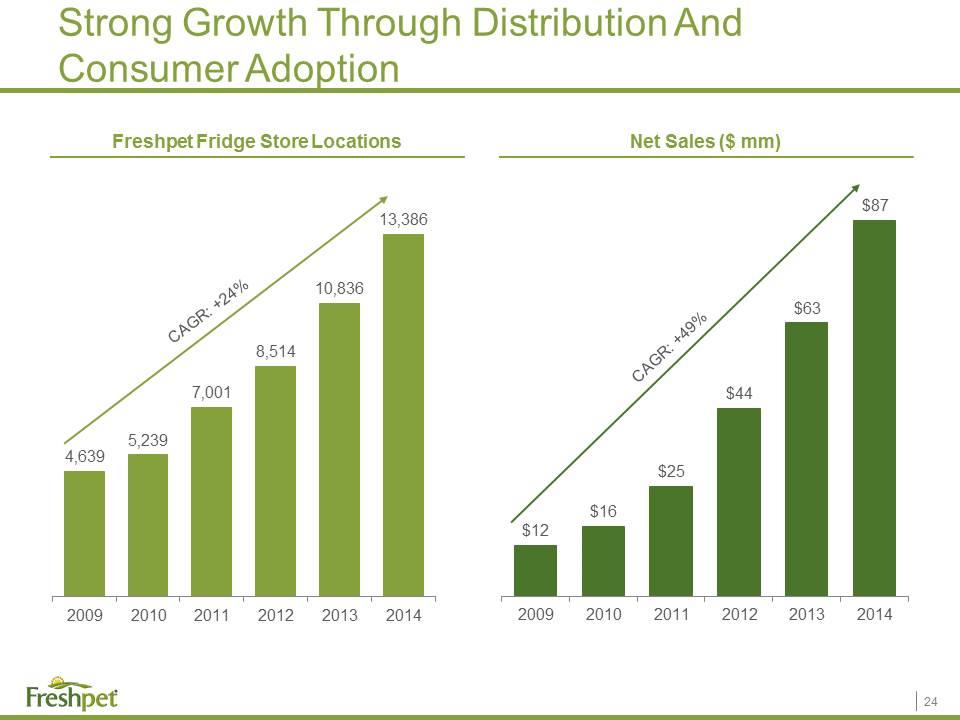
Strong Growth Through Distribution And Consumer Adoption CAGR: +49% Freshpet Fridge Store Locations Net Sales ($ mm) CAGR: +24%
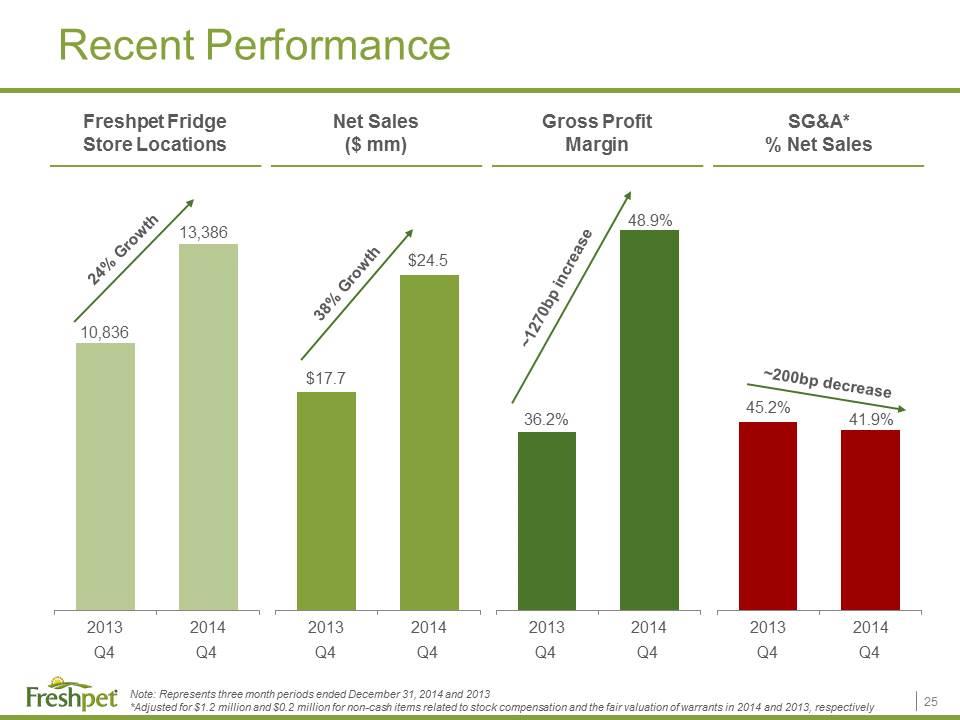
Recent Performance Net Sales ($ mm) Freshpet Fridge Store Locations 24% Growth 38% Growth Q4 Q4 Q4 Q4 Q4 Q4 Note: Represents three month periods ended December 31, 2014 and 2013 *Adjusted for $1.2 million and $0.2 million for non-cash items related to stock compensation and the fair valuation of warrants in 2014 and 2013, respectively ~1270bp increase Gross Profit Margin SG&A* % Net Sales Q4 Q4 $17.7 $24.5 36.2% 48.9% ~200bp decrease 45.2% 41.9% 13,386 10,836
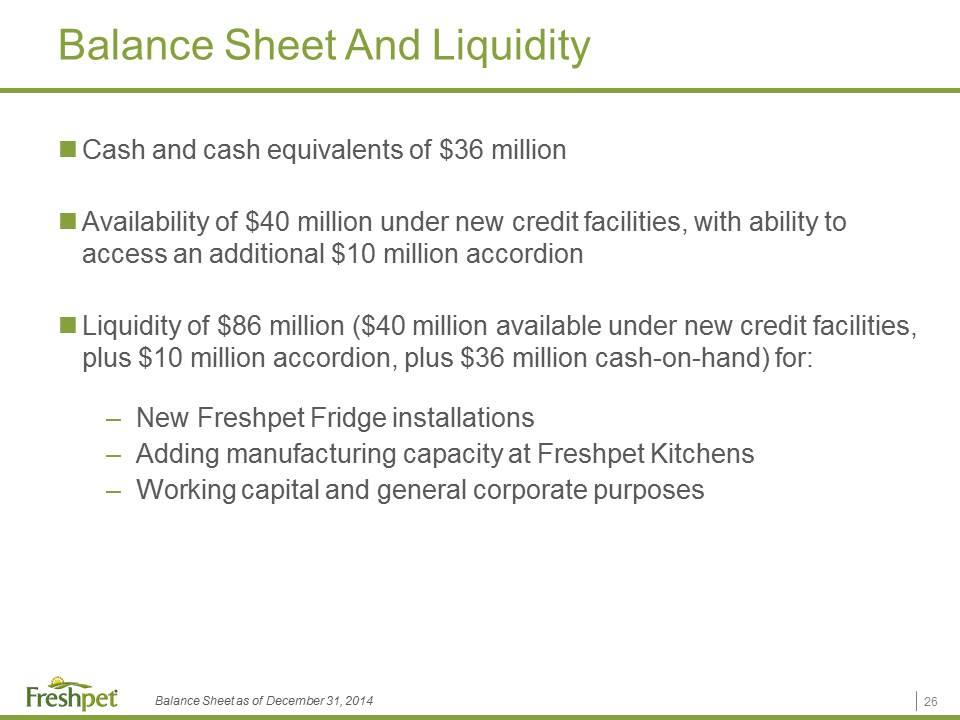
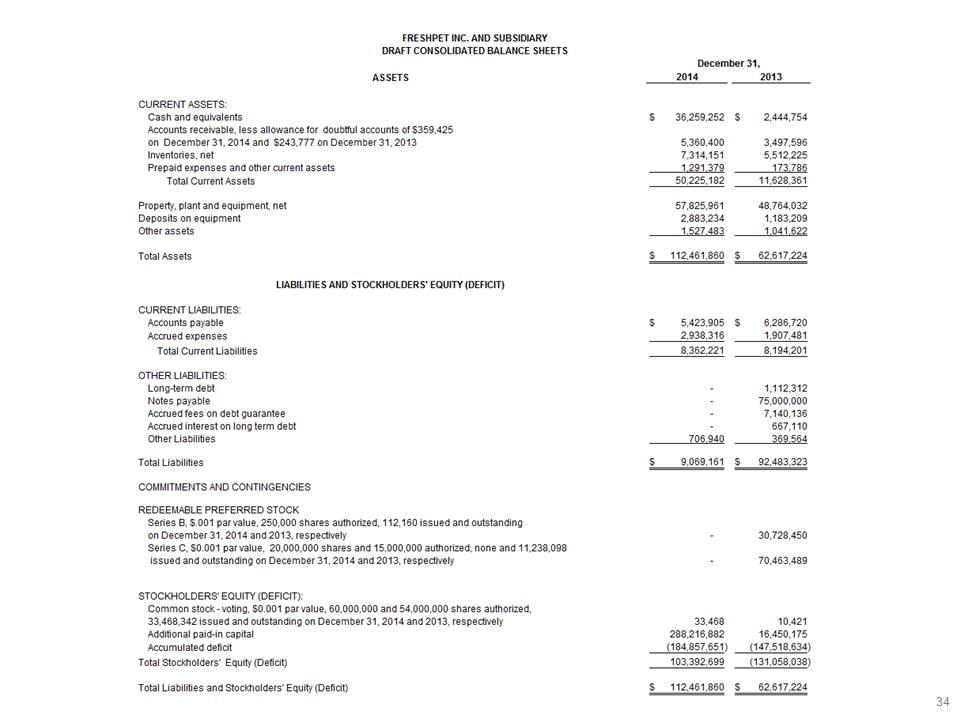
Balance Sheet And Liquidity Cash and cash equivalents of $36 million Availability of $40 million under new credit facilities, with ability to access an additional $10 million accordion Liquidity of $86 million ($40 million available under new credit facilities, plus $10 million accordion, plus $36 million cash-on-hand) for: New Freshpet Fridge installations Adding manufacturing capacity at Freshpet Kitchens Working capital and general corporate purposes Balance Sheet as of December 31, 2014
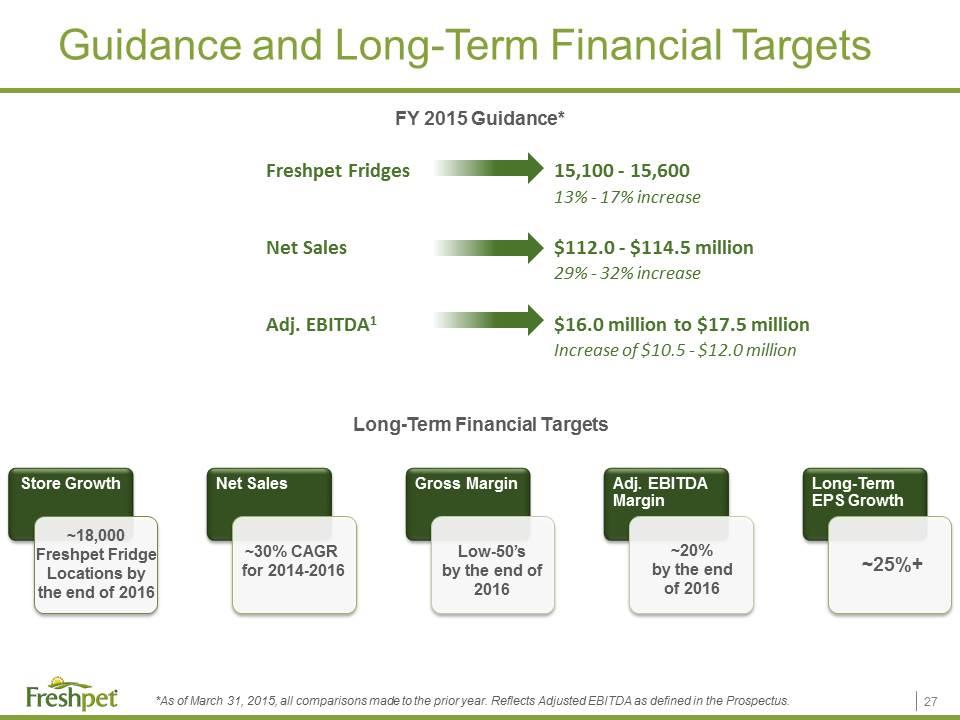
Guidance and Long-Term Financial Targets Long-Term Financial Targets FY 2015 Guidance* *As of March 31, 2015, all comparisons made to the prior year. Reflects Adjusted EBITDA as defined in the Prospectus. Freshpet Fridges15,100 - 15,600 13% - 17% increase Net Sales$112.0 - $114.5 million29% - 32% increase Adj. EBITDA1$16.0 million to $17.5 million Increase of $10.5 - $12.0 million ~25%+ ~20% by the end of 2016 Low-50’s by the end of 2016 ~30% CAGR for 2014-2016 ~18,000 Freshpet Fridge Locations by the end of 2016
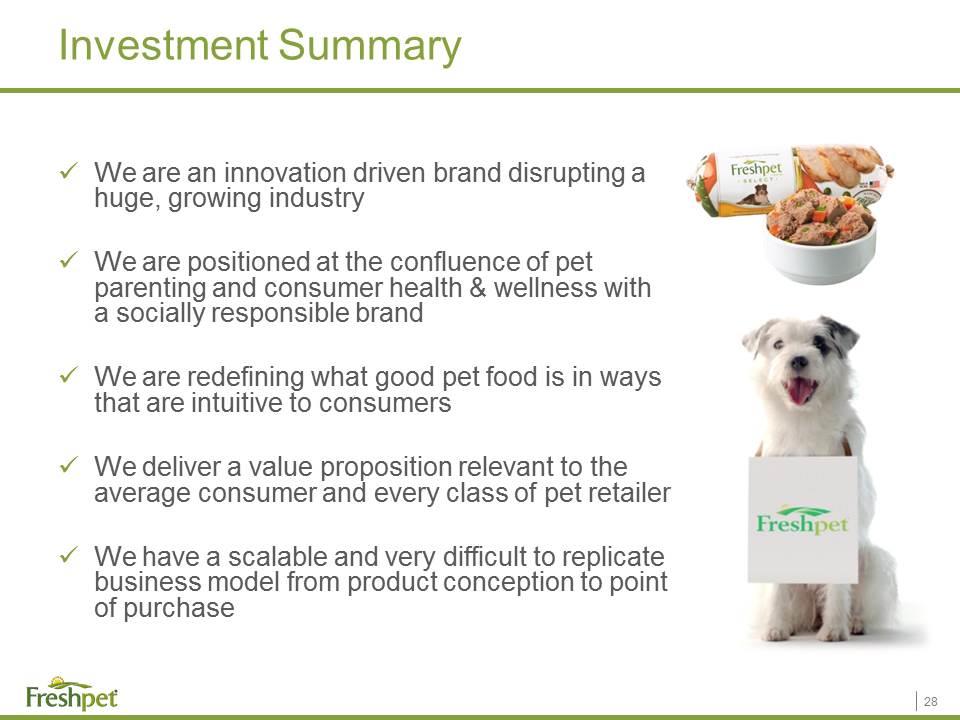
Investment Summary We are an innovation driven brand disrupting a huge, growing industry We are positioned at the confluence of pet parenting and consumer health & wellness with a socially responsible brand We are redefining what good pet food is in ways that are intuitive to consumers We deliver a value proposition relevant to the average consumer and every class of pet retailer We have a scalable and very difficult to replicate business model from product conception to point of purchase
Appendix
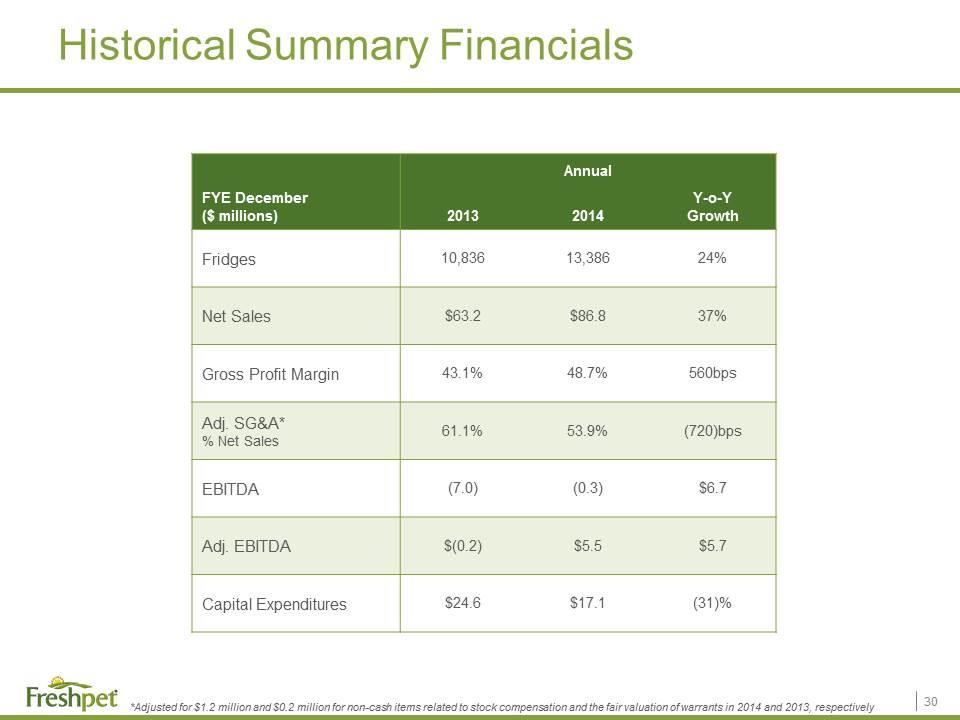
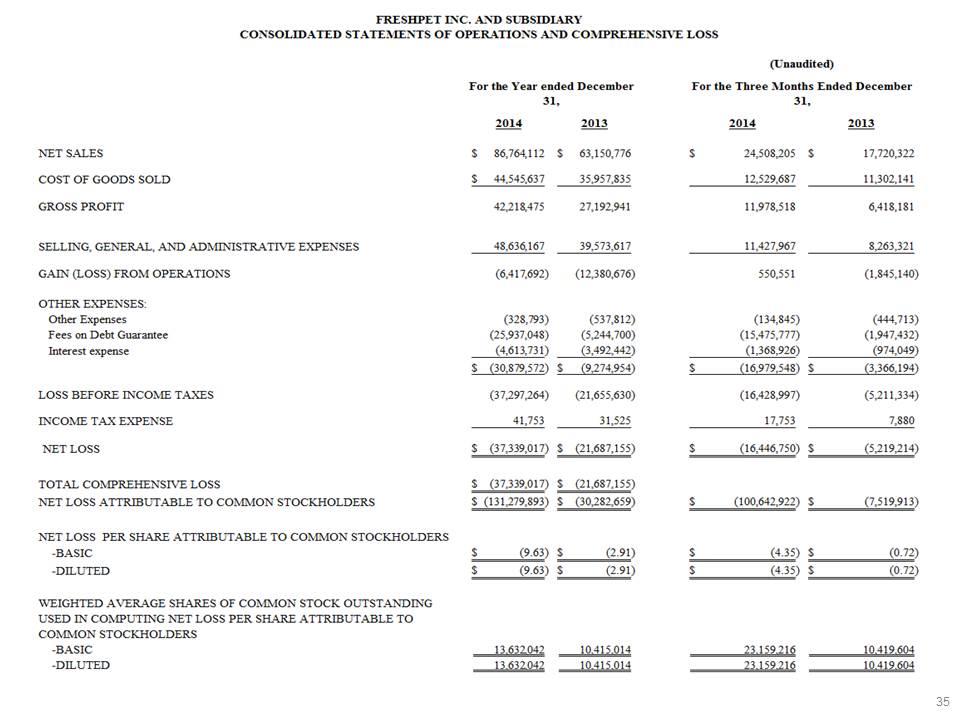
Historical Summary Financials FYE December ($ millions) Annual 2013 2014 Y-o-Y Growth Fridges 10,836 13,386 24% Net Sales $63.2 $86.8 37% Gross Profit Margin 43.1% 48.7% 560bps Adj. SG&A* % Net Sales 61.1% 53.9% (720)bps EBITDA (7.0) (0.3) $6.7 Adj. EBITDA $(0.2) $5.5 $5.7 Capital Expenditures $24.6 $17.1 (31)% *Adjusted for $1.2 million and $0.2 million for non-cash items related to stock compensation and the fair valuation of warrants in 2014 and 2013, respectively
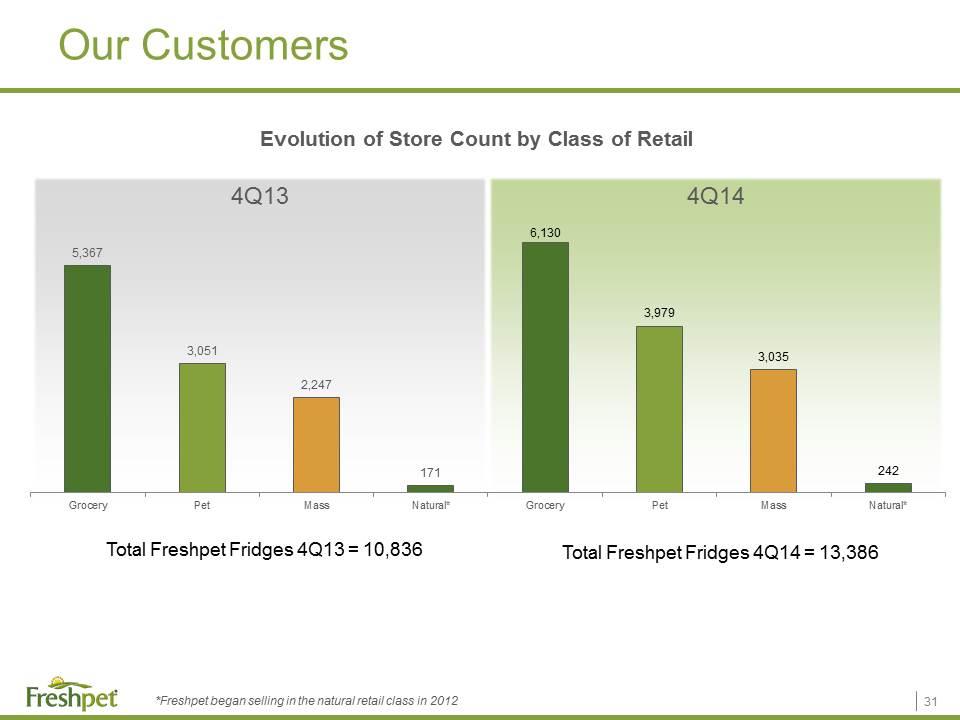
4Q13 4Q14 Our Customers Evolution of Store Count by Class of Retail *Freshpet began selling in the natural retail class in 2012 Total Freshpet Fridges 4Q14 = 13,386 Total Freshpet Fridges 4Q13 = 10,836
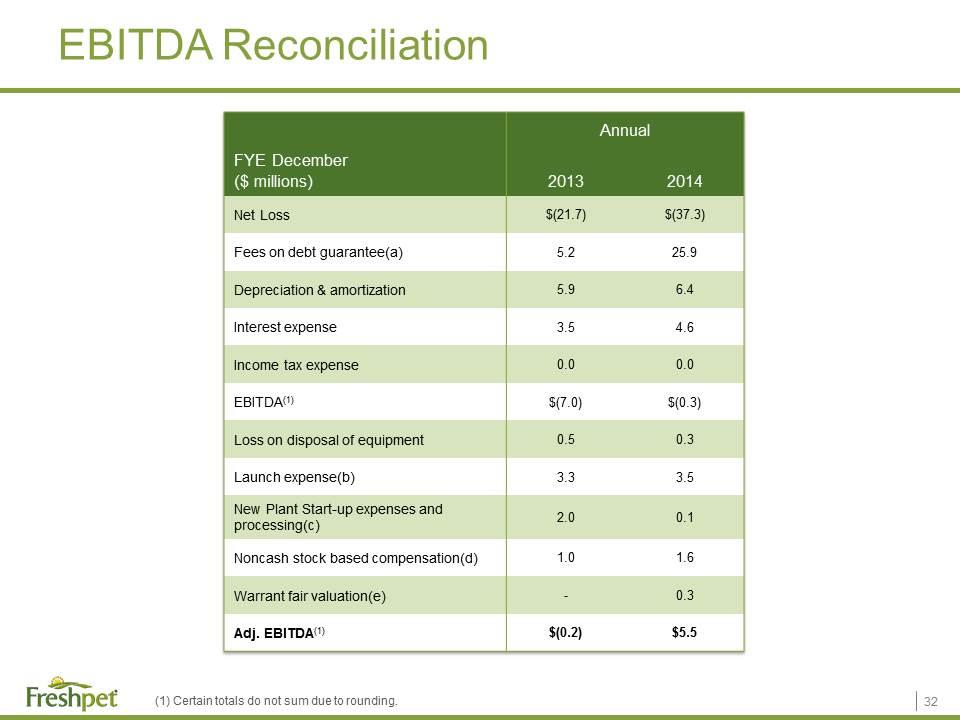
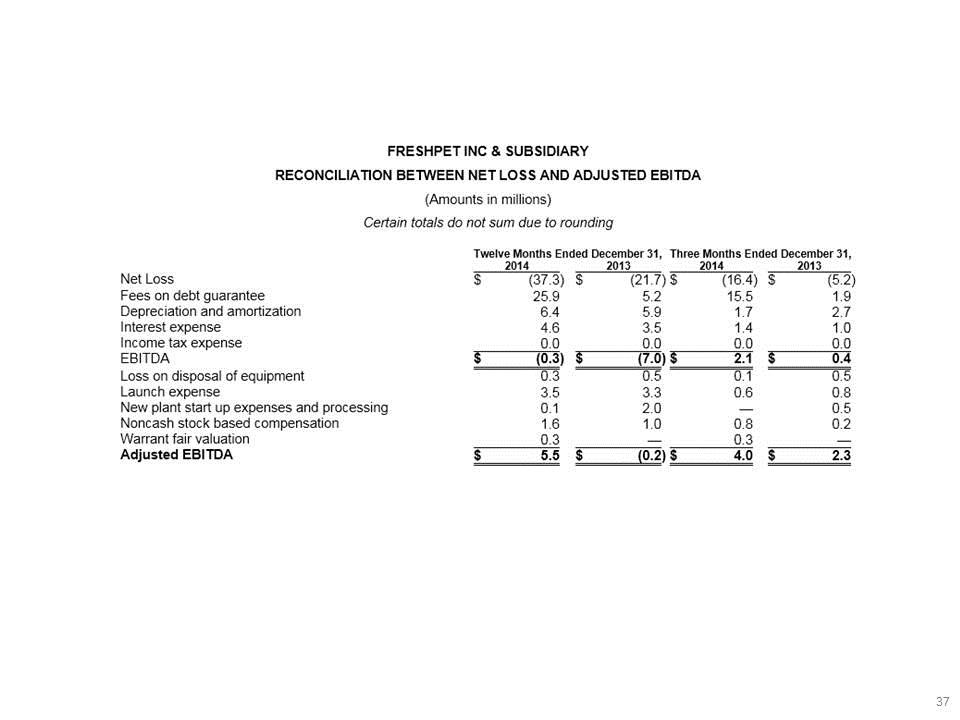
EBITDA Reconciliation Annual FYE December ($ millions) 2013 2014 Net Loss $(21.7) $(37.3) Fees on debt guarantee(a) 5.2 25.9 Depreciation & amortization 5.9 6.4 Interest expense 3.5 4.6 Income tax expense 0.0 0.0 EBITDA(1) $(7.0) $(0.3) Loss on disposal of equipment 0.5 0.3 Launch expense(b) 3.3 3.5 New Plant Start-up expenses and processing(c) 2.0 0.1 Noncash stock based compensation(d) 1.0 1.6 Warrant fair valuation(e) - 0.3 Adj. EBITDA(1) $(0.2) $5.5 (1) Certain totals do not sum due to rounding.
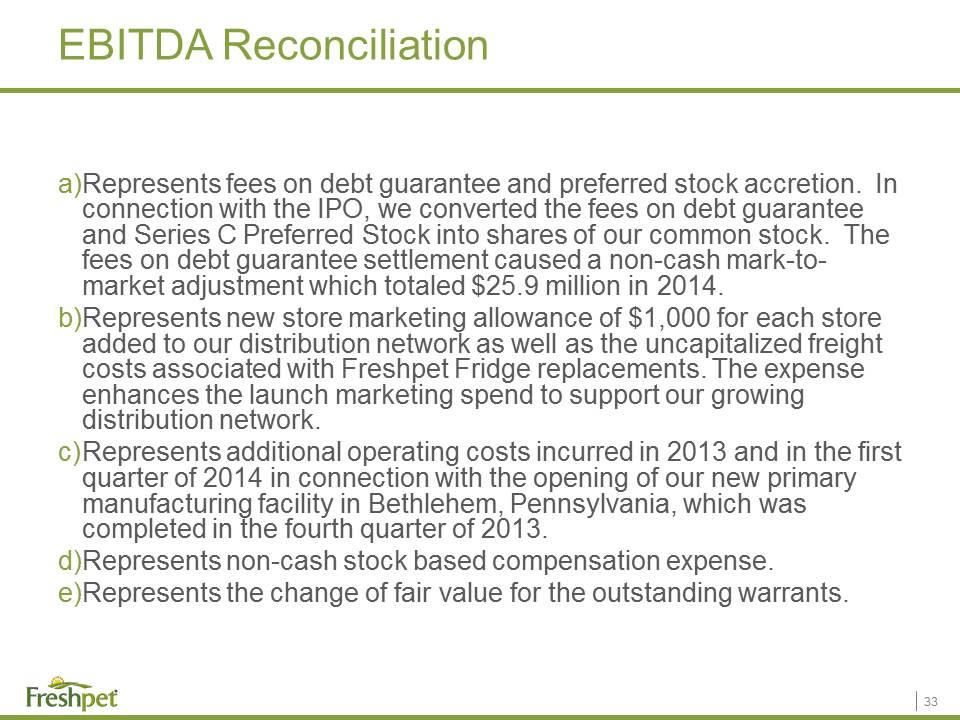
EBITDA Reconciliation Represents fees on debt guarantee and preferred stock accretion. In connection with the IPO, we converted the fees on debt guarantee and Series C Preferred Stock into shares of our common stock. The fees on debt guarantee settlement caused a non-cash mark-to-market adjustment which totaled $25.9 million in 2014. Represents new store marketing allowance of $1,000 for each store added to our distribution network as well as the uncapitalized freight costs associated with Freshpet Fridge replacements. The expense enhances the launch marketing spend to support our growing distribution network. Represents additional operating costs incurred in 2013 and in the first quarter of 2014 in connection with the opening of our new primary manufacturing facility in Bethlehem, Pennsylvania, which was completed in the fourth quarter of 2013. Represents non-cash stock based compensation expense. Represents the change of fair value for the outstanding warrants.
