Attached files
| file | filename |
|---|---|
| EX-24.1 - EX-24.1 - PARK OHIO INDUSTRIES INC/OH | pkohi20141231-ex241.htm |
| EX-32.1 - EX-32.1 - PARK OHIO INDUSTRIES INC/OH | pkohi20141231-ex321.htm |
| EX-31.1 - EX-31.1 - PARK OHIO INDUSTRIES INC/OH | pkohi20141231-ex311.htm |
| EX-31.2 - EX-31.2 - PARK OHIO INDUSTRIES INC/OH | pkohi20141231-ex312.htm |
| EXCEL - IDEA: XBRL DOCUMENT - PARK OHIO INDUSTRIES INC/OH | Financial_Report.xls |
UNITED STATES
SECURITIES AND EXCHANGE COMMISSION
Washington, D.C. 20549
FORM 10-K
(Mark One)
þ | ANNUAL REPORT PURSUANT TO SECTION 13 OR 15(d) OF THE SECURITIES |
EXCHANGE ACT OF 1934
For the fiscal year ended December 31, 2014
or
o | TRANSITION REPORT PURSUANT TO SECTION 13 OR 15(d) OF THE SECURITIES |
EXCHANGE ACT OF 1934
For the transition period from to
Commission file number: 333-43005-01
PARK-OHIO INDUSTRIES, INC.
(Exact name of registrant as specified in its charter)
Ohio | 34-6520107 | |
(State or other jurisdiction of incorporation or organization) | (I.R.S. Employer Identification No.) | |
6065 Parkland Boulevard, Cleveland, Ohio | 44124 | |
(Address of principal executive offices) | (Zip Code) | |
Registrant’s telephone number, including area code: (440) 947-2000
Securities registered pursuant to Section 12(b) of the Act:
None
Securities registered pursuant to Section 12(g) of the Act:
None
Pursuant to a corporate reorganization effective June 15, 1998, Park-Ohio Industries, Inc. became a wholly-owned subsidiary of Park-Ohio Holdings Corp. The registrant meets the conditions set forth in general instruction (I)(1)(a) and (b) of Form 10-K and is filing this form in reduced disclosure format.
Indicate by check mark if the registrant is a well-known seasoned issuer, as defined in Rule 405 of the Securities Act. Yes ¨ No þ
Indicate by check mark if the registrant is not required to file reports pursuant to Section 13 or Section 15(d) of the Act. Yes þ No ¨
Indicate by check mark whether the registrant: (1) has filed all reports required to be filed by Section 13 or 15(d) of the Securities Exchange Act of 1934 during the preceding 12 months (or for such shorter period that the registrant was required to file such reports), and (2) has been subject to such filing requirements for the past 90 days. Yes ¨ No þ
Indicate by check mark whether the registrant has submitted electronically and posted on its corporate Web site, if any, every Interactive Data File required to be submitted and posted pursuant to Rule 405 of Regulation S-T (§232.405 of this chapter) during the preceding 12 months (or for such shorter period that the registrant was required to submit and post such files). Yes þ No ¨
Indicate by check mark if disclosure of delinquent filers pursuant to Item 405 of Regulation S-K (§229.405 of this chapter) is not contained herein, and will not be contained, to the best of registrant’s knowledge, in definitive proxy or information statements incorporated by reference in Part III of this Form 10-K or any amendment to this Form 10-K. þ
Indicate by check mark whether the registrant is a large accelerated filer, an accelerated filer, a non-accelerated filer, or a smaller reporting company. See the definitions of “large accelerated filer,” “accelerated filer” and “smaller reporting company” in Rule 12b-2 of the Exchange Act. (Check one):
Large accelerated filer | o | Accelerated filer | o | |
Non-accelerated filer | þ (Do not check if a smaller reporting company) | Smaller reporting company | o | |
Indicate by check mark whether the registrant is a shell company (as defined in Rule 12b-2 of the Exchange Act). Yes ¨ No þ
All of the outstanding stock of the registrant is held by Park-Ohio Holdings Corp. As of February 27, 2015, 100 shares of the registrant’s common stock, $1 par value, were outstanding.
DOCUMENTS INCORPORATED BY REFERENCE
None
Park-Ohio Industries, Inc.
Form 10-K Annual Report
For The Fiscal Year Ended December 31, 2014
Table Of Contents
Item No. | Page No. | |
Part I | ||
1. | ||
1A. | ||
1B. | ||
2. | ||
3. | ||
4. | ||
Part II | ||
5. | ||
6. | ||
7. | ||
7A. | ||
8. | ||
9. | ||
9A. | ||
9B. | ||
Part III | ||
10. | ||
11. | ||
12. | ||
13. | ||
14. | ||
Part IV | ||
15. | ||
2
Part I
Item 1. Business
Overview
Park-Ohio Industries, Inc. (“Park-Ohio” or “Industries”), a wholly-owned subsidiary of Park-Ohio Holdings Corp. (“Holdings”), was incorporated as an Ohio corporation in 1984. Holdings, primarily through its subsidiaries owned by its direct subsidiary, Industries, is an industrial supply chain logistics and diversified manufacturing business operating in three segments: Supply Technologies, Assembly Components and Engineered Products.
References herein to “we” or “the Company” include, where applicable, Park-Ohio and its direct and indirect subsidiaries.
The Company operates through three reportable segments: Supply Technologies, Assembly Components and Engineered Products. Supply Technologies provides our customers with Total Supply Management™ services for a broad range of high-volume, specialty production components. Total Supply Management™ manages the efficiencies of every aspect of supplying production parts and materials to our customers’ manufacturing floor, from strategic planning to program implementation, and includes such services as engineering and design support, part usage and cost analysis, supplier selection, quality assurance, bar coding, product packaging and tracking, just-in-time and point-of-use delivery; electronic billing services and ongoing technical support. The principal customers of Supply Technologies are in following industries: the heavy-duty truck; automotive, truck and vehicle parts; power sports and recreational equipment; bus and coaches; electrical distribution and controls; agricultural and construction equipment; consumer electronics; HVAC; lawn and garden; semiconductor equipment; aerospace and defense; and plumbing. Assembly Components manufactures cast and machined aluminum components, automotive and industrial rubber and thermoplastic products, gasoline direct injection systems, fuel filler and hydraulic assemblies for automotive, agricultural equipment, construction equipment, heavy-duty truck and marine equipment industries. Assembly Components also provides value-added services such as design and engineering, machining and assembly. Engineered Products operates a diverse group of niche manufacturing businesses that design and manufacture a broad range of high quality products engineered for specific customer applications. The principal customers of Engineered Products are original equipment manufacturers (“OEMs”) and end users in the ferrous and non-ferrous metals, silicon, coatings, forging, foundry, heavy-duty truck, construction equipment, automotive, oil and gas, rail and locomotive manufacturing and aerospace and defense industries.
Our sales are made through our own sales organization, distributors and representatives. Intersegment sales are immaterial and eliminated in consolidation and are not included in the financial results presented. Intersegment sales are accounted for at values based on market prices. Income allocated to segments excludes certain corporate expenses, interest expense, and certain other infrequent or unusual charges or credits. Identifiable assets by segment include assets directly identified with those operations. As of December 31, 2014, we employed approximately 6,000 persons.
3
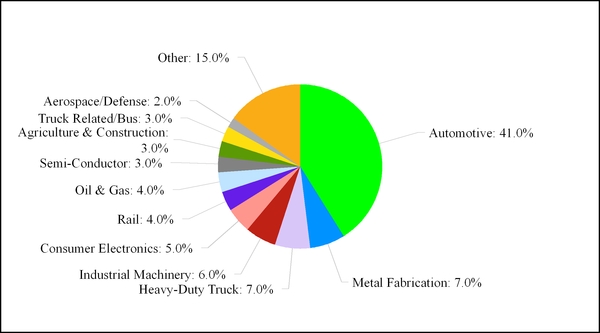
The following chart reflects our end-use market mix for the year ended December 31, 2014:
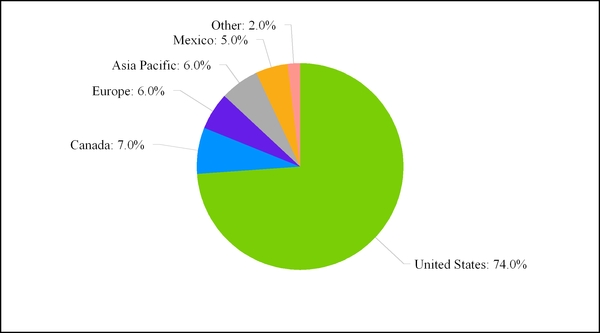
The following chart reflects our geographic mix for the year ended December 31, 2014:
4
The following table summarizes the key attributes of each of our business segments:
Supply Technologies | Assembly Components | Engineered Products | |||
NET SALES FOR 2014 | $559.6 million (40% of total) | $490.5 million (36% of total) | $328.6 million (24% of total) | ||
SELECTED PRODUCTS | Sourcing, planning and procurement of over 190,000 production components, including: • Fasteners • Pins • Valves • Hoses • Wire harnesses • Clamps and fittings • Rubber and plastic components | • Control arms • Front engine covers • Knuckles • Injection molded rubber products • Pump housings • Clutch retainers/pistons • Master cylinders • Rubber and thermoplastic hose • Oil pans • Flywheel spacers • Steering racks • Fuel filler assemblies • Gasoline direct injection systems | • Induction heating and melting systems • Pipe threading systems • Industrial oven systems • Forging presses | ||
SELECTED INDUSTRIES SERVED | • Heavy-duty truck • Automotive, truck and vehicle parts • Power sports and recreational equipment • Bus and coaches • Electrical distribution and controls • Agricultural and construction equipment • Consumer electronics • HVAC • Lawn and garden • Semiconductor equipment • Aerospace and defense • Plumbing | • Automotive • Agricultural equipment • Construction equipment • Heavy-duty truck • Marine equipment | • Ferrous and non-ferrous metals • Coatings • Forging • Foundry • Heavy-duty truck • Construction equipment • Silicon • Automotive • Oil and gas • Rail and locomotive manufacturing • Aerospace and defense | ||
Supply Technologies
Our Supply Technologies business provides our customers with Total Supply Management™, a proactive solutions approach that manages the efficiencies of every aspect of supplying production parts and materials to our customers’ manufacturing floor, from strategic planning to program implementation. Total Supply Management™ includes such services as engineering and design support, part usage and cost analysis, supplier selection, quality assurance, bar coding, product packaging and tracking, just-in-time and point-of-use delivery, electronic billing services and ongoing technical support. We operate 55 logistics service centers in the United States, Mexico, Canada, Puerto Rico, Scotland, Hungary, China, Taiwan, Singapore, India, United Kingdom and Ireland, as well as production sourcing and support centers in Asia. Through our supply chain management programs, we supply more than 190,000 globally-sourced production components, many of which are specialized and customized to meet individual customers’ needs.
Products and Services. Total Supply Management™ provides our customers with an expert partner in strategic planning, global sourcing, technical services, parts and materials, logistics, distribution and inventory management of production components. Some production components are characterized by low per unit supplier prices relative to the indirect costs of supplier management, quality assurance, inventory management and delivery to the production line. In addition, Supply Technologies delivers an increasingly broad range of higher-cost production components including valves, electro-mechanical
5
hardware, fittings, steering components and many others. Applications engineering specialists and the direct sales force work closely with the engineering staff of OEM customers to recommend the appropriate production components for a new product or to suggest alternative components that reduce overall production costs, streamline assembly or enhance the appearance or performance of the end product. As an additional service, Supply Technologies also provides spare parts and aftermarket products to end users of its customers’ products.
Total Supply Management™ services are typically provided to customers pursuant to sole-source arrangements. We believe our services distinguish us from traditional buy/sell distributors, as well as manufacturers who supply products directly to customers, because we outsource our customers’ high-volume production components supply chain management, providing processes customized to each customer’s needs and replacing numerous current suppliers with a sole-source relationship. Our highly-developed, customized, information systems provide transparency and flexibility through the complete supply chain. This enables our customers to: (1) significantly reduce the direct and indirect cost of production component processes by outsourcing internal purchasing, quality assurance and inventory fulfillment responsibilities; (2) reduce the amount of working capital invested in inventory and floor space; (3) reduce component costs through purchasing efficiencies, including bulk buying and supplier consolidation; and (4) receive technical expertise in production component selection and design and engineering. Our sole-source arrangements foster long-term, entrenched supply relationships with our customers and, as a result, the average tenure of service for our top 50 Supply Technologies clients exceeds six years. Supply Technologies’ remaining sales are generated through the wholesale supply of industrial products to other manufacturers and distributors pursuant to master or authorized distributor relationships.
The Supply Technologies segment also engineers and manufactures precision cold formed and cold extruded products, including locknuts, SPAC® nuts and wheel hardware, which are principally used in applications where controlled tightening is required due to high vibration. Supply Technologies produces both standard items and specialty products to customer specifications, which are used in large volumes by customers in the automotive, heavy-duty truck and rail industries.
Markets and Customers. For the year ended December 31, 2014, approximately 74% of Supply Technologies’ net sales were to domestic customers. Remaining sales were primarily to manufacturing facilities of large, multinational customers located in Canada, Mexico, Europe and Asia. Total Supply Management™ services and production components are used extensively in a variety of industries, and demand is generally related to the state of the economy and to the overall level of manufacturing activity.
Supply Technologies markets and sells its services to over 8,100 customers domestically and internationally. The principal industries served by Supply Technologies are the heavy-duty truck; automotive, truck and vehicle parts; power sports and recreational equipment; bus and coaches; electrical distribution and controls; agricultural and construction equipment; consumer electronics; HVAC; lawn and garden; semiconductor equipment; aerospace and defense; and plumbing. The five largest customers, within which Supply Technologies sells through sole-source contracts to multiple operating divisions or locations, accounted for approximately 32% of the sales of Supply Technologies in 2014 and 31% in 2013. The loss of any two of its top five customers could have a material adverse effect on the results of operations and financial condition of this segment.
Competition. A limited number of companies compete with Supply Technologies to provide supply management services for production parts and materials. Some global competitors include Anixter, Bossard and Wurth, and some domestic competitors include Endries, Fastenal and General. Supply Technologies competes in North America, Mexico, Europe and Asia, primarily on the basis of its Total Supply Management™ services, including engineering and design support, part usage and cost analysis, supplier selection, quality assurance, bar coding, product packaging and tracking, just-in-time and point-of-use delivery, electronic billing services and ongoing technical support, and its geographic reach, extensive product selection, price and reputation for high service levels. Numerous North American and foreign companies compete with Supply Technologies in manufacturing cold-formed and cold-extruded products.
Recent Developments. On June 10, 2014, we acquired all the outstanding capital stock of Apollo Aerospace Group (“Apollo”). Apollo is a supply chain management services company providing Class C production components and supply chain solutions to aerospace customers worldwide. Apollo's net sales for its fiscal year ended March 31, 2014 totaled
6
approximately $8.1 million. For more information about the acquisition of Apollo, see Note 3 to the consolidated financial statements included elsewhere herein.
Assembly Components
Our Assembly Components segment operates what we believe is one of the few aluminum component suppliers that have the capability to provide a wide range of high-volume, high-quality products utilizing a broad range of processes including gravity and low pressure permanent mold, die-cast and lost-foam, as well as emerging alternative casting technologies. In 2012, we added machining capabilities to our aluminum products service offerings. We also design and manufacture fluid routing, gasoline direct injection systems, injection molded rubber and thermoplastic and screw products.
Products and Services. Assembly Components manufactures cast aluminum components, automotive and industrial rubber and thermoplastic products, fuel filler, gasoline direct injection systems and hydraulic assemblies for automotive, agricultural equipment, construction equipment, heavy-duty truck and marine equipment industries. Assembly Components’ principal products include front engine covers, control arms, knuckles, pump housings, clutch retainers and pistons, master cylinders, oil pans and flywheel spacers, injected molded rubber and silicone products, including wire harnesses, shock and vibration mounts, spark plug boots and nipples and general sealing gaskets, rubber and thermoplastic hose, fuel filler assemblies and gasoline direct injection systems. We produce our Assembly Components at twenty-five manufacturing facilities in Ohio, Michigan, Indiana, Tennessee, Florida, Georgia, Mexico, China and the Czech Republic. In addition, we also provide value-added services such as design engineering, machining and part assembly.
Markets and Customers. The five largest customers, to which Assembly Components sells to multiple operating divisions through sole-source contracts, accounted for approximately 46% of Assembly Components sales for 2014 and 45% for 2013. The loss of any one of these customers could have a material adverse effect on the results of operations and financial condition of this segment.
Competition. Assembly Components competes principally on the basis of its ability to: (1) engineer and manufacture high-quality, cost-effective, assemblies utilizing multiple technologies in large volumes; (2) provide timely delivery; and (3) retain the manufacturing flexibility necessary to quickly adjust to the needs of its customers. There are few domestic companies with capabilities able to meet the customers’ stringent quality and service standards and lean manufacturing techniques. As one of these suppliers, Assembly Components is well-positioned to benefit as customers continue to consolidate their supplier base. Principal competitors in the Assembly Components segment are Chassix, Martinrea and Stant.
Recent Developments. Effective October 10, 2014, the Company acquired all the outstanding capital stock of Autoform Tool & Manufacturing (“Autoform”) for a total purchase consideration of $48.9 million in cash. The acquisition was funded from borrowings under the revolving credit facility provided by the Credit Agreement (as defined herein). Autoform is a supplier of high-end pressure fuel lines used in gasoline direct injection systems across a large number of engine platforms. Autoform's production facilities are located in Indiana. The financial results of Autoform are included in the Company’s Assembly Components segment and contributed $13.1 million in revenues in 2014 and were accretive from the date acquired. The purchase of Autoform was accounted for under the acquisition method of accounting.
Engineered Products
Our Engineered Products segment operates a diverse group of niche manufacturing businesses that design and manufacture a broad range of highly-engineered products, including induction heating and melting systems, pipe threading systems and forged and machined products. We manufacture these products in twelve domestic facilities and twelve international facilities in Canada, Mexico, the United Kingdom, Belgium, Germany, China, Italy, India and Japan.
Products and Services. Our induction heating and melting business utilizes proprietary technology and specializes in the engineering, construction, service and repair of induction heating and melting systems, primarily for the ferrous and non-ferrous metals, silicon, coatings, forging, foundry, automotive and construction equipment industries. Our induction heating and melting systems are engineered and built to customer specifications and are used primarily for melting, heating, and surface hardening of metals and curing of coatings. Approximately 56% of our induction heating and melting systems’ revenues are derived from the sale of replacement parts and provision of field service, primarily for the installed base of our own products. Our pipe threading business serves the oil and gas industry. We also engineer and install mechanical forging presses, sell spare
7
parts and provide field service for the large existing base of mechanical forging presses and hammers in North America. We machine, induction harden and surface finish crankshafts and camshafts, used primarily in locomotives. We forge aerospace and defense structural components such as landing gears and struts, as well as rail products such as railcar center plates and draft lugs.
Markets and Customers. We sell induction heating and other capital equipment to component manufacturers and OEMs in the ferrous and non-ferrous metals, silicon, coatings, forging, foundry, automotive, truck, construction equipment and oil and gas industries. We sell forged and machined products to locomotive manufacturers, machining companies and sub-assemblers who finish aerospace and defense products for OEMs, and railcar builders and maintenance providers.
Competition. We compete with small-to medium-sized domestic and international equipment manufacturers on the basis of service capability, ability to meet customer specifications, delivery performance and engineering expertise. We compete domestically and internationally with small-to medium-sized forging and machining businesses on the basis of product quality and precision.
Recent Developments. On December 4, 2014, we acquired all of the outstanding capital stock of Saet S.p.A (“Saet”) for a total purchase consideration of $22.1 million in cash. Saet is a leader in the design, manufacturing and testing of induction heating equipment and heat treat solutions. Saet operates through its locations in Italy, China, India and Tennessee. The financial results of Saet are included in the Company's Engineered Products segment.
Sales and Marketing
Supply Technologies markets its products and services in the United States, Mexico, Canada, Western and Eastern Europe and East and South Asia primarily through its direct sales force, which is assisted by applications engineers who provide the technical expertise necessary to assist the engineering staff of OEM customers in designing new products and improving existing products. Assembly Components primarily markets and sells its products in North America through internal sales personnel and independent sales representatives. Engineered Products primarily markets and sells its products in North America through both internal sales personnel and independent sales representatives. Induction heating and pipe threading equipment is also marketed and sold in Europe, Asia, Latin America and Africa through both internal sales personnel and independent sales representatives. In some instances, the internal engineering staff assists in the sales and marketing effort through joint design and applications-engineering efforts with major customers.
Raw Materials and Suppliers
Supply Technologies purchases substantially all of its production components from third-party suppliers. Supply Technologies has multiple sources of supply for its components. An increasing portion of Supply Technologies’ production components are purchased from suppliers in foreign countries, primarily Canada, Taiwan, China, South Korea, Singapore, India and multiple European countries. Supply Technologies is dependent upon the ability of such suppliers to meet stringent quality and performance standards and to conform to delivery schedules. Assembly Components and Engineered Products purchase substantially all of their raw materials, principally metals and certain component parts incorporated into their products, from third-party suppliers and manufacturers. Most raw materials required by Assembly Components and Engineered Products are commodity products available from several domestic suppliers. Management believes that raw materials and component parts other than certain specialty products are available from alternative sources.
Our suppliers of raw materials and component parts may significantly and quickly increase their prices in response to increases in costs of the raw materials, such as steel, that they use to manufacture our raw materials and component parts. We generally attempt to pass along increased raw materials prices to our customers in the form of price increases, there may be a time delay between the increased raw materials prices and our ability to increase the price of our products, or we may be unable to increase the prices of our products due to pricing pressure or other factors. See the discussion of risks associated with raw material supply and costs in Item 1A "Risk Factors".
Backlog
8
Management believes that backlog is not a meaningful measure for Supply Technologies, as a majority of Supply Technologies’ customers require just-in-time delivery of production components. Management believes that Assembly Components’ backlog as of any particular date is not a meaningful measure of sales for any future period as a significant portion of sales are on a release or firm order basis. The backlog of Engineered Products’ orders believed to be firm as of December 31, 2014 was $199.7 million compared with $145.3 million as of December 31, 2013. Approximately 74% of Engineered Products’ backlog as of December 31, 2014 is scheduled to be shipped in 2015.
Environmental, Health and Safety Regulations
We are subject to numerous federal, state and local laws and regulations designed to protect public health and the environment, particularly with regard to discharges and emissions, as well as handling, storage, treatment and disposal, of various substances and wastes. Our failure to comply with applicable environmental laws and regulations and permit requirements could result in civil and criminal fines or penalties or enforcement actions, including regulatory or judicial orders enjoining or curtailing operations or requiring corrective measures. Pursuant to certain environmental laws, owners or operators of facilities may be liable for the costs of response or other corrective actions for contamination identified at or emanating from current or former locations, without regard to whether the owner or operator knew of, or was responsible for, the presence of any such contamination, and for related damages to natural resources. Additionally, persons who arrange for the disposal or treatment of hazardous substances or materials may be liable for costs of response at sites where they are located, whether or not the site is owned or operated by such person.
From time to time, we have incurred, and are presently incurring, costs and obligations for correcting environmental noncompliance and remediating environmental conditions at certain of our properties. In general, we have not experienced difficulty in complying with environmental laws in the past, and compliance with environmental laws has not had a material adverse effect on our financial condition, liquidity and results of operations. Our capital expenditures on environmental control facilities were not material during the past five years and such expenditures are not expected to be material to us in the foreseeable future.
We are currently, and may in the future be, required to incur costs relating to the investigation or remediation of property, including property where we have disposed of our waste, and for addressing environmental conditions. For instance, we have been identified as a potentially responsible party at third-party sites under the Comprehensive Environmental Response, Compensation and Liability Act of 1980, as amended, or comparable state laws, which provide for strict and, under certain circumstances, joint and several liability. We are participating in the cost of certain clean-up efforts at several of these sites. The availability of third-party payments or insurance for environmental remediation activities is subject to risks associated with the willingness and ability of the third party to make payments. However, our share of such costs has not been material and, based on available information, we do not expect our exposure at any of these locations to have a material adverse effect on our results of operations, liquidity or financial condition.
Information as to Segment Reporting and Geographic Areas
The information contained in Note 2 to the consolidated financial statements included elsewhere herein relating to (1) net sales, income before income taxes, identifiable assets and other information by segment and (2) net sales and assets by geographic region for the years ended December 31, 2014, 2013 and 2012 is incorporated herein by reference.
Recent Developments
On June 10, 2014, we acquired all the outstanding stock of Apollo for approximately $5.4 million in cash. Apollo is a supply chain management services company providing Class C production components and supply chain solutions to aerospace customers worldwide. Apollo's net sales for its fiscal year ended March 31, 2014 totaled approximately $8.1 million.
On October 10, 2014, we acquired all the outstanding capital stock of Autoform for approximately $48.9 million in cash. The acquisition was funded from borrowings under the revolving credit facility provided by the Credit Agreement. Autoform is a supplier of high-end pressure fuel lines used in gasoline direct injection systems across a large number of engine platforms. Autoform's production facilities are located in Indiana. The financial results of Autoform are included in the Company's Assembly Components segment and contributed $13.1 million in revenues in 2014 and were accretive from the date acquired.
9
On December 4, 2014, we acquired all the outstanding capital stock of Saet for approximately $22.1 million in cash. Saet is a leader in the design, manufacturing and testing of induction heating equipment and heat treat solutions. Saet operates through its locations in Italy, China, India and Tennessee. The financial results of Saet are included in the Company's Engineered Products segment.
IPSCO Tubulars Inc. d/b/a TMK IPSCO sued Ajax Tocco Magnethermic Corporation ("ATM"), a subsidiary of Park-Ohio Industries, Inc., in the United States District Court for the Eastern District of Arkansas claiming that equipment supplied by ATM for heat treating certain steel pipe at IPSCO’s Blytheville, Arkansas facility did not perform as required by the contract. The complaint alleged causes of action for breach of contract, gross negligence, and constructive fraud. IPSCO sought approximately $10 million in damages plus an unspecified amount of punitive damages. ATM denied the allegations. ATM subsequently obtained summary judgment on the constructive fraud claim, which was dismissed by the district court prior to trial. The remaining claims were the subject of a bench trial that occurred in May 2013. After IPSCO presented its case, the district court entered partial judgment in favor of ATM, dismissing the gross negligence claim, a portion of the breach of contract claim, and any claim for punitive damages. The trial proceeded with respect to the remainder of IPSCO’s claim for breach of contract. In September 2013, the district court issued a judgment in favor of IPSCO in the amount of $5.2 million. IPSCO subsequently filed a motion seeking to recover $3.8 million in attorneys’ fees and costs. The district court reserved ruling on that issue pending an appeal. In October 2013, ATM filed an appeal with the U.S. Court of Appeals for the Eighth Circuit seeking reversal of the judgment in favor of IPSCO. In November 2013, IPSCO filed a cross-appeal seeking reversal of the dismissal of its claims for gross negligence and punitive damages. The Eighth Circuit issued an opinion in March 2015 affirming in part, reversing in part, and remanding the case. It affirmed the district court's determination that ATM was liable for breach of contract. It also affirmed the district court's dismissal of IPSCO's claims for gross negligence and punitive damages. However, the Eighth Circuit reversed nearly all of the damages awarded by the district court and remanded for further findings on the issue of damages, including whether consequential damages are barred under the express language of the contract. Because IPSCO did not appeal the award of $5.2 million in its favor, those damages may be decreased, but cannot be increased, on remand. IPSCO's motion to recover attorneys' fees and costs is stayed pending the outcome of the proceedings on remand.
Available Information
We file annual reports on Form 10-K, quarterly reports on Form 10-Q, current reports on Form 8-K proxy statements and other information, including amendments to these reports and statements, with the Securities and Exchange Commission (“SEC”). The public can obtain copies of these materials by visiting the SEC’s Public Reference Room at 100 F Street, NE, Washington, D.C. 20549, by calling the SEC at 1-800-SEC-0330, or by accessing the SEC’s website at http://www.sec.gov. In addition, as soon as reasonably practicable after such materials are filed with or furnished to the SEC, we make such materials available on our website free of charge at http://www.pkoh.com. The information on our website is not a part of this annual report on Form 10-K.
Item 1A. Risk Factors
The following are certain risk factors that could affect our business, results of operations and financial condition. These risks are not the only ones we face. If any of the following risks occur, our business, results of operations or financial condition could be adversely affected.
Adverse credit market conditions may significantly affect our access to capital, cost of capital and ability to meet liquidity needs.
Disruptions, uncertainty or volatility in the credit markets may adversely impact our ability to access credit already arranged and the availability and cost of credit to us in the future. These market conditions may limit our ability to replace, in a timely manner, maturing liabilities and access the capital necessary to grow and maintain our business. Accordingly, we may be forced to delay raising capital or pay unattractive interest rates, which could increase our interest expense, decrease our profitability and significantly reduce our financial flexibility. Longer-term disruptions in the capital and credit markets as a result of uncertainty, changing or increased regulation, reduced alternatives or failures of significant financial institutions could adversely affect our access to liquidity needed for our business. Any disruption could require us to take measures to conserve
10
cash until the markets stabilize or until alternative credit arrangements or other funding for our business needs can be arranged. Such measures could include deferring capital expenditures and reducing or eliminating future share repurchases or other discretionary uses of cash. Overall, our results of operations, financial condition and cash flows could be materially adversely affected by disruptions in the credit markets.
Adverse global economic conditions may have significant effects on our customers and suppliers that could result in material adverse effects on our business and operating results.
Significant reductions in available capital and liquidity from banks and other providers of credit, substantial reductions and fluctuations in equity and currency values worldwide, volatility in commodity prices for such items as crude oil, and concerns that the worldwide economy may enter into a prolonged recessionary period, may materially adversely affect our customers’ access to capital or willingness to spend capital on our products or their ability to pay for products that they will order or have already ordered from us. In addition, unfavorable global economic conditions may materially adversely affect our suppliers’ access to capital and liquidity with which they maintain their inventories, production levels and product quality, which could cause them to raise prices or lower production levels.
These potential effects of adverse global economic conditions are difficult to forecast and mitigate. As a consequence, our operating results for a particular period are difficult to predict, and, therefore, prior results are not necessarily indicative of results to be expected in future periods. Any of the foregoing effects could have a material adverse effect on our business, results of operations and financial condition.
Adverse global economic conditions may have significant effects on our customers that would result in our inability to borrow or to meet our debt service coverage ratio in our revolving credit facility.
As of December 31, 2014, we were in compliance with our debt service coverage ratio covenant and other covenants contained in our revolving credit facility. While we expect to remain in compliance throughout 2015, declines in demand in the automotive industry and in sales volumes could adversely impact our ability to remain in compliance with certain of these financial covenants. Additionally, to the extent our customers are adversely affected by a decline in the economy in general, they may not be able to pay their accounts payable to us on a timely basis or at all, which would make the accounts receivable ineligible for purposes of the revolving credit facility and could reduce our borrowing base and our ability to borrow.
The industries in which we operate are cyclical and are affected by the economy in general.
We sell products to customers in industries that experience cyclicality (expectancy of recurring periods of economic growth and slowdown) in demand for products and may experience substantial increases and decreases in business volume throughout economic cycles. Industries we serve, including the automotive and vehicle parts, heavy-duty truck, industrial equipment, steel, rail, oil and gas, electrical distribution and controls, aerospace and defense, recreational equipment, HVAC, electrical components, appliance and semiconductor equipment industries, are affected by consumer spending, general economic conditions and the impact of international trade. A downturn in any of the industries we serve could have a material adverse effect on our financial condition, liquidity and results of operations.
Because a significant portion of our sales is to the automotive and heavy-duty truck industries, a decrease in the demand of these industries or the loss of any of our major customers in these industries could adversely affect our financial health.
Demand for certain of our products is affected by, among other things, the relative strength or weakness of the automotive and heavy-duty truck industries. The domestic automotive and heavy-duty truck industries are highly cyclical and may be adversely affected by international competition. In addition, the automotive and heavy-duty truck industries are significantly unionized and subject to work slowdowns and stoppages resulting from labor disputes. We derived 41% and 7% of our net sales during the year ended December 31, 2014 from the automotive and heavy-duty truck industries, respectively.
The loss of a portion of business to any of our major automotive or heavy-duty truck customers could have a material adverse effect on our financial condition, cash flow and results of operations. We cannot assure you that we will maintain or improve our relationships in these industries or that we will continue to supply these customers at current levels.
11
Our Supply Technologies customers are generally not contractually obligated to purchase products and services from us.
Most of the products and services are provided to our Supply Technologies customers under purchase orders as opposed to long-term contracts. When we do enter into long-term contracts with our Supply Technologies customers, many of them only establish pricing terms and do not obligate our customers to buy required minimum amounts from us or to buy from us exclusively. Accordingly, many of our Supply Technologies customers may decrease the amount of products and services that they purchase from us or even stop purchasing from us altogether, either of which could have a material adverse effect on our net sales and profitability.
We are dependent on key customers.
We rely on several key customers. For the year ended December 31, 2014, our ten largest customers accounted for approximately 33% of our net sales. Many of our customers place orders for products on an as-needed basis and operate in cyclical industries and, as a result, their order levels have varied from period to period in the past and may vary significantly in the future. Due to competitive issues, we have lost key customers in the past and may again in the future. Customer orders are dependent upon their markets and may be subject to delays or cancellations. As a result of dependence on our key customers, we could experience a material adverse effect on our business and results of operations if any of the following were to occur:
• | the loss of any key customer, in whole or in part; |
• | the insolvency or bankruptcy of any key customer; |
• | a declining market in which customers reduce orders or demand reduced prices; or |
• | a strike or work stoppage at a key customer facility, which could affect both their suppliers and customers. |
If any of our key customers become insolvent or file for bankruptcy, our ability to recover accounts receivable from that customer would be adversely affected and any payments we received in the preference period prior to a bankruptcy filing may be potentially recoverable, which could adversely impact our results of operations.
We operate in highly competitive industries.
The markets in which all three of our segments sell their products are highly competitive. Some of our competitors are large companies that have greater financial resources than we have. We believe that the principal competitive factors for our Supply Technologies segment are an approach reflecting long-term business partnership and reliability, sourced product quality and conformity to customer specifications, timeliness of delivery, price and design and engineering capabilities. We believe that the principal competitive factors for our Assembly Components and Engineered Products segments are product quality and conformity to customer specifications, design and engineering capabilities, product development, timeliness of delivery and price. The rapidly evolving nature of the markets in which we compete may attract new entrants as they perceive opportunities, and our competitors may foresee the course of market development more accurately than we do. In addition, our competitors may develop products that are superior to our products or may adapt more quickly than we do to new technologies or evolving customer requirements.
We expect competitive pressures in our markets to remain strong. These pressures arise from existing competitors, other companies that may enter our existing or future markets and, in some cases, our customers, which may decide to internally produce items we sell. We cannot assure you that we will be able to compete successfully with our competitors. Failure to compete successfully could have a material adverse effect on our financial condition, liquidity and results of operations.
The loss of key executives could adversely impact us.
Our success depends upon the efforts, abilities and expertise of our executive officers and other senior managers, including Edward Crawford, our Chairman and Chief Executive Officer, and Matthew Crawford, our President and Chief Operating Officer, as well as the president of each of our operating units. An event of default occurs under our revolving credit facility if Messrs. E. Crawford and M. Crawford or certain of their related parties own in the aggregate less than 15% of Holdings’ outstanding common stock and if at such time neither Mr. E. Crawford nor Mr. M. Crawford holds the office of chairman, chief executive officer or president. The loss of the services of Messrs. E. Crawford and M. Crawford, senior and
12
executive officers, and/or other key individuals could have a material adverse effect on our financial condition, liquidity and results of operations.
We may encounter difficulty in expanding our business through targeted acquisitions.
We have pursued, and may continue to pursue, targeted acquisition opportunities that we believe would complement our business. We cannot assure you that we will be successful in consummating any acquisitions.
Any targeted acquisitions will be accompanied by the risks commonly encountered in acquisitions of businesses. We may not successfully overcome these risks or any other problems encountered in connection with any of our acquisitions, including the possible inability to integrate an acquired business’ operations, information technology, services and products into our business, diversion of management’s attention, the assumption of unknown liabilities, increases in our indebtedness, the failure to achieve the strategic objectives of those acquisitions and other unanticipated problems, some or all of which could materially and adversely affect us. The process of integrating operations could cause an interruption of, or loss of momentum in, our activities. Any delays or difficulties encountered in connection with any acquisition and the integration of our operations could have a material adverse effect on our business, results of operations, financial condition or prospects of our business.
Our Supply Technologies business depends upon third parties for substantially all of our component parts.
Our Supply Technologies business purchases substantially all of its component parts from third-party suppliers and manufacturers. As such, it is subject to the risk of price fluctuations and periodic delays in the delivery of component parts. Failure by suppliers to continue to supply us with these component parts on commercially reasonable terms, or at all, could have a material adverse effect on us. We depend upon the ability of these suppliers, among other things, to meet stringent performance and quality specifications and to conform to delivery schedules. Failure by third-party suppliers to comply with these and other requirements could have a material adverse effect on our financial condition, liquidity and results of operations.
The raw materials used in our production processes and by our suppliers of component parts are subject to price and supply fluctuations that could increase our costs of production and adversely affect our results of operations.
Our supply of raw materials for our Assembly Components and Engineered Products businesses could be interrupted for a variety of reasons, including availability and pricing. Prices for raw materials necessary for production have fluctuated significantly in the past and significant increases could adversely affect our results of operations and profit margins. While we generally attempt to pass along increased raw materials prices to our customers in the form of price increases, there may be a time delay between the increased raw materials prices and our ability to increase the price of our products, or we may be unable to increase the prices of our products due to pricing pressure or other factors.
Our suppliers of component parts, particularly in our Supply Technologies business, may significantly and quickly increase their prices in response to increases in costs of the raw materials, such as steel, that they use to manufacture our component parts. We may not be able to increase our prices commensurate with our increased costs. Consequently, our results of operations and financial condition may be materially adversely affected.
The energy costs involved in our production processes and transportation are subject to fluctuations that are beyond our control and could significantly increase our costs of production.
Our manufacturing process and the transportation of raw materials, components and finished goods are energy intensive. Our manufacturing processes are dependent on adequate supplies of electricity and natural gas. A substantial increase in the cost of transportation fuel, natural gas or electricity could have a material adverse effect on our margins. We may experience higher than anticipated gas costs in the future, which could adversely affect our results of operations. In addition, a disruption or curtailment in supply could have a material adverse effect on our production and sales levels.
13
Potential product liability risks exist from the products that we sell.
Our businesses expose us to potential product liability risks that are inherent in the design, manufacture and sale of our products and products of third-party vendors that we use or resell. While we currently maintain what we believe to be suitable and adequate product liability insurance, we cannot assure you that we will be able to maintain our insurance on acceptable terms or that our insurance will provide adequate protection against potential liabilities. In the event of a claim against us, a lack of sufficient insurance coverage could have a material adverse effect on our financial condition, liquidity and results of operations. Moreover, even if we maintain adequate insurance, any successful claim could have a material adverse effect on our financial condition, liquidity and results of operations.
Some of our employees belong to labor unions, and strikes or work stoppages could adversely affect our operations.
As of December 31, 2014, we were a party to seven collective bargaining agreements with various labor unions that covered approximately 600 full-time employees. Our inability to negotiate acceptable contracts with these unions could result in, among other things, strikes, work stoppages or other slowdowns by the affected workers and increased operating costs as a result of higher wages or benefits paid to union members. If the unionized workers were to engage in a strike, work stoppage or other slowdown, or other employees were to become unionized, we could experience a significant disruption of our operations and higher ongoing labor costs, which could have a material adverse effect on our business, financial condition and results of operations.
We operate and source internationally, which exposes us to the risks of doing business abroad.
Our operations are subject to the risks of doing business abroad, including the following:
• | fluctuations in currency exchange rates; |
• | limitations on ownership and on repatriation of earnings; |
• | transportation delays and interruptions; |
• | political, social and economic instability and disruptions; |
• | potential disruption that could be caused with the partial or complete reconfiguration of the European Union; |
• | government embargoes or foreign trade restrictions; |
• | the imposition of duties and tariffs and other trade barriers; |
• | import and export controls; |
• | labor unrest and current and changing regulatory environments; |
• | the potential for nationalization of enterprises; |
• | disadvantages of competing against companies from countries that are not subject to U.S. laws and regulations including the U.S. Foreign Corrupt Practices Act (“FCPA”); |
• | difficulties in staffing and managing multinational operations; |
• | limitations on our ability to enforce legal rights and remedies; and |
• | potentially adverse tax consequences. |
In addition, we could be adversely affected by violations of the FCPA and similar worldwide anti-bribery laws. The FCPA and similar anti-bribery laws in other jurisdictions generally prohibit companies and their intermediaries from making improper payments to non-U.S. officials for the purpose of obtaining or retaining business. Our policies mandate compliance with these anti-bribery laws. We operate in many parts of the world that have experienced governmental corruption to some degree and, in certain circumstances, strict compliance with anti-bribery laws may conflict with local customs and practices. We cannot assure you that our internal controls and procedures always will protect us from the reckless or criminal acts committed by our employees or agents. For example, in connection with responding to a subpoena from the staff of the SEC, regarding a third party, we disclosed to the staff that the third party participated in a payment on our behalf to a foreign tax official that implicates the FCPA. If we are found to be liable for FCPA violations (either due to our own acts or our inadvertence or due to the acts or inadvertence of others), we could suffer from criminal or civil penalties or other sanctions, which could have a material adverse effect on our business.
Any of the events enumerated above could have an adverse effect on our operations in the future by reducing the demand for our products and services, decreasing the prices at which we can sell our products or otherwise having an adverse effect on
14
our business, financial condition or results of operations. We cannot assure you that we will continue to operate in compliance with applicable customs, currency exchange control regulations, transfer pricing regulations or any other laws or regulations to which we may be subject. We also cannot assure you that these laws will not be modified.
Unexpected delays in the shipment of large, long-lead industrial equipment could adversely affect our results of operations in the period in which shipment was anticipated.
Long-lead industrial equipment contracts are a significant and growing part of our business. We primarily use the percentage of completion method to account for these contracts. Nevertheless, under this method, a large proportion of revenues and earnings on such contracts are recognized close to shipment of the equipment. Unanticipated shipment delays on large contracts could postpone recognition of revenue and earnings into future periods. Accordingly, if shipment was anticipated in the fourth quarter of a year, unanticipated shipment delays could adversely affect results of operations in that year.
We are subject to significant environmental, health and safety laws and regulations and related compliance expenditures and liabilities.
Our businesses are subject to many foreign, federal, state and local environmental, health and safety laws and regulations, particularly with respect to the use, handling, treatment, storage, discharge and disposal of substances and hazardous wastes used or generated in our manufacturing processes. Compliance with these laws and regulations is a significant factor in our business. We have incurred and expect to continue to incur significant expenditures to comply with applicable environmental laws and regulations. Our failure to comply with applicable environmental laws and regulations and permit requirements could result in civil or criminal fines or penalties or enforcement actions, including regulatory or judicial orders enjoining or curtailing operations or requiring corrective measures, installation of pollution control equipment or remedial actions.
We are currently, and may in the future be, required to incur costs relating to the investigation or remediation of property, including property where we have disposed of our waste, and for addressing environmental conditions. Some environmental laws and regulations impose liability and responsibility on present and former owners, operators or users of facilities and sites for contamination at such facilities and sites without regard to causation or knowledge of contamination. In addition, we occasionally evaluate various alternatives with respect to our facilities, including possible dispositions or closures. Investigations undertaken in connection with these activities may lead to discoveries of contamination that must be remediated, and closures of facilities may trigger compliance requirements that are not applicable to operating facilities. Consequently, we cannot assure you that existing or future circumstances, the development of new facts or the failure of third parties to address contamination at current or former facilities or properties will not require significant expenditures by us.
We expect to continue to be subject to increasingly stringent environmental and health and safety laws and regulations. It is difficult to predict the future interpretation and development of environmental and health and safety laws and regulations or their impact on our future earnings and operations. We anticipate that compliance will continue to require increased capital expenditures and operating costs. Any increase in these costs, or unanticipated liabilities arising from, among other things, discovery of previously unknown conditions or more aggressive enforcement actions, could adversely affect our results of operations, and there is no assurance that they will not exceed our reserves or have a material adverse effect on our financial condition.
If our information systems fail, our business could be materially affected.
We believe that our information systems are an integral part of the Supply Technologies segment and, to a lesser extent, the Assembly Components and Engineered Products segments. We depend on our information systems to process orders, manage inventory and accounts receivable collections, purchase products, maintain cost-effective operations, route and re-route orders, maintain confidential and proprietary information and provide superior service to our customers. These systems are subject to failure due to design flaws, improper use, cyber intrusions and other electronic service breaches. We cannot assure you that a failure of or a disruption in the operation of our information systems used by Supply Technologies, including the failure of the supply chain management software to function properly, or those used by Assembly Components and Engineered Products, will not occur. Any such failure or disruption could damage our relation with our customer in our industries or otherwise have a material adverse effect on our financial condition, liquidity and results of operations
15
Operating problems in our business may materially adversely affect our financial condition and results of operations.
We are subject to the usual hazards associated with manufacturing and the related storage and transportation of raw materials, products and waste, including explosions, fires, leaks, discharges, inclement weather, natural disasters, mechanical failure, unscheduled downtime and transportation interruption or calamities. The occurrence of material operating problems at our facilities may have a material adverse effect on our operations as a whole, both during and after the period of operational difficulties.
Changes in accounting standards or inaccurate estimates or assumptions in the application of accounting policies could adversely affect our financial results.
Our accounting policies and methods are fundamental to how we record and report our financial condition and results of operations. Some of these polices require use of estimates and assumptions that may affect the reported value of our assets or liabilities and financial results and are critical because they require management to make difficult, subjective, and complex judgments about matters that are inherently uncertain. Those who set and interpret the accounting standards (such as the Financial Accounting Standards Board, the SEC, and our independent registered public accounting firm) may amend or even reverse their previous interpretations or positions on how these standards should be applied. These changes can be hard to predict and can materially impact how we record and report our financial condition and results of operations. In some cases, we could be required to apply a new or revised standard retroactively, resulting in the restatement of prior period financial statements. For a further discussion of some of our critical accounting policies and standards and recent changes, see Critical Accounting Policies and Estimates in Management’s Discussion and Analysis of Financial Condition and Results of Operations and Note 1 to the consolidated financial statements included elsewhere herein.
We have a significant amount of goodwill, and any future goodwill impairment charges could adversely impact our results of operations.
As of December 31, 2014, we had goodwill of $89.5 million. The future occurrence of a potential indicator of impairment, such as a significant adverse change in legal factors or business climate, an adverse action or assessment by a regulator, unanticipated competition, a material negative change in relationships with significant customers, strategic decisions made in response to economic or competitive conditions, loss of key personnel or a more-likely-than-not expectation that a reporting unit or a significant portion of a reporting unit will be sold or disposed of, could result in goodwill impairment charges, which could adversely impact our results of operations. We have recorded goodwill impairment charges in the past, and such charges materially impacted our historical results of operations. For additional information, see Note 5, Goodwill, to the consolidated financial statements included elsewhere herein.
Our Chairman of the Board and Chief Executive Officer and our President and Chief Operating Officer collectively beneficially own a significant portion of Holdings’ outstanding common stock and their interests may conflict with yours.
As of December 31, 2014, Edward Crawford, our Chairman of the Board and Chief Executive Officer, and Matthew Crawford, our President and Chief Operating Officer, collectively beneficially owned approximately 27% of Holdings’ common stock. Mr. E. Crawford is Mr. M. Crawford’s father. Their interests could conflict with your interests. For example, if we encounter financial difficulties or are unable to pay our debts as they mature, the interests of Messrs. E. Crawford and M. Crawford may conflict with your interests.
Item 1B. Unresolved Staff Comments
None.
16
Item 2. Properties
As of December 31, 2014, our operations included numerous manufacturing and supply chain logistics services facilities located in 26 states in the United States and in Puerto Rico, as well as in Asia, Canada, Europe and Mexico. We lease our world headquarters located in Cleveland, Ohio, which includes the world headquarters for certain of our businesses. We believe our manufacturing, logistics and corporate office facilities are well-maintained and are suitable and adequate, and have sufficient productive capacity to meet our current needs.
17
The following table provides information relative to our principal facilities as of December 31, 2014.
Related Industry Segment | Location | Owned or Leased | Approximate Square Footage | Use | ||||
SUPPLY | Mississauga, Ontario, Canada | Leased | 145,000 | Manufacturing | ||||
TECHNOLOGIES (1) | Lawrence, PA | Leased | 116,000 | Logistics and Manufacturing | ||||
Minneapolis, MN | Leased | 87,100 | Logistics | |||||
Dayton, OH | Leased | 63,800 | Logistics | |||||
Cleveland, OH (2) | Leased | 60,450 | Supply Technologies Corporate Office | |||||
Carol Stream, IL | Leased | 51,000 | Logistics | |||||
Memphis, TN | Leased | 48,750 | Logistics | |||||
Solon, OH | Leased | 47,100 | Logistics | |||||
Streetsboro, OH | Leased | 45,000 | Manufacturing | |||||
Allentown, PA | Leased | 43,800 | Logistics | |||||
Suwanee, GA | Leased | 42,500 | Logistics | |||||
Dublin, VA | Leased | 40,000 | Logistics | |||||
Tulsa, OK | Leased | 40,000 | Logistics | |||||
Lenexa, KS | Leased | 29,500 | Logistics | |||||
ASSEMBLY | Ocala, FL | Owned | 433,000 | Manufacturing | ||||
COMPONENTS | Conneaut, OH (4) | Leased/Owned | 283,800 | Manufacturing | ||||
Lexington, TN | Owned | 240,000 | Manufacturing | |||||
Lobelville, TN (5) | Owned | 208,700 | Manufacturing | |||||
Rootstown, OH | Owned | 208,000 | Manufacturing | |||||
Cleveland, OH (3) | Leased/Owned | 190,000 | Manufacturing | |||||
Wapakoneta, OH | Owned | 188,000 | Manufacturing | |||||
Angola, IN | Owned | 135,000 | Manufacturing | |||||
Huntington, IN | Leased | 124,500 | Manufacturing | |||||
Fremont, IN | Owned | 112,000 | Manufacturing | |||||
Big Rapids, MI | Owned | 97,000 | Manufacturing | |||||
Ravenna, OH | Owned | 69,000 | Manufacturing | |||||
Delaware, OH | Owned | 45,000 | Manufacturing | |||||
Bedford, OH | Leased | 43,300 | Manufacturing | |||||
ENGINEERED | Cicero, IL | Owned | 450,000 | Manufacturing | ||||
PRODUCTS (6) | Cuyahoga Heights, OH | Owned | 427,000 | Manufacturing | ||||
Newport, AR | Owned | 200,000 | Manufacturing | |||||
Warren, OH | Owned | 195,000 | Manufacturing | |||||
Leini, Italy | Owned | 161,500 | Manufacturing | |||||
Madison Heights, MI | Leased | 128,000 | Manufacturing | |||||
Canton, OH | Leased | 124,000 | Manufacturing | |||||
La Roeulx, Belgium | Owned | 120,000 | Manufacturing | |||||
Brookfield, WI | Leased | 116,000 | Manufacturing | |||||
Wickliffe, OH | Owned | 110,000 | Manufacturing | |||||
Albertville, AL | Leased | 56,000 | Office | |||||
Leini, Italy | Leased | 53,800 | Manufacturing | |||||
Leini, Italy | Leased | 37,700 | Manufacturing | |||||
Cortland, OH | Owned | 30,000 | Office and Manufacturing | |||||
(1) | Supply Technologies has other facilities, none of which is deemed to be a principal facility. |
18
(2) | Includes 20,150 square feet used by Holdings’ and Park-Ohio’s corporate office. |
(3) | Includes one leased property with 150,000 square feet and one owned property with 40,000 square feet. |
(4) | Includes three leased properties with square footage of 91,800, 64,000 and 45,700, respectively, and one owned property with 82,300 square feet. |
(5) | Includes five facilities, which make up the total square footage of 208,700. |
(6) | Engineered Products has other owned and leased facilities, none of which is deemed to be a principal facility. |
19
Item 3. Legal Proceedings
We are subject to various pending and threatened lawsuits in which claims for monetary damages are asserted in the ordinary course of business. While any litigation involves an element of uncertainty, in the opinion of management, liabilities, if any, arising from currently pending or threatened litigation are not expected to have a material adverse effect on our financial condition, liquidity or results of operations.
In addition to the routine lawsuits and asserted claims noted above, we were a party to the lawsuits and legal proceedings described below as of December 31, 2014:
We were a co-defendant in approximately 254 cases asserting claims on behalf of approximately 612 plaintiffs alleging personal injury as a result of exposure to asbestos. These asbestos cases generally relate to production and sale of asbestos-containing products and allege various theories of liability, including negligence, gross negligence and strict liability, and seek compensatory and, in some cases, punitive damages.
In every asbestos case in which we are named as a party, the complaints are filed against multiple named defendants. In substantially all of the asbestos cases, the plaintiffs either claim damages in excess of a specified amount, typically a minimum amount sufficient to establish jurisdiction of the court in which the case was filed (jurisdictional minimums generally range from $25,000 to $75,000), or do not specify the monetary damages sought. To the extent that any specific amount of damages is sought, the amount applies to claims against all named defendants.
There are only six asbestos cases, involving 26 plaintiffs, that plead specified damages. In each of the six cases, the plaintiff is seeking compensatory and punitive damages based on a variety of potentially alternative causes of action. In three cases, the plaintiff has alleged compensatory damages in the amount of $3.0 million for four separate causes of action and $1.0 million for another cause of action and punitive damages in the amount of $10.0 million. In the fourth case, the plaintiff has alleged against each named defendant, compensatory and punitive damages, each in the amount of $10.0 million, for seven separate causes of action. In the fifth case, the plaintiff has alleged compensatory damages in the amount of $20.0 million for three separate causes of action and $5.0 million for another cause of action and punitive damages in the amount of $20.0 million. In the remaining case, the plaintiffs have alleged against each named defendant compensatory and punitive damages, each in the amount of $50.0 million, for four separate causes of action.
Historically, we have been dismissed from asbestos cases on the basis that the plaintiff incorrectly sued one of our subsidiaries or because the plaintiff failed to identify any asbestos-containing product manufactured or sold by us or our subsidiaries. We intend to vigorously defend these asbestos cases, and believe we will continue to be successful in being dismissed from such cases. However, it is not possible to predict the ultimate outcome of asbestos-related lawsuits, claims and proceedings due to the unpredictable nature of personal injury litigation. Despite this uncertainty, and although our results of operations and cash flows for a particular period could be adversely affected by asbestos-related lawsuits, claims and proceedings, management believes that the ultimate resolution of these matters will not have a material adverse effect on our financial condition, liquidity or results of operations. Among the factors management considered in reaching this conclusion were: (a) our historical success in being dismissed from these types of lawsuits on the bases mentioned above; (b) many cases have been improperly filed against one of our subsidiaries; (c) in many cases the plaintiffs have been unable to establish any causal relationship to us or our products or premises; (d) in many cases, the plaintiffs have been unable to demonstrate that they have suffered any identifiable injury or compensable loss at all or that any injuries that they have incurred did in fact result from alleged exposure to asbestos; and (e) the complaints assert claims against multiple defendants and, in most cases, the damages alleged are not attributed to individual defendants. Additionally, we do not believe that the amounts claimed in any of the asbestos cases are meaningful indicators of our potential exposure because the amounts claimed typically bear no relation to the extent of the plaintiff's injury, if any.
Our cost of defending these lawsuits has not been material to date and, based upon available information, our management does not expect its future costs for asbestos-related lawsuits to have a material adverse effect on our results of operations, liquidity or financial position.
20
IPSCO Tubulars Inc. d/b/a TMK IPSCO sued Ajax Tocco Magnethermic Corporation ("ATM"), a subsidiary of Park-Ohio Industries, Inc., in the United States District Court for the Eastern District of Arkansas claiming that equipment supplied by ATM for heat treating certain steel pipe at IPSCO’s Blytheville, Arkansas facility did not perform as required by the contract. The complaint alleged causes of action for breach of contract, gross negligence, and constructive fraud. IPSCO sought approximately $10 million in damages plus an unspecified amount of punitive damages. ATM denied the allegations. ATM subsequently obtained summary judgment on the constructive fraud claim, which was dismissed by the district court prior to trial. The remaining claims were the subject of a bench trial that occurred in May 2013. After IPSCO presented its case, the district court entered partial judgment in favor of ATM, dismissing the gross negligence claim, a portion of the breach of contract claim, and any claim for punitive damages. The trial proceeded with respect to the remainder of IPSCO’s claim for breach of contract. In September 2013, the district court issued a judgment in favor of IPSCO in the amount of $5.2 million. IPSCO subsequently filed a motion seeking to recover $3.8 million in attorneys’ fees and costs. The district court reserved ruling on that issue pending an appeal. In October 2013, ATM filed an appeal with the U.S. Court of Appeals for the Eighth Circuit seeking reversal of the judgment in favor of IPSCO. In November 2013, IPSCO filed a cross-appeal seeking reversal of the dismissal of its claims for gross negligence and punitive damages. The Eighth Circuit issued an opinion in March 2015 affirming in part, reversing in part, and remanding the case. It affirmed the district court's determination that ATM was liable for breach of contract. It also affirmed the district court's dismissal of IPSCO's claims for gross negligence and punitive damages. However, the Eighth Circuit reversed nearly all of the damages awarded by the district court and remanded for further findings on the issue of damages, including whether consequential damages are barred under the express language of the contract. Because IPSCO did not appeal the award of $5.2 million in its favor, those damages may be decreased, but cannot be increased, on remand. IPSCO's motion to recover attorneys' fees and costs is stayed pending the outcome of the proceedings on remand.
In August 2013, we received a subpoena from the staff of the SEC in connection with the staff’s investigation of a third party. At that time, we also learned that the Department of Justice (“DOJ”) is conducting a criminal investigation of the third party. In connection with its initial response to the staff’s subpoena, we disclosed to the staff of the SEC that, in November 2007, the third party participated in a payment on behalf of us to a foreign tax official that implicates the Foreign Corrupt Practices Act.
Our Board of Directors has formed a special committee to review our transactions with the third party and to make any recommendations to the Board of Directors with respect thereto.
We intend to cooperate fully with the SEC and the DOJ in connection with their investigations of the third party and with the SEC in light of our disclosure. We are unable to predict the outcome or impact of the special committee’s investigation or the length, scope or results of the SEC’s review or the impact on our results of operations.
Item 4. Mine Safety Disclosures
Not applicable.
21
Part II
Item 5. Market for the Registrant’s Common Equity, Related Stockholder Matters and Issuer Purchases of Equity Securities
The registrant is a wholly-owned subsidiary of Park-Ohio Holdings Corp. and has no equity securities that trade.
Item 6. Selected Financial Data
Information required by this item has been omitted pursuant to general instruction I of Form 10-K.
Item 7. Management’s Discussion and Analysis of Financial Condition and Results of Operations
Our consolidated financial statements include the accounts of Park-Ohio and its subsidiaries. All significant intercompany transactions have been eliminated in consolidation. The historical financial information discussed below is not directly comparable on a year-to-year basis, primarily due to acquisitions and litigation costs in 2014, 2013 and 2012, dispositions in 2013 and a refinancing in 2012.
EXECUTIVE OVERVIEW
General
We are an industrial Total Supply Management™ and diversified manufacturing business, operating in three segments: Supply Technologies, Assembly Components and Engineered Products.
Our Supply Technologies business provides our customers with Total Supply Management™, a proactive solutions approach that manages the efficiencies of every aspect of supplying production parts and materials to our customers’ manufacturing floor, from strategic planning to program implementation. Total Supply Management™ includes such services as engineering and design support, part usage and cost analysis, supplier selection, quality assurance, bar coding, product packaging and tracking, just-in-time and point-of-use delivery, electronic billing services and ongoing technical support. Our Supply Technologies business services customers in the following principal industries: heavy-duty truck; automotive, truck and vehicle parts; power sports and recreational equipment; bus and coaches; electrical distribution and controls; agricultural and construction equipment; consumer electronics; HVAC; lawn and garden; semiconductor equipment; aerospace and defense; and plumbing.
Assembly Components manufactures parts and assemblies and provides value-added design, engineering and assembly services that are incorporated into our customer’s end products. Our product offerings include cast and machined aluminum engine, transmission, brake, suspension and other components, such as pump housings, clutch retainers/pistons, control arms, knuckles, master cylinders, pinion housings, brake calipers, oil pans and flywheel spacers, industrial hose and injected molded rubber components, gasoline direct injection systems and fuel filler assemblies. Our products are primarily used in the following industries: automotive; agricultural; construction; heavy-duty truck; and marine OEMs, primarily on a sole-source basis.
Engineered Products operates a diverse group of niche manufacturing businesses that design and manufacture a broad range of highly-engineered products including induction heating and melting systems, pipe threading systems, industrial oven systems, and forged and machined products. Engineered Products also produces and provides services and spare parts for the equipment it manufactures. The principal customers of Engineered Products are OEMs, sub-assemblers and end users in the ferrous and non-ferrous metals, silicon, coatings, forging, foundry, heavy-duty truck, construction equipment, automotive, oil and gas, locomotive and rail manufacturing, and aerospace and defense industries.
Primary Factors Affecting 2014 Results
The following factors most affected our consolidated 2014 results:
• The net sales growth in 2014 was driven significantly by strategic acquisitions in 2013 and 2014.
22
Our 2014 and 2013 strategic bolt-on acquisitions of Saet, Autoform, Apollo, QEF Global Holdings Limited (“QEF”), Henry Halstead Limited (“Henry Halstead”) and Bates Rubber Inc. (“Bates”) added a combined $70.8 million of incremental revenues in 2014. These acquisitions have been successfully integrated into our segments, and the earnings results of these combined acquisitions have been accretive to us for the year ended December 31, 2014.
• | In addition to our net sales growth associated with acquisitions, our organic net sales growth was $104.7, or 8.7%, in 2014. Our organic net sales growth for 2014 is primarily due to strong performance in the Supply Technologies segment and our Aluminum business unit of the Assembly Components segment. |
• | Overall, we had net sales growth of 14.6% for 2014 when compared to the prior year. However, our unfavorable sales mix for 2014, compared to 2013, lead to a decrease in our gross margin percentage of 50 basis points. |
• | Due to the incremental selling, general and administrative (“SG&A”) expenses primarily related to our acquisitions, increased professional service fees and the incurrence of foreign currency exchange losses on non-permanent intercompany loans in 2014, our SG&A expenses increased 13.5% when compared to the prior year. Still, given our net sales increases, SG&A, as a percentage of net sales, decreased 10 basis points in 2014 compared to 2013. |
Subsequent Events
• | On February 9, 2015, Holdings' Board of Directors declared a quarterly dividend of $0.125 per common share. The dividend was paid on March 6, 2015, to shareholders of record as of the close of business on February 23, 2015, and resulted in a cash outlay of approximately $1.6 million. |
• | On March 12, 2015, the Company amended its Credit Agreement to increase the revolving credit facility from $250.0 million to $275.0 million. |
23
RESULTS OF OPERATIONS
2014 Compared with 2013 and 2013 Compared with 2012
2014 vs. 2013 | 2013 vs. 2012 | ||||||||||||||||||||||||
2014 | 2013 | 2012 | $ Change | % Change | $ Change | % Change | |||||||||||||||||||
(Dollars in millions, except per share data) | |||||||||||||||||||||||||
Net sales | $ | 1,378.7 | $ | 1,203.2 | $ | 1,128.2 | $ | 175.5 | 15 | % | $ | 75.0 | 7 | % | |||||||||||
Cost of sales | 1,144.2 | 992.2 | 920.9 | 152.0 | 15 | % | 71.3 | 8 | % | ||||||||||||||||
Gross profit | 234.5 | 211.0 | 207.3 | 23.5 | 11 | % | 3.7 | 2 | % | ||||||||||||||||
Gross profit as a percentage of net sales | 17.0 | % | 17.5 | % | 18.4 | % | |||||||||||||||||||
Selling, general and administrative expenses | 135.6 | 119.5 | 112.4 | 16.1 | 13 | % | 7.1 | 6 | % | ||||||||||||||||
SG&A as a percentage of net sales | 9.8 | % | 9.9 | % | 10.0 | % | |||||||||||||||||||
Litigation judgment and settlement costs | — | 5.2 | 13.0 | (5.2 | ) | * | (7.8 | ) | * | ||||||||||||||||
Operating income | 98.9 | 86.3 | 81.9 | 12.6 | 15 | % | 4.4 | 5 | % | ||||||||||||||||
Gain on acquisition of business | — | (0.6 | ) | — | 0.6 | * | (0.6 | ) | * | ||||||||||||||||
Interest expense | 26.1 | 25.9 | 26.0 | 0.2 | 1 | % | (0.1 | ) | — | % | |||||||||||||||
Income from continuing operations before income taxes | 72.8 | 61.0 | 55.9 | 11.8 | 19 | % | 5.1 | 9 | % | ||||||||||||||||
Income tax expense | 25.2 | 19.6 | 20.8 | 5.6 | 29 | % | (1.2 | ) | * | ||||||||||||||||
Net income from continuing operations | 47.6 | 41.4 | 35.1 | 6.2 | 15 | % | 6.3 | 18 | % | ||||||||||||||||
Income (loss) from discontinued operations, net of taxes | — | 3.0 | (2.4 | ) | (3.0 | ) | * | 5.4 | * | ||||||||||||||||
Net income | 47.6 | 44.4 | 32.7 | 3.2 | 7 | % | 11.7 | 36 | % | ||||||||||||||||
Net income attributable to noncontrolling interest | (1.3 | ) | (0.5 | ) | — | (0.8 | ) | * | (0.5 | ) | * | ||||||||||||||
Net income attributable to ParkOhio common shareholder | $ | 46.3 | $ | 43.9 | $ | 32.7 | $ | 2.4 | 5 | % | $ | 11.2 | 34 | % | |||||||||||
* Calculation not meaningful
24
2014 Compared with 2013
Net Sales:
Net sales increased $175.5 million, or 15%, to $1,378.7 million in 2014, compared to $1,203.2 million in 2013. The increase in net sales is principally attributable to strong organic growth of 9% and the strategic acquisitions in 2014 and 2013. Supply Technologies and Assembly Components segments were the primary contributors to the strong organic growth. Overall, our organic growth increased in 2014 on the strength of new automotive platform business in our Aluminum business within the Assembly Components segment, growth in the heavy-duty truck, power sports and recreational equipment, semiconductor and HVAC markets in the Supply Technologies segment and increased sales in the industrial equipment business of Engineered Products segment. These increases were offset by a slight decline in sales in the forging business. The 2013 acquisitions of Bates, Henry Halstead and QEF and the 2014 acquisitions of Apollo, Autoform and Saet also contributed to the 2014 revenue growth. Combined, these acquisitions contributed $70.8 million of the increase in net sales.
The factors explaining the changes in segment revenues for 2014 compared to the prior year are contained within the “Segment Analysis” section.
Cost of Sales & Gross Profit:
Cost of sales increased $152.0 million, or 15%, to $1,144.2 million in 2014, compared to $992.2 million in 2013. The increase in cost of sales was primarily due to the increase in net sales volumes, which increased 15%. The gross profit margin percentage was 17.0% in 2014 compared to 17.5% in 2013. This 50 basis point decline in gross margin percentage is largely due to a change in the sales mix between the comparable periods as the Assembly Components net sales, carrying a lower gross margin percentage, were a higher percentage of consolidated net sales than in the prior year.
SG&A Expenses:
Consolidated SG&A expenses increased 13% in 2014 compared to 2013, but SG&A expenses as a percent of sales decreased by 10 basis points to 9.8%. SG&A expenses increased in 2014 compared to 2013 primarily due to $6.7 million of incremental expense associated with our acquisitions, increased professional fees and increased salary and wage expenses. This increase in expense was partially offset by an increase in pension income.
Litigation Judgment and Settlement Costs:
During the third quarter of 2013, the United States District Court for the Eastern District of Arkansas awarded TMK IPSCO damages of approximately $5.2 million.
Gain on Acquisition of Business:
The $0.6 million gain on acquisition of business in 2013 relates to the bargain purchase associated with a small bolt-on acquisition in the Engineered Products segment.
Interest Expense:
Year Ended December 31, | ||||||||||||||
2014 | 2013 | $ Change | % Change | |||||||||||
(Dollars in millions) | ||||||||||||||
Interest expense | $ | 26.1 | $ | 25.9 | $ | 0.2 | 1 | % | ||||||
Average outstanding borrowings | $ | 397.1 | $ | 385.5 | $ | 11.6 | 3 | % | ||||||
Average borrowing rate | 6.57 | % | 6.71 | % | 14 | basis points | ||||||||
25
Interest expense increased $0.2 million in 2014 compared to 2013 as average borrowings in 2014 were higher when compared to 2013 due to additional borrowings to fund acquisitions.
Income Tax Expense:
The provision for income taxes was $25.2 million in 2014, which was a 34.6% effective income tax rate, compared to income taxes of $19.6 million provided in 2013, a 32.1% effective income tax rate. The increase in the effective tax rate in 2014 is primarily due to various non-deductible items.
Net Income from Continuing Operations:
Net income from continuing operations increased $6.2 million to $47.6 million in 2014, compared to $41.4 million in 2013, due to the reasons described above.
Income (Loss) from Discontinued Operations:
In September 2013, the Company sold all of the outstanding equity interests of a non-core business unit in the Supply Technologies segment for $8.5 million in cash, which resulted in a net gain of approximately $3.8 million, after taxes of $1.5 million. The income from discontinued operations of $3.0 million in 2013 is predominantly comprised of the gain on sale, but also includes the operating losses, net of tax, of the business unit sold.
Net Income:
Net income increased $3.2 million to $47.6 million in 2014, compared to $44.4 million in 2013, due to the reasons described above.
Net Income Attributable to Noncontrolling Interest:
As a result of the sale of the 25% equity interest in a small forging business in 2013, the income of $1.3 million attributable to the noncontrolling interest is deducted from net income to derive net income attributable to ParkOhio common shareholder.
Net Income Attributable to ParkOhio Common Shareholder:
Net income attributable to ParkOhio common shareholder increased $2.4 million to $46.3 million in 2014, compared to $43.9 million in 2013, due to the reasons described above.
26
2013 Compared with 2012
Net Sales:
Net sales increased $75.0 million, or 7%, to $1,203.2 million in 2013, compared to $1,128.2 million in 2012. The increase in net sales is primarily attributable to the strategic acquisitions in 2012 and 2013. The 2012 acquisition of Fluid Routing Solutions LLC (“FRS”) and the 2013 acquisitions of Bates, Henry Halstead and QEF were the primary drivers of the 2013 revenue growth. Combined, these acquisitions contributed $82.1 million of the increase in net sales. Overall, our organic growth declined slightly in 2013 as the strength of new automotive platform business in our Aluminum business within the Assembly Components segment was slightly more than offset by industrial slowness for the truck and defense industries in the Supply Technologies segment and for the industrial equipment business of the Engineered Products segment.
The factors explaining the changes in segment revenues for 2013 compared to the prior year are contained within the “Segment Analysis” section.
Cost of Sales & Gross Profit:
Cost of sales increased $71.3 million, or 8%, to $992.2 million for 2013, compared to $920.9 million in 2012. The increase in cost of sales was primarily due to the increase in net sales volumes, which increased 7%. The gross profit margin percentage was 17.5% in 2013 compared to 18.4% in 2012. This 90 basis point decline in gross margin percentage is largely due to a change in the sales mix between the comparable periods as the Assembly Components net sales, carrying a lower gross margin percentage, were a higher percentage of consolidated net sales than in the prior year.
SG&A Expenses:
Consolidated SG&A expenses increased 6% in 2013 compared to 2012; however, SG&A expenses as a percentage of sales declined by 10 basis points to 9.9%. SG&A expenses increased in 2013 compared to 2012 primarily due to $4.3 million of incremental expense associated with our acquisitions, increases in payroll, payroll related expenses and share-based compensation offset by FRS acquisition expenses of $1.1 million in 2012.
Litigation Judgment and Settlement Costs:
During the third quarter of 2013, the United States District Court for the Eastern District of Arkansas awarded TMK IPSCO damages of approximately $5.2 million.
During the second quarter of 2012, we agreed to settle the Evraz arbitration proceeding for the sum of $13.0 million in cash, which payment was made in June 2012.
Gain on Acquisition of Business:
The $0.6 million gain on the acquisition of business relates to the bargain purchase associated with a small bolt-on acquisition in the Engineered Products segment.
Interest Expense:
Year Ended December 31, | ||||||||||||||
2013 | 2012 | $ Change | % Change | |||||||||||
(Dollars in millions) | ||||||||||||||
Interest expense | $ | 25.9 | $ | 26.0 | $ | (0.1 | ) | — | % | |||||
Debt extinguishment costs included in interest expense | $ | — | $ | 0.3 | $ | (0.3 | ) | (100 | )% | |||||
Average outstanding borrowings | $ | 385.5 | $ | 379.2 | $ | 6.3 | 2 | % | ||||||
Average borrowing rate | 6.72 | % | 6.78 | % | 6 | basis points | ||||||||
27
Interest expense was comparable between the two years
Income Tax Expense:
The provision for income taxes was $19.6 million in 2013, which was a 32.1% effective income tax rate, compared to the income taxes of $20.8 million provided in 2012 with a 37.2% effective income tax rate. The reduction in the effective rate is primarily due to our ability to realize certain deductions, such as the Manufacturer's Deduction, now that our net operating loss carryforwards were utilized in 2012 combined with the reversal of valuation allowances against certain U.S. net deferred tax assets in 2013 that reduced tax expense by $1.6 million.
Net Income from Continuing Operations:
Net income from continuing operations increased $6.3 million to $41.4 million in 2013, compared to $35.1 million in 2012, due to the reasons described above.
Income (Loss) from Discontinued Operations:
In September 2013, the Company sold all of the outstanding equity interests of a non-core business unit in the Supply Technologies segment, for $8.5 million in cash, which resulted in a net gain of approximately $3.8 million, after taxes of $1.5 million. The income from discontinued operations of $3.0 million in 2013 is predominantly comprised of the gain on sale, but also includes operating losses, net of tax, of the business unit sold. The loss from discontinued operations of $2.4 million in 2012 is comprised of the operating losses, net of tax, of the business unit sold. As a result of the sale, the business unit has been removed from the Supply Technologies segment and presented as a discontinued operation for all of the periods presented.
Net Income:
Net income increased $11.7 million to $44.4 million in 2013, compared to $32.7 million in 2012, due to the reasons described above.
Net Income Attributable to Noncontrolling Interest:
As a result of the 25% equity interest in a small forging business in 2013, the income of $0.5 million attributable to the noncontrolling interest is deducted from the net income to derive income attributable to ParkOhio common shareholders.
Net Income Attributable to ParkOhio Common Shareholder:
Net income attributable to ParkOhio common shareholder increased $11.2 million to $43.9 million in 2013, compared to $32.7 million in 2012, due to the reasons described above.
SEGMENT ANALYSIS
We primarily evaluate performance and allocate resources based on segment operating income as well as projected future performance. Segment operating income is defined as revenues less expenses identifiable to the business units and product lines included within each segment. Segment operating income will reconcile to consolidated income from continuing operations before income taxes by deducting corporate costs that are not attributable to the segments, litigation judgment and settlement costs and net interest expense and by adding the gain on acquisition of business.
The proportion of consolidated revenues and segment operating income attributed to each segment was as follows:
28
Year Ended December 31, | ||||||||
2014 | 2013 | 2012 | ||||||
Revenues: | ||||||||
Supply Technologies | 40 | % | 39 | % | 43 | % | ||
Assembly Components | 36 | % | 34 | % | 27 | % | ||
Engineered Products | 24 | % | 27 | % | 30 | % | ||
Segment Operating Income: | ||||||||
Supply Technologies | 33 | % | 31 | % | 33 | % | ||
Assembly Components | 33 | % | 28 | % | 18 | % | ||
Engineered Products | 34 | % | 41 | % | 49 | % | ||
Supply Technologies Segment
2014 vs. 2013 | 2013 vs. 2012 | ||||||||||||||||||||||||
2014 | 2013 | 2012 | $ Change | % Change | $ Change | % Change | |||||||||||||||||||
(Dollars in millions) | |||||||||||||||||||||||||
Net sales | $ | 559.6 | $ | 471.9 | $ | 483.8 | $ | 87.7 | 19 | % | $ | (11.9 | ) | (2 | )% | ||||||||||
Segment operating income | $ | 42.5 | $ | 35.0 | $ | 37.5 | $ | 7.5 | 21 | % | $ | (2.5 | ) | (7 | )% | ||||||||||
Segment operating income margin | 7.6 | % | 7.4 | % | 7.8 | % | |||||||||||||||||||
2014 Compared with 2013
Net Sales: Approximately 44% of the revenue increase in the year ended December 31, 2014, compared to 2013, is directly attributable to the acquisitions of Henry Halstead, QEF and Apollo. The remainder of our growth in 2014 was organic growth in our diversified markets. This growth was driven by the heavy-duty truck market, which was up 30%; the power sports and recreational equipment market, which increased 21%; the semiconductor market, which was up 56%; and the HVAC market, which was up 15%. In addition our fastener manufacturing division generated sales increases of 9% in 2014.
Segment Operating Income: With increases in net sales, segment operating income increased $7.5 million, or 21%, to $42.5 million. Segment operating income margin was 7.6%, which was a 20 basis point increase compared to the operating margin of 7.4% in 2013. The increase in margin is primarily due to increased operational leverage as a result of our acquisitions of Henry Halstead, QEF and Apollo and overall customer product mix swings in 2014 and less acquisition-related costs associated with the inventory step-up in purchase accounting for acquisitions, offset by increased professional service fees.
2013 Compared with 2012
Net Sales: The decrease in net sales in 2013 compared with the prior year was primarily due to a 13% decline in volume associated with the heavy-duty truck market and a 25% decline in volume associated with the defense industry market combined with the exit of low margin business approximating $11.0 million. These unfavorable impacts to revenues were partially offset by approximately $8.5 million in sales from our two fourth-quarter 2013 acquisitions, Henry Halstead and QEF, greater volume in our power sports and recreational equipment market of 7% and increased tooling sales in our small fastener manufacturing division.
Segment Operating Income: Included in 2013 cost of sales was $1.6 million of acquisition-related costs associated with the inventory step-up in purchase accounting for the Henry Halstead and QEF acquisitions. Excluding these acquisition-related costs, segment operating income remained comparable with the prior year, even though revenues were slightly down compared to prior year. While the acquisition-related costs unfavorably impacted segment operating income by 30 basis points, our overall segment operating margin only decreased 20 basis points to 7.6% in 2013 compared with the prior year as a result of effective cost control management and the pairing of low margin business.
29
Assembly Components Segment
2014 vs. 2013 | 2013 vs. 2012 | ||||||||||||||||||||||||
2014 | 2013 | 2012 | $ Change | % Change | $ Change | % Change | |||||||||||||||||||
(Dollars in millions) | |||||||||||||||||||||||||
Net sales | $ | 490.5 | $ | 412.8 | $ | 304.0 | $ | 77.7 | 19 | % | $ | 108.8 | 36 | % | |||||||||||
Segment operating income | $ | 42.0 | $ | 31.8 | $ | 19.9 | $ | 10.2 | 32 | % | $ | 11.9 | 60 | % | |||||||||||
Segment operating income margin | 8.6 | % | 7.7 | % | 6.5 | % | |||||||||||||||||||
2014 Compared with 2013
Net Sales: The significant increase in net sales in 2014 is primarily due to the incremental sales from new programs with our automotive customers in our aluminum business. The aluminum business revenues increased 35%. Also contributing to the overall increase in net sales was the incremental revenues in 2014 associated with the acquisitions of Bates of approximately $15.5 million and Autoform of approximately $13.1 million. These revenue increases were slightly offset by the expected reduced volumes in the fuel filler business of FRS as programs completed their life cycles in the second half of 2013.
Segment Operating Income: On the strength of the aluminum business incremental contribution from the new program launches with our automotive customers in 2013 and the Bates and Autoform acquisitions, segment operating income increased 32% in 2014 compared to 2013. Our segment operating income margin was 8.6%, which was a 90 basis point increase compared to operating income margin of 7.7% in 2013. The increase in margin is primarily attributable to the volume increase in our aluminum business.
2013 Compared with 2012
Net Sales: The significant increase in net sales is primarily due to the incremental revenues in 2013 associated with the FRS and Bates acquisitions that combined to total approximately $73.6 million. In addition, aluminum business revenues increased 29% as new programs with our automotive customers were launched in 2013. In total, approximately 72% of our revenue growth is attributable to acquisitions and the remainder of the growth is organic.
Segment Operating Income: On the strength of our acquisitions, segment operating income increased 60% in 2013 compared with the prior year. Furthermore, our segment operating income margin increased 120 basis points based on the contribution of the FRS and Bates acquisitions. As the aluminum business was still ramping up to full capacity in 2013, this business has had only a small favorable impact on segment operating income improvement.
Engineered Products Segment
2014 vs. 2013 | 2013 vs. 2012 | ||||||||||||||||||||||||
2014 | 2013 | 2012 | $ Change | % Change | $ Change | % Change | |||||||||||||||||||
(Dollars in millions) | |||||||||||||||||||||||||
Net sales | $ | 328.6 | $ | 318.5 | $ | 340.4 | $ | 10.1 | 3 | % | $ | (21.9 | ) | (6 | )% | ||||||||||
Segment operating income | $ | 42.7 | $ | 47.1 | $ | 55.0 | $ | (4.4 | ) | (9 | )% | $ | (7.9 | ) | (14 | )% | |||||||||
Segment operating income margin | 13.0 | % | 14.8 | % | 16.2 | % | |||||||||||||||||||
2014 Compared with 2013
Net Sales: The increase in net sales of 3% in 2014 is primarily attributable to a 5% increase in the capital equipment business within our industrial equipment business unit. Global economic uncertainty in 2013 caused many industrial customers to defer orders. The aftermarket volume in the industrial equipment business was up less than 1% in 2014 compared to 2013. Offsetting these net sales increases, our forging business sales declined 2% in 2014 as sales were unfavorably impacted by reduced demand for some of its aircraft forging products.
30
Segment Operating Income: Segment operating income decreased 9% in 2014. The decrease in operating income dollars and the 180 basis point decline in segment operating income margin are associated with the sales mix in 2014 and the associated reduction in overhead absorption related to the decline in volume in our forging business.
2013 Compared with 2012
Net Sales: The decline in net sales of 6% in 2013 is primarily attributable to an 18% decline in capital equipment business within our industrial equipment business unit. Global economic uncertainty in 2013 caused many industrial customers to defer orders. The aftermarket volume in the industrial equipment business was just 2% less in 2013 compared to 2012. Offsetting these net sales declines, our forging business demand continued to be very strong in 2013 led by our rail business, and net sales increased 7% over the prior year.
Segment Operating Income: Given the decline in net sales in 2013, segment operating income also decreased 14%. The decrease in operating income dollars and the 140 basis point decline in segment operating income margin are associated with the volume decline in 2013 and the associated reduction in overhead absorption related to the decline in volume.
Off-Balance Sheet Arrangements
We do not have off-balance sheet arrangements, financing or other relationships with unconsolidated entities or other persons. There are occasions whereupon we enter into forward contracts on foreign currencies, primarily the euro, purely for the purpose of hedging exposure to changes in the value of accounts receivable in those currencies against the U.S. dollar. At December 31, 2014, none were outstanding. We currently have no other derivative instruments.
Critical Accounting Policies and Estimates
Preparation of financial statements in conformity with U.S. generally accepted accounting principles requires management to make certain estimates and assumptions which affect amounts reported in our consolidated financial statements. Management has made their best estimates and judgments of certain amounts included in the financial statements, giving due consideration to materiality. We do not believe that there is great likelihood that materially different amounts would be reported under different conditions or using different assumptions related to the accounting policies described below. However, application of these accounting policies involves the exercise of judgment and use of assumptions as to future uncertainties and, as a result, actual results could differ from these estimates.
Revenue Recognition: We recognize revenue, other than from long-term contracts, when title is transferred to the customer, typically upon shipment. Revenue from long-term contracts (approximately 8% of consolidated revenue) is accounted for under the percentage of completion method, and recognized on the basis of the percentage each contract’s cost to date bears to the total estimated contract cost. Revenue earned on contracts in process that are in excess of billings, is classified in unbilled contract revenue in the accompanying consolidated balance sheet. Billings that are in excess of revenue earned on contracts in process are classified in accrued expenses on the accompanying balance sheet. Our revenue recognition policies are in accordance with the SEC’s Staff Accounting Bulletin (“SAB”) No. 104, “Revenue Recognition.”
Allowance for Obsolete and Slow Moving Inventory: Inventories are stated at the lower of cost or market value and have been reduced by an allowance for obsolete and slow-moving inventories. The estimated allowance is based on management’s review of inventories on hand with minimal sales activity, which is compared to estimated future usage and sales. Inventories identified by management as slow-moving or obsolete are reserved for based on estimated selling prices less disposal costs. Though we consider these allowances adequate and proper, changes in economic conditions in specific markets in which we operate could have a material effect on reserve allowances required.
Impairment of Long-Lived Assets: In accordance with Accounting Standards Codification (“ASC”) 360, “Property, Plant and Equipment,” management performs impairment tests of long-lived assets, including property and equipment, whenever an event occurs or circumstances change that indicate that the carrying value may not be recoverable or the useful life of the asset has changed. We review our long-lived assets for indicators of impairment such as a decision to idle certain facilities and consolidate certain operations, a current-period operating or cash flow loss or a forecast that demonstrates continuing losses associated with the use of a long-lived asset and the expectation that, more likely than not, a long-lived asset
31
will be sold or otherwise disposed of significantly before the end of its previously estimated useful life. When we identify impairment indicators, we determine whether the carrying amount of our long-lived assets is recoverable by comparing the carrying value to the sum of the undiscounted cash flows expected to result from the use and eventual disposition of the assets. We consider whether impairments exist at the lowest level of independent identifiable cash flows within a reporting unit (for example, plant location, program level or asset level). If the carrying value of the assets exceeds the expected cash flows, we estimate the fair value of these assets by using appraisals or recent selling experience in selling similar assets or for certain assets with reasonably predictable cash flows by performing discounted cash flow analysis using the same discount rate used as the weighted average cost of capital in the respective goodwill impairment analysis to estimate fair value when market information is not available to determine whether an impairment existed.
Business Combinations, Goodwill and Indefinite-Lived Assets: Business combinations are accounted for using the purchase method of accounting. This method requires the Company to record assets and liabilities of the business acquired at their estimated fair market values as of the acquisition date. Any excess of the cost of the acquisition over the fair value of the net assets acquired is recorded as goodwill. The Company uses valuation specialists to perform appraisals and assist in the determination of the fair values of the assets acquired and liabilities assumed. These valuations require management to make estimates and assumptions.
Generally, goodwill recorded in business combinations is more susceptible to risk of impairment soon after the acquisition primarily because the business combination is recorded at fair value based on operating plans and economic conditions present at the time of the acquisition. If operating results or economic conditions deteriorate soon after an acquisition, it could result in the impairment of the acquired goodwill. A change in macroeconomic conditions in the United States or Europe, as well as future changes in the judgments, assumptions and estimates that were used in the Company's goodwill impairment testing, including the discount rate and future cash flow projections, could result in a significantly different estimate of the fair value.
As required by ASC 350, “Intangibles - Goodwill and Other” (“ASC 350”), management performs impairment testing of goodwill and indefinite-lived assets at least annually, as of October 1 of each year, or more frequently if impairment indicators arise.
The goodwill impairment analysis is a two-step process. Step one compares the carrying amount of the reporting unit to its estimated fair value. To the extent that the carrying value of the reporting unit exceeds its estimated fair value, step two is performed, where the reporting unit’s carrying value of goodwill is compared to the implied fair value of goodwill. To the extent that the carrying value of goodwill exceeds the implied fair value of goodwill, impairment exists and must be recognized. In accordance with ASC 350, management tests goodwill for impairment at the reporting unit level. A reporting unit is an operating segment pursuant to ASC 280, “Segment Reporting”, or one level below the operating segment (component level) as determined by the availability of discrete financial information that is regularly reviewed by operating segment management or an aggregate of component levels of an operating segment having similar economic characteristics.
We adopted the provisions of Accounting Standards Update (“ASU”) No. 2011-8, “Intangibles - Goodwill and Other (Topic 350): Testing Goodwill for Impairment,” which allows companies to assess qualitative factors to determine if goodwill might be impaired and whether it is necessary to perform the two-step goodwill impairment test. In 2014 and 2013, based on a review of the qualitative factors set forth in ASC 350, management concluded that as of October 1, 2014 and 2013, the reporting units had fair values that exceeded their carrying values. As a result of this analysis, we concluded that no impairment existed.
In 2014, we completed the acquisitions of Apollo, Autoform and Saet and recorded additional goodwill of $28.9 million. At December 31, 2014, we had goodwill of $89.5 million. There were no interim indicators of impairment and management concluded that the goodwill related to the Aluminum Products, FRS, Capital Equipment and Supply Technologies reporting units was not impaired and that the two-step approach was not required to be performed through December 31, 2014.
At December 31, 2014, we had $14.0 million of indefinite-lived trade names primarily related to the 2012 acquisition of FRS. For purposes of impairment testing in 2012, we estimated the fair value of the trade name using a “relief from royalty” approach. This approach involves two steps: (1) estimating a reasonable royalty rate for the trade name and (2) applying this royalty rate to a net sales stream and discounting the resulting cash flows to determine fair value. Fair value is then compared with the carrying value of the trade name. As a result of this analysis, we concluded that no impairment existed.
32
Based on the qualitative factors analyzed in 2014, as mentioned above, combined with this quantitative analysis performed in 2012, management concluded that as of October 1, 2014, the indefinite-lived intangibles had fair values that exceeded their carrying values. As a result of this analysis, we concluded that no impairment existed. There were no interim indicators of impairment and management concluded that the indefinite-lived intangibles were not impaired and that the two-step approach was not required to be performed through December 31, 2014.
See Notes 5 and 6 of the consolidated financial statements for additional disclosure on goodwill and indefinite-lived intangibles.
Income Taxes: In accordance with ASC 740, “Income Taxes” (“ASC 740”), we account for income taxes under the asset and liability method, whereby deferred tax assets and liabilities are determined based on temporary differences between the financial reporting and the tax bases of assets and liabilities and are measured using the currently enacted tax rates. Specifically, we measure gross deferred tax assets for deductible temporary differences and carryforwards, such as operating losses and tax credits, using the applicable enacted tax rates and apply the more likely than not measurement criterion.
In determining the adequacy of valuation allowances we consider cumulative and anticipated amounts of domestic and international earnings or losses, anticipated amounts of foreign source income as well as the anticipated taxable income resulting from the reversal of future taxable temporary differences. We intend to maintain any recorded valuation allowances until sufficient positive evidence, for example cumulative positive foreign earnings or additional foreign source income exists, to support reversal of the tax valuation allowances.
Further, at each interim reporting period, we estimate an effective income tax rate that is expected to be applicable for the full year. Significant judgment is involved regarding the application of global income tax laws and regulations and when projecting the jurisdictional mix of income. Additionally, interpretation of tax laws, court decisions or other guidance provided by taxing authorities influences our estimate of the effective income tax rates. As a result, our actual effective income tax rates and related income tax liabilities may differ materially from our estimated effective tax rates and related income tax liabilities. Any resulting differences are recorded in the period they become known.
Pension and Other Postretirement Benefit Plans: We and our subsidiaries have pension plans, principally noncontributory defined benefit or noncontributory defined contribution plans and postretirement benefit plans covering substantially all employees. The measurement of liabilities related to these plans is based on management’s assumptions related to future events, including interest rates, return on pension plan assets, rate of compensation increases, and health care cost trends. Pension plan asset performance in the future will directly impact our net income. We have evaluated our pension and other postretirement benefit assumptions, considering current trends in interest rates and market conditions and believe our assumptions are appropriate.
We consult with our actuaries at least annually when reviewing and selecting the discount rates to be used. The discount rates used by the Company are based on yields of various corporate and governmental bond indices with actual maturity dates that approximate the estimated benefit payment streams of the related pension plans. The discount rates are also reviewed in comparison with current benchmark indices, economic market conditions and the movement in the benchmark yield since the previous fiscal year. The liability weighted-average discount rate for the defined benefit pension plan is 3.82% for 2014, compared with 4.51% in 2013. For the other postretirement benefit plan, the rate is 3.60% for 2014 and 4.21% for 2013. This rate represents the interest rates generally available in the United States, which is the Company’s only country with other postretirement benefit liabilities. Another assumption that affects the Company’s pension expense is the expected long-term rate of return on assets. The Company’s plans are funded. The weighted-average expected long-term rate of return on assets assumption is 8.25% for 2014.
Changes in the related pension benefit costs may occur in the future due to changes in assumptions. The following table illustrates the sensitivity to a change in the assumed discount rate and expected long-term rate of return on assets for the Company’s pension plans and other postretirement plans as of December 31, 2014:
33
Change in Assumption | Impact on 2014 Benefit Expense | Impact on 2014 Projected Benefit Obligation for Pension Benefits | Impact on 2014 Projected Benefit Obligation for Postretirement Benefits | |||||||||
50 basis point decrease in discount rate | $ | — | $ | 3.3 | $ | 0.8 | ||||||
50 basis point increase in discount rate | $ | — | $ | (3.1 | ) | $ | (0.7 | ) | ||||
50 basis point decrease in expected return on assets | $ | 0.6 | $ | — | $ | — | ||||||
See Note 13 of the consolidated financial statements for further analysis regarding the sensitivity of the key assumptions applied in the actuarial valuations.
Legal Contingencies: We are involved in a variety of claims, suits, investigations and administrative proceedings with respect to commercial, premises liability, product liability, employment and environmental matters arising from the ordinary course of business. We accrue reserves for legal contingencies, on an undiscounted basis, when it is probable that we have incurred a liability and we can reasonably estimate an amount. When a single amount cannot be reasonably estimated, but the cost can be estimated within a range, we accrue the minimum amount in the range. Based upon facts and information currently available, we believe the amounts reserved are adequate for such pending matters. We monitor the development of legal proceedings on a regular basis and will adjust our reserves when, and to the extent, additional information becomes available.
Accounting Guidance Issued But Not Adopted as of December 31, 2014
In April 2014, the FASB issued ASU 2014-08, “Presentation of Financial Statements (Topic 205) and Property, Plant, and Equipment (Topic 360): Reporting Discontinued Operations and Disclosures of Disposals of Components of an Entity,” which raises the threshold for disposals to qualify as discontinued operations and requires new disclosures for discontinued operations and for individually material disposal transactions that do not meet the definition of a discontinued operation. The ASU is effective prospectively for reporting periods beginning with the first quarter of 2015. Early adoption is permitted for disposals that have not been previously reported in the financial statements. We believe the adoption of this ASU will have an insignificant effect on our consolidated financial statement as it only applies to future disposals. The Company is currently evaluating early adoption of this ASU.
In May 2014, the FASB issued ASU 2014-09, “Revenue from Contracts with Customers (Topic 606),” which was the result of a joint project by the FASB and International Accounting Standards Board to clarify the principles for recognizing revenue and to develop a common revenue standard for U.S. Generally Accepted Accounting Principles and International Financial Reporting Standards. The issuance of a comprehensive and converged standard on revenue recognition is expected to enable financial statement users to better understand and consistently analyze an entity’s revenue across industries, transactions, and geographies. The ASU will require additional disclosures to help financial statement users better understand the nature, amount, timing, and potential uncertainty of the revenue that is recognized. The ASU is effective for annual reporting periods beginning after December 15, 2016, and will require either retrospective application to each prior reporting period presented or retrospective application with the cumulative effect of initially applying the standard recognized at the date of adoption. The Company is currently evaluating the impact of adopting this guidance.
Environmental
We have been identified as a potentially responsible party at third-party sites under the Comprehensive Environmental Response, Compensation and Liability Act of 1980, as amended, or comparable state laws, which provide for strict and, under certain circumstances, joint and several liability. We are participating in the cost of certain clean-up efforts at several of these sites. However, our share of such costs has not been material and based on available information, our management does not expect our exposure at any of these locations to have a material adverse effect on our results of operations, liquidity or financial condition.
We have been named as one of many defendants in a number of asbestos-related personal injury lawsuits. Our cost of defending such lawsuits has not been material to date and, based upon available information, our management does not expect our future costs for asbestos-related lawsuits to have a material adverse effect on our results of operations, liquidity or financial
34
condition. We caution, however, that inherent in management’s estimates of our exposure are expected trends in claims severity, frequency and other factors that may materially vary as claims are filed and settled or otherwise resolved.
Seasonality; Variability of Operating Results
The timing of orders placed by our customers has varied with, among other factors, orders for customers’ finished goods, customer production schedules, competitive conditions and general economic conditions. The variability of the level and timing of orders has, from time to time, resulted in significant periodic and quarterly fluctuations in the operations of our business units. Such variability is particularly evident at the industrial equipment business unit included in the Engineered Products segment, which typically ships a few large systems per year.
Forward-Looking Statements
This Annual Report on Form 10-K contains certain statements that are “forward-looking statements” within the meaning of Section 27A of the Securities Act and Section 21E of the Exchange Act. The words “believes”, “anticipates”, “plans”, “expects”, “intends”, “estimates” and similar expressions are intended to identify forward-looking statements.
These forward-looking statements involve known and unknown risks, uncertainties and other factors that may cause our actual results, performance and achievements, or industry results, to be materially different from any future results, performance or achievements expressed or implied by such forward-looking statements. These factors include, but are not limited to the following: our substantial indebtedness; the uncertainty of the global economic environment; general business conditions and competitive factors, including pricing pressures and product innovation; demand for our products and services; raw material availability and pricing; fluctuations in energy costs; component part availability and pricing; changes in our relationships with customers and suppliers; the financial condition of our customers, including the impact of any bankruptcies; our ability to successfully integrate recent and future acquisitions into existing operations; the amounts and timing changes in general domestic economic conditions such as inflation rates, interest rates, tax rates, unemployment rates, higher labor and healthcare costs, recessions and changing government policies, laws and regulations, including the uncertainties related to the current global financial crises; adverse impacts to us, our suppliers and customers from acts of terrorism or hostilities; our ability to meet various covenants, including financial covenants, contained in the agreements governing our indebtedness; disruptions, uncertainties or volatility in the credit markets that may limit our access to capital; potential disruption due to a partial or complete reconfiguration of the European Union; increasingly stringent domestic and foreign governmental regulations, including those affecting the environment; inherent uncertainties involved in assessing our potential liability for environmental remediation-related activities; the outcome of pending and future litigation and other claims and disputes with customers; the outcome of the review being conducted by the special committee of our Board of Directors; our dependence on the automotive and heavy-duty truck industries, which are highly cyclical; the dependence of the automotive industry on consumer spending, which could be lower due to the effects of the recent financial crises; our ability to negotiate contracts with labor unions; our dependence on key management; our dependence on information systems; and the other factors we describe under the “Item 1A. Risk Factors” included in the Company’s Annual Report on Form 10-K. Any forward-looking statement speaks only as of the date on which such statement is made, and we undertake no obligation to update any forward-looking statement, whether as a result of new information, future events or otherwise, except as required by law. In light of these and other uncertainties, the inclusion of a forward-looking statement herein should not be regarded as a representation by us that our plans and objectives will be achieved.
35
Item 7A. Quantitative and Qualitative Disclosures About Market Risk
We are exposed to market risk, including changes in interest rates. We are subject to interest rate risk on borrowings under the floating rate revolving credit facility and term loan provided by our Credit Agreement, which consisted of borrowings of $190.8 million at December 31, 2014. A 100 basis point increase in the interest rate would have resulted in an increase in interest expense of approximately $1.9 million during the year ended December 31, 2014.
Our foreign subsidiaries generally conduct business in local currencies. During 2014, we recorded an unfavorable foreign currency translation adjustment of $7.9 million related to net assets located outside the United States. This foreign currency translation adjustment resulted primarily from the strengthening of the U.S. dollar. Our foreign operations are also subject to other customary risks of operating in a global environment, such as unstable political situations, the effect of local laws and taxes, tariff increases and regulations and requirements for export licenses, the potential imposition of trade or foreign exchange restrictions and transportation delays.
The Company periodically enters into forward contracts on foreign currencies, primarily the euro and the British pound sterling, purely for the purpose of hedging exposure to changes in the value of accounts receivable in those currencies against the U.S. dollar. We currently use no other derivative instruments. At December 31, 2014, there were no such currency hedge contracts outstanding.
Our largest exposures to commodity prices relate to steel and natural gas prices, which have fluctuated widely in recent years. We do not have any commodity swap agreements, forward purchase or hedge contracts.
36
Item 8. Financial Statements and Supplementary Data
Index to Consolidated Financial Statements and Supplementary Financial Data
Page | |
37
REPORT OF INDEPENDENT REGISTERED PUBLIC ACCOUNTING FIRM
The Board of Directors and Shareholder of Park-Ohio Industries, Inc.
We have audited the accompanying consolidated balance sheets of Park-Ohio Industries, Inc. and subsidiaries as of December 31, 2014 and 2013, and the related consolidated statements of income, comprehensive income, shareholder's equity and cash flows for each of the three years in the period ended December 31, 2014. Our audits also included the financial statement schedule listed in the Index at Item 15(a). These financial statements and schedule are the responsibility of the Company’s management. Our responsibility is to express an opinion on these financial statements and schedule based on our audits.
We conducted our audits in accordance with the standards of the Public Company Accounting Oversight Board (United States). Those standards require that we plan and perform the audit to obtain reasonable assurance about whether the financial statements are free of material misstatement. We were not engaged to perform an audit of the Company’s internal control over financial reporting. Our audits included consideration of internal control over financial reporting as a basis for designing our audit procedures that are appropriate in the circumstances, but not for the purposes of expressing an opinion on the effectiveness of the Company’s internal control over financial reporting. Accordingly, we express no such opinion. An audit also includes examining, on a test basis, evidence supporting the amounts and disclosures in the financial statements, assessing the accounting principles used and significant estimates made by management, as well as evaluating the overall financial statement presentation. We believe that our audits provide a reasonable basis for our opinion.
In our opinion, the financial statements referred to above present fairly, in all material respects, the consolidated financial position of Park-Ohio Industries, Inc. and subsidiaries at December 31, 2014 and 2013 and the consolidated results of their operations and their cash flows for each of the three years in the period ended December 31, 2014, in conformity with U.S. generally accepted accounting principles. Also, in our opinion, the related financial statement schedule, when considered in relation to the basic financial statements taken as a whole, presents fairly in all material respects the information set forth therein.
/s/ Ernst & Young LLP
Cleveland, Ohio
March 31, 2015
38
Park-Ohio Industries, Inc. and Subsidiaries
Consolidated Balance Sheets
December 31, 2014 | December 31, 2013 | ||||||
(In millions, except per share data) | |||||||
ASSETS | |||||||
Current assets: | |||||||
Cash and cash equivalents | $ | 48.3 | $ | 43.7 | |||
Accounts receivable, less allowances for doubtful accounts of $4.1 million at December 31, 2014 and $3.7 million at December 31, 2013 | 208.0 | 165.6 | |||||
Inventories, net | 238.4 | 221.4 | |||||
Deferred tax assets | 28.1 | 24.6 | |||||
Unbilled contract revenue | 26.8 | 8.7 | |||||
Prepaid and other current assets | 22.5 | 21.9 | |||||
Total current assets | 572.1 | 485.9 | |||||
Net property, plant and equipment | 141.0 | 114.5 | |||||
Goodwill | 89.5 | 60.4 | |||||
Intangible assets, net | 88.1 | 66.2 | |||||
Other long-term assets | 73.2 | 80.4 | |||||
Total assets | $ | 963.9 | $ | 807.4 | |||
LIABILITIES AND SHAREHOLDER’S EQUITY | |||||||
Current liabilities: | |||||||
Trade accounts payable | $ | 162.1 | $ | 112.9 | |||
Payables to affiliates | 1.8 | 1.6 | |||||
Accrued expenses and other | 103.7 | 85.6 | |||||
Total current liabilities | 267.6 | 200.1 | |||||
Long-term liabilities, less current portion: | |||||||
Debt | 434.4 | 379.2 | |||||
Deferred tax liabilities | 43.9 | 45.3 | |||||
Other postretirement benefits and other long-term liabilities | 40.1 | 32.2 | |||||
Total long-term liabilities | 518.4 | 456.7 | |||||
Park-Ohio Industries, Inc. and Subsidiaries shareholder's equity: | |||||||
Common stock, par value $1 per share | — | — | |||||
Additional paid-in capital | 88.6 | 81.5 | |||||
Retained earnings | 97.0 | 60.7 | |||||
Accumulated other comprehensive (loss) income | (14.0 | ) | 3.4 | ||||
Total Park-Ohio Industries, Inc. and Subsidiaries shareholder's equity | 171.6 | 145.6 | |||||
Noncontrolling interest | 6.3 | 5.0 | |||||
Total equity | 177.9 | 150.6 | |||||
Total liabilities and shareholder's equity | $ | 963.9 | $ | 807.4 | |||
The accompanying notes are an integral part of these consolidated financial statements.
39
Park-Ohio Industries, Inc. and Subsidiaries
Consolidated Statements of Income
Year Ended December 31, | |||||||||||
2014 | 2013 | 2012 | |||||||||
(In millions) | |||||||||||
Net sales | $ | 1,378.7 | $ | 1,203.2 | $ | 1,128.2 | |||||
Cost of sales | 1,144.2 | 992.2 | 920.9 | ||||||||
Gross profit | 234.5 | 211.0 | 207.3 | ||||||||
Selling, general and administrative expenses | 135.6 | 119.5 | 112.4 | ||||||||
Litigation judgment and settlement costs | — | 5.2 | 13.0 | ||||||||
Operating income | 98.9 | 86.3 | 81.9 | ||||||||
Gain on acquisition of business | — | (0.6 | ) | — | |||||||
Interest expense | 26.1 | 25.9 | 26.0 | ||||||||
Income from continuing operations before income taxes | 72.8 | 61.0 | 55.9 | ||||||||
Income tax expense | 25.2 | 19.6 | 20.8 | ||||||||
Net income from continuing operations | 47.6 | 41.4 | 35.1 | ||||||||
Income (loss) from discontinued operations, net of taxes | — | 3.0 | (2.4 | ) | |||||||
Net income | 47.6 | 44.4 | 32.7 | ||||||||
Net income attributable to noncontrolling interest | (1.3 | ) | (0.5 | ) | — | ||||||
Net income attributable to ParkOhio common shareholder | $ | 46.3 | $ | 43.9 | $ | 32.7 | |||||
The accompanying notes are an integral part of these consolidated financial statements.
40
Park-Ohio Industries, Inc. and Subsidiaries
Consolidated Statements of Comprehensive Income
Year Ended December 31, | ||||||||||||
2014 | 2013 | 2012 | ||||||||||
(In millions) | ||||||||||||
Net income | $ | 47.6 | $ | 44.4 | $ | 32.7 | ||||||
Other comprehensive income (loss): | ||||||||||||
Foreign currency translation (loss) gain | (7.9 | ) | (2.5 | ) | 0.6 | 0.6 | ||||||
Pension and postretirement benefit adjustments, net of tax | (9.5 | ) | 12.8 | 1.0 | 1.0 | |||||||
Total other comprehensive (loss) income | (17.4 | ) | 10.3 | 1.6 | ||||||||
Total comprehensive income, net of tax | 30.2 | 54.7 | 34.3 | |||||||||
Comprehensive income attributable to noncontrolling interest | (1.3 | ) | (0.5 | ) | — | |||||||
Comprehensive income attributable to ParkOhio common shareholder | $ | 28.9 | $ | 54.2 | $ | 34.3 | ||||||
The accompanying notes are an integral part of these consolidated financial statements.
41
Park-Ohio Industries, Inc. and Subsidiaries
Consolidated Statements of Shareholder's Equity
Common Stock | Additional Paid-In Capital | Retained Earnings(Deficit) | Accumulated Other Comprehensive Income (Loss) | Noncontrolling Interest | Total | ||||||||||||||||||
(In millions) | |||||||||||||||||||||||
Balance at January 1, 2012 | $ | — | $ | 59.9 | $ | (3.7 | ) | $ | (8.5 | ) | $ | — | $ | 47.7 | |||||||||
Other comprehensive income | — | — | 32.7 | 1.6 | — | 34.3 | |||||||||||||||||
Share-based compensation | — | 2.7 | — | — | — | 2.7 | |||||||||||||||||
Income tax effect of share-based compensation exercises and vesting | — | 0.4 | — | — | — | 0.4 | |||||||||||||||||
Income tax effect of suspended benefits from share-based compensation | — | 2.8 | — | — | — | 2.8 | |||||||||||||||||
Dividend paid to parent | — | — | (1.5 | ) | — | — | (1.5 | ) | |||||||||||||||
Capital contribution from parent | — | 10.0 | — | — | — | 10.0 | |||||||||||||||||
Balance at December 31, 2012 | — | 75.8 | 27.5 | (6.9 | ) | — | 96.4 | ||||||||||||||||
Other comprehensive income | — | — | 43.9 | 10.3 | 0.5 | 54.7 | |||||||||||||||||
Share-based compensation | — | 4.7 | — | — | — | 4.7 | |||||||||||||||||
Dividend paid to parent | — | — | (10.7 | ) | — | — | (10.7 | ) | |||||||||||||||
Income tax effect of share-based compensation exercises and vesting | — | 0.5 | — | — | — | 0.5 | |||||||||||||||||
Capital contribution from noncontrolling interest | — | 0.5 | — | — | 4.5 | 5.0 | |||||||||||||||||
Balance at December 31, 2013 | — | 81.5 | 60.7 | 3.4 | 5.0 | 150.6 | |||||||||||||||||
Other comprehensive income (loss) | — | — | 46.3 | (17.4 | ) | 1.3 | 30.2 | ||||||||||||||||
Share-based compensation | — | 5.8 | — | — | — | 5.8 | |||||||||||||||||
Dividend paid to parent | — | — | (10.0 | ) | — | — | (10.0 | ) | |||||||||||||||
Income tax effect of share-based compensation exercises and vesting | — | 1.3 | — | — | — | 1.3 | |||||||||||||||||
Balance at December 31, 2014 | $ | — | $ | 88.6 | $ | 97.0 | $ | (14.0 | ) | $ | 6.3 | $ | 177.9 | ||||||||||
The accompanying notes are an integral part of these consolidated financial statements.
42
Park-Ohio Industries, Inc. and Subsidiaries
Consolidated Statements of Cash Flows
Year Ended December 31, | |||||||||||
2014 | 2013 | 2012 | |||||||||
OPERATING ACTIVITIES | (In millions) | ||||||||||
Net income | $ | 47.6 | $ | 44.4 | $ | 32.7 | |||||
Adjustments to reconcile net income to net cash provided by operating activities: | |||||||||||
Depreciation and amortization | 22.4 | 18.5 | 17.5 | ||||||||
Debt extinguishment costs | — | — | 0.3 | ||||||||
Share-based compensation | 5.8 | 4.7 | 2.7 | ||||||||
Gain on sale of business and assets | (1.9 | ) | (6.0 | ) | (0.3 | ) | |||||
Gain on acquisition of business | — | (0.6 | ) | — | |||||||
Deferred income taxes | 0.6 | (2.1 | ) | 8.0 | |||||||
Other | 1.0 | — | — | ||||||||
Changes in operating assets and liabilities, excluding business acquisitions: | |||||||||||
Accounts receivable | (27.9 | ) | 8.5 | 9.6 | |||||||
Inventories and other current assets | (23.4 | ) | (4.7 | ) | 9.3 | ||||||
Accounts payable and accrued expenses | 29.4 | (7.0 | ) | (21.8 | ) | ||||||
Other | 2.3 | 4.0 | (1.5 | ) | |||||||
Net cash provided by operating activities | 55.9 | 59.7 | 56.5 | ||||||||
INVESTING ACTIVITIES | |||||||||||
Purchases of property, plant and equipment | (25.8 | ) | (29.8 | ) | (26.9 | ) | |||||
Proceeds from sale and leaseback transactions | — | 7.4 | 5.9 | ||||||||
Proceeds from sale of assets | 2.1 | 14.2 | 0.4 | ||||||||
Business acquisitions, net of cash acquired | (72.7 | ) | (45.8 | ) | (97.0 | ) | |||||
Net cash used by investing activities | (96.4 | ) | (54.0 | ) | (117.6 | ) | |||||
FINANCING ACTIVITIES | |||||||||||
Proceeds from term loans and other debt | 14.2 | — | 25.9 | ||||||||
Payments on term loans and other debt | (6.6 | ) | (4.2 | ) | (3.7 | ) | |||||
Proceeds from revolving credit facility, net | 50.3 | 9.1 | 8.9 | ||||||||
Dividend paid to parent | (10.0 | ) | (10.7 | ) | (1.5 | ) | |||||
Bank debt issue costs | — | — | (0.9 | ) | |||||||
Income tax effect of suspended benefits from share-based compensation | — | — | 2.8 | ||||||||
Income tax effect of share-based compensation exercises and vesting | 1.3 | 0.5 | 0.4 | ||||||||
Capital contribution from parent | — | — | 10.0 | ||||||||
Other | (1.3 | ) | — | — | |||||||
Net cash provided (used) by financing activities | 47.9 | (5.3 | ) | 41.9 | |||||||
Effect of exchange rate changes on cash | (2.8 | ) | 0.9 | 0.3 | |||||||
Increase (decrease) in cash and cash equivalents | 4.6 | 1.3 | (18.9 | ) | |||||||
Cash and cash equivalents at beginning of period | 43.7 | 42.4 | 61.3 | ||||||||
Cash and cash equivalents at end of period | $ | 48.3 | $ | 43.7 | $ | 42.4 | |||||
Income taxes paid | $ | 25.8 | $ | 25.0 | $ | 5.5 | |||||
Interest paid | $ | 24.0 | $ | 24.8 | $ | 23.8 | |||||
The accompanying notes are an integral part of these consolidated financial statements.
43
Park-Ohio Industries, Inc. and Subsidiaries
Notes to Consolidated Financial Statements
December 31, 2014, 2013 and 2012
NOTE 1 — Summary of Significant Accounting Policies
Consolidation and Basis of Presentation: The consolidated financial statements include the accounts of the Company and all of its majority-owned subsidiaries. All significant intercompany accounts and transactions have been eliminated upon consolidation. The Company does not have off-balance sheet arrangements or financings with unconsolidated entities or other persons. In the ordinary course of business, the Company leases certain real properties owned by related parties as described in Note 12. Transactions with related parties are in the ordinary course of business and are not material to the Company’s financial position, results of operations or cash flows. In December 2014, the Company purchased real estate owned by a company owned by the Chairman and Chief Executive Officer of the Company for cash of $1.8 million. The transaction is included in the capital expenditures of the cash flow statement.
Accounting Estimates: The preparation of financial statements in conformity with accounting principles generally accepted in the United States requires management to make estimates and assumptions that affect the reported amounts of assets and liabilities and disclosure of contingent assets and liabilities at the date of the financial statements and the reported amounts of revenues and expenses during the reporting period. Actual results could differ from those estimates.
Cash Equivalents: The Company considers all highly liquid investments with a maturity of three months or less when purchased to be cash equivalents.
Inventories: Inventories are stated at the lower of first-in, first-out (“FIFO”) cost or market value.
Major Classes of Inventories | December 31, 2014 | December 31, 2013 | |||||
(In millions) | |||||||
Finished goods | $ | 146.0 | $ | 124.1 | |||
Work in process | 19.8 | 36.0 | |||||
Raw materials and supplies | 72.6 | 61.3 | |||||
Inventories, net | $ | 238.4 | $ | 221.4 | |||
Other inventory items | |||||||
Inventory reserves | $ | 29.9 | $ | 28.4 | |||
Consigned Inventory | $ | 7.8 | $ | 6.6 | |||
Property, Plant and Equipment: Property, plant and equipment are carried at cost. Additions and associated interest costs are capitalized and expenditures for repairs and maintenance are charged to operations. Depreciation of fixed assets is computed principally by the straight-line method based on the estimated useful lives of the assets ranging from five to 50 years for buildings, and one to 20 years for machinery and equipment.
44
Park-Ohio Industries, Inc. and Subsidiaries
Notes to Consolidated Financial Statements — (Continued)
The following table summarizes property, plant and equipment at December 31, 2014 and December 31, 2013:
December 31, 2014 | December 31, 2013 | ||||||
(In millions) | |||||||
Property, plant and equipment: | |||||||
Land and land improvements | $ | 7.1 | $ | 6.4 | |||
Buildings | 70.9 | 60.7 | |||||
Machinery and equipment | 288.7 | 256.7 | |||||
Total property, plant and equipment | 366.7 | 323.8 | |||||
Less accumulated depreciation | 225.7 | 209.3 | |||||
Net property, plant and equipment | $ | 141.0 | $ | 114.5 | |||
Impairment of Long-Lived Assets: We assess the recoverability of long-lived assets (excluding goodwill) and identifiable acquired intangible assets with finite useful lives, whenever events or changes in circumstances indicate that we may not be able to recover the assets’ carrying amount. We measure the recoverability of assets to be held and used by a comparison of the carrying amount of the asset to the expected net future undiscounted cash flows to be generated by that asset, or, for identifiable intangibles with finite useful lives, by determining whether the amortization of the intangible asset balance over its remaining life can be recovered through undiscounted future cash flows. The amount of impairment of identifiable intangible assets with finite useful lives, if any, to be recognized is measured based on projected discounted future cash flows. We measure the amount of impairment of other long-lived assets (excluding goodwill) as the amount by which the carrying value of the asset exceeds the fair market value of the asset, which is generally determined, based on projected discounted future cash flows or appraised values. We classify long-lived assets to be disposed of other than by sale as held and used until they are disposed.
Goodwill and Indefinite-Lived Assets: In accordance with Accounting Standards Codification (“ASC”) 350, “Intangibles — Goodwill and Other” (“ASC 350”), the Company does not amortize goodwill or indefinite-lived intangible assets recorded in connection with business acquisitions.
Goodwill and indefinite life intangible assets are tested annually for impairment as of October 1, or whenever events or changes in circumstances indicate there may be a possible permanent loss of value in accordance with ASC 350.
Goodwill is tested for impairment at the reporting unit level and is based on the net assets for each reporting unit, including goodwill and intangible assets, compared to the fair value. In accordance with Accounting Standard Update (“ASU”) 2011-08, an entity has the option to first assess qualitative factors to determine whether the existence of events or circumstances leads to a determination that it is more likely than not that the fair value of a reporting unit is less than its carrying amount. If, after assessing the totality of events or circumstances, an entity determines it is not more likely than not that the fair value of a reporting unit is less than its carrying amount, then performing the two-step quantitative impairment test is unnecessary.
In assessing the qualitative factors to determine whether it is more likely than not that the fair value of a reporting unit is less than its carrying amount, we identify and assess relevant drivers of fair value and events and circumstances that may impact the fair value and the carrying amount of the reporting unit. The identification of relevant events and circumstances and how these may impact a reporting unit’s fair value or carrying amount involve significant judgments and assumptions. The judgments and assumptions include the identification of macroeconomic conditions, industry and market considerations, cost factors, overall financial performance, Company-specific events and share price trends, and the assessment of whether each relevant factor will impact the impairment test positively or negatively and the magnitude of any such impact.
If our qualitative assessment concludes that it is more likely than not that impairment exists then a quantitative assessment is required. In a quantitative assessment, we use an income approach and other valuation techniques to estimate the fair value of our reporting units. Absent an indication of fair value from a potential buyer or similar specific transactions, we believe that using this methodology provides reasonable estimates of a reporting unit’s fair value. The income approach is based on projected future debt-free cash flow that is discounted to present value using factors that consider the timing and risk of the
45
Park-Ohio Industries, Inc. and Subsidiaries
Notes to Consolidated Financial Statements — (Continued)
future cash flows. We believe that this approach is appropriate because it provides a fair value estimate based upon the reporting unit’s expected long-term operating and cash flow performance. This approach also mitigates most of the impact of cyclical downturns that occur in the reporting unit’s industry. The income approach is based on a reporting unit’s projection of operating results and cash flows that is discounted using a weighted-average cost of capital. The projection is based upon our best estimates of projected economic and market conditions over the related period including growth rates, estimates of future expected changes in operating margins and cash expenditures. Other significant estimates and assumptions include terminal value growth rates, terminal value margin rates, future capital expenditures and changes in future working capital requirements based on management projections. There are inherent uncertainties, however, related to these factors and to our judgment in applying them to this analysis. Nonetheless, we believe that this method provides a reasonable approach to estimate the fair value of our reporting units.
The Company completed its annual goodwill impairment test for each year presented and confirmed no reporting unit was at risk of failing the impairment test for any periods presented herein.
Indefinite life intangible assets are tested annually for impairment as of October 1, or whenever events or changes in circumstances indicate there may be a possible permanent loss of value in accordance with ASC 350. In accordance with ASU 2011-08, an entity may elect to first assess qualitative factors to determine whether it is more likely than not that the fair value of the indefinite-lived intangible is less than its carrying value. The Company completed its annual indefinite-lived intangible impairment assessment. As a result of this analysis, we concluded that no impairment existed.
Fair Values of Financial Instruments: Certain financial instruments are required to be recorded at fair value. The Company measures financial assets and liabilities at fair value in three levels of inputs. The three-tier fair value hierarchy, which prioritizes the inputs used in the valuation methodologies, is:
Level 1 — Valuations based on quoted prices for identical assets and liabilities in active markets.
Level 2 — Valuations based on observable inputs other than quoted prices included in Level 1, such as quoted prices for similar assets and liabilities in active markets, quoted prices for identical or similar assets and liabilities in markets that are not active, or other inputs that are observable or can be corroborated by observable market data.
Level 3 — Valuations based on unobservable inputs reflecting our own assumptions, consistent with reasonably available assumptions made by other market participants. These valuations require significant judgment.
Changes in assumptions or estimation methods could affect the fair value estimates; however, we do not believe any such changes would have a material impact on our financial condition, results of operations or cash flows. The carrying value of cash and cash equivalents, accounts receivable, accounts payable and borrowings under the Credit Agreement (as defined in Note 9) approximate fair value at December 31, 2014 and December 31, 2013. The fair values of long-term debt and pension plan assets are disclosed in Note 9 and Note 13, respectively.
The Company has not changed its valuation techniques for measuring fair value during 2014 and there were no transfers between levels during the periods presented.
Income Taxes: The Company accounts for income taxes under the asset and liability method, whereby deferred tax assets and liabilities are determined based on temporary differences between the financial reporting and the tax bases of assets and liabilities and are measured using the current enacted tax rates. In determining these amounts, management determined the probability of realizing deferred tax assets, taking into consideration factors including historical operating results, cumulative earnings and losses, expectations of future earnings, taxable income and the extended period of time over which the postretirement benefits will be paid and accordingly records valuation allowances if, based on the weight of available evidence it is more likely than not that some portion or all of our deferred tax assets will not be realized as required by ASC 740, “Income Taxes” (“ASC 740”).
Stock-Based Compensation: The Company follows the provisions of ASC 718, “Compensation — Stock Compensation” (“ASC 718”), which requires all share-based payments to employees, including grants of employee stock
46
Park-Ohio Industries, Inc. and Subsidiaries
Notes to Consolidated Financial Statements — (Continued)
options, to be recognized in the income statement based on their fair values. Compensation expense for awards with service conditions only that are subject to graded vesting is recognized on a straight-line basis over the term of the vesting period.
Holdings grants share-based compensation awards to Industries' employees. In accordance with ASC 718, such costs are allocated to Industries. Under the provisions of the Company’s 1998 Long-Term Incentive Plan, as amended (“1998 Plan”), which is administered by the Compensation Committee of Holdings' Board of Directors, incentive stock options, non-statutory stock options, stock appreciation rights (“SARs”), restricted share units, performance shares or stock awards may be awarded to directors and all employees of the Company and its subsidiaries. Stock options will be exercisable in whole or in installments as may be determined provided that no options will be exercisable more than ten years from date of grant. The exercise price will be the fair market value at the date of grant. The aggregate number of shares of Holdings' common stock that may be awarded under the 1998 Plan is 3,700,000, all of which may be incentive stock options. No more than 500,000 shares shall be the subject of awards to any individual participant in any one calendar year.
Revenue Recognition: The Company recognizes revenue, other than from long-term contracts, when title is transferred to the customer, typically upon shipment. Revenue from long-term contracts (approximately 8% of consolidated revenue) is accounted for under the percentage of completion method, and recognized on the basis of the percentage each contract’s cost to date bears to the total estimated contract cost. Revenue earned on contracts in process that are in excess of billings, is classified in unbilled contract revenues in the accompanying consolidated balance sheets. Billings that are in excess of revenues earned on contracts in process are classified in accrued expenses in the accompanying balance sheets.
Cost of Sales: Cost of sales is primarily comprised of direct materials and supplies consumed in the manufacture of product, as well as manufacturing labor, depreciation expense and direct overhead expense necessary to acquire and convert the purchased materials and supplies into finished product. Cost of sales also includes the cost to distribute products to customers, inbound freight costs, internal transfer costs, warehousing costs and other shipping and handling activity.
Shipping and Handling Costs: All shipping and handling costs are included in cost of sales in the Consolidated Statements of Income.
Accounts Receivable and Allowance for Doubtful Accounts: Accounts receivable are recorded at net realizable value. Accounts receivable are reduced by an allowance for amounts that may become uncollectable in the future. The Company’s policy is to identify and reserve for specific collectability concerns based on customers’ financial condition and payment history. During 2014 and 2013, we sold approximately $95.0 million and $75.4 million, respectively, of accounts receivable to mitigate accounts receivable concentration risk and to provide additional financing capacity. In compliance with ASC 860, “Transfers and Servicing”, sales of accounts receivable are reflected as a reduction of accounts receivable in the Consolidated Balance Sheets and the proceeds are included in the cash flows from operating activities in the Consolidated Statements of Cash flows. In 2014 and 2013, an expense in the amount of $0.5 million and $0.4 million, respectively, related to the discount on sale of accounts receivable is recorded in the Consolidated Statements of Income.
Concentration of Credit Risk: The Company sells its products to customers in diversified industries. The Company performs ongoing credit evaluations of its customers’ financial condition but does not require collateral to support customer receivables. The Company establishes an allowance for doubtful accounts based upon factors surrounding the credit risk of specific customers, historical trends and other information. As of December 31, 2014, the Company had uncollateralized receivables with six customers in the automotive industry, each with several locations, aggregating $37.7 million, which represented approximately 18% of the Company’s trade accounts receivable. During 2014, sales to these customers amounted to approximately $252.6 million, which represented approximately 18% of the Company’s net sales.
Environmental: The Company accrues environmental costs related to existing conditions resulting from past or current operations and from which no current or future benefit is discernible. Costs that extend the life of the related property or mitigate or prevent future environmental contamination are capitalized. The Company records a liability when environmental assessments and/or remedial efforts are probable and can be reasonably estimated. The estimated liability of the Company is not reduced for possible recoveries from insurance carriers.
47
Park-Ohio Industries, Inc. and Subsidiaries
Notes to Consolidated Financial Statements — (Continued)
Legal Contingencies: We are involved in a variety of claims, suits, investigations and administrative proceedings with respect to commercial, premises liability, product liability, employment and environmental matters arising from the ordinary course of business. We accrue reserves for legal contingencies, on an undiscounted basis, when it is probable that we have incurred a liability and we can reasonably estimate an amount. When a single amount cannot be reasonably estimated, but the cost can be estimated within a range, we accrue the minimum amount in the range. Based upon facts and information currently available, we believe the amounts reserved are adequate for such pending matters. We monitor the development of legal proceedings on a regular basis and will adjust our reserves when, and to the extent, additional information becomes available.
Foreign Currency Translation: The functional currency for a majority of subsidiaries outside the United States is the local currency. Financial statements for these subsidiaries are translated into U.S. dollars at year-end exchange rates for assets and liabilities and weighted-average exchange rates for revenues and expenses. The resulting translation adjustments are recorded in accumulated comprehensive income (loss) in shareholder's equity.
Recent Accounting Pronouncements Not Yet Adopted
In April 2014, the FASB issued ASU 2014-08, “Presentation of Financial Statements (Topic 205) and Property, Plant, and Equipment (Topic 360): Reporting Discontinued Operations and Disclosures of Disposals of Components of an Entity,” which raises the threshold for disposals to qualify as discontinued operations and requires new disclosures for discontinued operations and for individually material disposal transactions that do not meet the definition of a discontinued operation. The ASU is effective prospectively for reporting periods beginning with the first quarter of 2015. Early adoption is permitted for disposals that have not been previously reported in the financial statements. We believe the adoption of this ASU will have an insignificant effect on our consolidated financial statement as it only applies to future disposals.
In May 2014, the FASB issued ASU 2014-09, “Revenue from Contracts with Customers (Topic 606),” which was the result of a joint project by the FASB and International Accounting Standards Board to clarify the principles for recognizing revenue and to develop a common revenue standard for U.S. generally accepted accounting principles and International Financial Reporting Standards. The issuance of a comprehensive and converged standard on revenue recognition is expected to enable financial statement users to better understand and consistently analyze an entity’s revenue across industries, transactions, and geographies. The ASU will require additional disclosures to help financial statement users better understand the nature, amount, timing, and potential uncertainty of the revenue that is recognized. The ASU is effective for annual reporting periods beginning after December 15, 2016, and will require either retrospective application to each prior reporting period presented or retrospective application with the cumulative effect of initially applying the standard recognized at the date of adoption. The Company is currently evaluating the impact of adopting this guidance.
Reclassification: Certain amounts in the prior years' financial statements have been reclassified to conform to the current year presentation.
NOTE 2 — Segments
The Company operates through three reportable segments: Supply Technologies, Assembly Components and Engineered Products. Supply Technologies provides our customers with Total Supply Management™ services for a broad range of high-volume, specialty production components. Total Supply Management™ manages the efficiencies of every aspect of supplying production parts and materials to our customers’ manufacturing floor, from strategic planning to program implementation, and includes such services as engineering and design support, part usage and cost analysis, supplier selection, quality assurance, bar coding, product packaging and tracking, just-in-time and point-of-use delivery, electronic billing services and ongoing technical support. Assembly Components manufactures cast aluminum components, automotive and industrial rubber and thermoplastic products, gasoline direct injection systems, fuel filler and hydraulic assemblies for automotive, agricultural equipment, construction equipment, heavy-duty truck and marine equipment industries. Assembly Components also provides value-added services such as design and engineering, machining and assembly. Engineered Products operates a diverse group of niche manufacturing businesses that design and manufacture a broad range of high quality products engineered for specific customer applications.
The Company primarily evaluates performance and allocates resources based on segment operating income as well as projected future performance. Segment operating income is defined as revenues less expenses identifiable to the product lines
48
Park-Ohio Industries, Inc. and Subsidiaries
Notes to Consolidated Financial Statements — (Continued)
included within each segment. Segment operating income reconciles to consolidated income from continuing operations before income taxes by deducting corporate costs and other income or expense items that are not attributed to the segments and net interest expense.
Results by business segment were as follows:
Year Ended December 31, | |||||||||||
2014 | 2013 | 2012 | |||||||||
(In millions) | |||||||||||
Net sales: | |||||||||||
Supply Technologies | $ | 559.6 | $ | 471.9 | $ | 483.8 | |||||
Assembly Components | 490.5 | 412.8 | 304.0 | ||||||||
Engineered Products | 328.6 | 318.5 | 340.4 | ||||||||
$ | 1,378.7 | $ | 1,203.2 | $ | 1,128.2 | ||||||
Segment operating income: | |||||||||||
Supply Technologies | $ | 42.5 | $ | 35.0 | $ | 37.5 | |||||
Assembly Components | 42.0 | 31.8 | 19.9 | ||||||||
Engineered Products | 42.7 | 47.1 | 55.0 | ||||||||
Total segment operating income | 127.2 | 113.9 | 112.4 | ||||||||
Corporate costs | (28.3 | ) | (22.4 | ) | (17.5 | ) | |||||
Litigation judgment and settlement costs | — | (5.2 | ) | (13.0 | ) | ||||||
Gain on acquisition of business | — | 0.6 | — | ||||||||
Interest expense | (26.1 | ) | (25.9 | ) | (26.0 | ) | |||||
Income from continuing operations before income taxes | $ | 72.8 | $ | 61.0 | $ | 55.9 | |||||
49
Park-Ohio Industries, Inc. and Subsidiaries
Notes to Consolidated Financial Statements — (Continued)
Year Ended December 31, | |||||||||||
2014 | 2013 | 2012 | |||||||||
(In millions) | |||||||||||
Identifiable assets: | |||||||||||
Supply Technologies | $ | 277.6 | $ | 241.7 | $ | 207.0 | |||||
Assembly Components | 340.5 | 276.7 | 230.0 | ||||||||
Engineered Products | 246.9 | 183.1 | 199.4 | ||||||||
General corporate | 98.9 | 105.9 | 86.4 | ||||||||
$ | 963.9 | $ | 807.4 | $ | 722.8 | ||||||
Depreciation and amortization expense: | |||||||||||
Supply Technologies | $ | 4.5 | $ | 3.0 | $ | 3.9 | |||||
Assembly Components | 14.2 | 11.6 | 9.5 | ||||||||
Engineered Products | 3.3 | 3.4 | 3.2 | ||||||||
General corporate | 0.4 | 0.5 | 0.9 | ||||||||
$ | 22.4 | $ | 18.5 | $ | 17.5 | ||||||
Capital expenditures: | |||||||||||
Supply Technologies | $ | 5.8 | $ | 3.8 | $ | 1.6 | |||||
Assembly Components | 14.0 | 21.5 | 22.1 | ||||||||
Engineered Products | 2.4 | 3.6 | 3.1 | ||||||||
General corporate | 1.5 | 0.9 | 0.1 | ||||||||
$ | 23.7 | $ | 29.8 | $ | 26.9 | ||||||
The percentage of net sales by product line included in each segment was as follows:
Year Ended December 31, | ||||||||
2014 | 2013 | 2012 | ||||||
Supply Technologies: | ||||||||
Supply Technologies | 88 | % | 87 | % | 88 | % | ||
Engineered specialty products | 12 | % | 13 | % | 12 | % | ||
100 | % | 100 | % | 100 | % | |||
Assembly Components: | ||||||||
Fluid routing | 49 | % | 54 | % | 50 | % | ||
Aluminum products | 43 | % | 37 | % | 39 | % | ||
Rubber and plastics | 6 | % | 7 | % | 9 | % | ||
Screw products | 2 | % | 2 | % | 2 | % | ||
100 | % | 100 | % | 100 | % | |||
Engineered Products: | ||||||||
Industrial equipment business | 78 | % | 77 | % | 80 | % | ||
Forged and machined products | 22 | % | 23 | % | 20 | % | ||
100 | % | 100 | % | 100 | % | |||
50
Park-Ohio Industries, Inc. and Subsidiaries
Notes to Consolidated Financial Statements — (Continued)
The Company’s approximate percentage of net sales by geographic region was as follows:
Year Ended December 31, | ||||||||
2014 | 2013 | 2012 | ||||||
United States | 74 | % | 74 | % | 77 | % | ||
Canada | 7 | % | 8 | % | 8 | % | ||
Europe | 6 | % | 5 | % | 4 | % | ||
Asia | 6 | % | 6 | % | 6 | % | ||
Mexico | 5 | % | 5 | % | 4 | % | ||
Other | 2 | % | 2 | % | 1 | % | ||
100 | % | 100 | % | 100 | % | |||
The basis for attributing revenue to individual countries is final shipping destination.
At December 31, 2014, 2013 and 2012, approximately 72%, 77% and 81%, respectively, of the Company’s assets were maintained in the United States.
NOTE 3 — Acquisitions
In December 2014, the Company acquired all the outstanding capital stock of Saet S.p.A. (“Saet”) for $22.1 million in cash. Saet is a leader in the design, manufacturing and testing of induction heating equipment and heat treat solutions through its locations in Italy, China, India and Tennessee. The financial results of Saet are included in the Company's Engineered Products segment from the date of acquisition. Saet's sales for the year ended December 31, 2013 were approximately $35.9 million.
The acquisition of Saet was accounted for under the acquisition method of accounting. The entire purchase price allocation for Saet is preliminary. At December 31, 2014, the fair values of the assets acquired and liabilities assumed have been preliminarily estimated based on their carrying values and the excess consideration of $23.2 million has been preliminarily recorded as goodwill due to the proximity of the acquisition to the year-end date and pending finalization of the fair value. These preliminary estimates will be revised during the measurement period in 2015 as all pertinent information regarding finalization of the third-party valuations for inventories, intangible assets, goodwill, tangible assets, other liabilities and deferred income tax assets and liabilities acquired are fully evaluated by the Company.
In October 2014, the Company acquired all the outstanding capital stock of Autoform Tool and Manufacturing (“Autoform”) for a total purchase consideration of $48.9 million in cash. The acquisition was funded from borrowings under the revolving credit facility provided by the Credit Agreement. Autoform is a supplier of high end pressure fuel lines used in gasoline direct injection systems across a large number of engine platforms. Autoform's production facilities are located in Indiana. The financial results of Autoform are included in the Company's Assembly Components segment from the date of acquisition. Autoform generated approximately $36.8 million of revenue for the year ended December 31, 2013.
In June 2014, the Company acquired all the outstanding capital stock of Apollo Aerospace Group (“Apollo”) for $6.5 million, net of cash acquired. Apollo is a supply chain management company providing Class C production components and supply chain solutions to aerospace customers worldwide. Apollo generated net sales of approximately $8.1 million for its fiscal year ended March 31, 2014. The financial results of Apollo are included in the Company's Supply Technologies segment from the date of acquisition.
The acquisitions of Autoform and Apollo were accounted for under the acquisition method of accounting. The purchase price allocations were preliminary as of December 31, 2014. The Apollo purchase agreement provides payment of contingent consideration of approximately $2.4 million based on achievement of certain EBITDA targets over two years. The fair value of the earn-out was approximately $1.1 million at the date of the acquisition for a total purchase consideration of $6.5 million. On the acquisition date, a liability was recognized for the estimate of the acquisition date fair value of the earn-out. Any change in the fair value of the earn-out subsequent to the acquisition date will be recognized in selling, general and administrative expenses. Management's valuation of the fair value of tangible and intangible assets acquired and liabilities assumed for these acquisitions is based on estimates and assumptions. The purchase price allocation relating to these acquisitions is subject to further adjustment
51
Park-Ohio Industries, Inc. and Subsidiaries
Notes to Consolidated Financial Statements — (Continued)
until all pertinent information regarding finalization of the appraisals for intangibles, goodwill and deferred income tax assets and liabilities acquired are fully evaluated by the Company and independent valuations are complete. Revisions to these estimates as fair values are finalized will be reflected in the financial statements throughout the measurement period. Based on the preliminary purchase price allocation for these acquisitions, goodwill of $5.7 million was recorded.
In November 2013, the Company acquired all the outstanding capital stock of QEF Global Limited (“QEF”). QEF is a provider of supply chain management solutions with four locations throughout Ireland, Scotland and England. QEF's sales for the year ended December 31, 2012 totaled approximately $14.0 million.
In October 2013, the Company acquired all of the outstanding capital stock of Henry Halstead Ltd. (“Henry Halstead”). Henry Halstead is a provider of supply chain management solutions throughout the United Kingdom and Ireland. The Company paid $24.2 million (net of cash acquired) in the aggregate for QEF and Henry Halstead. QEF and Henry Halstead are included in our Supply Technologies segment from their respective dates of acquisition. Based on the final purchase price allocations for these acquisitions, goodwill of $7.9 million was recorded.
During August 2013, the Company acquired certain assets and liabilities of a small business, which resulted in a pre-tax gain of $0.6 million during the third quarter of 2013. The small business is engaged in the business of designing, manufacturing, selling, distributing and installing various tube bending machines and related tooling, spare and replacement parts and ancillary services for commercial applications. The small business is included in our Engineered Products segment from the date of acquisition. The purchase price was not significant to the results of operations, financial condition or liquidity.
Effective April 26, 2013, the Company acquired certain assets and assumed specific liabilities relating to Bates Rubber Inc. (“Bates”) for a total purchase price of $20.8 million in cash. The acquisition was funded from borrowings under the revolving credit facility provided by the Credit Agreement. Bates is a leading manufacturer of extruded, formed and molded products and assemblies for the transportation and industrial markets. Bates’ production facilities are located in Tennessee. The financial results of Bates are included in the Company’s Assembly Components segment and had insignificant revenues and net income from the date acquired. The acquisition was accounted for under the acquisition method of accounting. Based on the final purchase price allocation goodwill of $5.0 million was recorded. Assuming the QEF, Henry Halstead and Bates acquisitions had taken place at the beginning of 2012, the Company's results would not have been materially different.
On November 30, 2012, the Company completed the acquisition of Elastomeros Tecnicos Moldeados Inc. (“ETM”) for $1.1 million in cash, $0.5 million in promissory notes payable and $0.1 million annually in each of the next four years, if ETM achieves certain earnings levels. ETM is a provider of molded rubber products and has been integrated into the Company’s Assembly Components segment. The acquisition was accounted for under the acquisition method of accounting. Under the acquisition method of accounting, the purchase price is allocated to ETM’s tangible and intangible assets acquired and liabilities assumed based on their estimated fair values as of November 30, 2012, the effective date of the acquisition. Based on the final purchase price allocation, goodwill of $0.9 million was recorded.
On March 23, 2012, the Company completed the acquisition of Fluid Routing Solutions LLC (“FRS”), a leading manufacturer of automotive and industrial rubber and thermoplastic hose products and fuel filler and hydraulic fluid assemblies, in an all cash transaction valued at $98.8 million. FRS products include fuel filler, hydraulic, and thermoplastic assemblies and several forms of manufactured rubber and thermoplastic hose, including bulk and formed fuel, power steering, transmission oil cooling, hydraulic and thermoplastic hose. FRS sells to automotive and industrial customers throughout North America, Europe and Asia. FRS has five production facilities located in Florida, Michigan, Ohio, Tennessee and the Czech Republic. FRS is included in the Company’s Assembly Components segment and had revenues of $152.4 million and net income of $7.1 million for the period from the date acquired through December 31, 2012. The Company funded the acquisition with cash of $40.0 million, a $25.0 million seven-year amortizing term loan provided by the Credit Agreement and secured by certain real estate and machinery and equipment of the Company and $33.8 million of borrowings under the revolving credit facility provided by the Credit Agreement. The acquisition was accounted for under the acquisition method of accounting. Under the acquisition method of accounting, the total purchase price is allocated to FRS’ net tangible assets and intangible assets acquired and liabilities assumed based on their estimated fair values as of March 23, 2012, the effective date of the acquisition. Based on management’s valuation of the fair value of tangible and intangible assets acquired and liabilities assumed, which are based on
52
Park-Ohio Industries, Inc. and Subsidiaries
Notes to Consolidated Financial Statements — (Continued)
estimates and assumptions, the final purchase price is allocated as follows:
(In millions) | |||
Cash and cash equivalents | $ | 2.8 | |
Accounts receivable | 30.9 | ||
Inventories | 12.4 | ||
Prepaid expenses and other current assets | 2.7 | ||
Property, plant and equipment | 30.2 | ||
Customer relationships | 29.4 | ||
Trademarks and trade name | 11.5 | ||
Other assets | 0.2 | ||
Accounts payable | (17.8 | ) | |
Accrued expenses | (15.6 | ) | |
Deferred tax liability | (26.4 | ) | |
Other long-term liabilities | (0.8 | ) | |
Goodwill | 39.3 | ||
Total purchase price | $ | 98.8 | |
The following unaudited pro forma information is provided to present a summary of the combined results of the Company’s operations with FRS as if the acquisition had occurred on January 1, 2011. The unaudited pro forma financial information is for informational purposes only and is not necessarily indicative of what the results would have been had the acquisition been completed at the date indicated above.
Year Ended December 31, | |||
2012 | |||
(In millions) | |||
Pro forma revenues | $ | 1,179.1 | |
Pro forma net income | $ | 39.1 | |
NOTE 4 — Dispositions
On September 3, 2013, the Company sold all of the outstanding equity interests of a non-core business unit in the Supply Technologies segment for $8.5 million in cash. This business unit is a provider of high-quality machine to machine information technology solutions, products and services. As a result of the sale, this business unit has been removed from the Supply Technologies segment and presented as a discontinued operation for all of the periods presented. Effective immediately upon the disposition, the non-core business unit was released from its guarantee of the Company's 8.125% Senior Notes due 2021 (the "Notes"). The financial position of the discontinued operation was not significant. Select financial information included in discontinued operations were as follows:
53
Year Ended December 31, | |||||||
2013 | 2012 | ||||||
(In millions) | |||||||
Net sales | $ | 5.2 | $ | 5.8 | |||
Loss from discontinued operations before tax | $ | (1.3 | ) | $ | (4.0 | ) | |
Income tax benefit from operations | 0.5 | 1.6 | |||||
Net loss from discontinued operations | (0.8 | ) | (2.4 | ) | |||
Gain on sale of business before tax | 5.3 | — | |||||
Income tax expense from gain on sale of business | (1.5 | ) | — | ||||
Net gain on sale of business | 3.8 | — | |||||
Income (loss) from discontinued operations, net of taxes | $ | 3.0 | $ | (2.4 | ) | ||
On August 1, 2013, the Company sold 25% of its Southwest Steel Processing LLC ("SSP") business to Arkansas Steel Associates, LLC for $5.0 million in cash. SSP is included in our Engineered Products segment. This transaction facilitates the Company's capacity expansion in one of its growing product lines. As of June 30, 2013, SSP had guaranteed the Notes. Effective in the third quarter of 2013, SSP was released from this guarantee in conjunction with its designation as an "Unrestricted Subsidiary" under the indenture governing the Notes and the sale of the 25% of its business.
NOTE 5 — Goodwill
The changes in the carrying amount of goodwill by reportable segment for the years ended December 31, 2014, 2013, and 2012 were as follows:
Supply Technologies | Assembly Components | Engineered Products | Total | ||||||||||||
(In millions) | |||||||||||||||
Balance at January 1, 2012 | $ | — | $ | 4.6 | $ | 4.9 | $ | 9.5 | |||||||
Acquisitions | — | 40.2 | — | 40.2 | |||||||||||
Balance at December 31, 2012 | — | 44.8 | 4.9 | 49.7 | |||||||||||
Acquisitions | 6.2 | 4.2 | — | 10.4 | |||||||||||
Foreign currency translation | 0.2 | — | 0.1 | 0.3 | |||||||||||
Balance at December 31, 2013 | 6.4 | 49.0 | 5.0 | 60.4 | |||||||||||
Acquisitions | 0.7 | 5.0 | 23.2 | 28.9 | |||||||||||
Foreign currency translation | 0.5 | — | (0.3 | ) | 0.2 | ||||||||||
Balance at December 31, 2014 | $ | 7.6 | $ | 54.0 | $ | 27.9 | $ | 89.5 | |||||||
The increase in goodwill from December 31, 2013 is due to the acquisitions of Apollo in the second quarter of 2014 and Autoform and Saet in the fourth quarter of 2014. Apollo is included in the Supply Technologies reportable segment, Autoform is included in the Assembly Components reportable segment and Saet is included in the Engineered Products reportable segment. The goodwill associated with the Autoform transaction is deductible for income tax purposes. The goodwill associated with the Apollo and Saet transactions is not deductible for income tax purposes.
The increase in goodwill from December 31, 2012 is due to the acquisitions of Bates in the second quarter of 2013 and Henry Halstead and QEF in the fourth quarter of 2013. Bates is included in the Assembly Components reportable segment and Henry Halstead and QEF are included in the Supply Technologies reportable segment. The goodwill associated with the Bates
54
Park-Ohio Industries, Inc. and Subsidiaries
Notes to Consolidated Financial Statements — (Continued)
transaction is deductible for income tax purposes. The goodwill associated with the Henry Halstead and QEF transactions is not deductible for income tax purposes.
The increase in goodwill from January 1, 2012 to December 31, 2012 is due to the acquisitions of FRS in the first quarter of 2012 and ETM in the fourth quarter of 2012.
NOTE 6 — Other Intangible Assets
Information regarding other intangible assets as of December 31, 2014 and December 31, 2013 follows:
December 31, 2014 | December 31, 2013 | ||||||||||||||||||||||||
Weighted Average Useful Life | Acquisition Costs | Accumulated Amortization | Net | Acquisition Costs | Accumulated Amortization | Net | |||||||||||||||||||
(In millions) | |||||||||||||||||||||||||
Non-contractual customer relationships | 11.9 years | $ | 77.3 | $ | 13.2 | $ | 64.1 | $ | 61.1 | $ | 8.7 | $ | 52.4 | ||||||||||||
Indefinite-lived tradenames | * | 14.0 | * | 14.0 | 11.7 | * | 11.7 | ||||||||||||||||||
Other | 17.5 years | 12.3 | 2.3 | 10.0 | 3.9 | 1.8 | 2.1 | ||||||||||||||||||
Total | $ | 103.6 | $ | 15.5 | $ | 88.1 | $ | 76.7 | $ | 10.5 | $ | 66.2 | |||||||||||||
* Not meaningful, tradenames have an indefinite life. | |||||||||||||||||||||||||
Information regarding amortization expense of other intangible assets follows:
Year Ended December 31, | |||||||||||
2014 | 2013 | 2012 | |||||||||
(In millions) | |||||||||||
Amortization expense | $ | 4.8 | $ | 3.5 | $ | 2.5 | |||||
Amortization expense for the five years subsequent to December 31, 2014 follows:
(In millions) | |||
2015 | $ | 6.5 | |
2016 | $ | 6.4 | |
2017 | $ | 6.4 | |
2018 | $ | 6.2 | |
2019 | $ | 5.8 | |
NOTE 7 — Other Long-Term Assets
Other assets consist of the following:
December 31, | |||||||
2014 | 2013 | ||||||
(In millions) | |||||||
Pension assets | $ | 64.6 | $ | 73.3 | |||
Deferred financing costs, net | 5.1 | 5.7 | |||||
Other | 3.5 | 1.4 | |||||
Total | $ | 73.2 | $ | 80.4 | |||
55
Park-Ohio Industries, Inc. and Subsidiaries
Notes to Consolidated Financial Statements — (Continued)
NOTE 8 — Accrued Expenses
Accrued expenses and other current liabilities consist of the following:
December 31, | |||||||
2014 | 2013 | ||||||
(In millions) | |||||||
Accrued salaries, wages and benefits | $ | 25.4 | $ | 22.2 | |||
Advance billings | 28.4 | 20.4 | |||||
Current portion of long-term debt | 9.4 | 4.4 | |||||
Warranty accrual | 6.9 | 5.4 | |||||
Interest payable | 5.2 | 5.6 | |||||
Current portion of other post-retirement liabilities | 1.6 | 1.7 | |||||
Taxes, income and other | — | 2.9 | |||||
Other | 26.8 | 23.0 | |||||
Total | $ | 103.7 | $ | 85.6 | |||
Substantially all advance billings relate to the Company’s industrial equipment business unit. Warranty liabilities are primarily associated with the Company’s industrial equipment business unit and the fluid routing solutions business.
The Company estimates the amount of warranty claims on sold products that may be incurred based on current and historical data. The actual warranty expense could differ from the estimates made by the Company based on product performance. The following table presents the changes in the Company’s product warranty liability for the years ended December 31, 2014, 2013, and 2012:
Year Ended December 31, | |||||||||||
2014 | 2013 | 2012 | |||||||||
(In millions) | |||||||||||
Balance at January 1, | $ | 5.4 | $ | 6.9 | $ | 4.2 | |||||
Claims paid during the year | (2.9 | ) | (6.4 | ) | (6.0 | ) | |||||
Warranty expense | 4.0 | 4.9 | 5.4 | ||||||||
Acquired warranty liabilities | 0.4 | — | 3.3 | ||||||||
Balance at December 31, | $ | 6.9 | $ | 5.4 | $ | 6.9 | |||||
56
Park-Ohio Industries, Inc. and Subsidiaries
Notes to Consolidated Financial Statements — (Continued)
NOTE 9 — Financing Arrangements
Long-term debt consists of the following:
Carrying Value at | |||||||||||||||
Issuance Date | Maturity Date | Interest Rate at December 31, 2014 | December 31, 2014 | December 31, 2013 | |||||||||||
(In millions) | |||||||||||||||
Senior Notes | April 1, 2011 | April 1, 2021 | 8.125 | % | $ | 250.0 | $ | 250.0 | |||||||
Revolving credit | — | July 31, 2019 | 1.69 | % | 162.0 | 111.0 | |||||||||
Term loan | — | July 31, 2019 | 2.25 | % | 28.8 | 18.7 | |||||||||
Other | Various | Various | Various | 3.0 | 3.9 | ||||||||||
Total debt | 443.8 | 383.6 | |||||||||||||
Less current maturities | 9.4 | 4.4 | |||||||||||||
Total long-term debt, net of current portion | $ | 434.4 | $ | 379.2 | |||||||||||
On April 7, 2011, the Company completed the sale of $250.0 million in the aggregate principal amount of the Notes. The Notes bear an interest rate of 8.125% per annum, payable semi-annually in arrears on April 1 and October 1 of each year. The Notes mature on April 1, 2021. The Company is a party to a credit and security agreement, dated November 5, 2003, as amended (the “Credit Agreement”), with a group of banks, under which it may borrow or issue standby letters of credit or commercial letters of credit.
On July 31, 2014, the Company entered into a sixth amendment and restatement of the credit agreement (the “Amended Credit Agreement”). The Amended Credit Agreement, among other things, increases the revolving credit facility to $230.0 million, provides a term loan for $16.1 million and extends the maturity date of the borrowings under the Amended Credit Agreement to July 31, 2019. The revolving credit facility includes a Canadian sub-limit of $15.0 million and a European sub-limit of $10.0 million (which may be increased to $25.0 million) for borrowings in those locations.
At the Company’s election, domestic amounts borrowed under the revolving credit facility may be borrowed at either:
•LIBOR plus 1.5% to 2.5%; or
•the bank’s prime lending rate minus 0.25% to 1.25%.
At the Company's election, amounts borrowed under the term loan may be borrowed at either:
•LIBOR plus 2.0% to 3.0%; or
•the bank’s prime lending rate minus 0.75% to plus 0.25%.
The LIBOR-based interest rate is dependent on the Company’s debt service coverage ratio, as defined in the Amended Credit Agreement.
Amounts borrowed under the Canadian revolving credit facility provided by the Amended Credit Agreement may be borrowed at either:
•the Canadian deposit offered rate plus 1.5% to 2.5%;
•the Canadian prime lending rate plus 0.0% to 1.0%; or
•the US base rate plus 0.0% to 1.0%.
Under the Amended Credit Agreement, a detailed borrowing base formula provides borrowing availability to the Company based on percentages of eligible accounts receivable and inventory. The term loan is amortized based on a seven-year
57
Park-Ohio Industries, Inc. and Subsidiaries
Notes to Consolidated Financial Statements — (Continued)
schedule with the balance due at maturity (July 31, 2019). The Amended Credit Agreement also reduced the commitment fee for the revolving credit facility. Additionally, the Company has the option, pursuant to the Amended Credit Agreement, to increase the availability under the revolving credit facility by $50.0 million.
The Amended Credit Agreement was further amended in accordance with Amendment No. 1 to the Amended Credit Agreement, dated October 24, 2014 (the “Amendment”). The Amendment:
• | increases the revolving credit facility from $230.0 million to $250.0 million; |
• | increases the inventory advance rate from 50% to 60%, reducing back to 50% on a pro-rata quarterly basis over 36 months commencing April 1, 2015; |
• | reloads the term loan up to $35.0 million from $15.5 million, of which $28.8 million has been borrowed and is outstanding as of December 31, 2014; |
• | increases the Canadian sub-limit up to $25.0 million from $15.0 million; |
• | increases the European sub-limit up to $25.0 million from $10.0 million; and |
• | provides minor pricing adjustments including pricing the first $22.0 million drawn on the revolver at LIBOR + 3.50%, reducing automatically on a pro-rata quarterly basis over 36 months commencing April 1, 2015. |
At December 31, 2014, in addition to amounts borrowed under the revolving credit facility, there was $20.5 million outstanding for standby letters of credit.
At December 31, 2014, the Company had approximately $55.4 million of unused borrowing capacity under the revolving credit facility.
The following table represents fair value information of the Notes, classified as Level 1, at December 31, 2014 and December 31, 2013. The fair value was estimated using quoted market prices.
December 31, 2014 | December 31, 2013 | ||||||
(In millions) | |||||||
Carrying amount | $ | 250.0 | $ | 250.0 | |||
Fair value | $ | 266.3 | $ | 275.6 | |||
Maturities of long-term debt during each of the five years subsequent to December 31, 2014 follow:
(In millions) | |||
2015 | $ | 9.4 | |
2016 | $ | 12.2 | |
2017 | $ | 12.1 | |
2018 | $ | 6.5 | |
2019 | $ | 153.6 | |
Foreign subsidiaries of the Company had no borrowings at December 31, 2014 and 2013 and outstanding bank guarantees of approximately $5.2 million and $7.2 million at December 31, 2014 and 2013, respectively, under their credit arrangements.
The Notes are general unsecured senior obligations of the Company and are fully and unconditionally guaranteed on a joint and several basis by all material 100% owned domestic subsidiaries of the Company. Provisions of the indenture governing the Notes and the Credit Agreement contain restrictions on the Company’s ability to incur additional indebtedness, to create liens or other encumbrances, to make certain payments, investments, loans and guarantees and to sell or otherwise dispose of a substantial portion of assets or to merge or consolidate with an unaffiliated entity. At December 31, 2014, the Company was in compliance with all financial covenants of the Credit Agreement.
58
Park-Ohio Industries, Inc. and Subsidiaries
Notes to Consolidated Financial Statements — (Continued)
The weighted average interest rate on all debt was 5.62% at December 31, 2014 and 6.10% at December 31, 2013.
NOTE 10 — Income Taxes
Income from continuing operations before income tax expense consists of the following:
Year Ended December 31, | |||||||||||
2014 | 2013 | 2012 | |||||||||
(In millions) | |||||||||||
United States | $ | 54.3 | $ | 49.3 | $ | 40.6 | |||||
Outside the United States | 18.5 | 11.7 | 15.3 | ||||||||
$ | 72.8 | $ | 61.0 | $ | 55.9 | ||||||
Income taxes consisted of the following:
Year Ended December 31, | |||||||||||
2014 | 2013 | 2012 | |||||||||
(In millions) | |||||||||||
Current expense: | |||||||||||
Federal | $ | 17.6 | $ | 16.0 | $ | 7.5 | |||||
State | 0.8 | 1.5 | 0.9 | ||||||||
Foreign | 6.2 | 4.2 | 4.4 | ||||||||
24.6 | 21.7 | 12.8 | |||||||||
Deferred expense (benefit): | |||||||||||
Federal | 1.1 | 1.4 | 7.9 | ||||||||
State | (0.8 | ) | (2.6 | ) | (0.2 | ) | |||||
Foreign | 0.3 | (0.9 | ) | 0.3 | |||||||
0.6 | (2.1 | ) | 8.0 | ||||||||
Income tax expense | $ | 25.2 | $ | 19.6 | $ | 20.8 | |||||
The reasons for the difference between income tax expense and the amount computed by applying the statutory federal income tax rate to income from continuing operations before income taxes for the years ended December 31, 2014, 2013 and 2012 are as follows:
Year Ended December 31, | |||||||||||
Rate Reconciliation | 2014 | 2013 | 2012 | ||||||||
(In millions) | |||||||||||
Tax at statutory rate | $ | 25.4 | $ | 21.3 | $ | 19.7 | |||||
Effect of state income taxes, net | 1.4 | 1.1 | 1.0 | ||||||||
Effect of foreign operations | (0.9 | ) | (0.2 | ) | (0.1 | ) | |||||
Valuation allowance | (1.1 | ) | (1.6 | ) | (0.2 | ) | |||||
Non-deductible items | 1.8 | 0.7 | 0.6 | ||||||||
Manufacturer's deduction | (1.4 | ) | (1.4 | ) | (0.6 | ) | |||||
Other, net | — | (0.3 | ) | 0.4 | |||||||
Total | $ | 25.2 | $ | 19.6 | $ | 20.8 | |||||
59
Park-Ohio Industries, Inc. and Subsidiaries
Notes to Consolidated Financial Statements — (Continued)
Significant components of the Company’s net deferred tax assets and liabilities are as follows:
Year Ended December 31, | |||||||
2014 | 2013 | ||||||
(In millions) | |||||||
Deferred tax assets: | |||||||
Postretirement benefit obligation | $ | 6.2 | $ | 5.9 | |||
Inventory | 13.7 | 13.2 | |||||
Net operating loss and credit carryforwards | 6.3 | 3.8 | |||||
Goodwill | 1.0 | 0.5 | |||||
Warranty reserve | 2.5 | 2.1 | |||||
Compensation | 6.0 | 4.3 | |||||
Other | 10.7 | 10.1 | |||||
Total deferred tax assets | 46.4 | 39.9 | |||||
Deferred tax liabilities: | |||||||
Depreciation and amortization | 13.2 | 11.7 | |||||
Pension | 23.3 | 26.4 | |||||
Goodwill | 2.7 | 2.7 | |||||
Intangible assets | 14.5 | 15.4 | |||||
Other | 1.4 | 1.8 | |||||
Total deferred tax liabilities | 55.1 | 58.0 | |||||
Net deferred tax liabilities prior to valuation allowances | (8.7 | ) | (18.1 | ) | |||
Valuation allowances | (7.1 | ) | (2.6 | ) | |||
Net deferred tax liability | $ | (15.8 | ) | $ | (20.7 | ) | |
At December 31, 2014, the Company has state and foreign net operating loss carryforwards for income tax purposes. The foreign net operating loss carryforward is $16.4 million, of which $1.9 million expires between 2015 and 2024 and the remainder has no expiration date. The Company also has a tax benefit from a state net operating loss carryforward of $2.9 million that expires between 2015 and 2033. The Company also has a foreign capital loss carryforward of $0.6 million that has no expiration date.
The Company is subject to taxation in the U.S. and various state and foreign jurisdictions. The Company’s tax years for 2011 through 2014 remain open for examination by the U.S. and various state and foreign taxing authorities.
As of December 31, 2014 and 2013, the Company was not in a cumulative three-year loss position and it was determined that it was more likely than not that its U.S. deferred tax assets will be realized. As of December 31, 2014, the Company reversed a valuation allowance of $1.3 million against its state net operating loss carryforward. As of December 31, 2014 and 2013, the Company recorded valuation allowances of $6.9 million and $1.2 million, respectively, against certain foreign net deferred tax assets. The ultimate realization of deferred tax assets is dependent upon the generation of future taxable income (including reversals of deferred tax liabilities). The Company reviews all valuation allowances related to deferred tax assets and will reverse these valuation allowances, partially or totally, when appropriate under ASC 740.
60
Park-Ohio Industries, Inc. and Subsidiaries
Notes to Consolidated Financial Statements — (Continued)
A reconciliation of the beginning and ending amount of unrecognized tax benefits is as follows:
2014 | 2013 | 2012 | |||||||||
(In millions) | |||||||||||
Unrecognized Tax Benefit — January 1, | $ | 5.9 | $ | 6.1 | $ | 6.0 | |||||
Gross Increases — Tax Positions in Prior Period | 0.8 | 0.4 | 0.1 | ||||||||
Gross Decreases — Tax Positions in Prior Period | (0.2 | ) | (0.6 | ) | — | ||||||
Gross Increases — Tax Positions in Current Period | — | — | 0.1 | ||||||||
Lapse of Statute of Limitations | — | — | (0.1 | ) | |||||||
Unrecognized Tax Benefit — December 31, | $ | 6.5 | $ | 5.9 | $ | 6.1 | |||||
The total amount of unrecognized tax benefits that, if recognized, would affect the effective tax rate is $5.4 million at December 31, 2014 and $4.7 million at December 31, 2013. The Company recognizes accrued interest and penalties related to unrecognized tax benefits in income tax expense. During the year ended December 31, 2014 and 2013, the Company recognized approximately $0.3 million and $0.7 million, respectively, in net interest and penalties. The Company had approximately $1.7 million and $1.4 million for the payment of interest and penalties accrued at December 31, 2014 and 2013, respectively. The Company does not expect that the unrecognized tax benefit will change significantly within the next twelve months.
Deferred taxes have not been provided on approximately $90.2 million of undistributed earnings of the Company’s foreign subsidiaries as it is the Company’s policy and intent to permanently reinvest such earnings. The Company has determined that it is not practicable to determine the unrecognized tax liability on such undistributed earnings.
NOTE 11 — Stock-Based Compensation
A summary of Holdings' stock option activity as of December 31, 2014 and changes during the year then ended is presented below:
2014 | ||||||||||||
Number of Shares | Weighted Average Exercise Price | Weighted Average Remaining Contractual Term | Aggregate Intrinsic Value | |||||||||
(In whole shares) | (In millions) | |||||||||||
Outstanding — beginning of year | 146,000 | $ | 16.71 | |||||||||
Granted | — | — | ||||||||||
Exercised | (2,500 | ) | 14.12 | |||||||||
Canceled or expired | — | — | ||||||||||
Outstanding — end of year | 143,500 | $ | 16.76 | 1.7 years | $ | 6.6 | ||||||
Options exercisable | 143,500 | $ | 16.76 | 1.7 years | $ | 6.6 | ||||||
Exercise prices for options outstanding as of December 31, 2014 range from $14.12 to $15.61 and $20.00 to $24.92. The number of options outstanding and exercisable at December 31, 2014, which correspond with these ranges, are 108,500 and 35,000, respectively.
The total intrinsic value of options exercised during the years ended December 31, 2014, 2013 and 2012 was $0.1 million, $1.1 million and $0.8 million, respectively. Net cash proceeds from the exercise of stock options were $0.0 million, $0.4 million and $0.5 million, respectively.
61
Park-Ohio Industries, Inc. and Subsidiaries
Notes to Consolidated Financial Statements — (Continued)
In 2012, Holdings awarded an employee the option to purchase up to an aggregate of $0.5 million of Holdings' common stock at its then-current market value at a 20% discount and recognized compensation expense of $0.1 million.
There were no stock options awarded in 2014, 2013 and 2012.
A summary of Holdings' restricted share and performance share activity for the year ended December 31, 2014 is as follows:
2014 | |||||||||||||
Time-Based | Performance-Based | ||||||||||||
Number of Shares | Weighted Average Grant Date Fair Value | Number of Shares | Weighted Average Grant Date Fair Value | ||||||||||
(In whole shares) | (In whole shares) | ||||||||||||
Outstanding — beginning of year | 422,898 | $ | 21.04 | 42,000 | $ | 20.30 | |||||||
Granted | 137,750 | 57.04 | — | — | |||||||||
Vested | (211,048 | ) | 23.71 | (14,000 | ) | 20.30 | |||||||
Canceled or expired | (4,668 | ) | 38.19 | — | — | ||||||||
Outstanding — end of year | 344,932 | $ | 33.55 | 28,000 | $ | 20.30 | |||||||
The Company recognized compensation expense of $5.8 million, $4.7 million and $2.7 million for the years ended December 31, 2014, 2013 and 2012, respectively, relating to restricted shares and performance shares.
The total fair value of restricted stock units vested during the years ended December 31, 2014, 2013 and 2012 was $11.5 million, $6.1 million and $4.6 million, respectively.
The Company recognizes compensation cost of all share-based awards as expense on a straight-line basis over the vesting period of the awards.
As of December 31, 2014, the Company had unrecognized compensation expense of $9.8 million, before taxes, related to stock option awards and restricted shares. The unrecognized compensation expense is expected to be recognized over a total weighted average period of 2.0 years.
The number of shares available for future grants for all Holdings' plans at December 31, 2014 is 120,871.
NOTE 12 — Commitments, Contingencies and Litigation Judgment
The Company is subject to various pending and threatened legal proceedings arising in the ordinary course of business. Although the Company cannot precisely predict the amount of any liability that may ultimately arise with respect to any of these matters, the Company records provisions when it considers the liability probable and reasonably estimable. Our provisions are based on historical experience and legal advice, reviewed quarterly and adjusted according to developments. Estimating probable losses requires the analysis of multiple forecasted factors that often depend on judgments about potential actions by third parties, such as regulators, courts, and state and federal legislatures. Changes in the amounts of our loss provisions, which can be material, affect our financial condition. Due to the inherent uncertainties in the process undertaken to estimate potential losses, we are unable to estimate an additional range of loss in excess of our accruals. While it is reasonably possible that such excess liabilities, if they were to occur, could be material to operating results in any given quarter or year of their recognition, we do not believe that it is reasonably possible that such excess liabilities would have a material adverse effect on our long-term results of operations, liquidity or consolidated financial position.
Our subsidiaries are involved in a number of contractual and warranty related disputes. At this time, we cannot reasonably determine the probability of a loss, and the timing and amount of loss, if any, cannot be reasonably estimated. We believe that
62
Park-Ohio Industries, Inc. and Subsidiaries
Notes to Consolidated Financial Statements — (Continued)
appropriate liabilities for these contingencies have been recorded; however, actual results may differ materially from our estimates.
IPSCO Tubulars Inc. d/b/a TMK IPSCO sued Ajax Tocco Magnethermic Corporation ("ATM"), a subsidiary of Park-Ohio Industries, Inc., in the United States District Court for the Eastern District of Arkansas claiming that equipment supplied by ATM for heat treating certain steel pipe at IPSCO’s Blytheville, Arkansas facility did not perform as required by the contract. The complaint alleged causes of action for breach of contract, gross negligence, and constructive fraud. IPSCO sought approximately $10 million in damages plus an unspecified amount of punitive damages. ATM denied the allegations. ATM subsequently obtained summary judgment on the constructive fraud claim, which was dismissed by the district court prior to trial. The remaining claims were the subject of a bench trial that occurred in May 2013. After IPSCO presented its case, the district court entered partial judgment in favor of ATM, dismissing the gross negligence claim, a portion of the breach of contract claim, and any claim for punitive damages. The trial proceeded with respect to the remainder of IPSCO’s claim for breach of contract. In September 2013, the district court issued a judgment in favor of IPSCO in the amount of $5.2 million. IPSCO subsequently filed a motion seeking to recover $3.8 million in attorneys’ fees and costs. The district court reserved ruling on that issue pending an appeal. In October 2013, ATM filed an appeal with the U.S. Court of Appeals for the Eighth Circuit seeking reversal of the judgment in favor of IPSCO. In November 2013, IPSCO filed a cross-appeal seeking reversal of the dismissal of its claims for gross negligence and punitive damages. The Eighth Circuit issued an opinion in March 2015 affirming in part, reversing in part, and remanding the case. It affirmed the district court's determination that ATM was liable for breach of contract. It also affirmed the district court's dismissal of IPSCO's claims for gross negligence and punitive damages. However, the Eighth Circuit reversed nearly all of the damages awarded by the district court and remanded for further findings on the issue of damages, including whether consequential damages are barred under the express language of the contract. Because IPSCO did not appeal the award of $5.2 million in its favor, those damages may be decreased, but cannot be increased, on remand. IPSCO's motion to recover attorneys' fees and costs is stayed pending the outcome of the proceedings on remand.
In August 2013, the Company received a subpoena from the staff of the SEC in connection with the staff’s investigation of a third party. At that time, the Company also learned that the Department of Justice (“DOJ”) is conducting a criminal investigation of the third party. In connection with its initial response to the staff’s subpoena, the Company disclosed to the staff of the SEC that, in November 2007, the third party participated in a payment on behalf of the Company to a foreign tax official that implicates the Foreign Corrupt Practices Act (“FCPA”).
The Board of Directors of the Company has formed a special committee to review the Company’s transactions with the third party and to make any recommendations to the Board of Directors with respect thereto.
The Company intends to cooperate fully with the SEC and the DOJ in connection with their investigations of the third party and with the SEC in light of the Company’s disclosure. The Company is unable to predict the outcome or impact of the special committee’s investigation or the length, scope or results of the SEC’s review or the impact on its results of operations.
Leases
Future minimum lease commitments during each of the five years following December 31, 2014 and thereafter are as follows:
(In millions) | |||
2015 | $ | 14.8 | |
2016 | $ | 12.7 | |
2017 | $ | 9.9 | |
2018 | $ | 6.1 | |
2019 | $ | 2.9 | |
Thereafter | $ | 2.3 | |
Rental expense for 2014, 2013 and 2012 was $18.6 million, $17.6 million and $15.8 million, respectively.
63
Park-Ohio Industries, Inc. and Subsidiaries
Notes to Consolidated Financial Statements — (Continued)
Certain of the Company’s leases are with related parties at an annual rental expense of approximately $2.3 million. Transactions with related parties are in the ordinary course of business and are not material to the Company’s financial position, results of operations or cash flows.
During the years ended December 31, 2013 and 2012, we entered into sales leaseback transactions for certain equipment. No gains or losses resulted from these transactions and the leases are being accounted for as operating leases.
NOTE 13 — Pensions and Postretirement Benefits
The Company and its subsidiaries have pension plans, principally noncontributory defined benefit or noncontributory defined contribution plans, covering substantially all employees. In addition, the Company has an unfunded postretirement benefit plan. In April 2011, the Company amended one of its plans to cover most U.S. employees not covered by collective bargaining agreements using a cash balance formula, which increased the 2011 benefit obligation by approximately $1.1 million. Under a cash balance formula, a plan participant accumulates a retirement benefit consisting of pay credits that are based upon a percentage of current eligible earnings and current interest credits. For the remaining defined benefit plans, benefits are based on the employee’s years of service. For the defined contribution plans, the costs charged to operations and the amount funded are based upon a percentage of the covered employees’ compensation.
The following tables set forth the change in benefit obligation, plan assets, funded status and amounts recognized in the consolidated balance sheet for the defined benefit pension and postretirement benefit plans as of December 31, 2014 and 2013:
Pension Benefits | Postretirement Benefits | ||||||||||||||
2014 | 2013 | 2014 | 2013 | ||||||||||||
(In millions) | |||||||||||||||
Change in benefit obligation | |||||||||||||||
Benefit obligation at beginning of year | $ | 52.1 | $ | 56.4 | $ | 16.2 | $ | 18.5 | |||||||
Service cost | 2.2 | 2.6 | — | 0.1 | |||||||||||
Interest cost | 2.2 | 2.0 | 0.6 | 0.6 | |||||||||||
Actuarial (gains) losses | 8.8 | (4.4 | ) | 1.9 | (1.3 | ) | |||||||||
Plan amendment | 0.4 | — | — | — | |||||||||||
Benefits and expenses paid, net of contributions | (4.6 | ) | (4.5 | ) | (1.7 | ) | (1.7 | ) | |||||||
Benefit obligation at end of year | $ | 61.1 | $ | 52.1 | $ | 17.0 | $ | 16.2 | |||||||
Change in plan assets | |||||||||||||||
Fair value of plan assets at beginning of year | $ | 125.4 | $ | 109.4 | $ | — | $ | — | |||||||
Actual return on plan assets | 5.8 | 21.8 | — | — | |||||||||||
Company contributions | — | — | 1.7 | 1.7 | |||||||||||
Cash transfer to fund postretirement benefit payments | (0.9 | ) | (1.3 | ) | — | — | |||||||||
Benefits and expenses paid, net of contributions | (4.6 | ) | (4.5 | ) | (1.7 | ) | (1.7 | ) | |||||||
Fair value of plan assets at end of year | $ | 125.7 | $ | 125.4 | $ | — | $ | — | |||||||
Funded (underfunded) status of the plans | $ | 64.6 | $ | 73.3 | $ | (17.0 | ) | $ | (16.2 | ) | |||||
64
Park-Ohio Industries, Inc. and Subsidiaries
Notes to Consolidated Financial Statements — (Continued)
Amounts recognized in the consolidated balance sheets consist of:
Pension Benefits | Postretirement Benefits | ||||||||||||||
2014 | 2013 | 2014 | 2013 | ||||||||||||
(In millions) | |||||||||||||||
Noncurrent assets | $ | 64.6 | $ | 73.3 | $ | — | $ | — | |||||||
Noncurrent liabilities | — | — | 15.4 | 14.5 | |||||||||||
Current liabilities | — | — | 1.6 | 1.7 | |||||||||||
$ | 64.6 | $ | 73.3 | $ | 17.0 | $ | 16.2 | ||||||||
Amounts recognized in accumulated other comprehensive loss | |||||||||||||||
Net actuarial loss | $ | 15.3 | $ | 2.1 | $ | 7.6 | $ | 6.3 | |||||||
Net prior service cost (credit) | 0.4 | 0.1 | (0.4 | ) | (0.5 | ) | |||||||||
Accumulated other comprehensive loss | $ | 15.7 | $ | 2.2 | $ | 7.2 | $ | 5.8 | |||||||
As of December 31, 2014 and 2013, the Company’s defined benefit pension plans did not hold a material amount of shares of Holdings' common stock.
The pension plan weighted-average asset allocation at December 31, 2014 and 2013 and target allocation for 2015 are as follows:
Plan Assets | ||||||||
Target 2015 | 2014 | 2013 | ||||||
Asset Category | ||||||||
Equity securities | 45-75% | 64.6 | % | 67.2 | % | |||
Debt securities | 10-40 | 27.9 | % | 25.4 | % | |||
Other | 0-20 | 7.5 | % | 7.4 | % | |||
100 | % | 100 | % | 100 | % | |||
The following table sets forth, by level within the fair value hierarchy, the pension plans assets:
2014 | 2013 | ||||||||||||||||||||||||||||||
Level 1 | Level 2 | Level 3 | Total | Level 1 | Level 2 | Level 3 | Total | ||||||||||||||||||||||||
(In millions) | |||||||||||||||||||||||||||||||
Collective trust and pooled insurance funds: | |||||||||||||||||||||||||||||||
Common stock | $ | 45.6 | $ | 2.2 | $ | — | $ | 47.8 | $ | 48.3 | $ | 2.5 | $ | — | $ | 50.8 | |||||||||||||||
Equity Funds | 26.9 | — | — | 26.9 | 26.9 | — | — | 26.9 | |||||||||||||||||||||||
Foreign Stock | 5.4 | — | — | 5.4 | 5.6 | — | — | 5.6 | |||||||||||||||||||||||
U.S. Government obligations | 7.0 | — | — | 7.0 | 5.1 | — | — | 5.1 | |||||||||||||||||||||||
Fixed income funds | 19.6 | — | — | 19.6 | 18.8 | — | — | 18.8 | |||||||||||||||||||||||
Balanced funds | 2.1 | — | — | 2.1 | 2.1 | — | — | 2.1 | |||||||||||||||||||||||
Corporate Bonds | 7.5 | — | — | 7.5 | 6.8 | — | — | 6.8 | |||||||||||||||||||||||
Cash and Cash Equivalents | 1.8 | — | — | 1.8 | 2.0 | — | — | 2.0 | |||||||||||||||||||||||
Hedge funds | — | — | 7.6 | 7.6 | — | — | 7.3 | 7.3 | |||||||||||||||||||||||
$ | 115.9 | $ | 2.2 | $ | 7.6 | $ | 125.7 | $ | 115.6 | $ | 2.5 | $ | 7.3 | $ | 125.4 | ||||||||||||||||
65
Park-Ohio Industries, Inc. and Subsidiaries
Notes to Consolidated Financial Statements — (Continued)
The following table presents a reconciliation of Level 3 assets, as defined in Note 1, held during the years ended December 31, 2014 and 2013.
Balance at Beginning of Year | Net Unrealized Gain | Purchases | Balance at End of Year | ||||||||||||
(In millions) | |||||||||||||||
Hedge Funds: | |||||||||||||||
2014 | $ | 7.3 | $ | 0.3 | $ | — | $ | 7.6 | |||||||
2013 | $ | 6.4 | $ | 0.9 | $ | — | $ | 7.3 | |||||||
The following tables summarize the assumptions used in the valuation of pension and postretirement benefit obligations at December 31, and to measure the net periodic benefit cost in the following year.
Weighted-Average assumptions as of December 31, | |||||||||||||||||
Pension Benefits | Postretirement Benefits | ||||||||||||||||
2014 | 2013 | 2012 | 2014 | 2013 | 2012 | ||||||||||||
Discount rate | 3.82 | % | 4.51 | % | 3.66 | % | 3.60 | % | 4.21 | % | 3.35 | % | |||||
Expected return on plan assets | 8.25 | % | 8.25 | % | 8.25 | % | N/A | N/A | N/A | ||||||||
Rate of compensation increase | 3.00 | % | 2.00 | % | 2.00 | % | N/A | N/A | N/A | ||||||||
Medical health care benefits rate increase | N/A | N/A | N/A | 7.00 | % | 6.50 | % | 7.00 | % | ||||||||
Medical drug benefits rate increase | N/A | N/A | N/A | 7.00 | % | 6.50 | % | 7.25 | % | ||||||||
Ultimate health care cost trend rate | N/A | N/A | N/A | 5.00 | % | 5.00 | % | 5.00 | % | ||||||||
Year of ultimate trend rate | N/A | N/A | N/A | 2022 | 2042 | 2042 | |||||||||||
In determining its expected return on plan assets assumption for the year ended December 31, 2014, the Company considered historical experience, its asset allocation, expected future long-term rates of return for each major asset class, and an assumed long-term inflation rate. Based on these factors, the Company derived an expected return on plan assets for the year ended December 31, 2014 of 8.25%. This assumption was supported by the asset return generation model, which projected future asset returns using simulation and asset class correlation.
Pension Benefits | Postretirement Benefits | ||||||||||||||||||||||
2014 | 2013 | 2012 | 2014 | 2013 | 2012 | ||||||||||||||||||
(In millions) | |||||||||||||||||||||||
Components of net periodic benefit cost | |||||||||||||||||||||||
Service costs | $ | 2.2 | $ | 2.6 | $ | 2.2 | $ | — | $ | 0.1 | $ | — | |||||||||||
Interest costs | 2.2 | 2.0 | 2.2 | 0.6 | 0.6 | 0.8 | |||||||||||||||||
Expected return on plan assets | (10.1 | ) | (8.9 | ) | (8.2 | ) | — | — | — | ||||||||||||||
Amortization of prior service cost (credit) | 0.1 | — | — | (0.1 | ) | (0.1 | ) | (0.1 | ) | ||||||||||||||
Recognized net actuarial loss | — | 0.8 | 0.9 | 0.5 | 0.7 | 0.7 | |||||||||||||||||
Benefit (income) costs | $ | (5.6 | ) | $ | (3.5 | ) | $ | (2.9 | ) | $ | 1.0 | $ | 1.3 | $ | 1.4 | ||||||||
Other changes in plan assets and benefit obligations recognized in accumulated other comprehensive (income) loss | |||||||||||||||||||||||
AOCI at beginning of year | $ | 2.2 | $ | 20.3 | $ | 22.4 | $ | 5.8 | $ | 7.6 | $ | 7.1 | |||||||||||
Net (gain) loss arising during the year | 13.1 | (17.3 | ) | (1.2 | ) | 1.8 | (1.2 | ) | 1.1 | ||||||||||||||
Recognition of prior service credit | — | — | — | 0.1 | 0.1 | 0.1 | |||||||||||||||||
Recognition of actuarial loss | 0.4 | (0.8 | ) | (0.9 | ) | (0.5 | ) | (0.7 | ) | (0.7 | ) | ||||||||||||
Total recognized in accumulated other comprehensive loss at end of year | $ | 15.7 | $ | 2.2 | $ | 20.3 | $ | 7.2 | $ | 5.8 | $ | 7.6 | |||||||||||
66
Park-Ohio Industries, Inc. and Subsidiaries
Notes to Consolidated Financial Statements — (Continued)
The estimated net loss, prior service cost and net transition obligation for the defined benefit pension plans that will be amortized from accumulated other comprehensive income into net periodic benefit cost over the year ending December 31, 2015 are immaterial.
The estimated net loss and prior service cost for the postretirement plans that will be amortized from accumulated other comprehensive income into net periodic benefit cost over the year ending December 31, 2015 is $0.2 million and $0.6 million, respectively.
Below is a table summarizing the Company’s expected future benefit payments and the expected payments due to Medicare subsidy over the next ten years:
Postretirement Benefits | |||||||||||||||
Pension Benefits | Gross | Expected Medicare Subsidy | Net including Medicare Subsidy | ||||||||||||
(In millions) | |||||||||||||||
2015 | $ | 4.3 | $ | 1.7 | $ | 0.1 | $ | 1.6 | |||||||
2016 | 4.2 | 1.6 | 0.1 | 1.5 | |||||||||||
2017 | 4.3 | 1.6 | 0.1 | 1.5 | |||||||||||
2018 | 4.3 | 1.5 | 0.1 | 1.4 | |||||||||||
2019 | 4.3 | 1.4 | 0.1 | 1.3 | |||||||||||
2020 to 2024 | 23.1 | 6.0 | 0.5 | 5.5 | |||||||||||
The Company has a postretirement benefit plan. Under the plan, health care benefits are provided on both a contributory and noncontributory basis. The assumed health care cost trend rate has a significant effect on the amounts reported. A one-percentage-point change in the assumed health care cost trend rate would have the following effects:
1-Percentage Point Increase | 1-Percentage Point Decrease | ||||||
(In millions) | |||||||
Effect on total of service and interest cost components in 2014 | $ | 0.1 | $ | — | |||
Effect on postretirement benefit obligation as of December 31, 2014 | $ | 1.5 | $ | (1.3 | ) | ||
The Company expects to have no contributions to its defined benefit plans in 2015.
In January 2008, a Supplemental Executive Retirement Plan (“SERP”) for the Company’s Chairman of the Board of Directors and Chief Executive Officer (“CEO”) was approved by the Compensation Committee of the Board of Directors of the Company. The SERP provides an annual supplemental retirement benefit for up to $0.4 million upon the CEO’s termination of employment with the Company. The vested retirement benefit will be equal to a percentage of the Supplemental Pension that is equal to the ratio of the sum of his credited service with the Company prior to January 1, 2008 (up to a maximum of thirteen years), and his credited service on or after January 1, 2008 (up to a maximum of seven years) to twenty years of credited service. In the event of a change in control before the CEO’s termination of employment, he will receive 100% of the Supplemental Pension. The Company recorded an expense of $0.5 million in 2014, 2013 and 2012 related to the SERP. Additionally, a non-qualified defined contribution retirement benefit was also approved in which the Company will credit $0.1 million quarterly ($0.4 million annually) for a seven-year period to an account in which the CEO will always be 100% vested. The seven-year period began on March 31, 2008.
67
Park-Ohio Industries, Inc. and Subsidiaries
Notes to Consolidated Financial Statements — (Continued)
NOTE 14 — Accumulated Other Comprehensive Income (Loss)
The components of and changes in accumulated other comprehensive income (loss) for the years ended December 31, 2014, 2013, and 2012 were as follows:
Cumulative Translation Adjustment | Pension and Postretirement Benefits | Total | |||||||||
(In millions) | |||||||||||
Balance at January 1, 2012 | $ | 4.7 | $ | (13.2 | ) | $ | (8.5 | ) | |||
Foreign currency translation adjustments (a) | 0.6 | — | 0.6 | ||||||||
Recognition of actuarial gain, net (b) | — | 1.6 | 1.6 | ||||||||
Tax adjustment (c) | — | (0.6 | ) | (0.6 | ) | ||||||
Recognition of actuarial gain, net | — | 1.0 | 1.0 | ||||||||
Balance at December 31, 2012 | 5.3 | (12.2 | ) | (6.9 | ) | ||||||
Foreign currency translation adjustments (a) | (2.5 | ) | — | (2.5 | ) | ||||||
Recognition of actuarial gain, net (b) | — | 19.9 | 19.9 | ||||||||
Tax adjustment (c) | — | (7.1 | ) | (7.1 | ) | ||||||
Recognition of actuarial gain, net | — | 12.8 | 12.8 | ||||||||
Balance at December 31, 2013 | 2.8 | 0.6 | 3.4 | ||||||||
Foreign currency translation adjustments (a) | (7.9 | ) | — | (7.9 | ) | ||||||
Recognition of actuarial gain, net (b) | — | (14.9 | ) | (14.9 | ) | ||||||
Tax adjustment (c) | — | 5.4 | 5.4 | ||||||||
Recognition of actuarial gain, net | — | (9.5 | ) | (9.5 | ) | ||||||
Balance at December 31, 2014 | $ | (5.1 | ) | $ | (8.9 | ) | $ | (14.0 | ) | ||
(a) | No income taxes are provided on foreign currency translation adjustments as foreign earnings are considered permanently invested. |
(b) | The recognition of actuarial gains are reclassified out of accumulated other comprehensive income and included in the computation of net periodic benefit cost in selling, general and administrative expenses. |
(c) | The tax adjustments are reclassified out of accumulated other comprehensive income and included in income tax expense. |
68
Park-Ohio Industries, Inc. and Subsidiaries
Notes to Consolidated Financial Statements — (Continued)
NOTE 15 — Subsequent Events
On February 9, 2015, Holdings' Board of Directors declared a quarterly dividend of $0.125 per common share. The dividend was paid on March 6, 2015, to shareholders of record as of the close of business on February 23, 2015 and resulted in a cash outlay of approximately $1.6 million.
On March 12, 2015, the Company amended its Credit Agreement to increase the revolving credit facility from $250.0 million to $275.0 million.
NOTE 16 — Supplemental Guarantor Information
Each of the material domestic direct and indirect wholly-owned subsidiaries of the Company (the “Guarantor Subsidiaries”) has fully and unconditionally guaranteed, on a joint and several basis, to pay principal, premium, and interest with respect to the Notes. Each of the Guarantor Subsidiaries is “100% owned,” as defined by Rule 3-10(h)(1) of Regulation S-X.
The guarantee of a Guarantor Subsidiary will automatically terminate, and the obligations of such Guarantor Subsidiary under its guarantee of Notes will be released:
(a) in the event of any sale or other disposition of all or substantially all of the assets or all of the capital stock of any Subsidiary Guarantor, by way of merger, consolidation or otherwise;
(b) upon designation of any Subsidiary Guarantor as an “unrestricted subsidiary” (as defined in the indenture governing the Notes (the “Indenture”));
(c) upon defeasance or satisfaction and discharge of the Indenture; and
(d) upon the release of such Subsidiary Guarantor's guarantees under all credit facilities of the Company (other than a release as a result of payment under or a discharge of such guarantee).
Effective in the third quarter of 2013, Southwest Steel Processing (“SSP”) was released from its guarantee of the Notes in conjunction with its designation as an "Unrestricted Subsidiary" under the Indenture and the sale of 25% of its business. During the third quarter of 2013, all the outstanding equity interests of a non-core business unit in the Supply Technologies segment was sold and released as a guarantor of the Notes under customary conditions. As a result of the aforementioned releases from the guarantee of the Notes, all periods presented have been restated to reflect SSP and the disposed Supply Technologies business unit as non-guarantor subsidiaries.
The following supplemental condensed consolidating financial statements present condensed consolidating balance sheets as of December 31, 2014 and December 31, 2013, condensed consolidating statements of income for the years ended December 31, 2014, 2013 and 2012, condensed consolidating statements of cash flows for the years ended December 31, 2014, 2013 and 2012, and reclassification and elimination entries necessary to consolidate the Parent and all of its subsidiaries. The “Parent” reflected in the accompanying supplemental guarantor information is Park-Ohio Industries, Inc.
69
Park-Ohio Industries, Inc. and Subsidiaries
Notes to Consolidated Financial Statements — (Continued)
Park-Ohio Industries, Inc. and Subsidiaries
Condensed Consolidating Balance Sheet
December 31, 2014 | |||||||||||||||||||
Parent | Combined Guarantor Subsidiaries | Combined Non-Guarantor Subsidiaries | Reclassifications/ Eliminations | Consolidated | |||||||||||||||
(In millions) | |||||||||||||||||||
ASSETS | |||||||||||||||||||
Current assets: | |||||||||||||||||||
Cash and cash equivalents | $ | — | $ | 3.8 | $ | 44.5 | $ | — | $ | 48.3 | |||||||||
Accounts receivable, net | — | 148.3 | 59.7 | — | 208.0 | ||||||||||||||
Inventories, net | — | 176.2 | 62.2 | — | 238.4 | ||||||||||||||
Deferred tax assets | — | 27.4 | 0.7 | — | 28.1 | ||||||||||||||
Unbilled contract revenue | — | 18.1 | 8.7 | — | 26.8 | ||||||||||||||
Other current assets | 1.6 | 14.9 | 6.0 | — | 22.5 | ||||||||||||||
Total current assets | 1.6 | 388.7 | 181.8 | — | 572.1 | ||||||||||||||
Investment in subsidiaries | 451.8 | 162.6 | — | (614.4 | ) | — | |||||||||||||
Intercompany advances | 249.5 | 86.0 | 161.2 | (496.7 | ) | — | |||||||||||||
Net property, plant and equipment | 7.1 | 101.2 | 32.7 | — | 141.0 | ||||||||||||||
Goodwill | — | 56.6 | 32.9 | — | 89.5 | ||||||||||||||
Intangible assets, net | — | 74.6 | 13.5 | — | 88.1 | ||||||||||||||
Other long-term assets | 68.0 | 1.8 | 3.4 | — | 73.2 | ||||||||||||||
Total assets | $ | 778.0 | $ | 871.5 | $ | 425.5 | $ | (1,111.1 | ) | $ | 963.9 | ||||||||
LIABILITIES AND SHAREHOLDER'S EQUITY | |||||||||||||||||||
Current liabilities: | |||||||||||||||||||
Trade accounts payable | $ | 2.2 | $ | 120.4 | $ | 39.5 | $ | — | $ | 162.1 | |||||||||
Payable to affiliates | — | — | 1.8 | — | 1.8 | ||||||||||||||
Accrued expenses and other | 18.0 | 52.1 | 33.6 | — | 103.7 | ||||||||||||||
Total current liabilities | 20.2 | 172.5 | 74.9 | — | 267.6 | ||||||||||||||
Long-term liabilities, less current portion: | |||||||||||||||||||
Debt | 432.2 | 2.0 | 0.2 | — | 434.4 | ||||||||||||||
Deferred tax liabilities | — | 41.6 | 2.3 | — | 43.9 | ||||||||||||||
Other postretirement benefits and other long-term liabilities | 25.1 | 9.0 | 6.0 | — | 40.1 | ||||||||||||||
Total long-term liabilities | 457.3 | 52.6 | 8.5 | — | 518.4 | ||||||||||||||
Intercompany advances | 122.6 | 214.2 | 159.9 | (496.7 | ) | — | |||||||||||||
Total Park-Ohio Industries, Inc. and Subsidiaries shareholder's equity | 171.6 | 432.2 | 175.9 | (608.1 | ) | 171.6 | |||||||||||||
Noncontrolling interest | 6.3 | — | 6.3 | (6.3 | ) | 6.3 | |||||||||||||
Total shareholder's equity | 177.9 | 432.2 | 182.2 | (614.4 | ) | 177.9 | |||||||||||||
Total liabilities and shareholder’s equity | $ | 778.0 | $ | 871.5 | $ | 425.5 | $ | (1,111.1 | ) | $ | 963.9 | ||||||||
70
Park-Ohio Industries, Inc. and Subsidiaries
Notes to Consolidated Financial Statements — (Continued)
Park-Ohio Industries, Inc. and Subsidiaries
Condensed Consolidating Balance Sheet
December 31, 2013 | |||||||||||||||||||
Parent | Combined Guarantor Subsidiaries | Combined Non-Guarantor Subsidiaries | Reclassifications/ Eliminations | Consolidated | |||||||||||||||
(In millions) | |||||||||||||||||||
ASSETS | |||||||||||||||||||
Current assets: | |||||||||||||||||||
Cash and cash equivalents | $ | — | $ | 0.7 | $ | 43.0 | $ | — | $ | 43.7 | |||||||||
Accounts receivable, net | — | 124.0 | 41.6 | — | 165.6 | ||||||||||||||
Inventories, net | — | 175.5 | 45.9 | — | 221.4 | ||||||||||||||
Deferred tax assets | — | 23.3 | 1.3 | — | 24.6 | ||||||||||||||
Unbilled contract revenue | — | 8.5 | 0.2 | — | 8.7 | ||||||||||||||
Other current assets | 0.7 | 16.1 | 5.1 | — | 21.9 | ||||||||||||||
Total current assets | 0.7 | 348.1 | 137.1 | — | 485.9 | ||||||||||||||
Investment in subsidiaries | 403.8 | 149.8 | — | (553.6 | ) | — | |||||||||||||
Intercompany advances | 158.1 | 12.0 | 143.0 | (313.1 | ) | — | |||||||||||||
Net property, plant and equipment | 5.8 | 93.3 | 15.4 | — | 114.5 | ||||||||||||||
Goodwill | — | 51.3 | 9.1 | — | 60.4 | ||||||||||||||
Intangible assets, net | — | 52.3 | 13.9 | — | 66.2 | ||||||||||||||
Other long-term assets | 77.1 | 2.7 | 0.6 | — | 80.4 | ||||||||||||||
Total assets | $ | 645.5 | $ | 709.5 | $ | 319.1 | $ | (866.7 | ) | $ | 807.4 | ||||||||
LIABILITIES AND SHAREHOLDER'S EQUITY | |||||||||||||||||||
Current liabilities: | |||||||||||||||||||
Trade accounts payable | $ | 1.3 | $ | 89.6 | $ | 22.0 | $ | — | $ | 112.9 | |||||||||
Payable to affiliates | — | — | 1.6 | — | 1.6 | ||||||||||||||
Accrued expenses and other | 14.2 | 48.5 | 22.9 | — | 85.6 | ||||||||||||||
Total current liabilities | 15.5 | 138.1 | 46.5 | — | 200.1 | ||||||||||||||
Long-term liabilities, less current portion: | |||||||||||||||||||
Debt | 376.2 | 2.6 | 0.4 | — | 379.2 | ||||||||||||||
Deferred tax liabilities | — | 42.8 | 2.5 | — | 45.3 | ||||||||||||||
Other postretirement benefits and other long-term liabilities | 23.6 | 7.6 | 1.0 | — | 32.2 | ||||||||||||||
Total long-term liabilities | 399.8 | 53.0 | 3.9 | — | 456.7 | ||||||||||||||
Intercompany advances | 79.6 | 129.3 | 104.2 | (313.1 | ) | — | |||||||||||||
Total Park-Ohio Industries, Inc. and Subsidiaries shareholder's equity | 145.6 | 389.1 | 159.5 | (548.6 | ) | 145.6 | |||||||||||||
Noncontrolling interest | 5.0 | — | 5.0 | (5.0 | ) | 5.0 | |||||||||||||
Total shareholder's equity | 150.6 | 389.1 | 164.5 | (553.6 | ) | 150.6 | |||||||||||||
Total liabilities and shareholder’s equity | $ | 645.5 | $ | 709.5 | $ | 319.1 | $ | (866.7 | ) | $ | 807.4 | ||||||||
71
Park-Ohio Industries, Inc. and Subsidiaries
Notes to Consolidated Financial Statements — (Continued)
Park-Ohio Industries, Inc. and Subsidiaries
Condensed Consolidating Statement of Income
Year Ended December 31, 2014 | |||||||||||||||||||
Parent | Combined Guarantor Subsidiaries | Combined Non-Guarantor Subsidiaries | Eliminations | Consolidated | |||||||||||||||
(In millions) | |||||||||||||||||||
Net sales | $ | — | $ | 1,103.0 | $ | 275.7 | $ | — | $ | 1,378.7 | |||||||||
Cost of sales | — | 928.7 | 215.5 | — | 1,144.2 | ||||||||||||||
Gross profit | — | 174.3 | 60.2 | — | 234.5 | ||||||||||||||
Selling, general and administrative expenses | 26.2 | 74.7 | 34.7 | — | 135.6 | ||||||||||||||
Income (loss) from subsidiaries | 99.5 | 15.5 | — | (115.0 | ) | — | |||||||||||||
Operating income (loss) | 73.3 | 115.1 | 25.5 | (115.0 | ) | 98.9 | |||||||||||||
Interest expense | 25.7 | — | 0.4 | — | 26.1 | ||||||||||||||
Income (loss) from continuing operations before income taxes | 47.6 | 115.1 | 25.1 | (115.0 | ) | 72.8 | |||||||||||||
Income tax expense | — | 17.4 | 7.8 | — | 25.2 | ||||||||||||||
Net income (loss) from continuing operations | 47.6 | 97.7 | 17.3 | (115.0 | ) | 47.6 | |||||||||||||
Net income (loss) | 47.6 | 97.7 | 17.3 | (115.0 | ) | 47.6 | |||||||||||||
Net (income) loss attributable to noncontrolling interest | (1.3 | ) | — | (1.3 | ) | 1.3 | (1.3 | ) | |||||||||||
Net income (loss) attributable to ParkOhio common shareholder | $ | 46.3 | $ | 97.7 | $ | 16.0 | $ | (113.7 | ) | $ | 46.3 | ||||||||
Other comprehensive income (loss) (see note 14): | |||||||||||||||||||
Foreign currency translation adjustments | $ | (7.9 | ) | $ | — | $ | (7.9 | ) | $ | 7.9 | $ | (7.9 | ) | ||||||
Recognition of actuarial loss (gain), net of tax | (9.5 | ) | (9.5 | ) | — | 9.5 | (9.5 | ) | |||||||||||
Comprehensive income (loss), net of tax | 30.2 | 88.2 | 9.4 | (97.6 | ) | 30.2 | |||||||||||||
Comprehensive (income) loss attributable to noncontrolling interest | (1.3 | ) | — | (1.3 | ) | 1.3 | (1.3 | ) | |||||||||||
Comprehensive income (loss) attributable to ParkOhio common shareholder | $ | 28.9 | $ | 88.2 | $ | 8.1 | $ | (96.3 | ) | $ | 28.9 | ||||||||
72
Park-Ohio Industries, Inc. and Subsidiaries
Notes to Consolidated Financial Statements — (Continued)
Park-Ohio Industries, Inc. and Subsidiaries
Condensed Consolidating Statement of Income
Year Ended December 31, 2013 | |||||||||||||||||||
Parent | Combined Guarantor Subsidiaries | Combined Non-Guarantor Subsidiaries | Eliminations | Consolidated | |||||||||||||||
(In millions) | |||||||||||||||||||
Net sales | $ | — | $ | 989.0 | $ | 214.2 | $ | — | $ | 1,203.2 | |||||||||
Cost of sales | — | 819.7 | 172.5 | — | 992.2 | ||||||||||||||
Gross profit | — | 169.3 | 41.7 | — | 211.0 | ||||||||||||||
Selling, general and administrative expenses | 20.9 | 72.7 | 25.9 | — | 119.5 | ||||||||||||||
Litigation judgment and settlement costs | — | 5.2 | — | — | 5.2 | ||||||||||||||
Income (loss) from subsidiaries | 88.2 | 9.4 | — | (97.6 | ) | — | |||||||||||||
Operating income (loss) | 67.3 | 100.8 | 15.8 | (97.6 | ) | 86.3 | |||||||||||||
Gain on acquisition of business | — | (0.6 | ) | — | — | (0.6 | ) | ||||||||||||
Interest expense | 25.9 | 0.1 | (0.1 | ) | — | 25.9 | |||||||||||||
Income (loss) from continuing operations before income taxes | 41.4 | 101.3 | 15.9 | (97.6 | ) | 61.0 | |||||||||||||
Income tax expense | — | 16.3 | 3.3 | — | 19.6 | ||||||||||||||
Net income (loss) from continuing operations | 41.4 | 85.0 | 12.6 | (97.6 | ) | 41.4 | |||||||||||||
Income (loss) from discontinued operations, net of taxes | 3.0 | — | 3.0 | (3.0 | ) | 3.0 | |||||||||||||
Net income (loss) | 44.4 | 85.0 | 15.6 | (100.6 | ) | 44.4 | |||||||||||||
Net income attributable to noncontrolling interest | (0.5 | ) | — | (0.5 | ) | 0.5 | (0.5 | ) | |||||||||||
Net income (loss) attributable to ParkOhio common shareholder | $ | 43.9 | $ | 85.0 | $ | 15.1 | $ | (100.1 | ) | $ | 43.9 | ||||||||
Other comprehensive income (loss) (see note 14): | |||||||||||||||||||
Foreign currency translation adjustments | $ | (2.5 | ) | $ | — | $ | (2.5 | ) | $ | 2.5 | $ | (2.5 | ) | ||||||
Recognition of actuarial loss (gain), net of tax | 12.8 | 12.8 | — | (12.8 | ) | 12.8 | |||||||||||||
Comprehensive income (loss), net of tax | 54.7 | 97.8 | 13.1 | (110.9 | ) | 54.7 | |||||||||||||
Comprehensive income attributable to noncontrolling interest | (0.5 | ) | — | (0.5 | ) | 0.5 | (0.5 | ) | |||||||||||
Comprehensive income (loss) attributable to ParkOhio common shareholder | $ | 54.2 | $ | 97.8 | $ | 12.6 | $ | (110.4 | ) | $ | 54.2 | ||||||||
73
Park-Ohio Industries, Inc. and Subsidiaries
Notes to Consolidated Financial Statements — (Continued)
Park-Ohio Industries, Inc. and Subsidiaries
Condensed Consolidating Statement of Income
Year Ended December 31, 2012 | |||||||||||||||||||
Parent | Combined Guarantor Subsidiaries | Combined Non-Guarantor Subsidiaries | Eliminations | Consolidated | |||||||||||||||
(In millions) | |||||||||||||||||||
Net sales | $ | — | $ | 934.7 | $ | 193.5 | $ | — | $ | 1,128.2 | |||||||||
Cost of sales | — | 773.5 | 147.4 | — | 920.9 | ||||||||||||||
Gross profit | — | 161.2 | 46.1 | — | 207.3 | ||||||||||||||
Selling, general and administrative expenses | 16.9 | 73.8 | 21.7 | — | 112.4 | ||||||||||||||
Litigation judgment and settlement costs | — | 13.0 | — | — | 13.0 | ||||||||||||||
Income (loss) from subsidiaries | 77.8 | 15.0 | — | (92.8 | ) | — | |||||||||||||
Operating income (loss) | 60.9 | 89.4 | 24.4 | (92.8 | ) | 81.9 | |||||||||||||
Interest expense | 25.8 | — | 0.2 | — | 26.0 | ||||||||||||||
Income (loss) from continuing operations before income taxes | 35.1 | 89.4 | 24.2 | (92.8 | ) | 55.9 | |||||||||||||
Income tax expense (benefit) | — | 15.1 | 5.7 | — | 20.8 | ||||||||||||||
Net income (loss) from continuing operations | 35.1 | 74.3 | 18.5 | (92.8 | ) | 35.1 | |||||||||||||
Income (loss) from discontinued operations, net of taxes | (2.4 | ) | — | (2.4 | ) | 2.4 | (2.4 | ) | |||||||||||
Net income (loss) | 32.7 | 74.3 | 16.1 | (90.4 | ) | 32.7 | |||||||||||||
Net income attributable to noncontrolling interest | — | — | — | — | — | ||||||||||||||
Net income (loss) attributable to ParkOhio common shareholder | $ | 32.7 | $ | 74.3 | $ | 16.1 | $ | (90.4 | ) | $ | 32.7 | ||||||||
Other comprehensive income (loss) (see note 14): | |||||||||||||||||||
Foreign currency translation adjustments | $ | 0.6 | $ | — | $ | 0.6 | $ | (0.6 | ) | $ | 0.6 | ||||||||
Recognition of actuarial (loss) gain, net of tax | 1.0 | 1.0 | — | (1.0 | ) | 1.0 | |||||||||||||
Comprehensive income (loss), net of tax | 34.3 | 75.3 | 16.7 | (92.0 | ) | 34.3 | |||||||||||||
Comprehensive income attributable to noncontrolling interest | — | — | — | — | — | ||||||||||||||
Comprehensive income (loss) attributable to ParkOhio common shareholder | $ | 34.3 | $ | 75.3 | $ | 16.7 | $ | (92.0 | ) | $ | 34.3 | ||||||||
74
Park-Ohio Industries, Inc. and Subsidiaries
Notes to Consolidated Financial Statements — (Continued)
Park-Ohio Industries, Inc. and Subsidiaries
Condensed Consolidating Statement of Cash Flows
Year Ended December 31, 2014 | |||||||||||||||||||
Parent | Combined Guarantor Subsidiaries | Combined Non-Guarantor Subsidiaries | Eliminations | Consolidated | |||||||||||||||
(In millions) | |||||||||||||||||||
OPERATING ACTIVITIES | |||||||||||||||||||
Net cash provided (used) by operating activities | $ | (21.2 | ) | $ | 89.8 | $ | 14.4 | $ | (27.1 | ) | $ | 55.9 | |||||||
INVESTING ACTIVITIES | |||||||||||||||||||
Purchases of property, plant and equipment | (0.2 | ) | (8.3 | ) | (17.3 | ) | — | (25.8 | ) | ||||||||||
Proceeds from sale of property | — | 2.1 | — | — | 2.1 | ||||||||||||||
Business acquisition, net of cash acquired | — | (47.5 | ) | (25.2 | ) | — | (72.7 | ) | |||||||||||
Net cash used by investing activities | (0.2 | ) | (53.7 | ) | (42.5 | ) | — | (96.4 | ) | ||||||||||
FINANCING ACTIVITIES | |||||||||||||||||||
Intercompany account change | (30.7 | ) | (32.4 | ) | 36.0 | 27.1 | — | ||||||||||||
Proceeds from term loans and other debt | 14.1 | — | 0.1 | — | 14.2 | ||||||||||||||
Payments on term loans and other debt | (3.6 | ) | (0.6 | ) | (2.4 | ) | — | (6.6 | ) | ||||||||||
Proceeds from revolving credit facility | 50.3 | — | — | — | 50.3 | ||||||||||||||
Dividends paid to parent | (10.0 | ) | — | — | — | (10.0 | ) | ||||||||||||
Income tax effect of share-based compensation exercises and vesting | 1.3 | — | — | — | 1.3 | ||||||||||||||
Other | — | — | (1.3 | ) | — | (1.3 | ) | ||||||||||||
Net cash (used) provided by financing activities | 21.4 | (33.0 | ) | 32.4 | 27.1 | 47.9 | |||||||||||||
Effect of exchange rate changes on cash | — | — | (2.8 | ) | — | (2.8 | ) | ||||||||||||
Increase in cash and cash equivalents | — | 3.1 | 1.5 | — | 4.6 | ||||||||||||||
Cash and cash equivalents at beginning of period | — | 0.7 | 43.0 | — | 43.7 | ||||||||||||||
Cash and cash equivalents at end of period | $ | — | $ | 3.8 | $ | 44.5 | $ | — | $ | 48.3 | |||||||||
75
Park-Ohio Industries, Inc. and Subsidiaries
Notes to Consolidated Financial Statements — (Continued)
Park-Ohio Industries, Inc. and Subsidiaries
Condensed Consolidating Statement of Cash Flows
Year Ended December 31, 2013 | |||||||||||||||||||
Parent | Combined Guarantor Subsidiaries | Combined Non-Guarantor Subsidiaries | Eliminations | Consolidated | |||||||||||||||
(In millions) | |||||||||||||||||||
OPERATING ACTIVITIES | |||||||||||||||||||
Net cash provided (used) by operating activities | $ | (38.1 | ) | $ | 81.8 | $ | 19.9 | $ | (3.9 | ) | $ | 59.7 | |||||||
INVESTING ACTIVITIES | |||||||||||||||||||
Purchases of property, plant and equipment | (1.0 | ) | (23.8 | ) | (5.0 | ) | — | (29.8 | ) | ||||||||||
Proceeds from sale and leaseback transactions | — | 7.4 | — | — | 7.4 | ||||||||||||||
Proceeds from sale of assets | 13.5 | 0.7 | 13.5 | (13.5 | ) | 14.2 | |||||||||||||
Business acquisition, net of cash acquired | — | (21.6 | ) | (24.2 | ) | — | (45.8 | ) | |||||||||||
Net cash (used) provided by investing activities | 12.5 | (37.3 | ) | (15.7 | ) | (13.5 | ) | (54.0 | ) | ||||||||||
FINANCING ACTIVITIES | |||||||||||||||||||
Intercompany account change | 30.3 | (43.6 | ) | (4.1 | ) | 17.4 | — | ||||||||||||
Payments on term loans and other debt | (3.6 | ) | (0.4 | ) | (0.2 | ) | — | (4.2 | ) | ||||||||||
Proceeds from revolving credit facility | 9.1 | — | — | — | 9.1 | ||||||||||||||
Dividends to parent | (10.7 | ) | — | — | — | (10.7 | ) | ||||||||||||
Income tax effect of share-based compensation exercises and vesting | 0.5 | — | — | — | 0.5 | ||||||||||||||
Net cash provided (used) by financing activities | 25.6 | (44.0 | ) | (4.3 | ) | 17.4 | (5.3 | ) | |||||||||||
Effect of exchange rate changes on cash | — | — | 0.9 | — | 0.9 | ||||||||||||||
Increase in cash and cash equivalents | — | 0.5 | 0.8 | — | 1.3 | ||||||||||||||
Cash and cash equivalents at beginning of period | — | 0.2 | 42.2 | — | 42.4 | ||||||||||||||
Cash and cash equivalents at end of period | $ | — | $ | 0.7 | $ | 43.0 | $ | — | $ | 43.7 | |||||||||
76
Park-Ohio Industries, Inc. and Subsidiaries
Notes to Consolidated Financial Statements — (Continued)
Park-Ohio Industries, Inc. and Subsidiaries
Condensed Consolidating Statement of Cash Flows
Year Ended December 31, 2012 | |||||||||||||||||||
Parent | Combined Guarantor Subsidiaries | Combined Non-Guarantor Subsidiaries | Eliminations | Consolidated | |||||||||||||||
(In millions) | |||||||||||||||||||
OPERATING ACTIVITIES | |||||||||||||||||||
Net cash provided (used) by operating activities | $ | (46.8 | ) | $ | 84.9 | $ | 16.0 | $ | 2.4 | $ | 56.5 | ||||||||
INVESTING ACTIVITIES | |||||||||||||||||||
Purchases of property, plant and equipment | 0.9 | (25.2 | ) | (2.6 | ) | — | (26.9 | ) | |||||||||||
Proceeds from sale and leaseback transactions | — | 5.9 | — | — | 5.9 | ||||||||||||||
Proceeds from sale of assets | — | 0.4 | — | — | 0.4 | ||||||||||||||
Proceeds from the bond redemption | — | (97.0 | ) | — | — | (97.0 | ) | ||||||||||||
Net cash (used) provided by investing activities | 0.9 | (115.9 | ) | (2.6 | ) | — | (117.6 | ) | |||||||||||
FINANCING ACTIVITIES | |||||||||||||||||||
Intercompany account change | 3.8 | 31.1 | (32.5 | ) | (2.4 | ) | — | ||||||||||||
Proceeds from term loans and other debt | 25.0 | 0.9 | — | — | 25.9 | ||||||||||||||
Payments on term loans and other debt | (2.6 | ) | (0.9 | ) | (0.2 | ) | — | (3.7 | ) | ||||||||||
Proceeds from revolving credit facility | 8.9 | — | — | — | 8.9 | ||||||||||||||
Dividends to parent | (1.5 | ) | — | — | — | (1.5 | ) | ||||||||||||
Distribution of capital to shareholder | — | — | — | — | — | ||||||||||||||
Bank debt issue costs | (0.9 | ) | — | — | — | (0.9 | ) | ||||||||||||
Income tax effect of suspended benefits from share-based compensation | 2.8 | — | — | — | 2.8 | ||||||||||||||
Income tax effect of share-based compensation exercises and vesting | 0.4 | — | — | — | 0.4 | ||||||||||||||
Capital contribution from parent | 10.0 | — | — | — | 10.0 | ||||||||||||||
Net cash provided (used) by financing activities | 45.9 | 31.1 | (32.7 | ) | (2.4 | ) | 41.9 | ||||||||||||
Effect of exchange rate changes on cash | — | — | 0.3 | — | 0.3 | ||||||||||||||
Increase (decrease) in cash and cash equivalents | — | 0.1 | (19.0 | ) | — | (18.9 | ) | ||||||||||||
Cash and cash equivalents at beginning of period | — | 0.1 | 61.2 | — | 61.3 | ||||||||||||||
Cash and cash equivalents at end of period | $ | — | $ | 0.2 | $ | 42.2 | $ | — | $ | 42.4 | |||||||||
77
Supplementary Financial Data
Schedule II
Park-Ohio Industries, Inc. and Subsidiaries
Schedule II — Valuation and Qualifying Accounts and Reserves
Description | Balance at Beginning of Period | Charged to Costs and Expenses | Deductions and Other | Balance at End of Period | |||||||||||
(In millions) | |||||||||||||||
Year Ended December 31, 2014: | |||||||||||||||
Allowances deducted from assets: | |||||||||||||||
Trade receivable allowances | $ | 3.7 | $ | 0.3 | $ | 0.1 | (A) | $ | 4.1 | ||||||
Inventory obsolescence reserve | 28.4 | 8.4 | (6.9 | ) | (B) | 29.9 | |||||||||
Tax valuation allowances | 2.6 | (1.1 | ) | 5.6 | (C) | 7.1 | |||||||||
Year Ended December 31, 2013: | |||||||||||||||
Allowances deducted from assets: | |||||||||||||||
Trade receivable allowances | $ | 3.5 | $ | 1.8 | $ | (1.6 | ) | (A) | $ | 3.7 | |||||
Inventory obsolescence reserve | 27.2 | 9.4 | (8.2 | ) | (B) | 28.4 | |||||||||
Tax valuation allowances | 4.2 | (1.6 | ) | — | 2.6 | ||||||||||
Year Ended December 31, 2012: | |||||||||||||||
Allowances deducted from assets: | |||||||||||||||
Trade receivable allowances | $ | 5.5 | $ | 1.8 | $ | (3.8 | ) | (A) | $ | 3.5 | |||||
Inventory obsolescence reserve | 24.9 | 11.6 | (9.3 | ) | (B) | 27.2 | |||||||||
Tax valuation allowances | 4.4 | (0.2 | ) | — | 4.2 | ||||||||||
Note (A)- Uncollectable accounts written off, net of recoveries.
Note (B)- Amounts written off or payments incurred, net of acquired reserves.
Note (C)- Amounts accounted for under the acquisition method of accounting.
Item 9. Changes in and Disagreements With Accountants on Accounting and Financial Disclosure
There were no changes in or disagreements with our independent auditors on accounting and financial disclosure matters within the two-year period ended December 31, 2014.
Item 9A. Controls and Procedures
Evaluation of disclosure controls and procedures
As of the end of the period covered by this report, we carried out an evaluation, under the supervision and with the participation of our Chairman and Chief Executive Officer and our Vice President and Chief Financial Officer, of the effectiveness of our disclosure controls and procedures pursuant to Rule 13a-15(e) and Rule 15d-15(e) of the Securities Exchange Act of 1934, as amended (“Exchange Act”). In the second quarter of fiscal 2014, the Company acquired Apollo. In the fourth quarter of fiscal 2014, the Company acquired Autoform and Saet. The scope of the Company’s assessment of the effectiveness of internal control over financial reporting did not include Apollo, Autoform and Saet, which in the aggregate constituted 8% of total assets as of December 31, 2014 and less than 2% of revenues for the year then ended. These exclusions are in accordance with the SEC’s general guidance that an assessment of a recently acquired business may be omitted from the Company’s scope in the year of acquisition. Based upon this evaluation, our Chairman and Chief Executive Officer and Vice
78
President and Chief Financial Officer concluded that, as of the end of the period covered by this Annual Report on Form 10-K, our disclosure controls and procedures were effective.
Management’s Report on Internal Control over Financial Reporting
Our management is responsible for establishing and maintaining adequate internal control over financial reporting, as such term is defined in Rule 13a-15(f) under the Exchange Act. As required by Rule 13a-15(c) under the Exchange Act, management carried out an evaluation, with participation of our Chairman and Chief Executive Officer and Vice President and Chief Financial Officer, of the effectiveness of our internal control over financial reporting as of December 31, 2014. The framework on which such evaluation was based is contained in the report entitled “Internal Control — Integrated Framework” issued by the Committee of Sponsoring Organizations of the Treadway Commission (2013 Framework) (the “COSO Report”). Management’s assessment and conclusion on the effectiveness of internal control over financial reporting did not include the internal controls of Apollo, Autoform and Saet, which in the aggregate constituted 8% of total assets as of December 31, 2014 and less than 2% of revenues for the year then ended. Based upon the evaluation described above under the framework contained in the COSO Report, our management has concluded that our internal control over financial reporting was effective as of December 31, 2014.
Changes in internal control over financial reporting
There have been no changes in our internal control over financial reporting that occurred during the fourth quarter of 2014 that have materially affected, or are reasonably likely to materially affect, our internal control over financial reporting.
Item 9B. Other Information
None.
79
Part III
Item 10. Directors, Executive Officers and Corporate Governance
Information required by this item has been omitted pursuant to general Instruction I of Form 10-K.
Item 11. Executive Compensation
Information required by this item has been omitted pursuant to general Instruction I of Form 10-K.
Item 12. Security Ownership of Certain Beneficial Owners and Management and Related Stockholder Matters
Information required by this item has been omitted pursuant to general Instruction I of Form 10-K.
Item 13. Certain Relationships and Related Transactions, and Director Independence
Information required by this item has been omitted pursuant to general Instruction I of Form 10-K.
Item 14. Principal Accountant Fees and Services
The following table presents fees for professional services rendered by Ernst & Young LLP to the Company and its parent for the years ended December 31, 2014 and 2013:
2014 | 2013 | ||||||
Audit fees | $ | 1,246,000 | $ | 1,122,000 | |||
Audit-related fees | 75,000 | 75,000 | |||||
Tax fees | 312,400 | 183,430 | |||||
Fees for audit services include fees associated with the annual audit, the reviews of our quarterly reports on Form 10-Q, statutory audits required internationally and the audit of management’s assessment of internal control over financial reporting under Section 404 of the Sarbanes-Oxley Act of 2002. Audit-related fees principally included fees in connection with pension plan audits. Tax fees include fees in connection with tax compliance and tax planning. Park-Ohio is a wholly-owned subsidiary of Holdings and does not have a separate audit committee. Holdings’ audit committee has adopted a pre-approval policy for audit and non-audit related services and auditor independence requiring the approval by Holdings’ audit committee of all professional services rendered by the Company’s and its parent’s independent auditor prior to the commencement of the specified services.
All of the services related to the “Audit Fees,” “Audit-Related Fees” and “Tax Fees” were pre-approved by Holdings’ audit committee in accordance with Holdings’ formal policy on auditor independence.
80
Part IV
Item 15. Exhibits and Financial Statement Schedules
(a) (1) The following financial statements are included in Part II, Item 8 of this annual report on Form 10-K:
Page | |
Financial Statement Schedules | |
The following consolidated financial statement schedule of Park-Ohio Industries, Inc. is included in Item 8: | |
All other schedules for which provision is made in the applicable accounting regulations of the SEC are not required under the related instructions or are not applicable and, therefore, have been omitted.
(3) Exhibits:
The exhibits filed as part of this Annual Report on Form 10-K are listed on the Exhibit Index immediately preceding such exhibits and are incorporated herein by reference.
81
SIGNATURES
Pursuant to the requirements of the Securities Exchange Act of 1934, the registrant has duly caused this report to be signed on its behalf by the undersigned thereunto duly authorized.
PARK-OHIO INDUSTRIES, INC. | |
(Registrant) | |
By: | /s/ W. Scott Emerick |
Name: | W. Scott Emerick |
Title: | Vice President and Chief Financial Officer (Principal Financial and Accounting Officer) |
Date: March 31, 2015
Pursuant to the requirements of the Securities Exchange Act of 1934, this report has been signed by the following persons in the capacities and on the dates indicated.
* Edward F. Crawford | Chairman, Chief Executive Officer and Director (Principal Executive Officer) | March 31, 2015 | ||||
* W. Scott Emerick | Vice President and Chief Financial Officer (Principal Financial and Accounting Officer) | |||||
* Matthew V. Crawford | President, Chief Operating Officer and Director | |||||
* Patrick V. Auletta | Director | |||||
* Kevin R. Greene | Director | |||||
* A. Malachi Mixon, III | Director | |||||
* Dan T. Moore, III | Director | |||||
* Ronna Romney | Director | |||||
* Steven H. Rosen | Director | |||||
* James W. Wert | Director | |||||
* | The undersigned, pursuant to a Power of Attorney executed by each of the directors and officers identified above and filed with the Securities and Exchange Commission, by signing his name hereto, does hereby sign and execute this report on behalf of each of the persons noted above, in the capacities indicated. |
March 31, 2015 | By: | /s/ ROBERT D. VILSACK | ||||
Robert D. Vilsack, Attorney-in-Fact | ||||||
82
EXHIBIT INDEX
ANNUAL REPORT ON FORM 10-K
PARK-OHIO INDUSTRIES, INC.
For the Year Ended December 31, 2014
Exhibit | |
2.1 | Agreement and Plan of Merger by and among Fluid Routing Solutions Holding Corp., FRS Group, LLP, Automotive Holding Acquisition Corp and Park-Ohio Industries, Inc., dated as of March 5, 2012 (filed as Exhibit 2.1 to Form 10-Q of Park-Ohio Holdings Corp. filed on May 10, 2012, SEC File No. 000-03134 and incorporated by reference and made a part hereof) |
3.1 | Amended and Restated Articles of Incorporation of Park-Ohio Industries, Inc. (filed as Exhibit 3.1 to the Form 10-K of Park-Ohio Industries, Inc. for the year ended December 31, 1998, SEC File No. 333-43005 and incorporated by reference and made a part hereof) |
3.2 | Code of Regulations of Park-Ohio Industries, Inc. (filed as Exhibit 3.2 to the Form 10-K of Park-Ohio Industries, Inc. for the year ended December 31, 1998, SEC File No. 333-43005 and incorporated by reference and made a part hereof) |
4.1 | Sixth Amended and Restated Credit Agreement, dated July 31, 2014, among Industries, the other Loan Parties (as defined therein), the Lenders (as defined therein), JP Morgan Chase Bank, N.A., as Administrative Agent, JP Morgan Chase Bank, N.A., Toronto Branch, as Canadian Agent, JP Morgan Europe Limited, as European agent, RBS Business Capital, as Syndication Agent, KeyBank National Association and First National Bank of Pennsylvania, as Co-Documentation Agents, U.S. Bank National Association, as Co-Documentation Agent and Joint Bookrunner, PNC Bank, National Association , as Joint Bookrunner, and J.P. Morgan Securities, Inc. as Sole Lead Arranger and Bookrunning Manager (filed as Exhibit 10.1 to the Form 10-Q of Park-Ohio Holdings Corp., filed on November 10, 2014, SEC File No. 000-03134 and incorporated by reference and made a part hereof) |
4.2 | Amendment No. 1 to Sixth Amended and Restated Credit Agreement, dated October 24, 2014, among Park-Ohio Industries, Inc. and RB&W Corporation of Canada, as borrowers, the Ex-Im Borrowers party to the Credit Agreement (as defined therein) the other Loan Parties party to the Credit Agreement, the lenders party to the Credit Agreement, JPMorgan Chase Bank, N.A., as Administrative Agent and JPMorgan Chase Bank, N.A., Toronto Branch, as Canadian Agent and JPMorgan Europe Limited, as European Agent. |
4.3 | Indenture, dated as of April 7, 2011, among Park-Ohio Industries, Inc., the Guarantors (as defined therein) and Wells Fargo Bank, NA, as trustee (filed as Exhibit 4.1 to the Form 8-K of Park-Ohio Holdings Corp. filed on April 13, 2011, SEC File No. 000-03134 and incorporated herein by reference and made a part hereof) |
10.1 | Form of Indemnification Agreement entered into between Park-Ohio Industries, Inc. and each of its directors and certain officers (filed as Exhibit 10.1 to the Form 10-K of Park-Ohio Industries, Inc. for the year ended December 31, 1998, SEC File No. 333-43005 and incorporated by reference and made a part hereof) |
10.2* | Amended and Restated 1998 Long-Term Incentive Plan (filed as Exhibit 10.1 to Form 8-K of Park-Ohio Holdings Corp., filed on May 30, 2012, SEC File No. 000-03134 and incorporated by reference and made a part hereof) |
10.3* | Form of Restricted Share Agreement between the Company and each non-employee director (filed as Exhibit 10.1 to Form 8-K of Park-Ohio Holdings Corp., filed on January 25, 2005, SEC File No. 000-03134 and incorporated herein by reference and made a part hereof) |
10.4* | Form of Restricted Share Agreement for Employees (filed as Exhibit 10.1 to Form 10-Q for Park-Ohio Holdings Corp. for the quarter ended September 30, 2006, SEC File No. 000-03134 and incorporated herein by reference and made a part hereof) |
10.5* | Form of Incentive Stock Option Agreement (filed as Exhibit 10.5 to Form 10-K of Park-Ohio Holdings Corp. for the year ended December 31, 2004, SEC File No. 000-03134 and incorporated by reference and made a part hereof) |
10.6* | Form of Non-Statutory Stock Option Agreement (filed as Exhibit 10.6 to Form 10-K of Park-Ohio Holdings Corp. for the year ended December 31, 2004, SEC File No. 000-03134 and incorporated herein by reference and made a part hereof) |
83
Exhibit | |
10.7* | Park-Ohio Industries, Inc. Annual Cash Bonus Plan (filed as Exhibit 10.1 to the Form 8-K for Park-Ohio Holdings Corp, filed June 1, 2011, SEC File No. 000-03134 and incorporated by reference and made a part hereof) |
10.8* | Supplemental Executive Retirement Plan for Edward F. Crawford, effective as of March 10, 2008 (filed as Exhibit 10.9 to Form 10-K of Park-Ohio Holdings Corp. for the year ended December 31, 2007, SEC File No. 000-03134 and incorporated by reference and made a part hereof) |
10.9* | Non-qualified Defined Contribution Retirement Benefit Letter Agreement for Edward F. Crawford, dated March 10, 2008 (filed as Exhibit 10.10 to Form 10-K of Park-Ohio Holdings Corp. for the year ended December 31, 2007, SEC File No. 000-03134 and incorporated by reference and made a part hereof) |
10.10* | 2009 Director Supplemental Defined Contribution Plan of Park-Ohio Holdings Corp. (Filed as Exhibit 10 to Form 10-Q of Park-Ohio Holdings Corp. filed on May 10, 2011, SEC File No. 000-03134 and incorporated by reference and made a part hereof) |
24.1 | Power of Attorney |
31.1 | Principal Executive Officer’s Certification Pursuant to Section 302 of the Sarbanes-Oxley Act of 2002 |
31.2 | Principal Financial Officer’s Certification Pursuant to Section 302 of the Sarbanes-Oxley Act of 2002 |
32.1 | Certification requirement under Section 906 of the Sarbanes-Oxley Act of 2002 |
101.INS | XBRL Instance Document |
101.SCH | XBRL Taxonomy Extension Schema Document |
101.CAL | XBRL Taxonomy Extension Calculation Linkbase Document |
101.DEF | XBRL Taxonomy Extension Label Linkbase Document |
101.LAB | XBRL Taxonomy Extension Presentation Linkbase Document |
101.PRE | XBRL Taxonomy Extension Definition Linkbase Document |
* | Reflects management contract or other compensatory arrangement required to be filed as an exhibit pursuant to Item 15(c) of this Report. |
84