Attached files
| file | filename |
|---|---|
| 8-K - HOOPER HOLMES, INC. 8-K - HOOPER HOLMES INC | a51069478.htm |
| EX-99.1 - EXHIBIT 99.1 - HOOPER HOLMES INC | a51069478ex99_1.htm |
Exhibit 99.2
Hooper Holmes, Inc. March 31, 2015 Earnings Presentation Speakers: Henry Dubois, Chief Executive Officer Tom Collins, Chief Financial Officer 1
Safe Harbor Statement 2 The presentation contains forward-looking statements concerning plans, objectives, goals, strategies, future events or performances, which are not statements of historical fact. The forward-looking statements contained in this release reflect our current beliefs and expectations. Actual results or performance may differ materially from what is expressed in the forward-looking statements. You are referred to the documents filed by us with the SEC, specifically reports on Form 10-K and Form 10- Q including risk factors that could cause actual results to differ from forward-looking statements. These reports are available at www.sec.gov. This presentation should be used in conjunction with the earnings call dated March 31, 2015. This presentation contains information from third-party sources, including data from studies conducted by others and market data and industry forecasts obtained from industry publication. Although Hooper Holmes, Inc. believes that such information is reliable, Hooper Holmes, Inc. has not independently verified any of this information and Hooper Holmes, Inc. does not guarantee the accuracy or completeness of this information.2
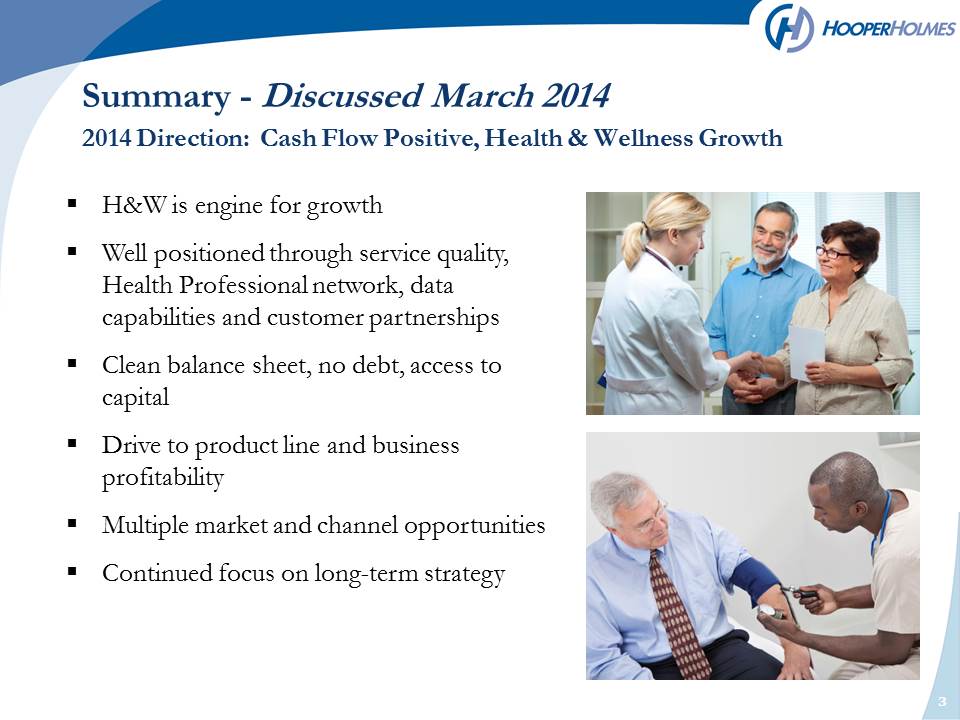
Summary - Discussed March 2014 2014 Direction: Cash Flow Positive, Health & Wellness Growth H&W is engine for growth Well positioned through service quality, Health Professional network, data capabilities and customer partnerships Clean balance sheet, no debt, access to Capital Drive to product line and business profitability Multiple market and channel opportunities Continued focus on long-term strategy 3
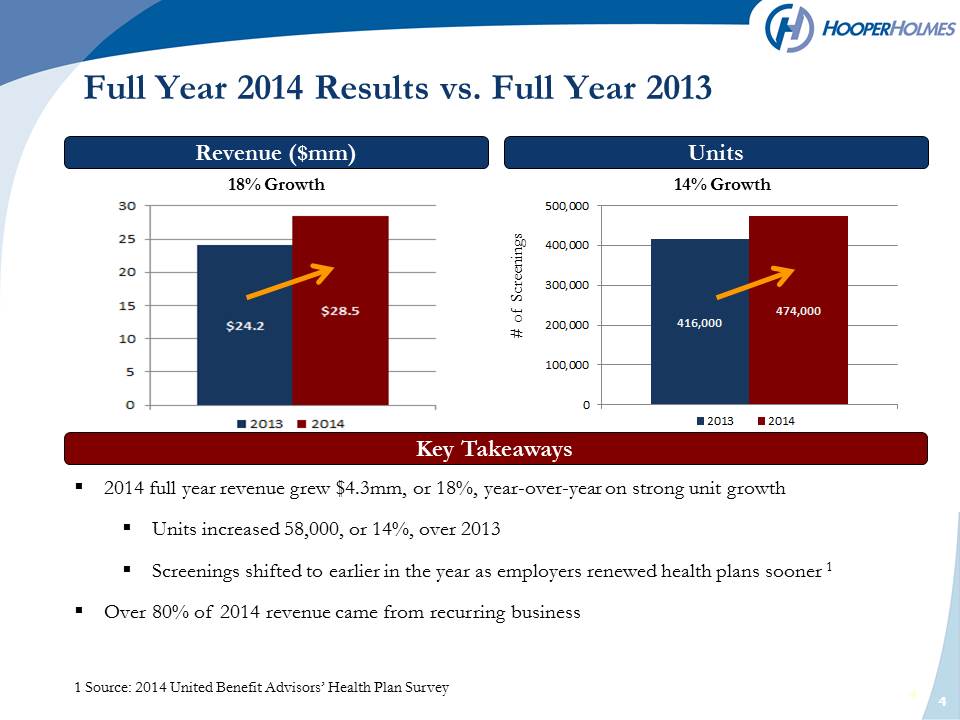
2014 full year revenue grew $4.3mm, or 18%, year-over-year on strong unit growth Units increased 58,000, or 14%, over 2013 Screenings shifted to earlier in the year as employers renewed health plans sooner 1 Over 80% of 2014 revenue came from recurring business 1 Source: 2014 United Benefit Advisors’ Health Plan Survey Key Takeaways 18% Growth 14% Growth # of Screenings Full Year 2014 Results vs. Full Year 2013 4
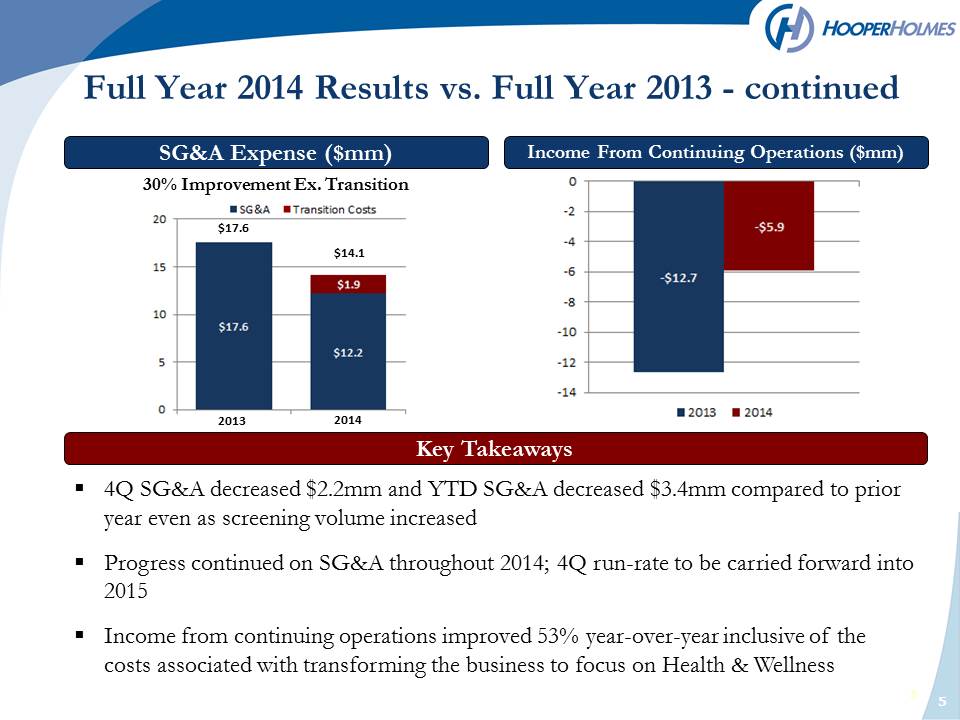
5 5 SG&A Expense ($mm) Income From Continuing Operations ($mm) 4Q SG&A decreased $2.2mm and YTD SG&A decreased $3.4mm compared to prior year even as screening volume increased Progress continued on SG&A throughout 2014; 4Q run-rate to be carried forward into 2015 Income from continuing operations improved 53% year-over-year inclusive of the costs associated with transforming the business to focus on Health & Wellness Key Takeaways 30% Improvement Ex. Transition Full Year 2014 Results vs. Full Year 2013 – continued 2013 2014 $17.6 $14.1 5
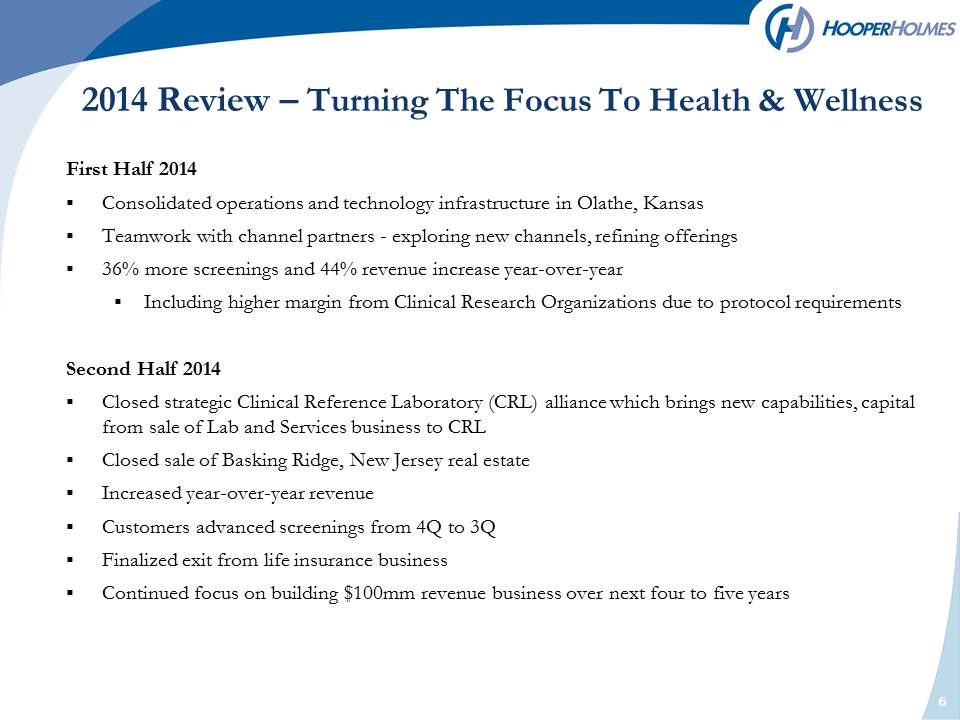
2014 Review – Turning The Focus To Health & Wellness First Half 2014 Consolidated operations and technology infrastructure in Olathe, Kansas Teamwork with channel partners - exploring new channels, refining offerings 36% more screenings and 44% revenue increase year-over-year Including higher margin from Clinical Research Organizations due to protocol requirementsSecond Half 2014 Closed strategic Clinical Reference Laboratory (CRL) alliance which brings new capabilities, capital from sale of Lab and Services business to CRL Closed sale of Basking Ridge, New Jersey real estate Increased year-over-year revenue Customers advanced screenings from 4Q to 3Q Finalized exit from life insurance business Continued focus on building $100mm revenue business over next four to five years 6
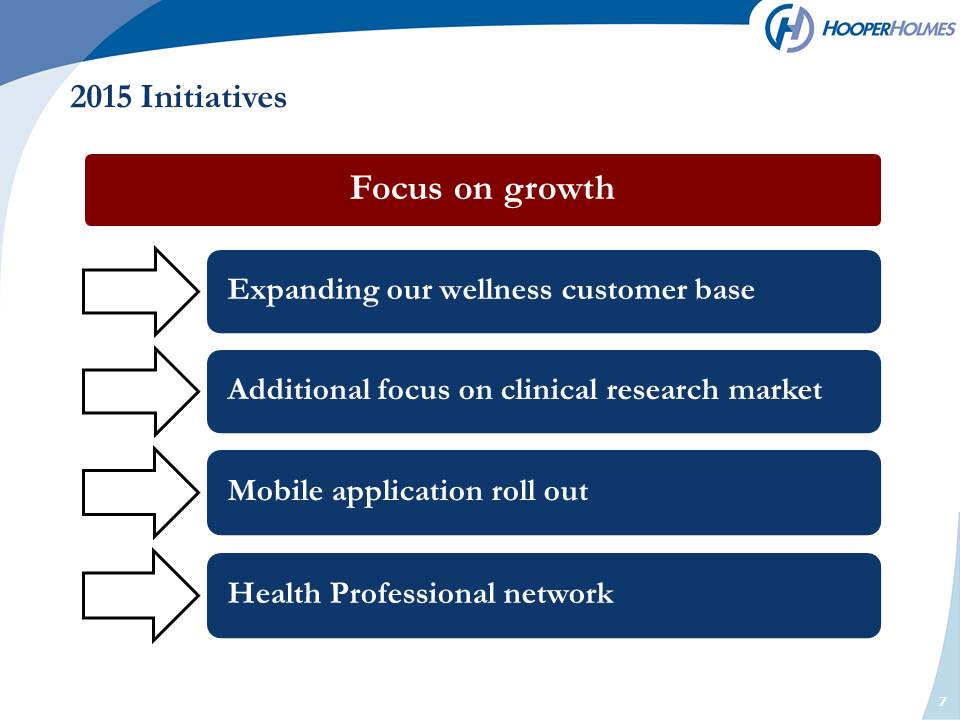
2015 Initiatives 7 Focus on
growth Expanding our wellness customer base Additional focus on clinical
research market Mobile application roll out Health Professional network
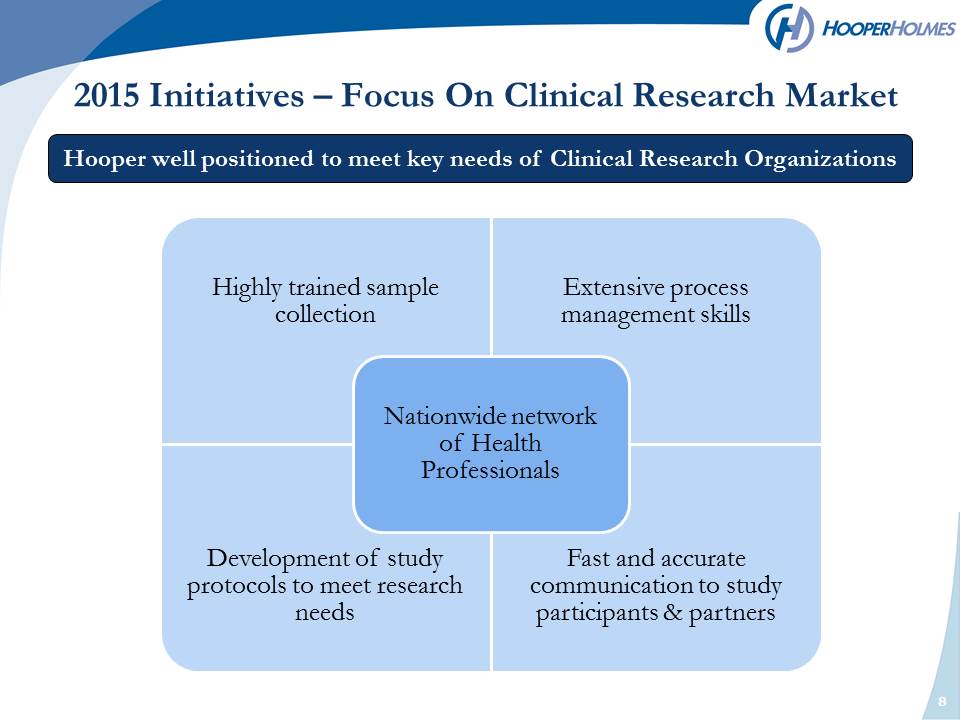
2015 Initiatives – Focus On Clinical Research Market 8 Hooper well positioned to meet key needs of Clinical Research Organizations Highly trained sample collection Extensive process management skills Development of study protocols to meet research needs Fast and accurate communication to study participants & partners Nationwide network of Health Professionals 8
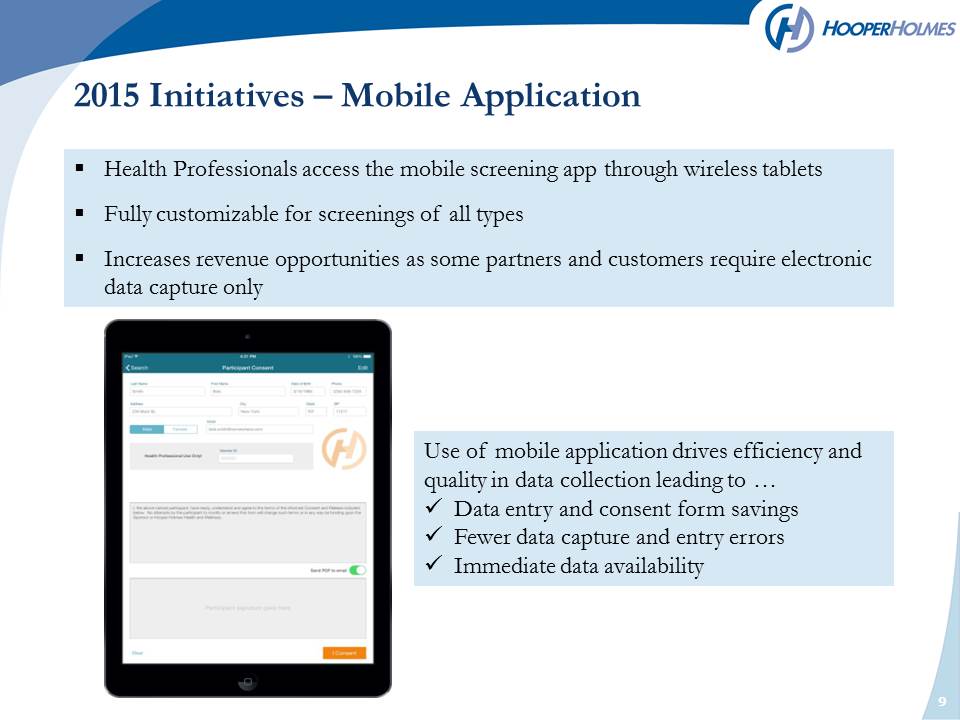
2015 Initiatives – Mobile Application Health Professionals access the mobile screening app through wireless tablets Fully customizable for screenings of all types Increases revenue opportunities as some partners and customers require electronic data capture only 9 Use of mobile application drives efficiency and quality in data collection leading to Data entry and consent form savings Fewer data capture and entry errors Immediate data availability 9
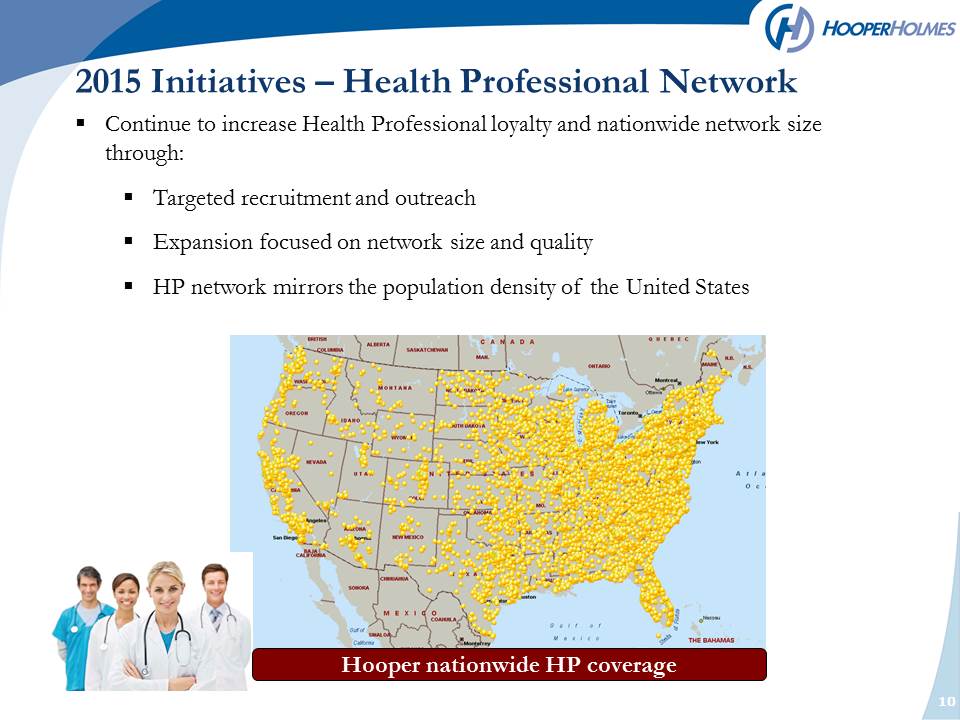
2015 Initiatives – Health Professional Network Continue to increase Health Professional loyalty and nationwide network size through: Targeted recruitment and outreach Expansion focused on network size and quality HP network mirrors the population density of the United States 10
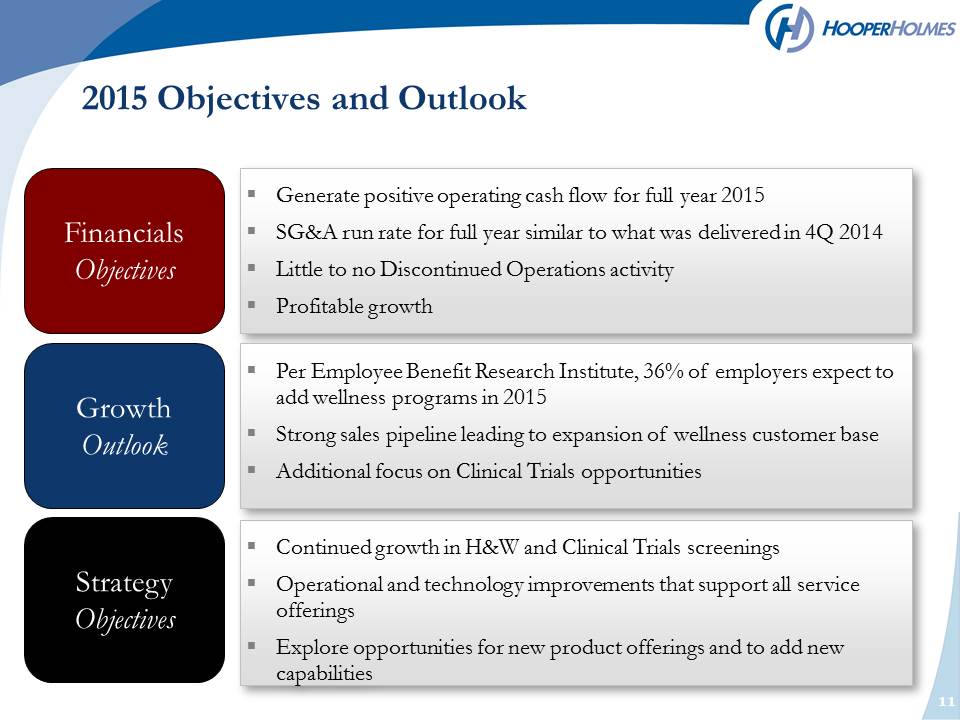
11 Strategy Objectives p Continued growth in H&W and Clinical Trials screenings Operational and technology improvements that support all service offerings Explore opportunities for new product offerings and to add new capabilities Financials Objectives Generate positive operating cash flow for full year 2015 SG&A run rate for full year similar to what was delivered in 4Q 2014 Little to no Discontinued Operations activity Profitable growth 2015 Objectives and Outlook Growth Outlook Per Employee Benefit Research Institute, 36% of employers expect to add wellness programs in 2015 Strong sales pipeline leading to expansion of wellness customer base Additional focus on Clinical Trials opportunities