Attached files
| file | filename |
|---|---|
| 8-K - 8-K - CAMDEN NATIONAL CORP | v405582_8k.htm |
| EX-2.1 - EXHIBIT 2.1 - CAMDEN NATIONAL CORP | v405582_ex2-1.htm |
| EX-99.4 - EXHIBIT 99.4 - CAMDEN NATIONAL CORP | v405582_ex99-4.htm |
| EX-99.1 - EXHIBIT 99.1 - CAMDEN NATIONAL CORP | v405582_ex99-1.htm |
| EX-10.1 - EXHIBIT 10.1 - CAMDEN NATIONAL CORP | v405582_ex10-1.htm |
| EX-10.2 - EXHIBIT 10.2 - CAMDEN NATIONAL CORP | v405582_ex10-2.htm |
| EX-99.3 - EXHIBIT 99.3 - CAMDEN NATIONAL CORP | v405582_ex99-3.htm |
Exhibit 99.2
Creating Maine’s Strongest Banking Franchise March 30, 2015 NASDAQ : CAC 1 A cquisition of SBM Financial, Inc. / . .

Forward Looking Statements Certain statements contained in this Current Report on Form 8 - K that are not statements of historical fact constitute forward - looking statements within the meaning of the Private Securities Litigation Reform Act of 1995 about the proposed merger of Camden National Corporation (“Camden National) and SBM Financial, Inc (“SBM”). These statements include statements regarding the anticipated closing date of the transaction, estimated cost savings of SBM’s pre - tax non - interests expenses, the amount of accretion of the transaction to Camden National’s earnings, and Camden National’s pro forma tangible equity to tangible assets ratio. Forward - looking statements can be identified by the fact that they do not relate strictly to historical or current facts. They often include words like “believe,” “expect,” “anticipate,” “estimate,” and “intend” or future or conditional verbs such as “will,” “would,” “should,” “could” or “may.” Certain factors that could cause actual results to differ materially from expected results include delays in completing the proposed merger, difficulties in achieving cost savings from the proposed merger or in achieving such cost savings within the expected time frame, difficulties in integrating Camden National and SBM, increased competitive pressures, changes in the interest rate environment, changes in general economic conditions, legislative and regulatory changes that adversely affect the business in which Camden National and SBM are engaged, changes in the securities markets and other risks and uncertainties disclosed from time to time in in Camden National’s Annual Report on Form 10 - K for the year ended December 31, 2014, as updated by other filings with the SEC. Camden National does not have any obligation to update forward - looking statements. 2 This presentation references non - GAAP financial measures incorporating tangible equity and related measures, as well as core deposits and efficiency ratio. These measures are commonly used by investors in evaluating business combinations and financial condition. Non - GAAP Financial Measures

Additional Information and Where to Find It In connection with the proposed merger, Camden National will file with the Securities and Exchange Commission (“SEC”) a Registration Statement on Form S - 4 that will include a Proxy Statement of SBM and Camden National and a Prospectus of Camden, as well as other relevant documents concerning the proposed merger. Investors and stockholders are urged to read the Registration Statement and the Proxy Statement/Prospectus regarding the proposed merger when it becomes available and any other relevant documents filed with the SEC, as well as any amendments or supplements to those documents, because they will contain important information. A free copy of the Registration Statement and Proxy Statement/Prospectus, as well as other filings containing information about Camden National and SBM, when they become available, may be obtained at the SEC’s Internet site (http://www.sec.gov). Copies of the Registration Statement and Proxy Statement/Prospectus (when they become available) and the filings that will be incorporated by reference therein may also be obtained, free of charge, from Camden National’s website at camdennational.com or by contacting Camden National Investor Relations at (207) 236 - 8821 or by contacting SBM Investor Relations at (207) 518 - 5607. 3 Camden National and certain of its directors and executive officers may be deemed to be participants in the solicitation of proxies from the stockholders of Camden National in connection with the proposed merger. Information about the directors and executive officers of Camden National is set forth in the proxy statement for Camden National’s 2015 annual meeting of stockholders, as filed with the SEC on a Schedule 14A on March 12, 2015. Additional information regarding the interests of those participants and other persons who may be deemed participants in the transaction and a description of their direct and indirect interests, by security holdings or otherwise, may be obtained by reading the Proxy Statement/Prospectus and other relevant documents regarding the proposed merger to be filed with the SEC (when they become available). Free copies of these documents may be obtained as described in the preceding paragraph. Participants in Solicitation

Source: SNL Financial. Deposit data as of June 2014. • Assets: $3.6 billion • Loans: $2.4 billion • Deposits: $2.6 billion • Annualized revenue: $150 million • Branches: 68 plus lending offices • Market capitalization: approximately $390 million • NASDAQ: CAC 4 Camden National (44 branches) SBM Financial (24 branches) 1 - mi overlap: 8 branches | 33% Creating Maine’s strongest banking franchise Augusta Brunswick Portland Kennebunk Bangor Camden Camden National (Manchester, NH LPO) SBM Financial (Boston, MA – Healthcare Lending; Braintree, MA – Mortgage Lending)

5 History • Founded in 1834 • 2008 - 2009 Financial Crisis : The bank struggled with operating losses, rising NPAs, subject to a C&D order • 2010 Recap / Turnaround : The Bank raised $60 million of new capital, brought in a new management team led by CEO John Everets, and appointed a new Board of Directors • Since the Recap , The Bank of Maine has returned to profitability and asset quality has improved significantly: – NPAs / Loans + OREO reduced from 13.5% (2010) to 2.0% (2014) – Formal Agreement with OCC lifted in October 2014 – Over $1 billion of new / renewed loans since 2011 – In 2013, sold 6 northern Maine branches at a gain and consolidated 3 central Maine branches About SBM Financial / The Bank of Maine Augusta Brunswick Portland Kennebunk I - 95 Corridor Source: Company reports and SNL Financial. Financial Highlights ($mm) 2012 2013 2014 Assets $786 $745 $806 Net Loans $585 $573 $630 Deposits $661 $626 $658 Total Equity $84 $84 $86 Core ROAA (0.25%) 0.07% 0.28% Net Interest Margin 3.42% 3.49% 3.59% Efficiency Ratio 111% 96% 89% NPAs / Assets 4.3% 2.1% 1.6%

6 Strategically Compelling ▪ Creates Maine’s leading independent bank ▪ Expands presence in higher growth Southern Maine markets ▪ Adds strong, low cost deposits increasing deposit market share to 10.6% from 7.9% 1 Financially Attractive ▪ Mid - teens EPS accretion in 2016 and beyond ▪ Tangible Book Value dilution of 13.6% with earn back in five years ▪ 15%+ Internal Rate of Return Low Execution Risk ▪ Overlapping and adjacent markets ▪ Efficiencies through in - market cost savings and common core technology systems ▪ Compatible culture ▪ Management has successful integration track record Merger Benefits (1) Source: SNL Financial. Deposit data as of June 2014.

Strategic Rationale • Creates Maine’s leading independent bank • Expands presence in higher growth southern Maine markets and enhances capacity in existing footprint • The Bank of Maine has a large, stable, and low cost deposit base • Healthcare and mortgage businesses provide new sources of growth and diversification • Significant cost savings drive attractive transaction economics • Combined company will be better positioned for rising interest rates • Overlapping markets , compatible culture, common core technology systems and Camden’s experience as an acquirer minimize execution risk 7

(1) Based on CAC closing price of $38.60 on March 27, 2015. 8 Deal Value: ▪ Aggregate deal value of $135 million 1 ▪ Per share deal value of $208.60 1 Consideration Mix: ▪ 80% stock / 20% cash ▪ 5.421 exchange ratio or $206.00 in cash ▪ Represents approximately 2.8 million CAC shares and $26 million in cash Pro Forma Ownership: ▪ 72% Camden National / 28% SBM Financial Board Representation: ▪ Combined board will include 2 directors from SBM Financial Required Approvals: ▪ Customary regulatory approvals; Camden National and SBM Financial shareholder approval Termination Fee and Walkaway Provision: ▪ Termination fee of $5.4 million and double trigger walkaway provision (20% decline in both CAC stock and relative to the NASDAQ Bank Index) Due Diligence ▪ Extensive, including 3 rd party loan review Expected Closing: ▪ Third quarter of 2015 Transaction Overview

9 Financial Impact ▪ 14% EPS accretion in 2016 (first full year); mid - teens accretive in 2017 and beyond ▪ TBV per share dilution of 13.6% at closing with earnback of 5 years 1 ▪ IRR of 15%+ ▪ Pro forma Tangible Common Equity to Tangible Assets at close: 7.0% Key Assumptions ▪ Cost savings of approximately 37% or $11 million based on SBM’s core noninterest expense base of $31 million; additional savings to Camden from not implementing budgeted expansion investments ▪ Gross loan mark of $11.8 million (1.8% of loans and 140% of reserves) ▪ After - tax restructuring charge of $9.8 million ▪ CDI of $4.6 million, representing 1.0% of Non - CD deposits amortized over 10 years (SYD) ▪ Revenue synergies identified but excluded from financial analysis Pricing Metrics 2 Recent Transactions 3 ▪ Price / Tangible Book Value: 1.49x 1.85x ▪ Price / LTM Net Income (adjusted for announced cost saves): 11.5x 4 13.3x ▪ Core Deposit Premium: 7.6% 8.9% (1 ) Based on crossover method. (2) Based on CAC closing price of $38.60 on March 27, 2015. ( 3) Represents median of Northeast & Mid Atlantic deals since 2012 with target assets between $500mm and $ 4bn. (4) Inclusive of Camden savings from not implementing budgeted expansion initiatives. Financial Impact

Summary • Accelerates our expansion into higher growth Southern Maine markets • Enhances franchise through added scale, density and low cost deposits • Healthcare and mortgage businesses represent new sources of growth • Financially attractive transaction • Low execution risk – compatible culture and customer focused community banking model 10

11 Appendix

(50%) 0% 50% 100% 150% 200% 250% '99 '00 '01 '02 '03 '04 '05 '06 '07 '08 '09 '10 '11 '12 '13 '14 '15 216% $8.57 $26.52 $0.00 $5.00 $10.00 $15.00 $20.00 $25.00 $30.00 '99 '00 '01 '02 '03 '04 '05 '06 '07 '08 '09 '10 '11 '12 '13 '14 $1.27 $3.28 $0.00 $1.00 $2.00 $3.00 $4.00 '99 '00 '01 '02 '03 '04 '05 '06 '07 '08 '09 '10 '11 '12 '13 '14 History • Founded 1875 in Camden, Maine • Largest publicly traded community bank in Northern New England • Experienced acquirer, completing five acquisitions since 1994 • Strong suite of wealth management and trust services offered through Acadia Trust Asset Growth and M&A History ($mm) About Camden National 12 Earnings Per Share TBV Per Share $0 $500 $1,000 $1,500 $2,000 $2,500 $3,000 1994 1996 1998 2000 2002 2004 2006 2008 2010 2012 2014 United Corp. $54 million Key Bank 4 Branches $54 million KSB Bancorp $179 million Union Bankshares $565 million Bank of America 14 Branches $287 million Branch Sale 5 Branches $46 million Organic Growth: $1,194 million Acquired Growth: $1,140 million Total Growth CAGR: 9.5% Total Return Since 1999

13 ($ in millions) Balance Sheet 1 ▪ Assets ▪ Loans ▪ Deposits ▪ Loans / Assets ▪ Loans / Deposits $2,790 $1,773 $1,932 64% 92% $806 $638 $658 78% 97% $3,596 $2,411 $2,590 67% 93% Profitability Ratios 2 ▪ Return on Assets ▪ Return on Tang. Equity ▪ Net Interest Margin ▪ Efficiency Ratio ▪ Fee Income / Revenue 0.92% 13.5% 3.11% 62% 24% 0.22% 2.0% 3.59% 89% 25% 1.0% 3 15% 3 3.22% 60% 4 24% Capital & Asset Quality ▪ Tangible Common Ratio ▪ Leverage Ratio ▪ NPAs / Assets 7.2% 9.3% 0.82% 10.7% 9.9% 1.61% 7.0% 5 8.0% 5 0.99% Combined Source: Company reports and SNL Financial. ( 1) Pro forma excludes impact of merger adjustments. (2) For the full year 2014. ( 3) Based on estimates for 2016 with full realization of cost savings. (4) Based on 2014, adjusted for full realization of cost savings. ( 5) Estimate at closing. Combined franchise will have scale, strong financial metrics, and an attractive valuation
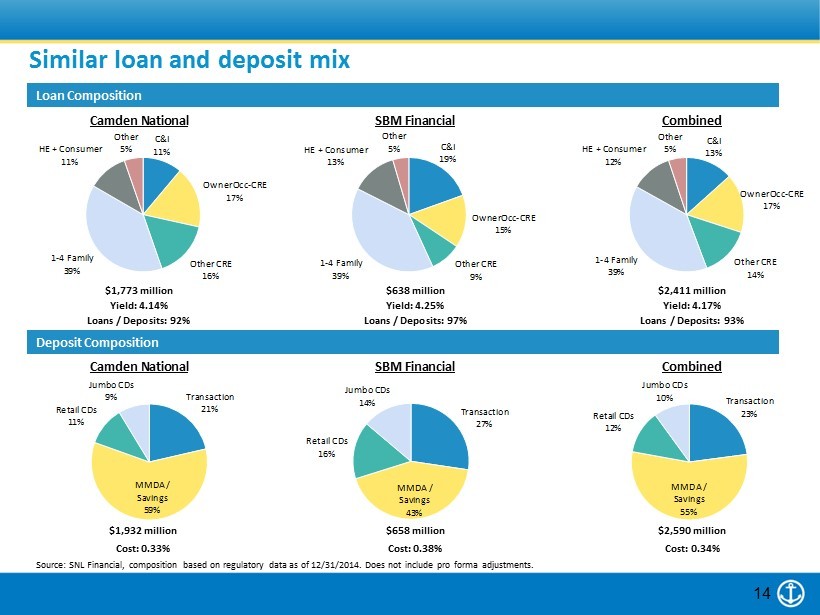
Transaction 21% MMDA / Savings 59% Retail CDs 11% Jumbo CDs 9% Transaction 27% MMDA / Savings 43% Retail CDs 16% Jumbo CDs 14% Transaction 23% MMDA / Savings 55% Retail CDs 12% Jumbo CDs 10% C&I 11% OwnerOcc - CRE 17% Other CRE 16% 1 - 4 Family 39% HE + Consumer 11% Other 5% C&I 19% OwnerOcc - CRE 15% Other CRE 9% 1 - 4 Family 39% HE + Consumer 13% Other 5% C&I 13% OwnerOcc - CRE 17% Other CRE 14% 1 - 4 Family 39% HE + Consumer 12% Other 5% Source: SNL Financial, composition based on regulatory data as of 12/31/2014. Does not include pro forma adjustments. 14 Loan Composition Deposit Composition $1,773 million $638 million $2,411 million Yield: 4.14% Yield: 4.25% Yield: 4.17% Loans / Deposits: 92% Loans / Deposits: 97% Loans / Deposits: 93% Camden National SBM Financial Combined Camden National SBM Financial Combined $1,932 million $658 million $2,590 million Cost: 0.33% Cost: 0.38% Cost: 0.34% Similar loan and deposit mix

Source: SNL Financial. Deposit data as of June 2014. 15 Camden National (44 branches) SBM Financial (24 branches) 1 - mi overlap: 8 branches | 33% ($ in millions) Rank Institution DepositsBranches Market Share % 1 Toronto-Dominion Bank $3,170 50 13.3 2 KeyCorp 2,998 53 12.6 Camden + SBM 2,521 68 10.6 3 Bangor Bancorp MHC 2,116 59 8.9 4 Camden National Corp. 1,876 44 7.9 5 Bank of America Corp. 1,660 18 7.0 6 First Bancorp Inc. 1,034 16 4.3 7 Machias Bancorp MHC 908 17 3.8 8 People's United Financial 890 26 3.7 9 Bar Harbor Bankshares 838 16 3.5 10 Norway Bancorp MHC 810 24 3.4 11 Kennebunk SB 750 13 3.1 12 Gorham Bancorp MHC 689 11 2.9 13 SBM Financial Inc. 645 24 2.7 14 Androscoggin Bancorp 602 12 2.5 15 Northeast Bancorp 596 12 2.5 Branch Network and Deposit Market Share Augusta Brunswick Portland Kennebunk Bangor Camden

16