Attached files
| file | filename |
|---|---|
| 8-K - 8-K - RBC Bearings INC | v405578_8k.htm |
| EX-2.1 - EXHIBIT 2.1 - RBC Bearings INC | v405578_ex2-1.htm |
| EX-99.1 - EXHIBIT 99.1 - RBC Bearings INC | v405578_ex99-1.htm |
Exhibit 99.2
Acquisition of Sargent Aerospace & Defense Business from Dover Corporation March 27, 2015
1 Safe Harbor Statement © 2015 RBC Bearings Incorporated This document contains, or may be deemed to contain, “forward - looking statements” within the meaning of Section 27A of the Securities Act of 1933 and Section 21E of the Securities Exchange Act of 1934. All statements other than statements of historical fact are “forward - looking statements” for purposes of federal and state securities laws, including outlooks, projections of earnings, revenue or other financial items relating to the Company, any statement of the plans, strategies and objectives of management for future operations; any statements concerning proposed future growth rates in the markets we serve; any statements of belief; any characterization of and the Company’s ability to control contingent liabilities; anticipated trends in the Company’s businesses; and any statements of assumptions underlying any of the foregoing . Forward - looking statements may include the words “may,” “estimate,” “intend,” “continue,” “believe,” “expect,” “anticipate” and other similar words . Although the Company believes that the expectations reflected in any forward - looking statements are reasonable, actual results could differ materially from those projected or assumed in any of our forward - looking statements . Our future financial condition and results of operations, as well as any forward - looking statements, are subject to change and to inherent risks and uncertainties beyond the control of the Company . These risks and uncertainties include, but are not limited to, risks and uncertainties relating to general economic conditions, geopolitical factors, future levels of general industrial manufacturing activity, future financial performance, market acceptance of new or enhanced versions of the Company’s products, the pricing of raw materials, changes in the competitive environments in which the Company’s businesses operate, the outcome of pending or future litigation and governmental proceedings and approvals, estimated legal costs, increases in interest rates, the Company’s ability to meet its debt obligations, and risks and uncertainties listed or disclosed in the Company’s reports filed with the Securities and Exchange Commission, including, without limitation, the risks identified under the heading “Risk Factors” set forth in the Company’s Annual Report filed on Form 10 - K . The Company does not intend, and undertakes no obligation, to update or alter any forward - looking statement.
Dr. Michael J. Hartnett Chairman, President and Chief Executive Officer Daniel A. Bergeron Director, Vice President and Chief Financial Officer 2
3 Agenda for Today’s Investor Call • Overview of the Sargent Aerospace & Defense Transaction • Review of Transaction Financial Details and Impact • Discussion of Sargent’s Strategic Fit with RBC • Question and Answer Session
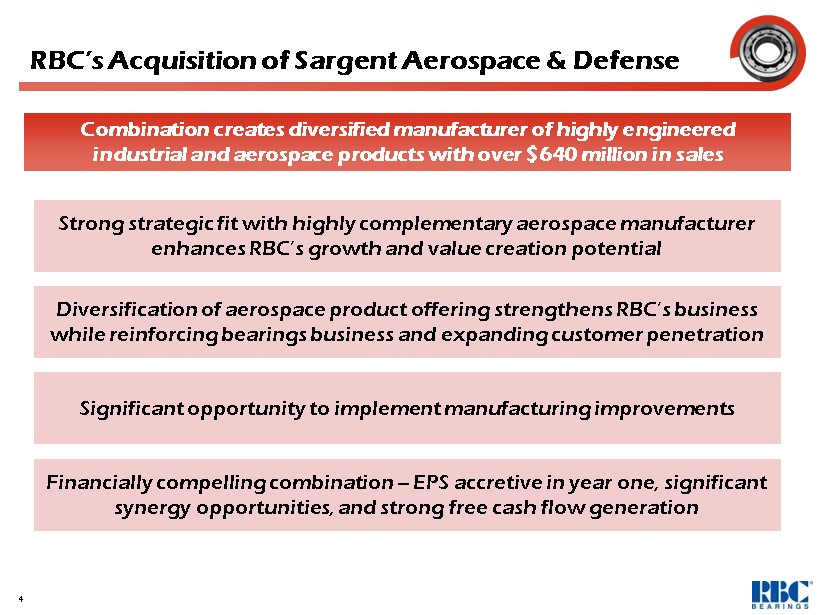
4 Diversification of aerospace product offering strengthens RBC’s business while reinforcing bearings business and expanding customer penetration Combination creates diversified manufacturer of highly engineered industrial and aerospace products with over $640 million in sales Strong strategic fit with highly complementary aerospace manufacturer enhances RBC’s growth and value creation potential Significant opportunity to implement manufacturing improvements Financially compelling combination – EPS accretive in year one, significant synergy opportunities, and strong free cash flow generation RBC’s Acquisition of Sargent Aerospace & Defense
5 Overview of the Sargent Aerospace & Defense Transaction
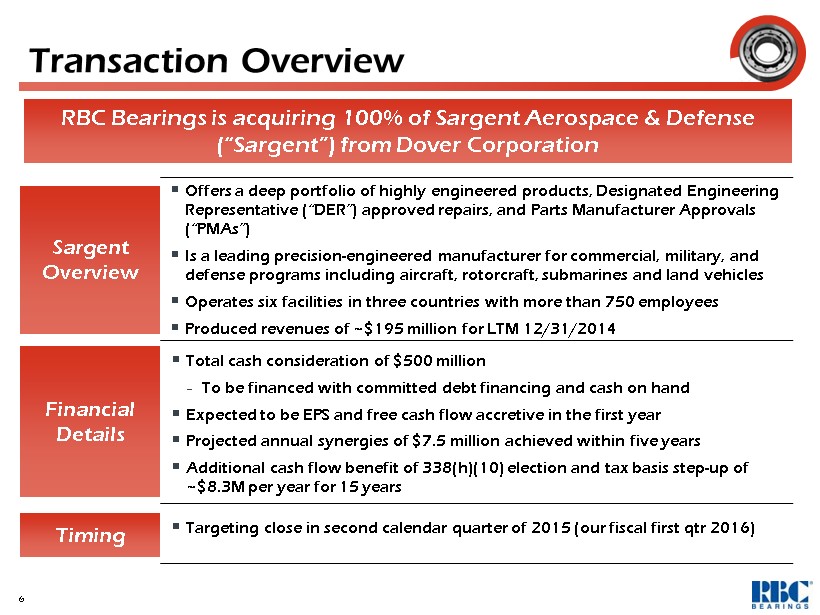
▪ Offers a deep portfolio of highly engineered products, Designated Engineering Representative (“DER”) approved repairs, and Parts Manufacturer Approvals (“PMAs”) ▪ Is a leading precision - engineered manufacturer for commercial, military, and defense programs including aircraft, rotorcraft, submarines and land vehicles ▪ Operates six facilities in three countries with more than 750 employees ▪ Produced revenues of ~ $195 million for LTM 12/31/2014 Sargent Overview ▪ Total cash consideration of $500 million − To be financed with committed debt financing and cash on hand ▪ Expected to be EPS and free cash flow accretive in the first year ▪ Projected annual synergies of $7.5 million achieved within five years ▪ Additional cash flow benefit of 338(h)(10) election and tax basis step - up of ~$8.3M per year for 15 years Financial Details ▪ Targeting close in second calendar quarter of 2015 (our fiscal first qtr 2016) Timing 6 RBC Bearings is acquiring 100% of Sargent Aerospace & Defense (“Sargent”) from Dover Corporation Transaction Overview
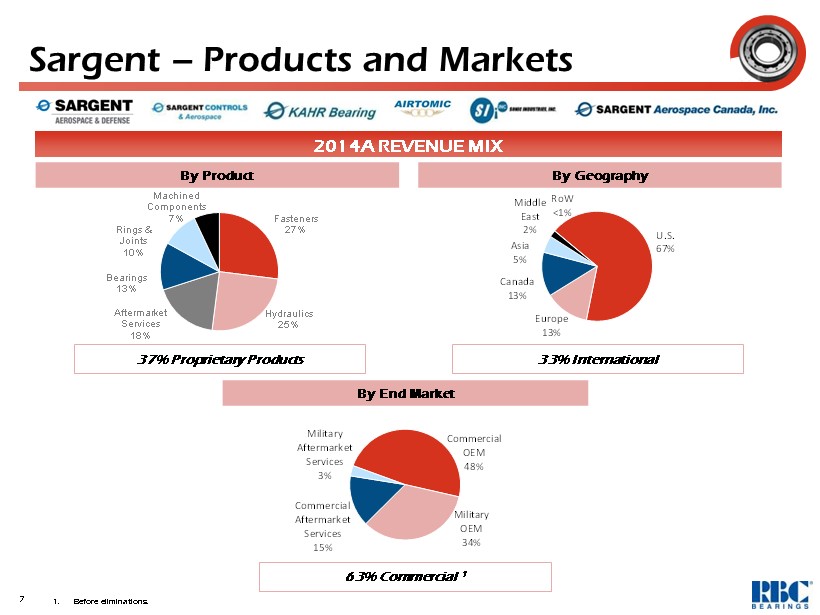
Fasteners 27% Hydraulics 25% Aftermarket Services 18% Bearings 13% Rings & Joints 10% Machined Components 7% 7 By Product 63% Commercial 1 37% Proprietary Products 33% International 2014A REVENUE MIX Sargent – Products and Markets By End Market By Geography 1. Before eliminations. Military OEM 34% Commercial Aftermarket Services 15% Military Aftermarket Services 3% Commercial OEM 48% U.S. 67% Europe 13% Canada 13% Asia 5% Middle East 2% RoW <1%
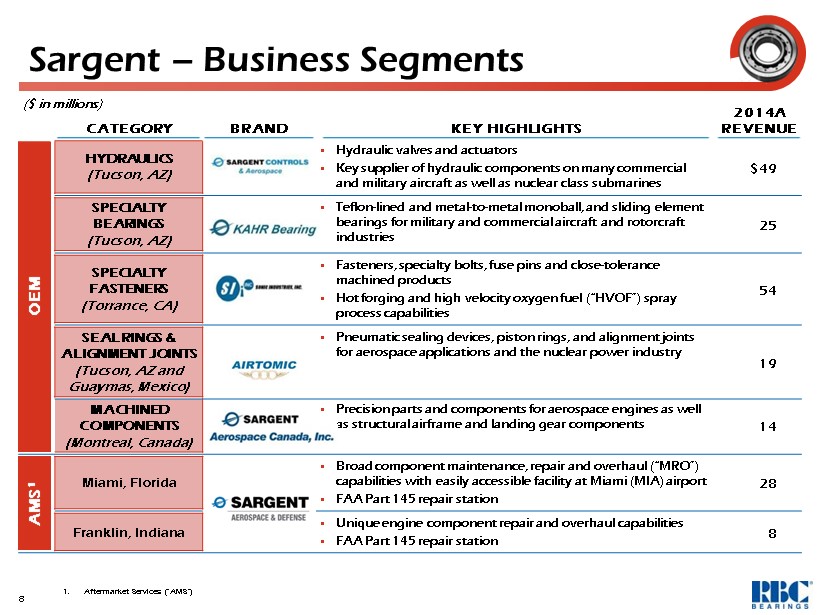
8 CATEGORY BRAND KEY HIGHLIGHTS 2014A REVENUE OEM HYDRAULICS (Tucson, AZ) ▪ Hydraulic valves and actuators ▪ Key supplier of hydraulic components on many commercial and military aircraft as well as nuclear class submarines $49 SPECIALTY BEARINGS (Tucson, AZ) ▪ Teflon - lined and metal - to - metal monoball , and sliding element bearings for military and commercial aircraft and rotorcraft industries 25 SPECIALTY FASTENERS (Torrance, CA) ▪ Fasteners, specialty bolts, fuse pins and close - tolerance machined products ▪ Hot forging and high velocity oxygen fuel (“HVOF”) spray process capabilities 54 SEAL RINGS & ALIGNMENT JOINTS (Tucson, AZ and Guaymas , Mexico ) ▪ Pneumatic sealing devices, piston rings, and alignment joints for aerospace applications and the nuclear power industry 19 MACHINED COMPONENTS (Montreal, Canada) ▪ Precision parts and components for aerospace engines as well as structural airframe and landing gear components 14 AMS 1 Miami, Florida ▪ Broad component maintenance, repair and overhaul (“MRO”) capabilities with easily accessible facility at Miami (MIA) airport ▪ FAA Part 145 repair station 28 Franklin, Indiana ▪ Unique engine component repair and overhaul capabilities ▪ FAA Part 145 repair station 8 Sargent – Business Segments ($ in millions) 1. Aftermarket Services (“ AMS ”)

9 Financial Details and Impact
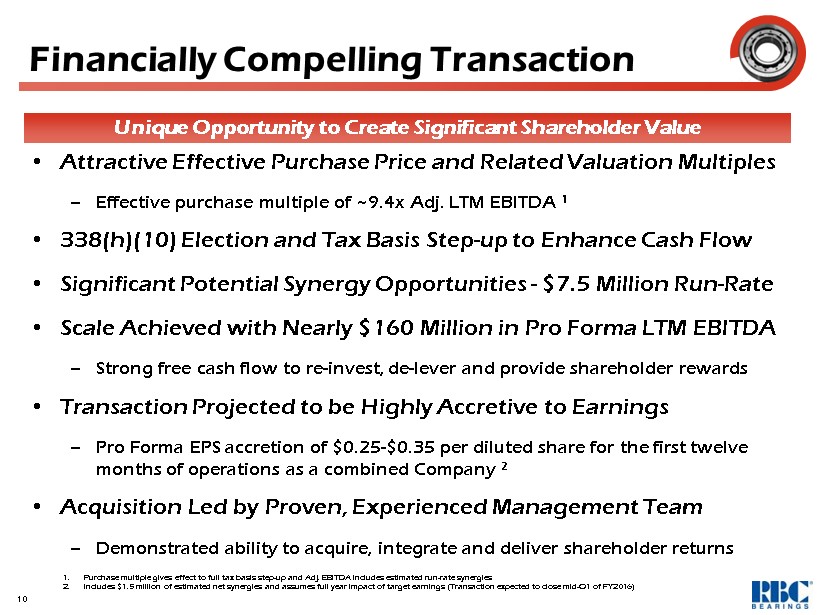
10 • Attractive Effective Purchase Price and Related Valuation Multiples – Effective purchase multiple of ~9.4x Adj. LTM EBITDA 1 • 338(h)(10) Election and Tax Basis Step - up to Enhance Cash Flow • Significant Potential Synergy Opportunities - $7.5 Million Run - Rate • Scale Achieved with Nearly $160 Million in Pro Forma LTM EBITDA – Strong free cash flow to re - invest, de - lever and provide shareholder rewards • Transaction Projected to be Highly Accretive to Earnings – Pro Forma EPS accretion of $0.25 - $0.35 per diluted share for the first twelve months of operations as a combined Company 2 • Acquisition Led by Proven , Experienced Management Team – Demonstrated ability to acquire, integrate and deliver shareholder returns Unique Opportunity to Create Significant Shareholder Value 1. Purchase multiple gives effect to full tax basis step - up and Adj. EBITDA includes estimated run - rate synergies 2. Includes $1.5 million of estimated net synergies and assumes full year impact of target earnings (Transaction expected to close mid - Q1 of FY2016) Financially Compelling Transaction
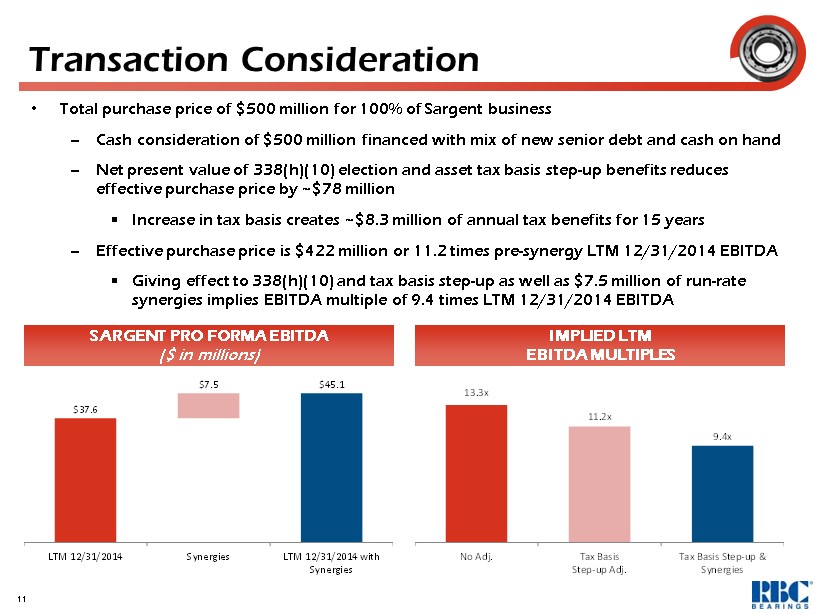
Transaction Consideration • Total purchase price of $500 million for 100% of Sargent business – Cash consideration of $500 million financed with mix of new senior debt and cash on hand – Net present value of 338(h )(10) election and asset tax basis step - up benefits reduces effective purchase price by ~$ 78 million ▪ Increase in tax basis creates ~$8.3 million of annual tax benefits for 15 years – Effective purchase price is $422 million or 11.2 times pre - synergy LTM 12/31/2014 EBITDA ▪ Giving effect to 338(h)(10) and tax basis step - up as well as $7.5 million of run - rate synergies implies EBITDA multiple of 9.4 times LTM 12/31/2014 EBITDA SARGENT PRO FORMA EBITDA ($ in millions) IMPLIED LTM EBITDA MULTIPLES 11 $37.6 $7.5 $45.1 LTM 12/31/2014 Synergies LTM 12/31/2014 with Synergies 13.3x 11.2x 9.4x No Adj. Tax Basis Step-up Adj. Tax Basis Step-up & Synergies
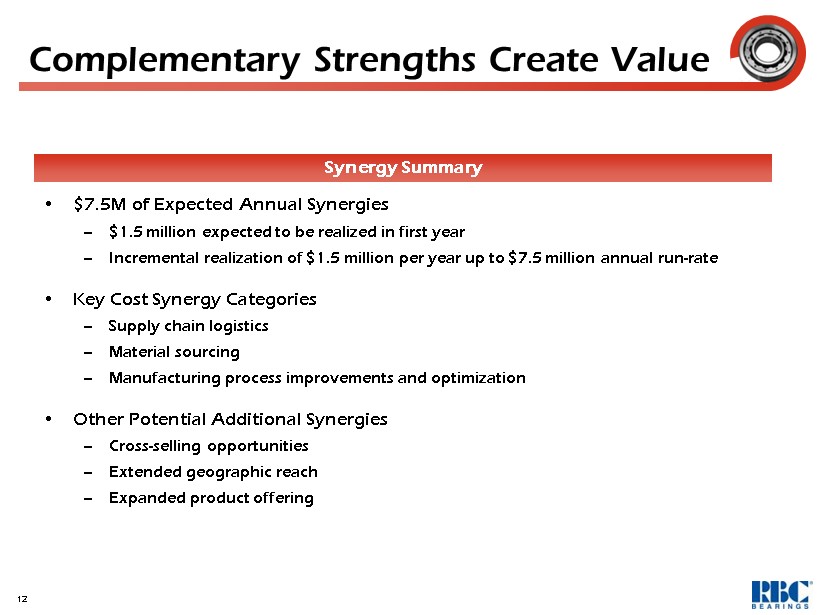
Complementary Strengths Create Value 12 • $7.5M of Expected Annual Synergies – $1.5 million expected to be realized in first year – Incremental realization of $1.5 million per year up to $7.5 million annual run - rate • Key Cost Synergy Categories – Supply chain logistics – Material sourcing – Manufacturing process improvements and optimization • Other Potential Additional Synergies – Cross - selling opportunities – Extended geographic reach – Expanded product offering Synergy Summary
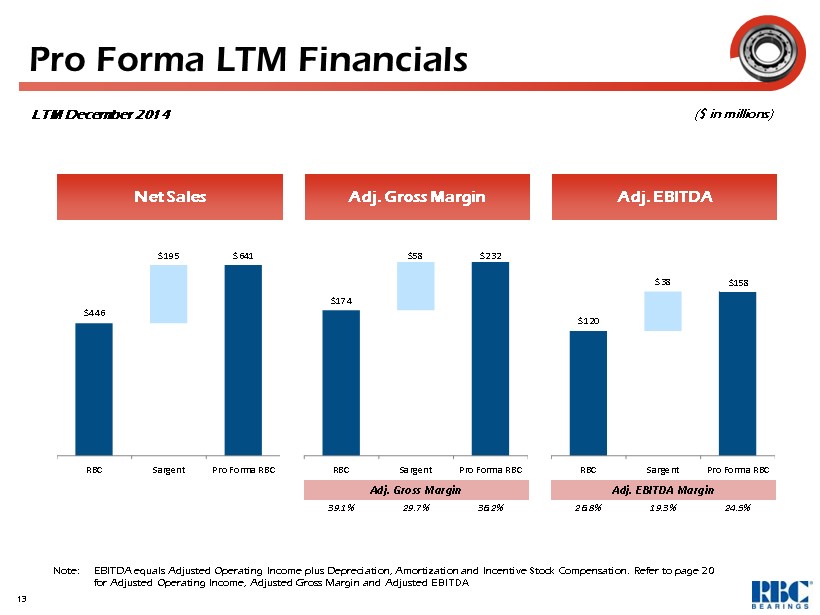
13 Pro Forma LTM Financials Note: EBITDA equals Adjusted Operating Income plus Depreciation, Amortization and Incentive Stock Compensation. Refer to page 20 for Adjusted Operating Income, Adjusted Gross Margin and Adjusted EBITDA ($ in millions) LTM December 2014 Adj. Gross Margin Adj. EBITDA Net Sales Adj. Gross Margin Adj. EBITDA Margin 39.1% 29.7% 36.2% 26.8% 19.3% 24.5% $446 $195 $641 RBC Sargent Pro Forma RBC $174 $58 $232 RBC Sargent Pro Forma RBC $120 $38 $157 RBC Sargent Pro Forma RBC $158
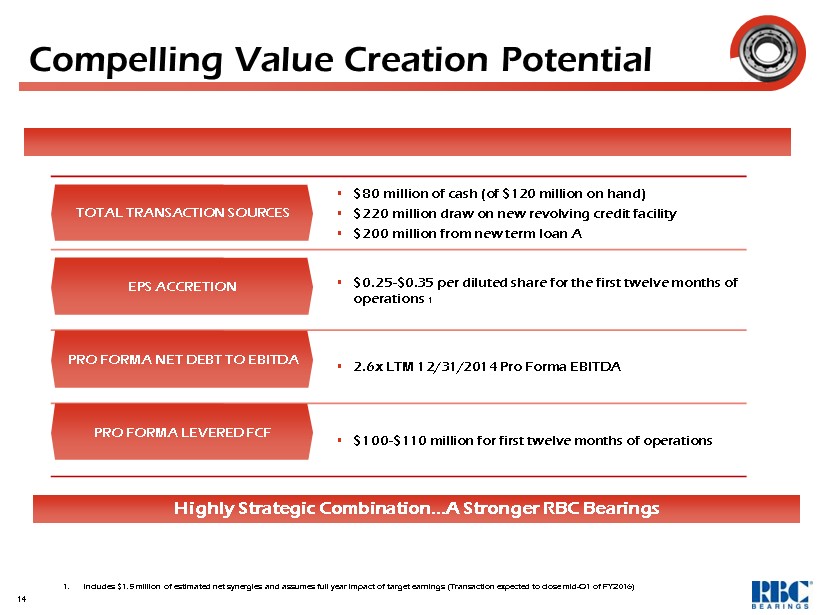
▪ $ 80 million of cash (of $120 million on hand) ▪ $220 million draw on new revolving credit facility ▪ $200 million from new term loan A ▪ $0.25 - $0.35 per diluted share for the first twelve months of operations 1 ▪ 2.6x LTM 12/31/2014 Pro Forma EBITDA ▪ $100 - $110 million for first twelve months of operations Compelling Value Creation Potential 14 TOTAL TRANSACTION SOURCES EPS ACCRETION PRO FORMA NET DEBT TO EBITDA PRO FORMA LEVERED FCF Highly Strategic Combination…A Stronger RBC Bearings 1. Includes $1.5 million of estimated net synergies and assumes full year impact of target earnings (Transaction expected to clo se mid - Q1 of FY2016)
15 Strategic Fit
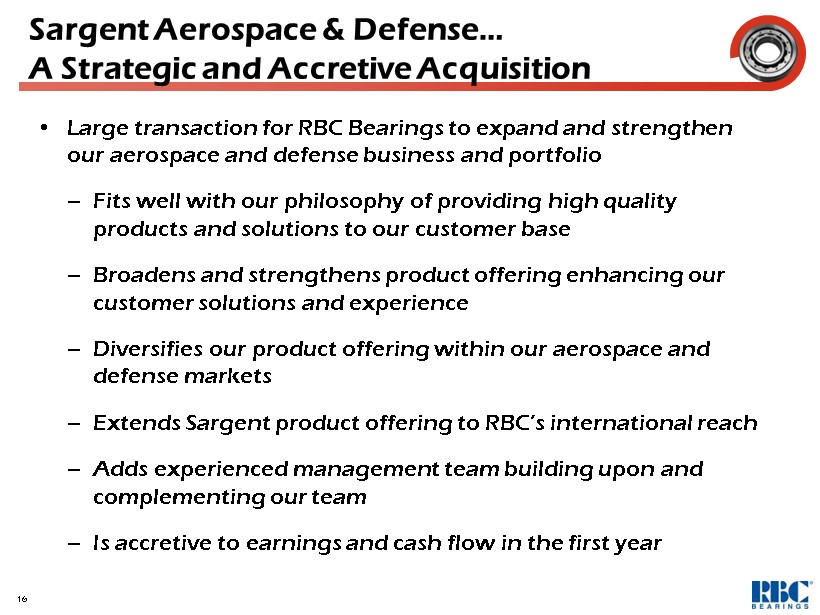
• Large transaction for RBC Bearings to expand and strengthen our aerospace and defense business and portfolio – Fits well with our philosophy of providing high quality products and solutions to our customer base – Broadens and strengthens product offering enhancing our customer solutions and experience – Diversifies our product offering within our aerospace and defense markets – Extends Sargent product offering to RBC’s international reach – Adds experienced management team building upon and complementing our team – Is accretive to earnings and cash flow in the first year 16 Sargent Aerospace & Defense… A Strategic and Accretive Acquisition
17 Q&A Session
18 Appendix
19 Non - GAAP Financial Measures In addition to disclosing results of operations that are determined in accordance with generally accepted accounting principles (“GAAP”), this document also discloses non - GAAP results of operations that exclude certain charges . These non - GAAP measures adjust for charges that Management believes are unusual. Management believes that the presentation of these non - GAAP measures provides useful information to investors regarding the Company’s results of operations, as these non - GAAP measures allow investors to better evaluate ongoing business performance . Investors should consider non - GAAP measures in addition to, not as a substitute for, financial measures prepared in accordance with GAAP . Reconciliations of the non - GAAP measures disclosed in this document with the most comparable GAAP measures are included in this Appendix and can be found on the Company’s website at www.rbcbearings.com.
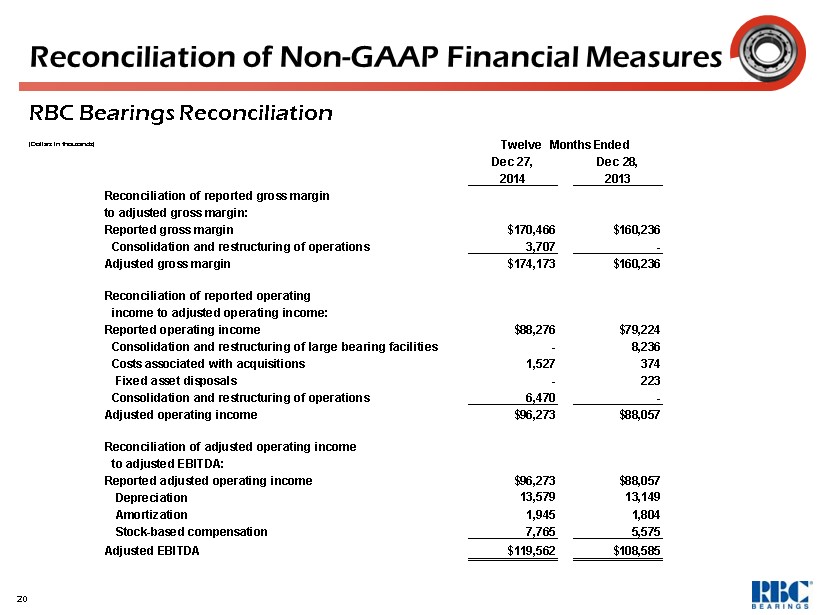
20 Reconciliation of Non - GAAP Financial Measures Dec 27, Dec 28, 2014 2013 Reconciliation of reported gross margin to adjusted gross margin: Reported gross margin $170,466 $160,236 Consolidation and restructuring of operations 3,707 - Adjusted gross margin $174,173 $160,236 Reconciliation of reported operating income to adjusted operating income: Reported operating income $88,276 $79,224 Consolidation and restructuring of large bearing facilities - 8,236 Costs associated with acquisitions 1,527 374 Fixed asset disposals - 223 Consolidation and restructuring of operations 6,470 - Adjusted operating income $96,273 $88,057 Reconciliation of adjusted operating income to adjusted EBITDA: Reported adjusted operating income $96,273 $88,057 Depreciation 13,579 13,149 Amortization 1,945 1,804 Stock-based compensation 7,765 5,575 Adjusted EBITDA $119,562 $108,585 Twelve Months Ended RBC Bearings Reconciliation (Dollars in thousands)