Attached files
| file | filename |
|---|---|
| EX-23 - EXHIBIT 23 - RBC Bearings INC | v439835_ex23.htm |
| EX-32.2 - EXHIBIT 32.2 - RBC Bearings INC | v439835_ex32-2.htm |
| EX-32.1 - EXHIBIT 32.1 - RBC Bearings INC | v439835_ex32-1.htm |
| EX-31.2 - EXHIBIT 31.2 - RBC Bearings INC | v439835_ex31-2.htm |
| EX-31.1 - EXHIBIT 31.1 - RBC Bearings INC | v439835_ex31-1.htm |
| EX-21 - EXHIBIT 21 - RBC Bearings INC | v439835_ex21.htm |
UNITED STATES
SECURITIES AND EXCHANGE COMMISSION
Washington, DC 20549
FORM 10-K
(Mark One)
| þ | ANNUAL REPORT PURSUANT TO SECTION 13 OR 15(d) OF THE SECURITIES AND EXCHANGE ACT OF 1934 |
For the fiscal year ended April 2, 2016
| ¨ | TRANSITION REPORT PURSUANT TO SECTION 13 OR 15(d) OF THE SECURITIES EXCHANGE ACT OF 1934 |
For the transition period from __________to _________
Commission file number 333-124824
RBC BEARINGS INCORPORATED
(Exact name of registrant as specified in its charter)
|
Delaware (State or other jurisdiction of incorporation or organization) |
95-4372080 (I.R.S. Employer Identification No.) | |
|
One Tribology Center, Oxford, CT (Address of principal executive offices) |
06478 (Zip Code) |
(203) 267-7001
(Registrant’s telephone number, including area code)
Securities registered pursuant to Section 12(b) of the Act: None
Securities registered pursuant to Section 12(g) of the Act:
Class A Common Stock, Par Value $0.01 per Share
(Title of class)
Indicate by check mark if the registrant is a well-known seasoned issuer, as defined in Rule 405 of the Securities Act. Yes þ No ¨
Indicate by check mark if the registrant is not required to file reports pursuant to Section 13 or Section 15(d) of the Act. Yes ¨ No þ
Indicate by check mark whether the registrant: (1) has filed all reports required to be filed by Section 13 or Section 15(d) of the Securities Exchange Act of 1934 during the preceding 12 months (or for such shorter period that the registrant was required to file such reports), and (2) has been subject to such filing requirements for the past 90 days. Yes þ No ¨
Indicate by check mark whether the registrant has submitted electronically and posted on its corporate Web site, if any, every Interactive Data File required to be submitted and posted pursuant to Rule 405 of Regulation S-T during the preceding 12 months (or for such shorter period that the registrant was required to submit and post such files). Yes þ No ¨
Indicate by check mark if disclosure of delinquent filers pursuant to Item 405 of Regulation S-K is not contained herein, and will not be contained, to the best of registrant’s knowledge, in definitive proxy or information statements incorporated by reference in Part III of this Form 10-K or any amendment to this Form 10-K. ¨
Indicate by check mark whether the registrant is a large accelerated filer, an accelerated filer, a non-accelerated filer or a smaller reporting company. See the definitions of “large accelerated filer,” “accelerated filer” and “smaller reporting company” in Rule 12b-2 of the Exchange Act. (Check one):
| Large accelerated filer þ | Accelerated filer ¨ | Non-accelerated filer ¨ (Do not check if a smaller reporting company) | |
| Smaller reporting company ¨ |
Indicate by check mark whether the registrant is a shell company (as defined in Rule 12b-2 of the Exchange Act). Yes ¨ No þ
The aggregate market value of the registrant’s Class A Common Stock held by non-affiliates of the registrant on September 26, 2015 (based on the September 25, 2015 closing sales price of $58.50 of the registrant’s Class A Common Stock, as reported by the Nasdaq National Market) was approximately $1,370,643,300.
Number of shares outstanding of the registrant’s Class A Common Stock at May 18, 2016:
23,541,972 Shares of Class A Common Stock, par value $0.01 per share.
Documents Incorporated by Reference:
Portions of the registrant’s proxy statement to be filed within 120 days of the close of the registrant’s fiscal year in connection with the registrant’s Annual Meeting of Shareholders to be held September 12, 2016 are incorporated by reference into Part III of this Form 10-K.
TABLE OF CONTENTS
RBC Bearings Incorporated
We are an international manufacturer and marketer of highly engineered precision bearings and products, which are integral to the manufacture and operation of most machines, aircraft and mechanical systems, to reduce wear to moving parts, facilitate proper power transmission, reduce damage and energy loss caused by friction and control pressure and flow. While we manufacture products in all major categories, we focus primarily on highly technical or regulated bearing products and engineered products for specialized markets that require sophisticated design, testing and manufacturing capabilities. We believe our unique expertise has enabled us to garner leading positions in many of the product markets in which we primarily compete. Over the past fifteen years, we have broadened our end markets, products, customer base and geographic reach. We currently have 37 facilities of which 33 are manufacturing facilities in five countries.
The Bearing and Engineered Products Industry
The bearing and engineered products industry is a fragmented multi-billion dollar market. Purchasers of bearings and engineered products include producers of commercial and military aircraft, submarine and vehicle equipment, oil and gas equipment and machinery manufacturers, industrial equipment and machinery manufacturers, construction machinery manufacturers and rail and train equipment manufacturers, mining and specialized equipment manufacturers.
Demand for bearings and precision components in the diversified industrial market are influenced by growth factors in industrial machinery and equipment shipments and construction, mining, energy and general industrial activity. In addition, usage of existing machinery will impact aftermarket demand for replacement products. In the aerospace market, aging of the existing commercial aircraft fleet, new aircraft build rates along with carrier traffic growth worldwide determines demand for our solutions. Lastly, activity in the defense market is being influenced by modernization programs necessitating spending on new equipment, as well as continued utilization of deployed equipment supporting aftermarket demand for replacement bearings and engineered products.
Customers and Markets
We serve a broad range of end markets where we can add value with our specialty, precision bearing and engineered products, components, and applications. We classify our customers into two principal categories: industrial and aerospace. These principal end markets utilize a large number of both commercial and specialized bearings and engineered products. Although we provide a relatively small percentage of total bearing and engineered products supplied to each of our overall principal markets, we believe we have leading market positions in many of the specialized product markets in which we primarily compete and serve. Financial information regarding geographic areas is set forth in Part II, Item 8. “Financial Statements and Supplementary Data,” Note 18 “Reportable Segments.”
| · | Industrial Market (34% of net sales for the fiscal year ended April 2, 2016) |
We manufacture bearings and engineered products for a wide range of diversified industrial markets, including construction and mining, oil and natural resource extraction, heavy truck, marine, rail and train, packaging, semiconductor machinery and the general industrial markets. Our products target market applications in which our engineering and manufacturing capabilities provide us with a competitive advantage in the marketplace.
Our largest industrial customers include Caterpillar, Halliburton, Komatsu America, National Oilwell Varco, Newport News Shipbuilding and various aftermarket distributors including Applied Industrial, BDI Corporation, Kaman Corporation, McMaster Carr and Motion Industries. We believe that the diversification of our sales among the various segments of the industrial markets reduces our exposure to downturns in any one individual market. We believe opportunities exist for growth and margin improvement in this market as a result of the introduction of new products, the expansion of aftermarket sales and continued manufacturing process improvements.
| · | Aerospace Market (66% of net sales for the fiscal year ended April 2, 2016) |
We supply bearings and engineered products for use in commercial, private and military aircraft and aircraft engines, guided weaponry, and vision and optical systems. We supply precision products for many of the commercial aircraft currently operating worldwide and are their primary supplier for many of their product lines. This includes military contractors for airplanes, helicopters, missile systems, engines and satellites. Commercial aerospace customers generally require precision products, often of special materials, made to unique designs and specifications. Many of our aerospace bearing products are designed and certified during the original development of the aircraft being served, which often makes us the primary bearing supplier for the life of the aircraft.
| 1 |
We manufacture bearings and engineered products used by the U.S. Department of Defense and certain foreign governments for use in fighter jets, troop transports, naval vessels, helicopters, gas turbine engines, armored vehicles, guided weaponry and satellites. We manufacture an extensive line of standard products that conform to many domestic military application requirements, as well as customized products designed for unique applications. Our bearings and engineered products are manufactured to conform to U.S. military specifications and are typically custom designed during the original product design phase, which often makes us the sole or primary supplier for the life of the product. In addition to products that meet military specifications, these customers often require precision products made of specialized materials to custom designs and specifications. Product approval for use on military equipment is often a lengthy process ranging from six months to six years.
Our largest aerospace customers include Airbus, Boeing, General Electric, Lockheed Martin, Safran, U.S. Department of Defense and various aftermarket distributors including National Precision Bearing, Wencor Group and Wesco Aircraft. We believe our strong relationships with OEMs help drive our aftermarket sales since a portion of OEM sales are ultimately intended for use as replacement parts. We believe that growth and margin expansion in this market will be driven primarily by expanding our international presence, new commercial aircraft introductions, new products, and the refurbishment and maintenance of existing commercial and military aircraft.
In fiscal 2016, 4.0% of our net sales were made directly, and we estimate that approximately an additional 18.0% of our net sales were made indirectly, to the U.S. government. These contracts or subcontracts may be subject to renegotiation of profit or termination of contracts at the election of the government. We, based on experience, believe that no material renegotiations or refunds will be required. See Part I, Item 1A. “Risk Factors – Future reductions or changes in U.S. government spending could negatively affect our business.”
Products
Bearings and engineered products are employed to fulfill several functions including reduction of friction, transfer of motion and carriage of loads, and control of pressure and flows. We design, manufacture and market a broad portfolio of bearings and engineered products. We operate through operating segments for which separate financial information is available, and for which operating results are evaluated regularly by our chief operating decision maker in determining resource allocation and assessing performance. Those operating segments with similar economic characteristics and that meet all other required criteria, including nature of the products and production processes, distribution patterns and classes of customers, are aggregated as reportable segments.
The following table provides a summary of our four reportable product segments: Plain Bearings; Roller Bearings; Ball Bearings; and Engineered Products.
| Net Sales for the Fiscal Year Ended | ||||||||||||||
| Segment | April 2, 2016 | March 28, 2015 | March 29, 2014 | Representative Applications | ||||||||||
| Plain Bearings | $ | 270,534 | $ | 230,168 | $ | 223,099 | · Aircraft engine controls and landing gear | |||||||
| (45.3 | )% | (51.7 | )% | (53.3 | )% | · Missile launchers | ||||||||
| · Mining, energy, and construction equipment | ||||||||||||||
| Roller Bearings | $ | 112,039 | $ | 128,702 | $ | 115,806 | · Aircraft hydraulics | |||||||
| (18.8 | )% | (28.9 | )% | (27.6 | )% | · Military and commercial truck chassis | ||||||||
| · Packaging machinery and gear pumps | ||||||||||||||
| Ball Bearings | $ | 53,650 | $ | 56,464 | $ | 49,555 | · Radar and night vision systems | |||||||
| (8.9 | )% | (12.7 | )% | (11.8 | )% | · Airframe control and actuation | ||||||||
| · Semiconductor equipment | ||||||||||||||
| Engineered Products | $ | 161,249 | $ | 29,944 | $ | 30,426 | · Hydraulics, valves and fasteners | |||||||
| (27.0 | )% | (6.7 | )% | (7.3 | )% | · Industrial gears, components and collets | ||||||||
| 2 |
Plain Bearings. Plain bearings are primarily used to rectify inevitable misalignments in various mechanical components, such as aircraft controls, helicopter rotors, or in heavy mining and construction equipment. Such misalignments are either due to machining inaccuracies or result when components change position relative to each other. Plain bearings are produced with either self-lubricating or metal-to-metal designs and consist of several sub-classes, including rod end bearings, spherical plain bearings and journal bearings.
Roller Bearings. Roller bearings are anti-friction products that utilize cylindrical rolling elements. We produce three main designs: tapered roller bearings, needle roller bearings and needle bearing track rollers and cam followers. We produce medium sized tapered roller bearings used primarily in heavy truck axle applications. We offer several needle roller bearing designs that are used in both industrial applications and certain U.S. military aircraft platforms. These products are generally specified for use where there are high loads and the design is constrained by space considerations. A significant portion of the sales of this product is to the aftermarket. Needle bearing track rollers and cam followers have wide and diversified use in the industrial market and are often prescribed as a primary component in articulated aircraft wings. We believe we are the world's largest producer of aircraft needle bearing track rollers.
Ball Bearings. Ball bearings are devices which utilize high precision ball elements to reduce friction in high speed applications. We specialize in four main types of ball bearings: high precision aerospace, airframe control, thin section and industrial ball bearings. High precision aerospace bearings are primarily sold to customers in the defense industry that require more technically sophisticated bearing products, such as missile guidance systems, providing higher degrees of fault tolerance given the criticality of the applications in which they are used. Airframe control ball bearings are precision ball bearings that are plated to resist corrosion and are qualified under a military specification. Thin section ball bearings are specialized bearings that use extremely thin cross sections and give specialized machinery manufacturers many advantages. We produce a general line of industrial ball bearings sold primarily to the aftermarket.
Engineered Products. Engineered Products consist primarily of highly engineered hydraulics and valves, fasteners, precision mechanical components and machine tool collets. Engineered hydraulics and valves are used in aircraft and submarine applications and aerospace and defense aftermarket services. Precision mechanical components are used in all general industrial applications, where some form of movement is required. Machine tool collets are cone-shaped metal sleeves, used for holding circular or rod like pieces in a lathe or other machine that provide effective part holding and accurate part location during machining operations.
Product Design and Development
We produce specialized bearings and engineered products that are often tailored to the specifications of a customer or application. Our sales professionals are highly experienced engineers who collaborate with our customers on a continual basis to develop bearing and engineered product solutions. The product development cycle can follow many paths which are dependent on the end market or sales channel. The process normally takes between 3-6 years from concept to sale depending upon the application and the market. A common route that is used for major OEM projects begins when our design engineers meet with their customer counterparts at the machine design conceptualization stage and work with them through the conclusion of the product development.
Often, at the early stage, a bearing design or engineered product concept is produced that addresses the expected demands of the application. Environmental demands are many but normally include load, stress, heat, thermal gradients, vibration, lubricant supply, pressure and flows, and corrosion resistance, with one or two of these environmental constraints being predominant in the design consideration. A bearing or engineered product design must perform reliably for a period of time specified by the customer's product objectives.
Once a bearing or engineered product is designed, a mathematical simulation is created to replicate the expected application environment and thereby allow optimization with respect to these design variables. Upon conclusion of the design and simulation phase, samples are produced and laboratory testing commences at one of our test laboratories. The purpose of this testing phase is not only to verify the design and the simulation model but also to allow further design improvement where needed. Finally, upon successful field testing by the customer, the product is ready for sale.
| 3 |
For the majority of our products, the culmination of this lengthy process is the receipt of a product approval or certification, generally obtained from either the OEM, the Department of Defense or the Federal Aviation Administration, or “FAA,” which allows us to supply the product to the customer and to the aftermarket. We currently have in excess of 71,600 of such approvals, which often gives us a competitive advantage, and in many of these instances we are the only approved supplier of a given bearing or engineered product.
Manufacturing and Operations
Our manufacturing strategies are focused on product reliability, quality and service. Custom and standard products are produced according to manufacturing schedules that ensure maximum availability of popular items for immediate sale while carefully considering the economies of lot production and special products. Capital programs and manufacturing methods development are focused on quality improvement, production costs and service. A monthly review of product line production performance assures an environment of continuous attainment of profitability and quality goals.
Capacity. Our plants currently run on a full first shift with second and third shifts at selected locations to meet the demands of our customers. We believe that current capacity levels and future annual estimated capital expenditures on equipment up to approximately 3.5% of net sales should permit us to effectively meet demand levels for the foreseeable future.
Inventory Management. Our increasing emphasis on OEM service and the distributor/aftermarket sector has required us to maintain greater inventories of a broader range of products than the OEM market historically demanded. This requires a greater investment in working capital to maintain these levels. We operate an inventory management program designed to balance customer delivery requirements with economically optimal inventory levels. In this program, each product is categorized based on characteristics including order frequency, number of customers and sales volume. Using this classification system, our primary goal is to maintain a sufficient supply of standard items while minimizing costs. In addition, production cost savings are achieved by optimizing plant scheduling around inventory levels and customer delivery requirements. This leads to more efficient utilization of manufacturing facilities and minimizes plant production changes while maintaining sufficient inventories to service customer needs.
Sales, Marketing and Distribution
Our marketing strategy is aimed at increasing sales within our two primary markets, targeting specific applications in which we can exploit our competitive strengths. To affect this strategy, we seek to expand into geographic areas not previously served by us and we continue to capitalize on new markets and industries for existing and new products. We employ a technically proficient sales force and utilize marketing managers, product managers, customer service representatives and product application engineers in our selling efforts.
We have developed our sales force through the hiring of sales personnel with prior industry experience, complemented by an in-house training program. We intend to continue to hire and develop expert sales professionals and strategically locate them to implement our expansion strategy. Today, our direct sales force is located to service North America, Europe, Asia and Latin America and is responsible for selling all of our products. This selling model leverages our relationship with key customers and provides opportunities to market multiple product lines to both established and potential customers. We also sell our products through a well-established, global network of industrial and aerospace distributors. This channel primarily provides our products to smaller OEM customers and the end users of bearings and engineered products that require local inventory and service. Our worldwide distributor network provides our customers with more than 4,600 points of sale for our products. We intend to continue to focus on building distributor sales volume.
The sale of our products is supported by a well-trained and experienced customer service organization. This organization provides customers with instant access to key information regarding their purchase and delivery requirements. We also provide customers with updated information through our website, and we have developed on-line integration with specific customers, enabling more efficient ordering and timely order fulfillment for those customers.
We store product inventory in warehouses located in the Midwest, Southwest and on the East and West coasts of the U.S. as well as in France and Switzerland. The inventory is located in these locations based on analysis of customer demand to provide superior service and product availability.
Competition
Our principal competitors include SKF, New Hampshire Ball Bearings, Rexnord, PCC, Arkwin and Timken, although we compete with different companies for each of our product lines. We believe that for the majority of our products, the principal competitive factors affecting our business are product qualifications, product line breadth, service, quality and price. Although some of our current and potential competitors may have greater financial, marketing, personnel and other resources than us, we believe that we are well positioned to compete with regard to each of these factors in each of the markets in which we operate.
| 4 |
Product Qualifications. Many of the products we produce are qualified for the application by the OEM, the U.S. Department of Defense, the FAA or a combination of these agencies. These credentials have been achieved for thousands of distinct items after years of design, testing and improvement. In many cases patent protection presides, in most cases there is strong brand identity and in numerous cases we have the exclusive product for the application.
Product Line Breadth. Our products encompass an extraordinarily broad range of designs which often create a critical mass of complementary bearings and engineered products for our markets. This position allows many of our industrial and aerospace customers the ability for a single manufacturer to provide the engineering service and product breadth needed to achieve a series of OEM design objectives and/or aftermarket requirements. This ability enhances our value to the OEM considerably while strengthening our overall market position.
Service. Product design, performance, reliability, availability, quality and technical and administrative support are elements that define the service standard for this business. Our customers are sophisticated and demanding, as our products are fundamental and enabling components to the construction or operation of their machinery. We maintain inventory levels of our most popular items for immediate sale and service. Our customers have high expectations regarding product availability and quality, and the primary emphasis of our service efforts is to ensure the widest possible range of available products and delivering them on a timely basis.
Price. We believe our products are priced competitively in the markets we serve. We continually evaluate our manufacturing and other operations to maximize efficiencies in order to reduce costs, eliminate unprofitable products from our portfolio and maximize our profit margins. We invest considerable effort to develop our price to value algorithms and we price to market levels where required by competitive pressures.
Suppliers and Raw Materials
We obtain raw materials, component parts and supplies from a variety of sources and generally from more than one supplier. Our principal raw material is steel. Our suppliers and sources of raw materials are based in the U.S., Europe and Asia. We purchase steel at market prices, which fluctuate as a result of supply and demand driven by economic conditions in the marketplace. For further discussion of the possible effects of changes in the cost of raw materials on our business, see Part I, Item 1A. “Risk Factors” in this Annual Report on Form 10-K.
Backlog
As of April 2, 2016, we had order backlog of $346.4 million compared to a backlog of $209.6 million in the prior fiscal year. The amount of backlog includes orders which we estimate will be fulfilled within the next 12 months; however, orders included in our backlog are subject to cancellation, delay or other modifications by our customers prior to fulfillment. We sell many of our products pursuant to contractual agreements, single source relationships or long-term purchase orders, each of which may permit early termination by the customer. However, due to the nature of many of the products supplied by us and the lack of availability of alternative suppliers to meet the demands of such customers' orders in a timely manner, we believe that it is not practical or prudent for most of our customers to shift their business to other suppliers.
Employees
We had 1,996 hourly employees and 1,281 salaried employees as of April 2, 2016, of whom 981 were employed in our international operations. As of April 2, 2016, 174 of our hourly employees were represented by unions in the U.S and 70 were represented by a union in Canada. We believe that our employee relations are satisfactory.
We are subject to four collective bargaining agreements covering substantially all of the hourly employees at our Fairfield, Connecticut, West Trenton, New Jersey, Plymouth, Indiana, and Montreal, Canada plants. These agreements expire on January 31, 2018, June 30, 2017, October 30, 2018, and June 23, 2018, respectively.
| 5 |
Intellectual Property
We own U.S. and foreign patents and trademark registrations and U.S. copyright registrations, and have U.S. trademark and patent applications pending. We currently have 205 issued or pending U.S. and foreign patents. We file patent applications and maintain patents to protect certain technology, inventions and improvements that are important to the development of our business, and we file trademark applications and maintain trademark registrations to protect product names that have achieved brand-name recognition among our customers. We also rely upon trade secrets, know-how and continuing technological innovation to develop and maintain our competitive position. Many of our brands are well recognized by our customers and are considered valuable assets of our business. We currently have 165 issued or pending U.S. and foreign trademark registrations and applications. We do not believe, however, that any individual item of intellectual property is material to our business.
Regulation
Product Approvals. Essential to servicing the aerospace and defense markets is the ability to obtain product approvals. We have a substantial number of product approvals in the form of OEM approvals or Parts Manufacturer Approvals, or “PMAs,” from the FAA. We also have a number of active PMA applications in process. These approvals enable us to provide products used in virtually all domestic aircraft platforms presently in production or operation.
We are subject to various other federal laws, regulations and standards. Although we are not presently aware of any pending legal or regulatory changes that may have a material impact on us, new laws, regulations or standards or changes to existing laws, regulations or standards could subject us to significant additional costs of compliance or liabilities, and could result in material reductions to our results of operations, cash flow or revenues.
Environmental Matters
We are subject to federal, state and local environmental laws and regulations, including those governing discharges of pollutants into the air and water, the storage, handling and disposal of wastes and the health and safety of employees. We also may be liable under the Comprehensive Environmental Response, Compensation, and Liability Act or similar state laws for the costs of investigation and clean-up of contamination at facilities currently or formerly owned or operated by us, or at other facilities at which we have disposed of hazardous substances. In connection with such contamination, we may also be liable for natural resource damages, government penalties and claims by third parties for personal injury and property damage. Agencies responsible for enforcing these laws have authority to impose significant civil or criminal penalties for non-compliance. We believe we are currently in material compliance with all applicable requirements of environmental laws. We do not anticipate material capital expenditures for environmental compliance in fiscal years 2017 or 2018.
Investigation and remediation of contamination is ongoing at some of our sites. In particular, state agencies have been overseeing groundwater monitoring activities at our facility in Hartsville, South Carolina and a corrective action plan at our Clayton, Georgia facility. At Hartsville, we are monitoring low levels of contaminants in the groundwater caused by former operations. Plans are currently underway to conclude remediation and monitoring activities. In connection with the purchase of our Fairfield, Connecticut facility in 1996, we agreed to assume responsibility for completing clean-up efforts previously initiated by the prior owner. We submitted data to the state that we believe demonstrates that no further remedial action is necessary although the state may require additional clean-up or monitoring. In connection with the purchase of our Clayton, Georgia facility, we agreed to take assignment of the hazardous waste permit covering such facility and to assume certain responsibilities to implement a corrective action plan concerning the remediation of certain soil and groundwater contamination present at that facility. The corrective action plan is ongoing. Although there can be no assurance, we do not expect expenses associated with these activities to be material.
Available Information
We file our annual, quarterly and current reports, proxy statements, and other documents with the Securities and Exchange Commission (“SEC”) under the Securities Exchange Act of 1934. The public may read and copy any materials filed with the SEC at the SEC’s Public Reference Room at 405 Fifth Street, N.W., Washington, D.C. 20549. The public may obtain information on the operation of the Public Reference Room by calling the SEC at 1-800-SEC-0330. Also, the SEC maintains an Internet website that contains reports, proxy and information statements, and other information regarding issuers that file electronically with the SEC. The public can obtain any documents that are filed by us at http://www.sec.gov.
In addition, this Annual Report on Form 10-K, as well as our quarterly reports on Form 10-Q, current reports on Form 8-K and any amendments to all of the foregoing reports and our governance documents, are made available free of charge on our Internet website (http://www.rbcbearings.com) as soon as reasonably practicable after such reports are electronically filed with or furnished to the SEC. A copy of the above filings will also be provided free of charge upon written request to us.
| 6 |
Cautionary Statement As To Forward-Looking Information
This report includes “forward-looking statements” within the meaning of Section 27A of the Securities Act of 1933 and Section 21E of the Securities Exchange Act of 1934. All statements other than statements of historical fact are "forward-looking statements" for purposes of federal and state securities laws, including any projections of earnings, cash flows, revenue or other financial items; any statements of the plans, strategies and objectives of management for future operations; any statements concerning proposed new services or developments; any statements regarding future economic conditions or performance; future growth rates in the markets we serve; increases in foreign sales; supply and cost of raw materials, any statements of belief; and any statements of assumptions underlying any of the foregoing. Forward-looking statements may include the words "may," "estimate," "intend," "continue," "believe," "expect," "anticipate," the negative of such terms or other comparable terminology.
Although we believe that the expectations reflected in any of our forward-looking statements are reasonable, actual results could differ materially from those projected or assumed in any of our forward-looking statements. Our future financial condition, results of operations and cash flows, as well as any forward-looking statements, are subject to change and to inherent risks and uncertainties, such as those disclosed in this Annual Report on Form 10-K. Factors that could cause our actual results, performance and achievements or industry results to differ materially from estimates or projections contained in forward-looking statements include, among others, the following:
| · | Weaknesses and cyclicality in any of the industries in which our customers operate; |
| · | Changes in marketing, product pricing and sales strategies or developments of new products by us or our competitors; |
| · | Future reductions in U.S. governmental spending or changes in governmental programs, particularly military equipment procurement programs; |
| · | Our ability to obtain and retain product approvals; |
| · | Supply and costs of raw materials, particularly steel, and energy resources and our ability to pass through these costs on a timely basis; |
| · | Our ability to acquire and integrate complementary businesses; |
| · | Unanticipated liabilities of acquired businesses, including Sargent; |
| · | Unexpected equipment failures, catastrophic events or capacity constraints; |
| · | The costs of defending, or the results of, new litigation; |
| · | Our ability to attract and retain our management team and other highly-skilled personnel; |
| · | Increases in interest rates; |
| · | Work stoppages and other labor problems for us and our customers or suppliers; |
| · | Limitations on our ability to expand our business; |
| · | Regulatory changes or developments in the U.S. and foreign countries; |
| · | Developments or disputes concerning patents or other proprietary rights; |
| · | Changes in accounting standards, policies, guidance, interpretation or principles; |
| · | Risks associated with operating internationally, including currency translation risks; |
| · | The operating and stock performance of comparable companies; |
| · | Investors’ perceptions of us and our industry; |
| · | General economic, geopolitical, industry and market conditions; |
| · | Changes in tax requirements (including tax rate changes and new tax laws); |
| · | Health care reform; and |
| · | Unforeseen developments in contingencies, such as litigation, could adversely affect our operating results and financial condition. |
Additional factors that could cause actual results to differ materially from our forward-looking statements are set forth in this Annual Report on Form 10-K, including under Part I, Item 1. “Business,” Part I, Item 1A. “Risk Factors,” Part II, Item 7. “Management’s Discussion and Analysis of Financial Condition and Results of Operations” and Part II, Item 8. “Financial Statements and Supplementary Data.”
We are not under any duty to update any forward-looking statements after the date of this report to conform such statements to actual results or to changes in our expectations. You are advised, however, to review any further disclosures we make on related subjects in our periodic filings with the Securities and Exchange Commission. All forward-looking statements contained in this report and any subsequently filed reports are expressly qualified in their entirety by these cautionary statements.
Our business, operating results, cash flows or financial condition could be materially adversely affected by any of the following risks. The trading price of our common stock could decline due to any of these risks, and you may lose all or part of your investment. You should carefully consider these risks before investing in shares of our common stock.
| 7 |
Risk Factors Related to Our Company
The bearing and engineered products industries are highly competitive, and competition could reduce our profitability or limit our ability to grow.
The global bearing and engineered products industries are highly competitive, and we compete with many U.S. and non-U.S. companies, some of which benefit from lower labor costs and fewer regulatory burdens than us. We compete primarily based on product qualifications, product line breadth, service and price. Certain competitors may be better able to manage costs than us or may have greater financial resources than we have. Due to the competitiveness in the bearing and engineered products industries we may not be able to increase prices for our products to cover increases in our costs, and we may face pressure to reduce prices, which could materially reduce our revenues, gross margin and profitability. Competitive factors, including changes in market penetration, increased price competition and the introduction of new products and technology by existing and new competitors could result in a material reduction in our revenues and profitability.
The loss of a major customer could result in a material reduction in our revenues and profitability.
Our top ten customers generated 33% and 28% of our net sales during fiscal 2016 and fiscal 2015, respectively. Accordingly, the loss of one or more of those customers or a substantial decrease in such customers' purchases from us could result in a material reduction in our revenues and profitability.
In addition, the consolidation and combination of defense or other manufacturers may eliminate customers from the industry and/or put downward pricing pressures on sales of component parts. For example, the consolidation that has occurred in the defense industry in recent years has significantly reduced the overall number of defense contractors in the industry. In addition, if one of our customers is acquired or merged with another entity, the new entity may discontinue using us as a supplier because of an existing business relationship with the acquiring company or because it may be more efficient to consolidate certain suppliers within the newly formed enterprise. The significance of the impact that such consolidation may have on our business is difficult to predict because we do not know when or if one or more of our customers will engage in merger or acquisition activity. However, if such activity involved our material customers it could materially impact our revenues and profitability.
Weakness in any of the industries in which our customers operate, as well as the cyclical nature of our customers' businesses generally, could materially reduce our revenues and profitability.
The commercial aerospace, mining and construction equipment and other diversified industrial industries to which we sell our products are, to varying degrees, cyclical and tend to decline in response to overall declines in industrial production. Margins in those industries are highly sensitive to demand cycles, and our customers in those industries historically have tended to delay large capital projects, including expensive maintenance and upgrades, during economic downturns. As a result, our business is also cyclical, and the demand for our products by these customers depends, in part, on overall levels of industrial production, general economic conditions and business confidence levels. Downward economic cycles could affect our customers and reduce sales of our products resulting in reductions in our revenues and net earnings. Any future material weakness in demand in any of these industries could materially reduce our revenues and profitability. Many of our customers have historically experienced periodic downturns, which often have had a negative effect on demand for our products. Previous industry downturns have negatively affected, and future industry downturns will negatively affect, our net sales, gross margin and net income.
Future reductions or changes in U.S. government spending could negatively affect our business.
In fiscal 2016, 4.0% of our net sales were made directly, and we estimate that, including our diversified industrial market, approximately an additional 18.0% of our net sales were made indirectly, to the U.S. government to support military or other government projects. Our failure to obtain new government contracts, the cancellation of government contracts or reductions in federal budget appropriations regarding our products could result in materially reduced revenue. In addition, the funding of defense programs also competes with non-defense spending of the U.S. government. Our business is sensitive to changes in national and international priorities and the U.S. government budget. A shift in government defense spending to other programs in which we are not involved or a reduction in U.S. government defense spending generally could materially reduce our revenues, cash flows from operations and profitability. If we, or our prime contractors for which we are a subcontractor, fail to win any particular bid, or we are unable to replace lost business as a result of a cancellation, expiration or completion of a contract, our revenues or cash flows could be reduced.
| 8 |
The U.S. government continues to focus on developing and implementing spending, tax, and other initiatives to stimulate the economy, create jobs, and reduce the deficit. One of these initiatives, the Budget Control Act of 2011 ("BCA"), imposed greater constraints around government spending. In an attempt to balance decisions regarding defense, homeland security, and other federal spending priorities, the BCA immediately imposed spending caps that contain significant reductions to the Department of Defense ("DOD") base budgets over a ten-year period ending in 2021. The BCA also provided for an automatic sequestration process, that impose additional cuts to the annual proposed DOD budgets continuing through 2021.
Although we cannot predict whether the automatic sequestration process will continue to proceed as set forth in the BCA or will be further modified by new or additional legislation, we believe our portfolio of programs and product offerings are well positioned and will not be materially impacted by such proposed DOD budget cuts. However, one or more of our programs could be reduced, extended, or terminated as a result of the U.S. Government's continuing assessment of priorities, which could significantly impact our operations.
Fluctuating supply and costs of raw materials and energy resources could materially reduce our revenues, cash flow from operations and profitability.
Our business is dependent on the availability and costs of energy resources and raw materials, particularly steel, generally in the form of stainless and chrome steel, which are commodity steel products. The availability and prices of raw materials and energy sources may be subject to curtailment or change due to, among other things, new laws or regulations, suppliers' allocations to other purchasers, interruptions in production by suppliers, changes in exchange rates and worldwide price levels. Although we currently maintain alternative sources for raw materials, our business is subject to the risk of price fluctuations and periodic delays in the delivery of certain raw materials. Disruptions in the supply of raw materials and energy resources could temporarily impair our ability to manufacture our products for our customers or require us to pay higher prices in order to obtain these raw materials or energy resources from other sources, which could thereby affect our net sales and profitability.
We seek to pass through a significant portion of our additional costs to our customers through steel surcharges or price increases. However, even if we are able to pass these steel surcharges or price increases to our customers, there may be a time lag of up to 3 months or more between the time a cost increase goes into effect and our ability to implement surcharges or price increases, particularly for orders already in our backlog. Competitive pressures and the terms of certain of our long-term contracts may require us to absorb at least part of these cost increases, particularly during periods of high inflation. As a result our gross margin percentage may decline, and we may not be able to implement other price increases for our products. We cannot provide assurances that we will be able to continue to pass these additional costs on to our customers at all or on a timely basis or that our customers will not seek alternative sources of supply if there are significant or prolonged increases in the price of steel or other raw materials or energy resources.
The Dodd-Frank Wall Street Reform and Consumer Protection Act contains provisions to improve transparency and accountability concerning the supply of certain minerals, known as conflict minerals, originating from the Democratic Republic of Congo (“DRC”) and adjoining countries. As a result, in August 2012 the SEC adopted annual disclosure and reporting requirements for those companies who use materials containing conflict minerals in their products mined from the DRC and adjoining countries. These new requirements necessitated due diligence efforts in calendar 2013, with initial disclosure requirements beginning in May 2014. There will be costs associated with complying with these disclosure requirements, including for diligence to determine the sources of materials containing conflict minerals used in our products and other potential changes to products, processes or sources of supply as a consequence of these verification activities. The implementation of these rules could adversely affect the sourcing, supply and pricing of materials used in certain of our products. As there may be only a limited number of suppliers offering “conflict free” materials, we cannot ensure that we will be able to obtain necessary materials containing conflict free minerals from such suppliers in sufficient quantities or at competitive prices. Also, we may face negative reactions from customers if we determine that certain of our products contain minerals not determined to be conflict free or if we are unable to sufficiently verify the origins for all materials containing conflict minerals used in our products through the procedures we implement.
| 9 |
Our products are subject to certain approvals, and the loss of such approvals could materially reduce our revenues and profitability.
Essential to servicing the aerospace market is the ability to obtain product approvals. We have a substantial number of product approvals, which enable us to provide products used in virtually all domestic aircraft platforms presently in production or operation. Product approvals are typically issued by the FAA to designated OEMs who are Production Approval Holders of FAA approved aircraft. These Production Approval Holders provide quality control oversight and generally limit the number of suppliers directly servicing the commercial aerospace aftermarket. Regulations enacted by the FAA provide for an independent process (the PMA process), which enables suppliers who currently sell their products to the Production Approval Holders, to sell products to the aftermarket. Our foreign sales may be subject to similar approvals or U.S. export control restrictions. We cannot assure you that we will not lose approvals for our products in the future. The loss or suspension of product approvals could result in lost sales and materially reduce our revenues and profitability. The repair and overhaul of aircraft parts and accessories throughout the world is highly regulated by government agencies, including the FAA. Our repair and overhaul operations are subject to certification pursuant to regulations established by the FAA and other country government agencies which regulations vary from country to country, although compliance with FAA requirements generally satisfies regulatory requirements in other countries. New and more stringent government regulations, if adopted and enacted, could have an adverse effect on our business, financial condition and results of operations.
The retirement of commercial aircraft could reduce our revenues.
Our repair and overhaul operations repair, overhaul and sell jet engine and aircraft components. If aircraft or engines for which we offer replacement parts or supply repair and overhaul services are retired and there are fewer aircraft that require these parts or services, our revenues may decline.
Work stoppages and other labor problems could materially reduce our ability to operate our business.
As of April 2, 2016, approximately 12.2% of our hourly employees were represented by labor unions in the U.S. and abroad. While we believe our relations with our employees are satisfactory, a lengthy strike or other work stoppage at any of our facilities, particularly at some of our larger facilities, could materially reduce our ability to operate our business. In addition, any attempt by our employees not currently represented by a union to join a union could result in additional expenses, including with respect to wages, benefits and pension obligations. We currently have four collective bargaining agreements, one agreement covering approximately 40 employees will expire in June 2017, one agreement covering approximately 93 employees will expire in January 2018, one agreement covering approximately 41 employees will expire in October 2018 and one agreement covering approximately 70 employees will expire in June 2018.
In addition, work stoppages at one or more of our customers or suppliers, including suppliers of transportation services, many of which have large unionized workforces, for labor or other reasons could also cause disruptions to our business that we cannot control, and these disruptions may materially reduce our revenues and profitability.
Unexpected equipment failures, catastrophic events or capacity constraints may increase our costs and reduce our sales due to production curtailments or shutdowns.
Our manufacturing processes are dependent upon critical pieces of equipment, such as furnaces, continuous casters and rolling equipment, as well as electrical equipment, such as transformers, and this equipment may, on occasion, be out of service as a result of unanticipated failures. In addition to equipment failures, our facilities are also subject to the risk of catastrophic loss due to unanticipated events such as fires, explosions, earthquakes or violent weather conditions. In the future, we may experience material plant shutdowns or periods of reduced production as a result of these types of equipment failures or catastrophes. Interruptions in production capabilities will inevitably increase our production costs and reduce sales and earnings for the affected period.
Certain of our facilities are operating at a full first shift with second and third shifts at some locations, and additional demand may require additional shifts and/or capital investments at these facilities. We cannot assure you that we will be able to add additional shifts as needed in a timely way and production constraints may result in lost sales. In certain markets we refrain from making additional capital investments to expand capacity where we believe market expansion in a particular end market is not sustainable or otherwise does not justify the expansion or capital investment. Our assumptions and forecasts regarding market conditions in these end markets may be erroneous and may result in lost earnings, potential sales going to competitors and inhibit our growth.
| 10 |
We may not be able to continue to make the acquisitions necessary for us to realize our growth strategy.
The acquisition of businesses that complement or expand our operations has been and continues to be an important element of our business strategy. We frequently engage in evaluations of potential acquisitions and negotiations for possible acquisitions, some of which, if consummated, could be significant to us. We cannot assure you that we will be successful in identifying attractive acquisition candidates or completing acquisitions on favorable terms in the future. Our inability to acquire businesses, or to operate them profitably once acquired, could have a material adverse effect on our business, financial position, cash flow and growth.
Over the past several years, as part of our strategic growth plans, we have typically acquired multiple businesses in any given year. Some of those acquisitions have been significant to our overall growth, such as the acquisition of Sargent in fiscal 2016. The full realization of the expected benefits and synergies of Sargent and other acquisitions will require integration over time of certain aspects of the manufacturing, engineering, administrative, sales and marketing and distribution functions of the acquired businesses, as well as some integration of information systems platforms and processes. Complete and successful integration of Sargent and other acquired businesses, and realization of expected synergies, can be a long and difficult process and may require substantial attention from our management team and involve substantial expenditures and include additional operational expenses, matching with our culture, the ability to retain and assimilate employees of the acquired business, the ability to retain customers and integrate customer bases, the adequacy of our implementation plans, the ability of our management to oversee and operate effectively the combined operations and our ability to achieve desired operating efficiencies and sales goals. The integration of any acquired businesses might cause us to incur unforeseen costs, which would lower our future earnings and would prevent us from realizing the expected benefits of these acquisitions.
Even if we are able to integrate future acquired businesses with our operations successfully, we cannot assure you that we will realize all of the cost savings, synergies or revenue enhancements that we anticipate from such integration or that we will realize such benefits and synergies within the expected time frame, or at all, and the costs of achieving these benefits may be higher than, and the timing may differ from, what we initially expect. Future acquisitions may also result in potentially dilutive issuances of securities.
Our ability to realize anticipated benefits and synergies from the acquisitions may be affected by a number of factors, including: the use of more cash or other financial resources, and additional management time, attention and distraction, on integration and implementation activities than we expect, including restructuring and other exit costs; increases in other expenses related to an acquisition, which may offset any potential cost savings and other synergies from the acquisition; our ability to avoid labor disruptions or disputes in connection with any integration; the timing and impact of purchase accounting adjustments; difficulties in employee or management integration; and unanticipated liabilities associated with acquired businesses.
Any potential cost-saving opportunities may take at least several quarters following an acquisition to implement, and any results of these actions may not be realized for at least several quarters following implementation.
Businesses that we have acquired, such as Sargent, or that we may acquire in the future may have liabilities which are not known to us.
In certain cases we have assumed liabilities of other acquired businesses including Sargent, and may assume liabilities of businesses that we acquire in the future. There may be liabilities or risks that we fail, or are unable, to discover, or that we underestimate, in the course of performing our due diligence investigations of acquired businesses. Additionally, businesses that we have acquired or may acquire in the future may have made previous acquisitions, and we could be subject to certain liabilities and risks relating to these prior acquisitions as well. We cannot assure you that our rights to indemnification contained in definitive acquisition agreements that we have entered or may enter into will be sufficient in amount, scope or duration to fully offset the risk of unforeseen business uncertainties or related possible liabilities. Any such liabilities, individually or in the aggregate, could have a material adverse effect on our business, financial condition or results of operations. As we begin to operate acquired businesses, we may learn additional information about them that adversely affects us, such as unknown or contingent liabilities, issues relating to compliance with applicable laws or issues related to ongoing supply chain or customer relationships or order demand.
| 11 |
Goodwill and indefinite-lived tradename intangibles comprise a significant portion of our total assets, and if we determine that goodwill and indefinite-lived tradename intangibles have become impaired in the future, our results of operations and financial condition in such years may be materially and adversely affected.
Goodwill represents the excess of cost over the fair market value of net assets acquired in business combinations. Indefinite-lived tradename intangibles represent long-standing brands acquired in business combinations and assumed to have indefinite lives. We review goodwill and indefinite-lived tradename intangibles at least annually for impairment and any excess in carrying value over the estimated fair value is charged to the results of operations. Our estimates of fair value are based on assumptions about the future operating cash flows, growth rates, discount rates applied to these cash flows and current market estimates of value. A reduction in net income resulting from the write down or impairment of goodwill or indefinite-lived tradename intangibles would affect financial results and could have a material and adverse impact upon the market price of our common stock. If we are required to record a significant charge to earnings in our consolidated financial statements because an impairment of goodwill or indefinite-lived tradename intangibles is determined, our results of operations and financial condition could be materially and adversely affected.
We depend heavily on our senior management and other key personnel, the loss of whom could materially affect our financial performance and prospects.
Our business is managed by a number of key executive officers, including Dr. Michael J. Hartnett. Our future success will depend on, among other things, our ability to keep the services of these executives and to hire other highly qualified employees at all levels.
We compete with other potential employers for employees, and we may not be successful in hiring and retaining executives and other skilled employees that we need. Our ability to successfully execute our business strategy, market and develop our products and serve our customers could be adversely affected by a shortage of available skilled employees or executives.
Our international operations are subject to risks inherent in such activities.
We have established operations in certain countries outside the U.S., including Mexico, France, Switzerland, Poland, China and Canada. Of our 37 facilities, 8 are located outside the U.S., including 7 manufacturing facilities.
In fiscal 2016, 13% of our net sales were generated by our international operations. We expect that this proportion is likely to increase as we seek to increase our penetration of foreign markets, including through acquisitions, particularly within the aerospace and defense markets. Our foreign operations are subject to the risks inherent in such activities such as: currency devaluations, logistical and communication challenges, costs of complying with a variety of foreign laws and regulations, greater difficulties in protecting and maintaining our rights to intellectual property, difficulty in staffing and managing geographically diverse operations, acts of terrorism or war or other acts that may cause social disruption which are difficult to quantify or predict and general economic conditions in these foreign markets. Our international operations may be negatively impacted by changes in government policies, such as changes in laws and regulations (or the interpretation thereof), restrictions on imports and exports, sources of supply, duties or tariffs, the introduction of measures to control inflation and changes in the rate or method of taxation. To date we have not experienced significant difficulties with the foregoing risks associated with our international operations.
Currency translation risks may have a material impact on our results of operations.
Our Swiss operation utilizes the Swiss Franc as the functional currency, our French operation utilizes the Euro as the functional currency, our Polish operation utilizes the Polish Zloty as the functional currency and our Canadian operation utilizes the Canadian Dollar as the functional currency. Foreign currency transaction gains and losses are included in earnings. Foreign currency transaction exposure arises primarily from the transfer of foreign currency from one subsidiary to another within the group and to foreign currency denominated trade receivables. Unrealized currency translation gains and losses are recognized upon translation of the foreign subsidiaries' balance sheets to U.S. dollars. Because our financial statements are denominated in U.S. dollars, changes in currency exchange rates between the U.S. dollar and other currencies have had, and will continue to have, an impact on our earnings. We periodically enter into derivative financial instruments such as forward exchange contracts to reduce the effect of fluctuations in exchange rates on certain third-party sales transactions denominated in non-functional currencies. Currency fluctuations may affect our financial performance in the future and we cannot predict the impact of future exchange rate fluctuations on our results of operations. See Part II, Item 7A. "Quantitative and Qualitative Disclosures about Market Risk—Foreign Currency Exchange Rates."
| 12 |
We may be required to make significant future contributions to our pension plan.
As of April 2, 2016, we maintained one noncontributory defined benefit pension plan. The plan was underfunded by $4.2 million as of April 2, 2016 and by $5.0 million as of March 28, 2015, which are the amounts by which the accumulated benefit obligations are more than the sum of the fair market value of the plan’s assets. We are required to make cash contributions to our pension plan to the extent necessary to comply with minimum funding requirements imposed by employee benefit laws and tax laws. The amount of any such required contributions is determined based on annual actuarial valuation of the plan as performed by the plan’s actuaries. The amount of future contributions will depend upon asset returns, then-current discount rates and a number of other factors, and, as a result, the amount we may elect or be required to contribute to our pension plan in the future may increase significantly. Additionally, there is a risk that if the Pension Benefit Guaranty Corporation concludes that its risk with respect to our pension plan may increase unreasonably if the plan continues to operate, if we are unable to satisfy the minimum funding requirement for the plan or if the plan becomes unable to pay benefits, then the Pension Benefit Guaranty Corporation could terminate the plan and take control of its assets. In such event, we may be required to make an immediate payment to the Pension Benefit Guaranty Corporation of all or a substantial portion of the underfunding as calculated by the Pension Benefit Guaranty Corporation based upon its own assumptions. The underfunding calculated by the Pension Benefit Guaranty Corporation could be substantially greater than the underfunding we have calculated because, for example, the Pension Benefit Guaranty Corporation may use a significantly lower discount rate. If such payment is not made, then the Pension Benefit Guaranty Corporation could place liens on a material portion of our assets and the assets of any members of our controlled group. Such action could result in a material increase in our pension related expenses and a corresponding reduction in our cash flow and net income. For additional information concerning our pension plan and plan liabilities, see Part II, Item 8. “Financial Statements and Supplementary Data,” Note 12 “Pension Plans.”
We may incur material losses for product liability and recall related claims.
We are subject to a risk of product and recall related liability in the event that the failure, use or misuse of any of our products results in personal injury, death, or property damage or our products do not conform to our customers' specifications. In particular, our products are installed in a number of types of vehicle fleets, including airplanes, trains, automobiles, heavy trucks and farm equipment, many of which are subject to government ordered as well as voluntary recalls by the manufacturer. If one of our products is found to be defective, causes a fleet to be disabled or otherwise results in a product recall, significant claims may be brought against us. We currently maintain product liability insurance coverage for product liability, although not for recall related claims, we cannot assure you that product liability or recall related claims, if made, would not exceed our insurance coverage limits or would be covered by insurance which, in turn, may result in material losses related to these claims, increased future insurance costs and a corresponding reduction in our cash flow and net income.
Environmental regulations impose substantial costs and limitations on our operations, and environmental compliance may be more costly than we expect.
We are subject to various federal, state and local environmental laws and regulations, including those governing discharges of pollutants into the air and water, the storage, handling and disposal of wastes and the health and safety of employees. These laws and regulations could subject us to material costs and liabilities, including compliance costs, civil and criminal fines imposed for failure to comply with these laws and regulatory and litigation costs. We also may be liable under the Federal Comprehensive Environmental Response, Compensation, and Liability Act, or similar state laws, for the costs of investigation and clean-up of contamination at facilities currently or formerly owned or operated by us or at other facilities at which we have disposed of hazardous substances. In connection with such contamination, we may also be liable for natural resource damages, government penalties and claims by third parties for personal injury and property damage. Compliance with these laws and regulations may prove to be more limiting and costly than we anticipate. New laws and regulations, stricter enforcement of existing laws and regulations, the discovery of previously unknown contamination or the imposition of new clean-up requirements could require us to incur costs or become the basis for new or increased liabilities that could cause a material increase in our environmental related compliance costs and a corresponding reduction in our cash flow and net income. Investigation and remediation of contamination at some of our sites is ongoing. Actual costs to clean-up these sites may exceed our current estimates. Although we have indemnities and other agreements for certain pre-closing environmental liabilities from the prior owners in connection with our acquisition of several of our facilities, we cannot assure you that the indemnities will be adequate to cover known or newly discovered pre-closing liabilities.
| 13 |
Our intellectual property and other proprietary rights are valuable, and any inability to protect them could adversely affect our business and results of operations; in addition, we may be subject to infringement claims by third parties.
Our ability to compete effectively is dependent upon our ability to protect and preserve the intellectual property and other proprietary rights and materials owned, licensed or otherwise used by us. We have numerous U.S. and foreign patents, trademark registrations and U.S. copyright registrations. We also have U.S. and foreign trademark and patent applications pending. We cannot assure you that our pending trademark and patent applications will result in trademark registrations and issued patents, and our failure to secure rights under these applications may limit our ability to protect the intellectual property rights that these applications were intended to cover. Although we have attempted to protect our intellectual property and other proprietary rights both in the United States and in foreign countries through a combination of patent, trademark, copyright and trade secret protection and non-disclosure agreements, these steps may be insufficient to prevent unauthorized use of our intellectual property and other proprietary rights, particularly in foreign countries where the protection available for such intellectual property and other proprietary rights may be limited. We cannot assure you that any of our intellectual property rights will not be infringed upon or that our trade secrets will not be misappropriated or otherwise become known to or independently developed by competitors. We may not have adequate remedies available for any such infringement or other unauthorized use. We cannot assure you that any infringement claims asserted by us will not result in our intellectual property being challenged or invalidated, that our intellectual property will be held to be of adequate scope to protect our business or that we will be able to deter current and former employees, contractors or other parties from breaching confidentiality obligations and misappropriating trade secrets. In addition, we may become subject to claims which could require us to pay damages or limit our ability to use certain intellectual property and other proprietary rights found to be in violation of a third party's rights, and, in the event such litigation is successful, we may be unable to use such intellectual property and other proprietary rights at all or on reasonable terms. Regardless of its outcome, any litigation, whether commenced by us or third parties, could be protracted and costly and could result in increased litigation related expenses, the loss of intellectual property rights or payment of money or other damages, which may result in lost sales and reduced cash flow and decrease our net income. See Part I, Item 1. "Business—Intellectual Property."
Cancellation of orders in our backlog of orders could negatively impact our revenues.
As of April 2, 2016, we had an order backlog of $346.4 million, which we estimate will be fulfilled within the next 12 months. However, orders included in our backlog are subject to cancellation, delay or other modifications by our customers prior to fulfillment. For these reasons, we cannot assure you that orders included in our backlog will ultimately result in the actual receipt of revenues from such orders.
If we fail to maintain an effective system of internal controls, we may not be able to accurately report our financial results or prevent fraud.
Effective internal controls are necessary for us to provide reliable financial reports and effectively prevent fraud. Any inability to provide reliable financial reports or prevent fraud could harm our business. To date, we have not detected any material weakness or significant deficiencies in our internal controls over financial reporting. However, we are continuing to evaluate and, where appropriate, enhance our policies, procedures and internal controls. If we fail to maintain the adequacy of our internal controls, as such standards are modified, supplemented or amended from time to time, we could be subject to regulatory scrutiny, civil or criminal penalties or shareholder litigation. In addition, failure to maintain adequate internal controls could result in financial statements that do not accurately reflect our financial condition. Inferior internal controls could also cause investors to lose confidence in our reported financial information, which could have a negative effect on the trading price of our stock.
Health care reform could adversely affect our operating results.
In 2010, the U.S. government enacted comprehensive health care reform legislation. Due to the breadth and complexity of this legislation, as well as its phased-in nature of implementation and lack of interpretive guidance, it is difficult for us to predict the overall effects it will have on our business over the coming years. To date, we have not experienced significant costs related to the health care reform legislation; however, it is possible that our operating results could be adversely affected in the future by increased costs, expanded liability exposure and requirements that change the ways we provide healthcare and other benefits to our employees.
Unforeseen developments in contingencies, such as litigation, could adversely affect our financial condition.
We and certain of our subsidiaries are, and from time to time may become, parties to a number of legal proceedings incidental to their businesses involving alleged injuries arising out of the use of their products, exposure to hazardous substances, or patent infringement, employment matters, and commercial disputes. The defense of these lawsuits may require significant expenses and divert management’s attention, and we may be required to pay damages that could adversely affect our financial condition. In addition, any insurance or indemnification rights that we may have may be insufficient or unavailable to protect us against potential loss exposures.
| 14 |
Risk Factors Related to our Common Stock
Provisions in our charter documents may prevent or hinder efforts to acquire a controlling interest in us.
Provisions of our certificate of incorporation and bylaws may discourage, delay or prevent a merger, acquisition or other change in control that stockholders may consider favorable, including transactions which might benefit our stockholders or in which our stockholders might otherwise receive a premium for their shares. These provisions may also prevent or frustrate attempts by our stockholders to replace or remove our management.
Our certificate of incorporation authorizes the issuance of preferred stock with such designations, rights and preferences as may be determined from time to time by our Board of Directors (the “Board”) without stockholder approval. Holders of the common stock may not have preemptive rights to subscribe for a pro rata portion of any capital stock which may be issued by us. In the event of issuance, such preferred stock could be utilized, under certain circumstances, as a method of discouraging, delaying or preventing a change in control of us or could impede our stockholders’ ability to approve a transaction they consider in their best interests. Although we have no present intention to issue any new shares of preferred stock, we may do so in the future.
We may not pay cash dividends in the foreseeable future.
Except for a $2.00 per common share special dividend paid on June 13, 2014, we have not paid any cash dividends on our common stock and may not pay cash dividends in the future. Instead, we plan to apply earnings and excess cash, if any, to the expansion and development of the business. Thus, the return on your investment, if any, could depend solely on an increase, if any, in the market value of our common stock.
ITEM 1B. UNRESOLVED STAFF COMMENTS
None
Our principal executive office is located at One Tribology Center, Oxford, Connecticut 06478. We also use these facilities for manufacturing and product testing and development.
We own facilities in the following locations:
| Tucson, Arizona | Delemont, Switzerland |
| Anjou, Quebec, Canada | Clayton, Georgia |
| Rancho Dominguez, California | Bremen, Indiana |
| Santa Ana, California | Plymouth, Indiana |
| Fairfield, Connecticut | Mielec, Poland |
| Middlebury, Connecticut | Bishopville, South Carolina |
| Oxford, Connecticut | Hartsville, South Carolina |
| Torrington, Connecticut | Westminster, South Carolina |
| Ball Ground, Georgia | Houston, Texas |
We have leases in effect with respect to the following facilities:
| Location of Leased Facility | Lease Expiration Date | Location of Leased Facility | Lease Expiration Date | |||
| Baldwin Park, California | April 30, 2018 | Franklin, Indiana | May 31, 2019 | |||
| Garden Grove, California | November 30, 2016 | Reynosa, Mexico | February 28, 2021 | |||
| Fountain Valley, California | November 30, 2019 | Tecate, Mexico | January 31, 2019 | |||
| Los Angeles, California | December 31, 2020 | West Trenton, New Jersey | February 28, 2018 | |||
| San Diego, California | October 1, 2016 | Mentor, Ohio | January 31, 2023 | |||
| Santa Fe Springs, California | November 30, 2018 | Oklahoma City, Oklahoma | September 30, 2021 | |||
| Shanghai, China | May 31, 2017 | Horsham, Pennsylvania | April 14, 2018 | |||
| Miami, Florida | February 16, 2019 | Bishopville, South Carolina | January 31, 2020 | |||
| Les Ulis, France | June 30, 2016 | Hartsville, South Carolina | May 31, 2016 | |||
| Hoffman Estates, Illinois | November 30, 2018 | Grand Prairie, Texas | February 28, 2018 |
| 15 |
We have several small field offices located in various locations to support field sales operations.
We believe that our existing property, facilities and equipment are generally in good condition, are well maintained and adequate to carry on our current operations. We also believe that our existing manufacturing facilities have sufficient capacity to meet increased customer demand. Substantially all of our owned domestic properties and most of our other assets are subject to a lien securing our obligations under our Wells Fargo Credit Agreement.
From time to time, we are involved in litigation and administrative proceedings which arise in the ordinary course of our business. We do not believe that any litigation or proceeding in which we are currently involved, including those discussed below, either individually or in the aggregate, is likely to have a material adverse effect on our business, financial condition, operating results, cash flow or prospects.
Our wholly owned subsidiary, RBC Aircraft Products, Inc. was a plaintiff in a lawsuit against Precise Machining & Manufacturing LLC in the United States District Court, District of Connecticut’s Case Number 3:10 CV 878 (SRU). A jury award against Precise Machining & Manufacturing LLC and in favor of RBC Aircraft Products, Inc. in the amount of $3.0 million was entered on April 9, 2013. Precise Machining & Manufacturing LLC subsequently filed a motion for judgment in its favor as a matter of law and a motion for a new trial. On May 5, 2014 the presiding judge surprisingly overturned the jury verdict as a matter of law and, in the alternative granted Precise a motion for a new trial on grounds not even requested by Precise. RBC Aircraft Products, Inc. subsequently filed a motion for Certification of Judgment, which was unopposed by Precise Machining & Manufacturing LLC, which was granted on July 28, 2014 and allowed RBC Aircraft Products, Inc. to immediately appeal the judges’ decision to overturn the jury verdict to the Second Circuit Court of Appeals (“Second Circuit”). RBC Aircraft Products, Inc. subsequently filed an appeal. On November 10, 2015 the Second Circuit reversed the District Court’s judgment in favor of Precise as a matter of law. However, the Second Circuit Court of Appeals remanded the case for a second trial giving deference to the District Court’s alternative holding that a second trial on liability was appropriate. On January 6, 2016 the District Court entered a pre-trial order tentatively scheduling a trial date on July 6, 2016. On May 20, 2016 RBC Aircraft Products, Inc. accepted an offer of judgement filed by Precise Machining and Manufacturing, LLC with the court on May 6, 2016 which as of May 20, 2016 resulted in a judgment to enter against Precise Machining and Manufacturing, LLC in the amount of $0.5 million inclusive of costs.
On October 5, 2007 SKF USA, Inc. (“SKF”) filed suit in Pennsylvania state court against Tyson Bearing Company, Inc. (now known as RBC Lubron Bearing Systems, Inc.) (“Tyson”) alleging that when Tyson vacated a facility in Glasgow, Kentucky on June 29, 2007, it breached an alleged five-year lease. SKF sought to recover approximately $3.8 million, including rent, prejudgment interest and attorney’s fees. After pending in the Pennsylvania court system for over nine years, a trial of the case was finally held during February, 2016. On February 17, 2016 the jury returned a verdict against Tyson in the amount of $1.0 million. Both SKF and Tyson filed post-trial motions. The filing of post-trial motions is required to preserve appeal rights. Both motions were opposed. Tyson’s post-trial motion sought a judgment notwithstanding the verdict, arguing that as a matter of law, the Court should set aside the verdict since there was no signed overlease; SKF violated the Statute of Frauds and was unable to sublease the property to Tyson; and there was no legally enforceable sublease because there was no agreement between SKF and Tyson. SKF filed a post-trial motion seeking a new trial as to damages on the grounds that the damages awarded by the jury did not have a rational basis to SKF’s actual damages; and a post-trial request for an award for prejudgment interest. Tyson opposed SKF’s motion arguing the jury verdict is rational considering the conflicting evidence related to the contract documents for the base rent, additional rent, and shared expenses and prejudgment interest requires a definitive, ascertainable sum at a definite time and that is lacking given the jury verdict. Oral argument for the post-trial motions and request was held on April 19, 2016. The Court subsequently denied Tyson’s motion for a judgment notwithstanding the verdict as well as SKF’s motion for a new trial. The Court did award SKF $0.5 million in prejudgment interest. On May 18, 2016 Tyson and SKF entered into a confidential settlement with respect to this matter.
ITEM 4. SUBMISSION OF MATTERS TO A VOTE OF SECURITY HOLDERS
No matters were submitted to a vote of security holders during the fourth quarter of the fiscal year ended April 2, 2016.
| 16 |
EXECUTIVE OFFICERS OF THE REGISTRANT
The executive officers are elected by the Board normally for a term of one year and until the election of their successors. Our executive officers of the company as of May 18, 2016 are as follows:
| Name | Age | Current Position and Previous Positions During Last Five Years | ||||
| Michael J. Hartnett | 70 | 1992 | Chairman, President and Chief Executive Officer | |||
| Daniel A. Bergeron | 56 | 2003 | Director, Vice President, Chief Financial Officer and Assistant Secretary | |||
| Thomas C. Crainer | 58 | 2008 | Vice President and General Manager | |||
| Richard J. Edwards | 60 | 1996 | Vice President and General Manager | |||
| Thomas J. Williams | 64 | 2006 | Corporate General Counsel and Secretary | |||
| Thomas M. Burigo | 64 | 2006 | Corporate Controller |
ITEM 5. MARKET FOR REGISTRANT’S COMMON EQUITY, RELATED STOCKHOLDER MATTERS AND ISSUER PURCHASES OF EQUITY SECURITIES
Price range of our Common Stock
Our common stock is quoted on the Nasdaq National Market under the symbol "ROLL." As of May 18, 2016, there were 3 holders of record of our common stock.
The following table shows the high and low sales prices of our common stock as reported by the Nasdaq National Market during the periods indicated:
| Fiscal 2016 | Fiscal 2015 | |||||||||||||||
| High | Low | High | Low | |||||||||||||
| First Quarter | $ | 77.86 | $ | 69.40 | $ | 65.82 | $ | 56.68 | ||||||||
| Second Quarter | 73.94 | 57.46 | 65.61 | 50.00 | ||||||||||||
| Third Quarter | 72.20 | 57.33 | 66.68 | 51.96 | ||||||||||||
| Fourth Quarter | 74.89 | 54.38 | 75.98 | 57.90 | ||||||||||||
The last reported sale price of our common stock on the Nasdaq National Market on May 18, 2016 was $72.47 per share.
Dividend Policy
On May 16, 2014, our Board declared a special cash dividend to shareholders of $2.00 per common share or a total of approximately $46.0 million. The special dividend was payable on June 13, 2014, to shareholders of record on May 30, 2014. The ex-dividend date was May 28, 2014. The Board opted for a special dividend payment, rather than a regular reoccurring dividend, to allow greater flexibility given our pipeline of attractive growth opportunities. The Board will, however, consider the use of additional special cash dividends in the future as circumstances warrant.
Issuer Purchases of Equity Securities
On February 7, 2013, our Board authorized us to repurchase up to $50.0 million of our common stock, from time to time on the open market, in block trade transactions and through privately negotiated transactions in compliance with Securities and Exchange Commission Rule 10b-18 depending on market conditions, alternative uses of capital and other relevant factors. Purchases may be commenced, suspended, or discontinued at any time without prior notice. This repurchase authorization terminates and replaces the existing $10.0 million stock repurchase program announced by us on June 15, 2007.
| 17 |
Total share repurchases for the three months ended April 2, 2016, all of which were made under this program, are as follows:
| Period | Total of shares purchased | Average price paid per share | Number of shares purchased as part of the publicly announced program | Approximate dollar value of shares still available to be purchased under the program (000’s) | ||||||||||||
| 12/27/2015 – 01/30/2016 | 239 | $ | 61.01 | 239 | $ | 30,596 | ||||||||||
| 01/31/2016 – 02/27/2016 | — | — | — | 30,596 | ||||||||||||
| 02/28/2016 – 04/2/2016 | 114 | $ | 63.64 | 114 | $ | 30,588 | ||||||||||
| Total | 353 | $ | 61.86 | 353 | ||||||||||||
During the fourth quarter of fiscal 2016, we did not issue any common stock that was not registered under the Securities Act.
Equity Compensation Plans
Information regarding equity compensation plans required to be disclosed pursuant to this Item is included in Part II, Item 8. “Financial Statements and Supplementary Data,” Note 15 “Stockholders’ Equity-Stock Option Plans” of this Annual Report on Form 10-K.
Performance Graph
The following graph shows the total return to our stockholders compared to the Russell 2000 Small Cap Index and the Nasdaq Composite Index over the period from April 2, 2011 to April 2, 2016. Because of the diversity of our markets and products we do not believe that a combination of peer issuers can be selected on an industry or line-of-business basis to provide a meaningful basis for comparing shareholder return. Accordingly, the Russell 2000 Small Cap Index is comprised of issuers with generally similar market capitalizations to that of the Company, and as permitted by regulation is included in the graph. Each line on the graph assumes that $100 was invested in our common stock on April 2, 2011 or in the respective indices at the closing price on April 2, 2011. The graph then presents the value of these investments, assuming reinvestment of dividends, through the close of trading on April 2, 2016.
| 18 |
Comparison of Five-Year Cumulative Total Return*
Among RBC Bearings Incorporated, the Nasdaq Composite Index, and the Russell 2000 Small Cap Index
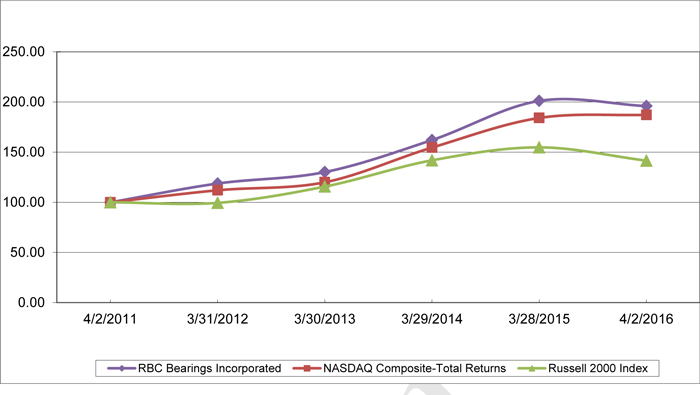
April 2, 2011 | March 31, 2012 | March 30, 2013 | March 29, 2014 | March 28, 2015 | April 2, 2016 | |||||||||||||||||||
| RBC Bearings Incorporated | $ | 100.00 | $ | 118.71 | $ | 130.11 | $ | 162.04 | $ | 201.03 | $ | 195.90 | ||||||||||||
| Nasdaq Composite Index | 100.00 | 111.97 | 119.97 | 154.55 | 184.05 | 187.19 | ||||||||||||||||||
| Russell 2000 Small Cap Index | 100.00 | 99.44 | 115.65 | 141.83 | 154.74 | 141.51 | ||||||||||||||||||
*The cumulative total return shown on the stock performance graph indicates historical results only and is not necessarily indicative of future results.
ITEM 6. SELECTED FINANCIAL DATA
The following table sets forth our selected consolidated historical financial and other data as of the dates and for the periods indicated. The selected financial data as of and for the years ended April 2, 2016, March 28, 2015, March 29, 2014, March 30, 2013 and March 31, 2012 have been derived from our historical consolidated financial statements audited by Ernst & Young LLP, independent registered public accounting firm. Historical results are not necessarily indicative of the results expected in the future. You should read the data presented below together with, and qualified by reference to, Part II, Item 7. "Management's Discussion and Analysis of Financial Condition and Results of Operations" and our consolidated financial statements included in Part II, Item 8. “Financial Statements and Supplementary Data” of this Annual Report on Form 10-K.
| Fiscal Year Ended | ||||||||||||||||||||
April 2, 2016 | March 28, 2015 | March 29, 2014 | March 30, 2013 | March 31, 2012 | ||||||||||||||||
| (in thousands, except share and per share amounts) | ||||||||||||||||||||
| Statement of Operations Data: | ||||||||||||||||||||
| Net sales(1) | $ | 597,472 | $ | 445,278 | $ | 418,886 | $ | 403,051 | $ | 397,511 | ||||||||||
| Cost of sales | 378,694 | 275,138 | 254,089 | 250,122 | 256,931 | |||||||||||||||
| Gross margin | 218,778 | 170,140 | 164,797 | 152,929 | 140,580 | |||||||||||||||
| Selling, general and administrative | 98,721 | 75,908 | 71,969 | 65,751 | 61,303 | |||||||||||||||
| Other, net | 16,216 | 5,802 | 4,178 | 9,077 | 1,629 | |||||||||||||||
| Operating income | 103,841 | 88,430 | 88,650 | 78,101 | 77,648 | |||||||||||||||
| Interest expense, net | 8,722 | 1,055 | 1,019 | 868 | 1,045 | |||||||||||||||
| Other non-operating expense (income) | 334 | 2,820 | (122 | ) | (2,955 | ) | 624 | |||||||||||||
| Income before income taxes | 94,785 | 84,555 | 87,753 | 80,188 | 75,979 | |||||||||||||||
| Provision for income taxes | 30,891 | 26,307 | 27,545 | 23,846 | 25,982 | |||||||||||||||
| Net income | $ | 63,894 | $ | 58,248 | $ | 60,208 | $ | 56,342 | $ | 49,997 | ||||||||||
| Net income per common share: | ||||||||||||||||||||
| Basic | $ | 2.75 | $ | 2.52 | $ | 2.63 | $ | 2.52 | $ | 2.28 | ||||||||||
| Diluted | $ | 2.72 | $ | 2.49 | $ | 2.59 | $ | 2.47 | $ | 2.23 | ||||||||||
| Weighted average common shares: | ||||||||||||||||||||
| Basic | 23,208,686 | 23,073,940 | 22,874,842 | 22,401,068 | 21,880,554 | |||||||||||||||
| Diluted | 23,508,418 | 23,385,061 | 23,244,241 | 22,810,793 | 22,390,914 | |||||||||||||||
| Dividends per share | — | $ | 2.00 | — | — | — | ||||||||||||||
| Other Financial Data: | ||||||||||||||||||||
| Capital expenditures | $ | 20,864 | $ | 20,897 | $ | 28,920 | $ | 42,017 | $ | 17,841 | ||||||||||
| 19 |
| As of | ||||||||||||||||||||
| April 2, | March 28, | March 29, | March 30, | March 31, | ||||||||||||||||
| 2016 | 2015 | 2014 | 2013 | 2012 | ||||||||||||||||
| (in thousands) | ||||||||||||||||||||
| Balance Sheet Data: | ||||||||||||||||||||
| Cash and cash equivalents | $ | 39,208 | $ | 125,455 | $ | 121,207 | $ | 114,480 | $ | 68,621 | ||||||||||
| Working capital | 340,640 | 383,366 | 374,725 | 326,953 | 270,434 | |||||||||||||||
| Total assets | 1,098,510 | 632,073 | 620,993 | 542,442 | 459,518 | |||||||||||||||
| Total debt | 363,696 | 9,198 | 10,447 | 10,300 | 1,041 | |||||||||||||||
| Total stockholders' equity | 620,947 | 549,433 | 538,452 | 462,195 | 385,815 | |||||||||||||||
| (1) | Net sales were $597.5 million in fiscal 2016 compared to $445.3 million in fiscal 2015, an increase of $152.2 million. Net sales in fiscal 2016 included net sales of $172.6 million for Sargent Aerospace and Defense (“Sargent”) which was acquired in April 2015. |
Net sales were $445.3 million in fiscal 2015 compared to $418.9 million in fiscal 2014, an increase of $26.4 million. Net sales in fiscal 2015 included net sales of $19.5 million for Climax Metal Products (“CMP”) and Turbine Components Inc. (“TCI”), which were acquired in August 2013 and October 2013, respectively
Net sales were $418.9 million in fiscal 2014 compared to $403.1 million in fiscal 2013, an increase of $15.8 million. Net sales in fiscal 2014 included net sales of $15.6 million for Western Precision Aero LLC (“WPA”), Climax Metal Products (“CMP”) and Turbine Components Inc. (“TCI”), which were acquired in March 2013, August 2013 and October 2013, respectively.
Net sales were $403.1 million in fiscal 2013 compared to $397.5 million in fiscal 2012, an increase of $5.6 million. Net sales in fiscal 2013 included net sales of $0.3 million for WPA.
ITEM 7. MANAGEMENT’S DISCUSSION AND ANALYSIS OF FINANCIAL CONDITION AND RESULTS OF OPERATIONS
The financial and business analysis below provides information which we believe is relevant to an assessment and understanding of our consolidated financial position, results of operations and cash flows. This financial and business analysis should be read in conjunction with the consolidated financial statements and related notes. All references to “Notes” in this Item 7 refer to the “Notes to Consolidated Financial Statements” included in Item 8 of the Annual Report on Form 10-K.
The following discussion and certain other sections of this Annual Report on Form 10-K contain statements reflecting our views about our future performance that constitute “forward-looking statements” under the Private Securities Litigation Reform Act of 1995. These forward-looking statements are based on current expectations, estimates, forecasts and projections about the industry and markets in which we operate and our beliefs and assumptions. Any statements contained herein (including without limitation statements to the effect that we or our management “believes,” “expects,” “anticipates,” “plans” and similar expressions) that are not statements of historical fact should be considered forward-looking statements. These statements are not guarantees of future performance and involve certain risks, uncertainties and assumptions that are difficult to predict. There are a number of important factors that could cause actual results to differ materially from those indicated by such forward-looking statements. These factors include, without limitation, those set forth, or incorporated by reference, below under the heading “Cautionary Statements.” We do not intend to update publicly any forward-looking statements whether as a result of new information, future events or otherwise.
| 20 |
Overview
We are a well-known international manufacturer of highly engineered precision bearings and components. Our precision solutions are integral to the manufacture and operation of most machines and mechanical systems, reduce wear to moving parts, facilitate proper power transmission and reduce damage and energy loss caused by friction. While we manufacture products in all major bearing categories, we focus primarily on the higher end of the bearing market where we believe our value added manufacturing and engineering capabilities enable us to differentiate ourselves from our competitors and enhance profitability. We believe our unique expertise has enabled us to garner leading positions in many of the product markets in which we primarily compete. With 37 facilities, of which 33 are manufacturing facilities in five countries, we have been able to significantly broaden our end markets, products, customer base and geographic reach. We have a fiscal year consisting of 52 or 53 weeks, ending on the Saturday closest to March 31. Based on this policy fiscal year 2016 had 53 weeks; fiscal 2015 and fiscal 2014 contained 52 weeks. We currently operate under four reportable business segments: Plain Bearings; Roller Bearings; Ball Bearings; and Engineered Products. The following further describes these reportable segments:
Plain Bearings. Plain bearings are produced with either self-lubricating or metal-to-metal designs and consists of several sub-classes, including rod end bearings, spherical plain bearings and journal bearings. Unlike ball bearings, which are used in high-speed rotational applications, plain bearings are primarily used to rectify inevitable misalignments in various mechanical components.
Roller Bearings. Roller bearings are anti-friction bearings that use rollers instead of balls. We manufacture four basic types of roller bearings: heavy duty needle roller bearings with inner rings, tapered roller bearings, track rollers and aircraft roller bearings.
Ball Bearings. We manufacture four basic types of ball bearings: high precision aerospace, airframe control, thin section and commercial ball bearings which are used in high-speed rotational applications.
Engineered Products. Engineered Products consists of highly engineered hydraulics, fasteners, collets and precision components used in aerospace, marine and industrial applications
Purchasers of bearings and engineered products include industrial equipment and machinery manufacturers, producers of commercial and military aerospace equipment such as missiles and radar systems, agricultural machinery manufacturers, construction, energy, mining and specialized equipment manufacturers, marine products, automotive and commercial truck manufacturers. The markets for our products are cyclical, and we have endeavored to mitigate this cyclicality by entering into sole-source relationships and long-term purchase agreements, through diversification across multiple market segments within the aerospace and industrial segments, by increasing sales to the aftermarket and by focusing on developing highly customized solutions.
Currently, our strategy is built around maintaining our role as a leading manufacturer of precision bearings and components through the following efforts:
| · | Developing innovative solutions. By leveraging our design and manufacturing expertise and our extensive customer relationships, we continue to develop new products for markets in which there are substantial growth opportunities. |
| · | Expanding customer base and penetrating end markets. We continually seek opportunities to access new customers, geographic locations and bearing platforms with existing products or profitable new product opportunities. |
| · | Increasing aftermarket sales. We believe that increasing our aftermarket sales of replacement parts will further enhance the continuity and predictability of our revenues and enhance our profitability. Such sales included sales to third party distributors, sales to OEMs for replacement products and aftermarket services. We will increase the percentage of our revenues derived from the replacement market by continuing to implement several initiatives. |
| · | Pursuing selective acquisitions. The acquisition of businesses that complement or expand our operations has been and continues to be an important element of our business strategy. We believe that there will continue to be consolidation within the industry that may present us with acquisition opportunities. |
We have demonstrated expertise in acquiring and integrating bearing and precision engineered component manufacturers that have complementary products or distribution channels and provide significant potential for margin enhancement. We have consistently increased the profitability of acquired businesses through a process of methods and systems improvement coupled with the introduction of complementary and proprietary new products. Since October 1992 we have completed 24 acquisitions, which have broadened our end markets, products, customer base and geographic reach.
| 21 |
The following items highlight the most recent significant events:
| · | In the first quarter of fiscal 2016, subsequent to the close of the fiscal 2015 year, we acquired Sargent for $500.0 million financed through a combination of cash on hand and senior debt. Headquartered in Tucson, Arizona, Sargent is a leader in precision-engineered products, solutions and repairs for aircraft airframes and engines, rotorcraft, submarines and land vehicles. Sargent manufactures sells, and services hydraulic valves and actuators, specialty bearings, specialty fasteners, seal rings & alignment joints, and precision components under leading brands including Kahr Bearing, Airtomic, Sonic Industries, Sargent Controls and Sargent Aerospace & Defense. Annual sales are approximately $195.0 million and the company has over 750 employees in six facilities in three countries. |
| · | In connection with the Sargent acquisition on April 24, 2015, we entered into a Credit Agreement (the “Credit Agreement”) and related Guarantee, Pledge Agreement and Security Agreement with Wells Fargo Bank, National Association, as Administrative Agent, Collateral Agent, Swingline Lender and Letter of Credit Issuer and the other lenders party thereto. The Credit Agreement provides RBCA, as Borrower, with (a) a $200.0 million term loan facility (the “Term Loan Facility”) and (b) a $350.0 million revolving credit facility (the “Revolving Credit Facility” and together with the Term Loan Facility, the “Facilities”). |
| · | In the second quarter of fiscal 2015, we reached a decision to consolidate the manufacturing capacity of the United Kingdom (U.K.) facility into our other manufacturing facilities. This decision was based on our intent to better align manufacturing abilities and product development. |
| · | In the third quarter of fiscal 2014, we acquired the net assets of TCI for approximately $3.9 million. Located in San Diego, California, TCI is an FAA certified aircraft gas turbine repair station and manufacturer of precision components for aerospace markets. |
Outlook
We ended fiscal 2016 with a backlog of $346.4 million compared to $209.6 million for the same period last fiscal year. Our net sales increased 34.2% year over year due to a 59.6% growth in the aerospace markets and 2.9% in the industrial markets. We expect to see growth in the industrial markets resulting from the overall economic improvement of the general industrial markets and continued growth in aerospace tied to the aircraft build rates and positive movement in defense spending. Our internal goal is to grow our industrial business at a pace of 2.0 to 2.5 times Gross Domestic Product (“GDP”) on a compounded basis.
Management believes that operating cash flows and available credit under the credit facilities will provide adequate resources to fund internal and external growth initiatives for the foreseeable future. As of April 2, 2016, we had cash and cash equivalents of $39.2 million of which approximately $29.3 million was cash held by our foreign operations. We expect that our undistributed foreign earnings will be re-invested indefinitely for working capital, internal growth and acquisitions for and by our foreign entities.
Sources of Revenue
Revenue is generated primarily from sales of products to the industrial market and the aerospace markets. Sales are often made pursuant to sole-source relationships, long-term agreements and purchase orders with our customers. We recognize revenues principally from the sale of products at the point of passage of title, which is at the time of shipment, except for certain customers for which it occurs when the products reach their destination.
We also recognize revenue on a Ship-In-Place basis for two customers who have required that we hold the product after final production is complete. In this case, a written agreement has been executed (at the customer’s request) whereby the customer accepts the risk of loss for product that is invoiced under the Ship-In-Place arrangement. For each transaction for which revenue is recognized under a Ship-In-Place arrangement, all final manufacturing inspections have been completed and customer acceptance has been obtained. In the twelve months ended April 2, 2016, 2.1% of our total net sales was recognized under Ship-In-Place transactions.
Sales to the industrial market accounted for 34% of our net sales for the fiscal year ended April 2, 2016. Sales to the aerospace and defense markets accounted for 66% of our net sales for the same period.
| 22 |
Aftermarket sales of replacement parts for existing equipment platforms and aftermarket services represented approximately 46% of our net sales for fiscal 2016. We continue to develop our OEM relationships which have established us as a leading supplier on many important industrial, aerospace and defense platforms. Over the past several years, we have experienced increased demand from the replacement parts market, particularly within the diversified industrial sectors; one of our business strategies has been to increase the proportion of sales derived from this sector and from aerospace and defense. We believe these activities increase the stability of our revenue base, strengthen our brand identity and provide multiple paths for revenue growth.
Approximately 13% of our net sales were generated by our international facilities for fiscal 2016, compared to 16% for fiscal 2015. We expect that this proportion will increase as we seek to increase our penetration of foreign markets. Our top ten customers generated 33% and 28% of our net sales in fiscal 2016 and fiscal 2015, respectively. Out of the 33% of net sales generated by our top ten customers during the fiscal year ended April 2, 2016, 20% of net sales were generated by our top four customers compared to 15% for the comparable period last fiscal year.
Cost of Revenues
Cost of sales includes employee compensation and benefits, raw materials, outside processing, depreciation of manufacturing machinery and equipment, supplies and manufacturing overhead.
Approximately 12% to 25% of our costs, depending on product mix, are attributable to raw materials and purchased components, a majority of which are related to steel and related products. During fiscal 2016, steel prices remained flat with slight variances up and down throughout the fiscal year. When we do experience raw material inflation, we offset these cost increases by changing our buying patterns, expanding our vendor network and passing through price increases when possible. The overall impact on raw material costs for this fiscal year was not material as a percent change on a year over year basis.
We monitor gross margin performance through a process of monthly operation reviews with all our divisions. We develop new products to target certain markets allied to our strategies by first understanding volume levels and product pricing and then constructing manufacturing strategies to achieve defined margin objectives. We only pursue product lines where we believe that the developed manufacturing process will yield the targeted margins. Management monitors gross margins of all product lines on a monthly basis to determine which manufacturing processes or prices should be adjusted.
Fiscal 2016 Compared to Fiscal 2015
Results of Operations
| FY16 | FY15 | $ Change | % Change | |||||||||||||
| Organic net sales | $ | 424.9 | $ | 445.3 | $ | (20.4 | ) | (4.6 | )% | |||||||
| Sales by recent acquisitions | 172.6 | — | 172.6 | |||||||||||||
| Total net sales | $ | 597.5 | $ | 445.3 | $ | 152.2 | 34.2 | % | ||||||||
| Net income | $ | 63.9 | $ | 58.2 | $ | 5.7 | 9.7 | % | ||||||||
| Net income per common share: Diluted | $ | 2.72 | $ | 2.49 | ||||||||||||
| Weighted average common shares: Diluted | 23,508,418 | 23,385,061 | ||||||||||||||
Net sales increased $152.2 million or 34.2% for fiscal 2016 over fiscal 2015. This increase was mainly the result of a 59.6% increase in net sales to the aerospace markets combined with a 2.9% increase in industrial net sales of $3.0 million.
| 23 |
Organic net sales decreased 4.6% compared to the prior fiscal year. Excluding a negative foreign exchange impact, organic net sales decreased 3.9%. Our aerospace markets decreased 0.6% mainly driven by defense and the industrial markets decreased 9.5% mainly driven by oil and gas.
Net income increased by $5.7 million to $63.9 million for fiscal 2016 compared to fiscal 2015. Excluding the after tax impact of $3.4 million in costs and $4.8 million in inventory purchase accounting associated with the Sargent acquisition, $0.7 million of costs associated with integration and restructuring, litigation reserve of $1.1 million and $0.1 million loss on extinguishment of debt offset $0.2 million of discrete tax benefit, net income would have been $73.8 million.
Gross Margin
| FY16 | FY15 | $ Change | % Change | |||||||||||||
| Gross Margin | $ | 218.8 | $ | 170.1 | $ | 48.7 | 28.6 | % | ||||||||
| Gross Margin % | 36.6 | % | 38.2 | % | ||||||||||||
Gross margin increased $48.7 million or 28.6% for fiscal 2016 compared to the same period last fiscal year. Excluding the unfavorable impact of $7.2 million of inventory purchase accounting associated with the Sargent acquisition, gross margin would have been $226.0 million. Organic gross margin as a percent of net sales was 38.9% compared to an adjusted 39.0% last fiscal year.
Selling, General and Administrative
| FY16 | FY15 | $ Change | % Change | |||||||||||||
| SG&A | $ | 98.7 | $ | 75.9 | $ | 22.8 | 30.1 | % | ||||||||
| % of net sales | 16.5 | % | 17.1 | % | ||||||||||||
SG&A decreased as a percentage of net sales to 16.5% in fiscal 2016 from 17.1% in fiscal 2015. SG&A expenses increased by $22.8 million to $98.7 million for fiscal 2016 compared to fiscal 2015. Excluding the impact of the Sargent acquisition of $17.7 million, the increase was primarily due to higher personnel expenses of $2.6 million, an increase in incentive stock compensation of $1.9 million, and increases in professional fees of $0.3 million and other miscellaneous expenses of $0.3 million.
Other Income (Expense)
| FY16 | FY15 | $ Change | % Change | |||||||||||||
| Other, net | $ | 16.2 | $ | 5.8 | $ | 10.4 | 179.5 | % | ||||||||
| % of net sales | 2.7 | % | 1.3 | % | ||||||||||||
Other operating expenses for fiscal 2016 totaled $16.2 million compared to $5.8 million for fiscal 2015. For fiscal 2016 other operating expenses were comprised of $9.0 million in amortization of intangibles, $5.1 million of acquisition related costs, $1.7 million litigation reserve, $1.0 million in integration and restructuring costs offset by other income of $0.6 million. For fiscal 2015 other operating expense primarily consisted of $2.8 million related to the consolidation and restructuring of the U.K. facility, $1.8 million of amortization of intangibles and $1.5 million associated with acquisition activity offset by other income of $0.3 million.
Interest Expense, Net
| FY16 | FY15 | $ Change | % Change | |||||||||||||
| Interest expense | $ | 8.7 | $ | 1.1 | $ | 7.6 | 726.7 | % | ||||||||
| % of net sales | 1.5 | % | 0.2 | % | ||||||||||||
Interest expense, net, generally consists of interest charged on our Wells Fargo Credit Agreement, mortgage, and other borrowings, offset by interest income (see “Liquidity and Capital Resources – Liquidity”, below). Interest expense, net was $8.7 million for fiscal 2016 compared to $1.1 million for 2015.
| 24 |
Other Non-Operating Expense (Income)
| FY16 | FY15 | $ Change | % Change | |||||||||||||
| Other non-operating expense (income) | $ | 0.3 | $ | 2.8 | ($ | 2.5 | ) | (88.2 | )% | |||||||
| % of net sales | 0.1 | % | 0.6 | % | ||||||||||||
Other non-operating expense for fiscal 2015 totaled $2.8 million, consisting primarily of the negative impact of the removal of the foreign exchange cap of Swiss Francs 1.20 against the Euro.
Income Taxes
| FY16 | FY15 | |||||||
| Income tax expense | $ | 30.9 | $ | 26.3 | ||||
| Effective tax rate with discrete items | 32.6 | % | 31.1 | % | ||||
| Effective tax rate without discrete items | 32.8 | % | 33.8 | % | ||||
Income tax expense for fiscal 2016 was $30.9 million compared to $26.3 million for fiscal 2015. Our effective income tax rate for fiscal 2016 was 32.6% compared to 31.1% for fiscal 2015. In addition to discrete items, the effective income tax rates are different from the U.S. statutory rate due to a special manufacturing deduction in the U.S. and foreign income taxed at lower rates which decrease the rate, and state income taxes which increase the rate. The effective income tax rate for fiscal 2016 of 32.6% includes discrete items of $0.2 million which are comprised substantially of unrecognized tax benefits associated with federal and state income tax audits closing, the expiration of statutes of limitations and an item associated with federal legislation reinstating the U.S. research credit. The effective income tax rate for fiscal 2016 without these discrete items would have been 32.8%. The effective income tax rate of 31.1% for fiscal 2015 includes discrete items in the amount of $5.5 million which are substantially comprised items associated with the consolidation and restructuring of the Company’s U.K. manufacturing facility and unrecognized tax benefits associated with federal and state income tax audits closing and the expiration of statutes of limitations. The effective income tax rate for fiscal 2015 without these discrete items would have been 33.8%.
Segment Information
We have four reportable product segments: Plain Bearings, Roller Bearings, Ball Bearings and Engineered Products. In fiscal 2016 we integrated the Sargent businesses into our Plain Bearings and Engineered Products segments (see Notes 3 and 18). We use net sales and gross margin as the primary measurement to assess the financial performance of each reportable segment. The presentation of segment net sales includes a reconciliation to adjust for the effects of any acquisitions made in fiscal 2016 and fiscal 2015.
Plain Bearing Segment:
| FY16 | FY15 | $ Change | % Change | |||||||||||||
| Organic net sales | $ | 228.2 | $ | 230.2 | $ | (2.0 | ) | (0.8 | )% | |||||||
| Sales by recent acquisitions | 42.3 | — | 42.3 | |||||||||||||
| Total net sales | $ | 270.5 | $ | 230.2 | $ | 40.3 | 17.5 | % | ||||||||
| Gross margin | $ | 103.5 | $ | 86.1 | $ | 17.4 | 20.3 | % | ||||||||
| Gross margin % | 38.3 | % | 37.4 | % | ||||||||||||
| SG&A | $ | 21.0 | $ | 18.7 | $ | 2.3 | 12.1 | % | ||||||||
| % of segment net sales | 7.8 | % | 8.1 | % | ||||||||||||
| 25 |
Net sales increased $40.3 million, or 17.5%, for fiscal 2016 compared to fiscal 2015. Excluding the $42.3 million impact of acquisition volume from Sargent, net sales decreased $2.0 million, or 0.8%, compared to fiscal 2015. The net sales decrease of $2.0 million for this segment was mostly attributable to a net sales increase to the aerospace sector of $2.5 million offset by a net sales decrease of $2.6 million to the industrial sector, driven mainly by oil and gas, general industrial distribution and an unfavorable foreign exchange impact of $1.9 million.
Gross margin increased $17.4 million for fiscal 2016 compared to fiscal 2015. Excluding the $18.5 million impact from the Sargent acquisition, the segment achieved a gross margin of $85.0 million for fiscal 2016, a decrease of $1.1 million, over fiscal 2015. The decrease in gross margin was primarily due to unfavorable foreign exchange of $0.6 million and product mix of $0.5 million.
Roller Bearing Segment:
| FY16 | FY15 | $ Change | % Change | |||||||||||||
| Organic net sales | $ | 112.0 | $ | 128.7 | $ | (16.7 | ) | (12.9 | )% | |||||||
| Sales by recent acquisitions | — | — | — | |||||||||||||
| Total net sales | $ | 112.0 | $ | 128.7 | $ | (16.7 | ) | (12.9 | )% | |||||||
| Gross margin | $ | 47.5 | $ | 50.0 | $ | (2.5 | ) | (5.1 | )% | |||||||
| Gross margin % | 42.4 | % | 38.9 | % | ||||||||||||
| SG&A | $ | 6.0 | $ | 6.2 | $ | (0.2 | ) | (3.4 | )% | |||||||
| % of segment net sales | 5.3 | % | 4.8 | % | ||||||||||||
Net sales decreased $16.7 million, or 12.9%, compared to fiscal 2015. This decrease was attributable to net sales decreases to the industrial sector of $13.4 million mainly driven by oil and gas and general industrial markets and to the aerospace sector of $3.3 million mainly driven by defense.
The Roller Bearings segment achieved a gross margin of $47.5 million in fiscal 2016 compared to $50.0 million in fiscal 2015. Excluding the impact of the consolidation and restructuring of the U.K. facility of $3.7 million, gross margin would have been $53.7 million for fiscal 2015. The decrease in gross margin was primarily due to the impact of decreased volume of $3.9 million and product mix of $2.6 million offset by cost reductions of $0.3 million.
Ball Bearing Segment:
| FY16 | FY15 | $ Change | % Change | |||||||||||||
| Organic net sales | $ | 53.7 | $ | 56.5 | $ | (2.8 | ) | (5.0 | )% | |||||||
| Sales by recent acquisitions | — | — | — | |||||||||||||
| Total net sales | $ | 53.7 | $ | 56.5 | $ | (2.8 | ) | (5.0 | )% | |||||||
| Gross margin | $ | 21.4 | $ | 22.5 | $ | (1.1 | ) | (5.1 | )% | |||||||
| Gross margin % | 39.8 | % | 39.9 | % | ||||||||||||
| SG&A | $ | 5.5 | $ | 5.3 | $ | 0.2 | 3.5 | % | ||||||||
| % of segment net sales | 10.3 | % | 9.4 | % | ||||||||||||
| 26 |
Net sales decreased $2.8 million, or 5.0%, for fiscal 2016 compared to fiscal 2015. This decrease was attributable to net sales decreases to the industrial sector of $1.2 million due mainly to general industrial markets and to the aerospace and defense sector of $1.6 million.
Gross margin decreased $1.1 million or 5.1% for fiscal 2016 compared to fiscal 2015. The decrease was primarily due to the unfavorable impact of decreased volume and product mix of $1.1 million.
Engineered Products Segment:
| FY16 | FY15 | $ Change | % Change | |||||||||||||
| Organic net sales | $ | 30.9 | $ | 29.9 | $ | 1.0 | 3.5 | % | ||||||||
| Sales by recent acquisitions | 130.3 | — | 130.3 | |||||||||||||
| Total net sales | $ | 161.2 | $ | 29.9 | $ | 131.3 | 438.5 | % | ||||||||
| Gross margin | $ | 46.5 | $ | 11.5 | $ | 35.0 | 301.9 | % | ||||||||
| Gross margin % | 28.9 | % | 38.7 | % | ||||||||||||
| SG&A | $ | 19.6 | $ | 4.0 | $ | 15.6 | 388.6 | % | ||||||||
| % of segment net sales | 12.2 | % | 13.4 | % | ||||||||||||
Net sales increased $131.3 million, or 438.5%, in fiscal 2016 compared to the same period last fiscal year. Our net sales to aerospace markets increased 1,894.8% while our net sales to industrial markets increased 88.6%. Organic net sales increased 3.5% compared to last fiscal year driven mainly by aerospace. Net sales to aerospace markets increased 40.1% offset by a decrease in net sales to industrial markets of 5.3%. The increase in aerospace net sales was mainly due to the commercial aerospace distribution market. The decrease in industrial sales was mostly driven by the general industrial markets.
Excluding the $35.1 million impact from the Sargent acquisition (which included a $7.2 million negative purchase accounting adjustment), the gross margin decrease of $0.1 million was mostly attributable to product mix.
Corporate:
| FY16 | FY15 | $ Change | % Change | |||||||||||||
| SG&A | $ | 46.6 | $ | 41.7 | $ | 4.9 | 11.9 | % | ||||||||
| % of total net sales | 7.8 | % | 9.4 | % | ||||||||||||
Corporate SG&A increased $4.9 million or 11.9% for fiscal 2016 compared to fiscal 2015. This was primarily due to higher personnel-related expenses of $2.1 million, and increases in stock compensation of $1.9 million, professional fees of $0.4 million and miscellaneous expenses of $0.5 million.
Fiscal 2015 Compared to Fiscal 2014
Results of Operations
| FY15 | FY14 | $ Change | % Change | |||||||||||||
| Net sales | $ | 445.3 | $ | 418.9 | $ | 26.4 | 6.3 | % | ||||||||
| Net income | $ | 58.2 | $ | 60.2 | $ | (2.0 | ) | (3.3 | )% | |||||||
| Net income per common share: Diluted | $ | 2.49 | $ | 2.59 | ||||||||||||
| Weighted average common shares: Diluted | 23,385,061 | 23,244,241 | ||||||||||||||
Net sales increased $26.4 million or 6.3% for fiscal 2015 over fiscal 2014. The increase in net sales was mainly the result of an 11.9% increase in industrial sales and a 2.2% increase in aerospace and defense. Growth in industrial sales was driven by volume increases in construction, oil and gas, the general industrial markets, and the acquisition of CMP. The aerospace and defense increase was driven by commercial aircraft build rates.
| 27 |
Net income decreased by $2.0 million to $58.2 million for fiscal 2015 compared to fiscal 2014. Excluding the after tax impact of costs associated with the consolidation and restructuring of facilities, net income would have been $64.0 million for fiscal 2015, an increase of $3.8 million over fiscal 2014.
Gross Margin
| FY15 | FY14 | $ Change | % Change | |||||||||||||
| Gross Margin | $ | 170.1 | $ | 164.8 | $ | 5.3 | 3.2 | % | ||||||||
| Gross Margin % | 38.2 | % | 39.3 | % | ||||||||||||
Gross margin decreased as a percentage of net sales in fiscal 2015 compared to fiscal 2014 primarily due to consolidation and restructuring of the U.K. facility. Excluding the impact of the consolidation and restructuring of the U.K. facility, gross margin would have been $173.8 million for fiscal 2015, an increase of $9.0 million over fiscal 2014. This would have resulted in a gross margin percentage of sales of 39.0% in fiscal 2015 compared to 39.3% for fiscal 2014.
Selling, General and Administrative
| FY15 | FY14 | $ Change | % Change | |||||||||||||
| SG&A | $ | 75.9 | $ | 72.0 | $ | 3.9 | 5.5 | % | ||||||||
| % of net sales | 17.0 | % | 17.2 | % | ||||||||||||
SG&A decreased as a percentage of net sales to 17.0% in fiscal 2015 from 17.2% in fiscal 2014. SG&A expenses increased by $3.9 million to $75.9 million for fiscal 2015 compared to fiscal 2014. Excluding the impact of two acquisitions of $3.2 million, the increase of $7.1 million was primarily attributable to increases in personnel related expenses of $4.9 million and incentive stock compensation expense of $2.5 million, offset by a decrease in other costs of $0.3 million.
Other Income (Expense)
| FY15 | FY14 | $ Change | % Change | |||||||||||||
| Other, net | $ | 5.8 | $ | 4.2 | $ | 1.6 | 38.9 | % | ||||||||
| % of net sales | 1.3 | % | 1.0 | % | ||||||||||||
Other operating expenses for fiscal 2015 totaled $5.8 million compared to $4.2 million for fiscal 2014. For fiscal 2015 other operating expense primarily consisted of $2.8 million related to the consolidation and restructuring of the U.K. facility, $1.8 million of amortization of intangibles and $1.5 million associated with acquisition activity offset by other income of $0.3 million. In fiscal 2014, other, net consisted of $1.9 million of amortization of intangibles, $1.9 million related primarily to consolidations and restructuring and $0.5 million of acquisition costs offset by $0.1 million of other miscellaneous income.
Interest Expense, Net
| FY15 | FY14 | $ Change | % Change | |||||||||||||
| Interest expense | $ | 1.1 | $ | 1.0 | $ | 0.1 | 3.5 | % | ||||||||
| % of net sales | 0.2 | % | 0.2 | % | ||||||||||||
Interest expense, net, generally consists of interest charged on our JP Morgan Credit Agreement, mortgage, and other borrowings, offset by interest income (see “Liquidity and Capital Resources – Liquidity”, below). Interest expense, net was $1.1 million for fiscal 2015 compared to $1.0 million for 2014.
| 28 |
Other Non-Operating Expense (Income)
| FY15 | FY14 | $ Change | % Change | |||||||||||||
| Other non-operating expense (income) | $ | 2.8 | $ | (0.1 | ) | $ | 2.9 | 2,411.5 | % | |||||||
| % of net sales | 0.6 | % | 0.0 | % | ||||||||||||
Other non-operating expense for fiscal 2015 totaled $2.8 million, consisting primarily of the negative impact of the removal of the foreign exchange cap of Swiss Francs 1.20 against the Euro.
Income Taxes
| FY15 | FY14 | |||||||
| Income tax expense | $ | 26.3 | $ | 27.5 | ||||
| Effective tax rate with discrete items | 31.1 | % | 31.4 | % | ||||
| Effective tax rate without discrete items | 33.8 | % | 33.3 | % | ||||
Income tax expense for fiscal 2015 was $26.3 million compared to $27.5 million for fiscal 2014. Our effective income tax rate for fiscal 2015 was 31.1% compared to 31.4% for fiscal 2014. In addition to discrete items, the effective income tax rates are different from the U.S. statutory rate due to a special manufacturing deduction in the U.S. and foreign income taxed at lower rates which decrease the rate, and state income taxes and an officers’ compensation adjustment which increase the rate. The effective income tax rate for fiscal 2015 of 31.1% includes discrete items of $5.5 million which are comprised substantially of items associated with the consolidation and restructuring of the Company’s U.K. manufacturing facility and unrecognized tax benefits associated with federal and state income tax audits closing and the expiration of statutes of limitations. The effective income tax rate for fiscal 2015 without these discrete items would have been 33.8%. The effective income tax rate of 31.4% for fiscal 2014 includes discrete items in the amount of $1.7 million which are substantially comprised of the reversal of unrecognized tax benefits associated with federal and state income tax audits closing and the expiration of statutes of limitations. The effective income tax rate for fiscal 2014 without these discrete items would have been 33.3%.
Segment Information
We have four reportable product segments: Plain Bearings, Roller Bearings, Ball Bearings and Engineered Products. We use net sales and gross margin as the primary measurement to assess the financial performance of each reportable segment. The presentation of segment net sales includes a reconciliation to adjust for the effects of any acquisitions made in fiscal 2015 and fiscal 2014.
Plain Bearing Segment:
| FY15 | FY14 | $ Change | % Change | |||||||||||||
| Organic net sales | $ | 226.0 | $ | 220.8 | $ | 5.2 | 2.4 | % | ||||||||
| Sales by recent acquisitions | 4.2 | 2.3 | 1.9 | |||||||||||||
| Total net sales | $ | 230.2 | $ | 223.1 | $ | 7.1 | 3.2 | % | ||||||||
| Gross margin | $ | 86.1 | $ | 85.2 | $ | 0.9 | 1.1 | % | ||||||||
| Gross margin % | 37.4 | % | 38.2 | % | ||||||||||||
| SG&A | $ | 18.7 | $ | 17.9 | $ | 0.8 | 4.6 | % | ||||||||
| % of segment net sales | 8.1 | % | 8.0 | % | ||||||||||||
| 29 |
Net sales increased $7.1 million or 3.2% for fiscal 2015 compared to fiscal 2014. Excluding the $1.9 million impact of acquisition volume from TCI, net sales increased $5.2 million or 2.4% over fiscal 2014. The net sales increase of $5.2 million for this segment was mostly attributable to a net sales increase to the aerospace and defense sector of $6.5 million offset by a net sales decrease to the industrial sector of $0.9 million and a foreign exchange impact of $0.4 million.
Gross margin increased $0.9 million for fiscal 2015 compared to fiscal 2014. The increase of $0.9 million was primarily attributed to favorable impact in volume of $1.8 million offset by unfavorable impacts in product mix of $0.7 million and foreign exchange of $0.2 million. Excluding the impact of acquisitions of $0.1 million the segment achieved a gross margin of $86.0 million in fiscal 2015, or an increase of 1.0% over fiscal 2014.
Roller Bearing Segment:
| FY15 | FY14 | $ Change | % Change | |||||||||||||
| Organic net sales | $ | 128.7 | $ | 115.8 | $ | 12.9 | 11.1 | % | ||||||||
| Sales by recent acquisitions | — | — | — | |||||||||||||
| Total net sales | $ | 128.7 | $ | 115.8 | $ | 12.9 | 11.1 | % | ||||||||
| Gross margin | $ | 50.0 | $ | 48.8 | $ | 1.2 | 2.5 | % | ||||||||
| Gross margin % | 38.9 | % | 42.1 | % | ||||||||||||
| SG&A | $ | 6.2 | $ | 6.9 | $ | (0.7 | ) | (10.5 | )% | |||||||
| % of segment net sales | 4.8 | % | 6.0 | % | ||||||||||||
Net sales increased $12.9 million or 11.1% over fiscal 2014. This increase was attributable to sales increases to the diversified industrial sector of $11.3 million and in the aerospace and defense sector of $1.6 million. This segment was primarily affected by the favorable impacts of increased volume of $9.9 million and product mix of $2.5 million.
The Roller Bearings segment achieved a gross margin of $50.0 million in fiscal 2015 compared to $48.8 million in fiscal 2014. Excluding the impact of the consolidation of operations of $3.7 million gross margin would have increased $4.9 million over the same period last year. Excluding these impacts, the increase was primarily due to cost efficiencies of $1.3 million, a volume increase of $3.3 million and favorable product mix of $0.3 million.
Ball Bearing Segment:
| FY15 | FY14 | $ Change | % Change | |||||||||||||
| Organic net sales | $ | 41.2 | $ | 40.1 | $ | 1.1 | 2.7 | % | ||||||||
| Sales by recent acquisitions | 15.3 | 9.5 | 5.8 | |||||||||||||
| Total net sales | $ | 56.5 | $ | 49.6 | $ | 6.9 | 13.9 | % | ||||||||
| Gross margin | $ | 22.5 | $ | 18.1 | $ | 4.4 | 24.1 | % | ||||||||
| Gross margin % | 39.9 | % | 36.6 | % | ||||||||||||
| SG&A | $ | 5.3 | $ | 4.5 | $ | 0.8 | 18.1 | % | ||||||||
| % of segment net sales | 9.4 | % | 9.1 | % | ||||||||||||
| 30 |
Net sales increased $6.9 million or 13.9% for fiscal 2015 compared to fiscal 2014. This increase was attributable to net sales increases to the diversified industrial sector of $6.4 million and to the aerospace and defense sector of $0.5 million. Excluding the $5.8 million impact of acquisition volume from CMP, net sales increased $1.1 million or 2.7% over fiscal 2014. The $1.1 million increase was primarily due to the favorable impact of increased volume of $1.8 million offset by $0.7 million of unfavorable product mix.
Gross margin increased $4.4 million or 24.1% for fiscal 2015 compared to fiscal 2014. Excluding the $2.8 million favorable impact due to acquisitions, the increase was primarily due to the favorable impact of increased volume of $0.6 million and cost efficiencies of $1.0 million.
Engineered Products Segment:
| FY15 | FY14 | $ Change | % Change | |||||||||||||
| Organic net sales | $ | 29.9 | $ | 30.4 | $ | (0.5 | ) | (1.6 | )% | |||||||
| Sales by recent acquisitions | — | — | — | |||||||||||||
| Total net sales | $ | 29.9 | $ | 30.4 | $ | (0.5 | ) | (1.6 | )% | |||||||
| Gross margin | $ | 11.5 | $ | 12.7 | $ | (1.2 | ) | (9.0 | )% | |||||||
| Gross margin % | 38.7 | % | 41.8 | % | ||||||||||||
| SG&A | $ | 4.0 | $ | 4.0 | — | 0.7 | % | |||||||||
| % of segment net sales | 13.4 | % | 13.1 | % | ||||||||||||
The Engineered Products segment is focused mainly on the sale of machine tool collets and precision components. During fiscal 2015 net sales decreased $0.5 million to $29.9 million from $30.4 million in fiscal 2014. This decrease was primarily attributable to net sale decreases to the aerospace and defense sector of $2.3 million offset by increases to the diversified industrial sector of $1.8 million.
Corporate:
| FY15 | FY14 | $ Change | % Change | |||||||||||||
| SG&A | $ | 41.7 | $ | 38.7 | $ | 3.0 | 7.8 | % | ||||||||
| % of total net sales | 9.4 | % | 9.2 | % | ||||||||||||
Corporate SG&A increased $3.0 million or 7.8% for fiscal 2015 compared to fiscal 2014. This was primarily due to an increase in stock compensation of $2.5 million and personnel – related expenses of $0.5 million.
| 31 |
Liquidity and Capital Resources
Our business is capital intensive. Our capital requirements include manufacturing equipment and materials. In addition, we have historically fueled our growth in part through acquisitions. We have historically met our working capital, capital expenditure requirements and acquisition funding needs through our net cash flows provided by operations, various debt arrangements and sale of equity to investors. We believe that operating cash flows and available credit under the credit facilities will provide adequate resources to fund internal and external growth initiatives for the foreseeable future.
Our ability to meet future working capital, capital expenditures and debt service requirements will depend on our future financial performance, which will be affected by a range of economic, competitive and business factors, particularly interest rates, cyclical changes in our end markets and prices for steel and our ability to pass through price increases on a timely basis, many of which are outside of our control. In addition, future acquisitions could have a significant impact on our liquidity position and our need for additional funds.
From time to time we evaluate our existing facilities and operations and their strategic importance to us. If we determine that a given facility or operation does not have future strategic importance, we may sell, partially or completely, relocate production lines, consolidate or otherwise dispose of those operations. Although we believe our operations would not be materially impaired by such dispositions, relocations or consolidations, we could incur significant cash or non-cash charges in connection with them.
Liquidity
As of April 2, 2016, we had cash and cash equivalents of $39.2 million of which approximately $29.3 million was cash held by our foreign operations. We expect that our undistributed foreign earnings will be re-invested indefinitely for working capital, internal growth and acquisitions for and by our foreign entities.
On May 16, 2014, our Board declared a special cash dividend to shareholders of $2.00 per common share or a total of approximately $46.0 million. The special dividend was payable on June 13, 2014, to shareholders of record on May 30, 2014. The ex-dividend date was May 28, 2014. The Board opted for a special dividend payment, rather than a regular reoccurring dividend, to allow greater flexibility given our pipeline of attractive growth opportunities. The Board will, however, consider the use of additional special cash dividends in the future as circumstances warrant.
New Credit Facility
In connection with the Sargent acquisition on April 24, 2015, the Company entered into the New Credit Agreement and related Guarantee, Pledge Agreement and Security Agreement with Wells Fargo Bank, National Association, as Administrative Agent, Collateral Agent, Swingline Lender and Letter of Credit Issuer and the other lenders party thereto and terminated the JP Morgan Credit Agreement. The Credit Agreement provides RBCA, as Borrower, with (a) a $200 million Term Loan and (b) a $350 million Revolver and together with the Term Loan (the “Facilities”).
Amounts outstanding under the Facilities generally bear interest at (a) a base rate determined by reference to the higher of (1) Wells Fargo’s prime lending rate, (2) the federal funds effective rate plus 1/2 of 1% and (3) the one-month LIBOR rate plus 1% or (b) LIBOR rate plus a specified margin, depending on the type of borrowing being made. The applicable margin is based on the Company's consolidated ratio of total net debt to consolidated EBITDA from time to time. Currently, our margin is 0.5% for base rate loans and 1.5% for LIBOR rate loans. As of April 2, 2016, there was $169.0 million outstanding under the Revolver and $192.5 million outstanding under the Term Loan, offset by $5.8 million in debt issuance costs (original amount was $7.1 million).
The New Credit Agreement requires us to comply with various covenants, including among other things, financial covenants to maintain the following: (1) a ratio of consolidated net debt to adjusted EBITDA, not to exceed 3.50 to 1; and (2) a consolidated interest coverage ratio not to exceed 2.75 to 1. The New Credit Agreement allows us to, among other things, make distributions to shareholders, repurchase our stock, incur other debt or liens, or acquire or dispose of assets provided that we comply with certain requirements and limitations of the agreement. As of April 2, 2016, we were in compliance with all such covenants.
Our obligations under the New Credit Agreement are secured as well as providing for a pledge of substantially all of our assets. We and certain of our subsidiaries have also entered into a Guarantee to guarantee our obligations under the New Credit Agreement.
| 32 |
Approximately $3.3 million of the Revolver is being utilized to provide letters of credit to secure RBCA’s obligations relating to certain insurance programs. As of April 2, 2016, RBCA has the ability to borrow up to an additional $177.7 million under the Revolver.
Prior Credit Facility
On November 30, 2010, we and RBCA terminated the previous KeyBank Credit Agreement and the related credit, security and ancillary agreements, and entered into a new credit agreement (the “JP Morgan Credit Agreement”) and related security and guaranty agreements with certain banks, J.P. Morgan Chase Bank, N.A., as Administrative Agent, and J.P. Morgan Chase Bank, N.A. and KeyBank National Association as Co-Lead Arrangers and Joint Lead Book Runners. The JP Morgan Credit Agreement provided RBCA with a $150.0 million five-year senior secured revolving credit facility which could be increased by up to $100.0 million, in increments of $25.0 million, under certain circumstances and subject to certain conditions (including the receipt from one or more lenders of the additional commitment).
Amounts outstanding under the JP Morgan Credit Agreement generally bore interest at the prime rate, or LIBOR plus a specified margin, depending on the type of borrowing being made. The applicable margin was based on our consolidated ratio of net debt to adjusted EBITDA from time to time. As of March 28, 2015, our margin was 0.5% for prime rate loans and 1.5% for LIBOR rate loans.
The JP Morgan Credit Agreement required us to comply with various covenants, including among other things, financial covenants to maintain the following: (1) a ratio of consolidated net debt to adjusted EBITDA not to exceed 3.25 to 1; and (2) a consolidated fixed charge coverage ratio not to exceed 1.5 to 1. As of March 28, 2015, we were in compliance with all such covenants. The JP Morgan Credit Agreement allowed us to, among other things, make distributions to shareholders, repurchase our stock, incur other debt or liens, or acquire or dispose of assets provided that we complied with certain requirements and limitations of the credit agreement. The JP Morgan Credit Agreement was terminated and replaced by the New Credit Agreement discussed above.
Other Notes Payable
On October 1, 2012, Schaublin purchased the land and building, which it currently occupies and had been leasing, for 14.1 million CHF (approximately $15.0 million). Schaublin obtained a 20 year fixed rate mortgage for 9.3 million CHF (approximately $9.9 million) at an interest rate of 2.9%. The balance of the purchase price of 4.8 million CHF (approximately $5.1 million) was paid from cash on hand. As of April 2, 2016, the balance on this mortgage was 7.7 million CHF, or $8.0 million.
Cash Flows
Fiscal 2016 Compared to Fiscal 2015
The following table summarizes our cash flow activities:
| FY16 | FY15 | $ Change | ||||||||||
| Net cash provided by (used in): | ||||||||||||
| Operating activities | $ | 83.4 | $ | 71.8 | $ | 11.6 | ||||||
| Investing activities | (520.1 | ) | (17.9 | ) | (502.2 | ) | ||||||
| Financing activities | 349.8 | (46.0 | ) | 395.8 | ||||||||
| Effect of exchange rate changes on cash | 0.7 | (3.6 | ) | 4.3 | ||||||||
| (Decrease)/increase in cash and cash equivalents | $ | (86.2 | ) | $ | 4.3 | $ | (90.5 | ) | ||||
During fiscal 2016 we generated cash of $83.4 million from operating activities compared to $71.8 million for fiscal 2015. The increase of $11.6 million for fiscal 2016 was mainly the result of an increase in net income of $5.7 million and addition of non-cash charges of $7.5 million, offset by an unfavorable net change in operating assets and liabilities of $1.6 million.
| 33 |
The following chart summarizes the (unfavorable) favorable change in operating assets and liabilities of ($1.6) million for fiscal 2016 versus fiscal 2015 and $18.6 million for fiscal 2015 versus fiscal 2014.
| FY16 | FY15 | |||||||
| Cash provided by (used in): | ||||||||
| Accounts receivable | $ | 1.4 | $ | 4.0 | ||||
| Inventory | (12.0 | ) | 3.5 | |||||
| Prepaid expenses and other current assets | (5.3 | ) | 7.2 | |||||
| Other non-current assets | 0.9 | 0.6 | ||||||
| Accounts payable | (2.2 | ) | 2.5 | |||||
| Accrued expenses and other current liabilities | 10.9 | 5.7 | ||||||
| Other non-current liabilities | 4.7 | (4.9 | ) | |||||
| Total change in operating assets and liabilities: | $ | (1.6 | ) | $ | 18.6 | |||
During fiscal 2016, we used $520.1 million for investing activities as compared to $17.9 for fiscal 2015. The increase of cash used in investing activities of $502.2 million is primarily attributable to the $500.0 million used to finance the acquisition of Sargent.
During fiscal 2016, we generated $349.8 million from financing activities compared to using $46.0 million for fiscal 2015. This increase in cash generated was primarily attributable to the $225.0 million revolving credit facility and $200.0 million proceeds from the term loan associated with the acquisition of Sargent in the first quarter of fiscal 2016.
Fiscal 2015 Compared to Fiscal 2014
In the fiscal year ended March 28, 2015 we generated cash of $71.8 million from operating activities compared to $48.0 million for fiscal 2014. The increase of $23.8 million for fiscal 2015 was mainly a result of the addition of non-cash charges of $7.2 million and a favorable net change in operating assets and liabilities of $18.6 million, offset by a decrease in net income of $2.0 million. The favorable impact of the non-cash charges was primarily due to the consolidation and restructuring of the U.K. facility for $5.0 million in the second quarter of fiscal 2015. The favorable change in operating assets and liabilities was primarily the result of a decrease in the amount of cash being used for working capital items
In fiscal 2015, we used $17.9 million for investing activities as compared to $47.1 million for fiscal 2014. The decrease of cash used in investing activities of $29.2 million is primarily attributable to the proceeds received on the sale of short-term investments of $2.4 million offset by acquisitions in fiscal 2014 of $17.6 million.
In fiscal 2015, we used $46.0 million for financing activities compared to providing $3.8 million for fiscal 2014. This increase was primarily attributable to the $46.0 million dividend paid to shareholders in the first quarter of fiscal 2015.
Capital Expenditures
Our capital expenditures in fiscal 2016 were $20.9 million. We expect to make capital expenditures of approximately $21.0 to $23.0 million during fiscal 2017 in connection with our existing business. We have funded our fiscal 2016 capital expenditures, and expect to fund fiscal 2017 capital expenditures, principally through existing cash and internally generated funds. We may also make substantial additional capital expenditures in connection with acquisitions.
Contractual Obligations
The contractual obligations presented in the table below represent our estimates of future payments under fixed contractual obligations and commitments. Changes in our business needs, cancellation provisions and interest rates, as well as actions by third parties and other factors, may cause these estimates to change. Because these estimates are necessarily subjective, our actual payments in future periods are likely to vary from those presented in the table. The following table summarizes certain of our contractual obligations and principal and interest payments under our debt instruments and leases as of April 2, 2016:
| 34 |
| Payments Due By Period | ||||||||||||||||||||
| Contractual Obligations(1) | Total | Less than 1 Year | 1 to 3 Years | 3 to 5 Years | More than 5 Years | |||||||||||||||
| (in thousands) | ||||||||||||||||||||
| Total debt | $ | 369,512 | $ | 10,486 | $ | 33,471 | $ | 319,971 | $ | 5,584 | ||||||||||
| Operating leases | 15,629 | 5,451 | 7,411 | 2,103 | 664 | |||||||||||||||
| Interest on debt(2) | 28,852 | 7,016 | 13,263 | 7,624 | 949 | |||||||||||||||
| Pension and postretirement benefits | 19,055 | 1,826 | 3,788 | 3,895 | 9,546 | |||||||||||||||
| Total contractual cash obligations | $ | 433,048 | $ | 24,779 | $ | 57,933 | $ | 333,593 | $ | 16,743 | ||||||||||
| (1) | We cannot make a reasonably reliable estimate of when the unrecognized tax benefits of $13.8 million, which includes interest and penalties, and is offset by deferred tax assets, will be paid to the respective taxing authorities. These obligations are therefore excluded from the above table. |
| (2) | These amounts represent expected cash payments of interest on our variable rate long-term debt under our Facilities at the prevailing interest rates at April 2, 2016. |
Quarterly Results of Operations
| Quarter Ended | ||||||||||||||||||||||||||||||||
Apr. 2, 2016 | Dec.
26, 2015 | Sept. 26, 2015 | June 27, 2015 | Mar. 28, 2015 | Dec.
27, 2014 | Sept. 27, 2014 | June 28, 2014 | |||||||||||||||||||||||||
(Unaudited) (in thousands, except per share data) | ||||||||||||||||||||||||||||||||
| Net sales | $ | 162,252 | $ | 144,216 | $ | 148,696 | $ | 142,308 | $ | 113,417 | $ | 106,322 | $ | 112,555 | $ | 112,984 | ||||||||||||||||
| Gross margin | 60,375 | 53,521 | 52,118 | 52,764 | 44,915 | 41,653 | 39,751 | 43,821 | ||||||||||||||||||||||||
| Operating income | 30,829 | 27,052 | 23,599 | 22,361 | 25,333 | 20,589 | 18,297 | 24,211 | ||||||||||||||||||||||||
| Net income | $ | 18,924 | $ | 17,047 | $ | 14,519 | $ | 13,404 | $ | 14,929 | $ | 14,051 | $ | 13,248 | $ | 16,020 | ||||||||||||||||
| Net income per common share: | ||||||||||||||||||||||||||||||||
| Basic(1)(2) | $ | 0.81 | $ | 0.73 | $ | 0.63 | $ | 0.58 | $ | 0.65 | $ | 0.61 | $ | 0.57 | $ | 0.70 | ||||||||||||||||
| Diluted(1)(2) | $ | 0.81 | $ | 0.73 | $ | 0.62 | $ | 0.57 | $ | 0.64 | $ | 0.60 | $ | 0.57 | $ | 0.69 | ||||||||||||||||
| (1) | See Part II, Item 8. “Financial Statements and Supplementary Data,” Note 2 “Summary of Significant Accounting Policies-Net Income Per Common Share.” |
| (2) | Net income per common share is computed independently for each of the quarters presented. Therefore, the sum of the quarterly earnings per share may not necessarily equal the total for the year. |
Critical Accounting Policies
Our discussion and analysis of our financial condition and results of operations are based upon our consolidated financial statements, which have been prepared in accordance with U.S. generally accepted accounting principles. The preparation of these financial statements requires us to make estimates and judgments that affect the reported amounts of assets, liabilities, revenues and expenses and related disclosure of contingent assets and liabilities. On an on-going basis, we evaluate our estimates, including those related to product returns, bad debts, inventories, recoverability of intangible assets, income taxes, financing operations, pensions and other postretirement benefits and contingencies and litigation. We base our estimates on historical experience and on various other assumptions that are believed to be reasonable under the circumstances, the results of which form the basis for making judgments about the carrying values of assets and liabilities that are not readily apparent from other sources. Actual results may differ from these estimates under different assumptions or conditions.
We believe the following critical accounting policies affect our more significant judgments and estimates used in the preparation of our consolidated financial statements.
Revenue Recognition. In accordance with SEC Staff Accounting Bulletin 101 “Revenue Recognition in Financial Statements as amended by Staff Accounting Bulletin 104,” we recognize revenues principally from the sale of products at the point of passage of title, which is at the time of shipment, except for certain customers for which it occurs when the products reach their destination.
| 35 |
We also recognize revenue on a Ship-In-Place basis for two customers who have required that we hold the product after final production is complete. In this case, a written agreement has been executed (at the customer’s request) whereby the customer accepts the risk of loss for product that is invoiced under the Ship-In-Place arrangement. For each transaction for which revenue is recognized under a Ship-In-Place arrangement, all final manufacturing inspections have been completed and customer acceptance has been obtained. In the twelve months ended April 2, 2016, 2.1% of our total net sales was recognized under Ship-In-Place transactions.
Accounts Receivable. We are required to estimate the collectability of our accounts receivable, which requires a considerable amount of judgment in assessing the ultimate realization of these receivables, including the current credit-worthiness of each customer. Changes in required reserves may occur in the future as conditions in the marketplace change.
Inventory. Inventories are stated at the lower of cost or market value. Cost is determined by the first-in, first-out method. We account for inventory under a full absorption method. We record adjustments to the value of inventory based upon past sales history and forecasted plans to sell our inventories. The physical condition, including age and quality, of the inventories is also considered in establishing its valuation. These adjustments are estimates, which could vary significantly, either favorably or unfavorably, from actual requirements if future economic conditions, customer inventory levels or competitive conditions differ from our expectations.
Goodwill and Indefinite-Lived Intangible Assets. Goodwill (representing the excess of the amount paid to acquire a company over the estimated fair value of the net assets acquired) and Indefinite Lived Intangible Assets are not amortized but instead is tested for impairment annually, or when events or circumstances indicate that its value may have declined. Separate tests are performed for goodwill and indefinite lived intangible assets. We apply a qualitative test of impairment on the indefinite lived intangible assets. This is done by assessing the existence of events or circumstances which would make it more likely than not that impairment is present. No such factors were identified during our current year analysis. The determination of any goodwill impairment is made at the reporting unit level and consists of two steps. First, the Company determines the fair value of a reporting unit and compares it to its carrying amount. Second, if the carrying amount of the reporting unit exceeds its fair value, an impairment loss is recognized for any excess of the carrying amount of the reporting unit's goodwill over the goodwill's implied fair value. The Company the income approach (discounted cash flow method) in testing goodwill for impairment. The key assumptions used in the discounted cash flow method used to estimate fair value include discount rates, revenue growth rates, terminal growth rates and cash flow projections. Discount rates, growth rates and cash flow projections are the most sensitive and susceptible to change as they require significant management judgment. Discount rates are determined by using a weighted average cost of capital (“WACC”). The WACC considers market and industry data as well as Company-specific risk factors for each reporting unit in determining the appropriate discount rate to be used. The discount rate utilized for each reporting unit is indicative of the return an investor would expect to receive for investing in such a business. Terminal growth rate determination follows common methodology of capturing the present value of perpetual cash flow estimates beyond the last projected period assuming a constant WACC and long-term growth rates. The Company has determined that, to date, no impairment of goodwill exists and fair value of the reporting units exceeded the carrying value in total by approximately 74%. The fair value of the reporting units exceeds the carrying value by a minimum of 37% at each of the four reporting units. The Company performs the annual impairment testing during the fourth quarter of each fiscal year. Although no changes are expected, if the actual results of the Company are less favorable than the assumptions the Company makes regarding estimated cash flows, the Company may be required to record an impairment charge in the future.
Income Taxes. As part of the process of preparing the consolidated financial statements, we are required to estimate the income taxes in each jurisdiction in which we operate. This process involves estimating the actual current tax liabilities together with assessing temporary differences resulting from the differing treatment of items for tax and financial reporting purposes. These differences result in deferred tax assets and liabilities, which are included in the Consolidated Balance Sheet. We must then assess the likelihood that the deferred tax assets will be recovered, and to the extent that we believe that recovery is not more than likely, we are required to establish a valuation allowance. If a valuation allowance is established or increased during any period, we are required to include this amount as an expense within the tax provision in the Consolidated Statements of Operations. Significant judgment is required in determining our provision for income taxes, deferred tax assets and liabilities, accrual for uncertain tax positions and any valuation allowance recognized against net deferred tax assets.
Pension Plan and Postretirement Health Care. We have a noncontributory defined benefit pension plan covering union employees in our Heim division plant in Fairfield, Connecticut, our Bremen subsidiary plant in Plymouth, Indiana and former union employees of our Tyson subsidiary in Glasgow, Kentucky and Nice subsidiary in Kulpsville, Pennsylvania.
| 36 |
Our pension plan funding policy is to make the minimum annual contribution required by the Employee Retirement Income Security Act of 1974. Plan obligations and annual pension expense are determined by independent actuaries using a number of assumptions provided by us including assumptions about employee demographics, retirement age, compensation levels, pay rates, turnover, expected long-term rate of return on plan assets, discount rate and the amount and timing of claims. Each plan assumption reflects our best estimate of the plan's future experience. The most sensitive assumption in the determination of plan obligations for pensions is the discount rate. The discount rate that we use for determining future pension obligations is based on a review of long-term bonds that receive one of the two highest ratings given by a recognized rating agency. The discount rate determined on this basis has decreased from 4.10% at March 29, 2014, to 3.40% at March 28, 2015 and April 2, 2016. In developing the overall expected long-term rate of return on plan assets assumption, a building block approach was used in which rates of return in excess of inflation were considered separately for equity securities and debt securities. The excess returns were weighted by the representative target allocation and added along with an appropriate rate of inflation to develop the overall expected long-term rate of return on plan assets assumption. The expected long-term rate of return on the assets of our pension plan was 7.00% in fiscal 2016 and fiscal 2015.
Lowering the discount rate assumption used to determine net periodic pension cost by 1.00% (from 3.40% to 2.40%) would have increased our pension expense for fiscal 2016 by approximately $0.4 million. Increasing the discount rate assumption used to determine net periodic pension cost by 1.00% (from 3.40% to 4.40%) would have decreased our pension expense for fiscal 2016 by approximately $0.3 million.
Lowering the expected long-term rate of return on the assets of our pension plan by 1.00% (from 7.00% to 6.00%) would have increased our pension expense for fiscal 2016 by approximately $0.2 million. Increasing the expected long-term rate of return on the assets of our pension plan by 1.00% (from 7.00% to 8.00%) would have reduced our pension expense for fiscal 2016 by approximately $0.2 million.
Lowering the discount rate assumption used to determine the funded status as of April 2, 2016 by 1.00% (from 3.40% to 2.40%) would have increased the projected benefit obligation of our pension plan by approximately $3.2 million. Increasing the discount rate assumption used to determine the funded status as of April 2, 2016 by 1.00% (from 3.40% to 4.40%) would have reduced the projected benefit obligation of our pension plan by approximately $2.7 million.
Our investment program objective is to achieve a rate of return on plan assets which will fund the plan liabilities and provide for required benefits while avoiding undue exposure to risk to the plan and increases in funding requirements. Our long-term target allocation of plan assets is 70% equity and 30% fixed income investments.
Stock-Based Compensation. We recognize compensation cost relating to all share-based payment transactions in the financial statements based upon the grant-date fair value of the instruments issued over the requisite service period.
The fair value for our options was estimated at the date of grant using the Black-Scholes option pricing model with the following weighted-average assumptions:
| Fiscal Year Ended | ||||||||||||
| April 2, 2016 | March 28, 2015 | March 29, 2014 | ||||||||||
| Dividend yield | 0.0 | % | 0.0 | % | 0.0 | % | ||||||
| Expected weighted-average life (yrs.) | 5.0 | 4.8 | 4.8 | |||||||||
| Risk-free interest rate | 1.70 | % | 1.60 | % | 1.04 | % | ||||||
| Expected volatility | 31.2 | % | 33.2 | % | 45.2 | % | ||||||
The Black-Scholes option pricing model was developed for use in estimating the fair value of traded options which have no vesting restrictions and are fully transferable. In addition, option valuation models require the input of highly subjective assumptions, including the expected stock price volatility. Because our options have characteristics significantly different from those of traded options, and because changes in the subjective input assumptions can materially affect the fair value estimate, the existing models do not necessarily provide a reliable single measure of the fair value of our options.
Impact of Inflation, Changes in Prices of Raw Materials and Interest Rate Fluctuations
To date, inflation in the economy as a whole has not significantly affected our operations. However, we purchase steel at market prices, which fluctuate as a result of supply and demand in the marketplace. To date, we have generally been able to pass through these price increases through price increases on our products, the assessment of steel surcharges on our customers or entry into long-term agreements with our customers which often contain escalator provisions tied to our invoiced price of steel. However, even if we are able to pass these steel surcharges or price increases to our customers, there may be a time lag of up to 3 months or more between the time a price increase goes into effect and our ability to implement surcharges or price increases, particularly for orders already in our backlog. As a result, our gross margin percentage may decline, and we may not be able to implement other price increases for our products. We offset these cost increases by changing our buying patterns, expanding our vendor network and passing through price increases. The overall impact on costs for the year was immaterial.
| 37 |
Competitive pressures and the terms of certain of our long-term contracts may require us to absorb at least part of these cost increases, particularly during periods of high inflation. Our principal raw material is 440c and 52100 wire and rod steel (types of stainless and chrome steel), which has historically been readily available. We have never experienced a work stoppage due to a supply shortage. We maintain multiple sources for raw materials including steel and have various supplier agreements. Through sole-source arrangements, supplier agreements and pricing, we have been able to minimize our exposure to fluctuations in raw material prices.
Our suppliers and sources of raw materials are based in the U.S., Europe and Asia. We believe that our sources are adequate for our needs in the foreseeable future, that there exist alternative suppliers for our raw materials and that in most cases readily available alternative materials can be used for most of our raw materials.
ITEM 7A. QUANTITATIVE AND QUALITATIVE DISCLOSURES ABOUT MARKET RISK
We are exposed to market risks, which arise during the normal course of business from changes in interest rates and foreign currency exchange rates.
Interest Rates. We have exposure to risk associated with interest rates on our short-term and long-term debt obligations entered into as part of our Sargent Aerospace & Defense acquisition on April 24, 2015. We entered into a new credit agreement (the “New Credit Agreement”) and related Guarantee, Pledge Agreement and Security Agreement with Wells Fargo Bank, National Association, as Administrative Agent, Collateral Agent, Swingline Lender and Letter of Credit Issuer and the other lenders party thereto and terminated the JP Morgan Credit Agreement. The New Credit Agreement provides RBCA, as Borrower, with (a) a $200,000 Term Loan and (b) a $350,000 Revolver and together with the Term Loan (the “Facilities”).
Amounts outstanding under our current credit agreement generally bear interest at (a) a base rate determined by reference to the higher of (1) Wells Fargo’s prime lending rate, (2) the federal funds effective rate plus 1/2 of 1% and (3) the one-month LIBOR rate plus 1% or (b) LIBOR rate plus a specified margin, depending on the type of borrowing being made. The applicable margin is based on the Company's consolidated ratio of total net debt to consolidated EBITDA from time to time. Currently, the Company's margin is 0.5% for base rate loans and 1.5% for LIBOR rate loans.
Foreign Currency Exchange Rates. As a result of our operations in Europe, we are exposed to risk associated with fluctuating currency exchange rates between the U.S. dollar, the Euro, the Swiss Franc, the Polish Zloty and the Canadian Dollar. Our Swiss operations utilize the Swiss Franc as the functional currency, our French operations utilize the Euro as the functional currency, our Polish operations utilize the Polish Zloty as the functional currency and our Canadian operations utilize the Canadian Dollar as the functional currency. Foreign currency transaction gains and losses are included in earnings. Approximately 11% of our net sales were impacted by foreign currency fluctuations in fiscal 2016 compared to approximately 13% of our net sales in fiscal 2015. We expect that this proportion is likely to increase as we seek to increase our penetration of foreign markets, particularly within the aerospace and defense markets. Foreign currency transaction exposure arises primarily from the transfer of foreign currency from one subsidiary to another within the group, and to foreign currency denominated trade receivables. Unrealized currency translation gains and losses are recognized upon translation of the foreign subsidiaries’ balance sheets to U.S. dollars. Because our financial statements are denominated in U.S. dollars, changes in currency exchange rates between the U.S. dollar and other currencies have had, and will continue to have, an impact on our earnings. We periodically enter into derivative financial instruments in the form of forward exchange contracts to reduce the effect of fluctuations in exchange rates on certain third-party sales transactions denominated in non-functional currencies. Based on the accounting guidance related to derivatives and hedging activities, we record derivative financial instruments at fair value. For derivative financial instruments designated and qualifying as cash flow hedges, the effective portion of the gain or loss on these hedges is reported as a component of accumulated other comprehensive income (“AOCI”), and is reclassified into earnings when the hedged transaction affects earnings. As of April 2, 2016, we had no derivatives.
Off-Balance Sheet Arrangements
We have no off-balance sheet arrangements.
| 38 |
ITEM 8. FINANCIAL STATEMENTS AND SUPPLEMENTARY DATA
Report of Independent Registered Public Accounting Firm
To The Board of Directors and Stockholders of RBC Bearings Incorporated
We have audited the accompanying consolidated balance sheets of RBC Bearings Incorporated (the Company) as of April 2, 2016 and March 28, 2015, and the related consolidated statements of operations, comprehensive income, stockholders’ equity, and cash flows for each of the three years in the period ended April 2, 2016. These financial statements are the responsibility of the Company’s management. Our responsibility is to express an opinion on these financial statements based on our audits.
We conducted our audits in accordance with the standards of the Public Company Accounting Oversight Board (United States). Those standards require that we plan and perform the audit to obtain reasonable assurance about whether the financial statements are free of material misstatement. An audit includes examining, on a test basis, evidence supporting the amounts and disclosures in the financial statements. An audit also includes assessing the accounting principles used and significant estimates made by management, as well as evaluating the overall financial statement presentation. We believe that our audits provide a reasonable basis for our opinion.
In our opinion, the financial statements referred to above present fairly, in all material respects, the consolidated financial position of RBC Bearings Incorporated at April 2, 2016 and March 28, 2015, and the consolidated results of its operations and its cash flows for each of the three years in the period ended April 2, 2016, in conformity with U.S. generally accepted accounting principles.
We also have audited, in accordance with the standards of the Public Company Accounting Oversight Board (United States), RBC Bearings Incorporated’s internal control over financial reporting as of April 2, 2016, based on criteria established in Internal Control-Integrated Framework issued by the Committee of Sponsoring Organizations of the Treadway Commission (2013 Framework) and our report dated May 26, 2016 expressed an unqualified opinion thereon.
| /s/Ernst & Young LLP |
Stamford, Connecticut
May 26, 2016
| 39 |
RBC Bearings Incorporated
Consolidated Balance Sheets
(dollars in thousands, except share and per share data)
April 2, 2016 | March 28, 2015 | |||||||
| ASSETS | ||||||||
| Current assets: | ||||||||
| Cash and cash equivalents | $ | 39,208 | $ | 125,455 | ||||
| Accounts receivable, net of allowance for doubtful accounts of $1,324 in 2016 and $860 in 2015 | 102,351 | 76,651 | ||||||
| Inventory | 280,537 | 206,158 | ||||||
| Deferred income taxes | — | 12,492 | ||||||
| Prepaid expenses and other current assets | 6,861 | 4,628 | ||||||
| Total current assets | 428,957 | 425,384 | ||||||
| Property, plant and equipment, net | 184,744 | 141,649 | ||||||
| Goodwill | 267,259 | 43,439 | ||||||
| Intangible assets, net of accumulated amortization of $22,165 in 2016 and $13,185 in 2015 | 207,252 | 12,028 | ||||||
| Other assets | 10,298 | 9,573 | ||||||
| Total assets | $ | 1,098,510 | $ | 632,073 | ||||
See accompanying notes.
| 40 |
RBC Bearings Incorporated
Consolidated Balance Sheets (continued)
(dollars in thousands, except share and per share data)
| April 2, | March 28, | |||||||
| 2016 | 2015 | |||||||
| LIABILITIES AND STOCKHOLDERS' EQUITY | ||||||||
| Current liabilities: | ||||||||
| Accounts payable | $ | 35,597 | $ | 23,459 | ||||
| Accrued expenses and other current liabilities | 42,234 | 17,326 | ||||||
| Current portion of long-term debt | 10,486 | 1,233 | ||||||
| Total current liabilities | 88,317 | 42,018 | ||||||
| Long-term debt, less current portion | 353,210 | 7,965 | ||||||
| Deferred income taxes | 3,208 | 10,126 | ||||||
| Other non-current liabilities | 32,828 | 22,531 | ||||||
| Total liabilities | 477,563 | 82,640 | ||||||
| Commitments and contingencies (Note 16) | ||||||||
| Stockholders' equity: | ||||||||
| Preferred stock, $.01 par value; authorized shares: 10,000,000 in 2016 and 2015; none issued and outstanding | — | — | ||||||
| Common stock, $.01 par value; authorized shares: 60,000,000 in 2016 and 2015; issued and outstanding shares: 24,146,767 in 2016 and 23,833,185 in 2015 | 241 | 238 | ||||||
| Additional paid-in capital | 279,420 | 262,091 | ||||||
| Accumulated other comprehensive income | (6,990 | ) | (7,770 | ) | ||||
| Retained earnings | 378,070 | 314,176 | ||||||
| Treasury stock, at cost, 603,035 shares in 2016 and 439,864 shares in 2015 | (29,794 | ) | (19,302 | ) | ||||
| Total stockholders' equity | 620,947 | 549,433 | ||||||
| Total liabilities and stockholders' equity | $ | 1,098,510 | $ | 632,073 | ||||
See accompanying notes.
| 41 |
RBC Bearings Incorporated
Consolidated Statements of Operations
(dollars in thousands, except share and per share data)
| Fiscal Year Ended | ||||||||||||
| April 2, | March 28, | March 29, | ||||||||||
| 2016 | 2015 | 2014 | ||||||||||
| Net sales | $ | 597,472 | $ | 445,278 | $ | 418,886 | ||||||
| Cost of sales | 378,694 | 275,138 | 254,089 | |||||||||
| Gross margin | 218,778 | 170,140 | 164,797 | |||||||||
| Operating expenses: | ||||||||||||
| Selling, general and administrative | 98,721 | 75,908 | 71,969 | |||||||||
| Other, net | 16,216 | 5,802 | 4,178 | |||||||||
| Total operating expenses | 114,937 | 81,710 | 76,147 | |||||||||
| Operating income | 103,841 | 88,430 | 88,650 | |||||||||
| Interest expense, net | 8,722 | 1,055 | 1,019 | |||||||||
| Other non-operating expense (income) | 334 | 2,820 | (122 | ) | ||||||||
| Income before income taxes | 94,785 | 84,555 | 87,753 | |||||||||
| Provision for income taxes | 30,891 | 26,307 | 27,545 | |||||||||
| Net income | $ | 63,894 | $ | 58,248 | $ | 60,208 | ||||||
| Net income per common share: | ||||||||||||
| Basic | $ | 2.75 | $ | 2.52 | $ | 2.63 | ||||||
| Diluted | $ | 2.72 | $ | 2.49 | $ | 2.59 | ||||||
| Weighted average common shares: | ||||||||||||
| Basic | 23,208,686 | 23,073,940 | 22,874,842 | |||||||||
| Diluted | 23,508,418 | 23,385,061 | 23,244,241 | |||||||||
| Dividends per Share | — | $ | 2.00 | — | ||||||||
See accompanying notes.
| 42 |
RBC Bearings Incorporated
Consolidated Statements of Comprehensive Income
(dollars in thousands)
| Fiscal Year Ended | ||||||||||||
April 2, 2016 | March 28, 2015 | March 29, 2014 | ||||||||||
| Net income | $ | 63,894 | $ | 58,248 | $ | 60,208 | ||||||
| Pension and postretirement liability adjustments, net of taxes | 465 | (945 | ) | 982 | ||||||||
| Change in unrealized loss on investments, net of taxes | — | (260 | ) | 131 | ||||||||
| Foreign currency translation adjustments | 315 | (8,930 | ) | 4,721 | ||||||||
| Total comprehensive income | $ | 64,674 | $ | 48,113 | $ | 66,042 | ||||||
See accompanying notes.
| 43 |
RBC Bearings Incorporated
Consolidated Statements of Stockholders' Equity
(dollars in thousands)
| Common Stock | Additional Paid-in | Accumulated Other Comprehensive | Retained
Earnings (Accumulated |
Treasury Stock | Total Stockholders' | |||||||||||||||||||||||||||
| Shares | Amount | Capital | Income/(Loss) | Deficit) | Shares | Amount | Equity | |||||||||||||||||||||||||
| Balance at March 31, 2013 | 23,277,928 | 233 | 234,151 | (3,469 | ) | 241,734 | (289,234 | ) | (10,454 | ) | 462,195 | |||||||||||||||||||||
| Net income | — | — | — | — | 60,208 | — | — | 60,208 | ||||||||||||||||||||||||
| Stock-based compensation | — | — | 5,833 | — | — | — | — | 5,833 | ||||||||||||||||||||||||
| Exercise of equity awards | 184,000 | 2 | 4,606 | — | — | (28,583 | ) | (1,788 | ) | 2,820 | ||||||||||||||||||||||
| Change in net prior service cost and actuarial losses, net of taxes of $141 | — | — | — | 982 | — | — | — | 982 | ||||||||||||||||||||||||
| Issuance of restricted stock | 62,100 | — | — | — | — | — | — | — | ||||||||||||||||||||||||
| Income tax benefit on exercise of non-qualified common stock options | — | — | 1,562 | — | — | — | — | 1,562 | ||||||||||||||||||||||||
| Unrealized gain on investments, net of taxes of $87 | — | — | — | 131 | — | — | — | 131 | ||||||||||||||||||||||||
| Currency translation adjustments, net of tax benefit of $13 | — | — | — | 4,721 | — | — | — | 4,721 | ||||||||||||||||||||||||
| Balance at March 29, 2014 | 23,524,028 | 235 | 246,152 | 2,365 | 301,942 | (317,817 | ) | (12,242 | ) | 538,452 | ||||||||||||||||||||||
| Net income | — | — | — | — | 58,248 | — | — | 58,248 | ||||||||||||||||||||||||
| Dividends paid to shareholders | — | — | — | — | (46,014 | ) | — | — | (46,014 | ) | ||||||||||||||||||||||
| Stock-based compensation | — | — | 8,339 | — | — | — | — | 8,339 | ||||||||||||||||||||||||
| Exercise of equity awards | 198,077 | 3 | 4,456 | — | — | (122,047 | ) | (7,060 | ) | (2,601 | ) | |||||||||||||||||||||
| Change in net prior service cost and actuarial losses, net of taxes of $564 | — | — | — | (945 | ) | — | — | — | (945 | ) | ||||||||||||||||||||||
| Issuance of restricted stock | 111,080 | — | — | — | — | — | — | — | ||||||||||||||||||||||||
| Income tax benefit on exercise of non-qualified common stock options | — | — | 3,144 | — | — | — | — | 3,144 | ||||||||||||||||||||||||
| Unrealized gain on investments, net of tax benefit of $173 | — | — | — | (260 | ) | — | — | — | (260 | ) | ||||||||||||||||||||||
| Currency translation adjustments, net of tax benefit of $48 | — | — | — | (8,930 | ) | — | — | — | (8,930 | ) | ||||||||||||||||||||||
| Balance at March 28, 2015 | 23,833,185 | 238 | 262,091 | (7,770 | ) | 314,176 | (439,864 | ) | (19,302 | ) | 549,433 | |||||||||||||||||||||
| Net income | — | — | — | — | 63,894 | — | — | 63,894 | ||||||||||||||||||||||||
| Stock-based compensation | — | — | 10,200 | — | — | — | — | 10,200 | ||||||||||||||||||||||||
| Exercise of equity awards | 171,319 | 3 | 4,580 | — | — | (163,171 | ) | (10,492 | ) | (5,909 | ) | |||||||||||||||||||||
| Change in net prior service cost and actuarial losses, net of taxes of $276 | — | — | — | 465 | — | — | — | 465 | ||||||||||||||||||||||||
| Issuance of restricted stock | 142,263 | — | — | — | — | — | — | — | ||||||||||||||||||||||||
| Income tax benefit on exercise of non-qualified common stock options | — | — | 2,549 | — | — | — | — | 2,549 | ||||||||||||||||||||||||
| Currency translation adjustments | — | — | — | 315 | — | — | — | 315 | ||||||||||||||||||||||||
| Balance at April 2, 2016 | 24,146,767 | $ | 241 | $ | 279,420 | $ | (6,990 | ) | $ | 378,070 | (603,035 | ) | $ | (29,794 | ) | $ | 620,947 | |||||||||||||||
See accompanying notes.
| 44 |
RBC Bearings Incorporated
Consolidated Statements of Cash Flows
(dollars in thousands)
| Fiscal Year Ended | ||||||||||||
April 2, 2016 | March 28, 2015 | March 29, 2014 | ||||||||||
| Cash flows from operating activities: | ||||||||||||
| Net income | $ | 63,894 | $ | 58,248 | $ | 60,208 | ||||||
| Adjustments to reconcile net income to net cash provided by operating activities: | ||||||||||||
| Depreciation | 16,807 | 13,206 | 13,063 | |||||||||
| Excess tax benefits from stock-based compensation | (2,549 | ) | (3,144 | ) | (1,562 | ) | ||||||
| Deferred income taxes | (336 | ) | 1,044 | 364 | ||||||||
| Amortization of intangible assets | 9,000 | 1,839 | 1,924 | |||||||||
| Amortization of deferred financing costs | 1,333 | 325 | 325 | |||||||||
| Consolidation and restructuring charges | 190 | 5,026 | — | |||||||||
| Stock-based compensation | 10,200 | 8,339 | 5,833 | |||||||||
| Loss (gain) on disposition of assets | 3 | 511 | (31 | ) | ||||||||
| Gain on acquisition | — | — | — | |||||||||
| Changes in operating assets and liabilities, net of acquisitions: | ||||||||||||
| Accounts receivable | (619 | ) | (2,005 | ) | (5,990 | ) | ||||||
| Inventory | (25,460 | ) | (13,504 | ) | (17,024 | ) | ||||||
| Prepaid expenses and other current assets | (1,576 | ) | 3,738 | (3,450 | ) | |||||||
| Other non-current assets | (1,876 | ) | (2,830 | ) | (3,418 | ) | ||||||
| Accounts payable | (2,756 | ) | (534 | ) | (2,986 | ) | ||||||
| Accrued expenses and other current liabilities | 14,246 | 3,391 | (2,321 | ) | ||||||||
| Other non-current liabilities | 2,859 | (1,860 | ) | 3,040 | ||||||||
| Net cash provided by operating activities | 83,360 | 71,790 | 47,975 | |||||||||
| Cash flows from investing activities: | ||||||||||||
| Purchase of property, plant and equipment | (20,864 | ) | (20,897 | ) | (28,920 | ) | ||||||
| Purchase of short-term investments | — | — | (729 | ) | ||||||||
| Proceeds from sale or maturities of short-term investments | — | 2,380 | — | |||||||||
| Acquisition of businesses, net of cash acquired | (500,000 | ) | — | (17,568 | ) | |||||||
| Proceeds from sale of assets | 726 | 608 | 100 | |||||||||
| Net cash used in investing activities | (520,138 | ) | (17,909 | ) | (47,117 | ) | ||||||
| Cash flows from financing activities: | ||||||||||||
| Proceeds from revolving credit facility | 225,000 | — | — | |||||||||
| Repayments of revolving credit facility | (56,000 | ) | — | — | ||||||||
| Proceeds from term loans | 200,000 | — | — | |||||||||
| Repayments of term loans | (7,500 | ) | — | — | ||||||||
| Finance fees paid in connection with credit facility | (7,122 | ) | — | — | ||||||||
| Payments of notes payable | (1,229 | ) | (500 | ) | (505 | ) | ||||||
| Repurchase of common stock | (10,492 | ) | (7,060 | ) | (1,788 | ) | ||||||
| Exercise of stock options | 4,583 | 4,459 | 4,608 | |||||||||
| Excess tax benefits from stock-based compensation | 2,549 | 3,144 | 1,562 | |||||||||
| Dividends paid to shareholders | — | (46,014 | ) | — | ||||||||
| Other, net | — | (106 | ) | (93 | ) | |||||||
| Net cash provided by (used in) financing activities | 349,789 | (46,077 | ) | 3,784 | ||||||||
| Effect of exchange rate changes on cash | 742 | (3,556 | ) | 2,085 | ||||||||
| Cash and cash equivalents: | ||||||||||||
| (Decrease)/increase during the year | (86,247 | ) | 4,248 | 6,727 | ||||||||
| Cash, at beginning of year | 125,455 | 121,207 | 114,480 | |||||||||
| Cash, at end of year | $ | 39,208 | $ | 125,455 | $ | 121,207 | ||||||
See accompanying notes.
| 45 |
RBC Bearings Incorporated
Notes to Consolidated Financial Statements
(dollars in thousands, except share and per share data)
| 1. | Organization and Business |
RBC Bearings Incorporated (the "Company", collectively with its subsidiaries), is a Delaware corporation. The Company operates in four reportable business segments—roller bearings, plain bearings, ball bearings and engineered products—in which it manufactures roller bearing components and assembled parts and designs and manufactures high-precision roller and ball bearings. The Company sells to a wide variety of original equipment manufacturers ("OEMs") and distributors who are widely dispersed geographically. In fiscal 2016, no one customer accounted for more than 10% of the Company’s net sales as compared to no more than 6% and 7% of the Company’s net sales in fiscal 2015 and 2014, respectively. The Company's segments are further discussed in Part II, Item 8. “Financial Statements and Supplemental Data,” Note 18 “Reportable Segments.”
| 2. | Summary of Significant Accounting Policies |
General
The consolidated financial statements include the accounts of RBC Bearings Incorporated, Roller Bearing Company of America, Inc. (“RBCA”) and its wholly-owned subsidiaries, Industrial Tectonics Bearings Corporation (“ITB”), RBC Linear Precision Products, Inc. (“LPP”), RBC Nice Bearings, Inc. (“Nice”), RBC Precision Products - Bremen, Inc. (“Bremen (MBC)”), RBC Precision Products - Plymouth, Inc. (“Plymouth”), RBC Lubron Bearing Systems, Inc. (“Lubron”), RBC Oklahoma, Inc. (“RBC Oklahoma”), RBC Aircraft Products, Inc. (“API”), RBC Southwest Products, Inc. (“SWP”), All Power Manufacturing Co. (“All Power”), RBC Aerostructures LLC (“RAS”), Western Precision Aero LLC (“WPA”), Climax Metal Products Company (“CMP”), RBC Turbine Components LLC (“TCI”), Sonic Industries, Inc. (“Sonic”), Sargent Aerospace and Defense LLC (“Sargent”), Avborne Accessory Group, Inc. (“AMS”), Schaublin Holdings S.A. and its wholly-owned subsidiaries Schaublin SA, RBC Bearings Polska SP ZOO and RBC France SAS (“Schaublin”), RBC de Mexico S DE RL DE CV (“Mexico”), Shanghai Representative office of Roller Bearing Company of America, Inc. (“RBC Shanghai”), RBC Bearings U.K. Limited and its wholly-owned subsidiary Phoenix Bearings Limited (“Phoenix”), Allpower de Mexico S DE RL DE CV (“Tecate”) and RBC Bearings Canada, Inc. Divisions of RBCA include: RBC Corporate, RBC E-Shop, RBC Aerospace sales office and warehouse, Transport Dynamics (“TDC”), Heim (“Heim”), Engineered Components (“ECD”), RBC Aerocomponents (“RAC”), PIC Design (“PIC Design”), RBC Hartsville, RBC West Trenton, RBC Bishopsville, RBC Eastern Distribution Center and RBC Grand Prarie TX location. U.S. Bearings (“USB”) is a division of SWP and Schaublin USA is a division of Nice. All intercompany balances and transactions have been eliminated in consolidation.
The Company has a fiscal year consisting of 52 or 53 weeks, ending on the Saturday closest to March 31. Based on this policy, fiscal year 2016 contained 53 weeks and 2015 and 2014 contained 52 weeks. The amounts are shown in thousands, unless otherwise indicated.
Use of Estimates
The preparation of financial statements in conformity with generally accepted accounting principles requires management to make estimates and assumptions that affect the reported amounts of assets and liabilities, and disclosure of contingent assets and liabilities, at the date of the financial statements, and the reported amounts of revenues and expenses during the reporting period. Actual results could differ from those estimates. Estimates are used for, but not limited to, the accounting for the allowance for doubtful accounts, valuation of inventories, accrued expenses, depreciation and amortization, income taxes and tax reserves, pension and postretirement obligations and the valuation of options.
Cash and Cash Equivalents
The Company considers all highly liquid investments purchased with an original maturity of three months or less to be cash equivalents. The Company maintains its cash accounts primarily with Bank of America, N.A and Wells Fargo & Company. The balances are insured by the Federal Deposit Insurance Company up to $250. The Company has not experienced any losses in such accounts.
| 46 |
Inventory
Inventories are stated at the lower of cost or market value. Cost is determined by the first-in, first-out method. The Company accounts for inventory under a full absorption method, and records adjustments to the value of inventory based upon past sales history and forecasted plans to sell our inventories. The physical condition, including age and quality, of the inventories is also considered in establishing its valuation. These adjustments are estimates, which could vary significantly, either favorably or unfavorably, from actual requirements if future economic conditions, customer inventory levels or competitive conditions differ from our expectations.
Shipping and Handling
The sales price billed to customers includes shipping and handling, which is included in net sales. The costs to the Company for shipping and handling are included in cost of sales.
Property, Plant and Equipment
Property, plant and equipment are recorded at cost. Depreciation and amortization of property, plant and equipment, including equipment under capital leases, is provided for by the straight-line method over the estimated useful lives of the respective assets or the lease term, if shorter. Depreciation of assets under capital leases is reported within depreciation and amortization. The cost of equipment under capital leases is equal to the lower of the net present value of the minimum lease payments or the fair market value of the leased equipment at the inception of the lease. Expenditures for normal maintenance and repairs are charged to expense as incurred.
The estimated useful lives of the Company's property, plant and equipment follows:
| Buildings and improvements | 20-30 years |
| Machinery and equipment | 3-15 years |
| Leasehold improvements | Shorter of the term of lease or estimated useful life |
Recognition of Revenue and Accounts Receivable and Concentration of Credit Risk
The Company recognizes revenue only after the following four basic criteria are met:
| · | Persuasive evidence of an arrangement exists; |
| · | Delivery has occurred or services have been rendered; |
| · | The seller's price to the buyer is fixed or determinable; and |
| · | Collectability is reasonably assured. |
Revenue is recognized upon the passage of title, which generally is at the time of shipment, except for certain customers for which it occurs when the products reach their destination. Accounts receivable, net of applicable allowances, is recorded when revenue is recorded.
We also recognize revenue on a Ship-In-Place basis for two customers who have required that we hold the product after final production is complete. In this case, a written agreement has been executed (at the customer’s request) whereby the customer accepts the risk of loss for product that is invoiced under the Ship-In-Place arrangement. For each transaction for which revenue is recognized under a Ship-In-Place arrangement, all final manufacturing inspections have been completed and customer acceptance has been obtained. In the fiscal year ended April 2, 2016, 2.1% of the Company’s total net sales was recognized under Ship-In-Place transactions.
We also on occasion record deferred revenue on our balance sheet as a liability. Deferred revenue represents progress payments received, primarily from one customer, to cover purchases of raw materials per the terms of multi-year long term contracts. Revenue associated with these agreements is recognized in accordance with the criteria discussed above.
The Company sells to a large number of OEMs and distributors who service the aftermarket. The Company's credit risk associated with accounts receivable is minimized due to its customer base and wide geographic dispersion. The Company performs ongoing credit evaluations of its customers' financial condition and generally does not require collateral or charge interest on outstanding amounts. The Company had no concentrations of credit risk with any one customer greater than 4% of accounts receivables at April 2, 2016 and March 28, 2015, respectively.
| 47 |
Allowance for Doubtful Accounts
The Company maintains an allowance for doubtful accounts for estimated losses resulting from the inability of its customers to make required payments. The Company reviews the collectability of its receivables on an ongoing basis taking into account a combination of factors. The Company reviews potential problems, such as past due accounts, a bankruptcy filing or deterioration in the customer's financial condition, to ensure the Company is adequately accrued for potential loss. Accounts are considered past due based on when payment was originally due. If a customer's situation changes, such as a bankruptcy or creditworthiness, or there is a change in the current economic climate, the Company may modify its estimate of the allowance for doubtful accounts. The Company will write-off accounts receivable after reasonable collection efforts have been made and the accounts are deemed uncollectible.
Goodwill and Indefinite-Lived Intangible Assets
Goodwill (representing the excess of the amount paid to acquire a company over the estimated fair value of the net assets acquired) and Indefinite Lived Intangible Assets are not amortized but instead is tested for impairment annually, or when events or circumstances indicate that its value may have declined. Separate tests are performed for goodwill and indefinite lived intangible assets. We apply a qualitative test of impairment on the indefinite lived intangible assets. This is done by assessing the existence of events or circumstances which would make it more likely than not that impairment is present. No such factors were identified during our current year analysis. The determination of any goodwill impairment is made at the reporting unit level and consists of two steps. First, the Company determines the fair value of a reporting unit and compares it to its carrying amount. Second, if the carrying amount of the reporting unit exceeds its fair value, an impairment loss is recognized for any excess of the carrying amount of the reporting unit's goodwill over the goodwill's implied fair value. The Company uses the income approach (discounted cash flow method) in testing goodwill for impairment. The key assumptions used in the discounted cash flow method used to estimate fair value include discount rates, revenue growth rates, terminal growth rates and cash flow projections. Discount rates, growth rates and cash flow projections are the most sensitive and susceptible to change as they require significant management judgment. Discount rates are determined by using a weighted average cost of capital (“WACC”). The WACC considers market and industry data as well as Company-specific risk factors for each reporting unit in determining the appropriate discount rate to be used. The discount rate utilized for each reporting unit is indicative of the return an investor would expect to receive for investing in such a business. Terminal growth rate determination follows common methodology of capturing the present value of perpetual cash flow estimates beyond the last projected period assuming a constant WACC and long-term growth rates. The Company has determined that, to date, no impairment of goodwill exists and fair value of the reporting units exceeded the carrying value in total by approximately 74%. The fair value of the reporting units exceeds the carrying value by a minimum of 37% at each of the four reporting units. The Company performs the annual impairment testing during the fourth quarter of each fiscal year. Although no changes are expected, if the actual results of the Company are less favorable than the assumptions the Company makes regarding estimated cash flows, the Company may be required to record an impairment charge in the future.
Deferred Financing Costs
Deferred financing costs are amortized on a straight line basis over the lives of the related credit agreements.
Derivative Financial Instruments
The Company utilizes forward contracts and average rate options to mitigate the impact of currency fluctuations on monetary assets and liabilities denominated in currencies other than the applicable functional currency as well as on forecasted transactions denominated in currencies other than the applicable functional currency. The Company does not engage in other uses of these financial instruments. For a financial instrument to qualify as a hedge, the Company must be exposed to interest rate or price risk, and the financial instrument must reduce the exposure and be designated as a hedge. Financial instruments qualifying for hedge accounting must maintain a high correlation between the hedging instrument and the item being hedged, both at inception and throughout the hedged period. The Company measures the effectiveness of the hedging relationship at the inception of the hedge and quarterly at a minimum.
If derivative financial instruments qualify as fair value hedges, the gain or loss on the instrument and the offsetting loss or gain on the hedged item attributable to the hedged risk are recognized in current earnings during the period of the change in fair values. For derivative financial instruments that qualify as cash flow hedges (i.e., hedging the exposure to variability in expected future cash flows that is attributable to a particular risk), the effective portion of the gain or loss on the derivative instrument is reported as a component of other comprehensive income and reclassified into earnings in the same period or periods during which the hedged transaction affects earnings. The ineffective portion of a cash flow hedge, if any, is determined based on the dollar-offset method (i.e., the gain or loss on the derivative financial instrument in excess of the cumulative change in the present value of future cash flows of the hedged item) and is recognized in current earnings during the period of change. As long as hedge effectiveness is maintained, interest rate swap arrangements and foreign currency exchange agreements qualify for hedge accounting as cash flow hedges.
| 48 |
All derivatives are recorded in the consolidated balance sheets at their fair values. Changes in fair values of derivatives are recorded in each period in comprehensive income, since the derivative is designated and qualifies as a cash flow hedge. As of April 2, 2016, the Company held no derivatives.
Income Taxes
The Company accounts for income taxes using the liability method, which requires it to recognize a current tax liability or asset for current taxes payable or refundable and a deferred tax liability or asset for the estimated future tax effects of temporary differences between the financial statement and tax reporting bases of assets and liabilities to the extent that they are realizable. Deferred tax expense (benefit) results from the net change in deferred tax assets and liabilities during the year. A valuation allowance is recorded to reduce deferred tax assets to the amount that is more likely than not to be realized.
Temporary differences relate primarily to the timing of deductions for depreciation, stock-based compensation, goodwill amortization relating to the acquisition of operating divisions, basis differences arising from acquisition accounting, pension and retirement benefits, and various accrued and prepaid expenses. Deferred tax assets and liabilities are recorded at the rates expected to be in effect when the temporary differences are expected to reverse.
Net Income Per Common Share
Basic net income per common share is computed by dividing net income available to common stockholders by the weighted-average number of common shares outstanding.
Diluted net income per common share is computed by dividing net income by the sum of the weighted-average number of common shares and dilutive common share equivalents then outstanding using the treasury stock method. Common share equivalents consist of the incremental common shares issuable upon the exercise of stock options.
The table below reflects the calculation of weighted-average shares outstanding for each year presented as well as the computation of basic and diluted net income per common share:
| Fiscal Year Ended | ||||||||||||
| April 2, | March 28, | March 29, | ||||||||||
| 2016 | 2015 | 2014 | ||||||||||
| Net income | $ | 63,894 | $ | 58,248 | $ | 60,208 | ||||||
| Denominator: | ||||||||||||
| Denominator for basic net income per common share—weighted-average shares | 23,208,686 | 23,073,940 | 22,874,842 | |||||||||
| Effect of dilution due to employee stock options | 299,732 | 311,121 | 369,399 | |||||||||
| Denominator for diluted net income per common share—adjusted weighted-average shares | 23,508,418 | 23,385,061 | 23,244,241 | |||||||||
| Basic net income per common share | $ | 2.75 | $ | 2.52 | $ | 2.63 | ||||||
| Diluted net income per common share | $ | 2.72 | $ | 2.49 | $ | 2.59 | ||||||
At April 2, 2016, 443,250 employee stock options and no restricted shares have been excluded from the calculation of diluted earnings per share. At March 28, 2015, 418,450 employee stock options and no restricted shares have been excluded from the calculation of diluted earnings per share. At March 29, 2014, 193,500 employee stock options and no restricted shares have been excluded from the calculation of diluted earnings per share. The inclusion of these employee stock options and restricted shares would be anti-dilutive.
Impairment of Long-Lived Assets
The Company assesses the net realizable value of its long-lived assets and evaluates such assets for impairment whenever indicators of impairment are present. For amortizable long-lived assets to be held and used, if indicators of impairment are present, management determines whether the sum of the estimated undiscounted future cash flows is less than the carrying amount. The amount of asset impairment, if any, is based on the excess of the carrying amount over its fair value, which is estimated based on projected discounted future operating cash flows using a discount rate reflecting the Company's average cost of funds. To date, no indicators of impairment exist other than those resulting in the restructuring charges already recorded.
| 49 |
Long-lived assets to be disposed of by sale or other means are reported at the lower of carrying amount or fair value, less costs to sell.
Foreign Currency Translation and Transactions
Assets and liabilities of the Company's foreign operations are translated into U.S. dollars using the exchange rate in effect at the balance sheet date. Results of operations are translated using the average exchange rate prevailing throughout the period. The effects of exchange rate fluctuations on translating foreign currency assets and liabilities into U.S. dollars are included in accumulated other comprehensive income (loss), while gains and losses resulting from foreign currency transactions are included in other non-operating expense (income). Net income of the Company's foreign operations for fiscal 2016, 2015 and 2014 amounted to $8,660, $2,474, and $10,045, respectively. Net assets of the Company's foreign operations were $104,382 and $96,545 at April 2, 2016 and March 28, 2015, respectively.
On January 15, 2015, the Swiss National Bank, removed its three-year-old foreign exchange cap of Swiss Francs 1.20 against the Euro. The new exchange rate was approximately 1.02 at the end of fiscal March 2015. This change in rates has impacted the translation and remeasurement of the financial statements of our Swiss company, Schaublin S.A. Schaublin S.A. had approximately 16.0 million Euro deposits on their balance sheet. When Euro deposits are re-measured to the functional currency of Swiss Francs, the change in exchange rate is reflected in the income statement in other non-operating expense. Based on the exchange rate at the end of fiscal March 2015, the income statement had a negative impact of approximately $3.1 million in the fourth quarter, and was partially offset by a favorable impact of approximately $0.4 million in other comprehensive income on the balance sheet.
Fair Value of Measurements
Fair value is the price that would be received to sell an asset or paid to transfer a liability in an orderly transaction between market participants at the measurement date (exit price). Inputs used to measure fair value are within a hierarchy consisting of three levels. Level 1 inputs represent unadjusted quoted prices in active markets for identical assets or liabilities. Level 2 inputs represent unadjusted quoted prices in active markets for similar assets or liabilities, or unadjusted quoted prices for identical or similar assets or liabilities in markets that are not active, or inputs other than quoted prices that are observable for the asset or liability. Level 3 inputs represent unobservable inputs for the asset or liability. Financial assets and liabilities are classified in their entirety based on the lowest level of input that is significant to the fair value measurement.
The financial assets and liabilities that are measured on a recurring basis in 2016 consist of the Company’s forward contracts and average rate options. The Company has measured the fair value of these forward contracts and average rate options using observable market inputs such as spot and forward rates (as provided by the financial institution with which these instruments has been executed). Based on these inputs, these instruments are classified as Level 2 of the valuation hierarchy. As of April 2, 2016, the Company held no forward contracts or average rate options.
The carrying amounts reported in the balance sheet for cash and cash equivalents, short-term investments, accounts receivable, prepaids and other current assets, and accounts payable and accruals, and other current liabilities approximate their fair value due to their short-term nature.
The carrying amounts of the Company's borrowings under its Wells Fargo Credit Agreement and Swiss Credit Facility approximate fair value, as these obligations have interest rates which vary in conjunction with current market conditions. The carrying value of the mortgage on our Schaublin building approximates fair value as the rates since entering into the mortgage in fiscal 2013 have not changed.
Accumulated Other Comprehensive Income (Loss)
The components of comprehensive income (loss) that relate to the Company are net income, foreign currency translation adjustments and pension plan and postretirement benefits, all of which are presented in the consolidated statements of stockholders' equity and comprehensive income (loss).
| 50 |
The following summarizes the activity within each component of accumulated other comprehensive income (loss), net of taxes:
| Currency Translation | Pension and Postretirement | Total | ||||||||||
| Balance at March 28, 2015 | $ | (93 | ) | $ | (7,677 | ) | $ | (7,770 | ) | |||
| Other comprehensive income before reclassifications | 315 | 644 | 959 | |||||||||
| Amounts reclassified from accumulated other comprehensive loss | — | (179 | ) | (179 | ) | |||||||
| Net current period other comprehensive income | 315 | 465 | 780 | |||||||||
| Balance at April 2, 2016 | $ | 222 | $ | (7,212 | ) | $ | (6,990 | ) | ||||
Stock-Based Compensation
The Company recognizes compensation cost relating to all share-based payment transactions in the financial statements based upon the grant-date fair value of the instruments issued over the requisite service period. The fair value of each option grant was estimated on the date of grant using the Black-Scholes pricing model.
Recent Accounting Pronouncements
In March 2016, the Financial Accounting Standards Board ("FASB") issued Accounting Standards update (“ASU") No. 2016-09: "Improvements to Employee Share-Based Payment Accounting" which amends ASC Topic 718, Compensation - Stock Compensation. This ASU includes provisions intended to simplify various aspects related to how share-based payments are accounted for and presented in the financial statements. This ASU is effective for public companies for the financial statements issued for annual periods beginning after December 15, 2016 and interim periods within those annual periods. Earlier application is permitted as of the beginning of an interim or annual reporting period, with any adjustments reflected as of the beginning of the fiscal year of adoption. The Company has not determined the effect that the adoption of the pronouncement may have on its financial position and/or results of operations.
In November 2015, the Financial Accounting Standards Board ("FASB") issued Accounting Standards update ("ASU") No. 2015-17 (Topic 740): "Balance Sheet Classification of Deferred Taxes". The FASB issued this ASU as part of its simplification initiative to reduce complexity in accounting standards. This ASU eliminates the current requirement that requires an organization to present deferred tax liabilities and assets as current and noncurrent in a classified balance sheet. Instead, organizations with a classified balance sheet are now required to classify each tax jurisdictions deferred tax assets and liabilities as noncurrent assets or noncurrent liabilities. This ASU will not change the existing guidance that prohibits the offsetting of deferred tax liabilities of one jurisdiction against the deferred tax assets of another jurisdiction. This ASU is effective for public companies for the financial statements issued for annual periods beginning after December 15, 2016 and interim periods within those annual periods. The Company has elected to early adopt this guidance prospectively during the fourth quarter of fiscal year 2016. Given that the Company elected prospective adoption, it did not reclassify prior year information to conform to the ASU.
In September 2015, the Financial Accounting Standards Board (“FASB”) issued Accounting Standards Update (“ASU”) No. 2015-16, “Business Combinations (Topic 805), Simplifying the Accounting for Measurement-Period Adjustments.” This ASU allows an acquirer in a business combination to account for measurement-period adjustments during the period in which it determines the amount of the adjustment. An acquirer would also need to capture in the current period any effect on earnings it would have recorded in previous periods if the accounting had been completed at the acquisition date. This pronouncement is effective for fiscal and interim periods beginning after December 15, 2015. Early adoption is permitted. The Company has adopted this update effective with their interim period beginning June 28, 2015.
In July 2015, the FASB issued ASU 2015-11, “Simplifying the Measurement of Inventory.” This update requires the company to measure inventory using the lower of cost and net realizable value. Net realizable value is defined as the estimated selling prices in the ordinary course of business, less reasonably predictable costs of completion, disposal and transportation. This ASU applies to companies measuring inventory using methods other than the last-in, first-out (LIFO) and retail inventory methods, including but not limited to the first-in, first-out (FIFO) or average costing methods. This pronouncement is effective for fiscal years and interim periods beginning after December 15, 2016. The adoption of this ASU is not expected to have a material impact on the Company’s consolidated financial statements.
| 51 |
In April 2015, the Financial Accounting Standards Board (“FASB”) issued Accounting Standards Update (“ASU”) No. 2015-04, “Compensation - Retirement Benefits: Practical Expedient for the Measurement Date of an Employer’s Defined Benefit Obligation and Plan Assets.” This ASU permits an entity with a fiscal year-end that doesn’t coincide with a month-end, to measure defined benefit plan assets and obligations using the month end that is closest to the entity’s fiscal year-end and apply that consistently from year to year. The practical expedient requires if a contribution or significant event occurs between the month-end date used to measure the defined benefit plan assets and an entity’s fiscal year end, the entity should adjust the measurement of the defined benefit plan assets and obligations to reflect the effects of those contributions and other significant events. This pronouncement is effective for fiscal and interim periods beginning after December 15, 2015. The Company has elected to adopt this guidance for the fiscal year ended April 2, 2016. The respective assets and liabilities associated with the defined benefit plans have been valued as of March 31, 2016, with no material impact on the Company’s consolidated financial statements.
In April 2015, the FASB issued ASU No. 2015-03, “Interest - Imputation of Interest: Simplifying the Presentation of Debt Issuance Costs.” This ASU requires that debt issuance costs related to a recognized debt liability be presented in the balance sheet as a direct deduction from the carrying amount of that debt liability. This pronouncement is effective for fiscal and interim periods beginning after December 15, 2015. Other than requiring a different presentation within the balance sheet, the adoption of this ASU is not expected to have a material impact on the Company’s consolidated financial statements.
In January 2015, the FASB issued ASU No. 2015-01, “Income Statement-Extraordinary and Unusual Items.” This update eliminates the concept of extraordinary items and removes the requirements to separately present extraordinary events. This ASU also requires additional disclosures for items that are both unusual in nature and infrequent in occurrence. This pronouncement is effective for fiscal years and interim periods beginning after December 15, 2015. The adoption of this ASU is not expected to have a material impact on the Company’s consolidated financial statements.
In August 2014, the FASB issued ASU No. 2014-15, “Presentation of Financial Statements-Going Concern.” This update requires management to evaluate whether there are conditions or events that raise substantial doubt about an entity’s ability to continue as a going concern, and requires related footnote disclosures. This pronouncement is effective for fiscal years and interim periods beginning after December 15, 2016. The adoption of this ASU is not expected to have a material impact on the Company’s consolidated financial statements.
In May 2014, the FASB issued ASU No. 2014-09, “Revenue from Contracts with Customers (Topic 606),” to clarify existing guidance on revenue recognition. This guidance includes the required steps to achieve the core principle that a company should recognize revenue when it transfers promised goods or services to customers in an amount that reflects the consideration to which the company expects to be entitled in exchange for those goods or services. This pronouncement is effective for fiscal years and interim periods beginning after December 15, 2016 with no early adoption permitted. The Company has not determined the effect that the adoption of the pronouncement may have on its financial position and/or results of operations.
In April 2014, the FASB issued ASU No. 2014-08, “Reporting Discontinued Operations and Disclosures of Disposals of Components of an Entity.” This update requires additional disclosures about discontinued operations and amends the requirements for reporting discontinued operations. Under this ASU only disposals constituting a major financial or operational impact or that represent a strategic shift should be reported as discontinued operations. This update also requires new disclosures for individually material disposals that do not qualify as discontinued operations. This guidance was adopted by the Company at the beginning of the second quarter of fiscal 2015. The adoption of this ASU did not have a material impact on the Company’s consolidated financial statements.
| 3. | Acquisitions and Dispositions |
On April 24, 2015, the Company acquired Sargent from Dover Corporation for $500,000 financed through a combination of cash on hand and senior debt. With headquarters in Tucson, Arizona, Sargent is a leader in precision-engineered products, solutions and repairs for aircraft airframes and engines, rotorcraft, submarines and land vehicles. Sargent manufactures, sells and services hydraulic valves and actuators, specialty bearings, specialty fasteners, seal rings & alignment joints and engineered components under leading brands including Kahr Bearing, Airtomic, Sonic Industries, Sargent Controls and Sargent Aerospace & Defense. The Company acquired Sargent because management believes it provides complementary products and channels, and expands and enhances the Company’s product portfolio and engineering technologies. The bearings and rings businesses are included in the Plain Bearings segment. The hydraulics, fasteners and precision components businesses are included in the Engineered Products segment.
| 52 |
The acquisition of Sargent was accounted for as a purchase in accordance with FASB Accounting Standards Codification (“ASC”) Topic 805, Business Combinations. Assets acquired and liabilities assumed were recorded at their fair values as of the acquisition date. The fair values of identifiable intangible assets, which were primarily customer relationships, product approvals, trade names, and patents and trademarks, were based on valuations using the income approach. The excess of the purchase price over the estimated fair values of tangible assets, identifiable intangible assets and assumed liabilities was recorded as goodwill. The goodwill is attributable to expected synergies and expected growth opportunities. The preliminary price allocation resulted in goodwill of $223,888. The Company estimates a majority of goodwill will be deductible for United States income tax purposes. The allocation of purchase price is preliminary as the Company has not completed its analysis estimating the fair value of inventory, property, plant, and equipment, intangible assets, income tax liabilities and certain liabilities. The purchase price allocation was updated to reflect current estimated fair values at the acquisition date, with the excess of purchase price over the estimated fair value of the net assets acquired recorded as goodwill.
The preliminary purchase price allocation for Sargent was as follows:
As of April 24, 2015 | ||||
| Current assets | $ | 3,086 | ||
| Trade receivables | 24,100 | |||
| Inventories | 48,867 | |||
| Property, plant and equipment | 39,907 | |||
| Intangible assets | 203,700 | |||
| Goodwill | 223,888 | |||
| Total assets acquired | 543,548 | |||
| Accounts payable | 14,900 | |||
| Liabilities assumed | 28,648 | |||
| Net assets acquired | $ | 500,000 | ||
The valuation of the net assets acquired of $500,000 was classified as Level 3 in the valuation hierarchy. Level 3 inputs represent unobservable inputs for the asset or liability.
The components of intangible assets included as part of the Sargent acquisition was as follows:
Weighted Average Amortization Period (Years) | Gross Value | |||||
| Amortizable intangible assets | ||||||
| Customer relationships | 25 | $ | 104,500 | |||
| Product approvals | 25 | 50,500 | ||||
| Trademarks and tradenames | 10 | 18,000 | ||||
| 173,000 | ||||||
| Non-amortizable intangible assets | ||||||
| Repair station certifications | - | 30,700 | ||||
| Intangible assets | $ | 203,700 | ||||
Included in the Company’s results of operations for the twelve months ended April 2, 2016 are revenues related to the Sargent acquisition of $172,547. Also, included for the twelve months ended April 2, 2016 is net income of $14,132. Acquisition-related expenses were recorded in Other, net in the Consolidated Statements of Operations for the twelve months ended April 2, 2016 of $6,096.
The following supplemental pro forma financial information presents the financial results for the twelve months ended April 2, 2016 and March 28, 2015, as if the acquisition of Sargent had occurred at the beginning of fiscal year 2015. The pro forma financial information includes, where applicable, adjustments for: (i) the estimated amortization of acquired intangible assets, (ii) estimated additional interest expense on acquisition related borrowings, (iii) the income tax effect on the pro forma adjustments using an estimated effective tax rate. The pro forma financial information excludes, where applicable, adjustments for: (i) the estimated impact of inventory purchase accounting adjustments and (ii) the estimated closing costs on the acquisition. The pro forma financial information is presented for illustrative purposes only and is not necessarily indicative of the operating results that would have been achieved had the acquisition been completed as of the date indicated or the results that may be obtained in the future:
| 53 |
| Twelve Months Ended | ||||||||
| April 2, | March 28, | |||||||
| 2016 | 2015 | |||||||
| Pro forma net sales | $ | 605,846 | $ | 634,963 | ||||
| Pro forma net income | 70,963 | 59,404 | ||||||
| Basic earnings per share as reported | $ | 2.75 | $ | 2.52 | ||||
| Pro forma basic earnings per share | 3.06 | 2.57 | ||||||
| Diluted earnings per share as reported | $ | 2.72 | $ | 2.49 | ||||
| Pro forma diluted earnings per share | 3.02 | 2.54 | ||||||
On October 7, 2013, the Company acquired the net assets of Turbine Components Inc. (“TCI”) for approximately $3,925. Located in San Diego, California, TCI is an FAA certified aircraft gas turbine repair station and manufacturer of precision components for aerospace markets. TCI’s net sales for calendar year 2012 were approximately $4,000. The purchase price allocation is as follows: accounts receivable ($585), inventory ($125), fixed assets ($1,231), goodwill ($2,821), intangible assets ($441), other non-current assets ($127), other current liabilities ($641), and noncurrent liabilities ($766). The purchase price allocation, which resulted in goodwill of $2,821, is deductible for tax purposes. TCI is included in the Plain Bearings segment. In connection with the acquisition the Company agreed to a contract for additional contingent consideration that is dependent on the outcome of future events. The fair value of the contingent consideration as of the acquisition date was $766. The contingent consideration is based on a market valuation formula and will be payable five years from the acquisition date. The current fair value of the contingent consideration is determined to be $469 (classified as level 3 of the valuation hierarchy). Proforma net sales and net income inclusive of TCI are not materially different from the amounts reported in the accompanying consolidated statements of operations.
On August 16, 2013, the Company acquired Climax Metal Products Company (“CMP”) located in Mentor, Ohio for $13,646. The purchase price included $10,672 in cash and $2,974 of debt. CMP is a manufacturer of precision shaft collars, rigid couplings, keyless locking devices, and bearings for the industrial markets. CMP’s net sales for the calendar year 2012 were approximately $14,100. The purchase price allocation is as follows: accounts receivable ($1,206), inventory ($4,509), other current assets ($73), fixed assets ($2,466), goodwill ($5,623), intangible assets ($3,904), other non-current assets ($10), other current liabilities ($2,171), and noncurrent liabilities ($1,974). The purchase price allocation, which resulted in goodwill of $5,623, is not deductible for tax purposes. CMP is included in the Ball Bearings segment. Proforma net sales and net income inclusive of CMP are not materially different from the amounts reported in the accompanying consolidated statements of operations.
| 4. | Allowance for Doubtful Accounts |
The activity in the allowance for doubtful accounts consists of the following:
| Fiscal Year Ended | Balance at Beginning of Year | Additions |
Other* | Write-offs | Balance at End of Year | |||||||||||||||
| April 2, 2016 | $ | 860 | $ | 191 | $ | 308 | ($ | 35 | ) | $ | 1,324 | |||||||||
| March 28, 2015 | 1,060 | 90 | (72 | ) | (218 | ) | 860 | |||||||||||||
| March 29, 2014 | $ | 1,719 | 297 | 105 | (1,061 | ) | $ | 1,060 | ||||||||||||
*Foreign currency and acquisition transactions.
| 54 |
| 5. | Inventory |
Inventories are summarized below:
| April 2, | March 28, | |||||||
| 2016 | 2015 | |||||||
| Raw materials | $ | 36,632 | $ | 18,424 | ||||
| Work in process | 73,761 | 50,243 | ||||||
| Finished goods | 170,144 | 137,491 | ||||||
| $ | 280,537 | $ | 206,158 | |||||
| 6. | Property, Plant and Equipment |
Property, plant and equipment consist of the following:
| April 2, | March 28, | |||||||
| 2016 | 2015 | |||||||
| Land | $ | 18,309 | $ | 14,243 | ||||
| Buildings and improvements | 80,770 | 70,242 | ||||||
| Machinery and equipment | 228,506 | 190,661 | ||||||
| 327,585 | 275,146 | |||||||
| Less: accumulated depreciation and amortization | 142,841 | 133,497 | ||||||
| $ | 184,744 | $ | 141,649 | |||||
| 7. | Restructuring of Operations |
In the second quarter of fiscal 2015, the Company reached a decision to consolidate the manufacturing capacity of its United Kingdom (U.K.) facility into its other manufacturing facilities. This decision was based on the Company’s intent to better align manufacturing abilities and product development. The consolidation of this facility into the European and South Carolina operations will strengthen and bring improved manufacturing scale to those operations. As a result the Company recorded a charge of $6,382 associated with the consolidation of operations in the second quarter of fiscal 2015 attributable to the Roller Bearings segment. The $6,382 charge includes $3,707 of inventory rationalization costs, $1,319 in impairment of intangibles, $427 loss on fixed assets disposals, $286 in employee related costs and $643 of other costs related to the consolidation of operations. The inventory rationalization costs were recorded in cost of sales in the income statement. All other costs were recorded under operating expenses in the other, net category of the income statement. The pre-tax charge of $6,382 was offset with an associated tax benefit of $3,131. The Company determined that the market approach was the most appropriate method to estimate the fair value for the inventory and equipment using comparable sales data and actual quotes from potential buyers in the market place. The consolidation of the majority of operations was completed in the second quarter of fiscal 2015. Additional charges of $88 were recorded in the third quarter of fiscal 2015.
| 8. | Goodwill and Intangible Assets |
Goodwill
Goodwill balances, by segment, consist of the following:
| Roller | Plain | Ball | Engineered Products | Total | ||||||||||||||||
| March 28, 2015 | $ | 16,007 | $ | 20,641 | $ | 5,623 | $ | 1,168 | $ | 43,439 | ||||||||||
| Acquisitions | — | 56,570 | — | 167,318 | 223,888 | |||||||||||||||
| Other | — | — | — | (68 | ) | (68 | ) | |||||||||||||
| April 2, 2016 | $ | 16,007 | $ | 77,211 | $ | 5,623 | $ | 168,418 | $ | 267,259 | ||||||||||
| 55 |
Intangible Assets
| April 2, 2016 | March 28, 2015 | |||||||||||||||||
| Weighted Average Useful Lives | Gross Carrying Amount |
Accumulated | Gross Carrying |
Accumulated | ||||||||||||||
| Product approvals | 24 | $ | 54,360 | $ | 4,488 | $ | 4,068 | $ | 2,372 | |||||||||
| Customer relationships and lists | 24 | 113,409 | 8,784 | 9,017 | 4,349 | |||||||||||||
| Trade names | 10 | 20,019 | 3,211 | 2,102 | 1,372 | |||||||||||||
| Distributor agreements | 5 | 722 | 722 | 722 | 722 | |||||||||||||
| Patents and trademarks | 15 | 8,573 | 3,546 | 7,670 | 3,039 | |||||||||||||
| Domain names | 10 | 437 | 342 | 437 | 299 | |||||||||||||
| Other | 5 | 1,197 | 1,072 | 1,197 | 1,032 | |||||||||||||
| Non-amortizable repair station certifications | n/a | 30,700 | — | — | — | |||||||||||||
| Total | $ | 229,417 | $ | 22,165 | $ | 25,213 | $ | 13,185 | ||||||||||
Amortization expense for definite-lived intangible assets during fiscal year 2016, 2015 and 2014 was $9,000 $1,839, and $1,924, respectively. A gross carrying amount of $2,776 and related amortization of $1,469 was written off in the three month period ended September 27, 2014 due to the consolidation of the Company’s United Kingdom (“U.K.”) facility. Estimated amortization expense for the five succeeding fiscal years and thereafter is as follows:
| 2017 | $ | 9,676 | ||
| 2018 | 9,554 | |||
| 2019 | 9,331 | |||
| 2020 | 9,224 | |||
| 2021 | 9,173 | |||
| 2022 and thereafter | 129,594 |
| 9. | Accrued Expenses and Other Current Liabilities |
The significant components of accrued expenses and other current liabilities are as follows:
| April 2, | March 28, | |||||||
| 2016 | 2015 | |||||||
| Employee compensation and related benefits | $ | 12,306 | $ | 8,488 | ||||
| Taxes | 8,173 | 3,393 | ||||||
| Deferred Revenue | 7,723 | — | ||||||
| Workers Compensation | 2,178 | 2,795 | ||||||
| Software License | 966 | — | ||||||
| Legal | 2,952 | 130 | ||||||
| Other | 7,936 | 2,520 | ||||||
| $ | 42,234 | $ | 17,326 | |||||
| 10. | Debt |
New Credit Facility
In connection with the Sargent Aerospace & Defense (“Sargent”) acquisition on April 24, 2015, the Company entered into a new credit agreement (the “New Credit Agreement”) and related Guarantee, Pledge Agreement and Security Agreement with Wells Fargo Bank, National Association, as Administrative Agent, Collateral Agent, Swingline Lender and Letter of Credit Issuer and the other lenders party thereto and terminated the JP Morgan Credit Agreement. The New Credit Agreement provides RBCA, as Borrower, with (a) a $200,000 Term Loan and (b) a $350,000 Revolver and together with the Term Loan (the “Facilities”).
| 56 |
Amounts outstanding under the Facilities generally bear interest at (a) a base rate determined by reference to the higher of (1) Wells Fargo’s prime lending rate, (2) the federal funds effective rate plus 1/2 of 1% and (3) the one-month LIBOR rate plus 1% or (b) LIBOR rate plus a specified margin, depending on the type of borrowing being made. The applicable margin is based on the Company's consolidated ratio of total net debt to consolidated EBITDA from time to time. Currently, the Company's margin is 0.5% for base rate loans and 1.5% for LIBOR rate loans. As of April 2, 2016, there was $169,000 outstanding under the Revolver and $192,500 outstanding under the Term Loan, offset by $5,816 in debt issuance costs (original amount was $7,122).
The New Credit Agreement requires the Company to comply with various covenants, including among other things, financial covenants to maintain the following: (1) a ratio of consolidated net debt to adjusted EBITDA, not to exceed 3.50 to 1; and (2) a consolidated interest coverage ratio not to exceed 2.75 to 1. The New Credit Agreement allows the Company to, among other things, make distributions to shareholders, repurchase its stock, incur other debt or liens, or acquire or dispose of assets provided that the Company complies with certain requirements and limitations of the agreement. As of April 2, 2016, the Company was in compliance with all such covenants.
The Company’s obligations under the New Credit Agreement are secured as well as providing for a pledge of substantially all of the Company’s and RBCA’s assets. The Company and certain of its subsidiaries have also entered into a Guarantee to guarantee RBCA’s obligations under the New Credit Agreement.
Approximately $3,290 of the Revolver is being utilized to provide letters of credit to secure RBCA’s obligations relating to certain insurance programs. As of April 2, 2016, RBCA has the ability to borrow up to an additional $177,710 under the Revolver.
Prior Credit Facility
On November 30, 2010, the Company entered into a credit agreement (the “JP Morgan Credit Agreement”) and related security and guaranty agreements with certain banks, J.P. Morgan Chase Bank, N.A., as Administrative Agent, and J.P. Morgan Chase Bank, N.A. and KeyBank National Association as Co-Lead Arrangers and Joint Lead Book Runners. The JP Morgan Credit Agreement provided Roller Bearing Company of America, Inc. (“RBCA”), as borrower, with a $150,000 five-year senior secured revolving credit facility which can be increased by up to $100,000, in increments of $25,000, under certain circumstances and subject to certain conditions (including the receipt from one or more lenders of the additional commitment).
Amounts outstanding under the JP Morgan Credit Agreement generally bore interest at the prime rate or LIBOR plus a specified margin, depending on the type of borrowing being made. The applicable margin was based upon our consolidated ratio of net debt to adjusted EBITDA, measured at the end of this quarter. As of March 28, 2015, the Company’s margin was 0.5% for prime rate loans and 1.5% for LIBOR rate loans.
The JP Morgan Credit Agreement required the Company to comply with various covenants, including among other things, financial covenants to maintain the following: (1) a ratio of consolidated net debt to adjusted EBITDA, not to exceed 3.25 to 1; and (2) a consolidated fixed charge coverage ratio not to exceed 1.5 to 1. As of March 28, 2015 the Company was in compliance with all such covenants. The credit agreement allowed the Company to, among other things, make distributions to shareholders, repurchase its stock, incur other debt or liens, or acquire or dispose of assets provided that the Company complied with certain requirements and limitations of the agreement. The JP Morgan Credit Agreement was terminated and replaced by the New Credit Agreement discussed above. $190 of debt issuance costs were written off upon termination.
Other Notes Payable
On October 1, 2012, Schaublin purchased the land and building, which it occupied and had been leasing, for 14,067 CHF (approximately $14,910). Schaublin obtained a 20 year fixed rate mortgage of 9,300 CHF (approximately $9,857) at an interest rate of 2.9%. The balance of the purchase price of 4,767 CHF (approximately $5,053) was paid from cash on hand. The balance on this mortgage as of April 2, 2016 was 7,673 CHF, or $8,012.
| 57 |
The balances payable under all borrowing facilities are as follows:
| April 2, | March 28, | |||||||
| 2016 | 2015 | |||||||
| Revolver and term loan facilities | $ | 361,500 | $ | — | ||||
| Debt issuance cost | (5,816 | ) | — | |||||
| Other | 8,012 | 9,198 | ||||||
| Total debt | $ | 363,696 | $ | 9,198 | ||||
| Less: current portion | 10,486 | 1,233 | ||||||
| Long-term debt | $ | 353,210 | $ | 7,965 | ||||
The current portion of long-term debt as of April 2, 2016 includes the current portion of the Schaublin mortgage. The current portion of long-term debt as of March 28, 2015 includes the current portion of the Schaublin mortgage and a $750 note payable relating to the AllPower acquisition.
The Company’s required future annual principal payments for the next five years are $10,486 for fiscal 2017, $14,236 for fiscal 2018, $19,236 for fiscal 2019, $24,236 for fiscal 2020, and $295,736 for fiscal 2021.
| 11. | Other Non-Current Liabilities |
The significant components of other non-current liabilities consist of:
| April 2, | March 28, | |||||||
| 2016 | 2015 | |||||||
| Non-current pension liability | $ | 4,186 | $ | 5,022 | ||||
| Other postretirement benefits | 2,999 | 3,117 | ||||||
| Non-current income tax liability | 13,848 | 5,647 | ||||||
| Deferred compensation | 8,924 | 8,208 | ||||||
| Other | 2,871 | 537 | ||||||
| $ | 32,828 | $ | 22,531 | |||||
| 12. | Pension Plan |
At April 2, 2016, the Company has one consolidated noncontributory defined benefit pension plan covering union employees in its Heim division plant in Fairfield, Connecticut, its Bremen subsidiary plant in Plymouth, Indiana and former union employees of the Tyson subsidiary in Glasgow, Kentucky and the Nice subsidiary in Kulpsville, Pennsylvania.
Plan assets are comprised primarily of equity and fixed income investments, as follows:
| April 2, | March 28, | |||||||
| 2016 | 2015 | |||||||
| Cash and cash equivalents | $ | 9,572 | $ | 9,925 | ||||
| U.S. equity mutual funds | 8,296 | 8,509 | ||||||
| Fixed income mutual funds | 4,864 | 4,791 | ||||||
| $ | 22,732 | $ | 23,225 | |||||
The fair value of the above investments is determined using quoted market prices of identical instruments. Therefore, the valuation inputs within the fair value hierarchy established by ASC 820 are classified as Level 1 of the valuation hierarchy.
| 58 |
The following tables set forth the funded status of the Company's defined benefit pension plan and the amount recognized in the balance sheet at April 2, 2016 and March 28, 2015:
| April 2, | March 28, | |||||||
| 2016 | 2015 | |||||||
| Change in benefit obligation: | ||||||||
| Benefit obligation at beginning of year | $ | 28,247 | $ | 25,698 | ||||
| Service cost | 272 | 265 | ||||||
| Interest cost | 920 | 1,007 | ||||||
| Actuarial (gain)/loss | (1,009 | ) | 2,764 | |||||
| Benefits paid | (1,513 | ) | (1,487 | ) | ||||
| Benefit obligation at end of year | $ | 26,917 | $ | 28,247 | ||||
| Change in plan assets: | ||||||||
| Fair value of plan assets at beginning of year | $ | 23,225 | $ | 21,603 | ||||
| Actual return on plan assets | (231 | ) | 1,859 | |||||
| Employer contributions | 1,250 | 1,250 | ||||||
| Benefits paid | (1,513 | ) | (1,487 | ) | ||||
| Fair value of plan assets at end of year | $ | 22,731 | $ | 23,225 | ||||
| Underfunded status at end of year | $ | (4,186 | ) | $ | (5,022 | ) | ||
| Amounts recognized in the consolidated balance sheet: | ||||||||
| Non-current assets | $ | — | $ | — | ||||
| Non-current liabilities | (4,186 | ) | (5,022 | ) | ||||
| Net liability recognized | $ | (4,186 | ) | $ | (5,022 | ) | ||
| Amounts recognized in accumulated other comprehensive loss: | ||||||||
| Prior service cost | $ | 167 | $ | 233 | ||||
| Net actuarial loss | 10,806 | 11,312 | ||||||
| Accumulated other comprehensive loss | $ | 10,973 | $ | 11,545 | ||||
| Amounts included in accumulated other comprehensive loss expected to be recognized as components of net periodic benefit cost in 2017: | ||||||||
| Prior service cost | $ | 61 | ||||||
| Net actuarial loss | 1,343 | |||||||
| Total | $ | 1,404 | ||||||
Benefits under the union plans are not a function of employees' salaries; thus, the accumulated benefit obligation equals the projected benefit obligation.
The following table sets forth net periodic benefit cost of the Company's plan for the three fiscal years in the period ended April 2, 2016:
| Fiscal Year Ended | ||||||||||||
| April 2, | March 28, | March 29, | ||||||||||
| 2016 | 2015 | 2014 | ||||||||||
| Components of net periodic benefit cost: | ||||||||||||
| Service cost | $ | 272 | $ | 265 | $ | 287 | ||||||
| Interest cost | 920 | 1,007 | 991 | |||||||||
| Expected return on plan assets | (1,615 | ) | (1,484 | ) | (1,591 | ) | ||||||
| Amortization of prior service cost | 66 | 66 | 70 | |||||||||
| Amortization of losses | 1,343 | 1,122 | 1,370 | |||||||||
| Net periodic benefit cost | $ | 986 | $ | 976 | $ | 1,127 | ||||||
| 59 |
The assumptions used in determining the net periodic benefit cost information are as follows:
| FY 2016 | FY 2015 | FY 2014 | ||||||||||
| Discount rate | 3.40 | % | 4.10 | % | 3.80 | % | ||||||
| Expected long-term rate of return on plan assets | 7.00 | % | 7.00 | % | 7.75 | % | ||||||
The discount rate used in determining the funded status as of April 2, 2016 and March 28, 2015 was 3.40%.
In developing the overall expected long-term return on plan assets assumption, a building block approach was used in which rates of return in excess of inflation were considered separately for equity securities and debt securities. The excess returns were weighted by the representative target allocation and added along with an appropriate rate of inflation to develop the overall expected long-term return on plan assets assumption. The Company’s long-term target allocation of plan assets is 70% equity and 30% fixed income investments.
The Company's investment program objective is to achieve a rate of return on plan assets which will fund the plan liabilities and provide for required benefits while avoiding undue exposure to risk to the plan and increases in funding requirements.
The following benefit payments, which reflect future service as appropriate, are expected to be paid. The benefit payments are based on the same assumptions used to measure the Company's benefit obligation at the end of fiscal 2016:
| 2017 | $ | 1,603 | ||
| 2018 | 1,634 | |||
| 2019 | 1,667 | |||
| 2020 | 1,698 | |||
| 2021 | 1,713 | |||
| 2022-2026 | 8,498 |
Although no contributions are required for fiscal 2017, the Company expects to make cash contributions in the $750 to $1,500 range.
One of the Company’s foreign operations, Schaublin, sponsors a pension plan for its approximately 157 employees in conformance with Swiss pension law. The plan is funded with a reputable (S&P rating A+) Swiss insurer. Through the insurance contract, the Company has effectively transferred all investment and mortality risk to the insurance company, which guarantees the federally mandated annual rate of return and the conversion rate at retirement. As a result, the plan has no unfunded liability; the interest cost is exactly offset by actual return. Thus, the net periodic cost is equal to the amount of annual premium paid by the Company. For fiscal years 2016, 2015 and 2014, the Company made contribution and premium payments equal to $861, $885 and $825, respectively.
The Company also has defined contribution plans under Section 401(k) of the Internal Revenue Code for all of its employees not covered by a collective bargaining agreement. Employer contributions under this plan, ranging from 10%-100% of eligible amounts contributed by employees, amounted to $1,354, $576 and $733 in fiscal 2016, 2015 and 2014, respectively. The amount for fiscal 2014 included a $300 discretionary match made by the Company.
Effective September 1, 1996, the Company adopted a non-qualified Supplemental Executive Retirement Plan ("SERP") for a select group of highly compensated management employees designated by the Board of the Company. The SERP allowed eligible employees to elect to defer, until termination of their employment, the receipt of up to 25% of their salary. In August 2008, the plan was modified, allowing eligible employees to elect to defer up to 75% of their current salary and up to 100% of bonus compensation. Employer contributions under this plan equal the lesser of 25% of the deferrals, or 1.75% of the employee’s annual salary, which vest in full after one year of service following the effective date of the SERP. Employer contributions under this plan amounted to $214, $177 and $162 in fiscal 2016, 2015 and 2014, respectively.
The fair value of the investments in the SERP is determined using quoted market prices of identical instruments. Therefore, the valuation inputs within the fair value hierarchy established by ASC 820 are classified as Level 1 of the valuation hierarchy.
| 60 |
| 13. | Postretirement Health Care and Life Insurance Benefits |
The Company, for the benefit of employees at its Heim, West Trenton, Bremen and PIC facilities and former union employees of its Tyson and Nice subsidiaries, sponsors contributory defined benefit health care plans that provide postretirement medical and life insurance benefits to union employees who have attained certain age and/or service requirements while employed by the Company. The plans are unfunded and costs are paid as incurred. Postretirement benefit obligations are included in “Accrued expenses and other current liabilities” and "Other non-current liabilities" in the consolidated balance sheet.
The following table set forth the funded status of the Company’s postretirement benefit plans, the amount recognized in the balance sheet at April 2, 2016 and March 28, 2015:
April 2, 2016 | March 28, 2015 | |||||||
| Change in benefit obligation: | ||||||||
| Benefit obligation at beginning of year | $ | 3,330 | $ | 2,990 | ||||
| Service cost | 54 | 50 | ||||||
| Interest cost | 107 | 115 | ||||||
| Actuarial (gain) loss | (129 | ) | 329 | |||||
| Benefits paid | (140 | ) | (154 | ) | ||||
| Benefit obligation at end of year | $ | 3,222 | $ | 3,330 | ||||
| Change in plan assets: | ||||||||
| Fair value of plan assets at beginning of year | $ | — | $ | — | ||||
| Company contributions | 140 | 154 | ||||||
| Benefits paid | (140 | ) | (154 | ) | ||||
| Fair value of plan assets at end of year | $ | — | $ | — | ||||
| (Under) funded status at end of year | $ | (3,222 | ) | $ | (3,330 | ) | ||
| Amounts recognized in the consolidated balance sheet: | ||||||||
| Current liability | $ | (223 | ) | $ | (213 | ) | ||
| Non-current liability | (2,999 | ) | (3,117 | ) | ||||
| Net liability recognized | $ | (3,222 | ) | $ | (3,330 | ) | ||
| Amounts recognized in accumulated other comprehensive loss: | ||||||||
| Prior service cost | $ | 22 | $ | 25 | ||||
| Net actuarial loss | 514 | 679 | ||||||
| Accumulated other comprehensive loss | $ | 536 | $ | 704 | ||||
| Amounts included in accumulated other comprehensive loss expected to be recognized as components of net periodic benefit cost in 2017: | ||||||||
| Prior service cost | $ | 3 | ||||||
| Net actuarial loss | 28 | |||||||
| Total | $ | 31 | ||||||
| Fiscal Year Ended | ||||||||||||
| April 2, | March 28, | March 29, | ||||||||||
| 2016 | 2015 | 2014 | ||||||||||
| Components of net periodic benefit cost: | ||||||||||||
| Service cost | $ | 54 | $ | 50 | $ | 48 | ||||||
| Interest cost | 107 | 115 | 111 | |||||||||
| Prior service cost amortization | 3 | 3 | 3 | |||||||||
| Amount of loss recognized | 37 | 17 | 39 | |||||||||
| Net periodic benefit cost | $ | 201 | $ | 185 | $ | 201 | ||||||
| 61 |
The Company measures its plans as of the last day of the fiscal year.
The plans contractually limit the benefit to be provided for certain groups of current and future retirees. As a result, there is no health care trend associated with these groups. The discount rate used in determining the accumulated postretirement benefit obligation was 3.40% at April 2, 2016 and March 28, 2015. The discount rate used in determining the net periodic benefit cost was 3.40% for fiscal 2016, 4.10% for fiscal 2015, and 3.80% for fiscal 2014. To determine the postretirement net periodic benefit costs in fiscal 2016 and fiscal 2015 the RP-2014 mortality table was used and for fiscal 2014 the RP-2000 combined mortality table was used.
The following benefit payments, which reflect future service as appropriate, are expected to be paid. The benefit payments are based on the same assumptions used to measure the Company's benefit obligation at the end of fiscal 2016:
| 2017 | $ | 223 | ||
| 2018 | 237 | |||
| 2019 | 250 | |||
| 2020 | 250 | |||
| 2021 | 234 | |||
| 2022-2026 | 1,048 |
| 14. | Income Taxes |
Income before income taxes for the Company's domestic and foreign operations is as follows:
| Fiscal Year Ended | ||||||||||||
April 2, 2016 | March 28, 2015 | March 29, 2014 | ||||||||||
| Domestic | $ | 83,622 | $ | 79,374 | $ | 74,975 | ||||||
| Foreign | 11,163 | 5,181 | 12,778 | |||||||||
| $ | 94,785 | $ | 84,555 | $ | 87,753 | |||||||
The provision for (benefit from) income taxes consists of the following:
| Fiscal Year Ended | ||||||||||||
April 2, 2016 | March 28, 2015 | March 29, 2014 | ||||||||||
| Current: | ||||||||||||
| Federal | $ | 26,281 | $ | 21,833 | $ | 22,835 | ||||||
| State | 1,960 | 809 | 1,292 | |||||||||
| Foreign | 2,986 | 2,621 | 3,054 | |||||||||
| 31,227 | 25,263 | 27,181 | ||||||||||
| Deferred: | ||||||||||||
| Federal | (279 | ) | 379 | 694 | ||||||||
| State | 342 | 630 | (9 | ) | ||||||||
| Foreign | (399 | ) | 35 | (321 | ) | |||||||
| (336 | ) | 1,044 | 364 | |||||||||
| Total | $ | 30,891 | 26,307 | $ | 27,545 | |||||||
A reconciliation of income taxes computed using the U.S. federal statutory rate to that reflected in operations follows:
| Fiscal Year Ended | ||||||||||||
April 2, 2016 | March 28, 2015 | March 29, 2014 | ||||||||||
| Income taxes using U.S. federal statutory rate | $ | 33,175 | $ | 29,594 | $ | 30,714 | ||||||
| State income taxes, net of federal benefit | 1,493 | 1,191 | 942 | |||||||||
| Domestic production activities deduction | (2,320 | ) | (2,414 | ) | (2,300 | ) | ||||||
| Foreign rate differential | (1,321 | ) | 842 | (1,739 | ) | |||||||
| Worthless stock deduction | — | (4,100 | ) | — | ||||||||
| U.S. unrecognized tax positions | 181 | 759 | (295 | ) | ||||||||
| Other | (317 | ) | 435 | 223 | ||||||||
| $ | 30,891 | $ | 26,307 | $ | 27,545 | |||||||
| 62 |
Net deferred tax assets (liabilities) consist of the following:
April 2, 2016 | March 28, 2015 | |||||||
| Deferred tax assets (liabilities): | ||||||||
| Postretirement benefits | $ | 1,111 | $ | 1,148 | ||||
| Employee compensation accruals | 3,541 | 2,413 | ||||||
| Net operating losses | 431 | 423 | ||||||
| Inventory | 13,017 | 9,731 | ||||||
| Stock compensation | 6,357 | 5,289 | ||||||
| Pension | 1,549 | 1,868 | ||||||
| State tax | 1,672 | 1,450 | ||||||
| Other | 3,006 | 1,723 | ||||||
| Total gross deferred tax assets | 30,684 | 24,045 | ||||||
| Valuation allowance | (580 | ) | (538 | ) | ||||
| Total deferred tax assets | $ | 30,104 | $ | 23,507 | ||||
| Deferred tax liabilities: | ||||||||
| Property, plant and equipment | (16,746 | ) | (14,200 | ) | ||||
| Intangible assets | (16,566 | ) | (6,941 | ) | ||||
| Total deferred tax liabilities | (33,312 | ) | (21,141 | ) | ||||
| Total net deferred tax assets (liabilities) | $ | (3,208 | ) | $ | 2,366 | |||
A valuation allowance has been recorded on certain foreign net operating losses, state credits and state net operating losses as it is more likely than not that these items will not be utilized. For the Company’s fiscal year ended April 2, 2016 the valuation allowance increased by $42 which pertained to an increase of state credits. For the Company’s fiscal year ended March 28, 2015 the valuation allowance decreased by $1,057 of which $1,104 pertained to a decrease of foreign net operating losses and $47 pertained to an increase of state credits and state net operating losses.
The Company has determined that its undistributed foreign earnings of approximately $84,524 at April 2, 2016 will be re-invested indefinitely based upon the need for cash in its foreign operations, potential foreign acquisitions and the Company's inability to remit cash back to the United States under its current foreign debt obligations.
As the Company’s undistributed earnings in foreign subsidiaries are considered to be reinvested indefinitely, no provision for U.S. federal and state income taxes has been provided. Upon repatriation of those earnings, in the form of dividends or otherwise, the Company would be subject to both U.S. income taxes (subject to an adjustment of foreign tax credits) and withholding taxes payable to various foreign countries. Determination of the amount of unrecognized deferred U.S. income tax liability is not practicable due to the complexities associated with its hypothetical calculation.
At April 2, 2016, the Company has state net operating losses in different jurisdictions at varying amounts up to $7,418, which expire at various dates through 2036. At April 2, 2016, the Company has state credits in different jurisdictions at varying amounts up to $2,148 which will expire at various dates through 2031. At April 2, 2016, the Company has foreign credits in different jurisdictions at varying amounts up to $663 which will expire at various dates through 2036.
The Company files income tax returns in the U.S. federal jurisdiction, and various states and foreign jurisdictions. With few exceptions, the Company is no longer subject to state or foreign income tax examinations by tax authorities for years ending before April 2, 2005. The Company is no longer subject to U.S. federal tax examination by the Internal Revenue Service for years ending before March 29, 2014. A U.S. federal tax examination by the Internal Revenue Service for the year ended March 30, 2013 was effectively settled in the Company’s first quarter fiscal 2016. A U.S. federal tax examination by the Internal Revenue Service for the year ended March 31, 2011 was completed during fiscal 2014.
| 63 |
A reconciliation of the beginning and ending amount of unrecognized tax benefits are as follows:
April 2, 2016 | March 28, 2015 | March 29, 2014 | ||||||||||
| Balance, beginning of year | $ | 5,514 | $ | 5,250 | $ | 5,892 | ||||||
| Gross increases– tax positions taken during a prior period | 248 | (139 | ) | 768 | ||||||||
| Gross increases– tax positions taken during the current period.. | 8,745 | 1,805 | 853 | |||||||||
| Decreases due to settlement with taxing authorities | — | (954 | ) | (1,182 | ) | |||||||
| Decreases due to lapse of the applicable statute of limitations | (210 | ) | (448 | ) | (1,081 | ) | ||||||
| Balance, end of year | $ | 14,297 | $ | 5,514 | $ | 5,250 | ||||||
If recognized, substantially all of the unrecognized tax benefits for the Company’s fiscal years ended April 2, 2016 and March 28, 2015 would affect the effective income tax rate.
The Company recognizes the interest and penalties accrued related to unrecognized tax benefits in income tax expense. The Company recognized a detriment of $182 of interest and penalties on its statement of operations for the fiscal years ended April 2, 2016 and a benefit of $20 of interest and penalties on its statement of operations for the fiscal year ended March 28, 2015. The Company has approximately $900 and $718 of accrued interest and penalties at April 2, 2016 and March 28, 2015, respectively.
The Company believes it is reasonably possible that some of its unrecognized tax positions may be effectively settled by the end of the Company’s fiscal year ending April 1, 2017 due to the closing of audits and the statute of limitations expiring in varying jurisdictions. The decrease, pertaining primarily to state credits and state tax, is estimated to be $269.
| 15. | Stockholders' Equity |
Stock Option Plans
2005 Long-Term Incentive Plan
The 2005 Long-Term Incentive Plan provides for grants of stock options, stock appreciation rights, restricted stock and performance awards. Directors, officers and other employees and persons who engage in services for the Company are eligible for grants under the plan. The purpose of the plan is to provide these individuals with incentives to maximize stockholder value and otherwise contribute to the Company’s success and to enable the Company to attract, retain and reward the best available persons for positions of responsibility.
1,139,170 shares of common stock were authorized for issuance under the plan, subject to adjustment in the event of a reorganization, stock split, merger or similar change in the Company’s corporate structure or in the outstanding shares of common stock. An amendment to increase the number of shares available for issuance under the 2005 Long-Term Incentive Plan from 1,139,170 to 1,639,170 was approved by shareholder vote in September 2006. A further amendment to increase the number of shares available for issuance under the 2005 Long-Term Incentive Plan from 1,639,170 to 2,239,170 was approved by shareholder vote in September 2007. The Company may grant shares of restricted stock to its employees and directors in the future under the plan. The Company’s Compensation Committee will administer the plan. The Company’s Board also has the authority to administer the plan and to take all actions that the Compensation Committee is otherwise authorized to take under the plan. The terms and conditions of each award made under the plan, including vesting requirements, is set forth consistent with the plan in a written agreement with the grantee.
2013 Long-Term Incentive Plan
The 2013 Long-Term Incentive Plan provides for grants of stock options, stock appreciation rights, restricted stock and performance awards. Directors, officers and other employees and persons who engage in services for the Company are eligible for grants under the plan. The purpose of the plan is to provide these individuals with incentives to maximize stockholder value and otherwise contribute to the Company’s success and to enable the Company to attract, retain and reward the best available persons for positions of responsibility.
| 64 |
1,500,000 shares of common stock were authorized for issuance under the plan, subject to adjustment in the event of a reorganization, stock split, merger or similar change in the Company’s corporate structure or in the outstanding shares of common stock. The Company may grant shares of restricted stock to its employees and directors in the future under the plan. The Company’s Compensation Committee will administer the plan. The Company’s Board also has the authority to administer the plan and to take all actions that the Compensation Committee is otherwise authorized to take under the plan. The terms and conditions of each award made under the plan, including vesting requirements, is set forth consistent with the plan in a written agreement with the grantee.
Stock Options. Under the 2005 Long-Term Incentive Plan, the Compensation Committee or the Board may approve the award of grants of incentive stock options and other non-qualified stock options. The Compensation Committee also has the authority to approve the grant of options that will become fully vested and exercisable automatically upon a change in control. The Compensation Committee may not, however, approve an award to any one person in any calendar year for options to purchase common stock equal to more than 10% of the total number of shares authorized under the plan, and it may not approve an award of incentive options first exercisable in any calendar year whose underlying shares have a fair market value greater than $100,000 determined at the time of grant. The Compensation Committee will approve the exercise price and term of any option in its discretion; however, the exercise price may not be less than 100% of the fair market value of a share of common stock on the date of grant. In the case of any incentive stock option, the option must be exercised within 10 years of the date of grant. The exercise price of an incentive option awarded to a person who owns stock constituting more than 10% of the Company’s voting power may not be less than 110% of such fair market value on such date and the option must be exercised within five years of the date of grant. As of April 2, 2016, there were outstanding options to purchase 748,300 shares of common stock granted under the 2005 Long-Term Incentive Plan, 513,400 of which were exercisable. There were 434,750 outstanding options to purchase shares of common stock granted under the 2013 Long-Term Incentive Plan, 46,000 of which were exercisable.
Restricted Stock. Under the 2005 Long-Term Incentive Plan, the Compensation Committee may approve the award of restricted stock subject to the conditions and restrictions, and for the duration that it determines in its discretion. As of April 2, 2016, there were 93,564 shares of restricted stock outstanding. Under the 2013 Long-Term Incentive Plan, there were 195,402 shares of restricted stock outstanding.
Stock Appreciation Rights. The Compensation Committee may approve the grant of stock appreciation rights, or SARs, subject to the terms and conditions contained in the plan. Under the 2005 Long-Term Incentive Plan, the exercise price of a SAR must equal the fair market value of a share of the Company’s common stock on the date the SAR was granted. Upon exercise of a SAR, the grantee will receive an amount in shares of our common stock equal to the difference between the fair market value of a share of common stock on the date of exercise and the exercise price of the SAR, multiplied by the number of shares as to which the SAR is exercised.
Performance Awards. The Compensation Committee may approve the grant of performance awards contingent upon achievement by the grantee or by the Company, of set goals and objectives regarding specified performance criteria, over a specified performance cycle. Awards may include specific dollar-value target awards, performance units, the value of which is established at the time of grant, and/or performance shares, the value of which is equal to the fair market value of a share of common stock on the date of grant. The value of a performance award may be fixed or fluctuate on the basis of specified performance criteria. A performance award may be paid out in cash and/or shares of common stock or other securities.
Amendment and Termination of the Plan. The Board may amend or terminate the 2005 Long-Term Incentive Plan at its discretion, except that no amendment will become effective without prior approval of the Company’s stockholders if such approval is necessary for continued compliance with the performance-based compensation exception of Section 162(m) of the Internal Revenue Code or any stock exchange listing requirements. If not previously terminated by the Board, the plan will terminate on the tenth anniversary of its adoption.
A summary of the status of the Company's stock options outstanding as of April 2, 2016 and changes during the year then ended is presented below. All cashless exercises of options and warrants are handled through an independent broker.
| Number Of Common Stock Options | Weighted Average Exercise Price |
Weighted Average | Intrinsic Value | |||||||||||||
| Outstanding, March 28, 2015 | 1,143,558 | $ | 42.24 | 4.4 | $ | 38,122 | ||||||||||
| Awarded | 211,500 | 72.35 | ||||||||||||||
| Exercised | (171,758 | ) | 26.68 | |||||||||||||
| Forfeitures | (250 | ) | 58.00 | |||||||||||||
| Outstanding, April 2, 2016 | 1,183,050 | $ | 49.88 | 4.4 | $ | 28,118 | ||||||||||
| Exercisable, April 2, 2016 | 559,400 | $ | 38.21 | 3.0 | $ | 19,823 | ||||||||||
| 65 |
The fair value for the Company's options was estimated at the date of grant using the Black-Scholes option pricing model with the following weighted-average assumptions, which are updated to reflect current expectations of the dividend yield, expected life, risk-free interest rate and using historical volatility to project expected volatility:
| Fiscal Year Ended | ||||||||||||
April 2, 2016 | March 28, 2015 | March 29, 2014 | ||||||||||
| Dividend yield | 0.0 | % | 0.0 | % | 0.0 | % | ||||||
| Expected weighted-average life (yrs.) | 5.0 | 4.8 | 4.8 | |||||||||
| Risk-free interest rate | 1.70 | % | 1.60 | % | 1.04 | % | ||||||
| Expected volatility | 31.2 | % | 33.2 | % | 45.2 | % | ||||||
The weighted average fair value per share of options granted was $22.05 in fiscal 2016, $20.15 in fiscal 2015 and $20.76 in fiscal 2014.
As of April 2, 2016, there was $9,861 of unrecognized compensation costs related to options which is expected to be recognized over a weighted average period of 3.2 years. The total fair value of options that vested in fiscal 2016, 2015 and 2014 was $12,126, $14,350 and $9,570, respectively. The total intrinsic value of options exercised in fiscal 2016, 2015 and 2014 was $7,219, $8,045 and $6,954, respectively.
Of the total awards outstanding at April 2, 2016, 1,161,814 are either fully vested or are expected to vest. These shares have a weighted average exercise price of $37.02, an intrinsic value of $42,561, and a weighted average contractual term of 4.4 years.
A summary of the status of the Company’s restricted stock outstanding as of April 2, 2016 and the changes during the year then ended is presented below.
| Number Of Restricted Stock Shares | Weighted- Average Grant Date Fair Value | |||||||
| Non-vested, March 28, 2015 | 253,384 | $ | 53.79 | |||||
| Granted | 142,450 | 71.57 | ||||||
| Vested | (106,681 | ) | 68.93 | |||||
| Forfeitures | (187 | ) | 52.34 | |||||
| Non-vested, April 2, 2016 | 288,966 | $ | 63.49 | |||||
The Company recorded $4,044 (net of taxes of $2,396) in compensation in fiscal 2016 related to restricted stock awards. These awards were valued at the fair market value of the Company’s common stock on the date of issuance and are being amortized as expense over the applicable vesting period. Unrecognized expense for restricted stock was $13,586 at April 2, 2016. This cost is expected to be recognized over a weighted average period of approximately 2.9 years.
| 16. | Commitments and Contingencies |
The Company leases facilities under non-cancelable operating leases, which expire on various dates through January 2023, with rental expense aggregating $5,101, $3,444 and $3,377 in fiscal 2016, 2015 and 2014, respectively.
The Company also has non-cancelable operating leases for transportation, computer and office equipment, which expire at various dates. Rental expense for fiscal 2016, 2015 and 2014 aggregated $1,606, $1,439 and $1,622, respectively.
Certain of the above leases are renewable while none contain material contingent rent or concession clauses.
| 66 |
The aggregate future minimum lease payments under operating leases are as follows:
| 2017 | $ | 5,451 | ||
| 2018 | 4,335 | |||
| 2019 | 3,077 | |||
| 2020 | 1,350 | |||
| 2021 | 754 | |||
| 2022 and thereafter | 664 |
As of April 2, 2016, approximately 12% of the Company's hourly employees in the U.S. and abroad were represented by labor unions.
The Company enters into government contracts and subcontracts that are subject to audit by the government. In the opinion of the Company's management, the results of such audits, if any, are not expected to have a material impact on the cash flows, financial condition or results of operations of the Company.
For fiscal 2016, 2015 and 2014, there were no audits by the government, the results of which, in the opinion of the Company’s management, had a material impact on the cash flows, financial condition or results of operations of the Company.
The Company is subject to federal, state and local environmental laws and regulations, including those governing discharges of pollutants into the air and water, the storage, handling and disposal of wastes and the health and safety of employees. The Company also may be liable under the Comprehensive Environmental Response, Compensation, and Liability Act or similar state laws for the costs of investigation and cleanup of contamination at facilities currently or formerly owned or operated by the Company, or at other facilities at which the Company may have disposed of hazardous substances. In connection with such contamination, the Company may also be liable for natural resource damages, government penalties and claims by third parties for personal injury and property damage. Agencies responsible for enforcing these laws have authority to impose significant civil or criminal penalties for non-compliance. The Company believes it is currently in material compliance with all applicable requirements of environmental laws. The Company does not anticipate material capital expenditures for environmental compliance in fiscal years 2017 or 2018.
Investigation and remediation of contamination is ongoing at some of the Company's sites. In particular, state agencies have been overseeing groundwater monitoring activities at the Company's facility in Hartsville, South Carolina and a corrective action plan at the Company’s facility in Clayton, Georgia. At Hartsville, the Company is monitoring low levels of contaminants in the groundwater caused by former operations. Plans are currently underway to conclude remediation and monitoring activities. In connection with the purchase of the Fairfield, Connecticut facility in 1996, the Company agreed to assume responsibility for completing clean-up efforts previously initiated by the prior owner. The Company submitted data to the state that the Company believes demonstrates that no further remedial action is necessary, although the state may require additional clean-up or monitoring. In connection with the purchase of the Company’s Clayton, Georgia facility, the Company agreed to take assignment of the hazardous waste permit covering such facility and to assume certain responsibilities to implement a corrective action plan concerning the remediation of certain soil and groundwater contamination present at that facility. The corrective action plan is ongoing. Although there can be no assurance, the Company does not expect the costs associated with the above sites to be material.
There are various claims and legal proceedings against the Company relating to its operations in the normal course of business. The Company accrues costs associated with legal and non-income tax matters when they become probable and reasonably estimable. Our wholly owned subsidiary, RBC Aircraft Products, Inc. was a plaintiff in a lawsuit against Precise Machining & Manufacturing LLC in the United States District Court, District of Connecticut’s Case Number 3:10 CV 878 (SRU). A jury award against Precise Machining & Manufacturing LLC and in favor of RBC Aircraft Products, Inc. in the amount of $2,986 was entered on April 9, 2013. Precise Machining & Manufacturing LLC subsequently filed a motion for judgment in its favor as a matter of law and a motion for a new trial. On May 5, 2014 the presiding judge surprisingly overturned the jury verdict as a matter of law and, in the alternative granted Precise a motion for a new trial on grounds not even requested by Precise. RBC Aircraft Products, Inc. subsequently filed a motion for Certification of Judgment, which was unopposed by Precise Machining & Manufacturing LLC, which was granted on July 28, 2014 and allowed RBC Aircraft Products, Inc. to immediately appeal the judges’ decision to overturn the jury verdict to the Second Circuit Court of Appeals (“Second Circuit”). RBC Aircraft Products, Inc. subsequently filed an appeal. On November 10, 2015 the Second Circuit reversed the District Court’s judgment in favor of Precise as a matter of law. However, the Second Circuit Court of Appeals remanded the case for a second trial giving deference to the District Court’s alternative holding that a second trial on liability was appropriate. On January 6, 2016 the District Court entered a pre-trial order tentatively scheduling a trial date on July 6, 2016. On May 20, 2016 RBC Aircraft Products, Inc. accepted an offer of judgement filed by Precise Machining and Manufacturing, LLC with the court on May 6, 2016 which as of May 20, 2016 resulted in a judgment to enter against Precise Machining and Manufacturing, LLC in the amount of $450 inclusive of costs.
| 67 |
On October 5, 2007 SKF USA, Inc. (“SKF”) filed suit in state court in Pennsylvania state court against Tyson Bearing Company, Inc. (now known as RBC Lubron Bearing Systems, Inc. (“Tyson”) alleging that when Tyson vacated a facility in Glasgow, Kentucky on June 29, 2007, it breached an alleged five-year lease. SKF sought to recover approximately $3,750, including rent, prejudgment interest and attorney’s fees. After pending in the Pennsylvania court system for over nine years, a trial of the case was finally held during February, 2016. On February 17, 2016 the jury returned a verdict against Tyson in the amount of $1,031. Both SKF and Tyson filed post-trial motions. Oral argument for the post-trial motions and request was held on April 19, 2016. The Court subsequently denied Tyson’s motion for a judgment notwithstanding the verdict as well as SKF’s motion for a new trial. The Court did award SKF $450 in prejudgment interest. On May 18, 2016 Tyson and SKF entered into a confidential settlement with respect to this matter.
| 17. | Other Operating Expense, Net |
Other operating expense, net is comprised of the following:
| Fiscal Year Ended | ||||||||||||
April 2, 2016 | March 28, 2015 | March 29, 2014 | ||||||||||
| Gain (loss) on impairment or disposition of assets | $ | — | $ | 511 | $ | (31 | ) | |||||
| Plant consolidation and restructuring costs | 1,063 | 2,554 | 1,917 | |||||||||
| Acquisition costs | 5,096 | — | — | |||||||||
| Provision for doubtful accounts | 191 | 31 | 138 | |||||||||
| Amortization of intangibles | 9,000 | 1,839 | 1,924 | |||||||||
| Other expense | 866 | 867 | 230 | |||||||||
| $ | 16,216 | $ | 5,802 | $ | 4,178 | |||||||
| 18. | Reportable Segments |
The Company operates through operating segments for which separate financial information is available, and for which operating results are evaluated regularly by the Company's chief operating decision maker in determining resource allocation and assessing performance. Those operating segments with similar economic characteristics and that meet all other required criteria, including nature of the products and production processes, distribution patterns and classes of customers, are aggregated as reportable segments. With the acquisition and integration of Sargent into the Company’s operating and reportable segment structure, the Company has transitioned the Other segment to a new reportable segment titled Engineered Products.
The Company has four reportable business segments, Plain Bearings, Roller Bearings, Ball Bearings and Engineered Products, which are described below.
Plain Bearings. Plain bearings are produced with either self-lubricating or metal-to-metal designs and consists of several sub-classes, including rod end bearings, spherical plain bearings and journal bearings. Unlike ball bearings, which are used in high-speed rotational applications, plain bearings are primarily used to rectify inevitable misalignments in various mechanical components.
Roller Bearings. Roller bearings are anti-friction bearings that use rollers instead of balls. The Company manufactures four basic types of roller bearings: heavy duty needle roller bearings with inner rings, tapered roller bearings, track rollers and aircraft roller bearings.
Ball Bearings. The Company manufactures four basic types of ball bearings: high precision aerospace, airframe control, thin section and commercial ball bearings which are used in high-speed rotational applications.
Engineered Products. Engineered Products consists of highly engineered hydraulics, fasteners, collets and precision components used in aerospace, marine and industrial applications. The hydraulics, fasteners and precision components businesses of Sargent are included here.
The accounting policies of the reportable segments are the same as those described in Part II, Item 8. “Financial Statements and Supplementary Data,” Note 2 “Summary of Significant Accounting Policies.” Segment performance is evaluated based on segment net sales and gross margin. Items not allocated to segment operating income include corporate administrative expenses and certain other amounts. Identifiable assets by reportable segment consist of those directly identified with the segment's operations. Corporate assets consist of cash, fixed assets and certain prepaid expenses.
| 68 |
| Fiscal Year Ended | ||||||||||||
April 2, 2016 | March 28, 2015 | March 29, 2014 | ||||||||||
| Net External Sales | ||||||||||||
| Plain | $ | 270,534 | $ | 230,168 | $ | 223,099 | ||||||
| Roller | 112,039 | 128,702 | 115,806 | |||||||||
| Ball | 53,650 | 56,464 | 49,555 | |||||||||
| Engineered Products | 161,249 | 29,944 | 30,426 | |||||||||
| $ | 597,472 | $ | 445,278 | $ | 418,886 | |||||||
| Gross Margin | ||||||||||||
| Plain | $ | 103,500 | $ | 86,058 | $ | 85,158 | ||||||
| Roller | 47,469 | 50,002 | 48,785 | |||||||||
| Ball | 21,352 | 22,501 | 18,125 | |||||||||
| Engineered Products | 46,457 | 11,579 | 12,729 | |||||||||
| $ | 218,778 | $ | 170,140 | $ | 164,797 | |||||||
| Selling, General and Administrative Expenses | ||||||||||||
| Plain | $ | 21,008 | $ | 18,741 | $ | 17,923 | ||||||
| Roller | 5,958 | 6,169 | 6,892 | |||||||||
| Ball | 5,512 | 5,326 | 4,511 | |||||||||
| Engineered Products | 19,631 | 4,018 | 3,991 | |||||||||
| Corporate | 46,612 | 41,654 | 38,652 | |||||||||
| $ | 98,721 | $ | 75,908 | $ | 71,969 | |||||||
| Operating Income | ||||||||||||
| Plain | $ | 73,289 | $ | 67,032 | $ | 66,343 | ||||||
| Roller | 41,270 | 40,056 | 41,630 | |||||||||
| Ball | 15,182 | 16,584 | 11,732 | |||||||||
| Engineered Products | 26,970 | 7,639 | 8,968 | |||||||||
| Corporate | (52,870 | ) | (42,881 | ) | (40,023 | ) | ||||||
| $ | 103,841 | $ | 88,430 | $ | 88,650 | |||||||
| Total Assets | ||||||||||||
| Plain | $ | 628,531 | $ | 474,208 | $ | 441,770 | ||||||
| Roller | 286,418 | 234,377 | 207,676 | |||||||||
| Ball | 55,675 | 50,074 | 44,119 | |||||||||
| Engineered Products | 454,428 | 49,307 | 42,861 | |||||||||
| Corporate | (326,542 | ) | (175,893 | ) | (115,433 | ) | ||||||
| $ | 1,098,510 | $ | 632,073 | $ | 620,993 | |||||||
| Capital Expenditures | ||||||||||||
| Plain | $ | 5,984 | $ | 7,505 | $ | 15,990 | ||||||
| Roller | 4,239 | 5,433 | 3,894 | |||||||||
| Ball | 1,457 | 2,333 | 1,424 | |||||||||
| Engineered Products | 5,693 | 1,592 | 3,991 | |||||||||
| Corporate | 3,491 | 4,034 | 3,621 | |||||||||
| $ | 20,864 | $ | 20,897 | $ | 28,920 | |||||||
| Depreciation & Amortization | ||||||||||||
| Plain | $ | 9,145 | $ | 7,012 | $ | 6,742 | ||||||
| Roller | 4,008 | 2,933 | 3,392 | |||||||||
| Ball | 1,790 | 1,706 | 1,799 | |||||||||
| Engineered Products | 9,411 | 1,974 | 1,856 | |||||||||
| Corporate | 1,453 | 1,420 | 1,198 | |||||||||
| $ | 25,807 | $ | 15,045 | $ | 14,987 | |||||||
| Geographic External Sales | ||||||||||||
| Domestic | $ | 522,405 | $ | 374,820 | $ | 351,418 | ||||||
| Foreign | 75,067 | 70,458 | 67,468 | |||||||||
| $ | 597,472 | $ | 445,278 | $ | 418,886 | |||||||
| 69 |
| Fiscal Year Ended | ||||||||||||
April 2, 2016 | March 28, 2015 | March 29, 2014 | ||||||||||
| Geographic Long-Lived Assets | ||||||||||||
| Domestic | $ | 145,538 | $ | 112,519 | $ | 105,018 | ||||||
| Foreign | 39,206 | 29,130 | 32,136 | |||||||||
| $ | 184,744 | $ | 141,649 | $ | 137,154 | |||||||
| Intersegment Sales | ||||||||||||
| Plain | $ | 3,973 | $ | 3,790 | $ | 3,807 | ||||||
| Roller | 18,874 | 19,618 | 17,794 | |||||||||
| Ball | 2,475 | 2,244 | 1,976 | |||||||||
| Engineered Products | 30,341 | 29,567 | 26,574 | |||||||||
| $ | 55,663 | $ | 55,219 | $ | 50,151 | |||||||
All intersegment sales are eliminated in consolidation.
ITEM 9. CHANGES IN AND DISAGREEMENTS WITH ACCOUNTANTS ON ACCOUNTING AND FINANCIAL DISCLOSURE
None.
ITEM 9A. CONTROLS AND PROCEDURES
The Company’s management is responsible for establishing and maintaining effective disclosure controls and procedures, as defined under Rule 13a-15(e) of the Securities Exchange Act of 1934. As of the end of the period covered by this report, the Company performed an evaluation, under the supervision and with the participation of the Company’s management, including its Chief Executive Officer and Chief Financial Officer, of the effectiveness of the Company’s disclosure controls and procedures. Based upon that evaluation, the Company’s Chief Executive Officer and Chief Financial Officer concluded that the Company’s disclosure controls and procedures provide reasonable assurance that the material information required to be disclosed by the Company in the reports that it files or submits to the Securities and Exchange Commission under the Securities Exchange Act of 1934 is recorded, processed, summarized and reported within the time periods specified in the Commission’s rules and forms. No changes were made to the Company’s internal control over financial reporting (as defined in Rule 13a-15(f) under the Securities Exchange Act of 1934) during the last fiscal quarter that materially affected, or are reasonably likely to materially affect, the Company’s internal control over financial reporting. The Company’s management believes that its disclosure controls and procedures were effective as of April 2, 2016.
| 70 |
Management’s Report on Internal Control Over Financial Reporting
Management of RBC Bearings Incorporated is responsible for establishing and maintaining adequate internal control over financial reporting, as such term is defined in Securities Exchange Act of 1934.
The Company’s internal control over financial reporting is supported by written policies and procedures that (i) pertain to the maintenance of records that, in reasonable detail, accurately and fairly reflect the transactions and dispositions of the Company’s assets; (ii) provide reasonable assurance that transactions are recorded as necessary to permit preparation of financial statements in accordance with generally accepted accounting principles, and that receipts and expenditures of the Company are being made only in accordance with authorizations of the Company’s management and directors; and (iii) provide reasonable assurance regarding prevention or timely detection of unauthorized acquisition, use or disposition of the Company’s assets that could have a material effect on the financial statements.
Because of its inherent limitations, internal control over financial reporting may not prevent or detect misstatements. Projections of any evaluation of effectiveness to future periods are subject to the risk that controls may become inadequate because of changes in conditions, or that the degree of compliance with the policies or procedures may deteriorate.
Under the supervision and with the participation of our management, including our principal executive officer and principal financial officer, we conducted an evaluation of the effectiveness of the Company’s internal control over financial reporting as of April 2, 2016 as required by Securities Exchange Act of 1934. In making this assessment, we used the criteria set forth in the framework in Internal Control-Integrated Framework (2013 Framework) issued by the Committee of Sponsoring Organizations of the Treadway Commission. Based on our evaluation under the framework in Internal Control-Integrated Framework, our management concluded that our internal control over financial reporting was effective as of April 2, 2016.
Our assessment of and conclusion on the effectiveness of internal control over financial reporting did not include the internal controls of Sargent Aerospace and Defense LLC, Sonic Industries, Inc., Avborne Accessory Group, Inc. and Sargent Aerospace Canada, Inc., which are included in the April 2, 2016 consolidated financial statements of RBC Bearings Incorporated and constituted $550.7 million and $513.3 million of total and net assets, respectively, as of April 2, 2016, and $172.6 million and $14.1 million of revenues and net income, respectively, for the year then ended.
The effectiveness of our internal control over financial reporting as of April 2, 2016 has been audited by Ernst & Young LLP, an independent registered public accounting firm, as stated in their report which appears on the following page.
RBC Bearings Incorporated
Oxford, Connecticut
May 26, 2016
| 71 |
Report of Independent Registered Public Accounting Firm
The Board of Directors and Stockholders of RBC Bearings Incorporated
We have audited RBC Bearings Incorporated’s internal control over financial reporting as of April 2, 2016, based on criteria established in Internal Control—Integrated Framework issued by the Committee of Sponsoring Organizations of the Treadway Commission (2013 framework) (the COSO criteria). RBC Bearings Incorporated’s management is responsible for maintaining effective internal control over financial reporting, and for its assessment of the effectiveness of internal control over financial reporting included in the accompanying Management’s Report on Internal Control over Financial Reporting. Our responsibility is to express an opinion on the company’s internal control over financial reporting based on our audit.
We conducted our audit in accordance with the standards of the Public Company Accounting Oversight Board (United States). Those standards require that we plan and perform the audit to obtain reasonable assurance about whether effective internal control over financial reporting was maintained in all material respects. Our audit included obtaining an understanding of internal control over financial reporting, assessing the risk that a material weakness exists, testing and evaluating the design and operating effectiveness of internal control based on the assessed risk, and performing such other procedures as we considered necessary in the circumstances. We believe that our audit provides a reasonable basis for our opinion.
A company’s internal control over financial reporting is a process designed to provide reasonable assurance regarding the reliability of financial reporting and the preparation of financial statements for external purposes in accordance with generally accepted accounting principles. A company’s internal control over financial reporting includes those policies and procedures that (1) pertain to the maintenance of records that, in reasonable detail, accurately and fairly reflect the transactions and dispositions of the assets of the company; (2) provide reasonable assurance that transactions are recorded as necessary to permit preparation of financial statements in accordance with generally accepted accounting principles, and that receipts and expenditures of the company are being made only in accordance with authorizations of management and directors of the company; and (3) provide reasonable assurance regarding prevention or timely detection of unauthorized acquisition, use, or disposition of the company’s assets that could have a material effect on the financial statements.
Because of its inherent limitations, internal control over financial reporting may not prevent or detect misstatements. Also, projections of any evaluation of effectiveness to future periods are subject to the risk that controls may become inadequate because of changes in conditions, or that the degree of compliance with the policies or procedures may deteriorate.
As indicated in the accompanying Management Report on Internal Control over Financial Reporting, management’s assessment of and conclusion on the effectiveness of internal control over financial reporting did not include the internal controls of Sargent Aerospace and Defense LLC, Sonic Industries, Inc., Avborne Accessory Group, Inc. and Sargent Aerospace Canada, Inc., which are included in the April 2, 2016 consolidated financial statements of RBC Bearings Incorporated and constituted $550.7 million and $513.3 million of total and net assets, respectively, as of April 2, 2016, and $172.6 million and $14.1 million of revenues and net income, respectively, for the year then ended. Our audit of internal control over financial reporting of RBC Bearings Incorporated also did not include an evaluation of the internal control over financial reporting of Sargent Aerospace and Defense LLC, Sonic Industries, Inc., Avborne Accessory Group, Inc. and Sargent Aerospace Canada, Inc.
In our opinion, RBC Bearings Incorporated maintained, in all material respects, effective internal control over financial reporting as of April 2, 2016, based on the COSO criteria.
We also have audited, in accordance with the standards of the Public Company Accounting Oversight Board (United States), the consolidated balance sheets of RBC Bearings Incorporated as of April 2, 2016 and March 28, 2015 and the related consolidated statements of operations, comprehensive income, stockholders’ equity and cash flows, for each of the three years in the period ended April 2, 2016, and our report dated May 26, 2016 expressed an unqualified opinion thereon.
.
| /s/Ernst & Young LLP | ||
| Stamford, Connecticut | ||
| May 26, 2016 |
| 72 |
None.
The information called for by Part III (Items 10, 11, 12, 13 and 14) of Form 10-K will be included in the Company’s Proxy Statement for its 2016 Annual Meeting of Shareholders, which the Company intends to file within 120 days after the close of its fiscal year ended April 2, 2016 and which is incorporated herein by reference to such Proxy Statement.
ITEM 15. EXHIBITS AND FINANCIAL STATEMENT SCHEDULES
| (a) (1) | Financial Statements |
The following Consolidated Financial Statements and Supplementary Data of the Company are included in Item 8, “Financial Statements and Supplementary Data”:
Report of Independent Registered Public Accounting Firm
Consolidated Balance Sheets at April 2, 2016 and March 28, 2015
Consolidated Statements of Operations for the years ended April 2, 2016, March 28, 2015, and March 29, 2014
Consolidated Statements of Comprehensive Income for the years ended April 2, 2016, March 28, 2015, and March 29, 2014
Consolidated Statements of Stockholders’ Equity for the years ended April 2, 2016, March 28, 2015, and March 29, 2014
Consolidated Statements of Cash Flows for the years ended April 2, 2016, March 28, 2015, and March 29, 2014
Notes to Consolidated Financial Statements
| (a) (2) | Financial Statement Schedules |
See Financial Statement Schedules under Item 15(c)
| (a) (3) | See Item 15(b) below. |
(b) The Exhibits required by Item 601 of regulation S-K are filed as Exhibits to this Report and indexed below immediately following Item 15(c), which index is incorporated herein by reference
(c) All Financial Statement Schedules are included in the Financial Statements and Supplementary Data under Item 15(a)(1) and incorporated herein by reference.
Exhibit Index
The following exhibits are filed as part of this Report.
Certain of the following exhibits have been previously filed with the Securities and Exchange Commission by the Company pursuant to the requirements of the Securities Act of 1933 and the Securities Exchange Act of 1934. Such exhibits are identified by the parenthetical references following the listing of each such exhibit and are incorporated herein by reference. The Company’s Commission file number is 333-124824.
| 73 |
| Exhibit Number |
Description of Document | |
| 3.1 | Amended and Restated Certificate of Incorporation of RBC Bearings Incorporated dated August 13, 2005 as filed with Amendment No. 4 to RBC Bearings Incorporated's Registration Statement on Form S-1, file No. 333-124824 (the "Registration Statement") dated August 8, 2005 is hereby incorporated by reference herein. | |
| 3.2 | Bylaws of RBC Bearings Incorporated, as filed as Exhibit 3.3 to Amendment No. 4 to the Registration Statement on Form S-1 dated August 8, 2005 is hereby incorporated by reference herein. | |
| 4.1 | Form of stock certificate for common stock, as filed as Exhibit 4.3 to RBC Bearings Incorporated's Amendment No. 3 to Registration Statement on Form S-1 dated August 4, 2005 is hereby incorporated by reference herein. | |
| 4.2 | Form of Amended and Restated Warrants to Purchase Common Stock, as filed as Exhibit 4.7 to RBC Bearing Incorporated’s Registration Statement on Form S-8 dated March 15, 2006, is hereby incorporated by reference herein. | |
| 4.3 | Amended and Restated Warrants to Purchase Class B Supervoting Common Stock, as filed as Exhibit 4.8 to RBC Bearing Incorporated’s Registration Statement on Form S-8 dated March 15, 2006, is hereby incorporated by reference herein. | |
| 10.1 | Amended and Restated 2001 Stock Option Plan of RBC Bearings Incorporated (f/k/a Roller Bearing Holding Company, Inc.), dated October 24, 2003 filed as Exhibit 10.2 to the Registration Statement on Form S-1 dated May 11, 2005 is hereby incorporated by reference herein. | |
| 10.2 | Form of RBC Bearings Incorporated 2005 Long-Term Equity Incentive Plan, as filed as Exhibit 4.6 to RBC Bearing Incorporated’s Registration Statement on Form S-8 dated November 18, 2005, is hereby incorporated by reference herein. | |
| 10.3 | RBC Bearings Incorporated 2005 Long Term Incentive Plan (Amended and Restated as of August 29, 2007) filed as Exhibit 10.1 on Form 8-K dated August 30, 2007 is hereby incorporated by reference herein. | |
| 10.4 | Form of Change in Control Letter Agreement for Named Executive Officers, filed as Exhibit 10.1 to Form 10-Q dated February 1, 2010 is hereby incorporated by reference herein. | |
| 10.5 | Credit Agreement, dated as of November 30, 2010, among Roller Bearing Company of America, Inc., RBC Bearings Incorporated, the Lenders named therein, J.P. Morgan Chase Bank, N.A. and KeyBank National Association, filed as Exhibit 10.1 to Form 8-K dated December 1, 2010 is hereby incorporated by reference herein. | |
| 10.6 | Guaranty Agreement, dated as of November 30, 2010, by and between RBC Bearings Incorporated and J.P. Morgan Chase Bank, N.A., as Administrative Agent, filed as Exhibit 10.2 to Form 8-K dated December 1, 2010 is hereby incorporated by reference herein. | |
| 10.7 | Security Agreement, dated as of November 30, 2010, among Roller Bearing Company of America, Inc., RBC Bearings Incorporated, the Subsidiary Guarantors (as defined therein), and J.P. Morgan Chase, N.A., filed as Exhibit 10.2 to Form 8-K dated December 1, 2010 is hereby incorporated by reference herein. | |
| 10.8 | Form of RBC Bearings Incorporated 2005 Long Term Incentive Plan (Amended and Restated as of August 25, 2010) filed as Exhibit 10.1 to Form 8-K dated August 25, 2010 is hereby incorporated by reference herein. | |
| 10.9 | Form of RBC Bearings Incorporated 2005 Long Term Incentive Plan (Amended and Restated as of September 8, 2010) filed as Exhibit 10.1 to Form 8-K dated September 10, 2010 is hereby incorporated by reference herein. | |
| 10.10 | RBC Bearings Incorporated Executive Officer Performance Based Compensation Plan filed as Exhibit 10.1 to Form 8-K dated September 13, 2011 is hereby incorporated by reference herein. | |
| 10.11 | Collective Bargaining Agreement effective February 1, 2013 between Heim Bearing division of Roller Bearing Company of America, Inc. and The International Union, United Automobile, Aerospace and Agricultural Implement Workers of America, U. A. W., and Amalgamated Local 376, UAW filed as Exhibit 10.1 to Form 8-K dated December 10, 2012 is hereby incorporated by reference herein. | |
| 10.12 | Amended and Restated Employment Agreement, effective April 1, 2013, between RBC Bearings Incorporated and Michael J. Hartnett, Ph.D. filed as Exhibit 10.1 to Form 8 K dated July 2, 2013 is hereby incorporated by reference herein. | |
| 10.13 | RBC Bearings Incorporated 2013 Long Term Incentive Plan (Amended and Restated as of August 21, 2013), filed as Exhibit 10.1 on Form 8-K dated August 21, 2013 is hereby incorporated by reference herein. |
| 74 |
| 10.14 | May 16, 2014 amendment to Credit Agreement, dated as of November 30, 2010 by and between the Company, RBCA, certain Lenders signatory thereto, J.P. Morgan Chase Bank, N.A., as Administrative Agent, and J.P. Morgan Chase Bank, N.A. and KeyBank National Association as Co-Lead Arrangers and Joint Lead Book Runners filed as Exhibit 10.1 on Form 8-K dated May 16, 2014 is hereby incorporated by reference herein. | |
| 10.15 | Equity Purchase Agreement, dated March 26, 2015, by and between Roller Bearing Company of America, Inc. as Buyer, RBC Bearings Incorporated as Guarantor and Dover Corporation (Canada) Limited and Dover Engineered Systems, Inc. as Sellers filed as Exhibit 2.1 to Form 8-K dated March 26, 2015 is hereby incorporated by reference herein. | |
| 10.16 | Credit Agreement, dated April 24, 2015, among Roller Bearing Company of America, Inc. as Borrower, RBC Bearings Incorporated and various Lenders signatory thereto as filed as Exhibit 10.1 to Form 8-K dated April 24, 2015 and is hereby incorporated by reference herein. | |
| 10.17 | Guarantee, dated April 24, 2015, by and between RBC Bearings Incorporated, the subsidiary guarantors party thereto and Wells Fargo Bank, National Association, as Administrative Agent as filed as Exhibit 10.2 to Form 8-K dated April 24, 2015 and is hereby incorporated by reference herein. | |
| 10.18 | Security Agreement, dated April 24, 2015 by and between Roller Bearing Company of America, Incorporated, RBC Bearing Incorporated, the subsidiary grantors party thereto and Wells Fargo Bank, National Association, as Collateral Agent for the benefit of the Secured Creditors as filed as Exhibit 10.4 to Form 8-K dated April 24, 2015 and is hereby incorporated by reference herein. | |
| 10.19 | Pledge Agreement, dated April 24, 2015, by and between Roller Bearing Company of America, Incorporated, RBC Bearings Incorporated, the subsidiary pledgors party thereto and Wells Fargo Bank, National Association, as Collateral Agent for the benefit of the Secured Creditors as filed as Exhibit 10.4 to Form 8-K dated April 24, 2015 and is hereby incorporated by reference herein. | |
| 21 | Subsidiaries of the Registrant. Filed herewith. | |
| 23 | Consent of Ernst & Young LLP. Filed herewith. | |
| 31.1 | Certification of Chief Executive Officer Pursuant to Section 302 of the Sarbanes-Oxley Act of 2002. Filed herewith. | |
| 31.2 | Certification of Chief Financial Officer Pursuant to Section 302 of the Sarbanes-Oxley Act of 2002. Filed herewith. | |
| 32.1 | Certification of Chief Executive Officer Pursuant to 18 U.S.C. Section 1350, as Adopted Pursuant to Section 906 of the Sarbanes-Oxley Act of 2002.* Filed herewith. | |
| 32.2 | Certification of Chief Financial Officer Pursuant to 18 U.S.C. Section 1350, as Adopted Pursuant to Section 906 of the Sarbanes-Oxley Act of 2002.* Filed herewith. |
| 101.INS | XBRL Instance Document. | |
| 101.SCH | XBRL Taxonomy Extension Schema Document. | |
| 101.CAL | XBRL Taxonomy Extension Calculation Linkbase Document. | |
| 101.DEF | XBRL Taxonomy Extension Definition Linkbase Document. | |
| 101.LAB | XBRL Taxonomy Extension Label Linkbase Document. | |
| 101.PRE | XBRL Taxonomy Extension Presentation Linkbase Document. |
* This certification accompanies this Annual Report on Form 10-K, is not deemed filed with the SEC and is not to be incorporated by reference into any filing of the Company under the Securities Act of 1933, as amended, or the Securities Exchange Act of 1934, as amended (whether made before or after the date of this Annual Report on Form 10-K), irrespective of any general incorporation language contained in such filing.
| 75 |
Pursuant to the requirements of Section 13 or 15(d) of the Securities Exchange Act of 1934, the Registrant has duly caused this Report to be signed on its behalf by the undersigned, thereunto duly authorized.
| RBC Bearings Incorporated | |||
| (Registrant) | |||
| By: | /s/ Michael J. Hartnett | ||
| Name: | Michael J. Hartnett | ||
| Title: | Chief Executive Officer | ||
| Date: | Date: May 26, 2016 | ||
Pursuant to the requirements of the Securities Exchange Act of 1934, this Report has been signed by the following persons on behalf of the Registrant and in the capacities and on the dates indicated.
| Signature | Title | |
/s/ Michael J. Hartnett Michael J. Hartnett |
Chairman, President and Chief Executive Officer (Principal Executive Officer and Chairman) | |
| Date: May 26, 2016 | ||
/s/ Daniel A. Bergeron Daniel A. Bergeron |
Chief Financial Officer (Principal Financial and Accounting Officer) | |
| Date: May 26, 2016 | ||
/s/ Thomas M. Burigo Thomas M. Burigo |
Corporate Controller | |
| Date: May 26, 2016 | ||
/s/ Richard R. Crowell Richard R. Crowell |
Director | |
| Date: May 26, 2016 | ||
/s/ Alan B. Levine Alan B. Levine |
Director | |
| Date: May 26, 2016 | ||
/s/ Dr. Amir Faghri Dr. Amir Faghri |
Director | |
| Date: May 26, 2016 | ||
/s/ Dr. Thomas J. O’Brien Dr. Thomas J. O'Brien |
Director | |
| Date: May 26, 2016 | ||
/s/ MITCHELL I. Quain Mitchell I. Quain |
Director | |
| Date: May 26, 2016 | ||
/s/ EDWARD D. STEWART Edward D. Stewart |
Director | |
| Date: May 26, 2016 |
| 76 |