Attached files
| file | filename |
|---|---|
| 8-K/A - 8-K/A - Manitex International, Inc. | d895348d8ka.htm |
| EX-99.1 - EX-99.1 - Manitex International, Inc. | d895348dex991.htm |
| EX-23.1 - EX-23.1 - Manitex International, Inc. | d895348dex231.htm |
| EX-99.3 - EX-99.3 - Manitex International, Inc. | d895348dex993.htm |
Exhibit 99.2
UNAUDITED CONDENSED GROUP CONSOLIDATED FINANCIAL
STATEMENTS AS OF AND FOR THE NINE-MONTH ENDED
SEPTEMBER 30, 2014 AND 2013
PM GROUP
3
Condensed Consolidated Statement of Financial Position (unaudited)
| (in Euro) |
30/09/2014 | 31/12/2013 | ||||||||||
| NON-CURRENT ASSETS |
||||||||||||
| Tangible assets |
(1 | ) | 18,614,976 | 19,256,205 | ||||||||
| Goodwill |
(2 | ) | 33,192,959 | 33,192,959 | ||||||||
| Other intangible assets |
(3 | ) | 3,825,746 | 3,715,926 | ||||||||
| Investments in other entities |
1,560 | 1,560 | ||||||||||
| Deferred tax assets |
(4 | ) | 5,988,051 | 5,703,493 | ||||||||
| Other non-current assets |
140,870 | 161,832 | ||||||||||
|
|
|
|
|
|||||||||
| Total non-current assets |
61,764,162 | 62,031,975 | ||||||||||
|
|
|
|
|
|||||||||
| CURRENT ASSETS |
||||||||||||
| Inventory |
(5 | ) | 19,809,268 | 13,851,167 | ||||||||
| Trade receivables |
(6 | ) | 20,277,192 | 28,521,700 | ||||||||
| Current tax receivables |
3,059,867 | 2,066,842 | ||||||||||
| Dividends receivable |
300,000 | 300,000 | ||||||||||
| Cash and cash equivalents |
(7 | ) | 1,683,500 | 2,220,199 | ||||||||
| Other current assets |
1,720,205 | 1,570,414 | ||||||||||
|
|
|
|
|
|||||||||
| Total current assets |
46,850,032 | 48,530,322 | ||||||||||
|
|
|
|
|
|||||||||
| Assets held for sale |
(26 | ) | 46,798,757 | 44,640,884 | ||||||||
|
|
|
|
|
|||||||||
| TOTAL ASSETS |
155,412,950 | 155,203,181 | ||||||||||
|
|
|
|
|
|||||||||
| LIABILITIES AND SHAREHOLDERS’ EQUITY |
||||||||||||
| Share capital |
23,311,420 | 23,311,420 | ||||||||||
| Reserves |
-15,467 | -34,324 | ||||||||||
| Accumulated deficit |
-50,760,044 | -49,299,634 | ||||||||||
|
|
|
|
|
|||||||||
| Shareholders’ equity—Group |
-27,464,091 | -26,022,538 | ||||||||||
|
|
|
|
|
|||||||||
| Capital and reserves of non-controlling interests |
935,717 | 905,756 | ||||||||||
| Net profit (loss) attributable to non-controlling interests |
-131,310 | 29,961 | ||||||||||
| Shareholders’ equity attributable to non-controlling interests |
804,407 | 935,717 | ||||||||||
|
|
|
|
|
|||||||||
| TOTAL SHAREHOLDERS’ EQUITY |
-26,659,684 | -25,086,821 | ||||||||||
|
|
|
|
|
|||||||||
| NON-CURRENT LIABILITIES |
||||||||||||
| Non-current financial payables |
(8 | ) | 717,700 | 1,137,551 | ||||||||
| Employee benefits |
(9 | ) | 1,352,744 | 1,413,558 | ||||||||
| Provisions for risks and charges |
(10 | ) | 1,427,880 | 1,437,325 | ||||||||
| Deferred tax liabilities |
(11 | ) | 3,197,327 | 3,038,312 | ||||||||
|
|
|
|
|
|||||||||
| Total non-current liabilities |
6,695,651 | 7,026,746 | ||||||||||
|
|
|
|
|
|||||||||
| CURRENT LIABILITIES |
||||||||||||
| Current financial payables |
(12 | ) | 99,853,416 | 100,162,961 | ||||||||
| Liabilities for financial instruments and derivatives |
(13 | ) | 1,728,343 | 2,141,069 | ||||||||
| Current tax payables |
1,859,592 | 1,624,037 | ||||||||||
| Current trade payables |
(14 | ) | 23,046,403 | 22,131,036 | ||||||||
| Other current liabilities |
3,665,980 | 4,498,986 | ||||||||||
|
|
|
|
|
|||||||||
| Total current liabilities |
130,153,734 | 130,558,089 | ||||||||||
|
|
|
|
|
|||||||||
| Liabilities held for sale |
(26 | ) | 45,223,248 | 42,705,167 | ||||||||
|
|
|
|
|
|||||||||
| TOTAL LIABILITIES AND SHAREHOLDERS’ EQUITY |
155,412,950 | 155,203,181 | ||||||||||
|
|
|
|
|
|||||||||
PM GROUP
4
Condensed Consolidated Statement of income for the nine-month period ended September 30, 2014 and 2013 (unaudited)
| (in Euro) |
9 M 2014 | 9 M 2013 | ||||||||||
| Revenue from operating activities |
(15 | ) | 53,541,589 | 50,775,349 | ||||||||
| Other revenue and income |
(16 | ) | 1,470,589 | 1,243,245 | ||||||||
| Change in inventories or finished goods and work in progress |
2,249,274 | -590,896 | ||||||||||
| Increase in non-current assets due to capitalisation of internal costs |
(17 | ) | 886,388 | 1,557,402 | ||||||||
| Costs of raw material |
(18 | ) | -30,206,923 | -25,718,000 | ||||||||
| Services |
(19 | ) | -9,649,637 | -10,176,099 | ||||||||
| Personnel |
(20 | ) | -12,402,311 | -13,384,012 | ||||||||
| Other operating expenses |
(21 | ) | -1,452,021 | -1,968,510 | ||||||||
| Depreciation and amortisation |
(22 | ) | -1,943,126 | -2,526,532 | ||||||||
| Impairment of tangible assets |
(22 | ) | 0 | -158,024 | ||||||||
| Provisions |
(23 | ) | -45,374 | -49,452 | ||||||||
|
|
|
|
|
|||||||||
| Operating profit /(loss) |
2,448,447 | -995,531 | ||||||||||
|
|
|
|
|
|||||||||
| Financial income and exchange gains |
(24 | ) | 1,466,332 | 1,429,092 | ||||||||
| Financial expenses and exchange losses |
(24 | ) | -4,376,074 | -4,816,147 | ||||||||
|
|
|
|
|
|||||||||
| Loss before taxation |
-461,295 | -4,382,586 | ||||||||||
|
|
|
|
|
|||||||||
| Taxes on income |
(25 | ) | -770,222 | 468,422 | ||||||||
|
|
|
|
|
|||||||||
| Net Loss from continuing operations |
-1,231,516 | -3,914,164 | ||||||||||
|
|
|
|
|
|||||||||
| Profit (Loss) from discontinued operations |
(26 | ) | -360,204 | 364,152 | ||||||||
|
|
|
|
|
|||||||||
| Net Loss for the period |
-1,591,720 | -3,550,012 | ||||||||||
|
|
|
|
|
|||||||||
| Profit (Loss) attributable to non-controlling interests |
-131,310 | 43,978 | ||||||||||
|
|
|
|
|
|||||||||
| Net Loss attributable to the Group |
-1,460,410 | -3,593,990 | ||||||||||
|
|
|
|
|
|||||||||
PM GROUP
5
Condensed Consolidated statement of comprehensive income for the nine-month period ended September 30, 2014 and 2013 (unaudited)
| (in Euro) |
30/09/2014 | 30/09/2013 | ||||||
| Net Loss for the period (A) |
(1,591,720 | ) | (3,550,012 | ) | ||||
|
|
|
|
|
|||||
| Gains/(losses) from translation into Euro of financial statements of foreign entities |
18,857 | (4,286 | ) | |||||
|
|
|
|
|
|||||
| Total other items of comprehensive income that will be recycled through the income statement, net of tax effect (b1) |
18,857 | (4,286 | ) | |||||
|
|
|
|
|
|||||
| Actuarial gains/(losses) from defined benefit plans |
0 | 0 | ||||||
|
|
|
|
|
|||||
| Total other items of comprehensive income that will not subsequently be recycled through the income statement, net of tax effect (b2) |
0 | 0 | ||||||
|
|
|
|
|
|||||
| Total other items of comprehensive income, net of tax effect (b1) + (b2) = (B) |
18,857 | (4,286 | ) | |||||
|
|
|
|
|
|||||
| Total comprehensive (loss) for the period (A)+(B) |
(1,572,863 | ) | (3,554,298 | ) | ||||
|
|
|
|
|
|||||
| Total comprehensive income (loss) attributable to non-controlling interests |
(131,310 | ) | 43,978 | |||||
|
|
|
|
|
|||||
| TOTAL COMPREHENSIVE (LOSS) ATTRIBUTABLE TO THE GROUP |
(1,441,553 | ) | (3,598,276 | ) | ||||
|
|
|
|
|
|||||
PM GROUP
6
Condensed Consolidated Statement of changes in equity (unaudited)
| (in Euro) |
Share capital |
Translation reserve |
Reserve under IAS 19 |
Total reserves |
Accumulated Deficit |
Shareholders’ equity - Group |
Capital and reserves of non-controlling interests |
Accumulated Profit/(Loss) attributable to non-controlling interests |
Shareholders’ equity of non-controlling interests |
TOTAL SHAREHOLDERS’ EQUITY |
||||||||||||||||||||||||||||||
| Shareholders’ equity at 01/01/2013 |
23,311,420 | (185,689 | ) | 0 | (185,689 | ) | (12,360,008 | ) | 10,765,723 | 983,204 | (56,954 | ) | 926,250 | 11,691,973 | ||||||||||||||||||||||||||
| Movement on translation reserve |
0 | (4,286 | ) | 0 | (4,286 | ) | 0 | (4,286 | ) | 1,891 | 0 | 1,891 | (2,395 | ) | ||||||||||||||||||||||||||
| Effect of Acquisition of 41% of Air Service |
0 | 0 | 0 | 0 | 0 | 0 | (13,494 | ) | 0 | (13,494 | ) | (13,494 | ) | |||||||||||||||||||||||||||
| Loss for period ended September 30, 2013 |
0 | 0 | 0 | 0 | (3,593,990 | ) | (3,593,990 | ) | 0 | 43,978 | 43,978 | (3,550,012 | ) | |||||||||||||||||||||||||||
|
|
|
|
|
|
|
|
|
|
|
|
|
|
|
|
|
|
|
|
|
|||||||||||||||||||||
| Shareholders’ equity at 30/09/2013 |
23,311,420 | (189,975 | ) | 0 | (189,975 | ) | (15,953,998 | ) | 7,167,447 | 971,601 | (12,976 | ) | 958,625 | 8,126,072 | ||||||||||||||||||||||||||
|
|
|
|
|
|
|
|
|
|
|
|
|
|
|
|
|
|
|
|
|
|||||||||||||||||||||
| Shareholders’ equity at 01/01/2014 |
23,311,420 | (16,889 | ) | (17,435 | ) | (34,324 | ) | (49,299,634 | ) | (26,022,538 | ) | 962,710 | (26,993 | ) | 935,717 | (25,086,821 | ) | |||||||||||||||||||||||
|
|
|
|
|
|
|
|
|
|
|
|
|
|
|
|
|
|
|
|
|
|||||||||||||||||||||
| Movement on translation reserve |
0 | 18,857 | 0 | 18,857 | 0 | 18,857 | 0 | 0 | 0 | 18,857 | ||||||||||||||||||||||||||||||
| Loss for period ended September 30, 2014 |
0 | 0 | 0 | 0 | (1,460,410 | ) | (1,460,410 | ) | 0 | (131,310 | ) | (131,310 | ) | (1,591,720 | ) | |||||||||||||||||||||||||
|
|
|
|
|
|
|
|
|
|
|
|
|
|
|
|
|
|
|
|
|
|||||||||||||||||||||
| Shareholders’ equity at 30/09/2014 |
23,311,420 | 1,968 | (17,435 | ) | (15,467 | ) | (50,760,044 | ) | (27,464,091 | ) | 962,710 | (158,303 | ) | 804,407 | (26,659,684 | ) | ||||||||||||||||||||||||
|
|
|
|
|
|
|
|
|
|
|
|
|
|
|
|
|
|
|
|
|
|||||||||||||||||||||
PM GROUP
7
Condensed Consolidated Statement of cash flows for the nine-month period ended September 30, 2014 and 2013 (unaudited)
| (in Euro) |
9 M 2014 | 9 M 2013 | ||||||
| Cash flows generated by operating activities |
| |||||||
| Net Loss for period |
(1,591,720 | ) | (3,550,012 | ) | ||||
| Adjustments made in order to reconciile net loss with the cash flows generated by operating activities |
||||||||
| - Depreciation and amortization |
2,801,958 | 3,425,856 | ||||||
| - Impairment |
0 | 158,024 | ||||||
| - Deferred tax/Deferred tax income |
(261,454 | ) | (659,167 | ) | ||||
| - Expenses on derivatives |
(471,609 | ) | (968,618 | ) | ||||
| - Financial income recognized in Statement of Income |
(235,625 | ) | (399,484 | ) | ||||
| - Finance costs recognised in Statement of Income |
4,376,442 | 5,529,618 | ||||||
| - Change in Employee Severance Indemnity Provision and other employee benefits |
(55,083 | ) | (85,068 | ) | ||||
| Operating profit before changes in working capital |
4,562,909 | 3,451,149 | ||||||
| Effect of changes in assets and liabilities in net working capital |
||||||||
| - Trade receivables |
5,946,029 | (4,544,166 | ) | |||||
| - Inventory |
(6,230,700 | ) | (3,435,372 | ) | ||||
| - Other current assets |
(146,726 | ) | 269,889 | |||||
| - Trade payables |
1,805,405 | 7,932,634 | ||||||
| - Other current liabilities |
(59,976 | ) | 638,771 | |||||
| - Tax receivables |
(374,417 | ) | (965,155 | ) | ||||
| - Tax payables |
321,645 | 527,432 | ||||||
| - Taxes paid during the period |
(420,171 | ) | (230,892 | ) | ||||
| - Other non current assets |
5,673 | 10,851 | ||||||
| - Provisions for risks and charges |
418,624 | (19,168 | ) | |||||
|
|
|
|
|
|||||
| Cash generated by operating activities (A) |
5,828,295 | 3,635,973 | ||||||
|
|
|
|
|
|||||
| Cash flows generated (absorbed) by investing activities |
||||||||
| - Payments for property, plant and equipment |
(622,801 | ) | (749,127 | ) | ||||
| - Proceeds from disposal of property, plant and equipment |
57,501 | 393,948 | ||||||
| - Payments for intangible assets |
(1,379,740 | ) | (1,869,195 | ) | ||||
| - Interest received |
6,657 | 3,054 | ||||||
|
|
|
|
|
|||||
| Change in cash absorbed by investing activities (B) |
(1,938,383 | ) | (2,221,320 | ) | ||||
|
|
|
|
|
|||||
| Cash flows generated by operating activities after cash flows absorbed by investing activities (A-B) |
3,889,912 | 1,414,653 | ||||||
|
|
|
|
|
|||||
| Cash flows (absorbed) generated by financing activities |
||||||||
| Short term financial payables and derivatives arranged (repaid) |
(2,202,430 | ) | 3,003,998 | |||||
| Medium/long term financial payables and derivatives arranged (repaid) |
(936,884 | ) | (438,481 | ) | ||||
| Interest paid |
(1,281,699 | ) | (3,842,894 | ) | ||||
| Share capital increase and reserves paid in cash |
0 | (13,494 | ) | |||||
|
|
|
|
|
|||||
| Change in cash absorbed by financing activities |
(4,421,013 | ) | (1,290,871 | ) | ||||
|
|
|
|
|
|||||
| Movement on translation reserve |
18,857 | (2,395 | ) | |||||
| Increase (decrease) in cash and cash equivalents |
(512,244 | ) | 121,387 | |||||
|
|
|
|
|
|||||
| Cash and cash equivalents at start of period |
2,220,199 | 2,217,357 | ||||||
|
|
|
|
|
|||||
| Cash and cash equivalents classified as assets held for sale at beginning of the period |
69,668 | |||||||
| Cash and cash equivalents classified as assets held for sale at end of the period |
94,123 | |||||||
|
|
|
|
|
|||||
| Cash and cash equivalents at end of period |
1,683,500 | 2,338,744 | ||||||
|
|
|
|
|
|||||
PM GROUP
8
EXPLANATORY NOTES
General information
PM Group S.p.A. (the “Parent Company” or “Company” or “PM”) is a company which is subject to the laws of the Italian Republic. PM Group S.p.A. and its subsidiaries (“PM Group” or “Group”) operate primarily in Italy, France, Spain, Chile, Romania, Argentina and the United States of America. The Group manufactures: (i) truck mounted hydraulic knuckle boom cranes (“Business Unit PM”), (ii) truck mounted aerial platforms (“Business Unit Oil & Steel”) and (iii) structure, like scaffolding, formworks for walls and slabs (“Business Unit Pilosio”).
Structure and content of the condensed consolidated financial statements
The unaudited interim group condensed consolidated financial statements to which these explanatory notes relate (hereinafter: the “Interim Group Condensed Consolidated Financial Statements”) include: (i) the statements of income, comprehensive income, changes in equity and cash flows for the period ended September 30, 2014 and 2013 and (ii) the statements of financial position as of September 30, 2014 and December 31, 2013. The Interim Group Condensed Consolidated Financial Statements have been prepared in accordance with International Accounting Standard (“IAS”) 34 “Interim Financial Reporting”, as issued by the International Accounting Standard Board (“IASB”). The financial statements were authorized and approved on February 13, 2014 by Board of Directors. This basis of preparation was considered best to represent the balance sheet, income statement and financial situation of the Company and the Group:
| • | Statement of financial position prepared with current assets/liabilities classified separately from non-current assets/liabilities; |
| • | Statement of income costs classified based on their nature; |
| • | Statement of cash flows prepared under the indirect method. |
PM GROUP
9
Group organizational structure
The chart below shows the Group’s organizational structure as at September 30, 2014:
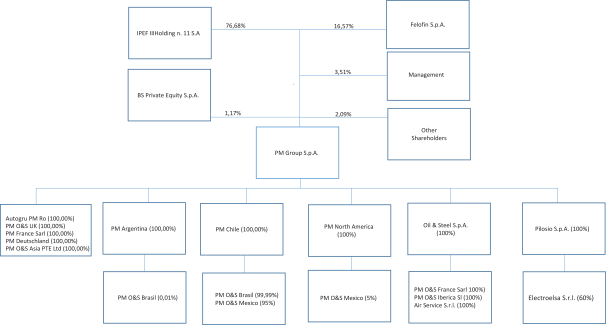
Significant Accounting Policies
Basis of preparation
Our interim Condensed Consolidated Financial Statements are unaudited. In the opinion of Group management, the financial statements include all known adjustments (which consist primarily of normal, recurring accruals, estimates and assumptions that impact the financial statements) necessary to present fairly the financial position at the balance sheet dates and the results of operations for the nine-month period then ended. The Condensed Consolidated Balance Sheet at December 31, 2013, presented herein, has been derived from our audited balance sheet included in our Group Consolidated Financial Statements for the fiscal year ended December 31, 2013, but does not include all disclosures required by IFRS. These financial statements should be read in conjunction with the Group consolidated financial statements and the related notes at December 31, 2013, which have been prepared in accordance with International Financial Reporting Standards (“IFRS”) as issued by the International Accounting Standards Board (“IASB”). The designation “IFRS” also includes all valid International Accounting Standards (“IAS”), as well as all interpretations of the IFRS Interpretation Committee, previously known as the International Financial Reporting Interpretations Committee (“IFRIC”), and before that the Standing Interpretations Committee (“SIC”). The results of operations for the nine-months ended September 30, 2014 are not necessarily indicative of operating results for the full year.
PM GROUP
10
These condensed consolidated financial statements have been presented in Euro which is the main currency in the countries where the PM Group companies conduct their business. A summary of the Group’s significant accounting policies is identified in the explanatory notes to the Group Consolidated Financial Statements at December 31, 2013. There have been no changes to the Group’s significant accounting policiies in the nine-month period ended September 30, 2014.
Foreign currencies
Financial statements expressed in currencies other than the Euro are translated into Euro. The exchange rates applied for 2014 and 2013 are shown below:
| 30/09/2014 |
||||||||
| Currency | Closing | Average | ||||||
| US Dollar |
1.26 | 1.36 | ||||||
| Romanian Lei |
4.41 | 4.45 | ||||||
| GB Pound |
0.78 | 0.81 | ||||||
| Chilean Peso |
755.46 | 760.32 | ||||||
| Argentinean Peso |
10.65 | 10.82 | ||||||
| Brazilian Real |
3.08 | 3.10 | ||||||
| Mexican Peso |
17.00 | 17.78 | ||||||
| 30/09/2013 |
||||||||
| Currency | Closing | Average | ||||||
| US Dollar |
1.35 | 1.32 | ||||||
| Romanian Lei |
4.46 | 4.41 | ||||||
| GB Pound |
0.84 | 0.85 | ||||||
| Chilean Peso |
682.17 | 643.17 | ||||||
| Argentinean Peso |
7.82 | 6.95 | ||||||
| Brazilian Real |
3.04 | 2.79 | ||||||
A full list of the investments included in the scope of consolidation at September 30, 2014 with details of shareholders’ equity and profit/loss for the period calculated in accordance with the applicable accounting standards is shown in the following table:
PM GROUP
11
Consolidated companies:
| Name |
Location |
Country | Share Capital (local currency/000) |
Shareholders’ equity (Euro/000) |
Including profit (loss) for 2013 (Euro/000) |
% interest held | ||||||||||
| 1 | PM Group | San Cesario sul Panaro | Italy | EUR | 23,311 | (25,921) | 557 | |||||||||
| 2 | Autogru PM RO | Arad | Romania | RON | 8,482 | 2,194 | 1 | 100.00% | ||||||||
| 3 | PM North America | Rolling Meadows, Ill | USA | USD | 25 | 112 | (1) | 100.00% | ||||||||
| 4 | PM France | Chassieu | France | EUR | 150 | (374) | (6) | 100.00% | ||||||||
| 5 | PM Argentina | Buenos Aires | Argentina | ARS | 60 | 238 | 25 | 100.00% | ||||||||
| 6 | PM Deutschland | Ulm | Germany | EUR | 25 | 34 | 1 | 100.00% | ||||||||
| 7 | PM Chile | Santiago | Chile | CLP | 19,742 | (749) | (603) | 100.00% | ||||||||
| 8 | Oil & Steel | San Cesario sul Panaro | Italy | EUR | 362 | (6,529) | (917) | 100.00% | ||||||||
| 9 | PM Oil & Steel UK | London | UK | GBP | 300 | (9) | 2 | 100.00% | ||||||||
| 10 | PM Oil & Steel France | Chassieu | France | EUR | 35 | (193) | (80) | 100.00% | ||||||||
| 11 | PM Oil & Steel Iberica | Valencia | Spain | EUR | 200 | 61 | (42) | 100.00% | ||||||||
| 12 | Air Service | Modena | Italy | EUR | 115 | 31 | (46) | 100.00% | ||||||||
| 13 | Pilosio | Feletto Umberto | Italy | EUR | 5,000 | 1,154 | (32) | 100.00% | ||||||||
| 14 | Electroelsa | Poggibonsi | Italy | EUR | 400 | 2,011 | (328) | 60.00% | ||||||||
| 15 | PM Oil & Steel do Brasil | Sao Paulo | Brazil | BRL | 600 | 183 | (5) | 100.00% | ||||||||
| 16 | PM Oil & Steel Mexico | Mexico City | Mexico | MXN | 350 | (51) | (63) | 100.00% | ||||||||
All Group companies are consolidated on a line-by-line basis.
At September 30, 2014, there were no changes to the scope of consolidation or to the percentage interests held in subsidiaries at December 31, 2013.
Going Concern
As disclosed in the Group Consolidated Financial Statements at December 31, 2013, in 2014, Management finalized an operation (the “Operation”) intended to restructure the financial indebtedness of the Group and restore the equity level. The Operation was to be implemented in accordance with Article 182 bis of the Bankruptcy Act and finalized on July 2014.
The main terms of the Operation have been included in Commitment Letters signed by Columna and Manitex, as well as in the PM Group and Oil & Steel Debt Restructuring Agreement signed by the creditor banks (collectively the “Agreement”). On November 18, 2014, the Courts in Modena approved the Agreement.
On January 15, 2015 Manitex completed the acquisition of PM Group and made a capital contribution of Euro 44.5 million in accordance with the terms of the Operation. On January 15, 2015, the sale of Pilosio was completed.
In view of the expected impact of the Operation and taking into account the difficult conditions in some of its main markets, the Group has prepared a new Business Plan for the period 2014 – 2017, which was approved by the holding company Board of Directors on June 10, 2014. The new Business Plan forecasts sufficient cash flows to meet the Group’s remaining obligations following the completion of the Operation.
After having evaluated the uncertainty regarding the economic environment, and the resulting uncertainty which inevitably affects the forecasts reflected in the Business Plan in relation to the Group’s future operating performance (in terms of both revenue and profitability), given the progress of the Operation, Management considers it probable that the Group’s economics and financial situation will be improved. For these reasons, Management reasonably believes that the Group has sufficient resources to continue to operate in the near future and, therefore, have prepared these condensed consolidated financial statements on a going concern basis.
PM GROUP
12
Recently Adopted Accounting Standards and Amendments
The Group has adopted the new standards and amendments, that are applicable from January 1, 2014, in the preparation of its unaudited interim condensed consolidated financial statements; their application did not have any effect on the unaudited interim condensed consolidated financial statements.
Comments on items in the Statement of Financial Position
ASSETS
Note 1—Tangible assets
The following tables show the opening balances, movements during the period ended September 30, 2014 and the closing balances for tangible assets:
| (in Euro) |
01/01/14 | Exchange difference |
Additions | Disposals | Reclassification | Depreciation | 30/09/14 | |||||||||||||||||||||
| Cost |
||||||||||||||||||||||||||||
| Land |
4,683,525 | 5,246 | 0 | 0 | 0 | 0 | 4,688,771 | |||||||||||||||||||||
| Buildings |
18,595,512 | 21,771 | 24,835 | 0 | 0 | 0 | 18,642,118 | |||||||||||||||||||||
| Plant and machinery |
9,119,979 | 36,433 | 155,700 | 47,336 | 3,257 | 0 | 9,268,033 | |||||||||||||||||||||
| Industrial and commercial equipment |
8,241,562 | 11,515 | 129,463 | 84,031 | 10,388 | 0 | 8,308,897 | |||||||||||||||||||||
| Other assets |
4,225,103 | -14,672 | 92,055 | 472,352 | -1,124 | 0 | 3,829,010 | |||||||||||||||||||||
| Assets under construction and payments on advance |
13,667 | 203 | 59,462 | 0 | -13,645 | 0 | 59,687 | |||||||||||||||||||||
|
|
|
|
|
|
|
|
|
|
|
|
|
|
|
|||||||||||||||
| Total Cost of Tangible Assets |
44,879,348 | 60,496 | 461,515 | 603,719 | -1,124 | 0 | 44,796,516 | |||||||||||||||||||||
|
|
|
|
|
|
|
|
|
|
|
|
|
|
|
|||||||||||||||
| (in Euro) |
01/01/14 | Exchange difference |
Additions | Disposals | Reclass. | Depreciation | 30/09/14 | |||||||||||||||||||||
| Accumulated depreciation and impairment |
||||||||||||||||||||||||||||
| Land |
0 | 0 | 0 | 0 | 0 | 0 | 0 | |||||||||||||||||||||
| Buildings |
6,479,062 | 38 | 0 | 0 | 0 | 447,653 | 6,926,753 | |||||||||||||||||||||
| Plant and machinery |
7,540,939 | 25,940 | 0 | 45,029 | 0 | 312,582 | 7,834,432 | |||||||||||||||||||||
| Industrial and commercial equipment |
7,947,233 | 9,292 | 0 | 84,031 | 0 | 149,606 | 8,022,100 | |||||||||||||||||||||
| Other assets |
3,655,909 | -1,106 | 0 | 444,452 | -1,124 | 189,028 | 3,398,255 | |||||||||||||||||||||
|
|
|
|
|
|
|
|
|
|
|
|
|
|
|
|||||||||||||||
| Total accumulated depreciation and impairment of tangible asset |
25,623,143 | 34,164 | 0 | 573,512 | -1,124 | 1,098,869 | 26,181,540 | |||||||||||||||||||||
|
|
|
|
|
|
|
|
|
|
|
|
|
|
|
|||||||||||||||
| Net Book Value |
19,256,205 | 26,332 | 461,515 | 30,207 | 0 | -1,098,869 | 18,614,976 | |||||||||||||||||||||
|
|
|
|
|
|
|
|
|
|
|
|
|
|
|
|||||||||||||||
PM GROUP
13
Note 2—Goodwill
| (in Euro) |
30/09/14 | 31/12/13 | ||||
| Beginning balance |
33,192,959 | 68,142,670 | ||||
|
|
|
|
||||
| Reclassification of Asset held for sale |
0 | -20,078,655 | ||||
| Impairment |
0 | -14,871,056 | ||||
|
|
|
|
||||
| Ending balance |
33,192,959 | 33,192,959 | ||||
|
|
|
|
||||
As there were no indicators of a possible loss in value at September 30, 2014, compared with the previous evaluation, it was not necessary to carry out a new impairment test.
Note 3—Other intangible assets
The following tables show the opening balances, movements during the period ended September 30, 2014 and the closing balances for other intangible assets:
| (in Euro) |
01/01/14 | Exchange difference |
Additions | Reclassification | Amortization | 30/09/14 | ||||||||||||||||||
| Cost |
||||||||||||||||||||||||
| Development costs |
13,108,394 | 20 | 0 | 89,147 | 0 | 13,197,561 | ||||||||||||||||||
| Patents and intellectual property rights |
1,932,970 | 1 | 78,893 | 0 | 0 | 2,011,864 | ||||||||||||||||||
| Concessions, licences, trademarks and similar |
89,024 | 611 | 465 | 0 | 0 | 90,100 | ||||||||||||||||||
| Assets in progress and payments on advance |
983,629 | 0 | 874,213 | -89,147 | 0 | 1,768,695 | ||||||||||||||||||
| Other |
280 | 0 | 90 | 0 | 0 | 370 | ||||||||||||||||||
|
|
|
|
|
|
|
|
|
|
|
|
|
|||||||||||||
| Total |
16,114,297 | 632 | 953,661 | 0 | 0 | 17,068,590 | ||||||||||||||||||
|
|
|
|
|
|
|
|
|
|
|
|
|
|||||||||||||
| (in Euro) |
01/01/14 | Exchange difference |
Additions | Reclassification | Amortization | 30/09/14 | ||||||||||||||||||
| Accumulated amortisation and impairment |
||||||||||||||||||||||||
| Development costs |
10,231,479 | 21 | 0 | 0 | 713,525 | 10,945,025 | ||||||||||||||||||
| Patents and intellectual property rights |
1,461,690 | 0 | 0 | 0 | 129,560 | 1,591,250 | ||||||||||||||||||
| Concessions, licences, trademarks and similar |
57,094 | 195 | 0 | 0 | 1,116 | 58,405 | ||||||||||||||||||
| Assets in progress and payments on advance |
648,052 | 0 | 0 | 0 | 0 | 648,052 | ||||||||||||||||||
| Other |
56 | 0 | 0 | 0 | 56 | 112 | ||||||||||||||||||
|
|
|
|
|
|
|
|
|
|
|
|
|
|||||||||||||
| Total |
12,398,371 | 216 | 0 | 0 | 844,257 | 13,242,844 | ||||||||||||||||||
|
|
|
|
|
|
|
|
|
|
|
|
|
|||||||||||||
| Net Book Value |
3,715,926 | 416 | 953,661 | 0 | -844,257 | 3,825,746 | ||||||||||||||||||
|
|
|
|
|
|
|
|
|
|
|
|
|
|||||||||||||
Capitalized development costs relate to new products, as described in Note 17 below.
Assets in progress, at their completion, are amortized over five years, being the estimated useful life of the Group’s new products without any significant restyling processes.
PM GROUP
14
Note 4—Deferred tax assets
Management consider these deferred tax assets recoverable on the basis of the future profits contained in the Business Plan.
| (in Euro) |
31/12/2013 | Statement of Income |
30/09/2014 | |||||||||
| Provisions for risks and charges |
135,962 | 5,047 | 141,009 | |||||||||
| Inventory |
706,031 | 68,338 | 774,369 | |||||||||
| Provision for bad debts |
273,354 | 4,400 | 277,754 | |||||||||
| Provision for losses on derivatives |
576,023 | -106,424 | 469,599 | |||||||||
| Tax losses |
509,534 | 80,069 | 589,603 | |||||||||
| Interest expenses |
3,495,267 | 228,028 | 3,723,295 | |||||||||
| Other |
7,322 | 5,100 | 12,422 | |||||||||
|
|
|
|
|
|
|
|||||||
| Deferred tax assets |
5,703,493 | 284,558 | 5,988,051 | |||||||||
|
|
|
|
|
|
|
|||||||
Note 5—Inventory
For details of changes in each inventory category, see the figures highlighted in the Income Statement.
The following tables contain a breakdown of net inventory by category and movements on the inventory obsolescence provision (deducted directly from inventory):
| (in Euro) |
30/09/2014 | 31/12/2013 | ||||||
| Raw, ancillary and consumable materials |
14,067,616 | 10,162,235 | ||||||
| Work in progress |
635,845 | 680,084 | ||||||
| Semi-finished goods |
816,443 | 744,358 | ||||||
| Finished goods |
6,711,446 | 4,862,442 | ||||||
| Inventory obsolescence provision |
-2,422,084 | -2,597,952 | ||||||
|
|
|
|
|
|||||
| Inventory |
19,809,268 | 13,851,167 | ||||||
|
|
|
|
|
|||||
Note 6—Current trade receivables
Current trade receivables are analyzed as follows:
| (in Euro) |
30/09/14 | 31/12/13 | ||||||
| Current trade receivables |
22,493,251 | 30,924,832 | ||||||
| Other receivables |
182,293 | 118,950 | ||||||
| Provision for bad debts |
-2,398,353 | -2,522,082 | ||||||
|
|
|
|
|
|||||
| Trade receivables |
20,277,192 | 28,521,700 | ||||||
|
|
|
|
|
|||||
PM GROUP
15
Note 7—Cash and cash equivalents
Cash and cash equivalents are analyzed as follows:
| (in Euro) |
30/09/14 | 31/12/13 | ||||||
| Cash on hand |
16,442 | 20,704 | ||||||
| Cheques |
163,000 | 5,857 | ||||||
| Bank and post office accounts |
1,504,057 | 2,193,638 | ||||||
|
|
|
|
|
|||||
| Cash and cash equivalents |
1,683,500 | 2,220,199 | ||||||
|
|
|
|
|
|||||
LIABILITIES
Note 8—Non-current financial payables
Non-current financial payables are analyzed as follows:
| (in Euro) |
30/09/2014 | 31/12/2013 | ||||||
| Non-current portion of loans payable |
676,784 | 802,451 | ||||||
| Payables to other lenders |
40,916 | 335,100 | ||||||
|
|
|
|
|
|||||
| Non-current financial payables |
717,700 | 1,137,551 | ||||||
|
|
|
|
|
|||||
Payables to other lenders are broken down by due date as follows:
| (in Euro) |
within a year |
between one and five years |
Balance 30/09/2014 |
within a year |
between one and five years |
Balance 31/12/2013 |
||||||||||||||||||
| Minimum payments due under finance leases |
411,035 | 43,462 | 454,497 | 535,253 | 344,729 | 879,981 | ||||||||||||||||||
| Interest element |
-10,669 | -2,547 | -13,216 | -27,481 | -9,629 | -37,110 | ||||||||||||||||||
|
|
|
|
|
|
|
|
|
|
|
|
|
|||||||||||||
| Present value of minimum payments due under finance leases |
400,366 | 40,916 | 441,282 | 507,772 | 335,100 | 842,872 | ||||||||||||||||||
|
|
|
|
|
|
|
|
|
|
|
|
|
|||||||||||||
The portion of these payables due within a year is classified under Current financial payables, as analyzed in Note 12.
Non current portion of loans payable are due within one and five years, as shown in the table below:
| (in Euro) |
30/09/2014 | 31/12/13 | ||||||
| Loans Payable due after between 1 and 5 years |
676,784 | 802,451 | ||||||
|
|
|
|
|
|||||
| Non-current portion of loans payable |
676,784 | 802,451 | ||||||
|
|
|
|
|
|||||
PM GROUP
16
A detailed breakdown of loans payable is shown in the following table:
| Bank |
Interest rate |
Original Maturity |
Type |
Loan amount €/1000 |
O/S Princ. 30/09/14 |
current | non- current |
security | ||||||||||||||||||
| CARISBO |
Eur 3M + 2,50 | 12/31/2014 | unsecured loan | 1,000 | 259,338 | 259,338 | — | none | ||||||||||||||||||
| BPER (ex B.ca CRV) |
Eur 3M + 2,50 | 12/31/2014 | unsecured loan | 1,000 | 923,105 | 923,105 | — | none | ||||||||||||||||||
| BPER |
Eur 3M + 2,50 | 12/31/2014 | unsecured loan | 1,500 | 1,500,000 | 1,500,000 | — | none | ||||||||||||||||||
| BNL |
Eur 3M + 2,50 | 12/31/2014 | unsecured loan | 600 | 600,000 | 600,000 | — | none | ||||||||||||||||||
| MPS |
Eur 3M + 2,50 | 12/31/2014 | unsecured loan | 5,500 | 5,500,000 | 5,500,000 | — | none | ||||||||||||||||||
| UNICREDIT |
Eur 3M + 2,50 | 12/31/2014 | unsecured loan | 2,000 | 2,000,000 | 2,000,000 | — | none | ||||||||||||||||||
| BPER / UNICREDIT |
- | 12/31/2015 | deferred interest—Senior loan | 2,862 | 2,862,200 | 2,862,200 | — | none | ||||||||||||||||||
| BPER / UNICREDIT |
Eur 6M + 2,36 | 1/30/2017 | Secured loan—Senior loan | 26,993 | 26,993,000 | 26,993,000 | — | mortgage + pledge on shares | ||||||||||||||||||
| BPER / UNICREDIT |
Eur 6M + 2,86 | 1/30/2017 | Secured loan—Senior loan | 30,000 | 30,000,000 | 30,000,000 | — | mortgage + pledge on shares | ||||||||||||||||||
| CARISBO |
Eur 3M + 2,50 | 12/31/2014 | unsecured loan | 500 | 129,354 | 129,354 | — | none | ||||||||||||||||||
| BPER (ex B.ca CRV) |
Eur 3M + 2,51 | 12/31/2014 | unsecured loan | 750 | 692,329 | 692,329 | — | none | ||||||||||||||||||
| BPER |
Eur 3M + 2,52 | 12/31/2014 | unsecured loan | 1,000 | 1,000,000 | 1,000,000 | — | none | ||||||||||||||||||
| BNL |
Eur 3M + 2,53 | 12/31/2014 | unsecured loan | 300 | 300,000 | 300,000 | — | none | ||||||||||||||||||
| MPS |
Eur 3M + 2,54 | 12/31/2014 | unsecured loan | 500 | 500,000 | 500,000 | — | none | ||||||||||||||||||
| BPER / UNICREDIT |
- | 12/31/2015 | deferred interest—Senior loan | 270 | 269,977 | 269,977 | — | none | ||||||||||||||||||
| BPER / UNICREDIT |
Eur 6M + 2,36 | 1/30/2017 | Secured loan—Senior loan | 5,807 | 5,807,000 | 5,807,000 | — | pledge on shares | ||||||||||||||||||
| BANCA ITALO ROMENA |
Eur 3M + 5% | 6/30/2015 | Secured loan | 800 | 680,185 | 680,185 | mortgage | |||||||||||||||||||
| DEBT ISSUANCE COSTS |
-339,346 | |||||||||||||||||||||||||
|
|
|
|
|
|
|
|||||||||||||||||||||
| TOTAL |
80,016,488 | 78,996,957 | 680,185 | |||||||||||||||||||||||
|
|
|
|
|
|
|
|||||||||||||||||||||
At September 30, 2014, the Group was not in compliance with covenants set out by the loan agreements, and resulted in the Group defaulting on its loans payable to the creditor banks totaling Euro 78,997 thousand. Consequently, the balance in default has been reclassified to current financial payables in the consolidated financial statements.
The mortgage refers to the Oil & Steel S.p.A. factory located in S. Cesario sul Panaro (MO). The pledge refers to the 100% Oil & Steel S.p.A. and Pilosio S.p.A. shares, held by PM Group S.p.A.
Note 9—Employee benefits
Movements on the employee severance indemnity / TFR provision during the period, including the effects of the actuarial valuation of the TFR, were as follows:
| (in Euro) |
31/12/13 | Increases | Decreases | 30/09/14 | ||||||||||||
| Employee severance indemnity / TFR |
1,413,558 | 459,227 | 520,041 | 1,352,744 | ||||||||||||
Note 10—Provisions for risks and charges
Movements on provisions for risks and charges in 2014 were as follows:
| (in Euro) |
31/12/13 | Increases | Decreases | 30/09/14 | ||||||||||||
| Product warranty provision |
851,000 | 16,074 | 0 | 867,074 | ||||||||||||
| Prov. for retirement benefits & similar obligations |
80,806 | 0 | 0 | 80,806 | ||||||||||||
| Other provisions |
505,519 | 0 | 25,519 | 480,000 | ||||||||||||
|
|
|
|
|
|
|
|
|
|||||||||
| Provisions for risks and charges |
1,437,325 | 16,074 | 25,519 | 1,427,880 | ||||||||||||
|
|
|
|
|
|
|
|
|
|||||||||
PM GROUP
17
The “Provision for retirement benefits and similar obligations” represents the potential liability towards agents in the event that the agency relationship is terminated by the Group companies or if the agents retire.
The “Provision for product warranty risks” has been updated based on estimated requirements.
Note 11—Provision for deferred taxes
| (in Euro) |
31/12/2013 | Statement of Income |
30/09/2014 | |||||||||
| Accelerated depreciation |
83,264 | 0 | 83,264 | |||||||||
| Goodwill |
1,696,163 | 159,015 | 1,855,178 | |||||||||
| Amortization from merger |
704,460 | 0 | 704,460 | |||||||||
| TFR under IAS |
66,058 | 0 | 66,058 | |||||||||
| Out of period income due to change of rate |
-228,888 | 0 | -228,888 | |||||||||
| Leasehold improvements |
140,683 | 0 | 140,683 | |||||||||
| Finance leases (IAS 17) |
505,574 | 0 | 505,574 | |||||||||
| Reversal of depreciation of land/building O&S |
57,999 | 0 | 57,999 | |||||||||
| Other |
12,999 | 0 | 12,999 | |||||||||
|
|
|
|
|
|
|
|||||||
| Total |
3,038,312 | 159,015 | 3,197,327 | |||||||||
|
|
|
|
|
|
|
|||||||
The deferred tax provision (Euro 3,197 thousand at September 30, 2014) largely relates to the deferral of gains realized on disposal of tangible assets held for more than three years, accelerated depreciation charged for tax purposes only until 2007 and the tax effects of the transition to IAS/IFRS.
Note 12—Current financial payables
| (in Euro) |
30/09/2014 | 31/12/2013 | ||||||
| Bank overdrafts, loans, advance on invoice and notes |
20,456,093 | 20,734,487 | ||||||
| Current portion of loans payable |
78,996,957 | 78,920,702 | ||||||
| Payables to other lenders |
400,366 | 507,772 | ||||||
|
|
|
|
|
|||||
| Current financial payables |
99,853,416 | 100,162,961 | ||||||
|
|
|
|
|
|||||
Payables to other lenders represents the amount due within a year and mainly relates to the current portion of Euro 349 thousand payable to Medioleasing (formerly Banca Marche) under the real estate finance lease entered into for the Oil & Steel factory in San Cesario sul Panaro (MO), Via Verdi 22 at September 30, 2014. As further described in Note 8, the Group defaulted on its loans payable to the creditor banks totaling Euro 78,997 thousand at September 30, 2014. Consequently, the balance in default has been reclassified to current financial liabilities in the financial statements.
PM GROUP
18
The fair value of the current portion of loans payable is assumed to be equal to Euro 40,420 thousand plus 860 thousand of Manitex shares. The fair value was determined to be the residual value of current portion of loans payable at September 30, 2014 (Euro 78,997 thousand) resulting from the restructuring of the financial indebtedness of the Group upon completion of the Operation. Please refer to the note related to the going concern assumption for more details on terms of the Operation.
Note 13—Liabilities for financial instruments and derivatives
| (in Euro) |
30/09/2014 | 31/12/2013 | ||||||
| Interest rate hedges |
1,728,343 | 2,141,069 | ||||||
|
|
|
|
|
|||||
| Liabilities for financial instruments and derivatives |
1,728,343 | 2,141,069 | ||||||
|
|
|
|
|
|||||
The Group uses financial instruments available on the market (including derivatives) solely in order to minimize its cost of borrowing and hedge the risk of interest rate and exchange rate fluctuations.
In accordance with IAS 32, IAS 39 and IFRS 7, these contracts have been recorded under “Liabilities for financial instruments and derivatives” (with a contra-entry to the Income Statement) in the amount of Euro 1,728 thousand which represents the fair value of the contracts at the reporting date. The change in fair value of these contracts is recorded in the financial income/expenses and exchange gains/losses captions of the Interim Condensed Consolidated Statement of Income.
At September 30, 2014, there were no transactions for the forward sale or purchase of currency.
Note 14—Current trade payables
Current trade payables (including invoices to be received from suppliers) are analyzed as follows:
| (in Euro) |
30/09/2014 | 31/12/2013 | ||||||
| Trade payables |
23,046,403 | 22,131,036 | ||||||
|
|
|
|
|
|||||
| Current trade payables |
23,046,403 | 22,131,036 | ||||||
|
|
|
|
|
|||||
PM GROUP
19
Comments on main Income Statement items
Note 15—Revenue from operating activities
Revenue from operating activities is analyzed below:
| (in Euro) |
9M 2014 | 9M 2013 | ||||||
| Revenue from operating activities |
52,137,327 | 49,039,645 | ||||||
| Revenue from services |
1,167,565 | 1,471,649 | ||||||
| Rental income |
101,193 | 114,702 | ||||||
| Other revenue from operating activities |
135,505 | 149,353 | ||||||
|
|
|
|
|
|||||
| Revenue from operating activities |
53,541,589 | 50,775,349 | ||||||
|
|
|
|
|
|||||
Note 16—Other revenue and income
Other revenue and income are analyzed as follows:
| (in Euro) |
9M 2014 | 9M 2013 | ||||||
| Compensation for damages |
58,014 | 2,080 | ||||||
| Gains on disposal |
7,656 | 16,088 | ||||||
| Freight services |
789,820 | 870,841 | ||||||
| Other |
615,099 | 354,236 | ||||||
|
|
|
|
|
|||||
| Other revenue and income |
1,470,589 | 1,243,245 | ||||||
|
|
|
|
|
|||||
“Freight Services” mainly includes revenues related to organization of freight service to customers. “Other” primarily includes sundry charges to customers.
Note 17—Increases in non-current assets due to capitalization of internal costs
This caption regards the capitalization of materials, services and labor costs incurred for the internal construction of equipment and the development of new products, as shown in the following table:
| (in Euro) |
9M 2014 | 9M 2013 | ||||||
| Increases in industrial equipment |
12,174 | 23,850 | ||||||
| Increases in development costs |
874,213 | 1,533,552 | ||||||
|
|
|
|
|
|||||
| Increases in non-current assets due to capitalisation of internal costs |
886,388 | 1,557,402 | ||||||
|
|
|
|
|
|||||
PM’s research and development activities focus on the introduction into the product range new series of light weight high performance cranes.
PM GROUP
20
Note 18—Costs of raw materials
Costs of raw materials are analyzed as follows:
| (in Euro) |
9M 2014 | 9M 2013 | ||||||
| Finished goods |
4,637,379 | 3,600,513 | ||||||
| Raw materials |
28,975,463 | 22,551,672 | ||||||
| Packaging and consumable materials |
372,720 | 406,504 | ||||||
| Change in inventory of raw materials and goods |
-3,778,640 | -840,688 | ||||||
|
|
|
|
|
|||||
| Total Costs of raw material |
30,206,923 | 25,718,000 | ||||||
|
|
|
|
|
|||||
Note 19—Costs for services
Costs for services are analyzed as follows:
| (in Euro) |
9M 2014 | 9M 2013 | ||||||
| Outsourced production |
3,037,617 | 3,088,466 | ||||||
| Transport/freight |
1,439,896 | 1,507,329 | ||||||
| Agents’ commission |
376,282 | 343,002 | ||||||
| Legal and consulting costs |
1,387,357 | 1,505,860 | ||||||
| Utilities and other industrial services |
617,734 | 648,891 | ||||||
| Insurance |
353,670 | 358,440 | ||||||
| Repairs and maintenance |
196,389 | 194,888 | ||||||
| Marketing, trade fairs and advertising |
358,127 | 597,455 | ||||||
| Board of Statutory Auditors’ fees |
68,687 | 73,932 | ||||||
| Other costs for services |
1,432,911 | 1,462,712 | ||||||
| Technical assistance |
380,967 | 395,123 | ||||||
|
|
|
|
|
|||||
| Costs for services |
9,649,637 | 10,176,099 | ||||||
|
|
|
|
|
|||||
Note 20—Personnel costs
| (in Euro) |
9M 2014 | 9M 2013 | ||||||
| Wages and salaries |
8,659,470 | 9,681,131 | ||||||
| Directors’ remuneration and benefits |
215,062 | 196,101 | ||||||
| Social contributions |
2,640,837 | 2,653,973 | ||||||
| TFR, retirement benefits and similar |
459,227 | 503,983 | ||||||
| Other costs |
427,714 | 348,824 | ||||||
|
|
|
|
|
|||||
| Personnel costs |
12,402,311 | 13,384,012 | ||||||
|
|
|
|
|
|||||
PM GROUP
21
The Group’s average headcount, by employee category, is shown in the following table:
| 9M 2014 | 9M 2013 | |||||||
| Managers |
13 | 12 | ||||||
| Staff |
552 | 566 | ||||||
|
|
|
|
|
|||||
| Total |
565 | 578 | ||||||
|
|
|
|
|
|||||
Figures for the Pilosio BU are included for the sake of completeness. The related costs are included in the operating expenses detailed in Note 26.
Note 21—Other operating expenses
Other operating expenses are analyzed as follows:
| (in Euro) |
9M 2014 | 9M 2013 | ||||||
| Rental of industrial and office buildings |
523,636 | 540,479 | ||||||
| Operating leases |
238,656 | 337,396 | ||||||
| Losses on disposals |
238 | 0 | ||||||
| Taxes other than income taxes |
334,619 | 287,651 | ||||||
| Bad debts |
16,910 | -6,350 | ||||||
| Other operating expenses |
337,964 | 809,334 | ||||||
|
|
|
|
|
|||||
| Other operating expenses |
1,452,021 | 1,968,510 | ||||||
|
|
|
|
|
|||||
Note 22—Depreciation, amortization and impairment of non-current assets
| (in Euro) |
9M 2014 | 9M 2013 | ||||||
| Amortization of intangible assets |
844,257 | 1,306,094 | ||||||
| Depreciation of tangible assets |
1,098,869 | 1,220,438 | ||||||
| Impairment of tangible assets |
0 | 158,024 | ||||||
|
|
|
|
|
|||||
| Depreciation, amortization and impairment of non-current assets |
1,943,126 | 2,684,556 | ||||||
|
|
|
|
|
|||||
Certain tangible assets have been impaired as the related fair value resulting from their sale was lower that their carrying amount.
Note 23—Provisions
These may be analyzed as follows:
| (in Euro) |
9M 2014 | 9M 2013 | ||||||
| Provision for bad debts |
54,818 | 45,490 | ||||||
| Provions for risks |
16,074 | 0 | ||||||
| Other provisions |
-25,519 | 3,962 | ||||||
|
|
|
|
|
|||||
| Total |
45,374 | 49,452 | ||||||
|
|
|
|
|
|||||
PM GROUP
22
“Provisions for risks” primarily relate to amounts allocated to the product warranty provision. “Other provisions” relate to favorable adjustments to provisions accrued in previous periods settled by the Group during 2014 amounting to approximately Euro 20 thousand. Amounts were recorded in “Other operating expenses”.
Note 24—Financial income and expenses
| (in Euro) |
9M 2014 | 9M 2013 | ||||||
| Interest income on bank accounts |
2,829 | 4,150 | ||||||
| Interest income from customers |
5,832 | 2,438 | ||||||
| Income from derivatives |
412,932 | 878,094 | ||||||
| Other financial income |
10,204 | 14,312 | ||||||
| Financial income |
431,797 | 898,993 | ||||||
| Financial expenses on loans and finance leases |
1,630,853 | 1,686,483 | ||||||
| Financial expenses on current liabilities |
489,364 | 490,700 | ||||||
| Financial expenses on derivatives |
552,766 | 609,493 | ||||||
| Other interest and expenses |
68,390 | 68,865 | ||||||
| Bank charges |
377,499 | 471,573 | ||||||
| Financial expenses |
3,118,872 | 3,327,114 | ||||||
| Exchange gains—realized |
359,943 | 256,052 | ||||||
| Exchange gains—unrealized |
674,592 | 274,047 | ||||||
| Exchange losses—realized |
635,852 | 429,795 | ||||||
| Exchange losses—unrealized |
621,350 | 1,059,238 | ||||||
| Net exchange losses |
-222,667 | -958,934 | ||||||
|
|
|
|
|
|||||
| Financial income and expenses |
-2,909,742 | -3,387,056 | ||||||
|
|
|
|
|
|||||
Note 25—Taxes on income
Tax for the nine month period is charged on the base of the best estimate of the average annual effective tax rate expected for the full year, applied to the pre-tax loss of the nine month period.
Note 26—Assets and liabilities held for sale. Profit/Loss from discontinued operations
The Interim Condensed Consolidated Financial Statements, include the assets and liabilities of Pilosio S.p.A. and its subsidiaries. On January 15, 2015 Pilosio was sold to a company owned by Columna at a price of Euro 1,000 thousand as previously described in the Group Consolidated Financial Statements at December 31, 2013.
As a result of the above, the Condesed Consolidated Statement of Income includes “Profit/Loss from discontinued operations” related to Pilosio, representing the loss of the discontinued operations, net of tax effects.
In accordance with IFRS 5, we provide below details of (i) the assets held for sale and the related liabilities at September 30, 2014, (ii) the items forming part of the discontinued operations/activities for the period ended September 30, 2014, and September 30, 2013, and (iii) cash flow information related to the discontinued operations for the period ended September 30, 2014 and 2013.
PM GROUP
23
Note 27—Fair Value measurement
IFRS 13 establishes a fair value hierarchy which classifies on three levels the inputs of the valuation techniques adopted to measure fair value. The fair value hierarchy gives highest priority to the quoted prices (unadjusted) on active markets for identical assets or liabilities (Level 1 inputs) and lowest priority to unobservable inputs (Level 3 inputs). In some cases, the inputs used to measure the fair value of an asset or liability could be classified on several levels of the fair value hierarchy. In such cases, the fair value measurement is classified entirely on the same hierarchy level where the lowest level input that has a significant impact o the valuation.
PM GROUP
24
The levels used in the hierarchy are:
| • | Level 1 inputs are quoted prices (unadjusted) on active markets for identical assets or liabilities that the entity can access at the measurement date; |
| • | Level 2 inputs are inputs other than quoted prices included within Level 1 that are observable for the asset or liability, either directly or indirectly; |
| • | Level 3 inputs are unobservable inputs for the asset or liability. |
The following table shows the fair value hierarchy of Assets and Liabilities measured at fair value at September 30, 2014:
| (in Euro) |
Level 1 | Level 2 | Level 3 | Total 30/09/2014 |
||||||||||||
| Liabilities for derivative financial instruments |
0 | -1.728.343 | 0 | -1.728.343 | ||||||||||||
|
|
|
|
|
|
|
|
|
|||||||||
| Total |
0 | -1.728.343 | 0 | -1.728.343 | ||||||||||||
|
|
|
|
|
|
|
|
|
|||||||||
Liabilities for derivative financial instruments did not change fair value hierarchy between December 31, 2013 and September 30, 2014.
The fair value of Liabilities for derivative financial Instruments is included in Level 2 of the fair value hierarchy and has been estimated with discounted cash flows models. The main inputs used are forward interest rates (from observable yield curves at the end of the reporting period), and contract interest rates, discounted at a rate that reflects the credit risk of various counterparties.
At December 31, 2013 assets and liabilities held for sale, related to the Business Unit Pilosio, were valued at fair value and disclosed in Level 3 of the fair value hierarchy. At September 30, 2014 assets and liabilities held for sale are no longer valued at fair value because at that date, as consequence of the loss incurred by Pilosio during the first nine month of 2014, their carrying amounts are lower of their fair value less costs to sell.
For financial instruments represented by short-term receivables, payables, and financial payables for which the present value of future cash flows does not differ significantly from carrying value, the carrying value is a reasonable approximation of the fair value. In particular, the carrying amount of Current receivables, Other current assets, Trade payables and Other current liabilities, approximates their fair value. The fair value of the financial payables has been disclosed in Note 12.
For other Statement of Financial Position items the carrying amount represents a reasonable approximation of fair value at September 30, 2014.
San Cesario sul Panaro, February 13, 2015
| FOR THE BOARD OF DIRECTORS |
| THE PRESIDENT |
| David J. Langevin |
PM GROUP
25