Attached files
| file | filename |
|---|---|
| 8-K - 8-K - CENTERPOINT ENERGY INC | d897564d8k.htm |
 Focused on
Energy Delivery, Positioned to Execute
Introduction to CenterPoint Energy
March 2015
A Fortune 500 company included in the:
S&P 500 Index
S&P 500 Utility Index
Dow Jones Utility Average Index
PHLX Utility Sector Index
Russell 1000 Index
Exhibit 99.1 |
 investors.centerpointenergy.com
March 2015
Cautionary Statement
2
This presentation contains statements concerning our expectations, beliefs, plans, objectives,
goals, strategies, future events or performance and underlying assumptions and other
statements that are not historical facts. These statements are “forward-looking
statements” within the meaning of the Private Securities Litigation Reform Act of 1995. You should not place undue
reliance on forward-looking statements. Actual results may differ materially from those
expressed or implied by these statements. You can generally identify our forward-looking statements by the
words “anticipate,” “believe,” “continue,” “could,”
“estimate,” “expect,” “forecast,” “goal,” “intend,” “may,” “objective,” “plan,” “potential,” “predict,” “projection,”
“should,” “will,” or other similar words. The absence of
these words, however, does not mean that the statements are not forward-looking.
We have based our forward-looking statements on our management's beliefs and assumptions
based on information currently available to our management at the time the statements
are made. We caution you that assumptions, beliefs, expectations, intentions, and
projections about future events may and often do vary materially from actual results. Therefore, we cannot
assure you that actual results will not differ materially from those expressed or implied by
our forward-looking statements. Some of the factors that could cause actual results
to differ from those expressed or implied by our forward-looking statements include but are not limited to the timing and impact of
future regulatory, legislative and IRS decisions, financial market conditions, future market
conditions, and other factors described in CenterPoint Energy, Inc.’s Form 10-K for the period ended
December 31, 2014 under “cautionary statement regarding forward-looking
information,” “Risk Factors” and “ – Liquidity and Capital Resources – Other Matters – Other Factors That Could Affect
Cash Requirements” and “Management’s Discussion and Analysis of Financial
Condition and Results of Operations - Certain Factors Affecting Future Earnings,” and in other filings with the SEC by
CenterPoint Energy, which can be found at
www.centerpointenergy.com on the Investor Relations page or on the SEC’s website at www.sec.gov .
Slides 20 and 21 are extracted from Enable Midstream Partners, LP’s (“Enable
Midstream”) investor presentation as presented at the Barclays Investment Grade Energy and Pipeline
conference dated March 4, 2015. These slides are included for informational purposes
only. The content has not been verified by CenterPoint Energy and CenterPoint Energy assumes no liability
for the same. You should consider Enable Midstream’s investor materials in the
context of their SEC filings and their entire investor presentation, which is available on their website at
http://investors.enablemidstream.com/.
This presentation contains time sensitive information that is accurate as of the date
hereof. Some of the information in this presentation in unaudited and may be subject to change. We
undertake no obligation to update the information presented herein except as required by law.
Investors and others should note that we may announce material information using SEC
filings, press releases, public conference calls, webcasts and the Investors page of our website. In
the future, we will continue to use these channels to distribute material information about
the Company and to communicate important information about the Company, key personnel, corporate
initiatives, regulatory updates and other matters. Information that we post on our
website could be deemed material; therefore, we encourage investors, the media, our customers, business
partners and others interested in our Company to review the information we post on our
website. Use of Non-GAAP Financial Measures In addition to
presenting its financial results in accordance with generally accepted accounting principles (“GAAP”), CenterPoint Energy also provides guidance based on adjusted diluted
earnings per share, which is a non-GAAP financial measure. Generally, a non-GAAP
financial measure is a numerical measure of a company’s historical or future financial performance that excludes
or includes amounts that are not normally excluded or included in the most directly comparable
GAAP financial measure. A reconciliation of diluted earnings per share to the adjusted basis used in
providing guidance is provided in this presentation on slide 7.
Management evaluates financial performance in part based on adjusted diluted earnings per
share and believes that presenting this non-GAAP financial measure enhances an investor’s
understanding of CenterPoint Energy’s overall financial performance by providing them
with an additional meaningful and relevant comparison of current and anticipated future results across
periods by excluding items that Management does not believe most accurately reflect its
fundamental business performance, which items include the items reflected in the reconciliation table on
page 7 of this presentation. This non-GAAP financial measure should be considered as
a supplement and complement to, and not as a substitute for, or superior to, the most directly comparable
GAAP financial measure and may be different than non-GAAP financial measures used by other
companies. |
 investors.centerpointenergy.com
March 2015
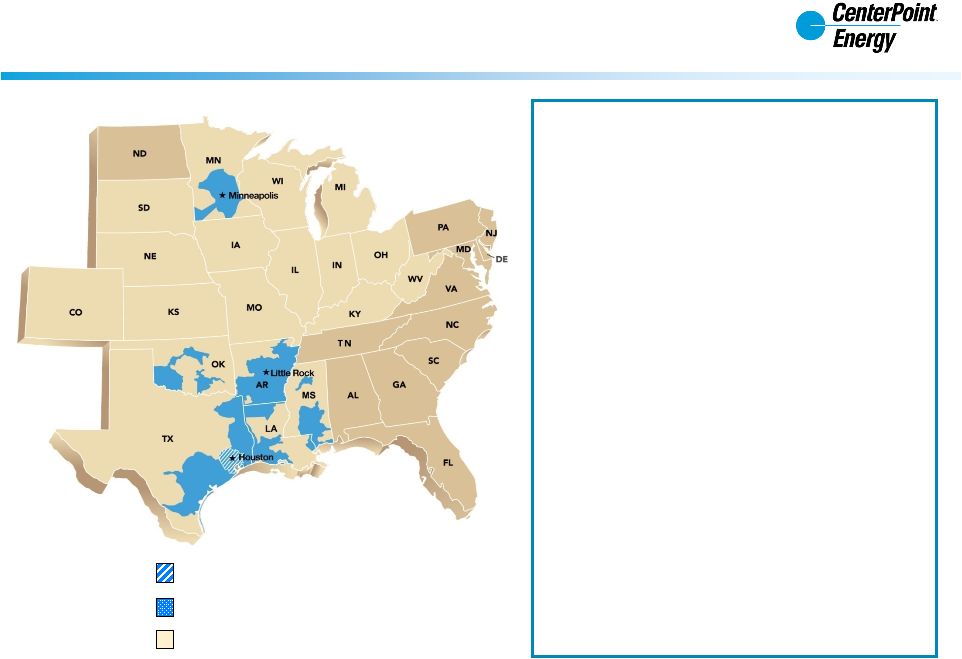
CenterPoint Energy, Inc. (NYSE: CNP)
Regulated Electric and Natural Gas Utility Serving more than 5.5
Million Customers
3
Electric Transmission & Distribution
Natural Gas Distribution
Energy Services
Electric Transmission & Distribution:
•
Electric utility operation with ~2.3 million
metered customers
•
~12,900 km²
service territory in and around
Houston
•
18 largest U.S. investor-owned electric
utility by customer base¹
•
81,839,060 MWh delivered in 2014
Gas Operations
•
10 gas distribution jurisdictions in six states
with ~3.4 million customers
•
5 largest U.S. gas distribution company by
customer base¹
•
Recently ranked 1 among the largest Midwest
Region natural gas utilities in the U.S. for
operational satisfaction in a 2014 Cogent
energy study
•
Gas distribution company and Energy Services
company delivered ~1.1 Tcf of natural gas in
2014
1.
As of Dec. 31, 2013 per AGA and EEI
th
th
st |
 investors.centerpointenergy.com
March 2015
Operating Energy Delivery Businesses that Provide
Superior Performance for our Key Stakeholders
4
Our Vision: Lead
the nation in delivering energy, service and value We are a premier U.S.
energy delivery company Delivering energy is CenterPoint Energy’s core
business Delivering service and value applies to all stakeholders
Our Strategy:
Operate, Serve, Grow
Ensure safe, reliable, efficient and
environmentally responsible
energy delivery businesses
Utilize new and innovative
technology to enhance
performance
Add value to energy delivery
through superior customer service,
new technology and innovation
Provide leadership in the
communities we serve
Develop a diverse and capable employee base
Invest in core energy delivery businesses
Actively govern Enable Midstream investment |
 investors.centerpointenergy.com
March 2015
CenterPoint Energy’s Value Proposition
Growth, Market Structure and Leadership
5
Strong dividend yield (4.75% as of March 19, 2015)
Competitive dividend growth rate projected to be
supported by regulated utilities with potential for
additional growth from Midstream investment
Lack of generation assets reduces the environmental
risks generally associated with a fully integrated
utility
Future capital investment in transmission and
distribution assets is expected to sustain earnings
momentum
Capital recovery mechanisms at both utilities help
reduce regulatory lag
Utilities’
earnings at or near authorized ROEs of 10%
at electric utility and an aggregated 10% at the gas
utilities
Focus on customer satisfaction improves regulatory
relationships allowing for constructive dialog to
optimize our business model |
 investors.centerpointenergy.com
March 2015
2014 Year Highlights
6
Electric transmission and distribution utility operating income for 2014 was $477 million as
compared to $474 million in 2013
Natural gas utility operating income for 2014 was $287 million as compared to $263 million in
2013 o
Rate changes and cost management efforts resulted in record operating income
Sustained strong economic activity with the addition of nearly 55,000 new meters for Houston
Electric and nearly 36,000 new Gas Utility customers
Invested
over
$1.4
billion
in
our
utility
operations,
addressing
demands
associated
with
system
safety,
reliability, growth and ongoing maintenance
Continued
industrial
and
economic
growth
led
to
ongoing
interest
in
our
transmission
rights-of-way
at
our
electric utility; 2014 Rights of Way revenue: $21 MM
Contributed equity income of $308 million in 2014
Enable Midstream Partners completed its initial public offering in 04/2014 under ticker
ENBL Increased 4.2% in January 2015, following a 14.5% increase in January 2014
10th consecutive year of dividend increases; 10 year CAGR of 9.5% off of a 2005 base of
$0.40 Utility Operations: Strong financial and operational performances
Midstream Investments:
Dividend: |
 investors.centerpointenergy.com
March 2015
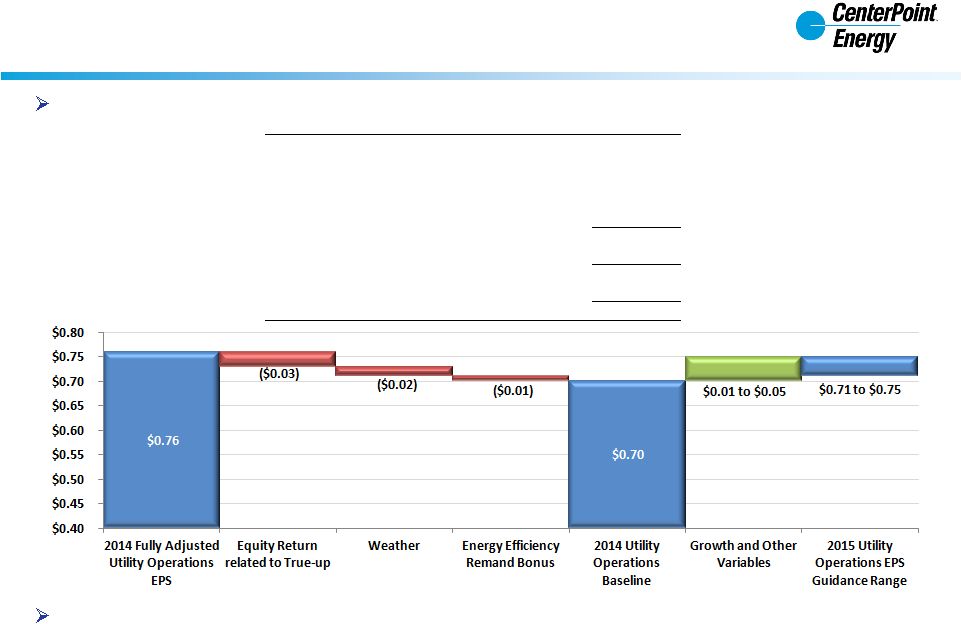
2015 Guidance as Provided on February 26, 2015
Consolidated EPS Guidance of $1.00 to $1.10 per Diluted Share
7
Utility Operations EPS guidance: $0.71 to $0.75 per diluted share from a 2014 Baseline of
$0.70 Regular quarterly cash dividend of $0.2475 declared in January 2015; if
annualized, would equate to $0.99 per share
2014 Fully Diluted EPS
$ 1.42
On an adjusted guidance basis:
ZENS-related mark to market gains
(0.12)
CES MTM gain
(0.04)
Pension Curtailment loss
0.01
2014 Consolidated EPS on a guidance basis
$ 1.27
Deferred Tax Benefit
(0.07)
2014 Fully Adjusted EPS
$ 1.20
Midstream Investments
(0.44)
2014 Fully Adjusted Utility Operations EPS
$ 0.76 |
 investors.centerpointenergy.com
March 2015
CenterPoint Summary Financials at a Glance
as of Dec. 31, 2014
8
1.
Excludes revenue from Transition and system restoration bond companies of $566 MM
2.
Excludes Transition and Restoration Bonds
3.
Excludes operating income from Transition and Restoration Bond companies of $118 MM
4.
Securitized regulatory assets of $2,738 MM excluded from total regulatory assets of $3,527 MM
|
 investors.centerpointenergy.com
March 2015
Houston Electric:
Transmission & Distribution (T&D) Utility
9 |
 investors.centerpointenergy.com
March 2015
Houston Electric: Overview
10
Electric T&D operating income for 2014 was $477 million as compared to $474 million in
2013 ~2.3
million
metered
customers;
~5,000
miles²
(12,900
km²)
in
and
around
Houston,
Texas
Dec. 2014 average residential electric price in TX:
$0.118/kwh¹ Usage per customer ~30% higher than the U.S.
average² Has consistently earned at or near its 10%
authorized ROE Low Business Risk
Poles and wires assets; No generation assets which reduces
business,
environmental, and regulatory risks
Direct customers are ~70 Retail Electric Providers (REPs)
Capital Recovery Mechanisms in Place
~95% of capital plan eligible for recovery through mechanisms
Reduces recovery lag and frequency of general rate cases
No rate case planned during next 5 years as long as current
capital
recovery mechanisms remain
in place
1.
U.S. Energy Information Administration; average price for all sectors was $0.0886
2.
Based on 2013 residential sales data from EIA and CenterPoint Energy
Source: eflon on Flickr [CC-BY-2.0] via Wikimedia Commons
|
 investors.centerpointenergy.com
March 2015
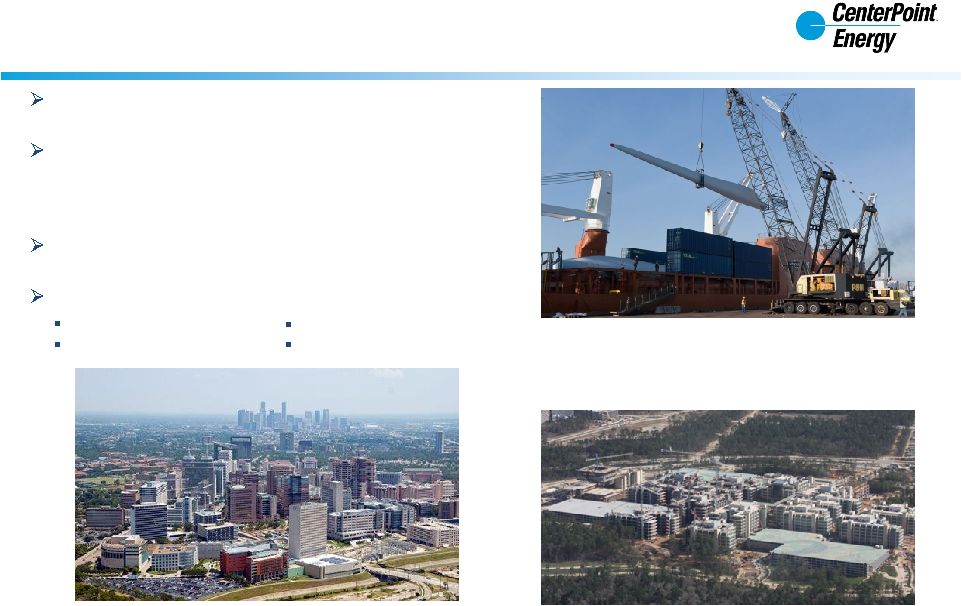
3 highest concentration of Fortune 500 company
headquarters in US (26)
Over the past 10 years and compared to the 10 largest
U.S. cities, Houston
created the most jobs (645,000+),
had the highest job growth CAGR, and made up 8% of
all U.S. jobs created
$30.5 billion in construction contracts awarded in the
Houston metro area in 2014
Diversified Economy
Oil/Gas, Petrochemical
Health Care
Houston Economy: Diverse and Growing
11
Texas Medical Center -
Largest medical center in the
world
Source: Wikipedia
Port of Houston –
Ranked first in the U. S. in foreign
waterborne tonnage, U.S. imports, U.S. export
tonnage, and second in the U.S. in total tonnage
Source: Port of Houston Authority
Exxon Mobil’s 385 acre campus is designed to
accommodate 10,000 employees by the end of 2015
Source: Houston Chronicle
Aerospace
Distribution/Logistics
rd |
 investors.centerpointenergy.com
March 2015
39 largest metropolitan economy in the
world² Largest absolute population growth of US cities
from July 2012 –
July 2013³
In the next 25 years, population forecasted to
grow to 9.5-11 million from a base of 6.3 million
in 2013
4
Industrial growth, such as the Freeport
LNG terminal above, and population
growth is driving higher capital
investment at Houston Electric
Source: Freeportlng.com
Houston Economy: Outpacing the Nation
Economy Drives Continued 2% Customer Growth
12
th
1.
IHS Global InSight Mar. 2015 Forecast
4. Greater Houston Partnership
2.
Brookings Institution
5. U.S. Bureau of Labor Statistics
3.
U.S. Census Bureau |
 investors.centerpointenergy.com
March 2015
Houston Electric’s Capital Investment Continues to Grow
13
$4.4 Billion 2015 –
2019 Capital Plan
Brazos
Valley
Connection
–
High
voltage
transmission
line¹
Reliability/Resiliency
–
Intelligent
grid
Technology
–
Advanced
Metering
System,
Customer
Service
Platform
Customer
Growth
–
customer
meter
additions
Infrastructure
Improvements
–
grid
hardening
Capital Plan Includes:
1
CenterPoint’s
portion
of
the
Houston
Import
Transmission
Project
expected
to
be
in
service
by
summer
of
2018
and
be
an
investment
of
approximately
$300
MM |
 investors.centerpointenergy.com
March 2015
Gas Operations
14 |
 investors.centerpointenergy.com
March 2015
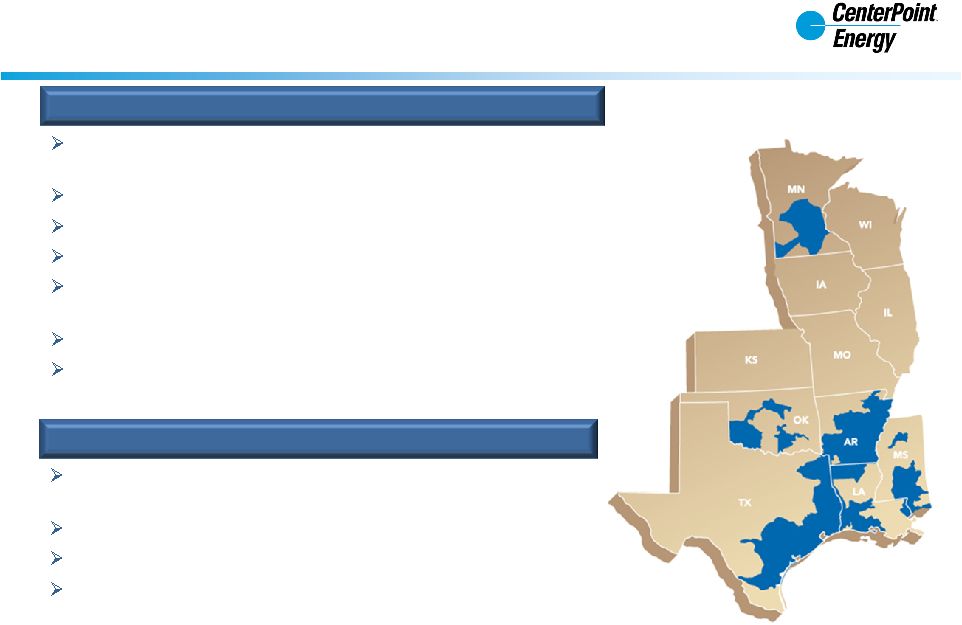
Gas Operations: Overview
15
NATURAL
GAS
UTILITIES
Six state footprint with vibrant metropolitan areas of Houston and
Minneapolis
Nearly 3.4 million customers; 5
largest gas utility in the U.S.
Earning at or near allowed returns; aggregated authorized ROE: 10%
Average Rate Base in 2014 of $2.1 billion
Customer growth of nearly 36,000 in 2014; overall, ~1% annual
customer growth since 2010
Rate base capital structure: 50% debt / 50% equity
Operating income for 2014 was $287 million compared to $263
million in 2013
Competitive natural gas supply and related energy services serving
~18,000 customers across 19 states
Complementary to natural gas utilities
Low VaR business model
Operating income, after adjusting for mark to market accounting,
would have been $23 million in 2014 compared to $15 million in
2013
ENERGY
SERVICES
(NON-REGULATED)
th |
 investors.centerpointenergy.com
March 2015
Natural Gas Utilities
16
Gas utilities are regulated at state and/or local
level
Most gas utilities collect a fixed monthly
customer charge and a volumetric variable
charge for delivering gas to customers
Conservation improvement programs offered
in Arkansas, Oklahoma, and Minnesota
Recorded more than $12 MM in conservation
improvement program incentives in 2014
Weather normalization adjustment and/or
Decoupling mechanisms in place for five of six
states
Capital recovery mechanisms in place in five
of six states reducing regulatory lag
Low natural gas price environment in the U.S. reduces
the potential that increased capital investment will
cause customer rate shock
Typical cost of natural gas to CNP residential customer |
 investors.centerpointenergy.com
March 2015
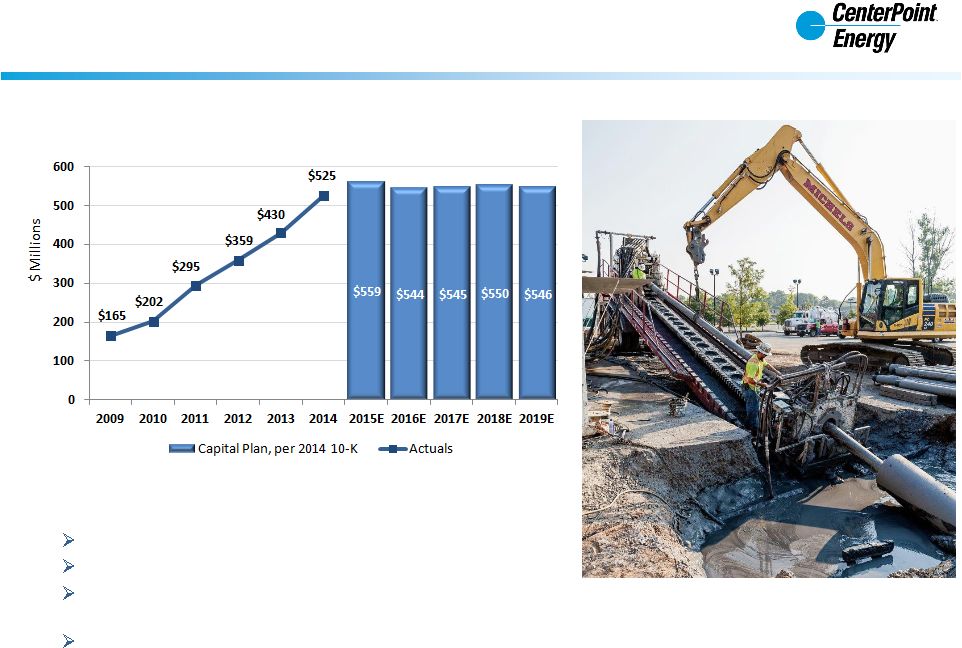
Natural Gas Utilities’
Capital Investment Continues to Grow
17
$2.7 Billion 2015 –
2019 Capital Plan
Replacing
aging
infrastructure
–
cast
iron,
plastic
Customer
growth
investment
–
customer
additions
System-wide Automated Meter Reading; 3.4 million meters
by Q4 2015
Minnesota Belt Line Project; $400 million over 12 years
Capital Plan Includes:
Using horizontal directional drilling to
construct and install a new pipeline under the
bed of the Arkansas River |
 investors.centerpointenergy.com
March 2015
Midstream Investments
18 |
 investors.centerpointenergy.com
March 2015
Committed to Midstream Excellence
19
CenterPoint owns 55.4% of the limited partner units of Enable Midstream Partners (NYSE:
ENBL) CenterPoint holds a 40% interest in the Incentive Distribution Rights held by the
General Partner 2014
Equity
Income
from
Enable:
$303
million;
2014
distributions
received
from
Enable:
$298
million
Investment in Enable provides expected long-term earnings and cash flow growth as the
U.S. natural gas and oil infrastructure build-out continues
Benefits of the Partnership:
Geographic diversification, with operations in major natural gas
and liquids-rich producing areas of Oklahoma, Texas,
Arkansas and Louisiana
Significant asset positions in a broad range of basins, including the Granite Wash, Tonkawa,
Mississippi Lime, Cana Woodford, Haynesville, Fayetteville, Barnett and Woodford plays
Enhanced supply and market access
Meaningful operating and commercial synergies
Stable and predictable cash flows from a balanced and diversified portfolio of assets
Independent access to capital at the Enable level
Enable Midstream Partners is a joint venture formed in
May 2013 that includes CenterPoint Energy, Inc.’s legacy
interstate pipelines and field services businesses and the
midstream business of Enogex LLC, a previous subsidiary
of OGE Energy Corp. It is managed by a general partner
whose governance is shared by CenterPoint Energy and
OGE on a 50/50 basis |
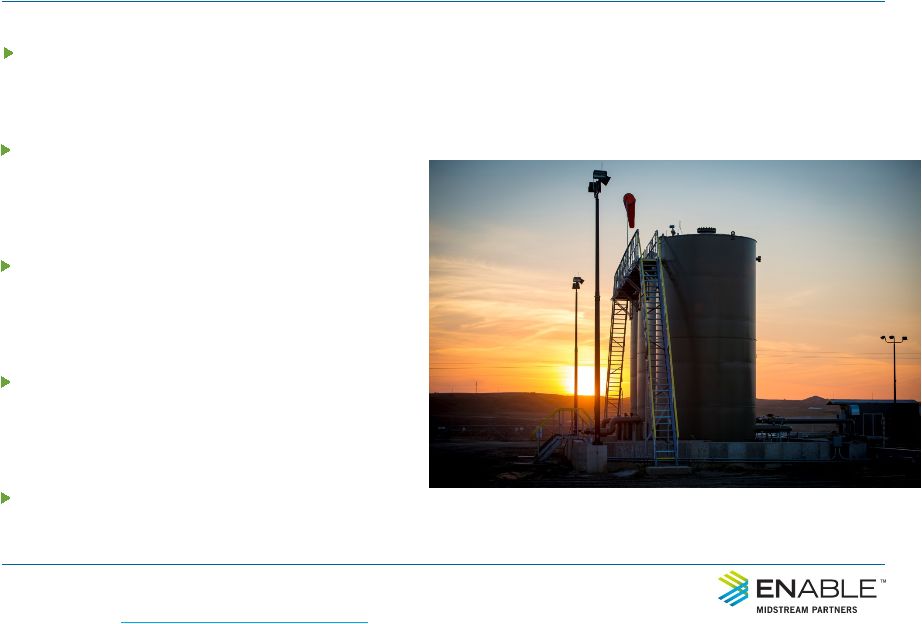
 Extract from Enable Midstream Partners’
March 4, 2015 Investor Presentation
Enable Midstream Highlights
Integrated suite of gathering, processing, transportation and storage assets with a
high degree of interconnectivity between assets and end markets
Significant fee-based and demand-fee margin
Long-term relationships with large-cap producers and utilities, many of
whom are investment grade
Investment grade ratings, lower leverage than many peers and significant
liquidity 20
Source:
http://investors.enablemidstream.com/ |
 Extract from Enable Midstream Partners’
March 4, 2015 investor presentation
Well-Positioned for Today’s Environment
21
Significant
fee-based
margin
with
approximately 79% of 2015 gross margin
forecasted to be fee-based and 54%
forecasted to be firm or MVC-based
Hedging program
provides downside
protection
with 88% of 2015 gross
margin projected to be either fee-based
or hedged
Integrated
assets
allow
Enable
to
adjust
volume flows and optimize our system in
response to changing prices and supply
dynamics
Seasoned
management
team
and
significant experience throughout the
organization
Investment grade ratings, low leverage and substantial liquidity
with a 2.9x
debt-to-Adjusted
EBITDA
ratio¹
and
$1.1
billion
in
revolver
capacity²
as
of
December 31, 2014
1.
Calculated by dividing $2,544 million of debt (including commercial paper and
promissory notes payable to sponsor) by $868 million of Adjusted EBITDA
2.
Calculated by reducing $1.4 billion revolver by $2 million of outstanding letters of
credit and $253 million of outstanding commercial paper Source: http://investors.enablemidstream.com/ |
 investors.centerpointenergy.com
March 2015
Improving Customer Satisfaction while Reducing Carbon Emissions
22 |
 investors.centerpointenergy.com
March 2015
Electric T&D Utility Technology:
Improving Customer Satisfaction while Reducing Carbon Emissions
23
Absence of generation assets significantly reduces
CenterPoint’s carbon footprint compared to
integrated utilities
One of the first large scale
Smart Meter deployments in the
U.S.
Eliminated need for over 8
million truck rolls since 2009
Intelligent Grid initiative enhances
reliability
28% Reliability improvement in 2014
These efforts strengthen the tie between the
customer and the utility
1
Since 2011
1 |
 investors.centerpointenergy.com
March 2015
Electric T&D Utility
Improving Customer Satisfaction while Reducing Carbon Emissions
24
Source: Philips, Roadstar GPLS
LED streetlight project: 173,000 street
lights over 5 years
Initiatives in place to protect wildlife
Awarded the Tree Line USA
designation for 10 consecutive year
Hike and Bike
trails along our
transmission
corridors within
Houston
th |
 investors.centerpointenergy.com
March 2015
Natural Gas Utilities:
Improving Customer Satisfaction while Reducing Carbon Emissions
25
Pipeline replacement programs,
especially cast-iron and bare steel,
accelerate the replacement of aging
gas pipelines increasing the efficiency
and safety of our gas distribution
system
CNP is a first-mover in new gas leak
detection technology which will be
begin to be deployed across our entire
footprint in 2015 and will improve our
ability to quickly identify and repair
gas leaks
Drive-by Advanced Meter
Technology eliminates the
need to enter homeowners’
property during monthly
meter reads and reduces
our carbon footprint |
 investors.centerpointenergy.com
March 2015
Committed to Community Service
26
Walking and Riding for Good Causes:
Money raised by employees in company-sponsored events
Year
United Negro
College Fund
March of Dimes
Juvenile
Diabetes
Research
Foundation
MS-150
Junior
Achievement
TOTAL
2013
$35,029
$299,934
$67,780
$60,863
$39,952
$502,543
2012
$28,261
$160,767
$74,454
$89,900
$40,100
$393,482
2011
$28,000
$192,000
$76,759
$109,958
$48,000
$454,717
2010
$27,000
$143,000
$76,000
$115,000
$41,000
$402,000
223,005 volunteer hours from employees, retirees, family and friends (Valued at more than $5.1
million.) $5.6 million in total corporate charitable contributions
$2.8 million in corporate/employee contributions to United Way in more than 94 United Way
offices across the nation
5,079 units of blood donated to Gulf Coast Regional Blood Center
|
 investors.centerpointenergy.com
March 2015
Additional Reference Materials
27
Category
Reference Material
Link
Financial Information
Quarterly Financial Tables
http://investors.centerpointenergy.com/highlights.cfm
Debt & Maturity Schedules
Equity Return Amortization Schedules
Supplemental Year End Materials
Regulatory Information
State Commission Website Access Points
http://investors.centerpointenergy.com/highlights.cfm
Houston Electric
Natural Gas Utilities
Industry Associations
Edison Electric Institute (EEI)
www.eei.org
American Gas Association (AGA)
www.aga.org
Investor Relations Contact Information –
011-713-207-6500
Carla
Kneipp
-
Vice
President
and
Treasurer
;
carla.kneipp@centerpointenergy.com
Dave
Mordy
–
Director;
david.mordy@centerpointenergy.com
Robert
Mcrae
–
Manager;
robert.mcrae@centerpointenergy.com
Brandi
Summersill
–
IR
Coordinator;
brandi.summersill@centerpointenergy.com |