Attached files
| file | filename |
|---|---|
| 8-K - FORM 8-K - TOYOTA MOTOR CREDIT CORP | dp54623_8k.htm |
Exhibit 99.1
 |
[GRAPHIC OMITTED]
Toyota Business Highlights 3Q FY2015
TOYOTA MOTOR SALES (TMS), U.S.A. INC. MONTHLY RESULTS
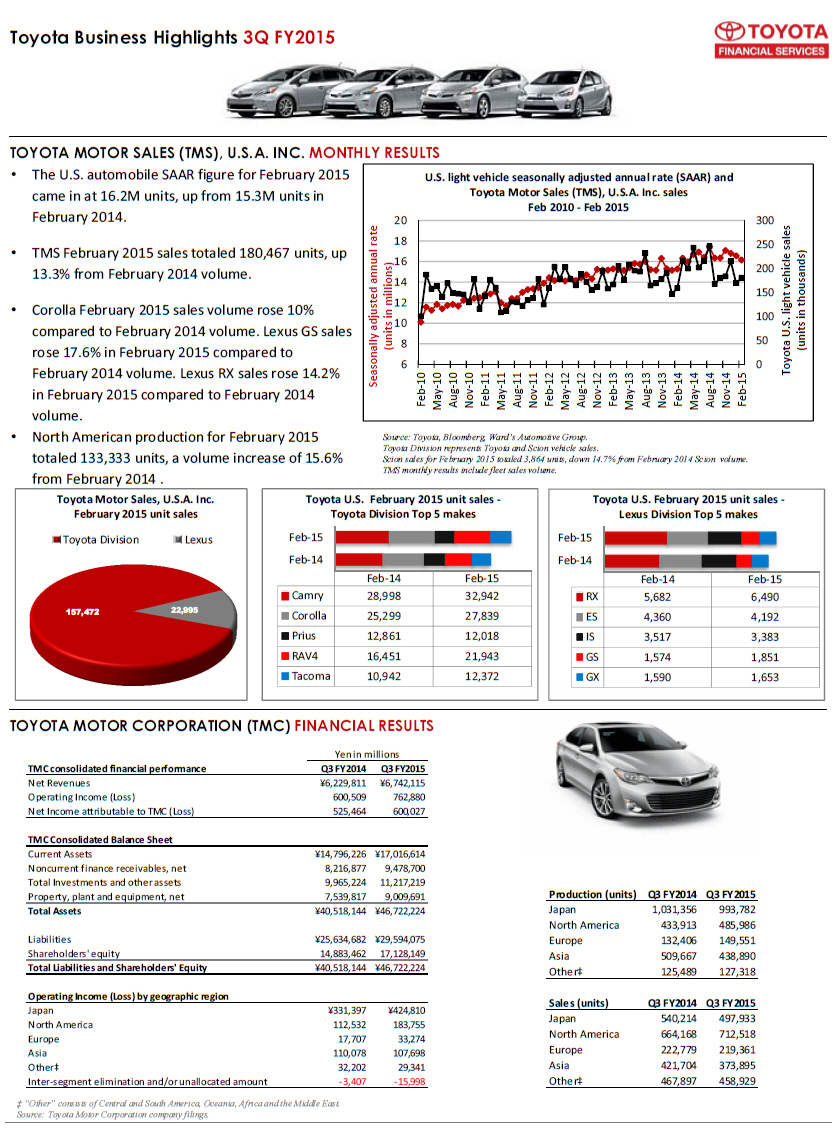
[] The U.S. automobile SAAR figure for February 2015 came in at 16.2M units,
up from 15.3M units in February 2014.
[] TMS February 2015 sales totaled 180,467 units, up 13.3% from February 2014
volume.
[] Corolla February 2015 sales volume rose 10% compared to February 2014
volume. Lexus GS sales rose 17.6% in February 2015 compared to February
2014 volume. Lexus RX sales rose 14.2% in February 2015 compared to
February 2014 volume.
[] North American production for February 2015 totaled 133,333 units, a
volume increase of 15.6% from February 2014 .
U. S. light vehicle seasonally adjusted annual rate (SAAR) and Toyota Motor
Sales (TMS), U.S.A. Inc. sales Feb 2010 - Feb 2015
[GRAPHIC OMITTED]
Source: Toyota, Bloomberg, Ward's Automotive Group. Toyota Division represents
Toyota and Scion vehicle sales.
Scion sales for February 2015 totaled 3,864 units, down 14.7% from February 2014
Scion volume.
TMS monthly results include fleet sales volume.
Toyota Motor Sales, U.S.A. Inc.
February 2015 unit sales
[GRAPHIC OMITTED]
Toyota U. S. February 2015 unit sales -Toyota Division Top 5 makes
[GRAPHIC OMITTED]
Feb-14 Feb-15
Camry 28,998 32,942
Corolla 25,299 27,839
Prius 12,861 12,018
RAV4 16,451 21,943
Tacoma 10,942 12,372
Toyota U. S. February 2015 unit sales -Lexus Division Top 5 makes
[GRAPHIC OMITTED]
Feb-14 Feb-15
RX 5,682 6,490
ES 4,360 4,192
IS 3,517 3,383
GS 1,574 1,851
GX 1,590 1,653
TOYOTA MOTOR CORPORATION (TMC) FINANCIAL RESULTS
Yen in millions
TMC consolidated financial performance Q3 FY2014 Q3 FY2015
Net Revenues Yen 6,229,811 Yen 6,742,115
Operating Income (Loss) 600,509 762,880
Net Income attributable to TMC (Loss) 525,464 600,027
TMC Consolidated Balance Sheet
Current Assets Yen 14,796,226 Yen 17,016,614
Noncurrent finance receivables, net 8,216,877 9,478,700
Total Investments and other assets 9,965,224 11,217,219
Property, plant and equipment, net 7,539,817 9,009,691
Total Assets Yen 40,518,144 Yen 46,722,224
Liabilities Yen 25,634,682 Yen 29,594,075
Shareholders' equity 14,883,462 17,128,149
Total Liabilities and Shareholders' Equity Yen 40,518,144 Yen 46,722,224
Operating Income (Loss) by geographic region
Japan Yen 331,397 Yen 424,810
North America 112,532 183,755
Europe 17,707 33,274
Asia 110,078 107,698
Other[] 32,202 29,341
Inter-segment elimination and/or unallocated amount -3,407 -15,998
Production (units) Q3 FY2014 Q3 FY2015
Japan 1,031,356 993,782
North America 433,913 485,986
Europe 132,406 149,551
Asia 509,667 438,890
Other[++] 125,489 127,318
Sales (units) Q3 FY2014 Q3 FY2015
Japan 540,214 497,933
North America 664,168 712,518
Europe 222,779 219,361
Asia 421,704 373,895
Other[++] 467,897 458,929
[++] "Other" consists of Central and South America, Oceania, Africa and the
Middle East. Source: Toyota Motor Corporation company filings.
|
 |
TOYOTA MOTOR CREDIT CORPORATION (TMCC) FINANCIAL RESULTS

                                                 U.S. dollars
                                                 in millions
TMCC financial performance       3Q 2014         3Q 2015
Total financing revenues         $1,876          $2,112
Income before income taxes       306             492
Net Income                       193             307
Debt-to-Equity Ratio             11.2x           10.6x


[GRAPHIC OMITTED]

[GRAPHIC OMITTED]

[GRAPHIC OMITTED]

[GRAPHIC OMITTED]

[]    Our  consolidated  net  income  was $307 million in Q3 FY2015, compared to
      $193  million  in  Q3  FY2014.  The  increase  in net income for the third
      quarter  of  FY2015  was  primarily  due to an increase in total financing
      revenue  of  $236 million. In addition, interest expense decreased by $225
      million driven by gains on derivatives, which was offset by an increase of
      $215  million  in  depreciation on operating leases and an increase of $72
      million in the provision for income taxes.

[]    Total  financing  revenues increased 12.6 percent during the third quarter
      of FY2015, as compared to the same period in FY2014 .

[]    Net  charge-offs as a percentage of average gross earning assets increased
      by 0.05% in Q3 FY2015 compared to Q3 FY2014.

[]    Aggregate  balances  for accounts 60 or more days past due as a percentage
      of  gross  earning  assets  increased by 0.02% in Q3 FY2015 compared to Q3
      FY2014.

1     TFS  market share represents the percentage of total domestic TMS sales of
      new   Toyota,   Lexus   and  Scion  vehicles  financed  by  us,  excluding
      non-Toyota/Lexus/Scion sales, sales under dealer rental car and commercial
      fleet programs and sales of a private Toyota distributor.

*     TMCC consumer portfolio includes TMCC and its consolidated subsidiaries

NORTH AMERICAN SHORT-TERM FUNDING PROGRAMS

[]    Toyota Motor Credit Corporation (TMCC), Toyota Credit de Puerto Rico Corp.
      (TCPR),   and   Toyota   Credit  Canada  Inc.  (TCCI)[+]  maintain  direct
      relationships  with  institutional  commercial paper investors through its
      Sales  and  Trading  team , providing each access to a variety of domestic
      and global markets through three, distinct 3(a)(3) programs.

[]    As  of  12/31/2014,  TMCC  and  TCPR  commercial  paper  programs  had  an
      outstanding  balance  of  $27.5  billion.  As of 12/31/2014, TMCC and TCPR
      commercial  paper programs had a weighted average remaining maturity of 80
      days.

[]    TCCI and TMCC are subsidiaries of Toyota Financial Services Corporation, a
      wholly-owned subsidiary of Toyota Motor Corporation.

[]    TMCC  consolidated financial liabilities include TMCC and its consolidated
      subsidiaries, which includes TCPR.

TMCC consolidated financial liabilities comparison
[GRAPHIC OMITTED]

* Figures above do not incorporate the Carrying Value Adjustments.

LET'S GO PLACES

[]    In  2017,  Toyota Financial Services plans to relocate its headquarters to
      Plano,  Texas  in  order  to join Toyota Motor Sales, U.S.A., Inc.; Toyota
      Motor  Engineering and Manufacturing North America, Inc.; and Toyota Motor
      North America as the Toyota affiliates unify their respective headquarters
      there  to create a single, state-of-the-art Toyota headquarters and pursue
      the One Toyota vision in North America.

[]    Continue    to    reference    the    Investor    Relations   section   of
      www.toyotafinancial.com  ,  for important information and filings. Forward
      looking statements are subject to risks and uncertainties that could cause
      actual  results  to  fall  short  of  current expectations. Toyota and its
      affiliates discuss these risks and uncertainties in filings they make with
      the  Securities  and  Exchange  Commission.  This  presentation  does  not
      constitute  an  offer  to  purchase  any  securities. Any offer or sale of
      securities  will  be  made  only  by  means  of  a  prospectus and related
      documentation.

The Toyota Financial Services Sales and Trading team engages in direct dialogue
with institutional investors delivering a variety of fixed income products to
meet our clients' investment objectives and risk tolerances. We focus on
providing simple, personal, and proactive service in the execution of all
trades.

Sales and Trading Contacts

Nicholas Ro                      Darren Marco                    Jason Katzen
Sales and Trading Manager        Region Manager                  Region Manager
(310) 468-7758                   (310) 468-5330                  (310) 468-3509
nicholas_ro@toyota. com          darren_marco@toyota. com        jason_katzen@toyota.com

Jeffrey DeSilva                  Alec Small                      Siva Vadlamannati
Funding and Liquidity Analyst    Funding and Liquidity Analyst   Funding and Liquidity Analyst
(310) 468-1366                   (310) 468-7431                  (310) 468-3509
jeffrey_DeSilva@toyota. com      alec_small@toyota. com         siva_Vadlamannati@Toyota.com
|