Attached files
| file | filename |
|---|---|
| 8-K - 8-K - HD Supply Holdings, Inc. | a15-7419_18k.htm |
| EX-99.1 - EX-99.1 - HD Supply Holdings, Inc. | a15-7419_1ex99d1.htm |
Exhibit 99.2
|
|
1 2014 Fourth-Quarter and Fiscal Year Performance March 24, 2015 Financial Results and Company Highlights |

|
|
2 Disclaimers Forward-Looking Statements This presentation includes “forward-looking statements” within the meaning of Section 27A of the Securities Act and Section 21E of the Exchange Act. Forward-looking statements are subject to known and unknown risks and uncertainties, many of which may be beyond our control. We caution you that the forward-looking information presented herein is not a guarantee of future events, and that actual events may differ materially from those made in or suggested by the forward-looking information contained in this presentation. In addition, forward-looking statements generally can be identified by the use of forward-looking terminology such as “may,” “plan,” “seek,” “comfortable with,” “will,” “expect,” “intend,” “estimate,” “anticipate,” “believe” or “continue” or the negative thereof or variations thereon or similar terminology. A number of important factors could cause actual events to differ materially from those contained in or implied by the forward-looking statements, including those factors discussed in our filings with the U.S. Securities & Exchange Commission’s (the “SEC”), including our annual report on Form 10-K, for the year ended February 1, 2015, which can be found at the SEC’s website www.sec.gov. Any forward-looking information presented herein is made only as of the date of this presentation, and we do not undertake any obligation to update or revise any forward-looking information to reflect changes in assumptions, the occurrence of unanticipated events, or otherwise. Non-GAAP Financial Measures HD Supply supplements its reporting net income (loss) with non-GAAP measurements, including Adjusted EBITDA, Adjusted net income (loss) and Adjusted net income (loss) per share. This supplemental information should not be considered in isolation or as a substitute for the GAAP measurements. Additional information regarding Adjusted EBITDA, Adjusted net income (loss) and Adjusted net income (loss) per share referred to in this presentation is included at the end of this presentation under “Reconciliation of Non-GAAP Measures.” Note In accordance with Accounting Standard Codification 205-20, Discontinued Operations, the results of Hardware Solutions are classified as discontinued operations for all periods presented. |
|
|
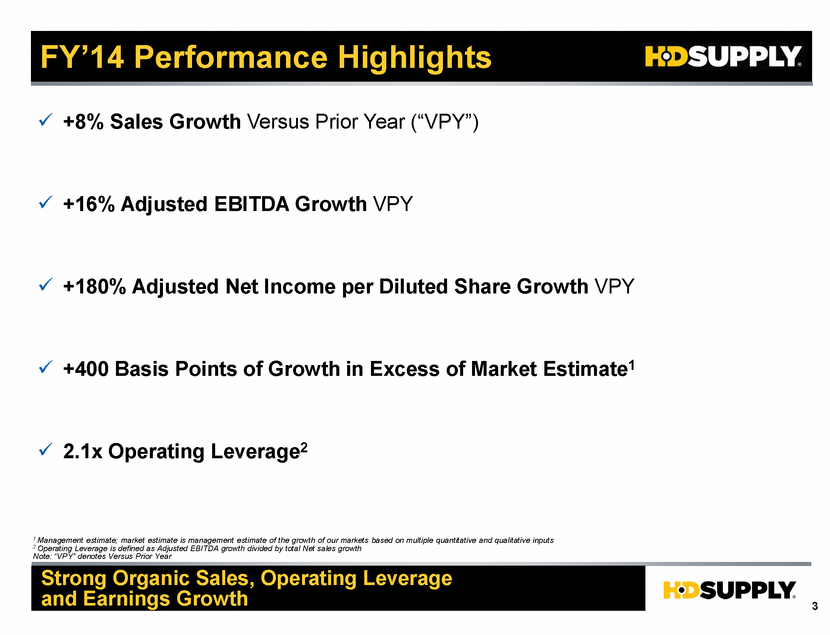
3 FY’14 Performance Highlights Strong Organic Sales, Operating Leverage and Earnings Growth . +8% Sales Growth Versus Prior Year (“VPY”) . +16% Adjusted EBITDA Growth VPY . +180% Adjusted Net Income per Diluted Share Growth VPY . +400 Basis Points of Growth in Excess of Market Estimate1 . 2.1x Operating Leverage2 1 Management estimate; market estimate is management estimate of the growth of our markets based on multiple quantitative and qualitative inputs 2 Operating Leverage is defined as Adjusted EBITDA growth divided by total Net sales growth Note: “VPY” denotes Versus Prior Year |
|
|
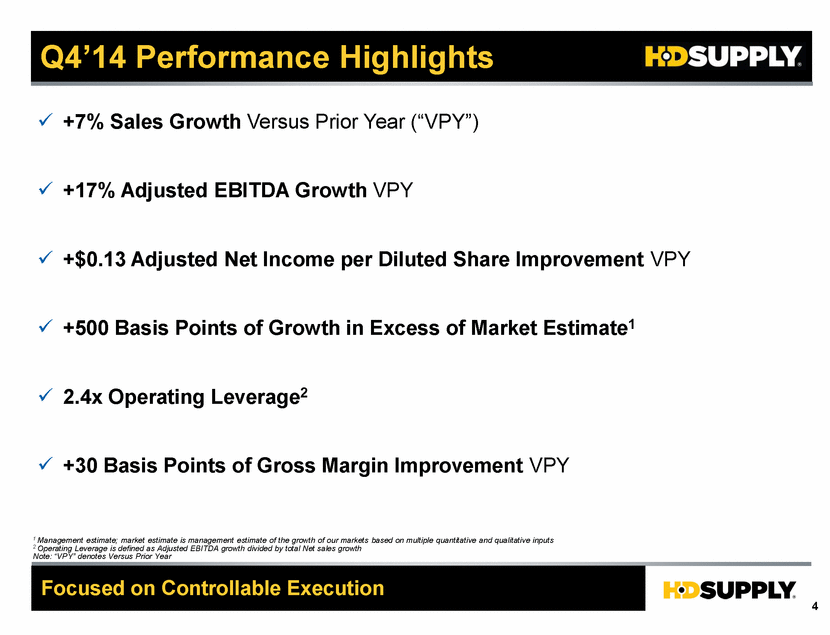
4 Q4’14 Performance Highlights Focused on Controllable Execution . +7% Sales Growth Versus Prior Year (“VPY”) . +17% Adjusted EBITDA Growth VPY . +$0.13 Adjusted Net Income per Diluted Share Improvement VPY . +500 Basis Points of Growth in Excess of Market Estimate1 . 2.4x Operating Leverage2 . +30 Basis Points of Gross Margin Improvement VPY 1 Management estimate; market estimate is management estimate of the growth of our markets based on multiple quantitative and qualitative inputs 2 Operating Leverage is defined as Adjusted EBITDA growth divided by total Net sales growth Note: “VPY” denotes Versus Prior Year |
|
|
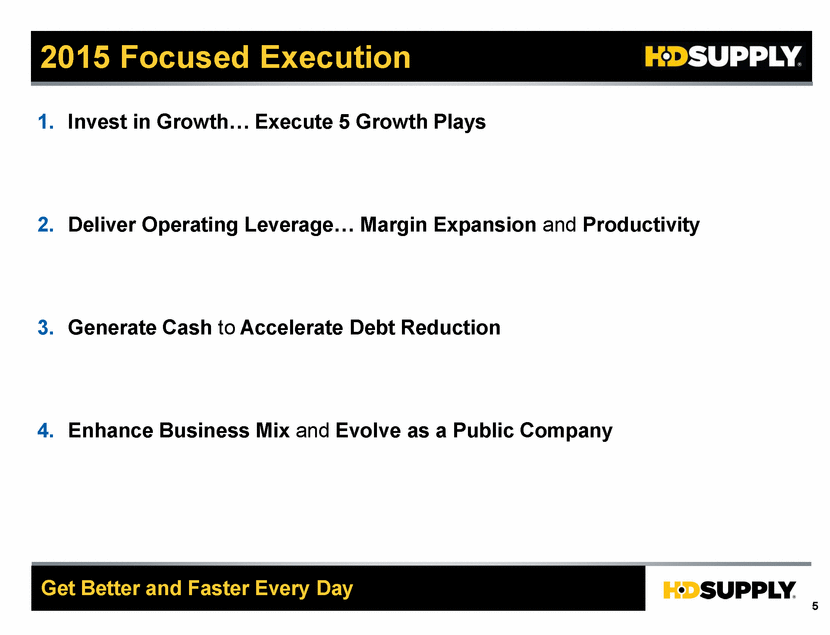
5 2015 Focused Execution Get Better and Faster Every Day 1. Invest in Growth... Execute 5 Growth Plays 2. Deliver Operating Leverage ... Margin Expansion and Productivity 3. Generate Cash to Accelerate Debt Reduction 4. Enhance Business Mix and Evolve as a Public Company |
|
|
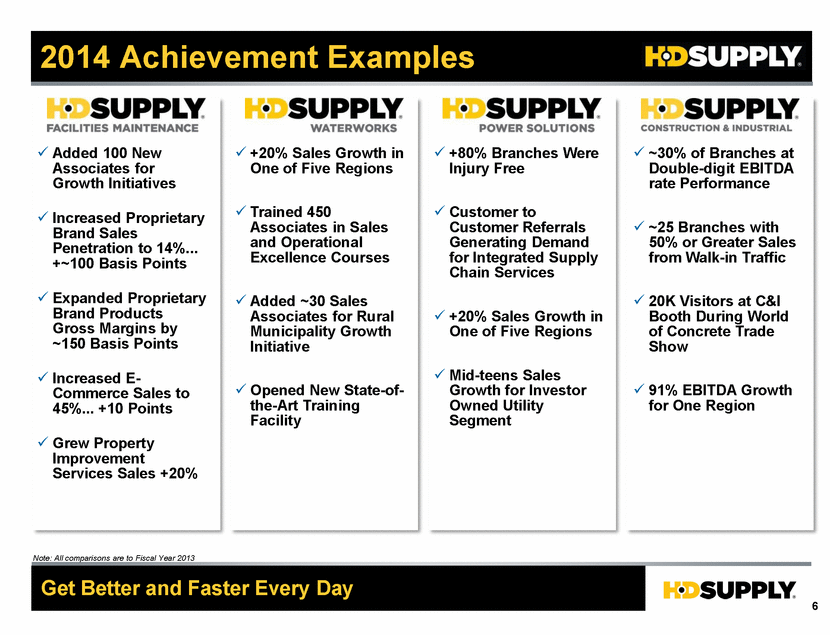
6 2014 Achievement Examples Get Better and Faster Every Day . Added 100 New Associates for Growth Initiatives . Increased Proprietary Brand Sales Penetration to 14%... +~100 Basis Points . Expanded Proprietary Brand Products Gross Margins by ~150 Basis Points . Increased E-Commerce Sales to 45%... +10 Points . Grew Property Improvement Services Sales +20% . +20% Sales Growth in One of Five Regions . Trained 450 Associates in Sales and Operational Excellence Courses . Added ~30 Sales Associates for Rural Municipality Growth Initiative . Opened New State-of the-Art Training Facility . +80% Branches Were Injury Free . Customer to Customer Referrals Generating Demand for Integrated Supply Chain Services . +20% Sales Growth in One of Five Regions . Mid-teens Sales Growth for Investor Owned Utility Segment . ~30% of Branches at Double-digit EBITDA rate Performance . ~25 Branches with 50% or Greater Sales from Walk-in Traffic . 20K Visitors at C&I Booth During World of Concrete Trade Show . 91% EBITDA Growth for One Region Note: All comparisons are to Fiscal Year 2013 |
|
|
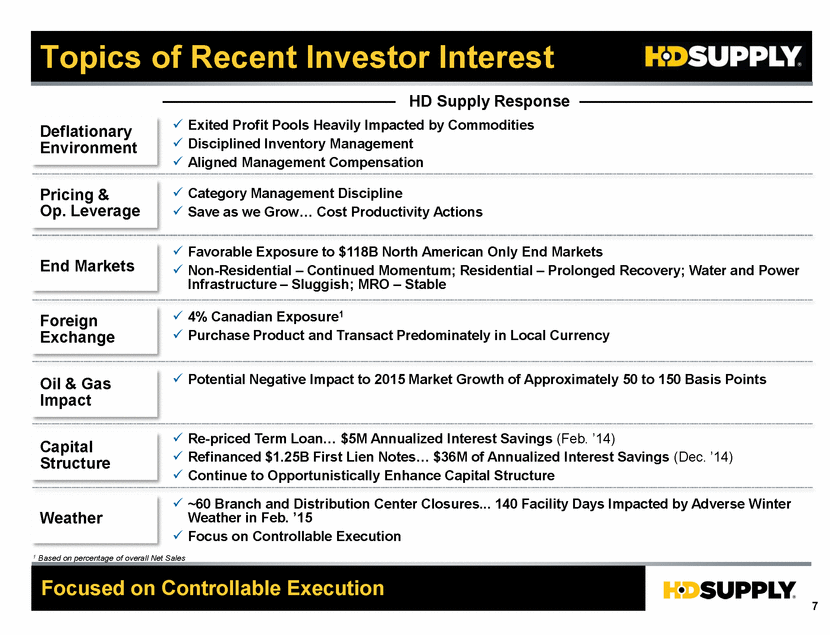
7 Topics of Recent Investor Interest Focused on Controllable Execution Deflationary Environment Pricing & Op. Leverage End Markets Foreign Exchange Oil & Gas Impact Capital Structure Weather . Exited Profit Pools Heavily Impacted by Commodities . Disciplined Inventory Management . Aligned Management Compensation . Category Management Discipline . Save as we Grow... Cost Productivity Actions . Favorable Exposure to $118B North American Only End Markets . Non-Residential – Continued Momentum; Residential – Prolonged Recovery; Water and Power Infrastructure – Sluggish; MRO – Stable . 4% Canadian Exposure1 . Purchase Product and Transact Predominately in Local Currency . Potential Negative Impact to 2015 Market Growth of Approximately 50 to 150 Basis Points . Re-priced Term Loan $5M Annualized Interest Savings (Feb. ’14) . Refinanced $1.25B First Lien Notes $36M of Annualized Interest Savings (Dec. ’14) . Continue to Opportunistically Enhance Capital Structure . ~60 Branch and Distribution Center Closures 140 Facility Days Impacted by Adverse Winter Weather in Feb. ’15 . Focus on Controllable Execution HD Supply Response 1 Based on percentage of overall Net Sales |
|
|
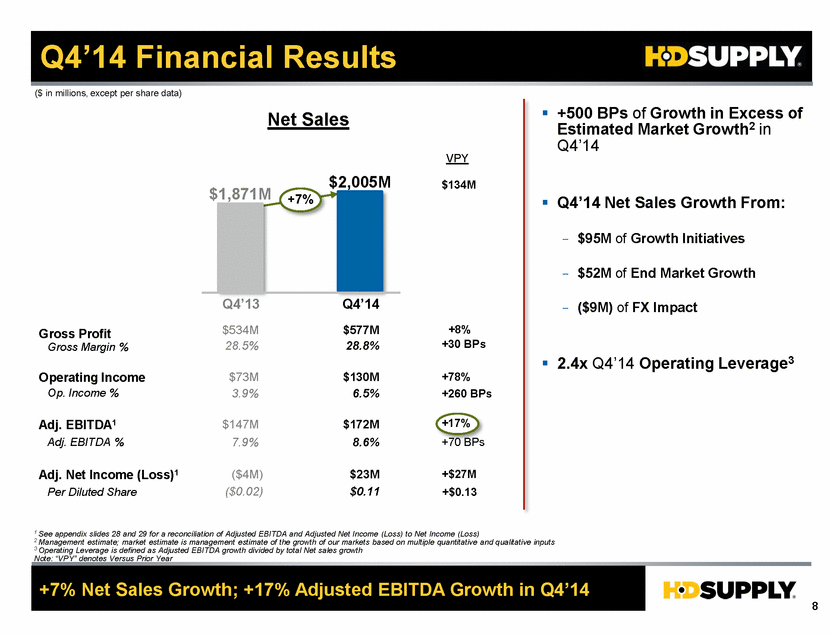
8 Q4’14 Financial Results $1,871M $2,005M +7% Gross Profit Gross Margin % Operating Income Adj. EBITDA % Op. Income % $534M $577M 28.5% 28.8% $147M $172M $73M $130M 7.9% 8.6% 6.5% +8% +30 BPs +70 BPs +17% +7% Net Sales Growth; +17% Adjusted EBITDA Growth in Q4’14 ($ in millions, except per share data) ($4M) $23M +$27M . +500 BPs of Growth in Excess of Estimated Market Growth2 in Q4’14 . Q4’14 Net Sales Growth From: - $95M of Growth Initiatives - $52M of End Market Growth - ($9M) of FX Impact . 2.4x Q4’14 Operating Leverage3 +78% Net Sales 1 See appendix slides 28 and 29 for a reconciliation of Adjusted EBITDA and Adjusted Net Income (Loss) to Net Income (Loss) 2 Management estimate; market estimate is management estimate of the growth of our markets based on multiple quantitative and qualitative inputs 3 Operating Leverage is defined as Adjusted EBITDA growth divided by total Net sales growth Note: “VPY” denotes Versus Prior Year Q4’13 Adj. EBITDA1 VPY Adj. Net Income (Loss)1 3.9% +260 BPs Q4’14 ($0.02) $0.11 +$0.13 Per Diluted Share $134M |
|
|
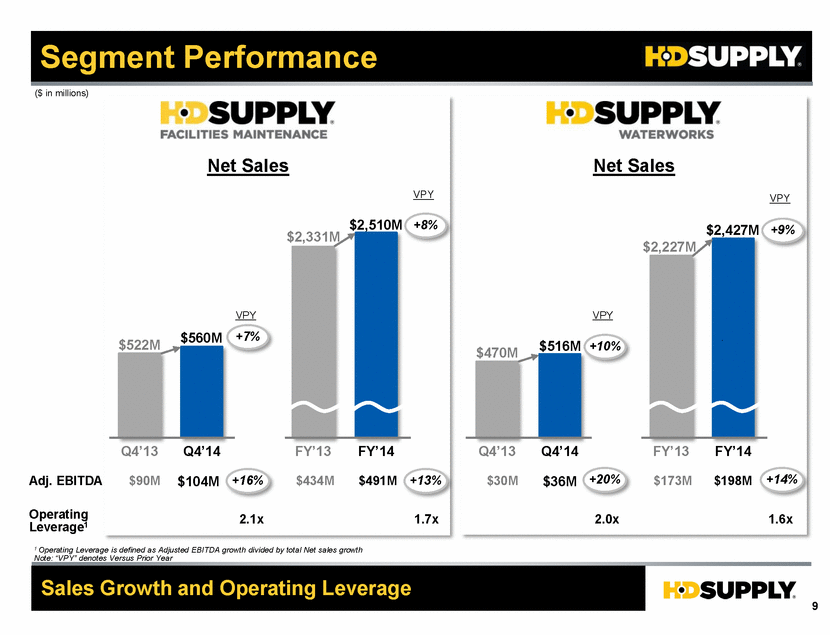
9 Segment Performance Adj. EBITDA ($ in millions) Sales Growth and Operating Leverage VPY +13% FY’14 $2,510M $491M 1.7x Q4’14 $560M $104M +7% +16% VPY +9% +14% $516M $36M VPY +10% +20% Net Sales $2,427M $198M 1.6x . $434M +8% $2,331M VPY $90M $522M FY’14 Q4’14 FY’13 Q4’13 $173M $2,227M $30M $470M FY’13 Q4’13 Operating Leverage1 1 Operating Leverage is defined as Adjusted EBITDA growth divided by total Net sales growth Note: “VPY” denotes Versus Prior Year Net Sales 2.0x 2.1x |
|
|
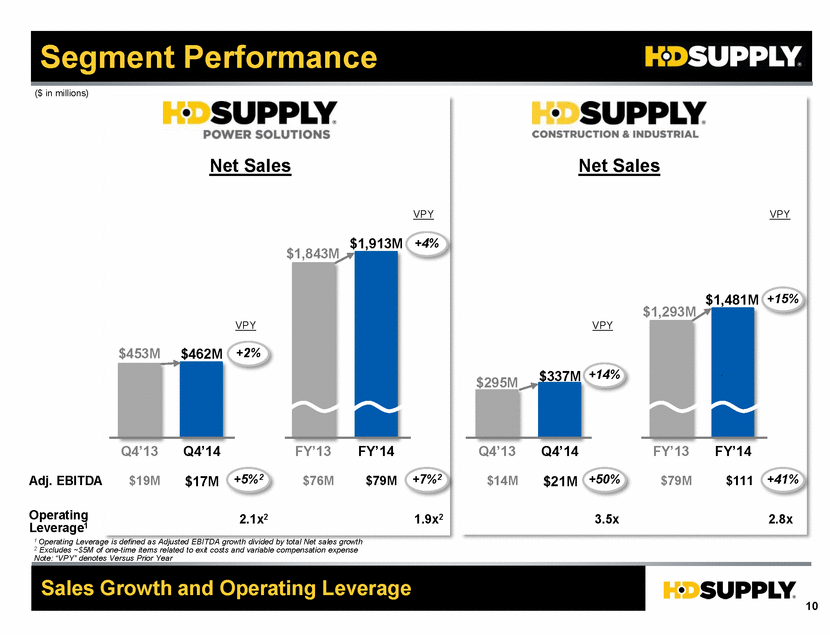
10 Segment Performance ($ in millions) Sales Growth and Operating Leverage +4% +7%2 $1,913M $79M $462M $17M +2% +5%2 +15% +41% $1,481M $111 . $337M $21M +14% +50% VPY VPY $76M $1,843M VPY $19M $453M $79M $1,293M $14M $295M VPY Net Sales Net Sales 1 Operating Leverage is defined as Adjusted EBITDA growth divided by total Net sales growth 2 Excludes ~$5M of one-time items related to exit costs and variable compensation expense Note: “VPY” denotes Versus Prior Year Adj. EBITDA Operating Leverage1 FY’14 FY’14 FY’13 FY’13 1.9x2 2.8x 3.5x 2.1x2 Q4’14 Q4’14 Q4’13 Q4’13 |
|
|
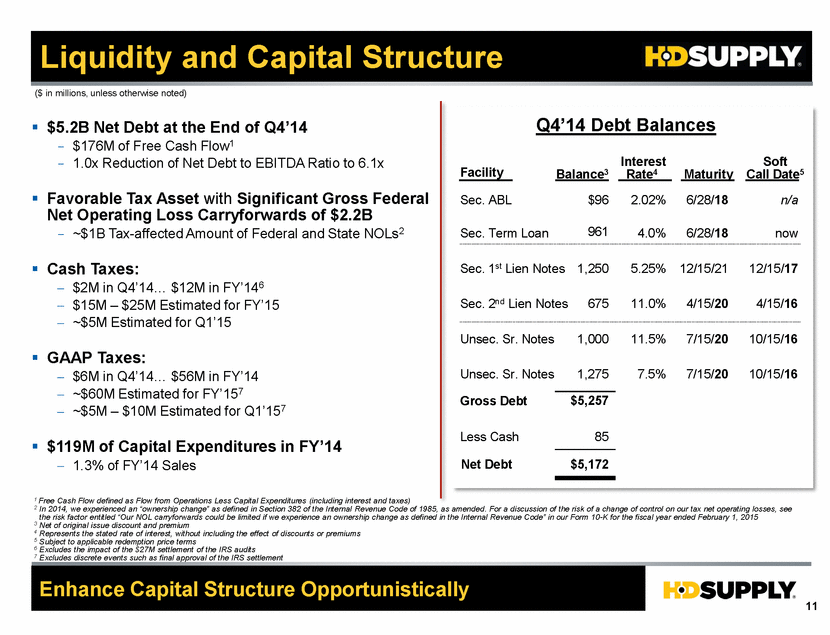
11 Liquidity and Capital Structure Q4’14 Debt Balances Sec. ABL Sec. Term Loan Sec. 1st Lien Notes Sec. 2nd Lien Notes Unsec. Sr. Notes Unsec. Sr. Notes $96 1,250 675 1,000 1,275 6/28/18 6/28/18 12/15/21 4/15/20 7/15/20 7/15/20 Gross Debt Less Cash Net Debt $5,172 85 $5,257 Facility Balance3 Maturity 1 Free Cash Flow defined as Flow from Operations Less Capital Expenditures (including interest and taxes) 2 In 2014, we experienced an “ownership change” as defined in Section 382 of the Internal Revenue Code of 1985, as amended. For a discussion of the risk of a change of control on our tax net operating losses, see the risk factor entitled “Our NOL carryforwards could be limited if we experience an ownership change as defined in the Internal Revenue Code” in our Form 10-K for the fiscal year ended February 1, 2015 3 Net of original issue discount and premium 4 Represents the stated rate of interest, without including the effect of discounts or premiums 5 Subject to applicable redemption price terms 6 Excludes the impact of the $27M settlement of the IRS audits 7 Excludes discrete events such as final approval of the IRS settlement Enhance Capital Structure Opportunistically ($ in millions, unless otherwise noted) 2.02% 4.0% 5.25% 11.0% 11.5% 7.5% Interest Rate4 961 n/a now 12/15/17 4/15/16 10/15/16 10/15/16 Soft Call Date5 . $5.2B Net Debt at the End of Q4’14 - $176M of Free Cash Flow1 - 1.0x Reduction of Net Debt to EBITDA Ratio to 6.1x . Favorable Tax Asset with Significant Gross Federal Net Operating Loss Carryforwards of $2.2B - ~$1B Tax-affected Amount of Federal and State NOLs2 . Cash Taxes: $2M in Q4’14 $12M in FY’146 $15M – $25M Estimated for FY’15 ~$5M Estimated for Q1’15 . GAAP Taxes: $6M in Q4’14... $56M in FY’14 ~$60M Estimated for FY’157 ~$5M – $10M Estimated for Q1’157 . $119M of Capital Expenditures in FY’14 1.3% of FY’14 Sales |
|
|
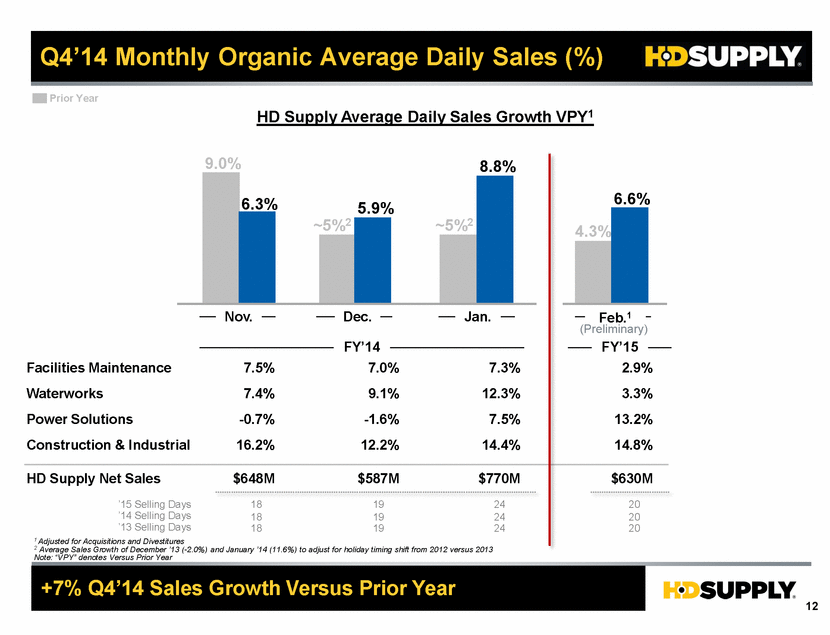
12 Q4’14 Monthly Organic Average Daily Sales (%) HD Supply Average Daily Sales Growth VPY1 +7% Q4’14 Sales Growth Versus Prior Year 1 Adjusted for Acquisitions and Divestitures 2 Average Sales Growth of December ’13 (-2.0%) and January ’14 (11.6%) to adjust for holiday timing shift from 2012 versus 2013 Note: “VPY” denotes Versus Prior Year 7.3% 12.3% 7.5% 14.4% 6.6% Feb.1 2.9% 3.3% 13.2% 14.8% 7.0% ’15 Selling Days 24 20 19 9.1% -1.6% 12.2% ’13 Selling Days 24 20 19 Facilities Maintenance Waterworks Power Solutions Construction & Industrial (Preliminary) 6.3% 5.9% 8.8% 7.5% 7.4% -0.7% 16.2% 18 18 9.0% 4.3% Nov. Dec. Jan. Prior Year $770M $630M $587M HD Supply Net Sales $648M ~5%2 ~5%2 ’14 Selling Days 24 20 19 18 FY’14 FY’15 |
|
|
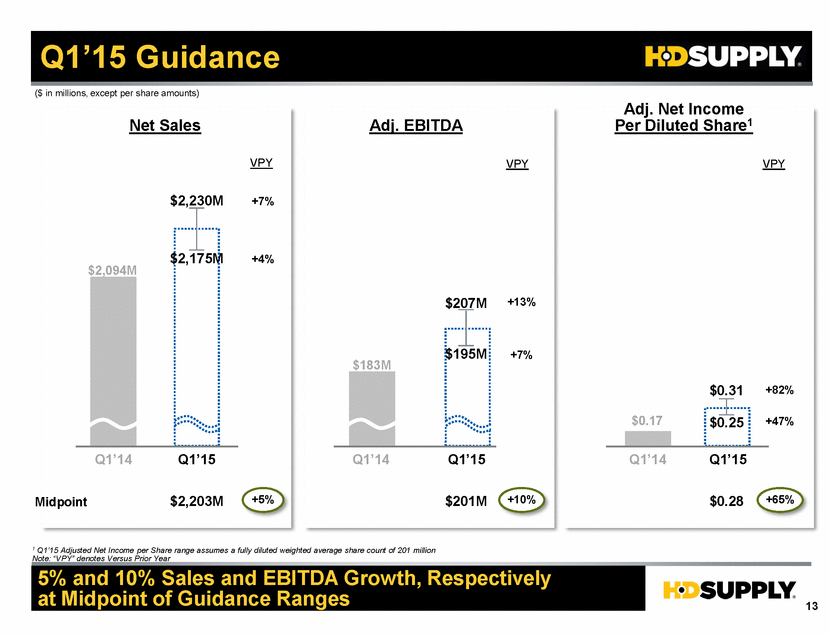
13 +13% +7% +7% +4% Q1’15 Guidance 5% and 10% Sales and EBITDA Growth, Respectively at Midpoint of Guidance Ranges $2,230M $2,175M $183M $2,094M $207M $195M VPY Q1’14 Q1’15 Q1’14 Q1’15 Q1’15 Net Sales Adj. EBITDA Adj. Net Income Per Diluted Share1 VPY 1 Q1’15 Adjusted Net Income per Share range assumes a fully diluted weighted average share count of 201 million Note: “VPY” denotes Versus Prior Year $0.31 $0.25 VPY ($ in millions, except per share amounts) $0.17 . . . . Q1’14 +82% +47% Midpoint $2,203M +5% $201M +10% $0.28 +65% |
|
|
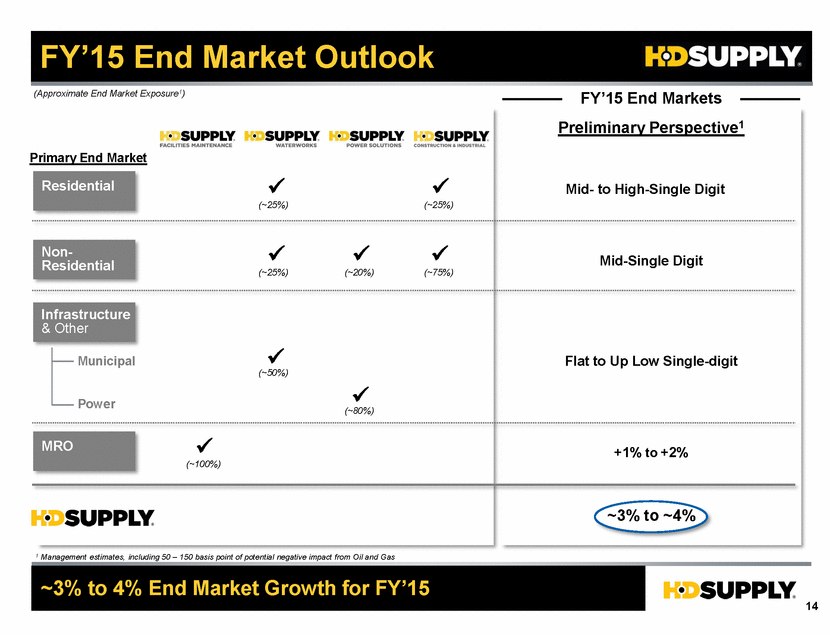
14 FY’15 End Market Outlook ~3% to 4% End Market Growth for FY’15 Residential Infrastructure & Other MRO Municipal Power 1 Management estimates, including 50 – 150 basis point of potential negative impact from Oil and Gas . . (~20%) (~80%) . . . (~25%) (~50%) (~25%) . . (~25%) (~75%) . (~100%) (Approximate End Market Exposure1) FY’15 End Markets Primary End Market Mid- to High-Single Digit Flat to Up Low Single-digit +1% to +2% Non- Residential Preliminary Perspective1 Mid-Single Digit ~3% to ~4% |
|
|
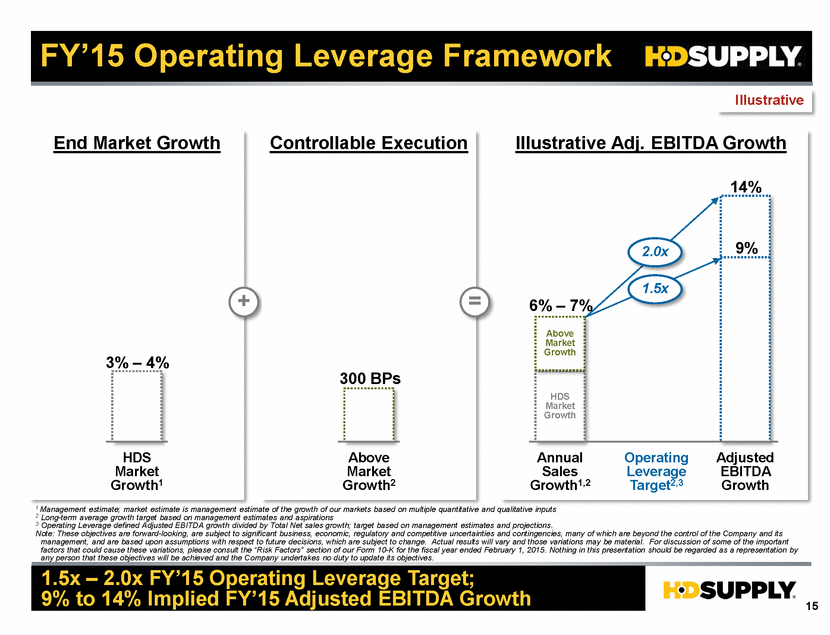
15 FY’15 Operating Leverage Framework 1.5x – 2.0x FY’15 Operating Leverage Target; 9% to 14% Implied FY’15 Adjusted EBITDA Growth HDS Market Growth1 Illustrative 3% – 4% + Above Market Growth2 300 BPs = End Market Growth Controllable Execution Annual Sales Growth1,2 Illustrative Adj. EBITDA Growth Adjusted EBITDA Growth 14% HDS Market Growth 9% 6% – 7% 2.0x 1.5x Operating Leverage Target2,3 1 Management estimate; market estimate is management estimate of the growth of our markets based on multiple quantitative and qualitative inputs 2 Long-term average growth target based on management estimates and aspirations 3 Operating Leverage defined Adjusted EBITDA growth divided by Total Net sales growth; target based on management estimates and projections. Note: These objectives are forward-looking, are subject to significant business, economic, regulatory and competitive uncertainties and contingencies, many of which are beyond the control of the Company and its management, and are based upon assumptions with respect to future decisions, which are subject to change. Actual results will vary and those variations may be material. For discussion of some of the important factors that could cause these variations, please consult the “Risk Factors” section of our Form 10-K for the fiscal year ended February 1, 2015. Nothing in this presentation should be regarded as a representation by any person that these objectives will be achieved and the Company undertakes no duty to update its objectives. Above Market Growth |
|
|
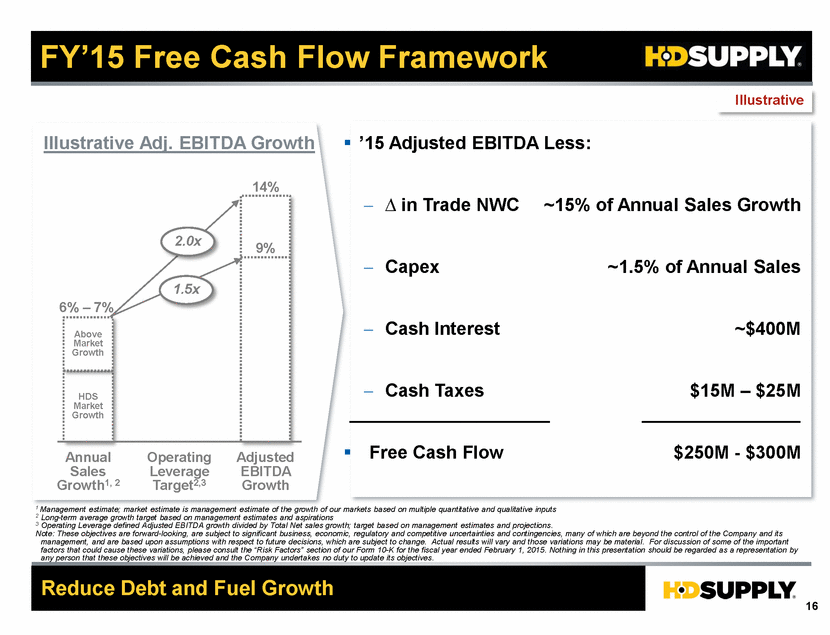
16 FY’15 Free Cash Flow Framework Reduce Debt and Fuel Growth Illustrative Annual Sales Growth1, 2 Illustrative Adj. EBITDA Growth Adjusted EBITDA Growth 14% HDS Market Growth 9% 6% – 7% 2.0x 1.5x Operating Leverage Target2,3 Above Market Growth . ’15 Adjusted EBITDA Less: . in Trade NWC Capex Cash Interest Cash Taxes . Free Cash Flow ~15% of Annual Sales Growth ~1.5% of Annual Sales ~$400M $15M – $25M $250M - $300M 1 Management estimate; market estimate is management estimate of the growth of our markets based on multiple quantitative and qualitative inputs 2 Long-term average growth target based on management estimates and aspirations 3 Operating Leverage defined Adjusted EBITDA growth divided by Total Net sales growth; target based on management estimates and projections. Note: These objectives are forward-looking, are subject to significant business, economic, regulatory and competitive uncertainties and contingencies, many of which are beyond the control of the Company and its management, and are based upon assumptions with respect to future decisions, which are subject to change. Actual results will vary and those variations may be material. For discussion of some of the important factors that could cause these variations, please consult the “Risk Factors” section of our Form 10-K for the fiscal year ended February 1, 2015. Nothing in this presentation should be regarded as a representation by any person that these objectives will be achieved and the Company undertakes no duty to update its objectives. |
|
|
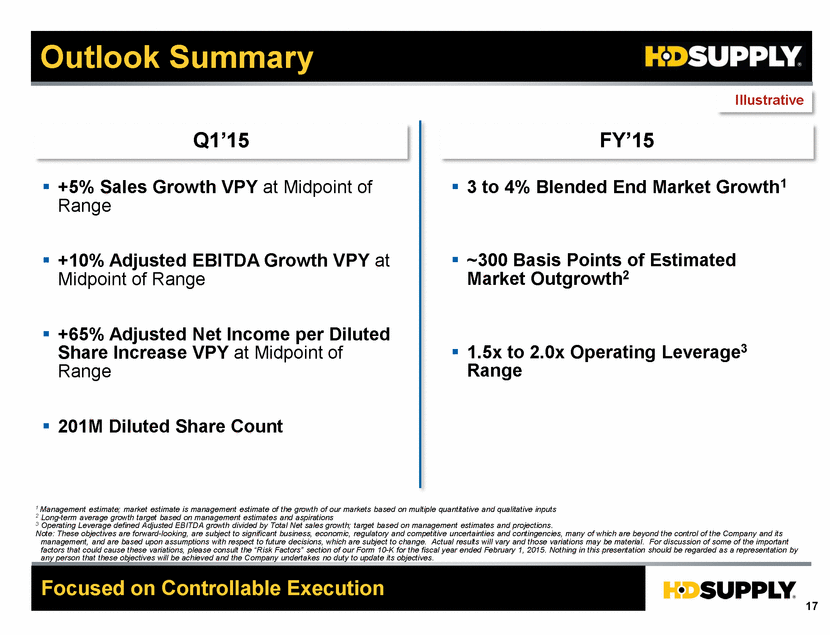
17 Outlook Summary Focused on Controllable Execution Q1’15 FY’15 . +5% Sales Growth VPY at Midpoint of Range . +10% Adjusted EBITDA Growth VPY at Midpoint of Range . +65% Adjusted Net Income per Diluted Share Increase VPY at Midpoint of Range . 201M Diluted Share Count . 3 to 4% Blended End Market Growth1 . ~300 Basis Points of Estimated Market Outgrowth2 . 1.5x to 2.0x Operating Leverage3 Range Illustrative 1 Management estimate; market estimate is management estimate of the growth of our markets based on multiple quantitative and qualitative inputs 2 Long-term average growth target based on management estimates and aspirations 3 Operating Leverage defined Adjusted EBITDA growth divided by Total Net sales growth; target based on management estimates and projections. Note: These objectives are forward-looking, are subject to significant business, economic, regulatory and competitive uncertainties and contingencies, many of which are beyond the control of the Company and its management, and are based upon assumptions with respect to future decisions, which are subject to change. Actual results will vary and those variations may be material. For discussion of some of the important factors that could cause these variations, please consult the “Risk Factors” section of our Form 10-K for the fiscal year ended February 1, 2015. Nothing in this presentation should be regarded as a representation by any person that these objectives will be achieved and the Company undertakes no duty to update its objectives. |
|
|
18 Q&A We Supply the Products and Services to Build Your City and Keep it Running |

|
|
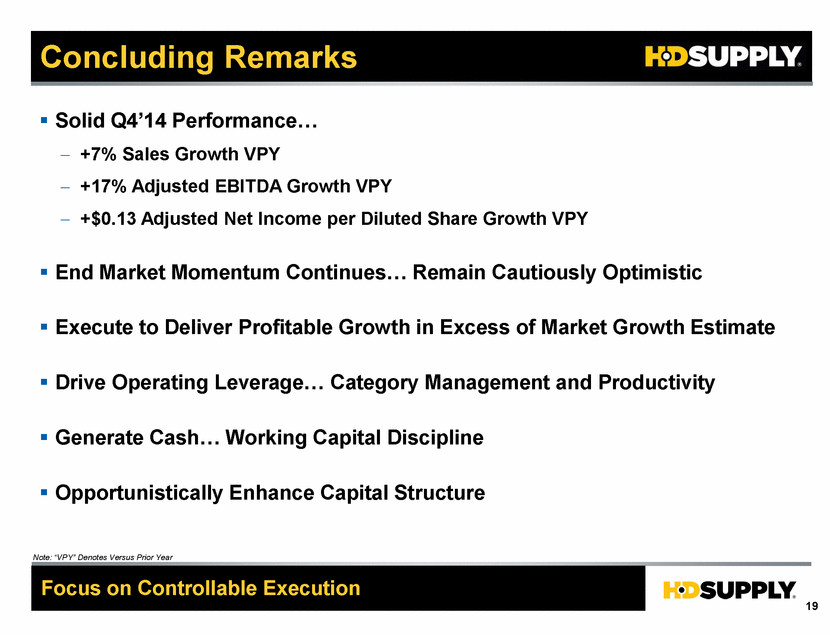
19 Concluding Remarks . Solid Q4’14 Performance +7% Sales Growth VPY +17% Adjusted EBITDA Growth VPY +$0.13 Adjusted Net Income per Diluted Share Growth VPY . End Market Momentum Continues Remain Cautiously Optimistic . Execute to Deliver Profitable Growth in Excess of Market Growth Estimate . Drive Operating Leverage Category Management and Productivity . Generate Cash Working Capital Discipline . Opportunistically Enhance Capital Structure Focus on Controllable Execution Note: “VPY” Denotes Versus Prior Year |
|
|
HD Supply Proprietary and Confidential Appendix |

|
|
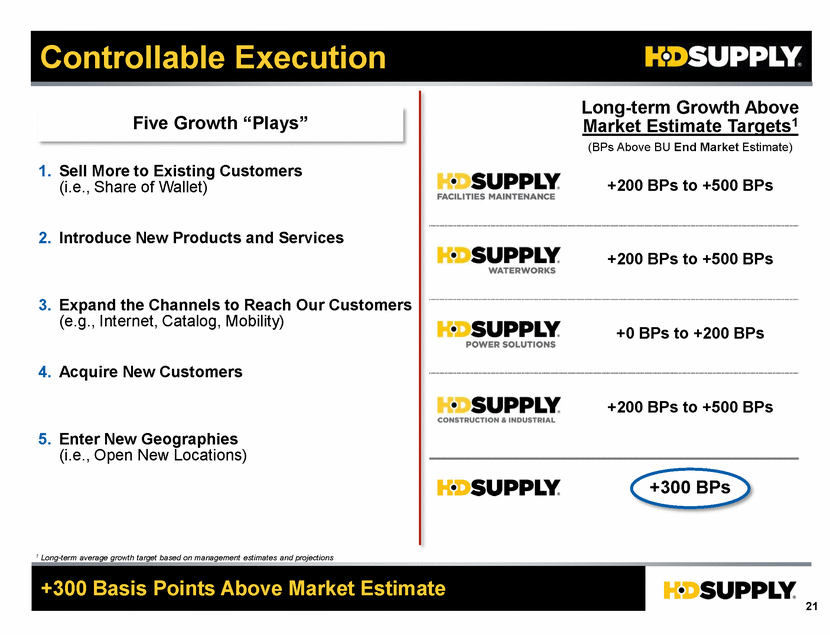
21 Controllable Execution +300 Basis Points Above Market Estimate 1 Long-term average growth target based on management estimates and projections +200 BPs to +500 BPs +300 BPs Long-term Growth Above Market Estimate Targets1 +200 BPs to +500 BPs +200 BPs to +500 BPs +0 BPs to +200 BPs (BPs Above BU End Market Estimate) 1. Sell More to Existing Customers (i.e., Share of Wallet) 2. Introduce New Products and Services 3. Expand the Channels to Reach Our Customers (e.g., Internet, Catalog, Mobility) 4. Acquire New Customers 5. Enter New Geographies (i.e., Open New Locations) Five Growth “Plays” |
|
|
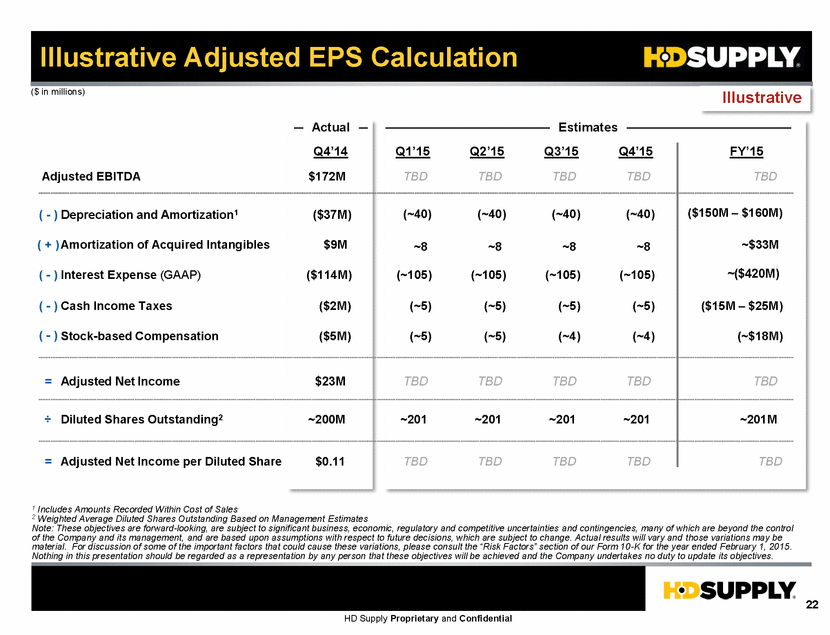
22 HD Supply Proprietary and Confidential Illustrative Adjusted EPS Calculation Adjusted EBITDA . Adjusted Net Income per Diluted Share . Adjusted Net Income = = . Diluted Shares Outstanding2 ÷ Illustrative TBD TBD TBD ~201M FY’15 $172M $0.11 $23M ~200M Q4’14 ($ in millions) TBD TBD TBD ~201 Q1’15 TBD TBD TBD ~201 Q4’15 Estimates TBD TBD TBD ~201 Q2’15 TBD TBD TBD ~201 Q3’15 . Depreciation and Amortization1 ( - ) ($37M) (~40) (~40) ($150M – $160M) (~40) (~40) . Amortization of Acquired Intangibles ( + ) ~$33M $9M ~8 ~8 ~8 ~8 . Interest Expense (GAAP) ( - ) ($114M) ~($420M) . Cash Income Taxes ( - ) ($15M – $25M) ($2M) . Stock-based Compensation ( - ) ($5M) (~105) (~105) (~105) (~105) (~5) (~5) (~5) (~5) 1 Includes Amounts Recorded Within Cost of Sales 2 Weighted Average Diluted Shares Outstanding Based on Management Estimates Note: These objectives are forward-looking, are subject to significant business, economic, regulatory and competitive uncertainties and contingencies, many of which are beyond the control of the Company and its management, and are based upon assumptions with respect to future decisions, which are subject to change. Actual results will vary and those variations may be material. For discussion of some of the important factors that could cause these variations, please consult the “Risk Factors” section of our Form 10-K for the year ended February 1, 2015. Nothing in this presentation should be regarded as a representation by any person that these objectives will be achieved and the Company undertakes no duty to update its objectives. Actual (~5) (~4) (~5) (~4) (~$18M) |
|
|
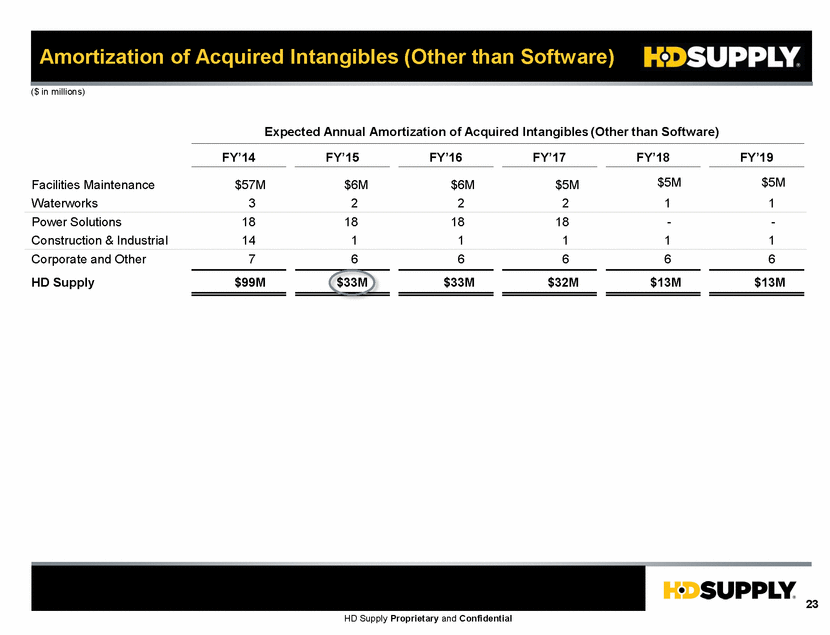
23 HD Supply Proprietary and Confidential Amortization of Acquired Intangibles (Other than Software) ($ in millions) FY’14 FY’15 FY’16 FY’17 FY’18 FY’19 Facilities Maintenance $57M $6M $6M $5M $5M $5M Waterworks 3 2 2 2 1 1 Power Solutions 18 18 18 18 - - Construction & Industrial 14 1 1 1 1 1 Corporate and Other 7 6 6 6 6 6 HD Supply $99M $33M $33M $32M $13M $13M Expected Annual Amortization of Acquired Intangibles (Other than Software) |
|
|
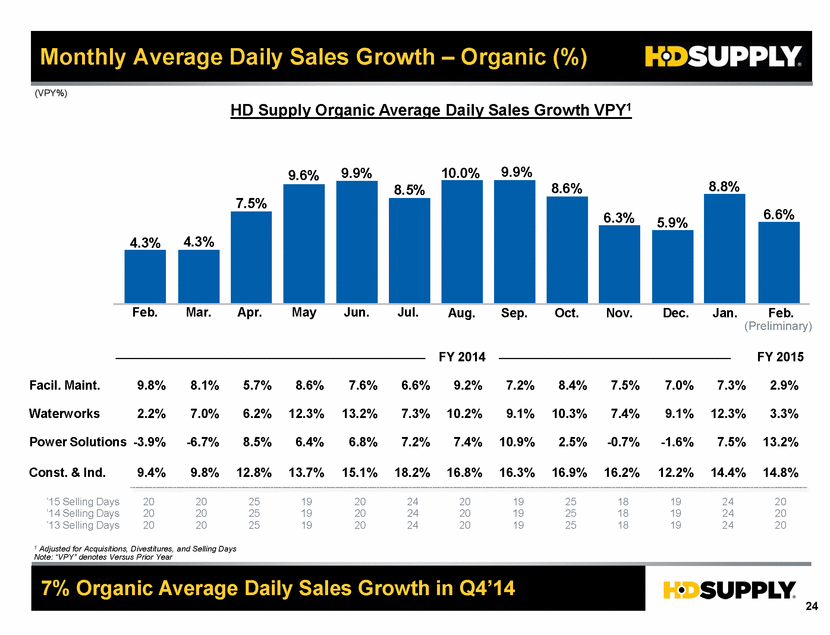
24 Monthly Average Daily Sales Growth – Organic (%) HD Supply Organic Average Daily Sales Growth VPY1 7% Organic Average Daily Sales Growth in Q4’14 (VPY%) 1 Adjusted for Acquisitions, Divestitures, and Selling Days Note: “VPY” denotes Versus Prior Year FY 2014 Facil. Maint. Waterworks Power Solutions Const. & Ind. Feb. 4.3% Apr. May Mar. 4.3% 7.5% 9.6% (Preliminary) Jul. Jun. 8.5% 9.8% 2.2% -3.9% 9.4% 8.1% 7.0% -6.7% 9.8% 5.7% 6.2% 8.5% 12.8% 8.6% 12.3% 6.4% 13.7% 7.6% 13.2% 6.8% 15.1% 6.6% 7.3% 7.2% 18.2% Aug. 9.9% 9.2% 10.2% 7.4% 16.8% Nov. 6.3% Oct. 8.6% ’15 Selling Days 20 20 25 19 20 24 20 19 25 18 20 24 19 Sep. 9.9% 10.0% 7.5% 7.4% -0.7% 16.2% 8.4% 10.3% 2.5% 16.9% 7.2% 9.1% 10.9% 16.3% 5.9% 8.8% 6.6% Dec. Jan. Feb. FY 2015 2.9% 3.3% 13.2% 14.8% 7.3% 12.3% 7.5% 14.4% 7.0% 9.1% -1.6% 12.2% ’14 Selling Days 20 20 25 19 20 24 20 19 25 18 20 24 19 ’13 Selling Days 20 20 25 19 20 24 20 19 25 18 20 24 19 |
|
|
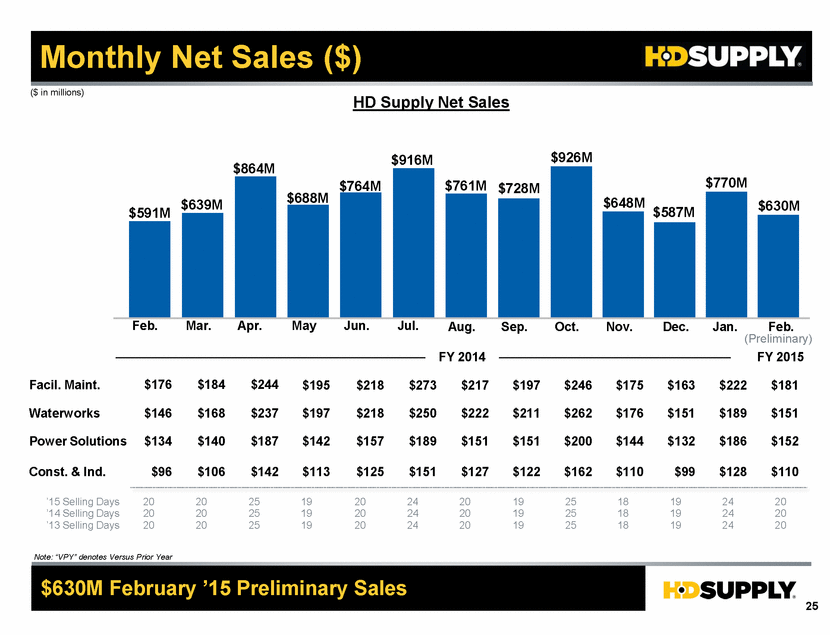
25 Monthly Net Sales ($) HD Supply Net Sales $630M February ’15 Preliminary Sales ($ in millions) Facil. Maint. Waterworks Power Solutions Const. & Ind. $176 $146 $134 $96 $688M $591M $639M $864M $184 $168 $140 $106 $244 $237 $187 $142 $195 $197 $142 $113 $761M $916M $764M $728M $218 $926M $273 $217 $218 $250 $222 $157 $189 $151 $125 $151 $127 $648M $587M $197 $770M $246 $211 $262 $151 $200 $122 $162 $175 $176 $144 $110 $630M Note: “VPY” denotes Versus Prior Year FY 2014 Feb. Apr. May Mar. (Preliminary) Jul. Jun. Aug. Nov. Oct. ’15 Selling Days 20 20 25 19 20 24 20 19 25 18 20 24 19 Sep. Dec. Jan. Feb. FY 2015 ’14 Selling Days 20 20 25 19 20 24 20 19 25 18 20 24 19 ’13 Selling Days 20 20 25 19 20 24 20 19 25 18 20 24 19 $163 $151 $132 $99 $222 $189 $186 $128 $181 $151 $152 $110 (Preliminary) |
|
|
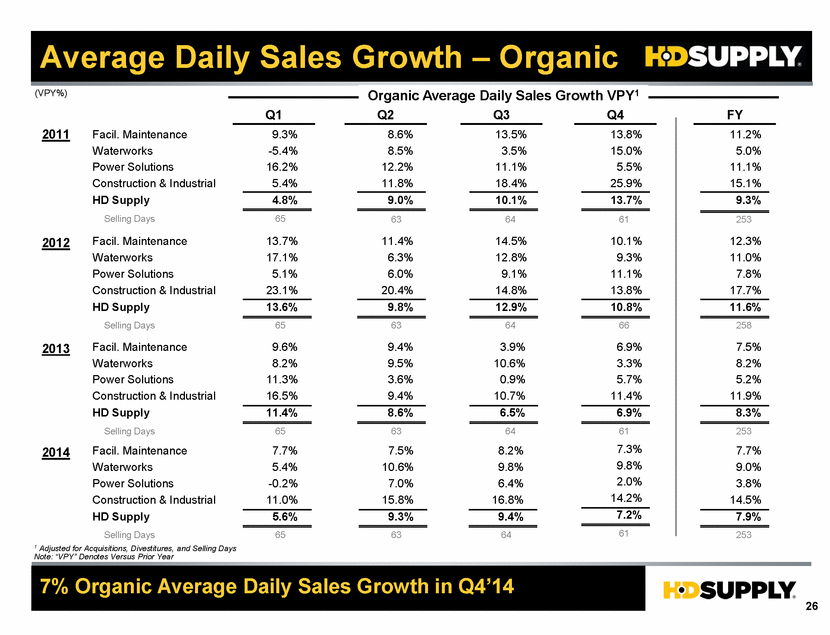
26 Average Daily Sales Growth – Organic 7% Organic Average Daily Sales Growth in Q4’14 Organic Average Daily Sales Growth VPY1 1 Adjusted for Acquisitions, Divestitures, and Selling Days Note: “VPY” Denotes Versus Prior Year Selling Days (VPY%) 2011 Facil. Maintenance Waterworks Power Solutions Construction & Industrial HD Supply 11.2% 5.0% 11.1% 15.1% 9.3% 253 2012 Facil. Maintenance Waterworks Power Solutions Construction & Industrial HD Supply Selling Days 12.3% 11.0% 7.8% 17.7% 11.6% 258 FY 2013 Facil. Maintenance Waterworks Power Solutions HD Supply Selling Days 7.5% 8.2% 5.2% 11.9% 8.3% 253 Construction & Industrial 2014 Facil. Maintenance Waterworks Power Solutions HD Supply Selling Days Q1 65 9.3% -5.4% 16.2% 5.4% 4.8% 13.7% 17.1% 5.1% 23.1% 13.6% 65 9.6% 8.2% 11.3% 16.5% 11.4% 65 7.7% 5.4% -0.2% 11.0% 5.6% 65 Construction & Industrial 63 Q2 8.6% 8.5% 12.2% 11.8% 9.0% 11.4% 6.3% 6.0% 20.4% 9.8% 63 9.4% 9.5% 3.6% 9.4% 8.6% 63 7.5% 10.6% 7.0% 15.8% 9.3% 63 64 Q3 13.5% 3.5% 11.1% 18.4% 10.1% 14.5% 12.8% 9.1% 14.8% 12.9% 64 64 3.9% 10.6% 0.9% 10.7% 6.5% 8.2% 9.8% 6.4% 16.8% 9.4% 64 61 Q4 13.8% 15.0% 5.5% 25.9% 13.7% 10.1% 9.3% 11.1% 13.8% 10.8% 66 6.9% 3.3% 5.7% 11.4% 6.9% 61 7.3% 9.8% 2.0% 14.2% 7.2% 61 7.7% 9.0% 3.8% 14.5% 7.9% 253 |
|
|
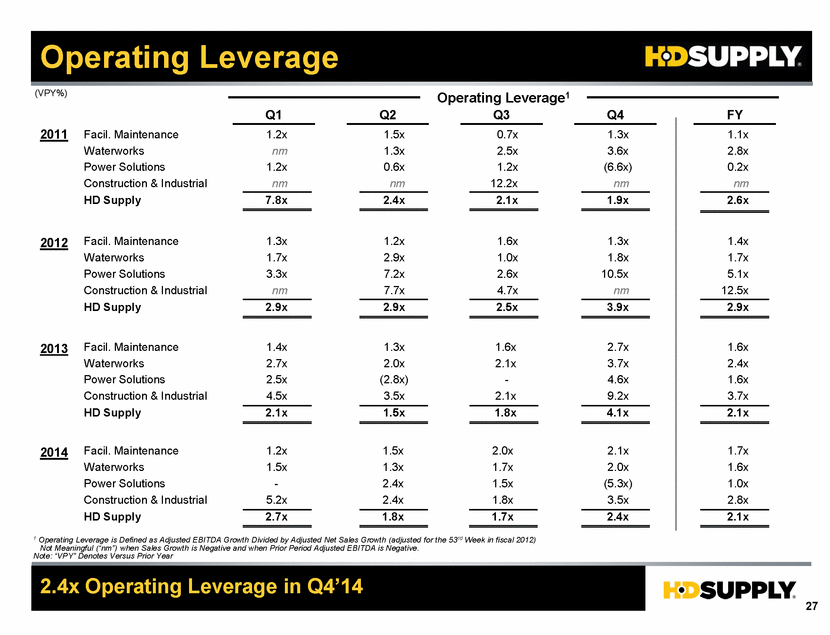
27 Operating Leverage 2.4x Operating Leverage in Q4’14 Operating Leverage1 (VPY%) 1.1x 2.8x 0.2x nm 2.6x 1.4x 1.7x 5.1x 12.5x 2.9x FY Q4 1.3x 3.6x (6.6x) nm 1.9x 1.3x 1.8x 10.5x nm 3.9x 2.7x 3.7x 4.6x 9.2x 4.1x 1.6x 2.4x 1.6x 3.7x 2.1x Q1 1.2x nm 1.2x nm 7.8x 1.3x 1.7x 3.3x nm 2.9x 1.4x 2.7x 2.5x 4.5x 2.1x 1.2x 1.5x - 5.2x 2.7x 1 Operating Leverage is Defined as Adjusted EBITDA Growth Divided by Adjusted Net Sales Growth (adjusted for the 53rd Week in fiscal 2012) Not Meaningful (“nm”) when Sales Growth is Negative and when Prior Period Adjusted EBITDA is Negative. Note: “VPY” Denotes Versus Prior Year Q2 1.5x 1.3x 0.6x nm 2.4x 1.2x 2.9x 7.2x 7.7x 2.9x 1.3x 2.0x (2.8x) 3.5x 1.5x 1.5x 1.3x 2.4x 2.4x 1.8x 2011 Facil. Maintenance Waterworks Power Solutions Construction & Industrial HD Supply 2012 Facil. Maintenance Waterworks Power Solutions Construction & Industrial HD Supply 2013 Facil. Maintenance Waterworks Power Solutions HD Supply Construction & Industrial 2014 Facil. Maintenance Waterworks Power Solutions HD Supply Construction & Industrial Q3 0.7x 2.5x 1.2x 12.2x 2.1x 1.6x 1.0x 2.6x 4.7x 2.5x 1.6x 2.1x - 2.1x 1.8x 2.0x 1.7x 1.5x 1.8x 1.7x 2.1x 2.0x (5.3x) 3.5x 2.4x 1.7x 1.6x 1.0x 2.8x 2.1x |
|
|
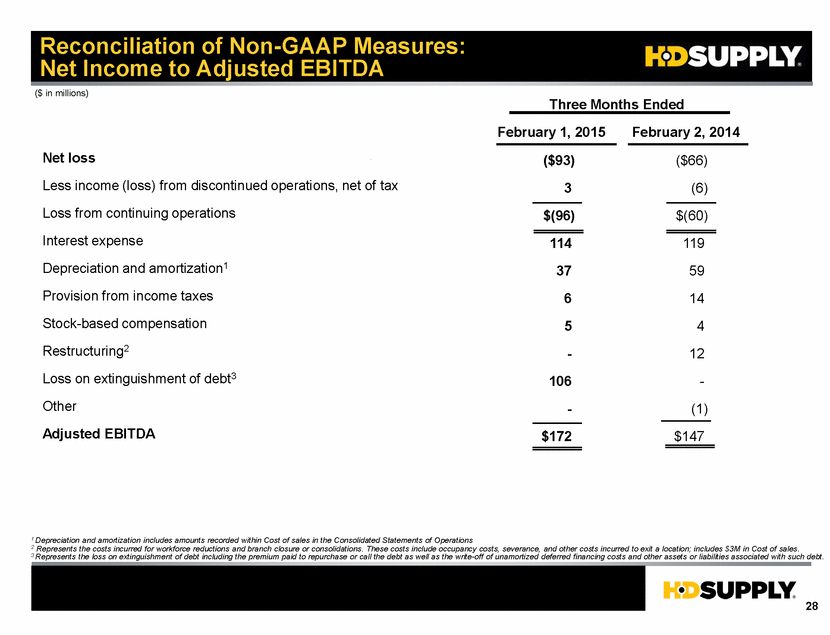
28 Reconciliation of Non-GAAP Measures: Net Income to Adjusted EBITDA ($ in millions) February 1, 2015 February 2, 2014 Three Months Ended Net loss Less income (loss) from discontinued operations, net of tax Loss from continuing operations Interest expense Depreciation and amortization1 Provision from income taxes Stock-based compensation Restructuring2 Loss on extinguishment of debt3 Other Adjusted EBITDA 1 Depreciation and amortization includes amounts recorded within Cost of sales in the Consolidated Statements of Operations 2 Represents the costs incurred for workforce reductions and branch closure or consolidations. These costs include occupancy costs, severance, and other costs incurred to exit a location; includes $3M in Cost of sales. 3 Represents the loss on extinguishment of debt including the premium paid to repurchase or call the debt as well as the write-off of unamortized deferred financing costs and other assets or liabilities associated with such debt. ($93) 3 $(96) 114 37 6 5 - 106 - $172 ($66) (6) $(60) 119 59 14 4 12 - (1) $147 |
|
|
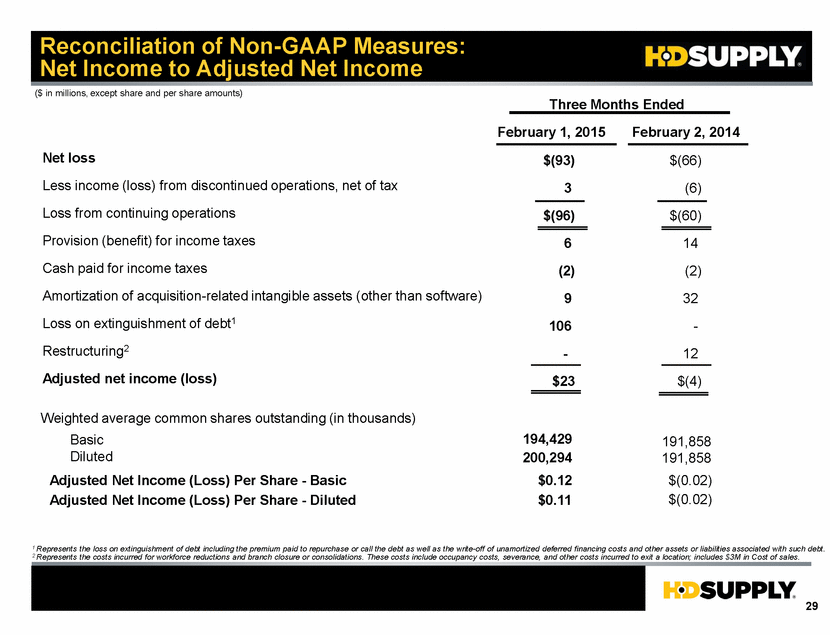
29 Reconciliation of Non-GAAP Measures: Net Income to Adjusted Net Income ($ in millions, except share and per share amounts) Weighted average common shares outstanding (in thousands) Basic 194,429 Diluted 200,294 Adjusted Net Income (Loss) Per Share - Basic $0.12 Adjusted Net Income (Loss) Per Share - Diluted $0.11 Three Months Ended Net loss Less income (loss) from discontinued operations, net of tax Loss from continuing operations Provision (benefit) for income taxes Cash paid for income taxes Amortization of acquisition-related intangible assets (other than software) Loss on extinguishment of debt1 Restructuring2 Adjusted net income (loss) $(93) 3 $(96) 6 (2) 9 106 - $23 1 Represents the loss on extinguishment of debt including the premium paid to repurchase or call the debt as well as the write-off of unamortized deferred financing costs and other assets or liabilities associated with such debt. 2 Represents the costs incurred for workforce reductions and branch closure or consolidations. These costs include occupancy costs, severance, and other costs incurred to exit a location; includes $3M in Cost of sales. February 1, 2015 February 2, 2014 $(66) (6) $(60) 14 (2) 32 - 12 $(4) 191,858 191,858 $(0.02) $(0.02) |