Attached files
| file | filename |
|---|---|
| 8-K - 8-K - Clearwater Paper Corp | d892295d8k.htm |
 CLEARWATER PAPER
CORPORATION
MARCH 2015
Exhibit 99.1 |
 FORWARD LOOKING
STATEMENTS
2
This
presentation
contains,
in
addition
to
historical
information,
certain
forward-looking
statements
within
the
meaning
of
the
Private
Securities
Litigation
Reform
Act
of
1995,
including
statements
regarding
North
American
tissue
demand
and
capacity,
paperboard
demand,
Chinese
paperboard
competition,
business
strategies,
EBITDA
margins
and
model,
measures
to
address
market
dynamics,
strategic
capital
projects,
and
Adjusted
EBITDA
run-rate.
Words
such
as
“anticipate,”
“expect,”
“intend,”
“will,”
“plan,”
“goals,”
“objectives,”
“target,”
“project,”
“believe,”
“schedule,”
“estimate,”
“may,”
and
similar
expressions
are
intended
to
identify
such
forward-looking
statements.
These
forward-looking
statements
are
based
on
management’s
updated
expectations,
estimates,
assumptions
and
projections
that
are
subject
to
change.
Our
actual
results
of
operations
may
differ
materially
from
those
expressed
or
implied
by
the
forward-looking
statements
contained
in
this
presentation.
Important
factors
that
could
cause
or
contribute
to
such
differences
include
the
risk
and
uncertainties
described
from
time
to
time
in
our
public
filings
with
the
Securities
and
Exchange
Commission,
as
well
as
the
following:
competitive pricing pressures for our products, including as a result of increased
capacity as additional manufacturing facilities are operated by our
competitors; the loss of or changes in prices in regards to a significant
customer; changes in transportation costs and disruptions in transportation
services; manufacturing or operating disruptions, including equipment
malfunction and damage to our manufacturing facilities caused by fire or weather-
related events and IT system failures;
changes in the cost and availability of wood fiber and wood pulp;
labor disruptions;
changes in costs for and availability of packaging supplies, chemicals, energy and
maintenance and repairs; environmental liabilities or expenditures;
changes in the U.S. and international economies and in general economic conditions
in the regions and industries in which we operate; changes
in
customer
product
preferences
and
competitors'
product
offerings;
changes in expenses and required contributions associated with our pension
plans; reliance on a limited number of third-party suppliers for raw
materials; cyclical industry conditions;
inability
to
successfully
implement
our
operational
efficiencies
and
expansion
strategies;
inability to fund our debt obligations;
restrictions on our business from debt covenants and terms; and
changes
in
laws,
regulations
or
industry
standards
affecting
our
business.
Forward-looking statements contained in this presentation present
management’s views only as of the date of this presentation or as indicated. We undertake no obligation to publicly
update forward-looking statements, whether as a result of new information,
future events or otherwise. |
 OVERVIEW OF
CLEARWATER PAPER
3 |
 INTRODUCTION TO
CLEARWATER PAPER
WE ARE A COMPANY FORMED IN LATE 2008 WITH MORE
THAN 60 YEARS OF OPERATING HISTORY
WE OPERATE
TWO BUSINESS SEGMENTS
Pulp and paperboard: 40% of 2014 net sales
Consumer products: 60% of 2014 net sales
FINANCIAL OVERVIEW FOR 2014
Net Sales: $2.0 Billion
Adjusted EBITDA¹: $240 Million
2008 to 2014 Adjusted EBITDA¹
CAGR: 21%
APPROXIMATELY 3,200 EMPLOYEES
4
1
See Appendix for the definition of Adjusted EBITDA as well as the reconciliation to
the most comparable GAAP measure. |
 CONSUMER PRODUCTS DIVISION
OVERVIEW
Clearwater Paper is one of the LARGEST NORTH AMERICAN
MANUFACTURERS OF PRIVATE LABEL TISSUE, focused on high value tissue
products across all categories, retail channels and geographies.
5 |
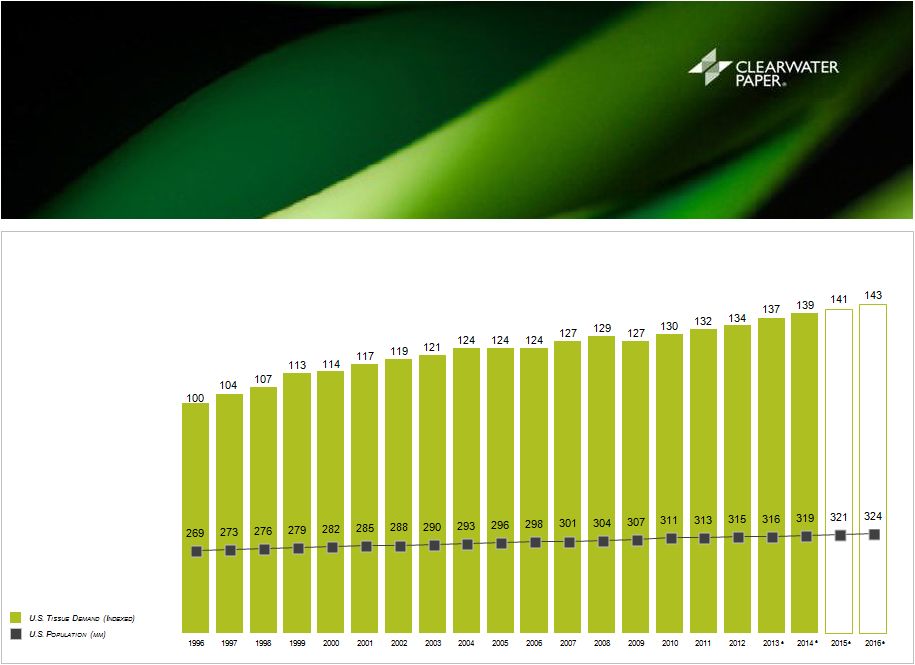 CONSUMER PRODUCTS DIVISION
MARKET DRIVERS
STABLE GROWTH
–
The tissue market has grown an average of
1
%
-
2
%
annually since 1996, consistent with population growth.
Source:
U.S.
Tissue
demand
per
RISI
for
North
America
only
from
US
Tissue
Data
January
2014,
U.S.
Population
per
U.S.
Census
December
2012
6 |
 CONSUMER PRODUCTS DIVISION
CAPACITY AND RETAIL CHANNELS
OVERVIEW OF FACILITIES
Tissue
Production
Capacity
1
:
433,000
tons
Tissue
Conversion
Capacity
1
:
435,000
tons
Clearwater
Paper
Tissue
Parent
Roll
Clearwater
Paper
Tissue
Converting
1
Represents 2014 annual volumes excluding specialty mills
2
IRI Panel data for Retail channel share by dollar amount sold as of Jan. 5,
2015. 3
Company sales data.
Change
in
Industry
Retail
Channel
Mix
U.S. TISSUE INDUSTRY
RETAIL
CHANNEL
MIX
2
2009
2014
Grocery
37
%
33
%
Mass
+
Supercenter
28
%
31
%
Club
22
%
23
%
Drug
7
%
5
%
Dollar
3
%
4
%
All Other
3
%
4
%
Clearwater Paper Focus on
Diversifying Channel Mix
CLEARWATER PAPER RETAIL
CHANNEL
MIX
3
2011
2014
Grocery
82
%
68
%
Mass
+
Supercenter
10
%
19
%
Drug
2
%
2
%
Dollar
6
%
10
%
All Other
1
%
7
Lewiston,ID
Las Vegas,NV
Oklahoma City, OK
Shelby, NC
Elwood, IL
Neenah, WI
Lady Smith, WI |
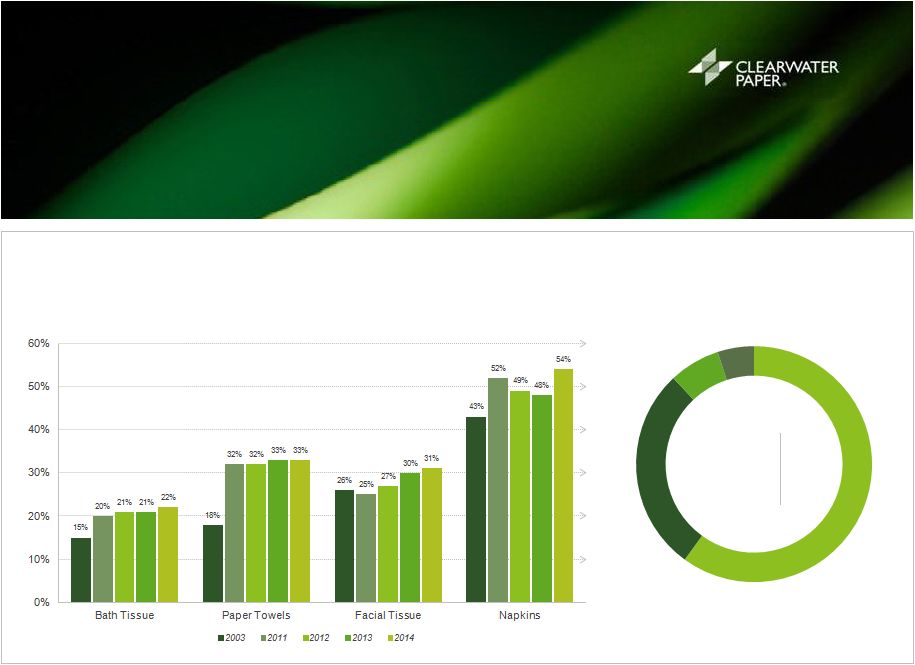 PRIVATE LABEL CONTINUES TO
CAPTURE MARKET SHARE IN TISSUE
Clearwater Paper ranks as one of the LARGEST NORTH
AMERICAN
PRIVATE
LABEL
TISSUE
MANUFACTURERS
Private Label Market Share
of Total U.S. Market
2014 U.S. Retail Tissue
Industry Product Mix
2014
Bath Tissue
60
%
Paper Towels
29
%
Facial Tissue
7
%
Napkins
4
%
Source: IRIWorldwide. January 2015
8 |
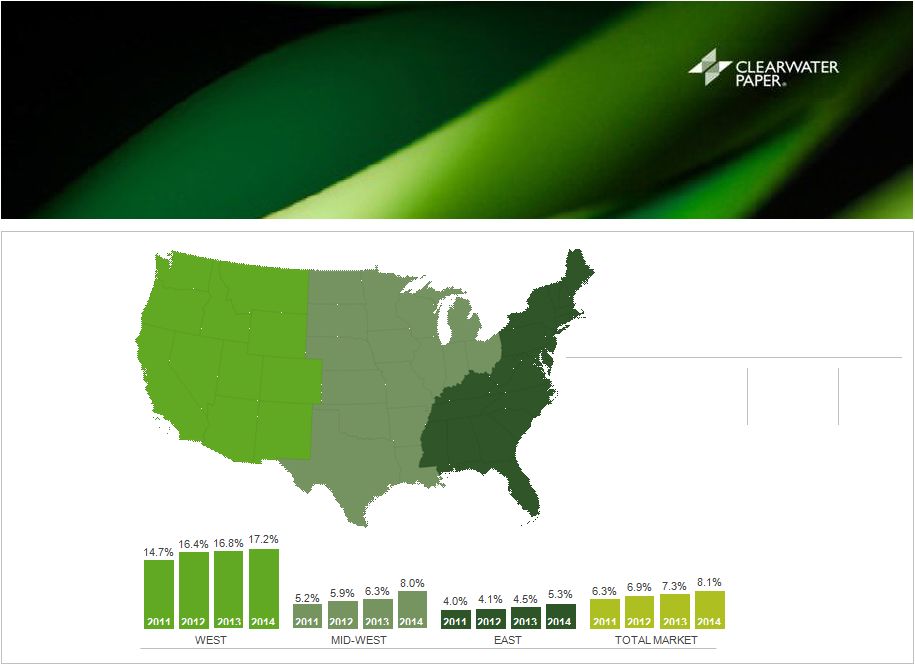 OPPORTUNITY FOR PRIVATE LABEL
AND CLEARWATER PAPER TO GROW
MARKET SHARE NATIONALLY
Clearwater
Paper
Market
Share by
Region
WEST
MID-WEST
EAST
Clearwater Paper
17.2
%
8.0
%
5.3
%
Brand Names
69.3
%
73.6
%
73.0
%
Other Private Label
13.5
%
18.4
%
21.7
%
Source: IRIWorldwide. January 2015
9 |
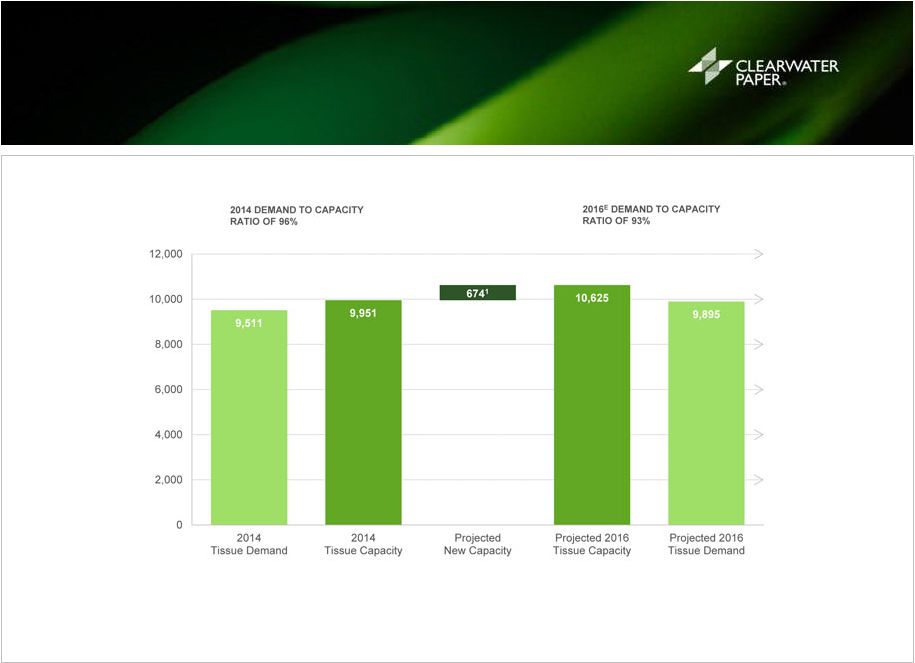 NORTH AMERICAN TISSUE MARKET
DEMAND VS. CAPACITY
Longer Term Market Remains in Equilibrium
Source: RISI August 2013 update for Outlook for World Tissue Business, RISI Feb 2015
US Tissue Monthly Data, and Company estimates 1
It is assumed that any productivity improvements (approximately 100k per year
or 1% of capacity) will be offset by closures over a cycle. Notes: Projected
capacity changes represents both virgin and recycled tissue capacity changes. Please see Appendix for breakdown
of specific projects reflected in the capacity changes.
10 |
 PAPERBOARD DIVISION
OVERVIEW
LEADING
MANUFACTURER
OF
SBS
1
used
in
packaging
of
premium
consumer
goods, pharmaceuticals, food and liquid, and food service plates, cups and
folding cartons.
11
1
Solid Bleach Sulfate paperboard |
 PAPERBOARD DEMAND REMAINS
STABLE AND OUTLOOK IS
FAVORABLE IN THE U.S.
Source: RISI estimates as of January 2015
¹
Based on tons produced. Projections based on North American Packaging papers and
board demand estimates per RISI. ²
Average price per short ton of 16 pt. SBS folding carton C1S. Price estimates per
RISI. DEMAND FOR SBS BASED PRODUCTS
EXPECTED TO REMAIN STABLE THROUGH 2016
•
Secular trend away from foam (polystyrene) cups and products is in the early
innings and the SBS market is expected to be a beneficiary
•
Strong economy bodes well for SBS business
•
China’s ivory board is expected to have minimal impact on Clearwater Paper in
2015 •
The strong U.S. dollar may attract foreign SBS manufacturers
12 |
 PULP AND PAPERBOARD DIVISION
CAPACITY AND MARKETS
Clearwater
Paper
ranks
as
one
of
the
top
five
largest
paperboard
manufacturers
in
North
America
Lewiston Mill
ID
Cypress Bend Mill
AR
OVERVIEW OF FACILITIES
Pulp
Production
Capacity
1
:
856,000
tons
Paperboard
Production
Capacity
1
:
812,000
tons
Clearwater Paper Pulp
Clearwater Paper SBS
Source: Company estimates, RISI, AF&PA
1
Represents 2014 annual volumes.
2
Represents ~6.0 million tons.
2014 North American Bleached
Paperboard
Production
by
Type
2
2014
Folding
36
%
Liquid Packaging
23
%
Cup
17
%
Plate, Dish, & Tray
13
%
Coated Bristols
8
%
All Other
3
%
2014 North American Bleached
Paperboard Production by Market Share
2014
International Paper
24
%
MeadWestvaco
23
%
Georgia Pacific
13
%
Evergreen
13
%
Clearwater Paper
12
%
Rock-Tenn
7
%
Weyerhauser
5
%
Tembec Paperboard
3
%
13 |
 OUR
MACRO STRATEGY TO OUR MACRO STRATEGY TO
CREATE SHAREHOLDER VALUE
CREATE SHAREHOLDER VALUE
GROW OUR TISSUE BUSINESS
> Lead private label in quality
> Expand geographically
Diversify retail channel penetration
OPTIMIZE PROFITABILITY OF
PAPERBOARD AND TISSUE BUSINESSES
> Improve sales mix
> Reduce costs
> Continue to improve quality
14 |
 SUCCESSFUL EXECUTION OF
PREVIOUSLY STATED GOALS
GOAL
COMPLETE NEW PAPER MACHINE
AT SHELBY, NC FACILITY
GOAL
OPTIMIZE THE
PAPERBOARD BUSINESS
GOAL
MAINTAIN A PRUDENT CAPITAL
STRUCTURE TO LOWER WEIGHTED
AVERAGE COST OF CAPITAL
GOAL
ASSET RATIONALIZATION/
COST INFRASTRUCTURE
GOAL
RETURN OF CAPITAL TO
SHAREHOLDERS
TIMEFRAME
ongoing
STATUS
•
Sold 5 specialty mills in December 2014 for $114 million
•
Closure of Long Island and Thomaston converting operations in 2013-2014
•
Established cross divisional supply chain function to drive out costs system
wide TIMEFRAME
ongoing
STATUS
•
Record
2014
production
of
792K
tons
and
Adjusted
EBITDA
margin
of
22%
2
•
Cost and production improvement projects
•
Idaho major maintenance cycle increased from 12 to 18 months
•
Enhanced access to fiber supply with chipping facility acquisition near Lewiston,
Idaho TIMEFRAME
completed
STATUS
•
70k ton Shelby TAD machine startup in Q4 2012 on budget
•
Full run rate achieved in Q3 2014 versus goal of Q4 2013
TIMEFRAME
ongoing
STATUS
•
Conservative capital structure with target leverage through the cycle of 3x
Adjusted EBITDA and ample liquidity
•
Refinanced bonds and reduced long-term debt interest rate to 5% from 8.6%
since 2013
TIMEFRAME
ongoing
STATUS
•
Announced new $100 million share repurchase program in December 2014
•
Returned $230 million in capital to shareholders from 2011 through 2014 through
share repurchases
•
Reduced shares outstanding by 20% or 4.5 million shares through 2014
TIMEFRAME
ongoing
STATUS
•
Achieved
$72
million
Adjusted
EBITDA
in
Q3
20141
•
Input cost inflation and conventional tissue pricing headwinds persist
•
Sold specialty mills in December 2014 representing 8% or $18.4 million in Adjusted
EBITDA
¹
See Appendix for the definition of Adjusted EBITDA as well as the reconciliation to
the most comparable GAAP measure. 2
Pulp
and
Paperboard
operating
income
for
2014
of
$144.2
million
plus
depreciations
of
$25.5
million
and
loss
on
impairment
of
Clearwater
Fiber
intangible
asset
resulting
in
Adjusted
EBITDA
of
$172.7
million
15
GOAL
$300
MILLION
ADJUSTED
EBITDA
1 |
 UPDATED ADJUSTED EBITDA TARGET
IN LIGHT OF CHANGES IN MARKET
CONDITIONS AND DIVESTITURE
16
1
Non-GAAP
measure
–
See
definition
and
reconciliation
to
most
comparable
GAAP
measure
2
.
2
This
information
is
based
upon
management’s
current
expectations
and
estimates,
which
are
in
part
based
on
market
and
industry
data.
Many
factors
are
outside
the
control
of
management,
including
particularly
input
costs
for
commodity
products,
and
actual
results
may
differ
materially
from
the
information
set
forth
above.
See
“Forward-Looking
Statements
on
page
2.
PRICING AND INPUT COSTS VS. 2011
•
Pricing pressure for conventional tissue products
•
Competitive market environment a barrier to passing through input cost inflation
to customers •
Key input costs up $46 million
•
Partly offset by improved paperboard pricing
•
$18.4
million
of
Adjusted
EBITDA
1
divested
with
sale
of
specialty
products
mills |
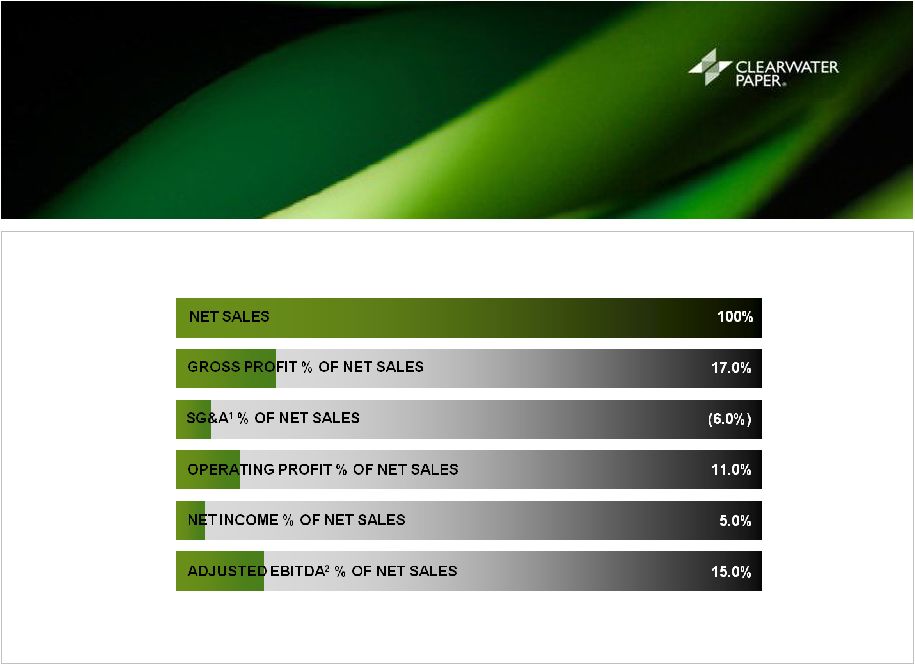 CLEARWATER PAPER
CROSS CYCLE FINANCIAL MODEL
1
Includes Corporate SG&A percentage of net sales of 2.5%
2
Non-GAAP measure –
See definition and reconciliation to most comparable GAAP measure.
.
17
2014
RESULTS
100%
13.9%
(6.3%)
7.5%
3.5%
11.5% |
 2015
FOCUS
•
Pulp optimization at mills
•
Standardize the back end of our converting lines
•
Bring new swing-line in Las Vegas on-line
2015
FOCUS
•
Execute national warehousing and logistics optimization strategy
•
100% adoption of pallet-based warehouse platform
•
Standardize
our
national
3
party
logistics
strategy
2015
FOCUS
•
Grow cup market stock and folding carton market share
•
Simplify cup and brik manufacturing complexity
•
Reduce complexity in our business through grade & SKU validation
•
Improve our category insights to help retailers sell best mix of
products
2015
FOCUS
•
Implement Black/Green belt training projects through Total Productive
Maintenance (TPM)
•
Conduct loss analysis audits by mill
2015
FOCUS
•
Develop Supply Chain planning tools (Demantra) for efficiencies
•
Launch Phase 2 of JD Edwards (Project 1Way), TM1 (financial forecasting)
PATH TO 15% ADJUSTED EBITDA
CROSS CYCLE TARGET MARGIN
18
GOAL
INCREASE OUR SALES
EFFECTIVENESS
GOAL
ACHIEVE SUPPLY CHAIN
EFFICIENCIES
GOAL
STRENGTHEN OUR CONTINUOUS
IMPROVEMENT CULTURE
GOAL
IMPROVE OUR MANUFACTURING
COST STRUCTURE
GOAL
IMPLEMENT THE RIGHT
PROCESSES, TOOLS, SYSTEMS
•
Reallocate $107M net specialty proceeds to strategic
investments
•
Operational improvements
rd |
 STRATEGIC INVESTMENTS
EXPECTED TO ACHIEVE
ADJUSTED EBITDA MARGIN TARGET
19
(MILLIONS $)
2015
2016-2018
FULL RUN-RATE EXPECTED¹
STRATEGIC INVESTMENTS²
CAPEX
CAPEX
ADJUSTED EBITDA IMPACT
Pulp Optimization
$26
$120-$130
$30-$35
Warehouse Automation
$12
$25-$30
$27-$32
Paper Machine and Converting Line Upgrades
$27
$11-$12
Converting Lines
$14
$10-$12
IT
$6
TOTAL STRATEGIC CAPEX
$85
$145-$160
PLUS BENEFITS FROM:
Operational Efficiency
$20-$32
Sales & Marketing Efficiency
$10-$15
Stranded Overhead
$7
TOTAL
$115-$145
Invest to improve operating efficiency and profitability
1
Non-GAAP
measure
–
See
definition
and
reconciliation
to
most
comparable
GAAP
measure
2
This
information
is
based
upon
management’s
current
expectations
and
estimates,
which
are
in
part
based
on
market
and
industry
data.
Many
factors
are
outside
the
control
of
management,
including
particularly
input
costs
for
commodity
products,
and
actual
results
may
differ
materially
from
the
information
set
forth
above.
See
“Forward-Looking
Statements
on
page
2.
•
High return/low risk investments
•
Expected to permanently reduce cost structure
•
Expected
Adjusted
EBITDA
improvement
of
$115
to
$145
million
in
2-3
years
1
•
Funding in Year 1 from sale proceeds of specialty mills
|
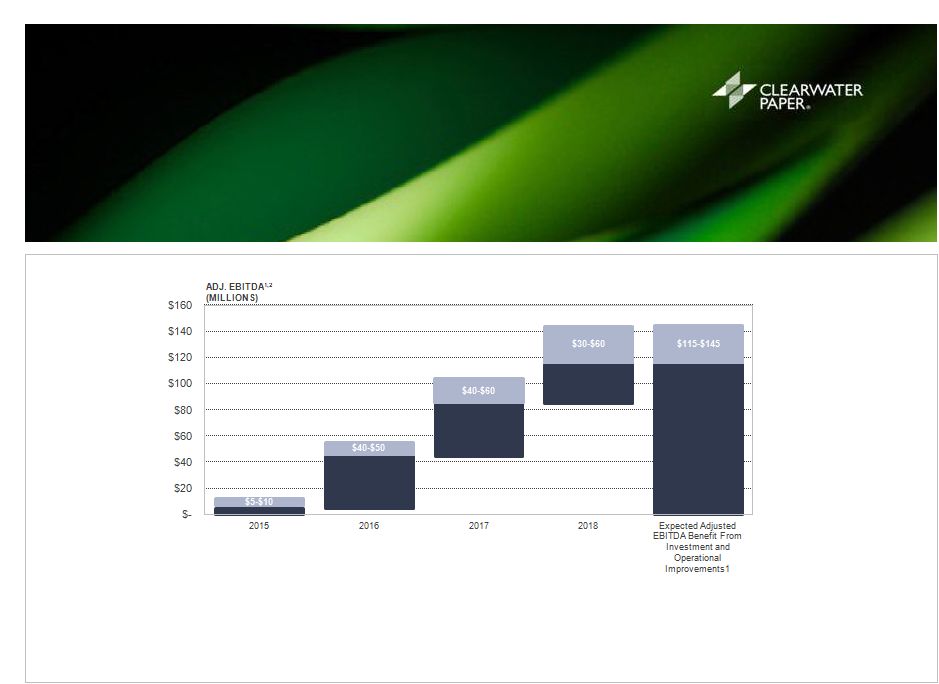 EXPECTED ADJUSTED EBITDA
FROM STRATEGIC INVESTMENTS AND
OPERATIONAL
IMPROVEMENTS
1,2
20
•
Expected
to
yield
a
$115-$145
million
Adjusted
EBITDA
increase
over
the
$230M
reset
run
rate
1
•
Assumes an annual $10-15 million of margin pressure
•
Implies
$285-$335
million
Adjusted
EBITDA
run
rate
in
2018
1
2
1
This information is based upon management’s current expectations and estimates, which are in part
based on market and industry data. Many factors are outside the control of management, including particularly input costs for commodity products,
and actual results may differ materially from the information set forth above. See
“Forward-Looking Statements on page 2. Non-GAAP measure – See definition and
reconciliation to most comparable GAAP measure. |
 CLEARWATER PAPER’S
VALUE PROPOSITION
21 |
 BALANCED
CAPITAL
ALLOCATION
2011-2014
22
1
Discretionary Free Cash Flow is cash flow from operations less maintenance capital
expenditures .
•
20% of total shares outstanding from
2011 through 2014
•
Continued investment in the business
while returning capital to investors
Capital Allocation
2011-2014
Cumulative Shares Repurchased
Total Shares Outstanding
(As of Dec 31st)
Commitment
to
return
at
least
50%
of
Discretionary
Free
Cash
Flow
1
to
shareholders
through
2015 |
 CLEARWATER PAPER IS A
LEADER AMONGST ITS PEERS
IN VALUE CREATION
Source: Bloomberg, market data as of October 24, 2014
Note: Total Shareholder Return includes with dividends reinvested and stock price
performance. 1
Small cap tissue peers include Cascades, Orchids, and Wausau.
23
489% Total Shareholder Return Since Spin-off
²
Paperboard peers include International Paper, Graphic Packaging, Kapstone,
MeadWestvaco, RockTenn, Packaging Corp of America, and Sonoco.
³
Large cap consumer product peers include Kimberly-Clark and Procter &
Gamble. |
 Strong Upward Trend in Multiple Over Time
WHICH HAS LED TO MULTIPLE
EXPANSION SINCE THE SPIN
24
Source: Bloomberg, Capital IQ, market data as of October 24, 2014
1
Small cap tissue peers include Cascades, Orchids, and Wausau.
²
Paperboard peers include International Paper, Graphic Packaging, Kapstone,
MeadWestvaco, RockTenn, Packaging Corp and Sonoco. ³
Large cap consumer product peers include Kimberly-Clark and Procter &
Gamble. |
 RETURN ON INVESTED CAPITAL
1,5
(UNAUDITED)
1
Return
on
Invested
Capital
(ROIC)
is
defined
as
[Net
Earnings
+
Interest
Expense]
/
[Tangible
Stockholders’
Equity
5
+
Debt
–
Excess
(Deficit)
Cash]
2
Weighted
Average
Cost
of
Capital
(WACC)
is
defined
as
[(Debt
x
Cost
of
Debt
x
{1-Marginal
Tax
Rate})/(Debt
+
Stockholders’
Equity)]+[(Stockholders’
Equity
x
Cost
of
Equity)/(Debt
+
Stockholders’
Equity)]
3
2013
Adjusted
ROIC
Net
Earnings
was
adjusted
to
remove
a
benefit
of
$67.5
million
from
discrete
tax
items
relating
to
release
of
uncertain
tax
positions.
2013
Adjusted
ROIC
Interest
Expense
includes
debt
retirement
costs
of
$17.1
million.
4
2014
Adjusted
ROIC
Net
Earnings
was
adjusted
to
remove
costs/loss
associated
with
optimization
and
sale
of
the
specialty
mills
totaling
$37.0
million
after-tax.
2014
Adjusted
ROIC
Interest
Expense
includes
debt
retirement
costs
of
$24.4
million.
5
Non-GAAP
Measure
–
See
definition
and
reconciliation
to
most
comparable
GAAP
measure.
25 |
 CLEARWATER PAPER’S
OUTLOOK
26 |
 FIRST QUARTER 2015 OUTLOOK
1,2
(COMPARED TO Q4’14, EXCLUDING SPECIALTY MILLS)
27
CONSUMER PRODUCTS
(EXCLUDING SPECIALTY MILLS)
PULP AND PAPERBOARD
CORPORATE
SHIPMENT VOLUMES
•
Slightly higher:
0–1% higher
•
Improved shipments:
1–5% higher
PRICE/MIX
•
Slightly Higher:
0–1% higher
•
Slightly Higher:
0–1% higher
PULP/WOOD FIBER COSTS
•
Cost/shipped ton:
higher
•
Cost/shipped ton:
stable
CHEMICAL COSTS
•
Cost/shipped ton:
stable
•
Cost/shipped ton:
lower
OP. & PKG. SUPPLIES
•
Cost/shipped ton:
lower
•
Cost/shipped ton:
stable
TRANSPORTATION COSTS
•
Cost/shipped ton:
lower
•
Cost/shipped ton:
stable
ENERGY COSTS
•
Cost/shipped ton:
stable
•
Cost/shipped ton:
stable
MAINTENANCE & REPAIRS
•
Stable
•
Higher due to planned major
maintenance outage
•
($13–$15M)
SG&A
•
Higher
•
Stable
•
Stable
1
This
informationis
based
upon
management’s
current
expectations
and
estimates,
which
arein
part
basedonmarket
andindustry
data.
Many
factors
are
outside
the
control
of
management,
including
particularly
input
costs
for
commodity
products,
and
actual
results
may
differ
materially
from
the
information
set
forth
above.
See
“Forward-Looking
Statements”
onpage
1.
2
Excludingimpact
of
sale
ofspecialty
mills.
Consolidated
Outlook:
Net
sales
2
:1-3%
higher;
Operating
margin:
3-5% |
 BRIDGE TO Q1’15 ADJUSTED EBITDA
OUTLOOK
1,2
28
1
This
information
is
based
upon
management’s
current
expectations
and
estimates,
which
are
in
part
based
on
market
and
industry
data.
Many
factors
are
outside
the
control
of
management,
including
particularly input costs for commodity products, and actual results may differ
materially from the information set forth above. See “Forward-Looking Statements on page 2.
2
Non-GAAP measure –
See definition and reconciliation to most comparable GAAP measure.
|
 APPENDIX
29 |
 RECONCILIATION
OF
GAAP
TO
NON-GAAP:
CLEARWATER
PAPER
EBITDA
1
AND
ADJUSTED
EBITDA
1
30
¹
See Appendix for the definition of Adjusted EBITDA as well as the reconciliation to
the most comparable GAAP measure. 2
Interest expense, net for 2009, 2013, and 2014 includes debt retirement costs of
$6.2 , $17.1 and $24.4 million respectively. ($ in millions)
2008
2009
2010
2011
2012
2013
2014
Net earnings/(loss)
$
9.7
$
182.5
$
73.8
$
39.7
$
64.1
$
107.0
$
(2.3)
Income tax provision (benefit)
$
5.6
$
93.2
$
2.4
$
31.2
$
47.5
$
(68.7)
$
(18.6)
Interest expense, net
2
$
13.1
$
21.7
$
22.6
$
44.8
$
33.8
$
61.1
$
63.6
Depreciation and amortization
$
47.0
$
47.4
$
47.7
$
76.9
$
79.3
$
90.3
$
90.1
EBITDA
1
$
75.4
$
344.8
$
146.5
$
192.7
$
224.7
$
189.6
$
170.0
Alternative Fuel Mixture Tax Credit
-
$
(170.6)
-
-
-
-
-
Cellu Tissue acquisition related expenses
-
-
$
20.3
-
-
-
-
Lewiston, Idaho sawmill sale related adjustments
-
-
-
$
2.9
-
-
-
Loss on sale of foam assets
-
-
-
-
$
1.0
-
-
Expenses associated with Metso litigation
-
-
-
-
$
2.0
-
-
Costs associated with Thomaston facility closure
-
-
-
-
-
$
6.0
$
1.3
Costs associated with Long Island facility closure
-
-
-
-
-
-
$
18.8
Directors equity-based compensation expense
-
$
2.6
$
3.7
1.5
$
1.4
$
4.1
$
4.6
Costs associated with optimization and sale of the specialty mills
$
40.8
Loss on impairment of Clearwater Fiber intangible asset
-
-
-
-
-
-
$
3.1
Adjusted EBITDA
1
$
75.4
$
176.8
$
170.5
$
197.1
$
229.1
$
199.7
$
238.5 |
  (Dollars in
thousands) Q1'13
Q2'13
Q3'13
Q4'13
Q1'14
Q2'14
Q3'14
Q4'14
2012
2013
2014
Earnings before interest, income taxes, and
depreciation & amortization
(EBITDA)¹ GAAP net (loss) earnings
($882)
$ 11,658
$ 13,317
$ 82,862
$ 6,226
$ 12,453
$ 6,253
($27,247)
$ 64,131
$ 106,955
($2,315)
Interest expense, net²
28,040
11,094
10,708
11,252
10,734
10,688
33,990
8,158
33,796
61,094
63,570
Income tax (benefit) provision
(14,675)
6,962
(5,183)
(55,825)
3,558
9,942
3,735
1,321
47,460
(68,721)
18,556
Depreciation and amortization expense
22,151
23,253
22,180
22,688
22,231
22,015
22,293
23,606
79,333
90,272
90,145
EBITDA¹
$ 34,634
$ 52,967
$ 41,022
$ 60,977
$ 42,749
$ 55,098
$ 66,271
$ 5,838
$ 224,720
$ 189,600
$ 169,956
Loss on sale of foam assets
-
-
-
-
-
-
-
-
1,014
-
-
Costs associated with Metso litigation
-
-
-
-
-
-
-
-
2,019
-
-
Directors' equity-based compensation expense (benefit)
3,472
(1,141)
361
1,392
2,817
(36)
(185)
2,010
1,369
4,084
4,606
Costs associated with Thomaston facility closure
183
1,013
1,717
3,064
750
374
42
91
-
5,977
1,257
Costs associated with Long Island facility closure
-
-
-
-
8,432
1,843
4,767
3,771
-
-
18,813
Costs/loss associated with optimization and sale of the specialty mills
-
-
-
-
-
-
1,066
39,735
-
-
40,801
Loss on impairment of Clearwater Fiber intangible asset
-
-
-
-
-
-
-
3,078
-
-
3,078
Adjusted EBITDA³
$ 38,289
$ 52,839
$ 43,100
$ 65,433
$ 54,748
$ 57,279
$ 71,961
$ 54,523
$ 229,122
$ 199,661
$ 238,511
Twelve Months Ended
December 31,
RECONCILIATION
OF
GAAP
TO
NON-GAAP:
CLEARWATER
PAPER
EBITDA
1
AND
ADJUSTED
EBITDA
1
¹
See Appendix for the definition of Adjusted EBITDA as well as the reconciliation to
the most comparable GAAP measure. 2 Interest expense, net for 2009, 2013, and
2014 includes debt retirement costs of $6.2 , $17.1 and $24.4 million respectively.
31 |
 RETURN ON INVESTED CAPITAL
TANGIBLE STOCKHOLDERS’
EQUITY &
EXCESS CASH RECONCILIATION OF NON-
GAAP FINANCIAL MEASURES
32
(Dollars in thousands)
2009
2010
2011
2012
2013
2014
Net earnings
1
69,520
$
73,800
$
39,674
$
64,131
$
106,955
$
($2,315)
Interest expense, net
15,505
22,571
44,809
33,796
44,036
39,150
Net earnings before interest
2
85,025
$
96,371
$
84,483
$
97,927
$
150,991
$
36,835
$
Tangible stockholders' equity3
363,736
$
182,416
$
205,623
$
263,608
$
334,783
$
263,494
$
Debt
148,285
538,314
523,694
523,933
650,000
575,000
Less excess cash
4
(175,750)
(130,023)
(48,440)
(17,579)
(78,675)
(62,331)
Invested capital
336,271
$
590,707
$
680,877
$
769,962
$
906,108
$
776,163
$
Return on Invested Capital (ROIC)
25.3%
16.3%
12.4%
12.7%
16.7%
4.7%
Stockholders' equity
363,736
$
468,349
$
484,904
$
540,894
$
605,094
$
497,537
$
Goodwill
-
(229,533)
(229,533)
(229,533)
(229,533)
(209,087)
Intangible assets, net
-
(56,400)
(49,748)
(47,753)
(40,778)
(24,956)
Tangible stockholder equity
3
363,736
$
182,416
$
205,623
$
263,608
$
334,783
$
263,494
$
Cash
2,824
$
18,928
$
8,439
$
12,579
$
23,675
$
27,331
$
Short-term investments
187,926
126,095
55,001
20,000
70,000
50,000
Operating cash
5
(15,000)
(15,000)
(15,000)
(15,000)
(15,000)
(15,000)
Excess cash
4
175,750
$
130,023
$
48,440
$
17,579
$
78,675
$
62,331
$
1
2009 Net Earnings was adjusted to remove a benefit of $170.6 million resulting from the recognition of
Alternative Fuel Mixture Tax Credits. 2
Non-GAAP measure.
3
Tangible stockholders' equity is defined as stockholders’ equity less Goodwill and Intangible
assets, net. 4
Excess (deficit) cash is defined as the sum of Cash and Short-term investments less Operating
cash 2
.
5
Operating cash is defined as a minimum amount of available cash deemed by management to be sufficient
to avoid operating disruptions due to a mismatch of cash inflows and outflows during an
accounting period.
Note: Balance sheet items are as of December 31 of each year presented.
st |
 Segment
Adjusted
EBITDA
($
in
thousands)
KEY SEGMENT RESULTS
PULP AND PAPERBOARD
1 Non-GAAP measure –
See definition and reconciliation to most comparable GAAP measure.
2 Segment Adjusted EBITDA margin is defined as Segment Adjusted EBITDA divided by
Segment net sales. 33
Q1'13
Q2'13
Q3'13
Q4'13
Q1'14
Q2'14
Q3'14
Q4'14
Shipments
Paperboard (short tons)
186,350
190,518
199,408
188,776
200,665
195,924
201,609
176,467
Sales Price
Paperboard ($/short ton)
$ 935
$ 946
$ 973
$ 978
$ 988
$ 1,017
$ 1,016
$ 1,017
Segment
net
sales
($
in
thousands)
$ 175,922
$ 181,294
$ 194,910
$ 188,012
$ 198,412
$ 199,629
$ 205,038
$ 180,675
1
$ 23,212
$ 30,550
$ 22,047
$ 43,238
$ 43,046
$ 39,654
$ 51,541
$ 38,460
Segment Adjusted EBITDA margin
1,2
13.3%
17.0%
11.3%
23.0%
21.7%
19.9%
25.1%
21.3%
19.0%
Pulp and
Paperboard
Cross-Cycle
Financial Model |
 PRO
FORMA IMPACT OF SALE OF SPECIALTY MILLS
1 Non-GAAP measure –
See definition and reconciliation to most comparable GAAP measure.
34
Consumer Products
Including Specialty Mills
Specialty Mills
Pro Forma
Consumer Products
Excluding Specialty Mills
(Dollars in millions)
Twelve Months Ended
December 31, 2014
Twelve Months Ended
November 30, 2014
Pro Forma
Net sales
1,183.4
$
217.7
$
965.7
$
Adjusted operating income
1
54.8
$
8.8
$
46.0
$
Depreciation and amortization expense
61.5
9.6
51.9
Adjusted EBITDA
1
116.3
$
18.4
$
97.9
$
|
 RECONCILIATION OF GAAP TO NON-
GAAP: Q1’15 OUTLOOK
35
¹
See Appendix for the definition of Adjusted EBITDA as well as the reconciliation to
the most comparable GAAP measure. (Dollars in thousands)
From
To
Earnings before interest, income taxes, and
depreciation & amortization (EBITDA)
1
GAAP net earnings
$4,500
$7,500
Interest expense, net
8,000
8,000
Income tax provision
2,800
4,800
Depreciation and amortization expense
21,000
22,000
EBITDA
1
$ 36,300
$ 42,300
Directors' equity-based compensation expense
700
700
Adjusted EBITDA
1
$ 37,000
$ 43,000
Three Months Ending
March 31, 2015
Range of Estimate
Outlook |
 RECONCILIATION OF GAAP TO NON-
GAAP: STRATEGIC INVESTMENTS
36
¹
See Appendix for the definition of Adjusted EBITDA as well as the reconciliation to
the most comparable GAAP measure. Pulp Optimization
Warehouse
Automation
Paper Machine
Upgrades
Converting Line
Operating
Efficiencies
Sales & marketing
Efficiency
Stranded
Overhead
Operating Income
$37.5 -
$42.5
$32.7 -
$37.7
$14.9 -
$15.9
$11.4 -
$13.4
$20 -
$32
$10 -
$15
$7
Depreciation
$7.5
$5.7
$3.9
$1.4
-
-
-
EBITDA
$30 -
$35
$27 -
$32
$11-12
$10 -
$12
$20 -
$32
$10 -
$15
$7
Adjusted EBITDA
$30 -
$35
$27 -
$32
$11-12
$10 -
$12
$20 -
$32
$10 -
$15
$7
1 |
 DEFINITIONS OF NON-GAAP
MEASURES
CLEARWATER PAPER DEFINITIONS OF NON-GAAP MEASURES
EBITDA is a non-GAAP measure that Clearwater Paper management uses as a
supplemental
performance
measure
to
evaluate
the
cash
generating
capacity
of
Clearwater
Paper. The most directly comparable GAAP measure is net earnings. EBITDA, as
defined by
Clearwater
Paper
management,
is
net
earnings
adjusted
for
net
interest
expense,
income taxes, and depreciation and amortization. It should not be considered as an
alternative to net earnings computed under GAAP.
Adjusted EBITDA is a non-GAAP measure that Clearwater Paper management defines
as EBITDA adjusted for items that we do not believe are indicative of our
core operating performance, including acquisition and disposition related
expenses, alternative fuel mixture tax credits, sale of foam assets,
expenses associated with the Metso litigation and costs associated with
directors equity based compensation. The most directly comparable GAAP
measure is net earnings. It should not be considered as an alternative to
net earnings computed under GAAP.
37 |
 NORTH AMERICAN TISSUE
PROJECTED CAPACITY CHANGE
38
Source: RISI and Other Industry
COMPANY
MILL/LOCATION
CONV/TAD
CAPACITY
CHANGE
ESTIMATED DATE
CHANNEL/BUSINESS/PRODUCTS
Announced New Capacity
Double Tree/Royal
Gila Bend, AZ
Conv
32,000
2015:Q1
PrimeLine PM from Adritz
Orchids Paper Products
Pryor, OK
Conv
30,000
2015:Q1
New PM from Recard
Confidential
Confidential
Conv
70,000
2015
Metso Advantage DCT
Confidential
Confidential
Conv
80,000
2015
Metso Advantage DCT 200TS
First Quality Tissue
Anderson, SC
TAD
70,000
2015:Q3
TAD PM Valmet
Von Drehle Corporation
Natchez, MS
Conv
35,000
2015:Q4
Valmet Advantage NTT
St. Croix Tissue (APP)
Baileyville, ME
Conv
66,000
2015:Q4
PrimeLine W8 PM from Adritz
Procter & Gamble
Box Elder, UT
TAD
80,000
2015:Q4
Retail/Brand/Bounty
First Quality Tissue
Anderson, SC
ATMOS
75,000
2016:Q1
Retail/P.L./BRT
St. Croix Tissue (APP)
Baileyville, ME
Conv
66,000
2016:Q2
PrimeLine W8 PM from Adritz
First Quality Tissue
Anderson, SC
TAD
70,000
2016:Q3
TAD PM likely Valmet
Net Capacity Change
674,000
Capacity Changes in the North American Tissue Industry
|