Attached files
| file | filename |
|---|---|
| EX-99.1 - EXHIBIT 99.1 - VONAGE HOLDINGS CORP | stratuspressreleasefinal2.htm |
| 8-K - 8-K - VONAGE HOLDINGS CORP | a8-kfdmarch2015.htm |

Sidoti & Company Nineteenth Annual Emerging Growth Research Institutional Investor Forum March 16, 2015
Safe Harbor Caution Concerning Forward-Looking Statements Various remarks that the Company makes contains forward-looking statements regarding potential acquisitions, acquisition integration, growth priorities, new products and related investment, revenues, adjusted EBITDA, churn, net lines or accounts, average revenue per user, cost of telephony services, the Company’s repurchase plan, capital expenditures, and, other statements that are not historical facts or information constitute forward-looking statements for purposes of the safe harbor provisions under The Private Securities Litigation Reform Act of 1995. The forward-looking statements are based on information available at the time the statements are made and/or management's belief as of that time with respect to future events and involve risks and uncertainties that could cause actual results and outcomes to be materially different. Important factors that could cause such differences include but are not limited to: risks related to the integration of SimpleSignal into Vonage and the anticipated future benefits resulting from the acquisition of SimpleSignal; the competition we face; our ability to adapt to rapid changes in the market for voice and messaging services; our ability to retain customers and attract new customers; the expansion of competition in the unified communications market; the impact of fluctuations in economic conditions, particularly on our small and medium business customers; security breaches and other compromises of information security; risks related to the acquisition or integration of future businesses or joint ventures, including the risks related to our acquisitions; the risk associated with developing and maintaining effective distribution channels; our ability to establish and expand strategic alliances; governmental regulation and taxes in our international operations; our ability to obtain or maintain relevant intellectual property licenses; intellectual property and other litigation that have been and may be brought against us; failure to protect our trademarks and internally developed software; obligations and restrictions associated with data privacy; our dependence on third party facilities, equipment, systems and services; system disruptions or flaws in our technology and systems; uncertainties relating to regulation of VoIP services; risks associated with operating abroad; liability under anti-corruption laws; results of regulatory inquiries into our business practices; fraudulent use of our name or services; our dependence upon key personnel; our dependence on our customers' existing broadband connections; differences between our service and traditional phone services; restrictions in our debt agreements that may limit our operating flexibility; our ability to obtain additional financing if required; any reinstatement of holdbacks by our vendors; our history of net losses and ability to achieve consistent profitability in the future;; the Company's available capital resources and other financial and operational performance which may cause the Company not to make common stock repurchases as currently anticipated or to commence or suspend such repurchases from time to time without prior notice; and other factors that are set forth in the "Risk Factors" section and other sections of Vonage's Annual Report on Form 10-K for the year ended December 31, 2014, in the Company's Quarterly Reports on Form 10-Q and Current Reports on Form 8-K. While the Company may elect to update forward-looking statements at some point in the future, the Company specifically disclaims any obligation to do so, and therefore, you should not rely on these forward-looking statements as representing the Company's views as of any date subsequent to today. Non-GAAP Financial Measures This presentation contains non-GAAP financial measures (including adjusted earnings before interest, taxes, depreciation and amortization (“adjusted EBITDA”), adjusted EBITDA less capex, net income excluding adjustments, net debt (cash) and free cash flow, as defined in Regulation G adopted by the SEC. The Company provides a reconciliation of these non-GAAP financial measures to the most directly comparable financial measure at the end of the presentation and in the Company's quarterly earnings releases, which can be found on the Vonage Investor Relations website at http://ir.vonage.com. 2

Vonage: A Compelling Investment | 3 Leadership Position in Large and Growing UCaaS Market for SMBs Powerful, Iconic Brand Structural Cost Advantages and Proven Acquisition Synergies Strong, Stable Cash Flows

The UCaaS Market for SMBs is Large and Growing Quickly | 4 Source: Frost & Sullivan $0 $4 $8 $12 2015 2020 $3B $10B ($ in B ill io n s ) 27% CAGR < 100 seats > 100 seats Cloud PBX Replacement Spend SoHo <20 Employees ~5,000,000 Firms Small Business 20-99 Employees ~500,000 Firms Mid Market 100 – 1,000 Employees ~90,000 Firms Enterprise >1,000 Employees ~9,000 Firms Vonage Target Market: 1 to 1,000 seats Source: United States Census Bureau, Jan 2015 US Business Market Segments

Vonage Brand Awareness is Significantly Higher Than Other Pure- Play Cloud PBX Market Participants | 5 Overall By Provider Type VoIP Telco Cable 77% 84% 72% 82% 8 x 8 2% 8% 0% 0% RingCentral 4% 10% 2% 0% Vocalocity 3% 5% 2% 2% Aided Brand Awareness Among Non-Customers • The iconic Vonage brand stands for innovation, disruption and value • More than $2 billion invested to build brand • Extending the Vonage brand to Vocalocity, now Vonage Business Solutions, has meaningfully accelerated growth Source: VG Marketing Research Sept. 2013; Online survey among small business decision makers with fewer than 25 lines using either VOIP, Telco or Cable
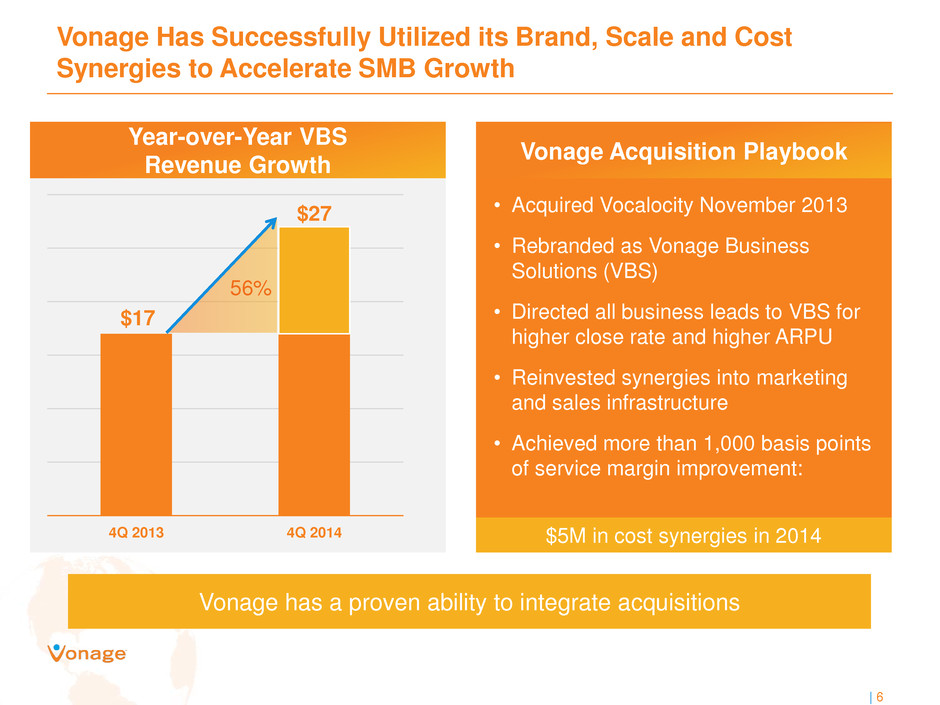
Vonage Has Successfully Utilized its Brand, Scale and Cost Synergies to Accelerate SMB Growth | 6 VBS Telesphere Telesphere VBS $16 Year-over-Year VBS Revenue Growth (N umbers in M ill io n s ) Vonage Acquisition Playbook • Acquired Vocalocity November 2013 • Rebranded as Vonage Business Solutions (VBS) • Directed all business leads to VBS for higher close rate and higher ARPU • Reinvested synergies into marketing and sales infrastructure • Achieved more than 1,000 basis points of service margin improvement: $5M in cost synergies in 2014 Vonage has a proven ability to integrate acquisitions $17 $27 4Q 2013 4Q 2014 56%

Management Intends to Deploy its Successful Acquisition Playbook to Accelerate the Growth of Telesphere • Expands presence in the higher end of the SMB market where “Quality of Service” is critical • Significant infrastructure investments in highly scalable platform to support rapid growth and potential bolt-on acquisitions • Proprietary back-office platform (Zeus) provides fully-integrated provisioning, monitoring, billing, service management and client configuration tools • Full management team retained, including CEO Clark Peterson, Founder and Chairman of the Cloud Communications Alliance | 7 Transaction Rationale / Key Strengths

Vonage is Uniquely Positioned to Deliver UCaaS Across the Full SMB Market Acquisition Date November 2013 December 2014 Average seats/customer <10 seats • One-third of revenue from customers > 20 seats >40 seats; many across multiple locations • Multiple customers exceed 1,000 seats ARPU/customer ~$200 ARPU ~$3,000 ARPU Sales Channel Primarily direct Primarily VAR/Channel Contracts None 3-year contract Delivery Cloud services over-the-top Cloud services bundled with MPLS service for QoS and SLAs Technology Proprietary Broadsoft for voice; multiple platforms for other UCaaS solutions | 8

Acquisition of SimpleSignal accelerates Vonage’s leadership position in rapidly growing UCaaS sector 9 • Solidifies Vonage’s leadership in the indirect sales channel - Provides strategic relationships with additional leading master agents and broader sales footprint - Zeus and ChannelSphere tools easily extend to SimpleSignal channel partners • Common technology platform - Utilizes same BroadSoft BroadWorks platform as Telesphere; expect seamless transition for customers - Leading provider of high quality business services over multiple broadband platforms • Cost and revenue synergies - Recurring cost synergies expected to exceed $1.7 million in 2016 - Improved customer experience through enhanced provisioning and management and care tools • Attractive valuation - 1.5x 2015E revenues; $25.25 million in cash and stock - Demonstrates Vonage’s acquisition discipline

Purchase Price • $25.25mm • Implies multiple of 1.5x 2015E revenues Consideration • $20mm cash • $5mm (1.1M million shares) in VG stock Balance Sheet • Cash portion to be paid from combination of cash on balance sheet and revolving credit facility • Pro-forma net leverage of 1.2x as of December 31, 2014 Capital Allocation • Continue share repurchase activity under 4-year $100mm program • Ample financial flexibility to continue acquisition strategy SimpleSignal Transaction Details 1 0
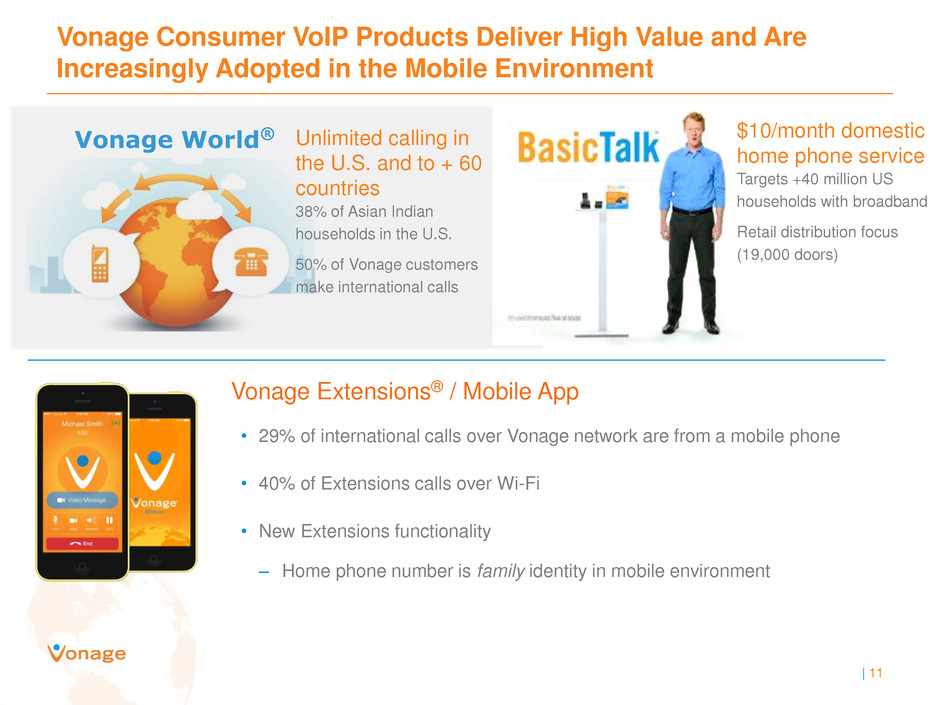
| 11 Vonage World® Unlimited calling in the U.S. and to + 60 countries 38% of Asian Indian households in the U.S. 50% of Vonage customers make international calls $10/month domestic home phone service Targets +40 million US households with broadband Retail distribution focus (19,000 doors) Vonage Consumer VoIP Products Deliver High Value and Are Increasingly Adopted in the Mobile Environment • 29% of international calls over Vonage network are from a mobile phone • 40% of Extensions calls over Wi-Fi • New Extensions functionality – Home phone number is family identity in mobile environment Vonage Extensions® / Mobile App
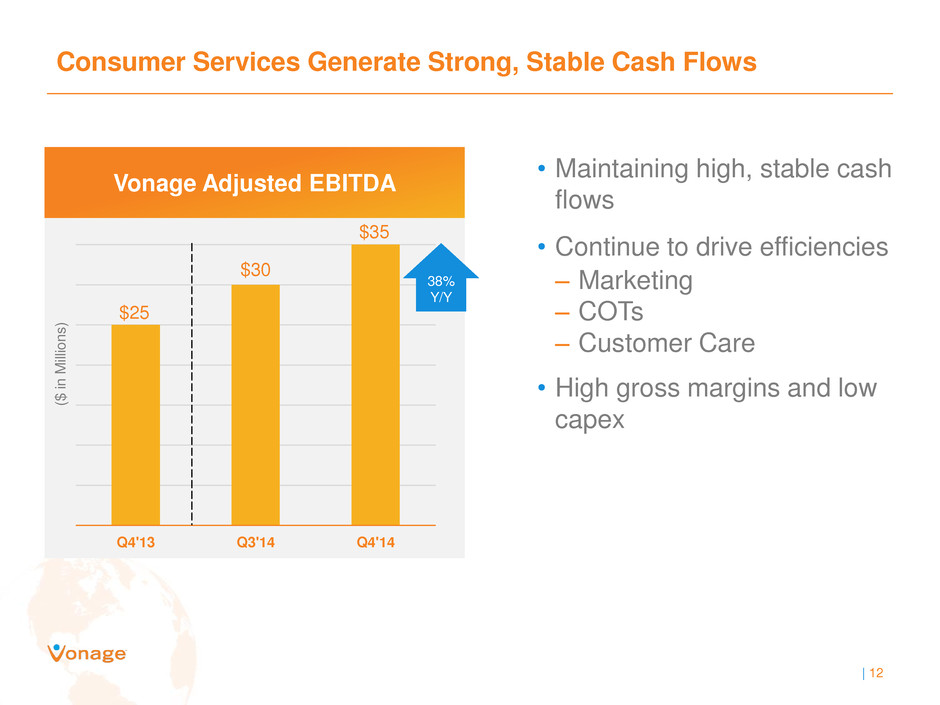
Consumer Services Generate Strong, Stable Cash Flows $25 $30 $35 Q4'13 Q3'14 Q4'14 Vonage Adjusted EBITDA ($ in M ill io n s ) • Maintaining high, stable cash flows • Continue to drive efficiencies – Marketing – COTs – Customer Care • High gross margins and low capex | 12 38% Y/Y
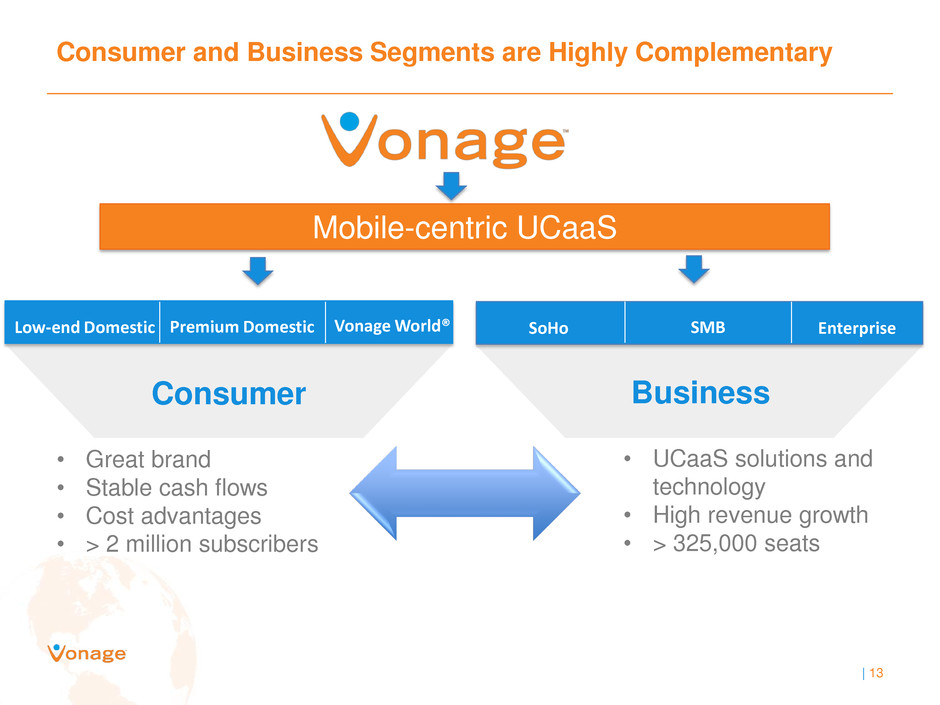
| 13 Mobile-centric UCaaS • Great brand • Stable cash flows • Cost advantages • > 2 million subscribers • UCaaS solutions and technology • High revenue growth • > 325,000 seats Consumer and Business Segments are Highly Complementary Vonage World® Premium Domestic Low-end Domestic Enterprise SMB SoHo Consumer Business
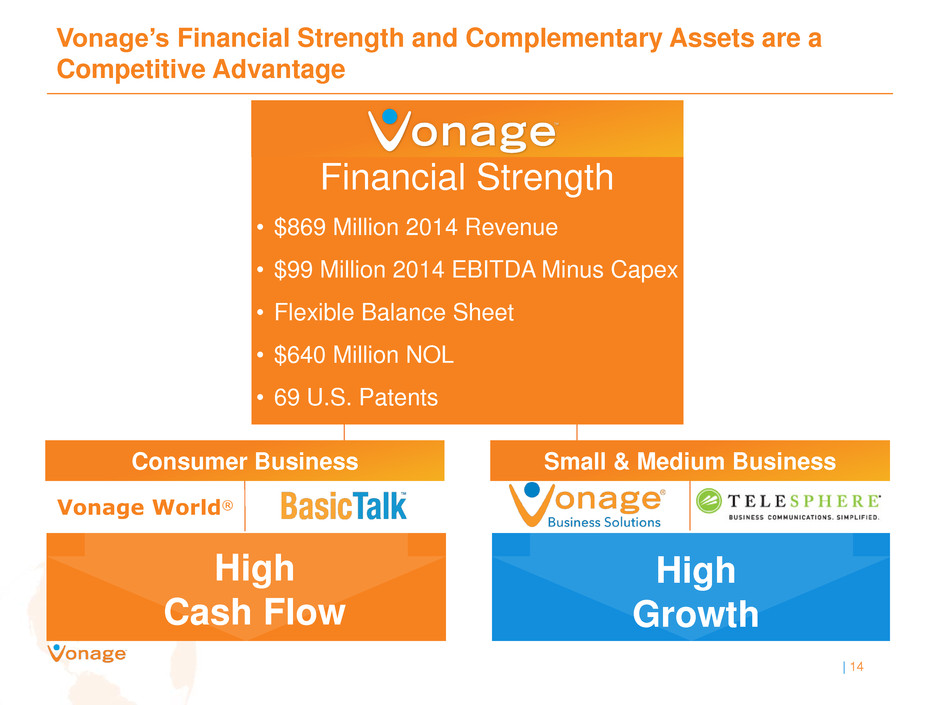
High Growth Small & Medium Business Consumer Business High Cash Flow Vonage World® Vonage’s Financial Strength and Complementary Assets are a Competitive Advantage | 14 Financial Strength • $869 Million 2014 Revenue • $99 Million 2014 EBITDA Minus Capex • Flexible Balance Sheet • $640 Million NOL • 69 U.S. Patents
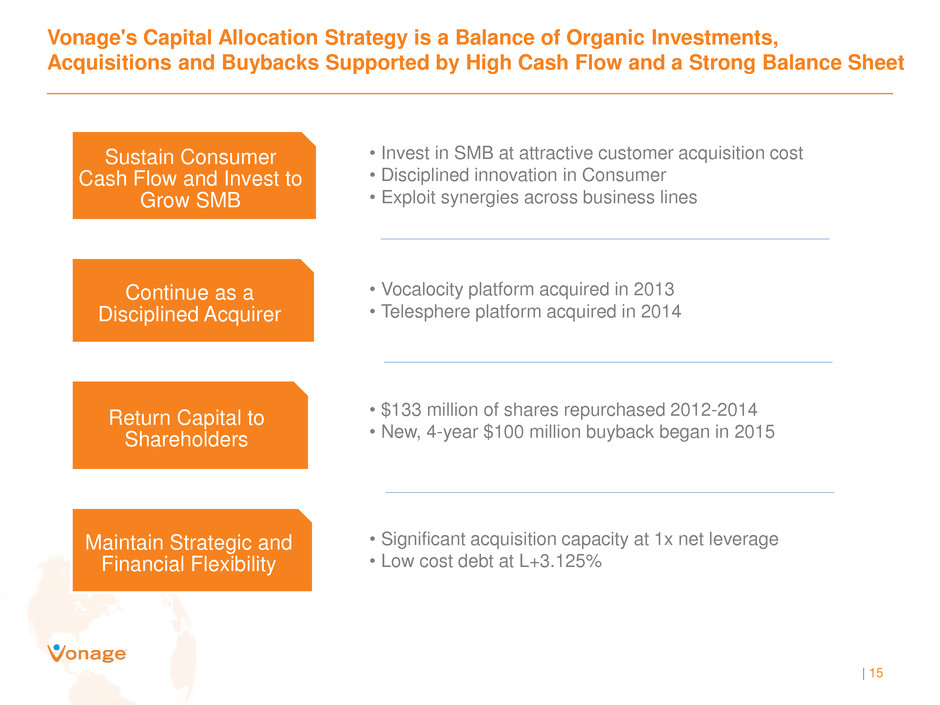
Vonage's Capital Allocation Strategy is a Balance of Organic Investments, Acquisitions and Buybacks Supported by High Cash Flow and a Strong Balance Sheet | 15 • Invest in SMB at attractive customer acquisition cost • Disciplined innovation in Consumer • Exploit synergies across business lines Sustain Consumer Cash Flow and Invest to Grow SMB • Vocalocity platform acquired in 2013 • Telesphere platform acquired in 2014 Continue as a Disciplined Acquirer • $133 million of shares repurchased 2012-2014 • New, 4-year $100 million buyback began in 2015 Return Capital to Shareholders • Significant acquisition capacity at 1x net leverage • Low cost debt at L+3.125% Maintain Strategic and Financial Flexibility
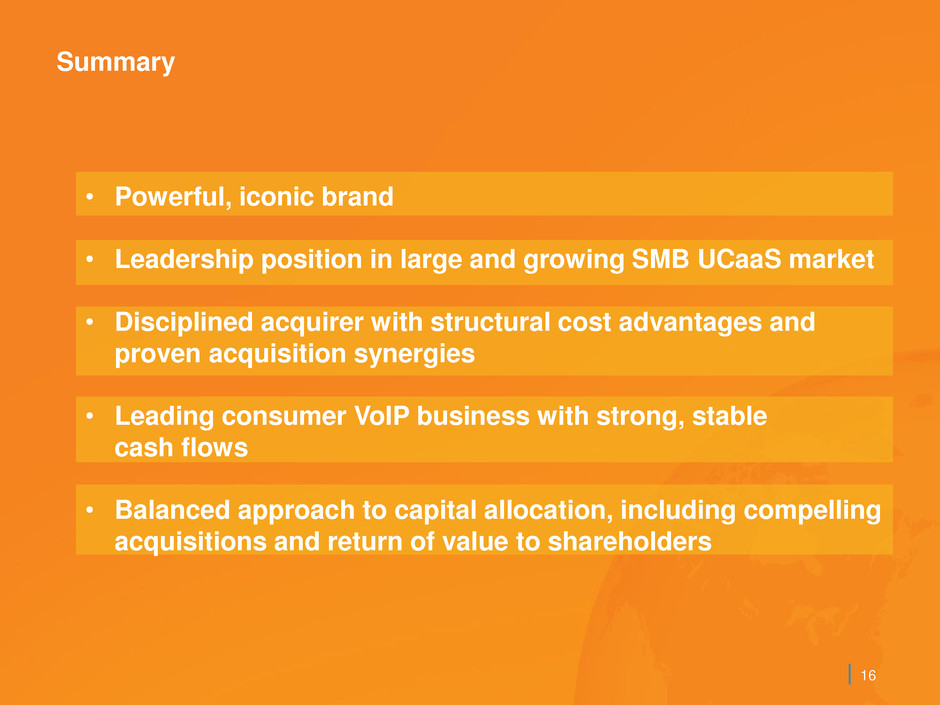
Summary | 16 • Powerful, iconic brand • Leadership position in large and growing SMB UCaaS market • Disciplined acquirer with structural cost advantages and proven acquisition synergies • Leading consumer VoIP business with strong, stable cash flows • Balanced approach to capital allocation, including compelling acquisitions and return of value to shareholders

Appendix
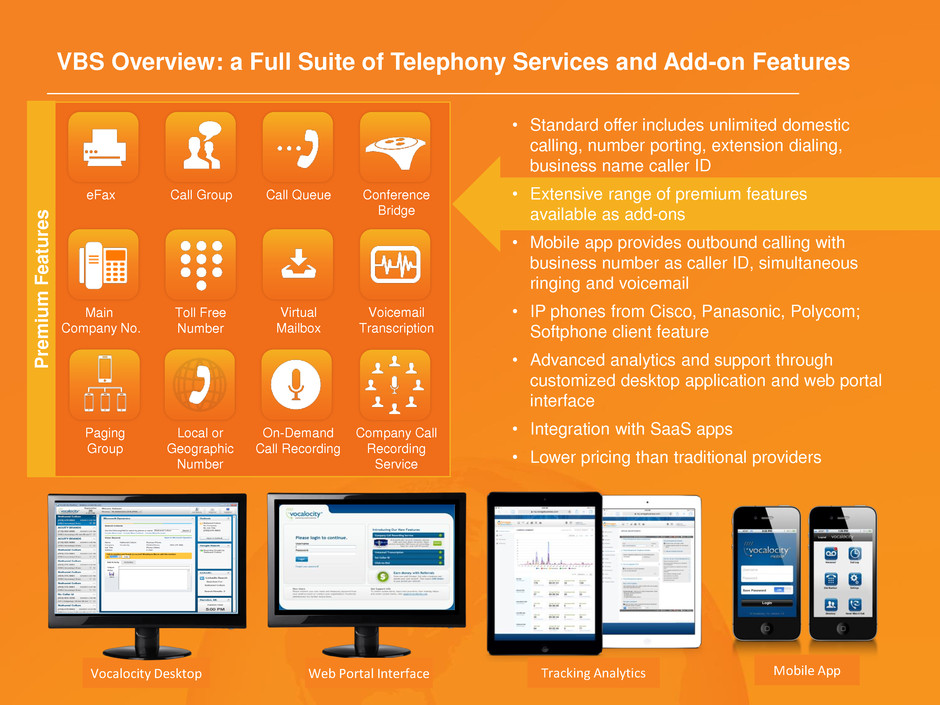
VBS Overview: a Full Suite of Telephony Services and Add-on Features Tracking Analytics P rem iu m F eat u re s Mobile App Vocalocity Desktop eFax Call Group Call Queue Conference Bridge Main Company No. Toll Free Number On-Demand Call Recording Virtual Mailbox Voicemail Transcription Company Call Recording Service Paging Group Local or Geographic Number Web Portal Interface • Standard offer includes unlimited domestic calling, number porting, extension dialing, business name caller ID • Extensive range of premium features available as add-ons • Mobile app provides outbound calling with business number as caller ID, simultaneous ringing and voicemail • IP phones from Cisco, Panasonic, Polycom; Softphone client feature • Advanced analytics and support through customized desktop application and web portal interface • Integration with SaaS apps • Lower pricing than traditional providers

Telesphere Provides a Comprehensive Suite of UCaaS Products and Services for Larger SMB and Enterprise Customers Key UCaaS Solutions • Virtual PBX • Collaboration (Web, IM&P) • Mobile office • Contact center • Call recording • Multipoint HD video conferencing • CRM • Lync integration • SMS text QoS Management / Security • MPLS • Managed firewall • SIP trunking Potential Future Services • Virtual desktop • Expanded CRM/IVR integration • Lync hosting • Cloud enterprise storage Services provisioned through a proprietary and scalable auto- provisioning and customer management platform highly valued for large scale installations

Non-GAAP Reconciliation Three Months Ended For the Years Ended December 31, September 30, December 31, 2014 2014 2013 2014 2013 Income from operations..........................................................................................................................................................................................................................................................................................................................................................................................................................................................................................................................................................................................................................................................................................................................................................................................................................................................................................................................................................................................................................................13,832$ 11,637$ 6,636$ 47,807$ 52,349$ Depreciation and amortization...................................................................................................................................................................................................................................................................................................................................................................................................................................................................................................................................................................................................................................................................................................................................................................................................................................................................................................................................................................................................................................14,264 12,346 11,427 51,407 36,066 Share-based expense.............................................................................................................................................................................................................................................................................................................................................................................................................................................................................................................................................................................................................................................................................................................................................................................................................................................................................................................................................................................................................................................4,171 5,785 4,758 21,070 17,843 Acquisition related costs....................................................................................................................................................................................................................................................................................................................................................................................................................................................................................................................................................................................................................................................................................................................................................................................................................................................................................................................................................................................................................................... 2,446 2 2,088 2,566 2,768 Net loss attributable to noncontrolling interest................................................................................................................................................................................................................................................................................................................................................................................................................................................................................................................................................................................................................................................................................................................................................................................................................................................................................................................................................................................................................ 110 191 266 819 488 Adjusted EBITDA.................................................................................................................................................................................................................................................................................................................................................................................................................................................................................................................................................................................................................................................................................................................................................................................................................................................................................................................................................................................................................................................34,823$ 29,961$ 25,175$ 123,669$ 109,514$ Less: Capital expenditures........................................................................................................................................................................................................................................................................................................................................................................................................................................................................................................................................................................................................................................................................................................................................................................................................................................................................................................................................................................................................................................ (5,200) (4,137) (2,881) (12,436) (9,889) Acquisition and development of software assets...................................................................................................................................................... (1,850) (2,938) (3,541) (11,819) (12,291) Adjusted EBITDA Minus Capex..................................................................................................................................................................................................................................................................................................................................................................................................................................................................................................................................................................................................................................................................................................................................................................................................................................................................................................................................................................................................................................... 27,773$ 22,886$ 18,753$ 99,414$ 87,334$ VONAGE HOLDINGS CORP. RECONCILIATION OF GAAP INCOME FROM OPERATIONS TO ADJUSTED EBITDA AND TO ADJUSTED EBITDA MINUS CAPEX (Dollars in thousands) (unaudited) December 31,
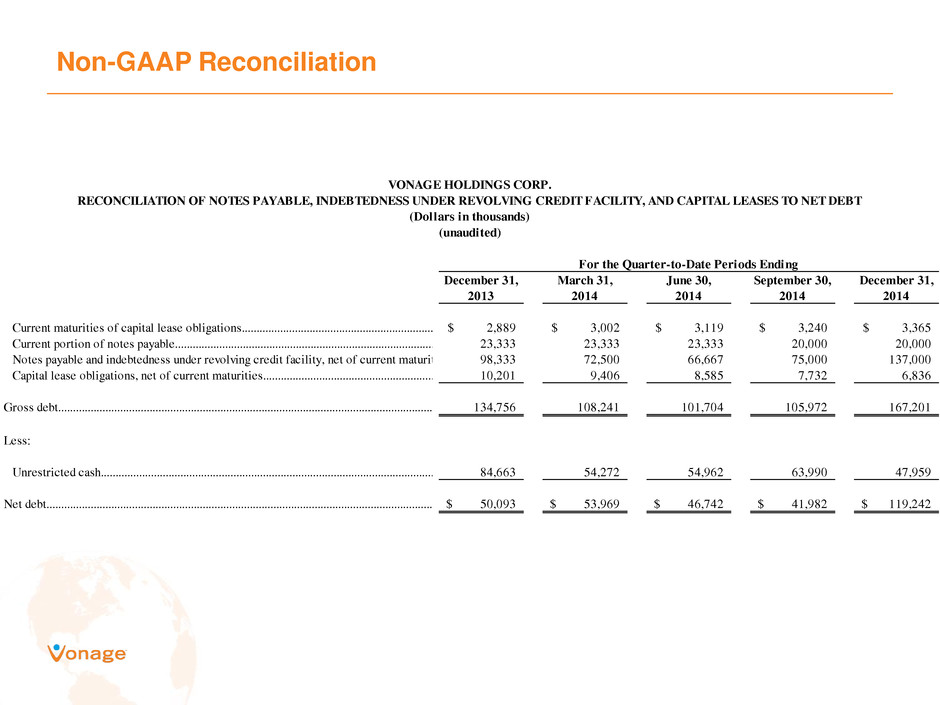
Non-GAAP Reconciliation RECONCILIATION OF NOTES PAYABLE, INDEBTEDNESS UNDER REVOLVING CREDIT FACILITY, AND CAPITAL LEASES TO NET DEBT (Dollars in thousands) (unaudited) December 31, March 31, June 30, September 30, December 31, 2013 2014 2014 2014 2014 Current maturities of capital lease obligations.................................................................................................................................................................................................................................................................................................................................................................................................................................................................................................................................................................................................................................................................................................................................................................................................................................................................................................................................................................................................................2,889$ 3,002$ 3,119$ 3,240$ 3,365$ Current portion of notes payable................................................................................................................................................................................................................................................................................................................................................................................................................................................................................................................................................................................................................................................................................................................................................................................................................................................................................................................................................................................................................................23,333 23,333 23,333 20,000 20,000 Notes payable and indebtedness under revolving credit facility, net of current maturities.......................................................................................................................................................................................................................................................................................................................................................................................................................................................................................................................................................................................................................................................................................................................................................................................................................................................................................................................................................................98,333 72,500 66,667 75,000 137,000 Capital lease obligations, net of current maturities............................................................................................................................................................................................................................................................................................................................................................................................................................................................................................................................................................................................................................................................................................................................................................................................................................................................................................................................................................................................................10,201 9,406 8,585 7,732 6,836 Gross debt......................................................................................................................................................................................................................................................................................................................................................................................................................................................................................................................................................................................................................................................................................................................................................................................................................................................................................................................................................................................................................................................134,756 108,241 101,704 105,972 167,201 Less: Unrestricted cash...............................................................................................................................................................................................................................................................................................................................................................................................................................................................................................................................................................................................................................................................................................................................................................................................................................................................................................................................................................................................................................................84,663 54,272 54,962 63,990 47,959 Net debt........................................................................................................................................................................................................................................................................................................................................................................................................................................................................................................................................................................................................................................................................................................................................................................................................................................................................................................................................................................................................................................................50,093$ 53,969$ 46,742$ 41,982$ 119,242$ VONAGE HOLDINGS CORP. For the Quarter-to-Date Periods Ending
