Attached files
| file | filename |
|---|---|
| EXCEL - IDEA: XBRL DOCUMENT - American Residential Properties, Inc. | Financial_Report.xls |
| EX-31.2 - EXHIBIT 31.2 - American Residential Properties, Inc. | arpi12312014ex312.htm |
| EX-21.1 - EXHIBIT 21.1 - American Residential Properties, Inc. | arpi12312014ex211.htm |
| EX-32.2 - EXHIBIT 32.2 - American Residential Properties, Inc. | arpi12312014ex322.htm |
| EX-23.1 - EXHIBIT 23.1 - American Residential Properties, Inc. | arpi12312014ex231.htm |
| EX-31.1 - EXHIBIT 31.1 - American Residential Properties, Inc. | arpi12312014ex311.htm |
| EX-12.1 - EXHIBIT 12.1 - American Residential Properties, Inc. | arpi12312014ex121.htm |
| EX-32.1 - EXHIBIT 32.1 - American Residential Properties, Inc. | arpi12312014ex321.htm |
UNITED STATES
SECURITIES AND EXCHANGE COMMISSION
Washington, D.C. 20549
_______________________________________
FORM 10-K
_______________________________________
ý | ANNUAL REPORT PURSUANT TO SECTION 13 or 15(d) OF THE SECURITIES EXCHANGE ACT OF 1934 |
For the fiscal year ended December 31, 2014
or
¨ | TRANSITION REPORT PURSUANT TO SECTION 13 or 15(d) OF THE SECURITIES EXCHANGE ACT OF 1934 |
For the transition period from to .
Commission File Number 001-35899
_______________________________________
AMERICAN RESIDENTIAL PROPERTIES, INC.
(Exact name of registrant as specified in its charter)
_______________________________________
Maryland | 45-4941882 | |
(State or other jurisdiction of incorporation or organization) | (I.R.S. Employer Identification Number) | |
7047 East Greenway Parkway, Suite 350 Scottsdale, AZ | 85254 | |
(Address of principal executive offices) | (Zip Code) | |
(480) 474-4800
(Registrant’s telephone number, including area code)
_______________________________________
Securities registered pursuant to Section 12(b) of the Act: | ||
Title of each class | Name on each exchange on which registered | |
Common stock, $0.01 par value per share | New York Stock Exchange | |
Securities registered pursuant to Section 12(g) of the Act: | ||
None | ||
Indicate by check mark if the registrant is a well-known seasoned issuer, as defined in Rule 405 of the Securities Act. Yes ¨ No ý
Indicate by check mark if the registrant is not required to file reports pursuant to Section 13 or Section 15(d) of the Act. Yes ¨ No ý
Indicate by check mark whether the registrant: (1) has filed all reports required to be filed by Section 13 or 15(d) of the Securities Exchange Act of 1934 during the preceding 12 months (or for such shorter period that the registrant was required to file such reports), and (2) has been subject to such filing requirements for the past 90 days. Yes ý No ¨
Indicate by check mark whether the registrant has submitted electronically and posted on its corporate Web site, if any, every Interactive Data File required to be submitted and posted pursuant to Rule 405 of Regulation S-T (§232.405 of this chapter) during the preceding 12 months (or for such shorter period that the registrant was required to submit and post such files). Yes ý No ¨
Indicate by check mark if disclosure of delinquent filers pursuant to Item 405 of Regulation S-K (§229.405 of this chapter) is not contained herein, and will not be contained, to the best of the registrant's knowledge, in definitive proxy or information statements incorporated by reference in Part III of this Form 10-K or any amendment to this Form 10-K. ý
Indicate by check mark whether the registrant is a large accelerated filer, an accelerated filer, a non-accelerated filer or a smaller reporting company. See definitions of “large accelerated filer,” “accelerated filer” and “smaller reporting company” in Rule 12b-2 of the Exchange Act.
Large accelerated filer | ¨ | Accelerated filer | ý | Non-accelerated filer (do not check if a smaller reporting company) | ¨ | Smaller reporting company | ¨ |
Indicate by check mark whether the registrant is a shell company (as defined in Rule 12b-2 of the Exchange Act). Yes ¨ No ý
The aggregate market value of the voting stock held by nonaffiliates of the registrant as of June 30, 2014 was $599.7 million based on the closing share price as quoted on the New York Stock Exchange on that day.
As of March 11, 2015 there were 32,195,280 shares of common stock, $0.01 par value per share, outstanding.
_______________________________________
DOCUMENTS INCORPORATED BY REFERENCE
Portions of the registrant's Definitive Proxy Statement with respect to its 2015 Annual Meeting of Stockholders are incorporated by reference into this Annual Report on Form 10-K in response to Part III, Items 10,11,12, 13 and 14.
AMERICAN RESIDENTIAL PROPERTIES, INC. | ||
INDEX | ||
Item No. | Page | |
PART I | ||
PART II | ||
PART III | ||
PART IV | ||
2
PART I
Item 1. | Business. |
In this Annual Report on Form 10-K, we refer to American Residential Properties, Inc., a Maryland corporation, as "we," "us," "our," "the Company" or "ARP," unless we specifically state otherwise or the context indicates otherwise. In addition, when used herein, the "Operating Partnership" refers to American Residential Properties OP, LP., a Delaware limited partnership.
Forward-Looking Statements
Some of the statements included in this Annual Report on Form 10-K constitute forward-looking statements within the meaning of the federal securities laws. Forward-looking statements relate to expectations, beliefs, projections, forecasts, future plans and strategies, anticipated events or trends and similar expressions concerning matters that are not historical facts. These statements are only predictions. We caution that forward-looking statements are not guarantees. Actual events or our investments and results of operations could differ materially from those expressed or implied in the forward-looking statements. Forward-looking statements are typically identified by the use of terms such as “may,” “will,” “should,” “expect,” “could,” “intend,” “plan,” “anticipate,” “estimate,” “believe,” “continue,” “predict,” “potential” or the negative of such terms and other comparable terminology. You can also identify forward-looking statements by discussions of strategy, plans or intentions.
The forward-looking statements included in this report reflect our current views about future events and are subject to numerous known and unknown risks, uncertainties, assumptions and changes in circumstances that may cause our actual results to differ significantly from those expressed in any forward-looking statement. Statements regarding the following subjects, among others, may be forward looking:
• | our business and investment strategy; |
• | our projected operating results; |
• | economic, demographic or real estate developments in our markets; |
• | home value appreciation, employment growth, residential building permits, median household income and household formation in our markets; |
• | defaults on, early terminations of or non-renewal of leases by our tenants; |
• | our ability to identify properties to acquire and completing acquisitions; |
• | increased time and/or expense to gain possession and restore properties; |
• | our ability to successfully restore, lease and manage acquired properties; |
• | projected operating costs; |
• | rental rates or vacancy rates; |
• | our ability to obtain financing; |
• | general volatility of the markets in which we participate; |
• | our expected investments; |
• | interest rates and the market value of our target assets; |
• | impact of changes in governmental regulations, tax law and rates and similar matters; |
• | our ability to maintain our qualification as a real estate investment trust, or REIT, for federal income tax purposes; |
• | availability of qualified personnel; |
• | estimates relating to our ability to make distributions to our stockholders in the future; |
• | our understanding of our competition; and |
• | market trends in our industry, real estate values, the debt securities markets or the general United States economy. |
The forward-looking statements are based on our beliefs, assumptions and expectations of future events, taking into account all information currently available to us. Forward-looking statements are not guarantees of future events or of our performance. These beliefs, assumptions and expectations can change as a result of many possible events or factors, not all of
3
which are known to us. Some of these events and factors are described in “Item 1A. Risk Factors” and in “Item 7. Management’s Discussion and Analysis of Financial Condition and Results of Operations” in this Annual Report on Form 10-K and other risks and uncertainties detailed in this and our other reports and filings with the Securities and Exchange Commission, or the SEC. If a change occurs, our business, financial condition, liquidity, cash flows and results of operations may vary materially from those expressed in or implied by our forward-looking statements. New risks and uncertainties arise over time, and it is not possible for us to predict the occurrence of those matters or the manner in which they may affect us. Except as required by law, we are not obligated to, and do not intend to, update or revise any forward-looking statements, whether as a result of new information, future events or otherwise. You should, therefore, not rely on these forward-looking statements as of any date subsequent to the date of this Annual Report on Form 10-K.
General
We are an internally managed real estate company that acquires, owns, renovates and manages single-family homes as rental properties. We own all of our assets and conduct substantially all of our operations through (i) our Operating Partnership, in which we have a 98.2% interest as of December 31, 2014 and for which, through our wholly owned subsidiary, American Residential GP, LLC, we serve as sole general partner, and (ii) American Residential Properties TRS, LLC, or our TRS, which is our taxable REIT subsidiary. We have elected to be taxed as a real estate investment trust, or REIT, for federal income tax purposes commencing with our short taxable year ended December 31, 2012. As a REIT, we are generally not be subject to federal income taxes to the extent that we currently distribute all of our taxable income to our stockholders and meet other specific requirements.
Our primary business is to acquire, restore, lease and manage single-family homes as well-maintained investment properties to generate attractive risk-adjusted returns over the long-term. We employ a disciplined and focused approach to evaluating acquisition opportunities, considering the mix of potential rent yield and future home price appreciation potential when selecting a market and investment. We have the infrastructure to acquire properties through multiple acquisition channels, including sourcing individual properties through auctions and brokers and purchasing portfolios of properties through brokerages or directly from operators, investors or banks. We restore homes to “rent-ready” condition to a standard that we believe appeals to our target tenants’ preferences, enabling us to attract qualified tenants and provide a high level of service to our tenants. We believe that our vertically integrated acquisition and management platform is critical to executing our strategy.
In addition to our primary business, we have a private mortgage financing business that generates attractive returns on invested capital and provides us access to acquisition opportunities and valuable market data.
As of December 31, 2014, we owned 8,893 properties in Arizona, California, Colorado, Florida, Georgia, Illinois, Indiana, Nevada, North Carolina, Ohio, South Carolina, Tennessee and Texas that were 81% leased, and we managed an additional 437 properties for ARP Phoenix Fund I, LP, or Phoenix Fund, in Arizona and Nevada. Phoenix Fund is a private investment fund formed in February 2010 by Stephen G. Schmitz, our Chief Executive Officer and Chairman, and Laurie A. Hawkes, our President and Chief Operating Officer and a member of our Board of Directors, to invest opportunistically in single-family homes as rental properties.
Our principal executive office is located at 7047 E. Greenway Parkway, Suite 350, Scottsdale, Arizona 85254. Our main telephone number is (480) 474-4800. Our web address is www.amresprop.com.
Our History and Capitalization
In October 2008, our founders, Mr. Schmitz and Ms. Hawkes, co-founded American Residential Properties LLC, or ARP LLC, a private investment firm, to capitalize on the extraordinary price deterioration in the single-family housing sector following the collapse in the housing and mortgage industries and began acquiring homes with their own capital. In February 2010, Mr. Schmitz and Ms. Hawkes launched Phoenix Fund.
We were incorporated in Maryland in March 2012 to expand upon Mr. Schmitz and Ms. Hawkes' vision, strategy and platform. As part of our formation transactions, we completed an initial private offering of our common stock in May 2012, raising net proceeds of approximately $208.7 million. In addition, upon the completion of our initial private offering, we acquired substantially all of the assets of American Residential Management, Inc., or ARM, a company co-owned by Mr. Schmitz and Ms. Hawkes, including the proprietary real estate acquisition and management platform developed by our co-founders, pursuant to a contribution and sale agreement between our Operating Partnership and ARM. In December 2012 and January 2013, we raised an additional approximately $139.1 million of net proceeds from a follow-on private offering of our common stock and a small direct private placement of our common stock.
We completed our initial public offering, or IPO, in May 2013, in which we issued 13,700,000 shares of our common stock at a public offering price of $21.00 per share, and we raised approximately $265.1 million of net proceeds, after deducting the
4
underwriting discounts and commissions, structuring fee and other offering expenses payable by us. We deployed the net proceeds from the IPO to acquire, restore, lease and manage single-family homes and to provide short-term private mortgage financing in accordance with our business strategy.
Our Business and Growth Strategies
Our primary objectives are to be a leader in the creation and expansion of the single-family rental business as an institutional-quality asset class with national scale and to generate long-term home price appreciation and provide our stockholders with attractive risk-adjusted returns. We seek to achieve these objectives through the following strategies:
Active Property Management
We seek to ensure tenant satisfaction by providing high-quality service at our self-managed properties. Our internally managed and vertically integrated property management platform allows us to oversee all aspects of our ownership of a rental home, including restoring a newly acquired home, marketing and leasing of the home, ensuring property quality control and opportunistically selling it when appropriate. We believe that internally managed property management allows us to optimize rental revenue, effectively manage expenses, realize economies of scale, standardize brand consistency and maintain direct contact with our tenants. Our senior management team has experience with the acquisition, restoration and management of single-family homes and provides oversight to all facets of our business. We believe our ability to improve asset quality and tenant retention, increase our homes’ useful lives and decrease turnover costs is an important element of our business and is instrumental in driving stockholder returns.
Disciplined Acquisition Strategy
We acquire high-quality single-family homes in select submarkets that meet our disciplined market selection criteria, which include above-average median household incomes, well-regarded school districts, proximity to employment centers and lifestyle amenities, access to transportation routes and public transit and low crime levels. We are focused on acquiring entry level homes with a number of key property characteristics, including: (i) three or more bedrooms; (ii) two or more bathrooms; (iii) post 1990 construction; (iv) master planned communities; and (v) estimated restoration costs of less than 20% of acquisition price. We believe these characteristics attract creditworthy tenants, produce high rental rates and occupancy levels and provide for long-term home price appreciation potential. We have an established acquisition and renovation platform to acquire high-quality single-family homes and source acquisition opportunities through a variety of channels. We source individual property purchases through foreclosure auction, short-sale, real estate owned, or REO, and traditional Multiple Listing Service, or MLS, processes. We also source portfolios of leased and vacant properties through brokerages or directly from operators, investors or banks.
Targeted Geographic Expansion
Our portfolio is diversified across several geographic markets. We continually monitor the markets in which we operate to identify investment opportunities that we believe can generate attractive risk-adjusted returns for our stockholders. We believe that our strategy to maintain and grow a geographically diverse investment portfolio provides us with the ability to expand our market presence where the supply and demand characteristics create the most compelling acquisition and rental opportunities. We select our markets based on a comprehensive set of investment criteria, including strength of rental demand and rates of job growth, population growth and unemployment.
Flexible Capital Structure
Our capital structure provides us with significant financial flexibility and the capacity to fund future growth. On December 31, 2014, our consolidated debt to undepreciated book value was approximately 53%. We have a $500 million senior secured revolving credit facility, or the Credit Facility, with an accordion feature that allows us, assuming our compliance with applicable covenants and at the lenders’ discretion, to borrow up to $750 million if certain criteria are met. As of December 31, 2014, we had $311 million outstanding under the Credit Facility, with an additional availability of approximately $153 million. For more information on the Credit Facility, please see "Item 7. Management's Discussion and Analysis of Financial Condition and Results of Operations" in this report.
Our Business Activities
Acquisitions
We have a disciplined acquisition platform that is capable of acquiring large numbers of properties across all of our acquisition channels in multiple target markets. When identifying desirable markets, we focus on factors such as the magnitude of housing price declines, strength of rental demand, and rates of job growth, population growth and unemployment, providing for attractive potential yields and potential home price appreciation. We use data from a variety of sources and evaluate
5
macroeconomic and microeconomic inputs (including housing market, demographic and economic data). Within markets that meet our selection criteria, we seek to identify the communities that offer the most attractive mix of housing prices, discounts to replacement cost, rental demand and rental rates, which are often characterized by good access to transportation networks and employment centers, quality schools and low levels of crime.
We source acquisition opportunities through a variety of channels, including foreclosure auctions and broker sales (including short-sales, REO and traditional MLS). We also source portfolios of leased and vacant properties through brokerages or directly from operators, investors or banks. Most recently, foreclosure auctions and broker sales have presented the most attractive channels to access a significant supply of quality homes at attractive prices. While foreclosure auctions provide for a limited time frame to complete due diligence, our underwriting involves applying our acquisition parameters, including evaluating property location, estimating the costs of potential eviction of existing occupants and restoration, calculating expected rents and expenses, and reviewing title issues. We have acquired and will continue to acquire properties through direct contracts with various property owners through brokers and portfolio sales from governmental agencies, financial institutions and competitors. Acquisitions through these channels generally allow more time for underwriting to determine the expected rents, expenses and renovation costs, to perform physical property inspections, obtain title insurance and review applicable covenants conditions and restrictions.
Restoration
Nearly all of the properties we purchase require some degree of restoration. We coordinate an initial on-site review of a property to identify the scope of desired restoration. Beyond customary restoration, we identify improvements that we believe will optimize the property’s overall appeal and ability to generate premium rents and an appropriate return on our invested capital. We monitor the entire restoration process, including reviewing bids, managing the restoration itself and maintaining quality-control oversight. We have established relationships with many home improvement professionals, including contractors, electricians, plumbers, painters, HVAC specialists, landscapers and cleaning companies. Due to our scale, we are able to negotiate discounted pricing both through national purchasing programs and in local markets with various suppliers of appliances, fixtures and building materials.
Leasing
Consistent with our underwriting at the time of acquisition, we establish rental rates based on local market conditions and are responsible for collecting and processing rent. Factors considered when establishing rents include prevailing rental rates for comparable properties, weighing factors such as the size and age of the home, neighborhood characteristics and proximity to lifestyle amenities. We use local leasing agents who interface with potential tenants and our internal leasing staff. Properties are marketed through multiple channels, including our website, Internet-based marketing strategies, MLS, yard signage and local brokers. Our leases with residential tenants are typically written with a term of one year, using standardized leases appropriate for each jurisdiction, and generally contain customary provisions applicable to that market.
Rigorous tenant underwriting is critical in our effort to lease our self-managed properties to creditworthy tenants that we believe are likely to maintain the home. We evaluate prospective tenants based on established guidelines and review financial data and metrics, such as household income, tenure at current job and rent as a percentage of household income. We also review non-financial factors, such as household size and rental history.
Property Management
We provide the continuum of property management services, including securing a property upon acquisition, coordinating with utility companies, overseeing the restoration process, managing the leasing process, communicating with tenants, collecting rents, conducting periodic inspections, managing routine property maintenance and repair needs, paying applicable taxes and HOA fees and interfacing with vendors and contractors.
We perform property management functions primarily out of our corporate office in Scottsdale, Arizona and with supporting functions performed through regional offices in certain of our target markets. The following functions are performed internally by our employees with respect to our self-managed properties: communicate with and receive all general inquiries and maintenance requests from our tenants; coordinate, supervise, approve and monitor completion of required work with third-party vendors; coordinate and supervise periodic property inspections; coordinate, bid, award, supervise and monitor restoration and re-tenancy projects performed by third-party contractors; interface and comply with all applicable HOA obligations. By performing these functions internally with respect to our self-managed portfolio, we believe that we establish improved communications, foster direct relationships with tenants and gain tighter control over the quality and cost of restorations and property maintenance.
6
Additionally, our tenants can make maintenance requests on a 24-hour basis through our website or emergency telephone hotline, both of which are administered and managed from our headquarters office. Upon receiving a maintenance request, our maintenance personnel and systems identify an appropriate service provider from our network of vendor relationships and dispatch repair personnel to the home.
Technology and Systems
We believe that robust information technology is essential to acquire and manage a large-scale portfolio of single-family rental homes. We have a scalable real estate acquisition and management platform that has aided in the expansion of our business. Our systems are designed to collect housing, demographic and economic data to support our ongoing acquisition activities. Our systems also accumulate and analyze data at the individual property and portfolio levels, including economic and physical information about a property throughout the period of our ownership and management.
Our Financing Strategy
We have financed our operations and acquisitions to date through the issuance of equity securities and exchangeable senior notes, borrowings under our Credit Facility and the issuance and sale of single-family rental pass-through certificates that represent beneficial ownership interests in a loan, or our Securitization Loan. In the future, we expect to finance our operations, in part, with borrowings under our Credit Facility and with various other types of indebtedness.
Competition
We face competition from different sources in each of our two primary activities, acquiring properties and renting our properties and, to a lesser extent, in our private mortgage financing activities. We believe our primary competitors in acquiring our target properties through individual acquisitions are individual investors, small private investment partnerships looking for one-off acquisitions of investment properties that can either be rented or restored and sold, larger investors, including private equity funds and other REITs, that are seeking to capitalize on the same market opportunity that we have identified, and owner occupants. Our primary competitors in acquiring portfolios are private equity investors, REITs and sizeable institutional investors. These same competitors may also compete with us for tenants. Competition may increase the prices for properties that we would like to purchase, reduce the amount of rent we may charge at our properties, reduce the occupancy of our portfolio and adversely impact our ability to achieve attractive yields. However, we believe that our vertically integrated real estate acquisition and management platform and market knowledge in markets that meet our selection criteria provide us with competitive advantages.
Management of Phoenix Fund
As of December 31, 2014, we managed 437 properties for Phoenix Fund, a fully committed private investment fund formed by Mr. Schmitz and Ms. Hawkes in 2010 to invest opportunistically in single-family homes as rental properties. Our TRS manages the properties of Phoenix Fund for a fee pursuant to a management agreement with Phoenix Fund. See "Item 1A. Risk Factors--Risks Related to Conflicts of Interest--Mr. Schmitz and Ms. Hawkes have duties to Phoenix Fund which may create conflicts of interest, and these conflicts may not be resolved in our favor, which could adversely affect us."
Risk Management
We face various forms of risk in our business ranging from broad economic, housing market and interest rate risks, to more specific factors, such as credit risk related to our tenants, re-leasing of properties and competition for properties. We believe that the housing market and credit risk expertise, research and analytical tools developed by our experienced management team will allow us to manage these risks.
Insurance
We carry liability and property insurance covering most of the properties in our portfolio under blanket insurance policies. All of our properties are covered by liability and property insurance, either carried by us or by preferred operators under longer-term arrangements with the operators. We believe the policy specifications and insured limits are appropriate and adequate for our properties given the relative risk of loss, the cost of the coverage and industry practice; however, our insurance coverage may not be sufficient to cover all losses we may sustain. Further, there are certain types of extraordinary losses, such as losses from terrorism and earthquakes, for which we may not have adequate insurance or coverage. It is our practice to obtain title insurance policies for all properties as soon as practicable after acquisition.
7
Regulation
General
Our properties are subject to various covenants, laws and ordinances and certain of our properties are also subject to the rules of the various homeowner associations, or HOAs, where such properties are located. We believe that we are in material compliance with such covenants, laws, ordinances and rules, and we also require that our tenants agree to comply with such covenants, laws, ordinances and rules in their leases with us.
Fair Housing Act
The Fair Housing Act, or FHA, its state law counterparts and the regulations promulgated by the United States Department of Housing and Urban Development, or HUD, and various state agencies, prohibit discrimination in housing on the basis of race or color, national origin, religion, sex, familial status (including children under the age of 18 living with parents or legal custodians, pregnant women and people securing custody of children under the age of 18), handicap or, in some states, financial capability. We believe that our properties are in substantial compliance with the FHA and other regulations.
Environmental Matters
As a current or prior owner of real estate, we are subject to various federal, state and local environmental laws, regulations and ordinances, and we could be liable to third parties as a result of environmental contamination or noncompliance at our properties, even if we no longer own such properties. See “Risk Factors—Risks Related to the Real Estate Industry Generally—Contingent or unknown liabilities could adversely affect our financial condition.”
REIT Qualification
We have elected to be taxed as a REIT for federal income tax purposes. Our qualification as a REIT depends upon our ability to meet on a continuing basis, through actual investment and operating results, various complex requirements under the Internal Revenue Code of 1986, as amended, or the Code, relating to, among other things, the percentage of income that we earn from specified sources, the percentage of our assets that fall within specified categories, the diversity of our capital stock ownership, and the percentage of our earnings that we distribute. We believe that we have been organized in conformity with the requirements for qualification and taxation as a REIT under the Code and that our intended manner of operation will enable us to continue to meet the requirements for qualification and taxation as a REIT. So long as we qualify as a REIT, we generally will not be subject to federal income tax on our REIT taxable income that we distribute currently to our stockholders. If we fail to qualify as a REIT in any taxable year and do not qualify for certain statutory relief provisions, we will be subject to federal income tax at regular corporate rates and may be precluded from qualifying as a REIT for the subsequent four taxable years following the year during which we fail to qualify as a REIT. Even if we qualify as a REIT, we may be subject to certain federal, state and local taxes on our income or property. In addition, our TRS will be subject to federal, state and local taxes on its income or property.
Investment Company Act of 1940
We intend to conduct our operations so that neither we nor any of our subsidiaries are required to register as an investment company under the Investment Company Act of 1940, as amended, or the 1940 Act.
Employees
As of December 31, 2014, we had 157 employees. Our employees are not covered by a collective bargaining agreement.
Available Information
Our website address is www.amresprop.com. Information on our website is not a part of this Annual Report on Form 10-K. We make available free of charge on our website (on the Investor Relations page under "SEC Filings"), our annual reports on Form 10-K, quarterly reports on Form 10-Q, current reports on Form 8-K and any amendments to those reports, as filed or furnished pursuant to Section 13(a) or 15(d) of the Securities Exchange Act of 1934, as amended, or the Exchange Act, as well as our proxy statements with respect to our annual meetings of stockholders, as soon as reasonably practicable after we electronically file such material with, or furnish it to, the SEC. All reports filed with the Securities and Exchange Commission, or SEC, may be read and copied at the SEC's public reference room at 100 F Street, N.E., Washington, D.C. 20549. Further information regarding the operation of the public reference room may be obtained by calling 1-800-SEC-3300. In addition, all of our reports filed with the SEC are available at the SEC's website at www.sec.gov.
8
Item 1A. | Risk Factors. |
Investment in our capital stock involves significant risks. If any of the risks discussed in this report occurs, our business, financial condition, liquidity and results of operations could be materially and adversely affected. The risk factors set forth below are not the only risks that may affect us. Some statements in this report, including statements in the following risk factors, constitute forward-looking statements. Please refer to the section entitled "Forward-Looking Statements" in Item 1 of this report.
Risks Related to Our Business
We are an early entrant in an emerging industry, and the long-term viability of our business strategy on an institutional scale is unproven.
Large-scale institutional investment in single-family residential homes as investment properties for rent is a relatively recent business strategy that has emerged out of the mortgage and housing crisis that began in late 2007. Prior to that time, single-family homes generally were not viewed as a viable asset for investment on a large scale by institutional investors. Consequently, the long-term viability of single-family residential investment strategies at an institutional scale has not yet been proven. As an early entrant in this emerging industry, we are subject to the risk that investing in and managing single-family rental homes may not prove to be a viable long-term business strategy for a permanent capital vehicle at an institutional scale. If it turns out that our strategy is not a viable long-term business strategy for a permanent capital vehicle at an institutional scale, we may not be able to achieve the growth and investment returns that we seek.
We are a recently organized corporation with a limited operating history, and we may not be able to successfully operate our business or generate sufficient operating cash flows to make or sustain distributions to our stockholders.
We were incorporated in March 2012 and commenced investment activities in May 2012, and we have a limited operating history. Our financial condition, results of operations and ability to make or sustain distributions to our stockholders will depend on many factors, including:
• | our ability to identify attractive acquisition opportunities that are consistent with our investment strategy; |
• | our ability to consummate acquisitions on favorable terms; |
• | our ability to achieve high occupancy rates and target rent levels; |
• | our ability to contain restoration, maintenance, marketing and other operating costs; |
• | real estate appreciation or depreciation in our markets; |
• | the level and volatility of interest rates, and our access to short- and long-term financing on favorable terms; |
• | our ability to absorb costs that are beyond our control, such as real estate taxes, HOA fees, insurance premiums, litigation costs and compliance costs; |
• | our ability to adapt to judicial and regulatory developments affecting landlord-tenant relations that may affect or delay our ability to dispossess or evict occupants or increase rents; |
• | our ability to respond to changes in population, employment or homeownership trends in our markets; and |
• | economic conditions in our markets, as well as the condition of the financial and real estate markets and the economy generally. |
We have many competitors and may not become an industry leader.
Several institutional investors have begun acquiring single-family homes on a large scale. Traditionally, foreclosed properties and loans secured by properties in pre-foreclosure were sold individually to private home buyers and small-scale investors. The sale of these assets in portfolios and the entry into this market of large, well-capitalized institutional investors, including us, are relatively recent trends, which we expect to intensify in the near future. Other REITs and investment funds have deployed and are expected to continue to deploy in the future, significant amounts of capital in the single-family housing sector and may have investment objectives that overlap with ours. In acquiring our target assets, we compete with a variety of investors, including private home buyers, small-scale investors and well-capitalized institutional investors. We also face increasing competition in our private mortgage financing business. Some of our competitors may have greater financial, technical, leasing, marketing and other resources than we do. Some competitors may have a lower cost of capital and access to capital sources that may not be available to us. These advantages of our competitors may adversely affect our ability to become an industry leader.
9
Our single-family homes may be unable to compete successfully for tenants.
Our single-family homes compete for tenants with other single-family homes, including those owned by Phoenix Fund, and multi-family housing options, such as apartments and condominiums. Some of these competitors may offer more attractive properties or lower rents than we do, and they may attract the high-quality tenants to whom we seek to lease our properties. Additionally, some competing housing options may qualify for governmental subsidies that may make such options more affordable and therefore more attractive than our properties. Competition for tenants could reduce our occupancy and rental rates and adversely affect us.
We intend to opportunistically expand our scale of operations and make acquisitions even if the rental and housing markets are not as favorable as they have been in recent months, which could adversely impact anticipated yields.
Our long-term growth depends on the availability of acquisition opportunities in desired markets at attractive pricing levels. We believe various factors and market conditions have made homes available for purchase at prices that are significantly below replacement cost in many markets. However, we expect that in the future housing prices will stabilize and return to more normalized levels, and therefore future acquisitions may be more costly and result in lower yields. There are many factors that may cause a recovery in the housing market that would result in future acquisitions becoming more expensive and possibly less attractive than recent past and present opportunities, including:
• | improvements in the overall economy and job market; |
• | a resumption of consumer lending activity and greater availability of consumer credit; |
• | improvements in the pricing and terms of mortgage-backed securities; |
• | increasing competition for single-family assets from private investors, entities with similar investment objectives to ours and owner-occupants; and |
• | tax or other government incentives that encourage homeownership. |
We will continue acquiring properties as long as we believe such properties offer an attractive total return opportunity. Accordingly, future acquisitions may have lower yield characteristics than recent past and present opportunities, and if such future acquisitions are funded through equity issuances, the yield and cash available for distribution per share will be reduced and the market price of our common stock may decline.
The past performance of our senior management and our limited operating history may not be indicative of our future results.
You should not rely upon the past performance of our senior management, as their past performance at Phoenix Fund, ARM or in their other prior professional endeavors may not be indicative of our future results. Furthermore, we only commenced our investment activities in May 2012, and our limited operating history and the prior operating history of our senior management may not be indicative of our future results.
Our success depends to a significant degree upon the continued contributions of our management and certain key personnel. If we were to lose the benefit of the experience, efforts and abilities of one or more of these individuals, particularly our founders, our operating results could suffer.
Our ability to achieve our investment objective and to make distributions to our stockholders depends upon the performance of our management team. We rely on our management team to, among other things, identify and consummate acquisitions, design and implement our financing strategies, manage our investments and conduct our day-to-day operations. We cannot guarantee the continued employment of any of our key personnel, who may choose to leave our company for any number of reasons, such as other business opportunities, differing views on our strategic direction or other disagreements. We also rely on the experience, efforts and abilities of our founders, Mr. Schmitz and Ms. Hawkes, each of whom may be difficult to replace and our operating results could suffer.
Our future success depends, in part, upon our ability to efficiently hire and retain highly skilled managerial, investment, financial and operational personnel.
The growth of our business will require us to hire additional qualified managerial, investment, financial and operational personnel, including hiring in various local markets. Competition for such highly skilled personnel is intense. We cannot assure you that we will be successful in attracting and retaining such skilled personnel or in integrating any new personnel into our organization. Moreover, additional employees could result in a substantial increase in compensation expense that may not be offset with additional revenue.
10
Operating our business on a larger scale could result in substantial increases in our expenses.
One of our goals is to implement our single-family rental business nationally. Our business model assumes that we can successfully use our vertically integrated platform to acquire and manage single-family homes on a larger scale than we have done to date without a directly proportional increase in our expenses. As our business grows in size and complexity, we can provide no assurance that our management platform will ultimately prove to be “scalable,” we will be able to achieve economies of scale, we will be able to manage additional properties or grow our business without incurring significant additional expenses.
Our investments are, and will continue to be, concentrated in the single-family housing sector and in a number of markets nationally. This exposes us to the risk of downturns in that sector or in such markets, and we would be adversely affected by an economic downturn or other adverse events impacting the single-family housing sector or any of such markets.
Our investment and geographic concentrations expose us to the risk of economic downturns and adverse regulatory, environmental or other developments in the single-family housing sector or any of the markets in which our properties are located, to a greater extent than if our strategy encompassed other sectors of the real estate industry and additional markets.
In addition to general, regional, national and international economic conditions, our business will be impacted by the economic conditions in the specific geographic areas and markets in which we operate. We intend to continue to acquire and manage single-family homes and to provide short-term private mortgage financing secured by single-family homes located in markets where we are currently invested, which, as of December 31, 2014, include the following: Phoenix, Arizona; the Central Valley and Inland Empire regions of California; Florida; Atlanta, Georgia; Chicago, Illinois; Indianapolis, Indiana; Charlotte, Raleigh and Winston-Salem, North Carolina; Nashville, Tennessee; and Dallas and Houston, Texas.
A significant assumption underlying our investment strategy is our belief that property values and operating fundamentals for single-family homes in these markets will improve significantly over the next several years. We can provide no assurance that this assumption will prove to be correct.
Our dependence upon local, third-party service providers may harm our financial results or reputation if the third parties fail to perform.
Though we are internally managed, we use local, third-party vendors and service providers to provide certain services for our properties. For example, we regularly rely on third-party home improvement professionals, leasing agents and property management companies to provide services to many of our properties. Selecting, managing and supervising these third-party service providers requires significant resources and expertise. We do not have exclusive or long-term contractual relationships with any of these third-party providers, and we can provide no assurance that we will have uninterrupted or unlimited access to their services. If we do not select, manage and supervise appropriate third parties to provide these services, our reputation and financial results may suffer. Notwithstanding our efforts to implement and enforce strong policies and practices regarding service providers, we may not successfully detect and prevent fraud, incompetence or theft by our third-party service providers. In addition, any removal or termination of third-party service providers would require us to seek new vendors or providers, which would create delays and adversely affect our operations. Poor performance by third-party service providers will reflect poorly on us and could significantly damage our reputation among desirable tenants. In the event of fraud or misconduct by a third party, we could also be exposed to material liability and be held responsible for damages, fines and/or penalties.
Through our preferred operators, we lease a number of our properties to third-party property operators pursuant to master leases that have longer terms than our leases with individual tenants who lease our properties directly from us.
As of December 31, 2014, 594 of our properties were leased to third-party property operators pursuant to long-term agreements. These operators in turn sub-lease these properties to tenants, and the operators are obligated to pay us rent and bear all costs associated with the properties, such as insurance, real estate taxes, HOA fees and maintenance costs. To the extent these operators do not maintain sufficient occupancy or rental rates at the properties, it is possible that they will not meet their obligations under the lease, including paying rent to us. Moreover, if an operator defaults on its lease with us, we would be required to find a replacement operator or operate the properties ourselves. No assurance can be given that we would be able to locate acceptable replacement operators on terms as favorable as we previously did. Moreover, if we choose to operate the properties ourselves it could increase our costs, especially if we were required to establish a local office to manage the properties.
Long-term leases may not result in fair market lease rates over time; therefore, our income and cash available for distribution to our stockholders could be lower than if we did not enter into long-term leases.
Through our preferred operators, we enter into long-term leases with third-party property operators relating to portfolios of properties. These operators, in turn, lease the properties out to individual tenants. Our longer-term leases with third-party operators provide for rent increases over time and require that the operators pay us a portion of their gross sub-lease revenue in the form of percentage rent. If we do not accurately judge the potential for increases in market rental rates, the rent under our long-term leases with operators may be significantly less than then-current market rental rates, even after contractual rental increases and applicable
11
percentage rents. Further, we may have no ability to terminate those leases or to adjust the rent to then-current market rates, or, for certain long-term leases with third-party operators, we may have termination rights but may be required to pay a termination payment to the operators in connection therewith. As a result, our revenues and cash available for distribution to our stockholders could be lower than if we did not enter into long-term leases relating to portfolios of properties.
Short-term leases of residential property may expose us to the effects of declining market rents.
We anticipate that a majority of our leases to tenant-occupants will be for a term of one year. As these leases permit the tenants to leave at the end of the lease term without penalty, we anticipate our rental revenues may be affected by declines in market rents more quickly than if our leases were for longer terms. Short-term leases may result in high turnover, which involves costs such as restoring the properties, marketing costs and lower occupancy levels. Because we have a limited operating history, our tenant turnover rate and related cost estimates may be less accurate than if we had more operating data upon which to base these estimates.
We rely on information supplied by prospective tenants in managing our business.
We rely on information supplied to us by prospective tenants in their rental applications to make leasing decisions, and we cannot be certain that this information is accurate. In particular, we rely on information submitted by prospective tenants regarding household income, tenure at current job and size of household. Moreover, these applications are submitted to us at the time we evaluate a prospective tenant, and we do not require tenants to provide us with updated information during the terms of their leases, notwithstanding the fact that this information can, and frequently does, change over time. Even though this information is not updated, we use it to evaluate the overall average credit characteristics of our portfolio over time. If tenant-supplied information is inaccurate or our tenants’ creditworthiness declines over time, we may make poor leasing or underwriting decisions and our portfolio may contain more credit risk than we believe. When we purchase properties that are subject to existing leases, we are often not able to collect any information on tenant creditworthiness in connection with such purchases.
We may be unable to secure funds for future tenant or other capital improvements, which could limit our ability to attract or replace tenants.
When tenants do not renew their leases or otherwise vacate their space, we often are required to expend funds for property restoration and leasing commissions in order to re-lease the property. If we have not established reserves for such expenditures, we will have to obtain financing from other sources. We may also have future financing needs for other capital improvements to restore our properties. If we need to secure financing for capital improvements in the future but are unable to secure such financing or are unable to secure financing on terms we feel are acceptable, we may be unable to make capital improvements or we may be required to defer such improvements. If this happens, it may cause our properties to suffer from a greater risk of obsolescence or a decline in value, or a greater risk of decreased cash flow as a result of fewer potential tenants being attracted to the property or existing tenants not renewing their leases. If we do not have access to sufficient funding in the future, we may not be able to make necessary capital improvements to our properties, and our properties’ ability to generate revenue may be significantly impaired.
When evaluating a property for acquisition, we make a number of significant estimates and assumptions that may prove to be inaccurate. This could cause us to overpay for a property or incur restoration and marketing costs significantly in excess of our estimates.
In determining whether a particular property meets our investment criteria, we make a number of significant estimates and assumptions, including the amount of time it will take us to gain possession of the property, estimated restoration costs, the amount of time between acquiring the property and leasing it, annual operating costs, rental rates and tenant default rates. These estimates and assumptions may prove to be inaccurate and cause us to overpay for properties or overvalue our properties.
Furthermore, we expect that there will be a significant degree of variability in the amount of time it takes us to gain possession of a property, the amount of restoration required at a property, the quality of construction of a property, the desirability of a property’s location and other property-specific issues. Our success will depend, to a significant degree, on our ability to evaluate these factors and identify and acquire properties that can be restored, rented and maintained at attractive yields. To the extent our evaluation of these factors or our assumptions are inaccurate, our investments may not meet our expectations.
In addition, the market and regulatory environments relating to single-family homes have been changing rapidly, making future trends difficult to forecast. For example, an increasing number of homeowners now wait for an eviction notice or eviction proceedings to commence before vacating a foreclosed property, which significantly increases the time period between the acquisition and leasing of a property. Such changes affect the accuracy of our assumptions and, in turn, may adversely affect us.
12
Our long-term growth will depend significantly upon future acquisitions of single-family homes that meet our acquisition criteria.
The acquisition of single-family homes entails various risks, including the risks that we may overvalue a home, our homes may not perform as we expect, we may be unable to quickly and efficiently restore and lease our homes, our tenants may default and our cost estimates for restoring an acquired home may prove inaccurate. In addition, we cannot assure you of the continued availability of acquisition opportunities in our markets at attractive pricing levels.
Our revenue and expenses are not directly correlated, and, because a large percentage of our costs and expenses are fixed and some variable expenses may not decrease over time, we may not be able to adapt our cost structure to offset any declines in our revenue.
Many of the expenses associated with our business, such as acquisition costs, restoration and maintenance costs, HOA fees, personal and real property taxes, insurance, compensation and other general expenses are fixed and would not necessarily decrease proportionally with any decrease in revenue. Our assets also require a significant amount of ongoing capital expenditure. Our expenses, including capital expenditures, will be affected by, among other things, any inflationary increases, and cost increases may exceed the rate of inflation in any given period. Certain expenses incurred on a per-unit basis are recurring in nature, such as HOA fees, taxes, insurance and restoration and maintenance costs, which may not decrease on a per-unit basis as our portfolio grows through additional property acquisitions. By contrast, our revenue is affected by many factors beyond our control, such as the availability and price of alternative rental housing and economic conditions in our markets. As a result, we may not be able to fully, or partially, offset any increase in our expenses with a corresponding increase in our revenues. In addition, state and local regulations may require us to maintain our properties, even if the cost of maintenance is greater than the value of the property or any potential benefit we may receive from renting the property.
If we cannot obtain financing, our growth may be limited.
To maintain our qualification as a REIT, we are required to distribute at least 90% of our REIT taxable income, determined without regard to the dividends paid deduction and excluding any net capital gain, each year to our stockholders. As a result, our ability to retain earnings to fund acquisitions, restorations or other capital expenditures is limited. We have financed our operations and acquisitions to date through a combination of the issuance of equity securities and debt financing. We believe it is appropriate to use leverage as a component of our financing strategy in an effort to increase our return potential. We can provide no assurance that we will be able to obtain debt financing on favorable terms or at all and we may be limited in the amount of leverage that we may incur by the terms of various financing arrangements.
Recent events in the financial markets have had an adverse impact on the credit markets, and, as a result, credit has become significantly more expensive and difficult to obtain, if available at all. Some lenders are imposing more stringent credit terms and there has been and may continue to be a general reduction in the amount of credit available. Many banks are either unable or unwilling to provide new asset-based lending. Tightening credit markets may have an adverse effect on our ability to obtain financing on favorable terms, thereby increasing financing costs and/or requiring us to accept financing with increasing restrictions. If conditions in the credit markets-in particular with respect to single-family home finance-materially deteriorate, our business could be materially and adversely affected. Our long-term ability to grow through additional investments will be limited if we cannot obtain additional financing. Market conditions may make it difficult to obtain financing, and we cannot assure you that we will be able to obtain debt or equity financing or that we will be able to obtain it on favorable terms.
Debt service obligations could adversely affect our operating results, may require us to sell properties and could adversely affect our ability to make or sustain distributions to our stockholders and the market price of our common stock.
As of December 31, 2014, our total consolidated indebtedness was approximately $768 million in aggregate principal. We may finance future activities with additional indebtedness. We may borrow for a number of reasons, such as financing acquisitions, capital expenditures or distributions necessary to maintain our qualification as a REIT. Our governing documents contain no limitations on the amount of debt that we may incur. As a result, we may incur debt in the future.
Incurring debt could subject us to many risks, including the risks that:
• | our cash flows from operations will be insufficient to make required payments of principal and interest; |
• | our debt may increase our vulnerability to adverse economic and industry conditions; |
• | we will be subject to restrictive covenants that require us to satisfy and remain in compliance with certain financial requirements or that impose limitations on the type or extent of activities we conduct; |
13
• | we may be required to dedicate a substantial portion of our cash flows from operations to payments on our debt, thereby reducing cash available for distribution to our stockholders, funds available for operations and capital expenditures, future business opportunities or other purposes; and |
• | the terms of any refinancing may not be as favorable as the terms of the debt being refinanced. |
Our debt service obligations expose us to the risk of default and reduce cash available to invest in our business or pay distributions that are necessary to qualify and remain qualified as a REIT. Moreover, if we do not have sufficient funds to repay any debt we incur when it matures, we may need to refinance the debt or raise additional capital. If, at the time of any refinancing, prevailing interest rates or other factors result in higher interest rates on refinancing, increases in interest expense could adversely affect our cash flows and, consequently, cash available for distribution to our stockholders. To the extent we are required to raise additional capital to satisfy such debt, existing stockholders would see their interests diluted. If we are unable to refinance our debt or raise additional capital on acceptable terms, we may be forced to dispose of substantial numbers of properties on disadvantageous terms, potentially resulting in losses. To the extent we cannot meet any future debt service obligations, we will risk losing some or all of our properties that may be pledged to secure our obligations to foreclosure. Any unsecured debt agreements we enter into may contain specific cross-default provisions with respect to specified other indebtedness, giving the unsecured lenders the right to declare a default if we are in default under other loans in some circumstances.
Our outstanding exchangeable senior notes may impact the market price of our common stock
We believe that many investors in, and potential purchasers of, exchangeable debt instruments - such as our exchangeable senior notes - employ, or seek to employ, a convertible arbitrage strategy with respect to such instruments. Investors that employ a convertible arbitrage strategy with respect to exchangeable debt instruments typically implement that strategy by selling short the common stock underlying the exchangeable instrument and dynamically adjusting their short position while they hold the instrument. The implementation of this strategy by investors in our exchangeable senior notes, as well as related market regulatory actions, could have a significant impact on the market price of our common stock.
Current and potential joint venture investments may make us vulnerable to our co-venturer’s financial condition and disputes between us and our co-venturer.
We have and may continue to co-invest with third parties through partnerships, joint ventures or other entities, acquiring non-controlling interests in or sharing responsibility for a property, partnership, joint venture or other entity. Under these circumstances, we may not be in a position to exercise sole decision-making authority regarding the assets held through the venture or the venture itself. Investments through joint ventures involve risks not present were a third party not involved in the investment, including the possibility that co-venturers may have rights that are superior to ours, become bankrupt, fail to fund their share of required capital contributions, make poor business decisions or block or delay actions that we believe are necessary or desirable. Co-venturers may have economic or other business interests or goals which are inconsistent with ours, including conflicting goals relating to the sale of assets or properties held in a joint venture or the timing of the termination and liquidation of the venture, and may be in a position to take actions contrary to our objectives. Such investments may also have the potential risk of impasses on material decisions, such as a sale, in circumstances where neither we nor our co-venturer have full control over the partnership or joint venture. Disputes between us and co-venturers may result in litigation or arbitration that would increase our expenses and prevent our officers and/or directors from focusing their time and effort on our business. Consequently, action by or disputes with co-venturers might result in subjecting properties owned by the joint venture to additional risk. In addition, we may under certain circumstances be liable for the actions of our co-venturers.
Our Board of Directors may approve changes to our investment strategy, financing strategy or leverage policies without stockholder consent.
Our Board of Directors may approve changes to any of our strategies, policies or procedures with respect to property acquisitions and divestitures, asset allocation, growth, operations, indebtedness, financing and distributions at any time without the consent of our stockholders, which could result in our acquiring properties that are different from, and possibly riskier than, the types of single-family residential real estate and related investments in which we currently invest. These changes could adversely affect us.
We anticipate being involved in a variety of litigation.
We anticipate being involved in a range of court proceedings in the ordinary course of business. These actions may include eviction proceedings and other landlord-tenant disputes, challenges to title and ownership rights (including actions brought by prior owners alleging wrongful foreclosure by their lender or loan servicer) and issues with local housing officials arising from the condition or maintenance of a property. While we intend to vigorously defend any legal action against us, no assurance can be given that we will not incur significant expense relating to these matters or that they will not require significant management attention and adversely affect us.
14
Security breaches and other disruptions could compromise our information and expose us to liability, which would cause our business and reputation to suffer.
In the ordinary course of our business we acquire and store sensitive data, including intellectual property, our proprietary business information and personally identifiable information of our prospective and current tenants, our employees and third-party service providers in our offices and on our networks. The secure processing and maintenance of this information is critical to our operations and business strategy. Despite our security measures, our information technology and infrastructure may be vulnerable to attacks by hackers or breached due to employee error, malfeasance or other disruptions. Any such breach could compromise our networks and the information stored there could be accessed, publicly disclosed, misused, lost or stolen. Any such access, disclosure or other loss of information could result in legal claims or proceedings, liability under laws that protect the privacy of personal information, regulatory penalties, disruption to our operations and the services we provide to customers or damage our reputation, which could adversely affect our results of operations and competitive position.
We will incur significant expenses as a result of being a public company, which will negatively impact our financial performance.
We will incur significant legal, accounting, insurance and other expenses as a result of being a public company. The Dodd-Frank Act and the Sarbanes-Oxley Act of 2002, or the Sarbanes-Oxley Act, as well as related rules implemented by the SEC and the New York Stock Exchange, or NYSE, have required changes in corporate governance practices of public companies. In addition, rules that the SEC is implementing or is required to implement pursuant to the Dodd-Frank Act are expected to require additional changes. We expect that compliance with these and other similar laws, rules and regulations, including compliance with Section 404 of the Sarbanes-Oxley Act, will substantially increase our expenses, including our legal and accounting costs, and make some activities more time-consuming and costly. We also expect these laws, rules and regulations to make it more expensive for us to obtain director and officer liability insurance, and we may be required to accept reduced policy limits and coverage or incur substantially higher costs to obtain the same or similar coverage, which may make it more difficult for us to attract and retain qualified persons to serve on our Board of Directors or as officers. Although the Jumpstart Our Business Startups Act of 2012, or the JOBS Act, recently enacted by the U.S. Congress and discussed in the next risk factor may for a limited period of time somewhat lessen the cost of complying with these additional regulatory and other requirements, we nonetheless expect a substantial increase in legal, accounting, insurance and certain other expenses in the future, which will negatively impact our results of operations and financial condition.
The JOBS Act allows us to postpone the date by which we must comply with certain laws and regulations intended to protect investors and to reduce the amount of information we provide in our reports filed with the SEC.
The JOBS Act is intended to reduce the regulatory burden on “emerging growth companies.” As defined in the JOBS Act, a public company whose initial public offering of common equity securities occurred after December 8, 2011 and whose annual gross revenues are less than $1.0 billion will, in general, qualify as an “emerging growth company” until the earliest of:
• | the last day of its fiscal year following the fifth anniversary of the date of its initial public offering of common equity securities; |
• | the last day of its fiscal year in which it has annual gross revenue of $1.0 billion or more; |
• | the date on which it has, during the previous three-year period, issued more than $1.0 billion in non-convertible debt; and |
• | the date on which it is deemed to be a “large accelerated filer,” which will occur at such time as the company (1) has an aggregate worldwide market value of common equity securities held by non-affiliates of $700 million or more as of the last business day of its most recently completed second fiscal quarter, (2) has been required to file annual and quarterly reports under the Exchange Act for a period of at least 12 months and (3) has filed at least one annual report pursuant to the Exchange Act. |
Under this definition, we are an “emerging growth company” and could remain an “emerging growth company” until as late as December 31, 2018.
The JOBS Act provides that, so long as a company qualifies as an “emerging growth company,” it will, among other things:
• | be exempt from the provisions of Section 404(b) of the Sarbanes-Oxley Act requiring that its independent registered public accounting firm provide an attestation report on the effectiveness of its internal control over financial reporting; |
• | be exempt from the “say on pay” provisions (requiring a non-binding stockholder vote to approve compensation of certain executive officers) and the “say on golden parachute” provisions (requiring a non-binding stockholder vote to approve golden parachute arrangements for certain executive officers in connection with mergers and certain other business combinations) of the Dodd-Frank Act and certain disclosure requirements of the Dodd-Frank Act relating to compensation of its chief executive officer; |
15
• | be permitted to omit the detailed compensation discussion and analysis from proxy statements and reports filed under the Exchange Act and instead provide a reduced level of disclosure concerning executive compensation; and |
• | be exempt from any rules that may be adopted by the PCAOB requiring mandatory audit firm rotation or a supplement to the auditor’s report on the financial statements. |
We currently expect to take advantage of some or all of the reduced regulatory and reporting requirements that will be available to us so long as we qualify as an “emerging growth company,” except that we have irrevocably elected not to take advantage of the extension of time to comply with new or revised financial accounting standards available under Section 102(b) of the JOBS Act. Among other reduced requirements available to us, our independent registered public accounting firm will not be required to provide an attestation report on the effectiveness of our internal control over financial reporting so long as we qualify as an “emerging growth company,” which may increase the risk that weaknesses or deficiencies in our internal control over financial reporting go undetected. Likewise, so long as we qualify as an “emerging growth company,” we may elect not to provide you with certain information, including certain financial information and certain information regarding compensation of our executive officers, that we would otherwise have been required to provide in filings we make with the SEC, which may make it more difficult for investors and securities analysts to evaluate our company. As a result, investor confidence in our company and the market price of our common stock may be adversely affected.
As a public reporting company, we are subject to rules and regulations established from time to time by the SEC and the NYSE regarding our internal control over financial reporting. We may not complete needed improvements to our internal control over financial reporting in a timely manner, or these internal controls may not be determined to be effective, which may adversely affect investor confidence in our company and, as a result, the market price of our common stock.
As a public reporting company, we are subject to the rules and regulations established from time to time by the SEC and the NYSE. These rules and regulations require, among other things, that we establish and periodically evaluate procedures with respect to our internal controls over financial reporting. Reporting obligations as a public company are likely to place a considerable strain on our financial and management systems, processes and controls, as well as on our personnel. In addition, as a public company we are required to document and test our internal controls over financial reporting pursuant to Section 404 of the Sarbanes-Oxley Act so that our management can certify as to the effectiveness of our internal controls over financial reporting by the time our annual report for the year ending December 31, 2014 is due and thereafter. Likewise, our independent registered public accounting firm will be required to provide an attestation report on the effectiveness of our internal control over financial reporting at such time as we cease to be an “emerging growth company,” as defined in the JOBS Act. As described in the preceding risk factor, we could qualify as an “emerging growth company” until as late as December 31, 2018. As a result, we will be required to improve our financial and managerial controls, reporting systems and procedures, to incur substantial expenses to test our systems and to make such improvements and to hire additional personnel. If our management is unable to certify the effectiveness of our internal controls, if our independent registered public accounting firm cannot deliver (at such time as it is required to do so) a report attesting to the effectiveness of our internal control over financial reporting or if we identify or fail to remediate material weaknesses in our internal controls, we could be subject to regulatory scrutiny and a loss of public confidence, which could harm our reputation and the market price of our common stock. In addition, if we do not maintain adequate financial and management personnel, processes and controls, we may not be able to manage our business effectively or accurately report our financial performance on a timely basis, which could adversely affect our results of operations and financial condition and cause a decline in the market price of our common stock.
Risks Related to Single-Family Housing
The value and operating fundamentals of single-family housing in our markets may not improve.
A substantial part of our business plan is based on our belief that the value and operating fundamentals of single-family housing in our markets will improve significantly over the next several years. We cannot assure you as to whether, when or to what extent property values and operating fundamentals will improve. In addition, it is possible that our belief is incorrect and that the value and operating fundamentals of single-family housing in our markets will not improve and may deteriorate.
16
Many factors impact the single-family residential rental market, and if rents in our markets do not increase sufficiently to keep pace with rising costs of operations, our cash available for distribution will decline.
The success of our business model will substantially depend on conditions in the single-family rental market in our geographic markets. Our asset acquisitions are premised on assumptions about, among other things, occupancy and rent levels, and if those assumptions prove to be inaccurate our cash flows will be lower than expected. Rental rates and occupancy levels have benefited in recent periods from macroeconomic trends affecting the U.S. economy and residential real estate markets in particular, including: a tightening of credit that has made it more difficult to finance a home purchase, combined with efforts by consumers generally to reduce their exposure to credit and slowly-recovering economic and employment conditions that have made it more difficult for families to remain in homes that were purchased prior to the economic downturn.
We do not expect these favorable trends in the residential rental market to continue indefinitely. Eventually, a strengthening of the U.S. economy and job growth, coupled with government programs designed to keep homeowners in their homes and/or other factors, may contribute to a stabilization or reversal of the current trend that favors renting rather than homeownership. In addition, we expect that as investors like us increasingly seek to capitalize on opportunities to purchase undervalued housing assets and convert them to productive uses, the supply of single-family rental properties will decrease and the competition for tenants will intensify. A softening of the rental market in our markets would reduce our rental revenue.
Acquiring properties during periods when the single-family home sector is experiencing substantial inflows of capital and intense competition may result in inflated purchase prices and increase the likelihood that our properties will not appreciate in value and may, instead, decrease in value.
The allocation of substantial amounts of capital for investment in the single-family home sector and significant competition for income producing real estate may inflate the purchase prices for such assets. To the extent we purchased or in the future purchase real estate in such an environment, it is possible that the value of our properties may not appreciate and may, instead, decrease in value, perhaps significantly, below the amount we paid for such properties. In addition to macroeconomic and local economic factors, technical factors, such as a decrease in the amount of capital allocated to the single-family home sector and the number of investors participating in the sector, could cause the value of our properties to decline.
Mortgage loan modification programs and future legislative action may reduce the number of properties that meet our investment criteria.
The U.S. government, through the Federal Reserve, the Federal Housing Administration and the Federal Deposit Insurance Corporation, has implemented a number of programs designed to provide homeowners with assistance in avoiding residential mortgage loan foreclosures, including the Home Affordable Modification Program, which seeks to provide relief to homeowners whose mortgages are in or may be subject to foreclosure, and the Home Affordable Refinance Program, which allows certain borrowers who are underwater on their mortgage but current on their mortgage payments to refinance their loans. Several states, including states in which our current markets are located, have adopted or are considering similar legislation. These programs and other loss mitigation programs may involve, among other things, the modification or refinancing of mortgage loans or providing homeowners with additional relief from loan foreclosures. Such programs are intended to lead to fewer foreclosures and, if successful, will decrease the supply of properties that meet our investment criteria.
The pace of residential foreclosures is unpredictable and subject to numerous factors. In recent periods there has been a backlog of foreclosures, due to a combination of volume constraints and legal actions, including those brought by the U.S. Department of Justice, or the DOJ, the Department of Housing and Urban Development, or HUD, State Attorneys General, the office of the Comptroller of the Currency, or the OCC, and the Federal Reserve Board against mortgage servicers alleging wrongful foreclosure practices. Financial institutions have also been subjected to regulatory restrictions and limitations on foreclosure activity by the Federal Deposit Insurance Corporation. Legal claims brought or threatened by the DOJ, HUD and 49 State Attorneys General against the five largest residential mortgage servicers in the country were settled in 2012 for approximately $25 billion, and an enforcement action threatened by the OCC against ten residential mortgage servicers was settled in 2013 for approximately $8.5 billion. A portion of the funds from each settlement will be directed to homeowners seeking to avoid foreclosure through mortgage modifications, and servicers are required to adopt specified measures to reduce mortgage obligations in certain situations. It is expected that the settlements will help many homeowners avoid foreclosures that would otherwise have occurred in the near-term. It is also possible that other residential mortgage servicing companies will agree to similar settlements. These developments will reduce the number of homes in the process of foreclosure and decrease the supply of properties that meet our investment criteria.
In addition, the U.S. Congress and numerous state legislatures have considered, proposed or adopted legislation to constrain foreclosures or may do so in the future. The Dodd-Frank Act also created the Consumer Financial Protection Bureau, which supervises and enforces federal consumer protection laws as they apply to banks, credit unions and other financial companies, including mortgage servicers. It remains uncertain as to whether any of these measures will have a significant impact on foreclosure volumes or what the timing of that impact would be. If foreclosure volumes were to decline significantly, we would expect REO inventory levels to decline or to grow at a slower pace, which would make it more difficult to find target assets at attractive prices and might constrain
17
our growth or reduce our long-term profitability. Also, the number of families seeking rental housing might be reduced by such legislation, reducing rental housing demand in our markets.
Claims of deficiencies in the foreclosure process may result in rescission of our purchases at auction or reduce the supply of foreclosed properties available to us.
Allegations of deficiencies in foreclosure practices could result in claims challenging the validity of some foreclosures that have occurred, potentially placing our claim of ownership to some of our properties at risk. We cannot be assured that our title insurance policies would provide protection in such instances or that such proceedings would not result in a complete dispossession of property from us without compensation.
Each state has its own laws governing the procedures to foreclose on mortgages and deeds of trust, and state laws generally require strict compliance with these laws in both judicial and non-judicial foreclosures. Recently, courts and administrative agencies have been more actively involved in enforcing state laws governing foreclosures, and, in some circumstances, have imposed new rules and requirements regarding foreclosures. Some courts have delayed or prohibited foreclosures based on alleged failures to comply with proper transfers of title, notice, identification of parties in interest, documentation and other legal requirements. The increase in the number of foreclosures since 2007 has led legislatures in many states to consider modifications to foreclosure laws to restrict and reduce foreclosures. For example, in 2012, California enacted a law imposing new limitations on foreclosures while a request for a loan modification is pending. Further, foreclosed owners and their legal representatives, including some prominent and well-financed legal firms, have brought litigation questioning the validity and finality of foreclosures that have already occurred. These developments may reduce, or slow the rate of growth in, the supply of foreclosed homes available to us for purchase. They may also call into question the validity of our titles to homes acquired at foreclosure, or result in rescission rights or other borrower remedies, which could result in a loss of a property purchased by us that may not be covered by title insurance. This could result in an increase in litigation and property maintenance costs incurred with respect to properties obtained through foreclosure, or delays in stabilizing and leasing such properties promptly after acquisition.
Single-family homes that are being sold through foreclosure or short-sales are subject to risks of theft, vandalism or other damage that could impair their value.
When a single-family home is put into foreclosure, due to a default by the homeowner on mortgage obligations, or a homeowner seeks a short sale, due to the value of the property being substantially below the outstanding principal balance of the mortgage, it is possible that the homeowner may cease to maintain the property adequately, or that the property may be abandoned by the homeowner and become susceptible to theft or vandalism. Lack of maintenance, theft and vandalism can substantially impair the value of the property. If we purchase a large number of properties in foreclosure in bulk sales and are not able to inspect each property before closing or we are unable to rent the properties quickly after purchase and restoration, some of our properties could be impaired.
We generally are not able to conduct a thorough inspection before purchasing properties at auction or in bulk sales.
We have purchased and expect to continue to purchase properties at auction and in bulk sales. When we purchase properties in these manners, we generally do not have the opportunity to conduct interior inspections or conduct more than cursory exterior inspections on a portion of the properties. These inspection processes may fail to reveal major defects associated with such properties, which may cause the amount of time and expense required to restore such properties to substantially exceed our estimates.
Properties acquired in bulk may subject us to a variety of risks.
A substantial portion of our properties were, and we expect that a portion of any future property acquisitions will be, purchased as portfolios in bulk from other owners of single-family homes. To the extent the management and leasing of such properties has not been consistent with our property management and leasing standards, we may be subject to a variety of risks, including risks relating to the condition of the properties, the credit quality and employment stability of the tenants and compliance with applicable laws, among others. In addition, financial and other information provided to us regarding such portfolios during our due diligence may not be accurate, and we may not discover such inaccuracies until it is too late to seek remedies against such sellers. To the extent we timely pursue such remedies, we may not be able to successfully prevail against the seller in an action seeking damages for such inaccuracies.
We incur significant costs in restoring our properties, and we may underestimate the costs or amount of time necessary to complete restorations.
Before renting a home to a tenant, we typically coordinate an on-site review of the home to identify the scope of restoration to be completed. Beyond customary repairs, we often undertake improvements designed to optimize overall property appeal and increase the value of the property when such improvements can be done cost effectively. To the extent properties are occupied by existing tenants, restorations may be postponed until the tenant vacates the premises.
18
We expect that nearly all of our properties will require some level of restoration immediately upon their acquisition or in the future following expiration of a lease or change in tenant, and some restorations may be extensive. In addition, in order to reposition properties in the rental market, we will be required to make ongoing capital improvements and may need to perform significant restorations and repairs from time to time. We are exposed to the risks inherent in property restoration, including potential cost overruns, increases in labor and materials costs, delays by contractors in completing work, delays in the timing of receiving necessary work permits and certificates of occupancy and poor workmanship. If our assumptions regarding the cost or timing of restorations across our properties prove to be materially inaccurate, we will be adversely affected.
The costs and amount of time necessary to secure possession and control of a newly acquired property may exceed our assumptions, which would delay our receipt of revenue from, and return on, the property.
Upon acquiring a new property, we may have to evict occupants who are in unlawful possession before we can secure possession and control of the property. The holdover occupants may be the former owners or tenants of a property, or they may be squatters or others who are illegally in possession. Securing control and possession from these occupants can be both costly and time-consuming. If these costs and delays exceed our expectations, our financial performance may suffer because of the increased expenses incurred or the unexpected delays in turning the properties into revenue-producing rented homes.
We depend on our tenants for a substantial majority of our revenues.
We depend on tenants for a substantial portion of our revenues. Our operating results and cash available for distribution would be adversely affected if a significant number of our tenants were unable to meet their lease obligations or failed to renew their leases with us. Widespread layoffs and other adverse changes in the economic conditions in our markets could result in substantial tenant defaults or non-renewals. In the event of a tenant default or bankruptcy, we may experience delays in enforcing our rights as landlord at that property and may incur costs in protecting our investment and re-leasing the property. We may be unable to re-lease the property for the rent previously received.
Through our preferred operators, we acquire portfolios of properties that are master leased to a third-party operator. Under these arrangements, the revenue we derive from these properties comes entirely from lease payments made by the third-party operator to us. If the third-party operator is unable to generate sufficient revenue from the operation of these properties to meet its obligations under the lease, including its obligation to pay rent to us, this could result in the reduction or elimination of revenue relating to a large number of our properties. A third-party operator’s ability to make lease payments to us would be adversely affected if a significant number of the occupants of the properties were unable to meet their obligations to the operator, which could make it difficult for the operator to meet its obligations to us. The occupants’ ability to meet their obligations to our third-party operator is affected by the same factors that affect our tenants’ ability to meet their obligations to us with respect to our self-managed portfolio, such as local economic and employment conditions.
We may be unable to renew leases and our occupancy rate could decline.
We cannot assure you that tenants will renew their leases with us. If the rental rates for our properties decrease or our tenants do not renew their leases, our financial condition, results of operations, cash flow, cash available for distribution, market price of our common stock and our ability to satisfy our debt service obligations could be materially adversely affected.
Some or all of our properties may become vacant either by a default of tenants under their leases or the expiration or termination of tenant leases. If vacancies continue for a long period of time, we may suffer reduced revenues resulting in less cash available for distribution. In addition, the resale value of the property could be reduced because the market value of a particular property may deteriorate if it remains unoccupied for an extended period of time.
A significant number of our properties are part of HOAs, and we and our tenants are subject to the rules and regulations of such HOAs, which may be arbitrary or restrictive. Violations of such rules may subject us to additional fees, penalties and litigation with such HOAs, which would be costly.
A significant number of our properties are located within HOAs, which are private entities that regulate the activities of owners and occupants of, and levy assessments on, properties in a residential subdivision. HOAs in which we own properties may have or may enact onerous or arbitrary rules that restrict our ability to restore, market or lease our properties or require us to restore or maintain such properties at standards or costs that are in excess of our planned budgets. Some HOAs impose limits on the number of property owners who may rent their homes, which, if met or exceeded, would cause us to incur additional costs to sell the property and opportunity costs of lost rental revenue. Furthermore, we may have tenants who violate HOA rules and for which we may be liable as the property owner. Additionally, the governing bodies of the HOAs in which we own property may not make important disclosures about the properties or may block our access to HOA records, initiate litigation, restrict our ability to sell our properties, impose assessments or arbitrarily change the HOA rules. We may be unaware of or unable to review or comply with HOA rules before purchasing a property, and any such excessively restrictive or arbitrary regulations may cause us to sell such property at a loss, prevent
19
us from renting such property or otherwise reduce our cash flow from such property, which would have an adverse effect on our returns on these properties.
We are subject to tenant relief laws and may be subject to rent control laws, which will negatively impact our rental revenue.
When we acquire distressed properties, we often will need to evict the occupant of the premises. Additionally, as an owner of many rental properties, we will regularly seek to evict tenants who are not paying their rent or are otherwise in material violation of the terms of their lease. Eviction activities result in additional legal costs and require our personnel’s time and attention. The eviction process is typically subject to numerous legal requirements and mandatory “cure” policies, which may increase our costs and delay our ability to gain possession of and stabilize a property. Additionally, state and local landlord-tenant laws may impose legal duties on us to assist tenants in relocating to new housing, or restrict our ability to recover certain costs or charge tenants for damage tenants cause to our property. Because such laws vary by state and locality, we need to be familiar with and take appropriate steps to comply with applicable landlord-tenant laws in the jurisdictions in which we operate, and we need to incur supervisory and legal expenses to ensure such compliance.
Furthermore, rent control laws may affect our rental revenue. Especially in times of recession and economic slowdown, rent control initiatives can receive significant political support. Were rent control to become applicable to certain of our properties, the effects on both our rental revenue and the value of such properties could be material and adverse.
Class action, tenants’ rights and consumer rights litigation may result in increased expenses and harm our results.
There are numerous tenants’ rights and consumer rights organizations that operate in our markets, and we may attract attention from some of these organizations and become a target of legal demands or litigation. Many such organizations have become more active and better funded in connection with mortgage foreclosure-related issues, and, with the large settlements identified above and the increased market for single-family rentals arising from former homeowners, some of these organizations may shift their litigation, lobbying, fundraising and grass roots organizing activities to focus on landlord-tenant issues. While we intend to conduct our business lawfully and in compliance with applicable landlord-tenant and consumer laws, such organizations might attempt to organize claims against us on a class action basis for damages or injunctive relief. We cannot anticipate what form such legal actions might take or what remedies they may seek. Additionally, these organizations may lobby local county and municipal attorneys or State Attorneys General to pursue enforcement or litigation against us or may lobby state and local legislatures to pass new laws and regulations to constrain our business operations. If they are successful in any such endeavors, they could limit our business operations and may impose on us significant litigation expenses, including settlements to avoid continued litigation or judgments for damages or injunctions.
Poor tenant selection and defaults by our tenants may negatively affect our financial performance and reputation.
Our success depends, in large part, upon our ability to attract and retain qualified tenants for our properties. This depends, in turn, upon our ability to screen applicants, identify good tenants and avoid tenants who may default. We may make mistakes in our selection of tenants, and we may rent to tenants whose default on our leases or failure to comply with the terms of the lease or HOA regulations negatively affect our financial performance, reputation and the quality and value of our properties. In addition, defaulting tenants will often be effectively judgment-proof. The process of evicting a defaulting tenant from a family residence can be adversarial, protracted and costly. Furthermore, some tenants facing eviction may damage or destroy the property. Damage to our properties may significantly delay re-leasing after eviction, necessitate expensive repairs or impair the rental revenue or value of the property, resulting in a lower than expected rate of return. In addition, we would incur turnover costs associated with re-leasing the properties, such as marketing expense and brokerage commissions, and would not collect revenue while the property is vacant. Although we will attempt to work with tenants to prevent such damage or destruction, there can be no assurance that we will be successful in all or most cases. Such tenants not only cause us not to achieve our financial objectives for the properties in which they live, but may subject us to liability, and may damage our reputation with our other tenants and in the communities where we do business.
Title defects and eminent domain could lead to material losses on our investments.
Although we have acquired, and currently intend to acquire in the future, title insurance on the majority of our residential properties when it is available, we will also acquire a number of our homes on an “as is” basis at auctions, without the benefit of title insurance at closing. Increased scrutiny of title matters, particularly in the case of foreclosures, could lead to legal challenges with respect to the validity of the sale. Challenges to title could result in the sale being rescinded, and we may be unable to recover our purchase price, resulting in a complete loss in the absence of title insurance. Title insurance obtained after we take title will exclude discoverable defects from coverage and therefore provide less protection to us. Although we endeavor to assess the state of title prior to purchase, there can be no assurance that our assessments will be completely effective, which could lead to a material, if not
20
complete loss, on our investment in such properties. In addition, even if we are able to acquire title insurance on a property, the title insurance provider may assert that we are not entitled to coverage under the policy and deny any claims we have thereunder.
It is also possible that governmental authorities may exercise eminent domain to acquire land on which our properties are built in order to build roads or other infrastructure. Any such exercise of eminent domain would allow us to recover only the fair value of the affected properties. Our acquisition strategy is premised on the concept that this “fair value” will be substantially less than the real value of the property for a number of years, and we could effectively have no profit potential from properties acquired by the government through eminent domain. Several cities are also exploring proposals to use eminent domain to acquire mortgages to assist homeowners to remain in their homes, potentially reducing the supply of single-family homes for sale in our markets.
The large supply of single-family homes becoming available for purchase as a result of the heavy volume of foreclosures, combined with historically low residential mortgage rates, may cause some potential renters to seek to purchase residences rather than lease them and, as a result, cause a decline in the number and quality of potential tenants.
The large supply of foreclosed homes, along with the low residential mortgage interest rates currently available and government sponsored programs to promote home ownership, has made home ownership more affordable and more accessible for potential renters who have strong credit. The foregoing factors may encourage certain potential renters to purchase residences rather than lease them, thereby causing a decline in the number and quality of potential tenants available to us.
Declining real estate values and impairment charges could adversely affect our earnings and financial condition.
We intend to review the carrying value of our long-lived assets (including our real estate properties) for impairment whenever events or changes in circumstances, such as adverse market conditions, indicate that their carrying amount may not be recoverable. If our evaluation indicates that we may be unable to recover the carrying value of a material portion of our real estate investments, an impairment loss will be recorded to the extent that the carrying value exceeds the estimated fair value of the properties. These losses would have a direct impact on our net income, because recording an impairment loss results in an immediate negative adjustment to net income. They would also be reflected as a decrease in assets on our balance sheet. The evaluation of anticipated cash flows is highly subjective and is based in part on assumptions regarding future occupancy, rental rates and capital requirements that could differ materially from actual results in future periods. A deteriorating real estate market may cause us to reevaluate the assumptions used in our impairment analysis. Impairment charges could adversely affect our financial condition, results of operations, cash available for distribution and market price of our common stock.
Risks Related to Short-Term Private Mortgage Financing
The short-term private mortgage financings we provide are subject to risks of delinquency, default and loss.
Mortgage loans are subject to risks of delinquency, default and loss. The ability of a borrower to repay a loan secured by residential property typically is dependent primarily upon the income or assets of the borrower. In addition, the ability or motivation of the borrower to repay its mortgage loan may be affected by, among other things: changes in zoning laws for the property or its surrounding area; the condition of the property and neighborhood; environmental contamination at the property; the occurrence of any uninsured casualty at the property; changes in national, regional or local economic conditions; declines in regional or local real estate values; increases in interest rates; real estate tax rates; changes in governmental rules, regulations and fiscal policies, including environmental legislation; acts of God; terrorism; social unrest; and civil disturbances.
To the extent that the borrower purchased a property with the intent of rehabilitating and “flipping” the property to a third party, such borrower may not have adequate funds to complete the rehabilitation or otherwise may not be able to complete such rehabilitation prior to the maturity of the mortgage note. The inability to complete such improvements or an inability to sell the property to a third party upon completion of such rehabilitation may impair the borrower’s ability to repay the loan and may result in an event of default under such mortgage loan.
In the event of a default under a mortgage loan held by us, we will bear a risk of loss of principal to the extent of any deficiency between the value of the collateral that we can realize upon foreclosure and sale and the principal and accrued interest of the mortgage loan, which could have a material adverse effect on our cash flow from operations and could limit the amount of cash available for distribution. In the event of the bankruptcy of a mortgage loan borrower, the mortgage loan to such borrower will be deemed to be secured only to the extent of the value of the underlying collateral at the time of bankruptcy (as determined by the bankruptcy court), and the lien securing the mortgage loan will be subject to the avoidance powers of the bankruptcy trustee or debtor-in-possession to the extent the lien is unenforceable under state law. Foreclosure on a mortgage loan can be an expensive and lengthy process that can have a substantial negative effect on our originally anticipated return on the foreclosed mortgage loan.
21
We may be subject to losses due to fraudulent and negligent acts on the part of loan applicants, mortgage brokers, other vendors and our employees.
With respect to our investments in mortgage loans, we rely upon information supplied by borrowers and other third parties, including financial and other information provided by the applicant in connection with our funding of the loan, property appraisal reports or valuations, title information and other appropriate documentation. If any of this information is misrepresented or falsified and if we do not discover it prior to funding a loan, the actual value of such loan may be significantly lower than anticipated. As a practical matter, we generally bear the risk of loss associated with a misrepresentation, whether it is made by the borrower, the mortgage broker, another third party or one of our employees. Although we may have rights against persons and entities who made or knew about the misrepresentation, those persons and entities may be difficult to locate, and it is often difficult to collect any monetary losses that we may have suffered.
Our mortgage lending activities are subject to a body of complex laws and regulation at the federal, state and local levels.
In connection with our mortgage lending activities, we are required to comply with applicable laws, rules and regulations, as well as judicial and administrative decisions, of all jurisdictions in which we fund mortgage loans, as well as an extensive body of federal laws, rules and regulations. The volume of new or modified laws, rules and regulations applicable to our business has increased in recent years. The laws, rules and regulations of each of these jurisdictions are different, complex and, in some cases, in direct conflict with each other. It may be more difficult to identify comprehensively, to interpret accurately, to program properly our information systems and to effectively train our personnel with respect to all of these laws, rules and regulations, thereby potentially increasing the risks of non-compliance with these laws, rules and regulations. Our failure to comply with these laws, rules and regulations could prevent us from funding mortgage loans and could lead to civil and criminal liability, including potential monetary penalties, and negatively impact our ability to enforce loans or give borrowers the right to rescind or cancel loan transactions.
Risks Related to the Real Estate Industry Generally
Our performance and value are subject to general economic conditions and risks associated with our real estate assets.
The investment returns available from equity investments in real estate depend on the amount of income earned and capital appreciation generated by the properties, as well as the expenses incurred in connection with the properties. If our properties and any properties we acquire in the future do not generate income sufficient to meet operating expenses, including any debt service and capital expenditures, then our ability to make distributions to our stockholders could be adversely affected. In addition, there are significant expenditures associated with an investment in real estate (such as debt service (to the extent we borrow funds in the future), real estate taxes, HOA fees, insurance and maintenance costs) that generally do not decline when circumstances reduce the income from the property. Income from and the value of our properties may be adversely affected by the factors listed below, among others:
• | downturns in international, national, regional and local economic conditions (particularly increases in unemployment); |
• | the attractiveness of the properties we acquire to potential tenants and competition from other properties; |
• | changes in supply of or demand for similar or competing properties in our markets; |
• | bankruptcies, financial difficulties or lease defaults by our tenants; |
• | inability to collect rent from tenants; |
• | changes in interest rates, availability and terms of debt financing; |
• | changes in operating costs and expenses; |
• | changes in, or increased costs of compliance with, governmental laws, rules, regulations and fiscal policies, including changes in tax, real estate, environmental and zoning laws, and our potential liability thereunder; |
• | political, regulatory or other factors including terrorism; |
• | illiquidity of real estate investments generally; |
• | tenants’ perceptions of the safety, convenience and attractiveness of our properties and the neighborhoods in which our properties are located; |
• | ongoing needs for capital improvements, particularly in older properties; |
• | our ability to provide adequate maintenance and obtain adequate insurance; |
• | changes in the cost or availability of insurance, including coverage for mold or asbestos; |
22
• | environmental conditions or retained liabilities for such conditions; |
• | unanticipated changes in costs associated with known adverse environmental conditions or retained liabilities for such conditions; |
• | periods of high interest rates and tight money supply; |
• | tenant turnover; |
• | disruptions in the global supply chain; |
• | the ability or unwillingness of tenants to pay rent increases; |
• | civil unrest, acts of God, including earthquakes, hurricanes, tornadoes, floods and other natural disasters, which may result in uninsured losses, and acts of war or terrorism, including the consequences of terrorist acts such as those that occurred on September 11, 2001; |
• | rent control or rent stabilization or other housing laws, which could prevent us from raising rents; and |
• | increases in property-level maintenance and operating expenses. |
For these and other reasons, we cannot assure you that we will be profitable or that we will realize growth in the value of our real estate properties.
Uninsured or underinsured losses relating to real property may adversely affect our returns.
We attempt to ensure that all of the properties we acquire are adequately insured to cover casualty losses. However, there are certain losses, including losses from floods, fires, earthquakes, acts of war, acts of terrorism or riots, that may not always be insured against or that are not generally fully insured against. In addition, changes in the cost or availability of insurance could expose us to uninsured casualty losses. In the event that any of the properties we acquire incurs a casualty loss that is not fully covered by insurance, the value of our assets will be reduced by the amount of any such uninsured loss, and we could experience a significant loss of capital invested and potential revenues in these properties and could potentially remain obligated under any recourse debt associated with the property. Inflation, changes in building codes and ordinances, environmental considerations and other factors might also keep us from using insurance proceeds to replace or restore a property after it has been damaged or destroyed. Under those circumstances, the insurance proceeds we receive might be inadequate to restore our economic position on the damaged or destroyed property. Any such losses could adversely affect us and the market price of our common stock. In addition, we may have no source of funding to repair or reconstruct the damaged property, and we cannot assure you that any such sources of funding will be available to us for such purposes in the future.
Contingent or unknown liabilities could adversely affect our financial condition.
Our acquisition activities are subject to many risks. We may acquire properties that are subject to unknown or contingent liabilities, including liabilities for or with respect to liens attached to properties, unpaid real estate taxes, utilities or HOA charges for which a prior owner should be liable, clean-up or remediation of environmental conditions or code violations, claims of vendors or other persons dealing with the acquired properties and tax liabilities, among other things. In each case, our acquisition may be without any, or with only limited, recourse with respect to unknown or contingent liabilities or conditions. As a result, if any such liability were to arise relating to our properties, or if any adverse condition exists with respect to our properties that is in excess of our insurance coverage, we might have to pay substantial sums to settle or cure it, which could adversely affect us. The properties we acquire may also be subject to covenants, conditions or restrictions that restrict the use or ownership of such properties, including prohibitions on leasing or requirements to obtain the approval of HOAs prior to leasing. We may not discover such restrictions during the acquisition process and such restrictions may adversely affect our ability to operate such properties as we intend.
In addition, purchases of single-family homes acquired at auction, in short sales, from lenders or in bulk purchases typically involve few or no representations or warranties with respect to the properties and may allow us limited or no recourse against the sellers of such properties. Such properties also often have unpaid tax, utility and HOA liabilities for which we may be obligated but fail to anticipate.
Environmentally hazardous conditions may adversely affect our operating results.
Under various federal, state and local environmental laws, a current or previous owner or operator of real property may be liable for the cost of removing or remediating hazardous or toxic substances on such property. Such laws often impose liability whether or not the owner or operator knew of, or was responsible for, the presence of such hazardous or toxic substances. Even if more than one person may have been responsible for the contamination, each person covered by applicable environmental laws may be held responsible for all of the clean-up costs incurred. In addition, third parties may sue the owner or operator of a site for damages based
23
on personal injury, natural resources or property damage or other costs, including investigation and clean-up costs, resulting from the environmental contamination. The presence of hazardous or toxic substances on one of our properties, or the failure to properly remediate a contaminated property, could give rise to a lien in favor of the government for costs it may incur to address the contamination or otherwise adversely affect our ability to sell or lease the property or borrow using the property as collateral. Environmental laws also may impose restrictions on the manner in which property may be used or businesses may be operated. A property owner who violates environmental laws may be subject to sanctions which may be enforced by governmental agencies or, in certain circumstances, private parties. In connection with the acquisition and ownership of our properties, we may be exposed to such costs. The cost of defending against environmental claims, of compliance with environmental regulatory requirements or of remediating any contaminated property could materially and adversely affect us.
Compliance with new or more stringent environmental laws or regulations or stricter interpretation of existing laws may require material expenditures by us. We may be subject to environmental laws or regulations relating to our properties, such as those concerning lead-based paint, mold, asbestos, proximity to power lines or other issues. We cannot assure you that future laws, ordinances or regulations will not impose any material environmental liability or that the current environmental condition of our properties will not be affected by the activities of tenants, existing conditions of the land, operations in the vicinity of the properties or the activities of unrelated third parties. In addition, there are various local, state and federal fire, health, life-safety and similar regulations that we may be required to comply with. Failure to comply with applicable laws and regulations could result in fines and/or damages, suspension of personnel, civil liability and/or other sanctions.
We may obtain only limited warranties when we purchase a property and would have only limited recourse in the event our due diligence did not identify any issues that lower the value of our property.
The seller of a property often sells such property in its “as is” condition on a “where is” basis and “with all faults” without any warranties of merchantability or fitness for a particular use or purpose. In addition, purchase and sale agreements may contain only limited warranties, representations and indemnifications that will only survive for a limited period after the closing. The purchase of properties with limited warranties increases the risk that we may lose some or all of our invested capital in the property, as well as the loss of rental revenue from that property.
We may have difficulty selling real estate investments, and our ability to distribute all or a portion of the net proceeds from such sales to our stockholders may be limited.
Real estate investments are relatively illiquid, and, as a result, we may have a limited ability to sell our properties should the need arise. When we sell our properties, we may not realize gains on such sales. We may elect not to distribute any proceeds from the sales of properties to our stockholders.
Our ability to sell our properties may also be limited by our need to avoid the 100% prohibited transactions tax that is imposed on gain recognized by a REIT from the sale of property characterized as dealer property. In order to ensure that we avoid such characterization, we may be required to hold our properties for a minimum period of time and comply with certain other requirements in the Code or dispose of our properties through our TRS, which is subject to federal and state income taxation as a corporation.
Our real properties are subject to property taxes that may increase in the future, which could adversely affect us.
Our real properties are subject to real and personal property taxes that may increase as tax rates change and as the real properties are assessed or reassessed by taxing authorities. Our leases with preferred operators provide that property taxes are the responsibility of the preferred operators, while our leases for our self-managed properties provide that we are responsible for such taxes. In any case, as the owner of the properties, we are ultimately responsible for payment of the taxes to the applicable government authorities. If real property taxes increase, our expenses will increase. Moreover, if our preferred operators do not pay real estate taxes pursuant to the terms of their leases with us, we will be responsible for such taxes. If we fail to pay any such taxes, the applicable taxing authority may place a lien on the real property and the real property may be subject to a tax sale.
Risks Related to Conflicts of Interest
Mr. Schmitz and Ms. Hawkes have duties to Phoenix Fund which may create conflicts of interest, and these conflicts may not be resolved in our favor, which could adversely affect us.
Each of Mr. Schmitz and Ms. Hawkes owns a 50% interest in the general partner of Phoenix Fund. They also jointly own ARM, the former property manager of Phoenix Fund, which holds the 175,000 Operating Partnership, or OP, units that our Operating Partnership issued in connection with our acquisition of the ARM assets upon completion of our initial private offering and formation transactions in May 2012. They may have conflicting duties because they have a duty to both us and to the limited partners of Phoenix Fund (which will retain ownership of its properties and continue as a private fund until liquidated). Upon completion of our formation transactions in May 2012, Phoenix Fund agreed not to commit to purchase any additional single-family homes and, as a result, Phoenix Fund is not expected to compete with us for investments in single-family homes in our markets. However, some of Phoenix
24
Fund’s properties may compete with our properties, including with respect to tenants. Our TRS is party to a management agreement with Phoenix Fund, pursuant to which it provides services, including, among other things, leasing management services, to Phoenix Fund for a fee in an amount equal to 6.0% of Phoenix Fund’s gross rental revenue.
It is possible that the duties owed by Mr. Schmitz and Ms. Hawkes to the limited partners of Phoenix Fund may conflict with the duties they owe to us. In addition, Mr. Schmitz and Ms. Hawkes are required to spend a portion of their working time attending to the obligations of the general partner of Phoenix Fund, which may detract from the amount of time and attention they are able to devote to us. Finally, Mr. Schmitz and Ms. Hawkes are entitled to receive certain compensation from Phoenix Fund in the event of a sale of the assets of Phoenix Fund, which could create incentives for them that are in conflict with our interests, particularly if we have an interest in buying those assets.
Our fiduciary duties to the limited partners of our operating partnership could create conflicts of interest, which may impede business decisions that could benefit our stockholders.
We, through our wholly owned subsidiary that serves as the sole general partner of our Operating Partnership, have a fiduciary duty to the other limited partners in our Operating Partnership, the discharge of which may conflict with the interests of our stockholders. The limited partners of our Operating Partnership (other than us) are Mr. Schmitz and Ms. Hawkes, as well as other members of our management and our Board of Directors who have received LTIP units. The limited partners of our Operating Partnership have agreed that, in the event of a conflict between the duties owed by us to our stockholders and to such limited partners, we are under no obligation to give priority to the interests of such limited partners.
In addition, Mr. Schmitz and Ms. Hawkes, as well as any other limited partners (other than us), have and will have the right to vote on certain amendments to the partnership agreement and to approve certain amendments that would adversely affect their rights. These voting rights may be exercised in a manner that conflicts with the interests of our stockholders.
We may also experience conflicts of interest with several members of our senior management team who are or may become limited partners in our Operating Partnership through the receipt of LTIP units granted under our equity incentive plan.
Risks Related to Our Organization and Structure
Provisions of our charter may limit the ability of a third party to acquire control of us by authorizing our Board of Directors to issue additional securities.
Our Board of Directors may, without stockholder approval, amend our charter to increase or decrease the aggregate number of our shares or the number of shares of any class or series that we have the authority to issue and to classify or reclassify any unissued shares of our common or preferred stock, and set the preferences, rights and other terms of the classified or reclassified shares. As a result, our Board of Directors may authorize the issuance of additional shares or establish a series of common or preferred stock that may have the effect of delaying or preventing a change in control of our company, including transactions at a premium over the market price of our shares, even if stockholders believe that a change in control is in their interest. These provisions, along with the restrictions on ownership and transfer contained in our charter and certain provisions of Maryland law described below, could discourage unsolicited acquisition proposals or make it more difficult for a third party to gain control of us, which could adversely affect the market price of our securities.
Provisions of Maryland law may limit the ability of a third party to acquire control of us by requiring our Board of Directors or stockholders to approve proposals to acquire our company or effect a change in control.
Certain provisions of the Maryland General Corporation Law, or MGCL, applicable to Maryland corporations may have the effect of inhibiting a third party from making a proposal to acquire us or of impeding a change in control under circumstances that otherwise could provide our stockholders with the opportunity to realize a premium over the then-prevailing market price of their shares, including:
• | “business combination” provisions that, subject to limitations, prohibit certain business combinations between us and an “interested stockholder” (defined generally as any person (other than us or any subsidiary) who beneficially owns 10% or more of the voting power of our outstanding voting stock after the date on which we first had 100 or more beneficial owners of our stock, or an affiliate or associate of us who, at any time within the two-year period immediately prior to the date in question, was the beneficial owner of 10% or more of the voting power of our then outstanding stock after the date on which we first had 100 or more beneficial owners of our stock) or an affiliate of any interested stockholder for five years after the most recent date on which the interested stockholder became an interested stockholder, and, thereafter, any such business combination between us and an interested stockholder generally must be recommended by our Board of Directors and approved by the affirmative vote of at least (1) 80% of the votes entitled to be cast by holders of our outstanding voting stock and (2) two-thirds of the votes entitled to be cast by holders of our outstanding voting stock other than shares held by the interested stockholder with whom (or with whose affiliate) the business combination |
25
is to be effected or held by an affiliate or associate of the interested stockholder, unless, among other conditions, our stockholders receive a minimum price (as defined in the MGCL) for their shares and the consideration is received in cash or in the same form as previously paid by the interested stockholder for its shares; and
• | “control shares” provisions provide that holders of our “control shares” (defined as shares of stock which, if aggregated with all other such shares of stock owned by the acquirer or in respect of which the acquirer is able to exercise or direct the exercise of voting power (except solely by virtue of a revocable proxy), would entitle the acquirer to exercise voting power in electing directors within one of three ranges) acquired in a “control share acquisition” have no voting rights except to the extent approved by the affirmative vote of at least two-thirds of the votes entitled to be cast by our stockholders entitled to vote generally in the election of directors, excluding votes cast by (1) the person who makes or proposes to make a control share acquisition, (2) an officer or (3) an employee of us who is also a director of the corporation. |
By resolution of our Board of Directors, we have opted out of the business combination provisions of the MGCL and provided that (1) any business combination between us and any other person is exempt from the business combination provisions of the MGCL, and (2) such business combination is first approved by our Board of Directors (including a majority of directors who are not affiliates or associates of such persons). In addition, pursuant to a provision in our bylaws, we have opted out of the control share provisions of the MGCL. However, our Board of Directors may by resolution elect to opt in to the business combination provisions of the MGCL, and we may, by amendment to our bylaws, opt in to the control share provisions of the MGCL at any time in the future, whether before or after an acquisition of control shares.
Certain provisions of the MGCL permit our Board of Directors, without stockholder approval and regardless of what is currently provided in our charter or bylaws, to implement certain corporate governance provisions, some of which (for example, a classified board) are not currently applicable to us. These provisions may have the effect of limiting or precluding a third party from making an unsolicited acquisition proposal for us or of delaying, deferring or preventing a change in control of us under circumstances that otherwise could be in the best interests of our stockholders. Our charter contains a provision whereby we elect, at such time as we become eligible to do so, which occurred upon completion of the IPO, to be subject to the provisions of Title 3, Subtitle 8 of the MGCL relating to the filling of vacancies on our Board of Directors.
Our rights and the rights of our stockholders to take action against our directors and officers are limited, which could limit your recourse in the event of actions not in your best interests.
Under Maryland law, generally, a director will not be liable if he or she performs his or her duties in good faith, in a manner he or she reasonably believes to be in our best interests and with the care that an ordinarily prudent person in a like position would use under similar circumstances. In addition, our charter limits the liability of our directors and officers to us and our stockholders for money damages, except for liability resulting from:
• | actual receipt of an improper benefit or profit in money, property or services; or |
• | active and deliberate dishonesty that is established by a final judgment and is material to the cause of action. |
Our charter and bylaws provide for indemnification of our directors and officers for actions taken by them in those capacities to the maximum extent permitted by Maryland law. Our bylaws require us to indemnify each director and officer, to the maximum extent permitted by Maryland law, in the defense of any proceeding to which he or she is made, or threatened to be made, a party by reason of his or her service to us. In addition, we may be obligated to advance the defense costs incurred by our directors and officers pursuant to indemnification agreements between us and the director or officer. As a result, we and our stockholders may have more limited rights against our directors and officers than might otherwise exist absent the current provisions in our charter and bylaws or that might exist with other companies.
Our charter contains provisions that make removal of our directors difficult, and the employment agreements we have with some of our executives contain severance provisions that make termination of their employment under certain circumstances expensive for us, which could make it difficult for our stockholders to effect changes to our Board of Directors and our management.
Our charter provides that a director may be removed only for cause (as defined in our charter) and then only by the affirmative vote of holders of shares entitled to cast at least two-thirds of all the votes entitled to be cast generally in the election of directors. Our charter also provides that vacancies on our Board of Directors may be filled only by a majority of the remaining directors in office, even if less than a quorum. These requirements prevent stockholders from removing directors except for cause and with a substantial affirmative vote and from replacing directors with their own nominees and may prevent a change in control of our company that is in the best interests of our stockholders.
26
We have entered into employment agreements with several of our executive officers containing severance provisions that could make it difficult and costly for us to terminate their employment.
The ability of our Board of Directors to change our major policies without the consent of stockholders may not be in your interest.
Our Board of Directors determines our major policies, including policies and guidelines relating to our acquisitions, leverage, financing, growth, operations and distributions to stockholders. Our Board of Directors may amend or revise these and other policies and guidelines from time to time without the vote or consent of our stockholders. Accordingly, our stockholders will have limited control over changes in our policies and those changes could adversely affect our financial condition, results of operations and our ability to make distributions to our stockholders.
We may structure acquisitions of property in exchange for OP units on terms that could limit our liquidity or our flexibility.
We may acquire properties by issuing OP units in exchange for a property owner contributing property to the Operating Partnership. If we enter into such transactions, in order to induce the contributors of such properties to accept OP units, rather than cash, in exchange for their properties, it may be necessary for us to provide them additional incentives. For instance, our Operating Partnership’s limited partnership agreement provides that any holder of OP units may exchange OP units for cash equal to the value of an equivalent number of shares of our common stock or, at our option, for shares of our common stock on a one-for-one basis. We may, however, enter into additional contractual arrangements with contributors of property under which we would agree to repurchase a contributor’s OP units for shares of our common stock or cash, at the option of the contributor, at set times. If the contributor required us to repurchase OP units for cash pursuant to such a provision, it would limit our liquidity and thus our ability to use cash to make other investments, satisfy other obligations or make distributions to stockholders. Moreover, if we were required to repurchase OP units for cash at a time when we did not have sufficient cash to fund the repurchase, we might be required to sell one or more properties to raise funds to satisfy this obligation. Furthermore, we might agree that if distributions the contributor received as a limited partner in our Operating Partnership did not provide the contributor with a defined return, then upon redemption of the contributor’s OP units we would pay the contributor an additional amount necessary to achieve that return. Such a provision could further negatively impact our liquidity and flexibility. Finally, in order to allow a contributor of a property to defer taxable gain on the contribution of property to our Operating Partnership, we might agree not to sell a contributed property for a defined period of time or until the contributor exchanged the contributor’s OP units for cash or shares. Such an agreement would prevent us from selling those properties, even if market conditions made such a sale favorable to us.
Risks Related to Qualification and Operation as a REIT
Failure to remain qualified as a REIT would cause us to be taxed as a regular corporation, which would substantially reduce funds available for distribution to our stockholders.
We have limited operating history as a publicly traded REIT. The REIT rules and regulations are highly technical and complex. We cannot assure you our management team's experience will be sufficient to continue to successfully operate our company as a publicly traded REIT. We believe that our organization and proposed method of operation has enabled us to meet the requirements for qualification and taxation as a REIT commencing with our short taxable year ended December 31, 2012. However, we cannot assure you that we remain qualified as a REIT.
If we fail to qualify as a REIT in any taxable year, we will face serious tax consequences that will substantially reduce the funds available for distribution to our stockholders because:
• | we would not be allowed a deduction for dividends paid to stockholders in computing our taxable income and would be subject to federal income tax at regular corporate rates; |
• | we could be subject to the federal alternative minimum tax and possibly increased state and local taxes; and |
• | unless we are entitled to relief under certain federal income tax laws, we could not re-elect REIT status until the fifth calendar year after the year in which we failed to qualify as a REIT. |
In addition, if we fail to qualify as a REIT, we will no longer be required to make distributions. As a result of all these factors, our failure to qualify as a REIT could impair our ability to expand our business and raise capital, and it would adversely affect the market price of our stock.
Even if we continue to qualify for taxation as a REIT, we may face other tax liabilities that reduce our cash flows.
Even if we continue to qualify for taxation as a REIT, we may be subject to certain federal, state and local taxes on our income and assets, including taxes on any undistributed income, tax on income from some activities conducted as a result of a foreclosure and state or local income, property and transfer taxes. In addition, we could, in certain circumstances, be required to pay an excise or
27
penalty tax (which could be significant in amount) in order to utilize one or more relief provisions under the Code to maintain our qualification as a REIT. In addition, in order to meet the REIT qualification requirements, or to avert the imposition of a 100% tax that applies to certain gains derived by a REIT from dealer property or inventory, we may hold and/or dispose of some of our assets through our TRS or other subsidiary corporations that are subject to regular corporate federal, state and local taxes.
Failure to make required distributions would subject us to federal corporate income tax.
We intend to continue to operate in a manner so as to qualify as a REIT for federal income tax purposes. In order to qualify as a REIT, we generally are required to distribute at least 90% of our REIT taxable income, determined without regard to the dividends paid deduction and excluding any net capital gain, each year to our stockholders. To the extent that we satisfy this distribution requirement, but distribute less than 100% of our REIT taxable income, we will be subject to federal corporate income tax on our undistributed taxable income. In addition, we will be subject to a 4% nondeductible excise tax if the actual amount that we pay out to our stockholders in a calendar year is less than a minimum amount specified under the Code.
The prohibited transactions tax may limit our ability to dispose of our properties.
A REIT’s net income from prohibited transactions is subject to a 100% tax. In general, prohibited transactions are sales or other dispositions of property other than foreclosure property held primarily for sale to customers in the ordinary course of business. We may be subject to the prohibited transactions tax in an amount equal to 100% of net gain upon a disposition of real property. Although a safe harbor to the characterization of the sale of real property by a REIT as a prohibited transaction is available, we cannot assure you that we can comply with the safe harbor or that we will avoid owning property that may be characterized as held primarily for sale to customers in the ordinary course of business. Consequently, we may choose not to engage in certain sales of our properties or may conduct such sales through our TRS, which would be subject to federal and state income taxation as a corporation. For example, if we decide to acquire properties opportunistically to restore in anticipation of immediate resale, we will need to conduct that activity through our TRS to avoid the 100% prohibited transactions tax. No assurance can be given, however, that the Internal Revenue Service, or IRS, will respect the transaction by which any such properties are contributed to our TRS, and, even if the contribution transaction is respected, our TRS may incur a significant tax liability as a result of any such sales.
We may pay taxable dividends of cash and our stock, in which case stockholders may sell shares of our stock to pay tax on such dividends, placing downward pressure on the market price of our stock.
We may distribute taxable dividends that are payable in cash and our stock at the election of each stockholder. The IRS has issued private letter rulings to other REITs treating certain distributions that are paid partly in cash and partly in stock as taxable dividends that would satisfy the REIT annual distribution requirement and qualify for the dividends paid deduction for federal income tax purposes. Those rulings may be relied upon only by taxpayers to whom they were issued, but we could request a similar ruling from the IRS. In addition, the IRS previously issued a revenue procedure establishing a temporary safe harbor that authorized publicly traded REITs to make elective cash/stock dividends, but that temporary safe harbor has expired. Accordingly, it is unclear whether and to what extent we will be able to make taxable dividends payable in cash and our stock.
If we made a taxable dividend payable in cash and our stock, taxable stockholders receiving such dividends will be required to include the full amount of the dividend as ordinary income to the extent of our current and accumulated earnings and profits, as determined for federal income tax purposes. As a result, stockholders may be required to pay income tax with respect to such dividends in excess of the cash dividends received. If a U.S. stockholder sells our stock that it receives as a dividend in order to pay this tax, the sales proceeds may be less than the amount included in income with respect to the dividend, depending on the market price of our stock at the time of the sale. Furthermore, with respect to certain non-U.S. stockholders, we may be required to withhold federal income tax with respect to such dividends, including in respect of all or a portion of such dividend that is payable in stock. If we made a taxable dividend payable in cash and our stock and a significant number of our stockholders determine to sell shares of our stock in order to pay taxes owed on dividends, it may be viewed as economically equivalent to a dividend reduction and put downward pressure on the market price of our stock. We do not currently intend to pay taxable dividends in the form of our stock and cash, although we may choose to do so in the future.
Our ownership of our TRS is subject to limitations, and our transactions with our TRS will cause us to be subject to a 100% penalty tax on certain income or deductions if those transactions are not conducted on arm’s-length terms.
Overall, no more than 25% of the value of a REIT’s assets may consist of stock or securities of one or more taxable REIT subsidiaries. In addition, the Code limits the deductibility of interest paid or accrued by a taxable REIT subsidiary to its parent REIT to assure that the taxable REIT subsidiary is subject to an appropriate level of corporate taxation. The Code also imposes a 100% excise tax on REITs for certain transactions between a taxable REIT subsidiary and its parent REIT that are not conducted on an arm’s-length basis. Furthermore, we monitor the value of our respective investments in our TRS for the purpose of ensuring compliance with taxable REIT subsidiary ownership limitations and structure our transactions with our TRS on terms that we believe are arm’s length to avoid incurring the 100% excise tax described above. There can be no assurance, however, that we will be able to comply with the 25% REIT subsidiaries limitation or to avoid application of the 100% excise tax.
28
You may be restricted from acquiring or transferring certain amounts of our stock.
The stock ownership restrictions of the Code for REITs and the 9.8% stock ownership limit in our charter may inhibit market activity in our capital stock and restrict our business combination opportunities.
In order to qualify as a REIT for each taxable year, five or fewer individuals, as defined in the Code, may not own, beneficially or constructively, more than 50% in value of our issued and outstanding stock at any time during the last half of a taxable year. Attribution rules in the Code determine if any individual or entity beneficially or constructively owns our capital stock under this requirement. Additionally, at least 100 persons must beneficially own our capital stock during at least 335 days of a taxable year for each taxable year. To help insure that we meet these tests, our charter restricts the acquisition and ownership of shares of our capital stock.
Our charter, with certain exceptions, authorizes our directors to take such actions as are necessary and desirable to preserve our qualification as a REIT. Unless exempted by our Board of Directors, our charter prohibits any person from beneficially or constructively owning more than 9.8% in value or in number of shares, whichever is more restrictive, of the outstanding shares of any class or series of our capital stock. Our Board of Directors may not grant an exemption from these restrictions to any proposed transferee whose ownership in excess of 9.8% of the value of outstanding shares of our capital stock would result in our failing to qualify as a REIT. These restrictions on ownership and transfer will not apply, however, if our Board of Directors determines that it is no longer in our best interest to continue to qualify as a REIT or that compliance with the restrictions is no longer necessary in order for us to qualify as a REIT.
Complying with REIT requirements may cause us to forgo otherwise attractive opportunities.
To qualify as a REIT for federal income tax purposes, we must continually satisfy tests concerning, among other things, the sources of our income, the nature and diversification of our assets, the amounts that we distribute to our stockholders and the ownership of our capital stock. We may be required to make distributions to stockholders at disadvantageous times or when we do not have funds readily available for distribution and may be unable to pursue investments that would be otherwise advantageous to us in order to satisfy the source-of-income or asset-diversification requirements for qualifying as a REIT. Thus, compliance with the REIT requirements may hinder our ability to make certain attractive investments.
Dividends payable by REITs do not qualify for the reduced tax rates available for some dividends.
The maximum tax rate applicable to “qualified dividend income” payable to U.S. stockholders that are taxed at individual rates is 20%. Dividends payable by REITs, however, generally are not eligible for the reduced rates on qualified dividend income. The more favorable rates applicable to regular corporate qualified dividends could cause investors who are taxed at individual rates to perceive investments in REITs to be relatively less attractive than investments in the stocks of non-REIT corporations that pay dividends, which could adversely affect the value of the shares of REITs, including our stock.
We may be subject to adverse legislative or regulatory tax changes that could reduce the market price of our stock.
At any time, the federal income tax laws governing REITs or the administrative interpretations of those laws may be amended. We cannot predict when or if any new federal income tax law, regulation or administrative interpretation, or any amendment to any existing federal income tax law, regulation or administrative interpretation, will be adopted, promulgated or become effective, and any such law, regulation, or interpretation may take effect retroactively. We and our stockholders could be adversely affected by any such change in the federal income tax laws, regulations or administrative interpretations.
29
Item 1B. | Unresolved Staff Comments. |
None.
Item 2. | Properties. |
We lease our headquarters located at 7047 East Greenway Parkway, Suite 350, Scottsdale, Arizona 85254. We also lease office space located at 9015 W. Union Hills Drive, Suites 104 and 105, Peoria, Arizona 85352; 1363 Shermer Road, Suite 210, Northbrook, Illinois 60062; 201 17th Street, Suite 3055, Atlanta, Georgia 30363; and 6060 N. Central Expressway, 5th Floor, Dallas, Texas 75206.
The following table provides a summary of our portfolio of single-family properties by metropolitan statistical area, or MSA, and metropolitan division, or Metro Division, as of December 31, 2014.
MSA/Metro Division | Number of Homes | Aggregate Investment (in thousands) | Average Investment Per Home (1) | Percentage Leased (2) | Average Age (years) | Average Size (square feet) | ||||||||||||||
Phoenix, AZ | 1,380 | $ | 202,751 | $ | 146,921 | 92.7 | % | 17 | 1,713 | |||||||||||
Dallas-Fort Worth, TX | 1,093 | $ | 179,502 | $ | 164,229 | 79.3 | % | 11 | 2,114 | |||||||||||
Houston, TX | 1,106 | $ | 164,524 | $ | 148,756 | 90.7 | % | 7 | 1,934 | |||||||||||
Atlanta, GA | 1,062 | $ | 155,622 | $ | 146,536 | 54.0 | % | 16 | 2,099 | |||||||||||
Nashville, TN | 744 | $ | 131,093 | $ | 176,200 | 81.3 | % | 11 | 1,913 | |||||||||||
Florida | 625 | $ | 86,531 | $ | 138,450 | 61.0 | % | 13 | 1,722 | |||||||||||
Other Texas | 375 | $ | 66,998 | $ | 178,662 | 87.2 | % | 10 | 1,978 | |||||||||||
Chicago, IL | 511 | $ | 66,790 | $ | 130,705 | 100.0 | % | 55 | 1,406 | |||||||||||
Charlotte, NC-SC | 376 | $ | 60,411 | $ | 160,666 | 64.6 | % | 10 | 2,051 | |||||||||||
Inland Empire, CA | 213 | $ | 38,516 | $ | 180,825 | 95.8 | % | 16 | 1,915 | |||||||||||
Indianapolis, IN | 538 | $ | 38,034 | $ | 70,695 | 83.1 | % | 52 | 1,321 | |||||||||||
Raleigh, NC | 240 | $ | 36,722 | $ | 153,008 | 78.8 | % | 9 | 1,746 | |||||||||||
Winston-Salem, NC | 234 | $ | 29,560 | $ | 126,324 | 88.5 | % | 12 | 1,426 | |||||||||||
Other California | 80 | $ | 10,608 | $ | 132,594 | 95.0 | % | 36 | 1,335 | |||||||||||
Las Vegas, NV | 68 | $ | 7,505 | $ | 110,373 | 85.3 | % | 15 | 1,553 | |||||||||||
Other MSA/Metro Divisions | 248 | $ | 36,861 | $ | 148,634 | 81.9 | % | 10 | 1,639 | |||||||||||
Total/Weighted Average | 8,893 | $ | 1,312,028 | $ | 147,535 | 80.7 | % | 17 | 1,829 | |||||||||||
______________
(1) | For self-managed homes, represents average purchase price (including broker commissions and closing costs) plus average capital expenditures. For homes leased to preferred operators , represents purchase price (including broker commissions and closing costs) paid by us for the portfolio divided by the number of homes in the portfolio and does not include past, expected or budgeted general and administrative expenses associated with ongoing monitoring activities of our investment. The preferred operator is obligated to pay for all taxes, insurance, other expenses and capital expenditures (including significant capital improvements) required for the management, operation and maintenance of the properties. Accordingly, absent a default by the preferred operator under a long-term lease agreement with us, we expect to incur no expenses related to properties leased to our preferred operators, other than general and administrative expenses associated with ongoing monitoring activities of our investment. |
(2) | Includes both self-managed homes and homes leased to preferred operators. We classify homes leased to preferred operators as 100% leased, because each preferred operator is obligated to pay us 100% of the base rent specified in the applicable lease irrespective of whether or not the homes are occupied by residential sub-tenants. This does not mean that 100% of the homes leased to preferred operators are occupied by residential sub-tenants. If a preferred operator is unable to lease a material portion of the homes it leases from us to residential sub-tenants, it may adversely affect the operator’s ability to pay rent to us under the lease. |
30
Item 3. | Legal Proceedings. |
We are not involved in any material legal proceedings nor, to our knowledge, are any material legal proceedings threatened against us.
Item 4. | Mine Safety Disclosures. |
Not applicable.
PART II
Item 5. | Market for Registrant's Common Equity, Related Stockholder Matters and Issuer Purchases of Equity Securities. |
Market Information
Our shares of common stock began trading on the NYSE on May 9, 2013 under the symbol "ARPI." The following table sets forth, for the periods indicated, the high and low closing prices per share:
High | Low | ||||||||
2013 | |||||||||
Second Quarter (period from May 9, 2013 through June 30, 2013) | $ | 21.00 | $ | 17.20 | |||||
Third Quarter | $ | 18.41 | $ | 16.50 | |||||
Fourth Quarter | $ | 18.53 | $ | 16.29 | |||||
2014 | |||||||||
First Quarter | $ | 19.02 | $ | 17.12 | |||||
Second Quarter | $ | 19.28 | $ | 17.01 | |||||
Third Quarter | $ | 19.45 | $ | 18.09 | |||||
Fourth Quarter | $ | 19.16 | $ | 17.01 | |||||
Holders
As of December 31, 2014, we had 31 holders of record of our common stock. However, because most of our shares of common stock are held by brokers and other institutions on behalf of stockholders, we believe there are substantially more beneficial holders of shares of our common stock than record holders.
Dividends
As of December 31, 2014, we had not declared or paid any dividends.
We have elected to be taxed as a REIT for federal income tax purposes. As a REIT, under federal income tax law we are required to distribute annually at least 90% of our REIT taxable income. Subject to the requirements of the MGCL, we intend to pay quarterly dividends to our stockholders, if and to the extent authorized by our Board of Directors, which in the aggregate will approximately equal our REIT taxable income in the relevant year.
Securities Authorized for Issuance Under Equity Compensation Plan
The following table sets forth information regarding securities authorized for issuance under the American Residential Properties, Inc. 2012 Equity Incentive Plan, or our 2012 Equity Incentive Plan, as of December 31, 2014. See Note 7 to the accompanying consolidated financial statements for additional information regarding our 2012 Equity Incentive Plan.
31
Plan Category | Number of securities to be issued upon exercise of outstanding options, warrants and rights | Weighted-average exercise price of outstanding options, warrants and rights | Number of securities remaining available for future issuance under equity compensation plans | |||||||
Equity compensation plans approved by security holders | — | — | 472,128 | (1) | ||||||
Equity compensation plans not approved by security holders | — | — | — | |||||||
Total | — | 472,128 | ||||||||
______________
(1) | The aggregate limit of shares of our common stock available for grant under our 2012 Equity Incentive Plan is 1.5 million shares. Securities issued include: (i) 59,517 restricted shares of commons stock, net of forfeitures, comprised of 25,220 vested and 34,297 unvested shares, and (ii) 968,355 LTIP units, net of forfeitures, comprised of 441,242 vested LTIP units, of which 18,801 LTIP units were exchanged for shares of our common stock, and 527,113 unvested LTIP units. The vested and unvested LTIP units may be exchangeable in the future for shares of our common stock. |
Stock Performance Graph
The following graph provides a comparison of the cumulative total stockholder return from May 9, 2013, the date on which our shares began trading on the NYSE, to the NYSE closing price per share on December 31, 2014, with the cumulative total return of the Russell 2000 Index and the MSCI US Equity REIT Index for the same period. Total return values were calculated assuming a $100 investment in our shares of common stock and each of the indices on May 9, 2013 and the reinvestment of all dividends.
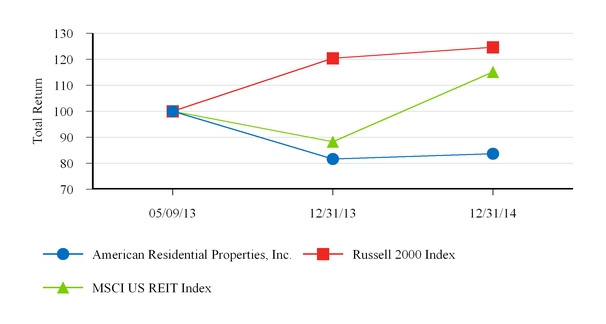
The actual returns shown on the graph above are as follows:
Name | Initial Investment at May 9, 2013 | Value of Initial Investment at December 31, 2013 | Value of Initial Investment at December 31, 2014 | |||||||||
American Residential Properties, Inc. | $ | 100.00 | $ | 81.71 | $ | 83.67 | ||||||
Russell 2000 Index | $ | 100.00 | $ | 120.43 | $ | 124.68 | ||||||
MSCI US REIT Index | $ | 100.00 | $ | 88.28 | $ | 115.10 | ||||||
32
Recent Sales of Unregistered Securities
On January 25, 2013, we issued 37,600 shares of our common stock to 19 accredited investors and 2 non-accredited investors (both of whom we reasonably believe have such knowledge and experience in financial and business matters that each was capable of evaluating the merits and risks of the investment) for a purchase price of $20.50 per share in a private placement in reliance on an exemption from registration under Section 4(a)(2) of the Securities Act and Rule 506 of Regulation D thereunder.
On March 1, 2013, we issued, or approved for issuance, an aggregate of 16,375 restricted shares of our common stock to certain of our employees under our 2012 Equity Incentive Plan, in reliance on an exemption from registration under Section 4(a)(2) of the Securities Act.
On April 4, 2013, we issued 2,500 LTIP units to one of our independent directors under our 2012 Equity Incentive Plan in reliance on an exemption from registration under Section 4(a)(2) of the Securities Act.
33
Item 6. | Selected Financial Data. |
The following tables present selected consolidated financial and operating data that has been derived from our audited consolidated financial statements and selected portfolio data. The following information should be read in conjunction with "Item 7. Management's Discussion and Analysis of Financial Condition and Results of Operations," "Item 8. Consolidated Financial Statements and Supplementary Data" and the notes to the financial statements, each of which is included elsewhere in this Annual Report on Form 10-K.
Consolidated Statement of Operations Data
(amounts in thousands, except share and per share amounts)
Year Ended December 31, | Period from March 30, (inception) to December 31, | |||||||||||||
2014 | 2013 | 2012 | ||||||||||||
Revenue: | ||||||||||||||
Rental | $ | 81,883 | $ | 32,354 | $ | 2,195 | ||||||||
Other | 4,981 | 5,606 | 735 | |||||||||||
Total revenue | 86,864 | 37,960 | 2,930 | |||||||||||
Expenses: | ||||||||||||||
Property operating and maintenance | 21,485 | 8,536 | 912 | |||||||||||
Real estate taxes | 14,787 | 6,095 | 608 | |||||||||||
Homeowners’ association fees | 2,145 | 1,170 | 330 | |||||||||||
Acquisition | 937 | 3,890 | 760 | |||||||||||
Depreciation and amortization | 47,298 | 22,193 | 1,804 | |||||||||||
General, administrative and other | 15,023 | 16,374 | 4,837 | |||||||||||
Interest | 22,664 | 5,113 | — | |||||||||||
Total expenses | 124,339 | 63,371 | 9,251 | |||||||||||
Loss from continuing operations before equity in net (loss) income of unconsolidated ventures | (37,475 | ) | (25,411 | ) | (6,321 | ) | ||||||||
Equity in net (loss) income of unconsolidated ventures | (158 | ) | 60 | 83 | ||||||||||
Net loss | (37,633 | ) | (25,351 | ) | (6,238 | ) | ||||||||
Net loss attributable to non-controlling interests | 654 | 368 | 99 | |||||||||||
Net loss attributable to common stockholders | $ | (36,979 | ) | $ | (24,983 | ) | $ | (6,139 | ) | |||||
Basic and diluted loss per share: | ||||||||||||||
Net loss per share attributable to common stockholders | $ | (1.15 | ) | $ | (0.92 | ) | $ | (0.53 | ) | |||||
Weighted-average number of shares of common stock outstanding | 32,143,934 | 27,130,348 | 11,536,193 | |||||||||||
Consolidated Balance Sheet Data
(amounts in thousands)
December 31, | ||||||||||||
2014 | 2013 | 2012 | ||||||||||
Investment in real estate, net | $ | 1,243,603 | $ | 775,548 | $ | 216,696 | ||||||
Cash, cash equivalents and restricted cash | 32,743 | 24,294 | 101,725 | |||||||||
All other assets | 84,427 | 94,360 | 31,006 | |||||||||
Total assets | $ | 1,360,773 | $ | 894,202 | $ | 349,427 | ||||||
Revolving credit facility | $ | 311,000 | $ | 169,000 | — | |||||||
Exchangeable senior notes, net | $ | 102,188 | $ | 99,377 | — | |||||||
Securitization loan, net | $ | 340,675 | — | — | ||||||||
Total liabilities | $ | 788,208 | $ | 286,783 | $ | 3,196 | ||||||
Total equity | $ | 572,565 | $ | 607,419 | $ | 346,231 | ||||||
34
Selected Portfolio Data
December 31, | ||||||||||
2014 | 2013 | 2012 | ||||||||
Total Portfolio | ||||||||||
Total properties owned | 8,893 | 6,073 | 1,775 | |||||||
Total properties leased | 7,173 | 4,528 | 1,350 | |||||||
Total homes % leased | 80.7 | % | 74.6 | % | 76.1 | % | ||||
Stabilized Portfolio | ||||||||||
Total stabilized properties (1)(2) | 7,841 | 5,375 | na | |||||||
Total stabilized leased properties (1)(2) | 7,173 | 4,537 | na | |||||||
Total stabilized properties % leased (1)(2) | 91.5 | % | 84.4 | % | na | |||||
Annual average rent per leased home as a percentage of average investment per leased home: | ||||||||||
Self-Managed Single-Family Homes | 10.2 | % | 10.4 | % | 9.9 | % | ||||
Preferred Operator Homes | 7.4 | % | 7.3 | % | 7.4 | % | ||||
______________
(1) | Properties are considered stabilized when renovations have been completed and the properties have been leased or available for rent for a period of greater than 90 days. Includes properties with in-place leases at the date of acquisition. |
(2) Operations commenced in 2012, therefore stabilized property statistics are not meaningful for the 2012 period.
35
Item 7. | Management’s Discussion and Analysis of Financial Condition and Results of Operations. |
The following discussion of our financial condition and results of operations should be read together with the "Selected Consolidated Financial Data," and the consolidated financial statements and related notes in Part II, Item 8 in this Annual Report on Form 10-K. This report, including the following Management’s Discussion and Analysis of Financial Condition and Results of Operations, contains forward-looking statements based upon our current expectations that involve risks and uncertainties. Our actual results may differ materially from those anticipated in these forward-looking statements as a result of various factors, including those set forth under “Forward-Looking Statements,” “Item IA. Risk Factors” or in other parts of this report.
Overview
We are an internally managed real estate company that acquires, owns and manages single-family homes as rental properties. In 2008, our founders, Stephen G. Schmitz, our Chief Executive Officer and Chairman, and Laurie A. Hawkes, our President and Chief Operating Officer and a member of our Board of Directors, identified a unique opportunity to acquire homes at distressed pricing and lease them at attractive rental rates. They subsequently began developing a vertically integrated platform to acquire and manage single-family homes on an institutional scale. We were formed to expand upon our founders’ vision, strategy and platform.
As of December 31, 2014, we owned 8,893 properties in Arizona, California, Colorado, Florida, Georgia, Illinois, Indiana, Nevada, North Carolina, Ohio, South Carolina, Tennessee and Texas with an aggregate investment of $1.3 billion, and we managed an additional 437 properties for ARP Phoenix Fund I, LP, or Phoenix Fund, in Arizona and Nevada. For the period from January 1, 2015 to February 28, 2015, we acquired 123 single-family homes for a total purchase price of approximately $22 million and contracted to acquire 30 additional homes for a total purchase price of approximately $5 million. Of the homes we acquired or contracted to acquire during this period, 90 homes are in Tennessee, 32 homes are in Georgia, 26 homes are in Texas, 4 homes are in North Carolina and 1 home is in Florida. There is no assurance that we will close on the properties we have under contract.
Our primary business strategy is to acquire, restore, lease and manage single-family homes as well-maintained investment properties to generate attractive risk-adjusted returns over the long-term. We employ a disciplined and focused approach to evaluating acquisition opportunities, considering the mix of rent yield and future home price appreciation potential when selecting a market and investment. Our strategic aggregation of single-family homes provides a strong foundation for creating long-term home price appreciation in our portfolio. We have the infrastructure to acquire large numbers of properties through multiple acquisition channels, including sourcing individual properties through auctions and brokers and purchasing portfolios of properties through brokerages or directly from operators, investors or banks. We restore homes to “rent-ready” condition in an efficient and cost-effective manner, to a standard that we believe appeals to our target tenants’ preferences, enabling us to attract qualified tenants and provide a high level of service to retain our tenants. We believe that our vertically integrated acquisition and management platform is critical to executing our strategy.
In addition to our primary business strategy of acquiring, restoring, leasing and managing single-family homes, we have a private mortgage financing business that generates attractive returns on invested capital and provides us access to acquisition opportunities and valuable market data. As of December 31, 2014, our private mortgage portfolio had an aggregate outstanding principal balance of $21.0 million, a weighted-average interest rate of 11.9% per annum and a weighted-average remaining term of 100 days.
We plan to continue acquiring single-family homes and other residential real estate related assets in markets that satisfy our investment criteria. We conduct substantially all of our operations through our Operating Partnership, in which we own a 96.7% interest, including the sole 0.4% general partnership interest that we hold through a subsidiary as of December 31, 2014 after giving effect to vested and unvested LTIP awards.
We have elected to be taxed as a REIT for federal income tax purposes. As a REIT, we are generally not subject to federal income taxes to the extent that we currently distribute all of our taxable income to our stockholders and meet other specific requirements. If we fail to qualify as a REIT in any taxable year, we will be subject to federal and state income tax (including any applicable alternative minimum tax) on our taxable income at regular corporate tax rates, and we may be ineligible to qualify as a REIT for four subsequent tax years. Even if we continue to qualify as a REIT, we may be subject to certain state or local income taxes, and our TRS, which is our taxable REIT subsidiary, will be subject to federal, state and local taxes on its income at regular corporate rates.
Industry Outlook
Residential housing is the largest real estate asset class in the United States with a size of approximately $20.4 trillion, according to the 2014 third-quarter Federal Reserve Flow of Funds release. Historically, according to the U.S. Census Bureau, approximately one-third of this asset class has been rented and single-family homes currently comprise roughly one-third of all residential rental housing.
36
We believe that an over-correction in residential housing prices in certain housing markets from their historic peak occurred as a result of the housing and mortgage crisis in 2008, creating the potential for home price appreciation. We also believe that there continues to be a large supply of single-family homes that we can acquire at favorable pricing.
Property Portfolio
The following three tables present summary statistics of our single-family homes by metropolitan statistical area, or MSA, and metropolitan division, or metro division, as of December 31, 2014, in descending order of aggregate investment. The first table includes our entire portfolio of single-family homes. The second table includes only the single-family homes that we manage. The third table includes only the single-family homes that our preferred operators manage.
Total Portfolio of Single-Family Homes - Summary Statistics | ||||
December 31, 2014
MSA/Metro Division | Number of Homes | Aggregate Investment (in thousands) | Average Investment Per Home (1) | Percentage Leased (2) | Average Age (years) | Average Size (square feet) | ||||||||||||||
Phoenix, AZ | 1,380 | $ | 202,751 | $ | 146,921 | 92.7 | % | 17 | 1,713 | |||||||||||
Dallas-Fort Worth, TX | 1,093 | $ | 179,502 | $ | 164,229 | 79.3 | % | 11 | 2,114 | |||||||||||
Houston, TX | 1,106 | $ | 164,524 | $ | 148,756 | 90.7 | % | 7 | 1,934 | |||||||||||
Atlanta, GA | 1,062 | $ | 155,622 | $ | 146,536 | 54.0 | % | 16 | 2,099 | |||||||||||
Nashville, TN | 744 | $ | 131,093 | $ | 176,200 | 81.3 | % | 11 | 1,913 | |||||||||||
Florida | 625 | $ | 86,531 | $ | 138,450 | 61.0 | % | 13 | 1,722 | |||||||||||
Other Texas | 375 | $ | 66,998 | $ | 178,662 | 87.2 | % | 10 | 1,978 | |||||||||||
Chicago, IL | 511 | $ | 66,790 | $ | 130,705 | 100.0 | % | 55 | 1,406 | |||||||||||
Charlotte, NC-SC | 376 | $ | 60,411 | $ | 160,666 | 64.6 | % | 10 | 2,051 | |||||||||||
Inland Empire, CA | 213 | $ | 38,516 | $ | 180,825 | 95.8 | % | 16 | 1,915 | |||||||||||
Indianapolis, IN | 538 | $ | 38,034 | $ | 70,695 | 83.1 | % | 52 | 1,321 | |||||||||||
Raleigh, NC | 240 | $ | 36,722 | $ | 153,008 | 78.8 | % | 9 | 1,746 | |||||||||||
Winston-Salem, NC | 234 | $ | 29,560 | $ | 126,324 | 88.5 | % | 12 | 1,426 | |||||||||||
Other California | 80 | $ | 10,608 | $ | 132,594 | 95.0 | % | 36 | 1,335 | |||||||||||
Las Vegas, NV | 68 | $ | 7,505 | $ | 110,373 | 85.3 | % | 15 | 1,553 | |||||||||||
Other MSA/Metro Divisions | 248 | $ | 36,861 | $ | 148,634 | 81.9 | % | 10 | 1,639 | |||||||||||
Total/Weighted Average | 8,893 | $ | 1,312,028 | $ | 147,535 | 80.7 | % | 17 | 1,829 | |||||||||||
______________
(1) | For self-managed homes, represents average purchase price (including broker commissions and closing costs) plus average capital expenditures. For homes leased to our preferred operators, represents purchase price (including broker commissions and closing costs) paid by us for the portfolio divided by the number of homes in the portfolio and does not include past, expected or budgeted general and administrative expenses associated with ongoing monitoring activities of our investment. The preferred operator is obligated to pay for all taxes, insurance, other expenses and capital expenditures (including significant capital improvements) required for the management, operation and maintenance of the properties. Accordingly, absent a default by the preferred operator under a long-term lease agreement with us, we expect to incur no expenses related to properties leased to our preferred operators, other than general and administrative expenses associated with ongoing monitoring activities of our investment. |
(2) | Includes both self-managed homes and homes leased to preferred operators. We classify homes leased to our preferred operators as 100% leased, because each preferred operator is obligated to pay us 100% of the base rent specified in the applicable lease irrespective of whether or not the homes are occupied by residential sub-tenants. This does not mean that 100% of the homes leased to preferred operators are occupied by residential sub-tenants. If a preferred operator is unable to lease a material portion of the homes it leases from us to residential sub-tenants, it may adversely affect the operator’s ability to pay rent to us under the lease. |
37
Portfolio of Self Managed Single-Family Homes - Summary Statistics | ||||
December 31, 2014
Leased Homes | |||||||||||||||||||||||||||||||||||
MSA/Metro Division | Number of Homes | Average Purchase Price Per Home (1) | Average Capital Expenditures Per Home (2) | Average Investment Per Home (3) | Aggregate Investment (in thousands) | Percentage Leased | Average Age (years) | Average Size (square feet) | Average Monthly Rent Per Leased Home | Annual Average Rent per Leased Home as a Percentage of Average Investment Per Leased Home (4) | |||||||||||||||||||||||||
Phoenix, AZ | 1,380 | $ | 138,109 | $ | 8,812 | $ | 146,921 | $ | 202,751 | 92.7 | % | 17 | 1,713 | $ | 1,033 | 8.5 | % | ||||||||||||||||||
Dallas-Fort Worth, TX | 1,093 | $ | 153,039 | $ | 11,190 | $ | 164,229 | $ | 179,502 | 79.3 | % | 11 | 2,114 | $ | 1,486 | 10.9 | % | ||||||||||||||||||
Houston, TX | 1,106 | $ | 141,311 | $ | 7,445 | $ | 148,756 | $ | 164,524 | 90.7 | % | 7 | 1,934 | $ | 1,400 | 11.3 | % | ||||||||||||||||||
Atlanta, GA | 1,062 | $ | 136,381 | $ | 10,155 | $ | 146,536 | $ | 155,622 | 54.0 | % | 16 | 2,099 | $ | 1,216 | 10.4 | % | ||||||||||||||||||
Nashville, TN | 744 | $ | 164,612 | $ | 11,588 | $ | 176,200 | $ | 131,093 | 81.3 | % | 11 | 1,913 | $ | 1,417 | 9.7 | % | ||||||||||||||||||
Florida | 625 | $ | 127,097 | $ | 11,353 | $ | 138,450 | $ | 86,531 | 61.0 | % | 13 | 1,722 | $ | 1,135 | 10.3 | % | ||||||||||||||||||
Other Texas | 375 | $ | 167,071 | $ | 11,591 | $ | 178,662 | $ | 66,998 | 87.2 | % | 10 | 1,978 | $ | 1,608 | 10.9 | % | ||||||||||||||||||
Charlotte, NC-SC | 376 | $ | 153,317 | $ | 7,349 | $ | 160,666 | $ | 60,411 | 64.6 | % | 10 | 2,051 | $ | 1,224 | 9.5 | % | ||||||||||||||||||
Inland Empire, CA | 213 | $ | 156,561 | $ | 24,264 | $ | 180,825 | $ | 38,516 | 95.8 | % | 16 | 1,915 | $ | 1,414 | 9.4 | % | ||||||||||||||||||
Raleigh, NC | 240 | $ | 145,011 | $ | 7,997 | $ | 153,008 | $ | 36,722 | 78.8 | % | 9 | 1,746 | $ | 1,220 | 9.8 | % | ||||||||||||||||||
Indianapolis, IN | 455 | $ | 65,493 | $ | 9,469 | $ | 74,962 | $ | 34,108 | 80.0 | % | 50 | 1,351 | $ | 821 | 12.7 | % | ||||||||||||||||||
Winston-Salem, NC | 234 | $ | 122,636 | $ | 3,688 | $ | 126,324 | $ | 29,560 | 88.5 | % | 12 | 1,426 | $ | 1,094 | 10.4 | % | ||||||||||||||||||
Other California | 80 | $ | 110,753 | $ | 21,841 | $ | 132,594 | $ | 10,608 | 95.0 | % | 36 | 1,335 | $ | 1,074 | 9.7 | % | ||||||||||||||||||
Las Vegas, NV | 68 | $ | 97,738 | $ | 12,635 | $ | 110,373 | $ | 7,505 | 85.3 | % | 15 | 1,553 | $ | 1,043 | 11.0 | % | ||||||||||||||||||
Other MSA/Metro Divisions | 248 | $ | 140,842 | $ | 7,792 | $ | 148,634 | $ | 36,861 | 81.9 | % | 10 | 1,639 | $ | 1,241 | 10.2 | % | ||||||||||||||||||
Total/Weighted Average | 8,299 | $ | 139,569 | $ | 10,005 | $ | 149,574 | $ | 1,241,312 | 79.3 | % | 15 | 1,861 | $ | 1,256 | 10.2 | % | ||||||||||||||||||
______________
(1) | Average purchase price includes broker commissions and closing costs. |
(2) | Represents average capital expenditures per home as of December 31, 2014. Does not include additional expected or future capital expenditures. |
(3) | Represents average purchase price plus average capital expenditures. |
(4) | Represents annualized average monthly rent per leased home as a percentage of our average investment (average purchase price per home plus average capital expenditures) per leased home. Does not include a provision for payment of ongoing property expenses (such as insurance, taxes, HOA fees and maintenance) or an allocation of our general and administrative expense, all of which materially impact our results. Accordingly, it should not be interpreted as a measure of profitability, and its utility in evaluating our business is limited. Average monthly rent for leased homes may not be indicative of average rents we may achieve on our vacant homes. |
Portfolio of Preferred Operator Single-Family Homes - Summary Statistics | ||||||
December 31, 2014
MSA/Metro Division | Number of Homes | Average Investment Per Home (1) | Aggregate Investment (in thousands) | Percentage Leased (2) | Average Age (years) | Average Size (square feet) | Average Monthly Rent Per Home Paid by Preferred Operator to Us (3) | Annual Rent as a Percentage of Average Investment Per Home (4) | |||||||||||||||||||
Chicago, IL | 511 | $ | 130,705 | $ | 66,790 | 100 | % | 55 | 1,406 | $ | 794 | 7.3 | % | ||||||||||||||
Indianapolis, IN | 83 | $ | 47,302 | $ | 3,926 | 100 | % | 59 | 1,160 | $ | 354 | 9.0 | % | ||||||||||||||
Total/Weighted Average | 594 | $ | 119,051 | $ | 70,716 | 100 | % | 56 | 1,372 | $ | 733 | 7.4 | % | ||||||||||||||
______________
(1) | Represents purchase price (including broker commissions and closing costs) paid by us for the portfolio divided by the number of homes in the portfolio and does not include past, expected or budgeted general and administrative expenses associated with ongoing monitoring activities of our investment. The preferred operator is obligated to pay for all taxes, insurance, other expenses and capital expenditures (including significant capital improvements) required for the management, operation and maintenance of the properties. Accordingly, absent a default by the preferred operator under a long-term lease agreement with us, we expect to incur no expenses related to properties leased to our preferred operators, other than general and administrative expenses associated with ongoing monitoring activities of our investment. |
(2) | We classify homes leased to our preferred operators as 100% leased, because each preferred operator is obligated to pay us 100% of the base rent specified in the applicable lease irrespective of whether or not the homes are occupied by residential sub-tenants. This does not mean that 100% of the homes leased to preferred operators are occupied by residential sub-tenants. If a preferred operator is unable to lease a material portion of the homes it leases from us to residential sub-tenants, it may adversely affect the operator’s ability to pay rent to us under the lease. |
38
(3) | Represents the initial annual base rent payable to us by the preferred operator pursuant to the portfolio lease divided by 12 and then divided by the number of homes included in the lease. |
(4) | Represents annualized average monthly rent paid by preferred operator to us as a percentage of our average investment per home. The rent paid by the preferred operator is net of all taxes, insurance, other expenses and capital expenses (including significant capital improvements) for which the preferred operator is responsible. |
Stabilized Properties
We acquire both vacant homes and homes subject to existing leases. When we acquire a property that is not leased, we must possess, restore, market and lease the property before it becomes a revenue generating asset. We refer to this process as property stabilization. Stabilized properties include properties in which we have (i) completed restorations and the property has been leased for the first time, (ii) completed restorations and the property has been listed for the first time for a period of greater than 90 days and (iii) acquired a property with an existing lease. Properties acquired with existing leases may require future renovations to restore a property to our standards prior to re-leasing. We expect that stabilized properties provide an indication of how our portfolio will perform over the long-term.
The following two tables presents summary statistics of our portfolio of stabilized single-family homes by MSA and metro division as of December 31, 2014, in descending order of number of homes. The first table includes our entire portfolio of stabilized single-family homes. The second table includes only the stabilized single-family homes that we manage.
Total Portfolio of Stabilized(1) Single-Family Homes —Summary Statistics
December 31, 2014
MSA/Metro Division | Number of Homes | Average Investment Per Home (2) | Homes Leased | Homes Vacant (3) | Percentage Leased | |||||||||||
Phoenix, AZ | 1,379 | $ | 146,968 | 1,279 | 100 | 92.7 | % | |||||||||
Houston, TX | 1,092 | $ | 148,475 | 1,003 | 89 | 91.8 | % | |||||||||
Dallas-Fort Worth, TX | 935 | $ | 163,541 | 867 | 68 | 92.7 | % | |||||||||
Nashville, TN | 649 | $ | 174,198 | 605 | 44 | 93.2 | % | |||||||||
Atlanta, GA | 632 | $ | 136,960 | 573 | 59 | 90.7 | % | |||||||||
Indianapolis, IN | 513 | $ | 71,286 | 447 | 66 | 87.1 | % | |||||||||
Chicago, IL | 511 | $ | 130,705 | 511 | — | 100.0 | % | |||||||||
Florida | 460 | $ | 128,852 | 381 | 79 | 82.8 | % | |||||||||
Other Texas | 361 | $ | 177,648 | 327 | 34 | 90.6 | % | |||||||||
Charlotte, NC-SC | 259 | $ | 154,975 | 243 | 16 | 93.8 | % | |||||||||
Winston-Salem, NC | 234 | $ | 126,324 | 207 | 27 | 88.5 | % | |||||||||
Raleigh, NC | 218 | $ | 150,292 | 189 | 29 | 86.7 | % | |||||||||
Inland Empire, CA | 213 | $ | 180,825 | 204 | 9 | 95.8 | % | |||||||||
Other California | 80 | $ | 132,594 | 76 | 4 | 95.0 | % | |||||||||
Las Vegas, NV | 67 | $ | 110,821 | 58 | 9 | 86.6 | % | |||||||||
Other MSA/Metro Divisions | 238 | $ | 148,285 | 203 | 35 | 85.3 | % | |||||||||
Total/Weighted Average | 7,841 | $ | 145,185 | 7,173 | 668 | 91.5 | % | |||||||||
______________
(1) | Properties are considered stabilized when renovations have been completed and the properties have been leased or available for rent for a period of greater than 90 days. Includes properties with in-place leases at the date of acquisition. |
(2) | Represents average purchase price plus average capital expenditures. |
(3) | As of December 31, 2014, 493 homes were available for rent and 175 homes were undergoing renovation. |
39
Portfolio of Self-Managed Stabilized(1) Single-Family Homes—Summary Statistics
December 31, 2014
Leased Homes | |||||||||||||||||||||||||||||||
MSA/Metro Division | Number of Homes | Average Purchase Price Per Home (2) | Average Capital Expenditure Per Home (3) | Average Investment Per Home (4) | Homes Leased | Homes Vacant (5) | Percentage Leased | Average Monthly Rent Per Leased Home | Annual Average Rent per Leased Home as a Percentage of Average Investment Per Leased Home (6) | ||||||||||||||||||||||
Phoenix, AZ | 1,379 | $ | 138,152 | $ | 8,816 | $ | 146,968 | 1,279 | 100 | 92.7 | % | $ | 1,033 | 8.5 | % | ||||||||||||||||
Houston, TX | 1,092 | $ | 141,021 | $ | 7,454 | $ | 148,475 | 1,003 | 89 | 91.8 | % | $ | 1,400 | 11.3 | % | ||||||||||||||||
Dallas-Fort Worth, TX | 935 | $ | 151,839 | $ | 11,702 | $ | 163,541 | 867 | 68 | 92.7 | % | $ | 1,486 | 10.9 | % | ||||||||||||||||
Nashville, TN | 649 | $ | 162,077 | $ | 12,121 | $ | 174,198 | 605 | 44 | 93.2 | % | $ | 1,417 | 9.7 | % | ||||||||||||||||
Atlanta, GA | 632 | $ | 123,835 | $ | 13,125 | $ | 136,960 | 573 | 59 | 90.7 | % | $ | 1,216 | 10.4 | % | ||||||||||||||||
Florida | 460 | $ | 116,736 | $ | 12,116 | $ | 128,852 | 381 | 79 | 82.8 | % | $ | 1,135 | 10.3 | % | ||||||||||||||||
Indianapolis, IN | 430 | $ | 66,800 | $ | 9,115 | $ | 75,915 | 364 | 66 | 84.7 | % | $ | 821 | 12.7 | % | ||||||||||||||||
Other Texas | 361 | $ | 166,008 | $ | 11,640 | $ | 177,648 | 327 | 34 | 90.6 | % | $ | 1,608 | 10.9 | % | ||||||||||||||||
Charlotte, NC-SC | 259 | $ | 146,934 | $ | 8,041 | $ | 154,975 | 243 | 16 | 93.8 | % | $ | 1,224 | 9.5 | % | ||||||||||||||||
Winston-Salem, NC | 234 | $ | 122,636 | $ | 3,688 | $ | 126,324 | 207 | 27 | 88.5 | % | $ | 1,094 | 10.4 | % | ||||||||||||||||
Raleigh, NC | 218 | $ | 142,234 | $ | 8,058 | $ | 150,292 | 189 | 29 | 86.7 | % | $ | 1,220 | 9.8 | % | ||||||||||||||||
Inland Empire, CA | 213 | $ | 156,561 | $ | 24,264 | $ | 180,825 | 204 | 9 | 95.8 | % | $ | 1,414 | 9.4 | % | ||||||||||||||||
Other California | 80 | $ | 110,753 | $ | 21,841 | $ | 132,594 | 76 | 4 | 95.0 | % | $ | 1,074 | 9.7 | % | ||||||||||||||||
Las Vegas, NV | 67 | $ | 98,271 | $ | 12,550 | $ | 110,821 | 58 | 9 | 86.6 | % | $ | 1,043 | 11.0 | % | ||||||||||||||||
Other MSA/Metro Divisions | 238 | $ | 140,400 | $ | 7,885 | $ | 148,285 | 203 | 35 | 85.3 | % | $ | 1,241 | 10.2 | % | ||||||||||||||||
Total/Weighted Average | 7,247 | $ | 136,919 | $ | 10,408 | $ | 147,327 | 6,579 | 668 | 90.8 | % | $ | 1,256 | 10.2 | % | ||||||||||||||||
______________
(1) | Properties are considered stabilized when renovations have been completed and the properties have been leased or available for rent for a period of greater than 90 days. Includes properties with in-place leases at the date of acquisition. |
(2) | Average purchase price includes broker commissions and closing costs. |
(3) | Represents average capital expenditures per home as of December 31, 2014. Does not include additional expected or future capital expenditures. |
(4) | Represents average purchase price plus average capital expenditures. |
(5) | As of December 31, 2014, 493 homes were available for rent and 175 homes were undergoing renovation. |
(6) | Represents annualized average monthly rent per leased home as a percentage of our average investment (average purchase price per home plus average capital expenditures) per leased home. Does not include a provision for payment of ongoing property expenses (such as insurance, taxes, HOA fees and maintenance) or an allocation of our general and administrative expense, all of which materially impact our results. Accordingly, it should not be interpreted as a measure of profitability, and its utility in evaluating our business is limited. Average monthly rent for leased homes may not be indicative of average rents we may achieve on our vacant homes. |
Highlights of 2014
Acquisitions
During 2014, we acquired 2,839 single-family homes, of which 815 are in Georgia, 785 are in Texas, 520 are in Tennessee, 392 are in Florida, 248 are in North Carolina, 62 are in Indiana, 15 are in Illinois, 1 is in Ohio and 1 is in South Carolina, and incurred renovation and re-tenancy costs on our existing portfolio, which increased our total investment $509.9 million to approximately $1.3 billion.
Securitization
In August 2014, we completed a securitization transaction resulting in $340.6 million in total gross proceeds, before issuance costs of $10.9 million. The transaction involves the issuance and sale of single-family rental pass-through certificates that represents beneficial ownership interest in a loan secured by 2,876 homes sold to an affiliate from our portfolio of single-family properties. The loan has an initial term of two years, with three 12-month extension options, resulting in a fully extended maturity date of September 9, 2019 and requires that we maintain certain covenants, including but not limited to, a minimum debt yield on the collateral pool of properties. The effective weighted average of the fixed-rate spreads is 2.11% plus 1-month LIBOR. The unamortized discount at December 31, 2014 was $1.6 million.
Additionally, as part of certain lender requirements in connection with the securitization transaction, we entered into an interest rate cap agreement for the initial two year term of the loan, with a LIBOR based strike rate equal to 3.12%. This interest
40
rate cap agreement has been formally designated as a cash flow hedge at inception and will be regularly assessed for effectiveness on an on-going basis.
Amended Credit Facility
In June 2014, we amended the credit agreement governing our Credit Facility, to, among other things, increase the maximum borrowing amount from $380 million to $500 million. In addition, the amendment agreed to by the lenders increased the size of the accordion feature to provide for a maximum borrowing amount of $750 million, subject to meeting certain criteria and obtaining additional commitments from the lenders.
41
Factors Expected to Affect Our Results and Financial Condition
Our results of operations and financial condition are affected by numerous factors, many of which are beyond our control. Key factors that impact our results of operations and financial condition include our pace of acquisitions and ability to deploy our capital, the amount of time and cost required to stabilize newly acquired properties and convert them to revenue generating assets, rental rates, occupancy levels, rates of tenant turnover, the success of our preferred operators, our expense ratios and capital structure.
Property Acquisitions
We have aggressively but prudently grown our portfolio of single-family homes. Our ability to identify and acquire single-family homes that meet our investment criteria is impacted by home prices in our markets, the inventory of properties available for sale through our acquisition channels and competition for our target assets.
Property Stabilization
The time and cost involved in stabilizing our newly acquired properties impacts our financial performance and is affected by the amount of time it takes us to gain possession of a property, the amount of time and cost associated with property restoration and the amount of time it takes to market and lease the property. Our possession of each property we acquire can be delayed for a multitude of reasons beyond our control, including applicable statutory rights of redemption, rescission rights and legal challenges to our ownership or unauthorized occupants living in the property at the time of purchase. As part of our underwriting criteria, we typically estimate restoration costs to be 5% to 15% of the purchase price, although actual costs may vary significantly based on market, age and condition of the property and other factors. The time to restore a newly acquired property can vary significantly among properties for several reasons, including the channel through which the property was acquired, the age and condition of the property and whether the property was vacant when we acquired it. Similarly, the time to market and lease a property is driven by local demand, our marketing techniques and the size of our available inventory. We actively monitor these measures and trends.
We anticipate that, on average, the stabilization period for each non-leased property that we acquire will range from 90 to 180 days. As of December 31, 2014, we had 7,841 properties owned in our portfolio of stabilized single-family homes, of which 91.5% were leased. We acquire both vacant homes and homes subject to existing leases. Homes acquired with existing leases may require future renovations to restore a property to our standards prior to re-leasing, which will impact the turnover time and may not be fully indicative of how we expect our stabilized portfolio to perform over time. We continually track key metrics such as average time to obtain possession, restore and lease our properties.
Revenue
Our revenue comes primarily from rents collected under lease agreements for our properties. These include both short-term leases that we enter into directly with tenants, which typically have a term of one year, and longer-term net leases, which typically have a term of five to ten years, that we enter into with preferred operators who sub-lease the properties to sub-tenants. For the year ended December 31, 2014, approximately 94.3% of our total revenue was attributable to rental activity, 0.4% was attributable to management services and the remaining 5.3% was attributable to interest earned on our portfolio of private mortgage financings and on cash balances. Over time, we expect most of our revenue to be derived from leasing our properties. The most important drivers of revenue (aside from portfolio growth) are rental and occupancy rates. Our rental and occupancy rates are affected by macroeconomic factors and local and property-level factors, including, market conditions, seasonality, tenant defaults, the amount of time that it takes us to restore properties upon acquisition and the amount of time it takes us to restore and re-lease vacant properties.
In each of our markets, we monitor a number of factors that may impact the single-family real estate market and our tenants’ finances, including the unemployment rate, household formation and net population growth, income growth, size and make-up of existing and anticipated housing stock, prevailing market rental and mortgage rates, rental vacancies and credit availability. Growth in demand for rental housing in excess of the growth of rental housing supply, among other factors, will generally drive higher occupancy and rental rates. Negative trends in our markets with respect to these metrics or others could adversely impact our rental revenue. The growth of our portfolio has been significant during the past year, increasing 46% to 8,893 single-family homes located in 13 states.
We expect that the occupancy of our portfolio will increase as the proportion of recently acquired properties declines relative to the size of our entire portfolio. Nevertheless, our ability to drive revenue growth will depend in large part on our ability to efficiently restore and lease newly acquired properties, maintain occupancy in the rest of our portfolio and acquire additional properties.
42
The following table summarizes our portfolio and operating metrics by quarter during 2014.
As of December 31, 2014 | As of September 30, 2014 | As of June 30, 2014 | As of March 31, 2014 | ||||||||||||||||||||
Number of Homes | % Leased | Number of Homes | % Leased | Number of Homes | % Leased | Number of Homes | % Leased | ||||||||||||||||
Portfolio of single-family homes | |||||||||||||||||||||||
Self-managed (1) | 8,299 | 79.3 | % | 7,613 | 80.1 | % | 6,595 | 87.6 | % | 6,152 | 79.5 | % | |||||||||||
Preferred operator (2) | 594 | 100.0 | % | 610 | 100.0 | % | 610 | 100.0 | % | 610 | 100.0 | % | |||||||||||
Total properties | 8,893 | 80.7 | % | 8,223 | 81.6 | % | 7,205 | 88.6 | % | 6,762 | 81.4 | % | |||||||||||
Portfolio of stabilized single-family homes (3) | |||||||||||||||||||||||
Self-managed (1) | 7,247 | 90.8 | % | 6,572 | 92.8 | % | 6,099 | 94.7 | % | 5,277 | 92.7 | % | |||||||||||
Preferred operator (2) | 594 | 100.0 | % | 610 | 100.0 | % | 610 | 100.0 | % | 610 | 100.0 | % | |||||||||||
Total properties | 7,841 | 91.5 | % | 7,182 | 93.4 | % | 6,709 | 95.2 | % | 5,887 | 93.4 | % | |||||||||||
______________
(1) | The amount presented represents the properties that were leased as of the end of the period. |
(2) | We classify homes leased to our preferred operators as 100% leased, because each preferred operator is obligated to pay us 100% of the base rent specified in the applicable lease irrespective of whether or not the homes are occupied by residential sub-tenants. This does not mean that 100% of the homes leased to preferred operators are occupied by residential sub-tenants. If a preferred operator is unable to lease a material portion of the homes it leases from us to residential sub-tenants, it may adversely affect the operator’s ability to pay rent to us under the lease. |
(3) | Properties are considered stabilized when renovations have been completed and the properties have been leased or available for rent for a period of greater than 90 days. Properties with in-place leases at the date of acquisition are also considered stabilized even though these properties have not been renovated and may require future renovations to meet our standards. |
The following table summarizes our acquisition activity by quarter during 2014.
Total Owned Properties as of December 31, 2014 | Three Months Ended December 31, 2014 | Three Months Ended September 30, 2014 | Three Months Ended June 30, 2014 | Three Months Ended March 31, 2014 | Total Owned Properties as of December 31, 2013 | ||||||||||||
Portfolio of single-family homes | |||||||||||||||||
Self-managed | 8,302 | 688 | 1,019 | 443 | 674 | 5,478 | |||||||||||
Preferred operator program | 610 | — | — | — | 15 | 595 | |||||||||||
Properties sold (1) | (19 | ) | (18 | ) | (1 | ) | — | — | — | ||||||||
Total properties | 8,893 | 670 | 1,018 | 443 | 689 | 6,073 | |||||||||||
______________
(1) | Total properties sold include 16 preferred operator homes and 3 self-managed homes. |
For the period from January 1, 2015 to February 28, 2015, we acquired 123 single-family homes for a total purchase price of approximately $22 million and contracted to acquire 30 additional homes for a total purchase price of approximately $5 million. Of the homes we acquired or contracted to acquire during this period, 90 homes are in Tennessee, 32 homes are in Georgia, 26 homes are in Texas, 4 homes are in North Carolina and 1 home is in Florida. There is no assurance that we will close on the properties we have under contract.
Expenses
Our ability to acquire, restore, lease and maintain our portfolio in a cost-effective manner will be a key driver of our operating performance. We monitor the following categories of expenses that we believe most significantly affect our results of operations.
Property-Related Expenses
Once we acquire and restore a self-managed property, we have ongoing property-related expenses, including HOA fees (when applicable), taxes, insurance, ongoing costs to market and maintain the property and expenses associated with tenant turnover. Certain of these expenses are not subject to our control, including HOA fees, property insurance and real estate taxes. We expect that certain of our costs, including insurance costs and property management costs, will account for a smaller percentage of our revenue as we expand our portfolio, achieve larger scale and negotiate volume discounts with third-party service providers and vendors. For properties leased to preferred operators, we have no day-to-day operating responsibilities or property-related expenses, because such responsibilities and expenses are obligations of the operators pursuant to the terms of the leases. As of December 31, 2014, 594 of our properties were managed by two preferred operators.
43
Property Management
We provide all property management functions for our self-managed properties. For the properties we manage, these functions include: securing the property upon acquisition; coordinating with the utilities; controlling the restoration process; managing the leasing process; communicating with tenants; collecting rents; conducting periodic inspections, routine property maintenance and repairs; paying HOA fees; interfacing with vendors and contractors; and accounting and compliance.
By performing these functions internally for our self-managed properties, we believe that we establish improved communications, foster direct relationships with tenants, gain tighter control over the quality and cost of restorations and property maintenance, gain increased attention and focus of third-party leasing agents and improve the timeliness of rental receipts.
Overhead
We will incur expenses associated with our vertically integrated real estate acquisition and management platform, such as compensation expense and other general and administrative costs. In the near term, as our business grows, we expect to hire additional employees, which will increase our general and administrative costs. In addition, we will incur additional costs related to operating as a public company due to increased legal, insurance, accounting and other expenses related to corporate governance, SEC reporting and other compliance matters. Over time, we expect these costs to decline as a percentage of revenue as our portfolio grows.
Based on our experience, we believe that the property-related expenses for vacancy, bad debt, property taxes, insurance, HOA fees, repairs and maintenance and capital expenditure reserves and the costs for property management services, such as managing the process of restoring, marketing, leasing and maintaining our stabilized single-family homes, will average between 40% and 45% of gross rental revenue. Variations in asset level returns will be due to a variety of factors, including location, age and condition of the property and the efficiency of our property management services.
Results of Operations
Our December 31, 2014 consolidated financial statements and results of operations include a comparison to the year ended December 31, 2013 and the period from March 30, 2012 (inception) to December 31, 2012. Through December 31, 2014, we acquired a total of 8,893 properties (net of 19 properties sold). We believe our financial results during the year ended December 31, 2014 are not representative of our future financial results. As we have been experiencing rapid growth since the commencement of our investment activities, we have a greater percentage of our portfolio invested in assets in the process of stabilization than we would expect to have as our company continues to mature. Newly acquired properties that are not leased at the time of acquisition will not begin generating revenue during this process of stabilization to offset fixed expenses incurred and, therefore, will reduce our overall financial performance in the near term. Accordingly, our operating margin has an opportunity to improve as vacant properties in our self-managed portfolio are leased and begin generating rental revenue.
44
The following are our results of operations for the years ended December 31, 2014 and 2013 and the period from March 30, 2012 (inception) to December 31, 2012:
Consolidated Statement of Operations Data
(amounts in thousands)
Year Ended December 31, | Period from March 30, (inception) to December 31, | 2013 to 2014 Change in $ | 2013 to 2014 Change in % | |||||||||||||||||
2014 | 2013 | 2012 | ||||||||||||||||||
Revenue: | ||||||||||||||||||||
Rental revenue | $ | 81,883 | $ | 32,354 | $ | 2,195 | $ | 49,529 | 153.1 | % | ||||||||||
Management services (related party) | 393 | 442 | 238 | (49 | ) | (11.1 | )% | |||||||||||||
Interest and other | 4,588 | 5,164 | 497 | (576 | ) | (11.2 | )% | |||||||||||||
Total revenue | 86,864 | 37,960 | 2,930 | 48,904 | 128.8 | % | ||||||||||||||
Expenses: | ||||||||||||||||||||
Property operating and maintenance | 21,485 | 8,536 | 912 | 12,949 | 151.7 | % | ||||||||||||||
Real estate taxes | 14,787 | 6,095 | 608 | 8,692 | 142.6 | % | ||||||||||||||
Homeowners’ association fees | 2,145 | 1,170 | 330 | 975 | 83.3 | % | ||||||||||||||
Acquisition | 937 | 3,890 | 760 | (2,953 | ) | (75.9 | )% | |||||||||||||
Depreciation and amortization | 47,298 | 22,193 | 1,804 | 25,105 | 113.1 | % | ||||||||||||||
General, administrative and other | 15,023 | 16,374 | 4,837 | (1,351 | ) | (8.3 | )% | |||||||||||||
Interest | 22,664 | 5,113 | — | 17,551 | 343.3 | % | ||||||||||||||
Total expenses | 124,339 | 63,371 | 9,251 | 60,968 | 96.2 | % | ||||||||||||||
Loss from continuing operations before equity in net income of unconsolidated ventures | (37,475 | ) | (25,411 | ) | (6,321 | ) | (12,064 | ) | 47.5 | % | ||||||||||
Equity in net (loss) income of unconsolidated ventures | (158 | ) | 60 | 83 | (218 | ) | (363.3 | )% | ||||||||||||
Net loss | (37,633 | ) | (25,351 | ) | (6,238 | ) | (12,282 | ) | 48.4 | % | ||||||||||
Net loss attributable to non-controlling interests | 654 | 368 | 99 | 286 | 77.7 | % | ||||||||||||||
Net loss attributable to common stockholders | $ | (36,979 | ) | $ | (24,983 | ) | $ | (6,139 | ) | $ | (11,996 | ) | 48.0 | % | ||||||
Comparison of the Year Ended December 31, 2014 and the Year Ended December 31, 2013
Rental Revenue
Rental revenue includes rental revenue from our residential properties, application fees and lease termination fees. Our rental revenue of $81.9 million and $32.4 million for the years ended December 31, 2014 and 2013 was comprised of rental revenue from self-managed properties of $76.8 million and $26.1 million for the year ended December 31, 2014 and 2013, respectively, and $5.1 million and $6.2 million of revenue from preferred operator properties for the year ended December 31, 2014 and 2013, respectively. As of December 31, 2014, approximately 79.3% of our self-managed properties were leased. The increase in total revenue from the prior year is primarily attributable to growth in our portfolio from 6,073 homes as of December 31, 2013 to 8,893 homes as of December 31, 2014 and higher rental income generated from the leases of an additional 2,645 homes in 2014 coupled with higher rental rates.
During the fourth quarter 2013, we terminated the leases with three of our preferred operators. We have assumed management of these Company-owned properties, which the preferred operators had been operating pursuant to leases, and we transferred 828 homes from our preferred operator portfolio into our self-managed portfolio, of which 336 homes are in Indiana, 166 homes are in Arizona, 163 homes are in Georgia, 138 homes are in Florida, 14 homes are in Nevada and 11 homes are in North Carolina. In connection with this termination, we recorded a provision for doubtful accounts of $0.8 million for the year ended December 31, 2013. Our rental revenue was negatively impacted by a $1.1 million reduction in revenue related to the lease terminations with three preferred operators.
45
Management Services Revenue
Management services revenue was $0.4 million and $0.4 million for the years ended December 31, 2014 and 2013, respectively. From the completion of our initial private offering through February 11, 2013, management services revenue represented fee income earned from ARM for property restoration, leasing and management services provided to Phoenix Fund, a related party, under a sub-management agreement with ARM. Since February 11, 2013, management services revenue represents fee income earned from Phoenix Fund for property restoration, leasing and management services provided to Phoenix Fund under a management agreement between Phoenix Fund and our TRS.
Interest and Other Revenue
Interest and other revenue was $4.6 million and $5.2 million for the years ended December 31, 2014 and 2013, respectively, and includes interest income earned on private mortgage financings and interest income earned on cash balances held with financial institutions. The decrease in interest and other income is primarily due to the decrease in our mortgage portfolio balance. Our mortgage portfolio had an aggregate outstanding balance of $21.1 million as of December 31, 2014 compared to an aggregate outstanding balance of $43.5 million as of December 31, 2013.
Property Operating and Maintenance
Property operating and maintenance expenses were $21.5 million and $8.5 million for the years ended December 31, 2014 and 2013, respectively, and includes all direct and indirect costs related to operating our residential properties, including management personnel, insurance, utilities, landscaping and general repairs and maintenance, other than real estate taxes and HOA fees, which are presented separately in our December 31, 2014 and 2013 consolidated statements of operations. The increase in property and maintenance expenses is due primarily to growth in our portfolio to 8,893 homes as of December 31, 2014 from 6,073 homes as of December 31, 2013. To a lesser extent, the increase is due to increased re-tenancy costs as the number of homes leased has increased by 2,645 over prior year as well as increased property management expenses due to the increase in our portfolio of homes.
Real Estate Taxes
Real estate taxes were $14.8 million and $6.1 million for the years ended December 31, 2014 and 2013. Upon acquisition of a home, its real estate taxes are set based upon municipal and state laws. These costs generally remain constant throughout the year and have little variation. Because these expenses are relatively fixed during each year, our operating margin has an opportunity to improve as vacant properties in our self-managed portfolio are leased and begin generating rental revenue. In subsequent years, real estate taxes will fluctuate based on changes in property values, municipal and state real estate tax rates and the number of homes in our portfolio. Real estate taxes have increased primarily due to the increase in the number of homes in our portfolio from 6,073 at December 31, 2013 to 8,893 at December 31, 2014. Real estate taxes for the year ended December 31, 2013 include approximately $1.0 million in property taxes related to the termination of the preferred operator leases on 828 properties in Arizona, Florida, Georgia, Indiana, Nevada and North Carolina.
Homeowners’ Association Fees
HOA fees were $2.1 million and $1.2 million for the years ended December 31, 2014 and 2013. Like real estate taxes, these fees are determined upon each property's acquisition and generally remain fixed thereafter based upon the existing HOA agreements. The increase in homeowners' association fees is due to growth in our portfolio of homes from 6,073 at December 31, 2013 to 8,893 at December 31, 2014.
Acquisition
Acquisition expenses were $0.9 million and $3.9 million for the years ended December 31, 2014 and 2013. These expenses are primarily transaction costs incurred in connection with the acquisition of properties with existing leases, including but not limited to, payments for property inspections, closing costs, title insurance, transfer taxes, recording fees and broker commissions. For properties that are leased at the time of acquisition, these costs are expensed, rather than capitalized as a component of the acquisition cost (which is the accounting treatment of these costs for properties that are vacant at the time of acquisition). The decrease in 2014 in acquisition expenses is due primarily to us moving away from purchasing properties with existing leases to acquiring vacant properties.
Depreciation and Amortization
Depreciation and amortization includes depreciation expense on our real estate portfolio using the straight-line method over the estimated useful lives of the respective assets, ranging from 5 to 27.5 years, from the date of acquisition. Depreciation and amortization also includes amortization expense related to in-place lease intangibles, deferred leasing costs and other direct costs capitalized associated with leasing our properties, amortized over the remaining term of the related leases. The increase in depreciation
46
and amortization is primarily attributable to the growth in our real estate portfolio. The following table summarizes our depreciation and amortization expense (amounts in thousands):
Year Ended December 31, | ||||||||
2014 | 2013 | |||||||
Depreciation of real estate portfolio | $ | 40,014 | $ | 16,781 | ||||
Depreciation of other assets | 905 | 376 | ||||||
Amortization of in-place lease intangibles and other direct costs | 6,379 | 5,036 | ||||||
Total depreciation and amortization | $ | 47,298 | $ | 22,193 | ||||
General, Administrative and Other
General, administrative and other expense was $15.0 million and $16.4 million for the years ended December 31, 2014 and 2013. These expenses include payroll expense, professional fees, insurance expense and office expenses. During the year ended December 31, 2014, these expenses include $3.0 million in non-cash stock compensation expense. The reason for the decrease in general, administrative and other expenses is primarily due to a decrease in stock compensation expense of $2.3 million. Stock compensation expenses were higher in 2013 due to IPO related, one-time charges. During the year ended December 31, 2013, these expenses include $5.3 million in non-cash stock compensation expense, $1.0 million in bonuses awarded to our Chief Executive Officer and our President and Chief Operating Officer upon registration of shares sold in our initial private offering and upon completion of our IPO, pursuant to their respective employment agreements and $0.4 million in severance charges. The $5.3 million in non-cash stock compensation expense includes $3.1 million in non-recurring, accelerated vesting expense incurred upon completion of our IPO in May 2013.
Interest Expense
Interest expense includes interest on outstanding debt, non-utilization fees for unused portions of our Credit Facility, amortization of deferred financing costs incurred in connection with the issuance of our outstanding debt, non-cash charges related to the accretion of the discounts on the exchangeable senior notes and the Securitization Loan, net of amounts capitalized during the restoration period on newly acquired properties. Interest expense was $22.7 million and $5.1 million for the years ended December 31, 2014 and 2013, respectively, an increase of $17.6 million. Interest expense for the year ended December 31, 2014 includes $6.2 million in amortization of deferred financing costs on our Credit Facility, the exchangeable senior notes and the Securitization Loan and $2.9 million in non-cash charges related to the amortization of the discount on the exchangeable senior notes and the Securitization Loan. The increase in interest expense is primarily due to higher average outstanding debt balances in 2014, versus 2013, and higher amortization of fees.
Interest expense was $5.1 million for the year ended December 31, 2013 and includes $1.7 million in amortization of deferred financing costs incurred in connection with our Credit Facility, and the Notes and $0.3 million in non-cash charges related to the amortization of the discount on the Notes.
Equity in Net Income (Loss) of Unconsolidated Ventures
Equity in net loss of unconsolidated ventures was approximately $(158,000) for the year ended December 31, 2014 and includes our proportionate share of income in Flatiron VI LLC, Siphon Draw LLC and Red Rock River LLC, all of which are Delaware limited liability companies that invest in residential mortgage loans. Equity in net income of unconsolidated ventures was approximately $60,000 for the period ended December 31, 2013.
Comparison of the Year Ended December 31, 2013 and the Period from March 30, 2012 (inception) to December 31, 2012
Rental Revenue
The increase in total revenue between the year ended December 31, 2013 and the period from March 30, 2012 (inception) through December 31, 2012 is primarily attributable to growth in our portfolio from 1,775 to 6,073 homes as of December 31, 2013 and 2012, respectively, and higher rental income generated from the leases of an additional 3,178 homes.
Management Services Revenue
Management services revenue was $0.4 million and $0.2 million for the year ended December 31, 2013 and the period from March 30, 2012 (inception) through December 31, 2012, respectively. The increase in management services revenue is attributable to the partial year in 2012 as we commenced operations in May 2012.
47
Interest and Other Revenue
The increase in interest and other revenue is primarily attributable to the growth in our mortgage portfolio which had an aggregate outstanding balance of $43.5 million as of December 31, 2013 compared to an aggregate outstanding balance of $13.0 million as of December 31, 2012.
Property Operating and Maintenance
Property operating and maintenance expenses were $8.5 million for the year ended December 31, 2013 and include all direct and indirect costs related to operating our residential properties, including management personnel, insurance, utilities, landscaping and general repairs and maintenance, other than real estate taxes and HOA fees, which are presented separately in our December 31, 2013 consolidated statements of operations. Property operating and maintenance expenses for the period from March 30, 2012 (inception) through December 31, 2012 were $0.9 million as we commenced operations in May 2012.
Real Estate Taxes
Real estate taxes were $6.1 million for the year ended December 31, 2013. Real estate taxes for the period from March 30, 2012 (inception) through December 31, 2012 were $0.6 million. The increase in real estate taxes is attributable to our portfolio growth and partial year in 2012 as we commenced operations in May 2012.
Homeowners’ Association Fees
HOA fees were $1.2 million for the year ended December 31, 2013. Like real estate taxes, these fees are determined upon acquisition and generally remain fixed based upon existing HOA agreements. HOA fees for the period from March 30, 2012 (inception) through December 31, 2012 were $0.3 million as we commenced operations in May 2012.
Acquisition
Acquisition expenses were $3.9 million for the year ended December 31, 2013. These expenses are primarily transaction costs incurred in connection with the acquisition of properties with existing leases, including but not limited to, payments for property inspections, closing costs, title insurance, transfer taxes, recording fees and broker commissions. The higher acquisition expenses in 2013 were primarily attributable to the larger volume of acquisitions with existing leases. Acquisition expenses for the period from March 30, 2012 (inception) through December 31, 2012 were $0.8 million as we commenced operations in May 2012.
Depreciation and Amortization
The increase in depreciation and amortization is primarily attributable to the growth in our real estate portfolio and a shorter comparative period in the prior year as we commenced operations in May 2012. The following table summarizes our depreciation and amortization expense (amounts in thousands):
Year Ended December 31, | Period from March 30, (inception) to December 31, | |||||||
2013 | 2012 | |||||||
Depreciation of real estate portfolio | $ | 16,781 | $ | 1,277 | ||||
Depreciation of other assets | 376 | 28 | ||||||
Amortization of in-place lease intangibles and other direct costs | 5,036 | 499 | ||||||
Total depreciation and amortization | $ | 22,193 | $ | 1,804 | ||||
General, Administrative and Other
General, administrative and other expense was $16.4 million for the year ended December 31, 2013. These expenses include payroll expense, professional fees, insurance expense and office expenses. During the year ended December 31, 2013, these expenses also include $5.3 million in non-cash stock compensation expense, $1.0 million in bonuses awarded to our Chief Executive Officer and our President and Chief Operating Officer upon registration of shares sold in our initial private offering and upon completion of our IPO, pursuant to their respective employment agreements and $0.4 million in severance charges. The $5.3 million in non-cash stock compensation expense includes $3.1 million in non-recurring, accelerated vesting expense incurred upon completion of our IPO in May 2013. General, administrative and other expense was $4.8 million for the period from March 30, 2012 (inception) through December 31, 2012. These expenses include payroll expenses, professional fees, insurance expense and office expenses, including $1.9 million in non-cash stock compensation expense. The increase in general, administrative and other expense was primarily attributable to additional headcount to support the growth and size of our portfolio operations as we commenced operations in May 2012.
48
Interest Expense
Interest expense was $5.1 million for the year ended December 31, 2013 and includes $1.7 million in amortization of deferred financing costs incurred in connection with our Credit Facility and the exchangeable senior notes and $0.3 million in non-cash charges related to the amortization of the discount on the Notes. There was no interest expense for the period from March 30, 2012 (inception) through December 31, 2012.
Equity in Net Income of Unconsolidated Ventures
Equity in net income of unconsolidated ventures was approximately $60,000 for the year ended December 31, 2013 and includes our proportionate share of income in Flatiron VI LLC, Siphon Draw LLC and Red Rock River LLC, all of which are Delaware limited liability companies that invest in residential mortgage loans. Equity in net income of unconsolidated ventures was approximately $83,000 for the period from March 30, 2012 (inception) through December 31, 2012.
Critical Accounting Policies and Estimates
Our discussion and analysis of our historical financial condition and results of operations are based upon our consolidated financial statements, which have been prepared in accordance with United States generally accepted accounting principles, or GAAP. The preparation and presentation of consolidated financial statements in conformity with GAAP requires management to make judgments, estimates and assumptions that may affect the amounts reported in the consolidated financial statements and accompanying notes. Actual results could differ materially from those estimates.
Investment in Real Estate
Property acquired not subject to an existing lease is accounted for as an asset acquisition, with the property recorded at the purchase price, including acquisition costs, allocated between land and building and improvements based upon their relative fair values at the date of acquisition. Property acquired with an existing lease is recorded as a business combination. For properties acquired through portfolio transactions, we determine whether the acquisition qualifies as a business combination based on the nature and status of the properties as of the acquisition date. A portfolio comprised of properties that are substantially leased at acquisition is treated as a business combination. A portfolio comprised of properties that are substantially vacant at acquisition is treated as an asset acquisition. To date, portfolio acquisitions were comprised of properties that were substantially leased at acquisition and accordingly were accounted for as business combinations. For property acquisitions accounted for as business combinations, the land, building and improvements and the existing lease are recorded at fair value at the date of acquisition, with acquisition costs expensed as incurred.
Fair value is determined under the guidance of Financial Accounting Standards Board, or FASB, Codification Topic 820, Fair Value Measurements, primarily based on unobservable market data inputs, which are categorized as Level 3 inputs. In making estimates of fair values for purposes of allocating purchase price, we utilize our market knowledge and published market data. Our real estate portfolio is depreciated using the straight-line method over the estimated useful lives of the respective assets, ranging from 5 to 27.5 years.
In-place lease intangibles associated with our homes managed by preferred operators are valued based on management’s estimates of lost rent and carrying costs while in-place lease intangibles associated with the acquisition of self-managed homes are valued based on management’s estimate of lost rent during the time it would take to locate a tenant and execute a lease if the property were vacant, considering current market conditions and costs to execute similar leases. In estimating lost rent and carrying costs, management considers market rents, real estate taxes, insurance, costs to execute similar leases (including leasing commissions) and other related costs. The value assigned to in-place leases is amortized on a straight-line basis as a component of depreciation and amortization expense over the remaining initial term of the related lease. The leases reflect market rental rates.
We incur costs to prepare our acquired properties to be rented. These costs (including direct internal costs) are capitalized and allocated to building costs. Costs related to the restoration or improvement of our properties (including direct internal costs) that improve and extend their useful lives are capitalized and depreciated over their estimated useful lives. Expenditures for ordinary repairs and maintenance are expensed as incurred.
Impairment of Long-Lived Assets
We evaluate our long-lived assets for impairment whenever events or changes in circumstances indicate that their carrying amount may not be recoverable. Significant indicators of impairment may include, but are not limited to, declines in home values, rental rates and occupancy percentages and significant changes in the economy. We make our assessment at the individual property level because it represents the lowest level of cash flows. If an impairment indicator exists, we compare the expected future undiscounted cash flows from the property against its net carrying amount. We prepare our future undiscounted cash flow analysis using estimates based on current rental rates, renewals and occupancy, operating expenses and inputs from our annual planning process and historical performance. When preparing these estimates, we consider each property’s historical results, current operating trends and current market conditions. These estimates may be impacted by variable factors, including inflation, expected rental rates,
49
the general health of the economy and market competition. If the sum of the estimated undiscounted cash flows is less than the net carrying amount of the property, we record an impairment loss for the difference between the estimated fair value of the individual property and the carrying amount of the property at that date. To determine the estimated fair value, we consider both recent comparable homes sales and the use of discounted projected future cash flows. The rates used to discount projected future cash flows reflect market discount rates. No impairments were recorded during the years ended December 31, 2014 or 2013 or the period from March 30, 2012 (inception) through December 31, 2012.
Revenue Recognition
We lease single-family residences we own and manage directly to tenants who occupy the properties under residential leases, generally, with terms of one year. We perform credit investigations on prospective tenants and typically obtain security deposits. Rental revenue, net of any concessions, is recognized on a straight-line basis over the term of the lease, which is not materially different than if it were recorded when due from tenants and recognized monthly as it is earned. Properties that are subject to longer-term operating arrangements with preferred operators are leased to the operator for a minimum of five to ten years with renewal options. These operators are responsible for taxes, insurance and maintenance of the properties under the terms of the operating arrangements. Under our preferred operator lease agreements, we earn base rental revenue paid monthly, with contractual minimum annual rent increases on each anniversary of the lease commencement date. We recognize rental revenue on a straight-line basis over the term of the lease. We also earn percentage rents on a quarterly basis equal to a fixed percentage of the gross revenue the preferred operator collects from its residential sub-tenants who occupy the homes. Percentage rental revenue is recorded when the gross revenue collected from the sub-tenants is known and the amount can be calculated.
Mortgage Financings
We hold mortgage financing receivables for investment. The receivables are carried at cost, net of related unamortized premiums or discounts, if any. The mortgage loans are secured by single-family homes.
Interest income on mortgage financings is recognized on the effective interest method applied on a loan-by-loan basis. Direct costs, if any, associated with funding loans are offset against any related fees received and the balance, along with any premium or discount, is deferred and amortized as an adjustment to interest income over the terms of the related loans using the effective interest method.
Acquisition Deposits
We have made earnest money deposits relating to offers to purchase rental properties. If the offers to purchase rental properties are not accepted, the deposits will be returned to us.
Rents and Other Receivables, Net
We maintain an allowance for doubtful accounts for estimated losses that may result from the inability of tenants, preferred operators or borrowers to make required rent or other payments. This allowance is estimated based on payment history and current credit status of our tenants, preferred operators and borrowers. If a tenant, preferred operator or borrower fails to make contractual payments beyond any allowance, we may recognize bad debt expense in future periods equal to the amount of unpaid rent, interest or principal and deferred rent. We generally do not require collateral or other security from our tenants, other than security deposits. Mortgage loans are secured by single-family homes. If estimates of collectibility differ from the cash received, then the timing and amount of our reported revenue could be impacted.
Deferred Leasing Costs and Lease Intangibles, Net
Deferred leasing commissions and other direct costs associated with leasing our properties (including direct internal costs) and in-place lease intangibles are capitalized and amortized on a straight-line basis over the terms of the related leases.
Deferred Financing Costs, Net
Financing costs are recorded at cost and consist of loan fees and other costs incurred in connection with obtaining debt. Amortization of deferred financing costs is computed using a method, which approximates the effective interest method over the remaining life of the debt, and is included in interest expense in the accompanying consolidated statements of operations.
Investments in Unconsolidated Ventures
Investments in ventures are generally accounted for under the equity method of accounting when we exercise significant influence over the venture but we do not serve as managing member or control the venture. Net income (loss) allocations are included in the investment balance along with the contributions made and distributions received over the life of the investment. In
50
October 2012, we invested approximately $5.5 million in Flat Iron VI LLC, a joint venture in which our equity interest is approximately 78% of the total amount invested. In December 2012, we invested approximately $4.7 million in Siphon Draw LLC, a joint venture in which our equity interest is approximately 80% of the total amount invested. In May 2013, we invested approximately $18.0 million in Red Rock River LLC, a joint-venture in which our equity interest is approximately 62% of the total amount invested. The joint-ventures used invested funds to purchase portfolios of residential mortgage loans.
Goodwill
Goodwill represents the estimated fair value of the real estate acquisition and management platform acquired from ARM (Note 9). Goodwill has an indefinite life and, accordingly, we do not amortize this asset but instead analyze it on an annual basis for impairment. Accounting Standards Codification, or ASC, 350, Intangibles - Goodwill and Other, permits us to assess qualitative factors to determine whether it is more likely than not that the fair value of the reporting unit is less than the carrying amount as a basis to determine whether the two-step impairment test is necessary. We also have the option to bypass the qualitative assessment for any reporting unit in any period and proceed directly to performing the first step of the two-step goodwill impairment test. The first step in the impairment test compares the fair value of the reporting unit with its carrying amount. If the carrying amount exceeds fair value, the second step is required to determine the amount of the impairment loss by comparing the implied fair value of the reporting unit goodwill with the carrying amount of that goodwill. Impairment charges, if any, are recognized in operating results. No impairments have been recorded for the years ended December 31, 2014 or 2013 or for the period from March 30, 2012 (inception) through December 31, 2012.
Other Assets, Net
Other assets include prepaid expenses, deposits, other receivables and other miscellaneous assets, including office property and equipment. Office property and equipment is recorded at cost and depreciated using the straight-line method over the estimated useful lives of the respective assets of three to seven years.
Income Taxes
We have elected to be taxed as a REIT under Sections 856 to 860 of the Code. We believe that we have operated in such a manner as to satisfy the requirements for qualification as a REIT. Accordingly, we will not be subject to federal income tax, provided that we qualify as a REIT and our distributions to our stockholders equal or exceed our REIT taxable income.
Qualification and taxation as a REIT depends upon our ability to meet the various qualification tests imposed under the Code related to the percentage of income that we earn from specified sources, the percentage of our assets that fall within specified categories, the diversity of our capital stock ownership, and the percentage of our earnings that we distribute. Accordingly, no assurance can be given that we will be organized or be able to operate in a manner so as to qualify or remain qualified as a REIT. If we fail to qualify as a REIT in any taxable year, we will be subject to federal and state income tax (including any applicable alternative minimum tax) on our taxable income at regular corporate tax rates, and we may be ineligible to qualify as a REIT for four subsequent tax years. Even if we qualify as a REIT, we may be subject to certain state and local income and franchise taxes, and our TRS will be subject to federal, state and local taxes on its income. Franchise taxes are included in general and administrative expenses on the accompanying consolidated statements of operations.
We have elected to treat our TRS as a taxable REIT subsidiary. Certain activities that we undertake will be conducted in our TRS, such as third-party property management and non-customary services for our tenants and holding assets that we cannot hold directly. Our TRS is subject to both federal and state income taxes, which are not material.
We determine whether any tax position taken or expected to be taken meet the "more-likely-than-not" threshold of being sustained by the applicable federal, state or local tax authority. As of December 31, 2014, 2013 and 2012, we concluded that there is no tax liability relating to uncertain income tax positions. Our policy is to recognize interest related to any underpayment of income taxes as interest expense and to recognize any penalties as operating expenses. There was no accrual for interest or penalties at December 31, 2014 or 2013 or for the period from March 30, 2012 (inception) through December 31, 2012.
We file federal, state and local income tax returns. Federal and state tax returns filed for 2013 and 2012 are still subject to examination. We believe that we have appropriate support for the income tax positions taken on our tax returns. We have net operating loss carryforwards for income tax purposes at December 31, 2014, 2013 and 2012. These losses would be available to reduce future taxable income or distribution requirements until they expire, which varies by jurisdiction but generally is not more than 20 years from the tax year in which they originate. Based on all available evidence, we cannot conclude it is more likely than not these attributes will be utilized in the future and thus a valuation allowance has been recorded against them.
51
Stock-Based Payments
We have awarded stock-based compensation to certain employees and members of our Board of Directors in the form of long-term incentive plan, or LTIP, units and restricted shares of our common stock (Note 7). We estimate the fair value of the awards and recognize this value over the requisite vesting period. For LTIP units, the fair value is based on the market value of our common stock on the date of grant and a discount for lack of marketability estimated by a third-party consultant.
Segment Reporting
ASC Topic 280, Segment Reporting, established standards for the manner in which public enterprises report information about operating segments. We view our operations as one reportable segment with activities related to leasing and operating single-family homes as rental properties.
Emerging Growth Company Status
We are an “emerging growth company,” as defined in the JOBS Act, and we are eligible to take advantage of certain exemptions from various reporting requirements that are applicable to other public companies that are not “emerging growth companies.” We currently expect to take advantage of some or all of the reduced regulatory and reporting requirements that will be available to us so long as we qualify as an “emerging growth company,” except that we have irrevocably elected not to take advantage of the extension of time to comply with new or revised financial accounting standards available under Section 102(b) of the JOBS Act.
Recent Accounting Pronouncements
See Note 2 to the December 31, 2014 consolidated financial statements included in this report for discussion of recently-issued accounting pronouncements.
Liquidity and Capital Resources
Liquidity is a measure of our ability to meet potential cash requirements, maintain our assets, fund our operations and make distributions to our stockholders and other general business needs. Our liquidity, to a certain extent, is subject to general economic, financial, competitive and other factors that are beyond our control. Our near-term liquidity requirements consist primarily of purchasing our target assets, restoring and leasing properties and funding our operations.
Our long-term liquidity needs consist primarily of funds necessary to pay for the acquisition, restoration and maintenance of properties; HOA fees; real estate taxes; non-recurring capital expenditures; interest and principal payments on incurred indebtedness; payment of quarterly distributions to our stockholders to the extent declared by our Board of Directors; and general and administrative expenses. We expect to incur between 5% and 15% of the total purchase price of vacant homes acquired on restorations in order to prepare the acquired home for rental activities. The nature of our business, our growth plans and the requirement that we distribute at least 90% of our REIT taxable income, determined without regard to the dividends paid deduction and excluding any net capital gain, to our stockholders each year, may cause us to have substantial liquidity needs over the long-term, although we have not had any taxable income to date. We will seek to satisfy our long-term liquidity needs through cash flow from operations, long-term secured and unsecured indebtedness, the issuance of debt and equity securities, including OP units, property dispositions and joint venture transactions. We have financed our operations and acquisitions to date through the issuance of equity securities, the Securitization Loan, the Notes and borrowings under the Credit Facility. We expect to meet our operating liquidity requirements generally through cash on hand and cash provided by operations (as we lease acquired single-family homes). We anticipate that cash on hand, cash provided by operations and borrowings under the Credit Facility will be sufficient to meet our liquidity requirements for at least the next 12 months. Our assets are illiquid by their nature. Thus, a timely liquidation of assets might not be a viable source of short-term liquidity should a cash flow shortfall arise that causes a need for additional liquidity. It could be necessary to source liquidity from other financing alternatives should any such scenario arise.
Our liquidity and capital resources as of December 31, 2014 consisted of cash and cash equivalents of $21.3 million.
On August 26, 2014, we completed a securitization transaction which involved the issuance and sale in a private offering of six classes of single-family rental pass-through certificates that represent beneficial ownership interests in a loan secured by a portfolio of 2,876 single-family homes transferred to an indirect subsidiary of the Company from our portfolio of single-family homes. Certain of the certificates were sold at a discount of $1.7 million in the aggregate, resulting in gross proceeds from the offering of approximately $340.6 million. The gross proceeds were distributed to our Operating Partnership, and were used primarily to repay a portion of our outstanding Credit Facility.
As of December 31, 2014, $311 million was outstanding under the Credit Facility, with remaining availability of $152.8 million. In the future, we expect to finance our operations, in part, with borrowings under the Credit Facility and with various other types of indebtedness. We may raise additional capital in the future through the sale of shares of our capital stock.
52
To date, we have not declared any distributions. To qualify as a REIT for federal income tax purposes, we are required to distribute annually at least 90% of our REIT taxable income, without regard to the deduction for dividends paid and excluding net capital gains, and to pay tax at regular corporate rates to the extent that we annually distribute less than 100% of our net taxable income. Subject to the requirements of the MGCL we intend to pay quarterly dividends to our stockholders, if and to the extent authorized by our Board of Directors.
Operating Activities
Cash from operating activities is primarily dependent upon the number of owned properties, occupancy level of our portfolio, the rental rates specified in our leases, the collectability of rent, the interest rates specified in our portfolio of private mortgage financings and the level of our operating expenses and general and administrative costs. Cash provided by operating activities for the year ended December 31, 2014 increased $6.8 million to $14.0 million, compared to cash provided by operating activities for the year ended December 31, 2013 of $7.2 million. Net income for the year ended December 31, 2014, adjusted for depreciation and amortization, amortization of stock-based compensation, amortization of deferred financing costs, accretion of discount on the Notes, accretion of the discount on the Securitization Loan, and bad debt expense, was $24.3 million, an increase of $18.2 million compared to the year ended December 31, 2013. The increase is primarily attributable to the increase in size of our real estate portfolio and aggregate number of homes leased.
Cash provided by operating activities for the year ended December 31, 2013 increased $10.0 million to $7.2 million, compared to cash used in operating activities for the period March 30, 2012 (inception) to December 31, 2012 of $2.8 million. Net income for the year ended December 31, 2013, adjusted for depreciation and amortization, amortization of stock-based compensation, amortization of deferred financing costs and bad debt expense of $5.8 million, increased by $8.2 million compared to the period March 30, 2012 (inception) to December 31, 2012. The increase is primarily attributable to our increased portfolio size as we commenced operations in May 2012 and acquired our first properties in June 2012.
Investing Activities
Cash used in investing activities for the year ended December 31, 2014 was $486.8 million and was primarily the result of property acquisitions and renovations on newly acquired properties offset by repayments of mortgage financings. We utilized $455.9 million for property acquisitions, including the purchase price and the value of any in-place leases, $52.8 million in capital improvements, of which $44.6 million was related to initial renovations on newly acquired properties and $8.2 million was related to capital improvements made to properties that had been previously occupied. The average purchase price for newly acquired properties was approximately $160,000 for acquisitions that occurred in the year ended December 31, 2014.
We invested $13.6 million in mortgage financings, offset by $36.0 million in repayments of mortgage financings in 2014.
Cash used in investing activities for the year ended December 31, 2013 was $625.7 million and was primarily the result of property acquisitions, renovations on newly acquired properties and additional investments in mortgage financings and unconsolidated joint ventures. We utilized $553.4 million for property acquisitions, including the purchase price and the value of any in-place leases, and $25.2 million in capital improvements, of which $22.1 million was related to initial renovations on newly acquired properties and $3.1 million was related to capital improvements made to properties that had been previously occupied. The average purchase price for newly acquired properties was approximately $129,200 for acquisitions that occurred in the year ended December 31, 2013.
We invested $66.6 million in mortgage financings, offset by $36.1 million in repayments of mortgage financings in 2013.
Cash used in investing activities for the period March 30, 2012 (inception) to December 31, 2012 was $242.5 million, primarily due to property acquisitions and investments in mortgage financings and unconsolidated ventures.
Financing Activities
Cash provided by financing activities for the year ended December 31, 2014 was $469.8 million and was primarily attributable to proceeds of $340.6 million from the issuance of the Securitization Loan and net borrowings of $142.0 million under the Credit Facility to fund acquisition activities, offset by $12.7 million paid in deferred financing costs.
Cash provided by financing activities for the year ended December 31, 2013 was $541.1 million and was primarily attributable to Credit Facility net borrowings of $169.0 million, proceeds of $288.5 million from the sale of shares of our common stock in our IPO, completed in May 2013, and private placement in January 2013 and proceeds of $115.0 million from the sale of the Notes offset by $22.6 million in common stock issuance transaction costs related to our IPO, deferred financing costs paid of $5.0 million related to the Original Credit Facility and the Credit Facility and offering costs paid of $3.8 million related to the Notes.
We have elected to be taxed as a REIT for federal income tax purposes. As a REIT, under federal income tax law we are required to distribute annually at least 90% of our REIT taxable income. Subject to the requirements of MGCL, we intend to pay quarterly dividends to our stockholders, if and to the extent authorized by our Board of Directors, which in the aggregate will approximately equal our REIT taxable income in the relevant year. As of December 31, 2014, no dividends have been declared.
53
Cash provided by financing activities for the period March 30, 2012 (inception) to December 31, 2012 of $347.0 million was attributable to proceeds of $371.2 million from the sale of shares of our common stock in the May 2012 initial private offering offset by $24.2 million in offering transaction costs.
Off-Balance Sheet Arrangements
We have no obligations, assets or liabilities which would be considered off-balance sheet arrangements. We have not participated in transactions that create relationships with unconsolidated entities or financial partnerships, often referred to as variable interest entities, which would have been established for the purpose of facilitating off-balance sheet arrangements.
Contractual Obligations
The following table provides information with respect to our commitments as of December 31, 2014, including any guaranteed or minimum commitments under contractual obligations (amounts in thousands).
Payment due by period | ||||||||||||||||||||
Total | Less than 1 Year (2015) | 1-3 years (2016-2017) | 3-5 years (2018-2019) | More than 5 years (after 2019) | ||||||||||||||||
Debt obligations(1) | $ | 768,241 | $ | — | $ | 311,000 | $ | 457,241 | $ | — | ||||||||||
Interest payment obligations(2) | 51,356 | 11,986 | 22,972 | 16,398 | — | |||||||||||||||
Operating lease obligations (3) | 3,309 | 832 | 1,638 | 839 | — | |||||||||||||||
Property acquisition obligations(4) | 14,247 | 14,247 | — | — | — | |||||||||||||||
$ | 837,153 | $ | 27,065 | $ | 335,610 | $ | 474,478 | $ | — | |||||||||||
______________
(1) | Represents aggregate principal amounts outstanding under the Credit Facility, the Exchangeable Senior Notes and the Securitization Loan. The Notes and Securitization Loan are recorded on the consolidated balance sheet net of discount of $12.8 million and $1.6 million, respectively, as of December 31, 2014 (Note 4). The Securitization Loan matures September 2016, with three 12-month extension options. We assume we will exercise the Securitization Loan options to the fully extended maturity. In January 2015, we exercised the one year extension on the credit facility. |
(2) | Interest payment obligations were calculated using interest rates applicable as of December 31, 2014. |
(3) | Includes operating leases for office space in Scottsdale and Peoria, Arizona, Atlanta, Georgia, Northbrook, Illinois and Dallas Texas. |
(4) | Represents purchase offers on single-family rental homes that were accepted by the sellers but not closed as of December 31, 2014. Acquisition deposits were paid through December 31, 2014 in connection with these rental home purchase commitments. There is no assurance that we will close on the properties we have under contract. |
Funds From Operations
The following is a reconciliation of net income (loss) (which we believe is the most comparable GAAP measure) to funds from operations, or FFO. Also presented is information regarding the weighted-average number of shares of our common stock outstanding used for the basic and diluted computation per share (amounts in thousands, expect share and per-share amounts):
Year Ended December 31, | Period from March 30, (inception) to December 31, | |||||||||||
2014 | 2013 | 2012 | ||||||||||
Net loss | $ | (37,633 | ) | $ | (25,351 | ) | $ | (6,238 | ) | |||
Add: Depreciation and amortization of real estate assets | 46,393 | 21,817 | 1,776 | |||||||||
Less: Gain on sale of real estate | (111 | ) | — | — | ||||||||
FFO | $ | 8,649 | $ | (3,534 | ) | $ | (4,462 | ) | ||||
FFO attributable to common stockholders (1) | $ | 8,499 | $ | (3,483 | ) | $ | (4,392 | ) | ||||
FFO per share of common stock, basic and diluted | $ | 0.26 | $ | (0.13 | ) | $ | (0.38 | ) | ||||
Weighted-average number of shares of common stock outstanding: | ||||||||||||
Basic | 32,143,934 | 27,130,348 | 11,536,193 | |||||||||
Diluted (2) | 32,759,072 | 27,130,348 | 11,536,193 | |||||||||
______________
(1) | Based on a weighted-average interest in our Operating Partnership of approximately 98.26% and 98.55% for the years ended December 31, 2014 and 2013, respectively, and 98.42% for the period from March 30, 2012 (inception) through December 31, 2012. |
(2) | Assumes the issuance of potentially issuable shares unless the result would be anti-dilutive. |
54
FFO is a widely recognized measure of REIT performance. We calculate FFO as defined by the National Association of Real Estate Investment Trusts, or NAREIT. FFO represents net income (loss) (as computed in accordance with GAAP), excluding gains from disposition of property (but including impairments and provisions for losses on property held for sale), plus real estate-related depreciation and amortization (including capitalized leasing costs).
Management uses FFO as a supplemental performance measure because, in excluding real estate-related depreciation and amortization and gains from property dispositions, it accounts for trends in occupancy rates, rental rates and operating costs. We believe that, as a widely recognized measure of the performance of REITs, FFO will be used by investors as a basis to compare our operating performance with that of other REITs.
However, because FFO excludes depreciation and amortization and captures neither the changes in the value of our properties that result from use or market conditions nor the level of capital expenditures and leasing commissions necessary to maintain the operating performance of our properties, all of which have real economic effects and could materially impact our results of operations, the utility of FFO as a measure of our performance is limited. Other Equity REITs may not calculate FFO in accordance with the NAREIT definition and, accordingly, our FFO may not be comparable to that of other REITs. As a result, FFO should be considered only as a supplement to net income (loss) as a measure of our performance. FFO should not be used as a measure of our liquidity, nor is it indicative of funds available to fund our cash needs, including our ability to pay dividends or make distributions. FFO also should not be used as a supplement to or substitute for net income (loss) or net cash flows from operating activities (as computed in accordance with GAAP).
Item 7A. | Quantitative and Qualitative Disclosures About Market Risk. |
Market Risk
Our future income, cash flows and fair values relevant to financial instruments are dependent on prevalent market interest rates. Interest rates are highly sensitive to several factors, including governmental monetary policies, domestic and global economic and political conditions and other factors which are beyond our control. We may incur additional variable rate debt in the future, including additional amounts that we may borrow under our Credit Facility. In addition, decreases in interest rates may lead to additional competition for the acquisition of single-family homes and other real estate due to a reduction in attractive alternative income-producing investments. Increased competition for the acquisition of single-family homes may lead to future acquisitions being more costly and result in lower yields on single-family homes we have targeted for acquisition. In such circumstances, if we are not able to offset the decrease in yields by obtaining lower interest costs on our borrowings, our results of operations will be adversely affected. Significant increases in interest rates may also have an adverse impact on our earnings if we are unable to acquire single-family homes with rental rates high enough to offset the increase in interest rates on our borrowings.
Market risk refers to the risk of loss from adverse changes in market prices and interest rates. We may use derivative financial instruments to manage, or hedge, interest rate risks related to any borrowings we may have. We expect to enter into such contracts only with major financial institutions based on their credit rating and other factors.
Interest Rate Risk
We have interest rate risk with respect to our debt. The fixed rate debt consists of the Notes. Our variable rate debt consists of our Credit Facility and the Securitization Loan. Changes in interest rates have different impacts on the fixed and variable portions of our debt portfolio. A change in interest rates on the fixed portion of the debt portfolio impacts the fair value of the instrument, but has no impact on interest expense or cash flow. A change in interest rates on the variable portion of the debt portfolio impacts the interest incurred and cash flows, but does not generally impact the fair value of the instrument. The fair value of the Notes is also impacted by changes in the market price of our common stock.
As of December 31, 2014, $311.0 million was outstanding and $152.8 million was available under our Credit Facility. Amounts borrowed on our Credit Facility bear interest at variable rates based, at the Company's option, on LIBOR plus a spread ranging from 2.50% to 3.25% or a base rate plus a spread ranging from 1.50% to 2.25%, with each spread based on a ratio of total indebtedness to total asset value (each as defined in the credit agreement that governs our Credit Facility) ranging from less than or equal to 45% to greater than 55%. If interest rates on our outstanding balance of $311.0 million under our Credit Facility were to increase or decrease by 50 basis points, our interest expense would increase or decrease by approximately $1.6 million, respectively.
As of December 31, 2014 the aggregate principal outstanding balance of our Securitization Loan was $342.2 million. Borrowings under our Securitization Loan bear interest at a weighted-average interest rate of 2.26%. We entered into an interest rate cap agreement as a designated cash flow hedge for the variable rate Securitization Loan with a LIBOR-based strike rate equal to 3.12% for the initial two year term. Therefore, a change in the 1-month LIBOR of 50 basis points would increase or decrease our interest expense by $1.7 million, respectively.
55
The following table presents the principal amounts, weighted-average interest rates and maturities of our fixed and variable rate debt by year as of December 31, 2014 (amounts in thousands).
2015 | 2016 | 2017 | 2018 | 2019 | Thereafter | Total | ||||||||||||||||||||||||
Liabilities: | ||||||||||||||||||||||||||||||
Fixed rate debt | $ | — | $ | — | $ | — | $ | 115,000 | $ | — | $ | — | $ | 115,000 | ||||||||||||||||
Average interest rate | — | % | — | % | — | % | 3.25 | % | — | % | — | % | 3.25 | % | ||||||||||||||||
Variable rate debt | $ | — | $ | 311,000 | $ | — | $ | — | $ | 342,241 | $ | — | $ | 653,241 | ||||||||||||||||
Average interest rate | — | % | 3.01 | % | — | % | — | % | 2.26 | % | — | % | 2.62 | % | ||||||||||||||||
Total | — | 311,000 | — | 115,000 | 342,241 | — | 768,241 | |||||||||||||||||||||||
The table reflects aggregate principal indebtedness outstanding as of December 31, 2014 and does not reflect indebtedness, if any, incurred after that date. The Notes and Securitization Loan are recorded on the consolidated balance sheet net of discount of $12.8 million and $1.6 million, respectively, as of December 31, 2014 (Note 4). The Securitization Loan matures September 2016, with three 12-month extension options. We assume we will exercise the Securitization Loan options to the fully extended maturity. In January 2015, we exercised the one year extension on the Credit Facility. For information regarding the fair value of our debt, see Note 8 to our consolidated financial statements in Part II, Item 8 of this Form 10-K.
As of December 31, 2014, we did not have any market risk sensitive instruments.
Equity Price Risk
We have $115.0 million aggregate principal amount of exchangeable senior notes that are exchangeable into cash, shares of our common stock or a combination of cash and shares of our common stock. If investors were to decide to exchange their notes, our future earnings would benefit from a reduction in interest expense and our common stock outstanding would increase if we elect to issue shares of our common stock in the exchange.
Further, the trading price of our common stock has been and is likely to continue to be highly volatile and could be subject to wide fluctuations. Such fluctuations could impact our decision or ability to utilize the equity markets as a potential source of our funding needs in the future.
56
Item 8. | Financial Statements and Supplementary Data. |
INDEX TO CONSOLIDATED FINANCIAL STATEMENTS
57
Report of Independent Registered Public Accounting Firm
The Board of Directors and Stockholders of
American Residential Properties, Inc.
We have audited the accompanying consolidated balance sheets of American Residential Properties, Inc. as of December 31, 2014 and 2013, and the related consolidated statements of operations, comprehensive loss, equity, and cash flows for the years ended December 31, 2014 and 2013 and the period from March 30, 2012 (inception) to December 31, 2012. Our audits also included the financial statement schedules listed in the Index at Item 15(a). These financial statements and schedules are the responsibility of the Company's management. Our responsibility is to express an opinion on these financial statements and schedules based on our audits.
We conducted our audits in accordance with the standards of the Public Company Accounting Oversight Board (United States). Those standards require that we plan and perform the audit to obtain reasonable assurance about whether the financial statements are free of material misstatement. We were not engaged to perform an audit of the Company's internal control over financial reporting. Our audits included consideration of internal control over financial reporting as a basis for designing audit procedures that are appropriate in the circumstances, but not for the purpose of expressing an opinion on the effectiveness of the Company's internal control over financial reporting. Accordingly, we express no such opinion. An audit also includes examining, on a test basis, evidence supporting the amounts and disclosures in the financial statements, assessing the accounting principles used and significant estimates made by management, and evaluating the overall financial statement presentation. We believe that our audits provide a reasonable basis for our opinion.
In our opinion, the financial statements referred to above present fairly, in all material respects, the consolidated financial position of American Residential Properties, Inc. at December 31, 2014 and 2013, and the consolidated results of its operations and its cash flows for the years ended December 31, 2014 and 2013 and the period from March 30, 2012 (inception) to December 31, 2012, in conformity with U.S. generally accepted accounting principles. Also, in our opinion, the related financial statement schedules, when considered in relation to the basic financial statements taken as a whole, present fairly, in all material respects, the information set forth therein.
/s/ Ernst & Young LLP
Phoenix, Arizona
March 16, 2015
58
AMERICAN RESIDENTIAL PROPERTIES, INC.
CONSOLIDATED BALANCE SHEETS
(amounts in thousands, except share amounts)
December 31, | ||||||||
2014 | 2013 | |||||||
Assets | ||||||||
Investment in real estate: | ||||||||
Land | $ | 249,151 | $ | 158,795 | ||||
Building and improvements | 1,042,954 | 627,881 | ||||||
Furniture, fixtures and equipment | 9,508 | 6,930 | ||||||
1,301,613 | 793,606 | |||||||
Less: accumulated depreciation | (58,010 | ) | (18,058 | ) | ||||
Investment in real estate, net | 1,243,603 | 775,548 | ||||||
Mortgage financings | 21,097 | 43,512 | ||||||
Cash and cash equivalents | 21,270 | 24,294 | ||||||
Restricted cash | 11,473 | — | ||||||
Acquisition deposits | 2,561 | 282 | ||||||
Rents and other receivables, net | 4,583 | 2,949 | ||||||
Deferred leasing costs and lease intangibles, net | 3,391 | 2,454 | ||||||
Deferred financing costs, net | 13,037 | 6,558 | ||||||
Investment in unconsolidated ventures | 25,691 | 26,611 | ||||||
Goodwill | 3,500 | 3,500 | ||||||
Other, net | 10,567 | 8,494 | ||||||
Total assets | $ | 1,360,773 | $ | 894,202 | ||||
Liabilities and Equity | ||||||||
Liabilities: | ||||||||
Revolving credit facility | $ | 311,000 | $ | 169,000 | ||||
Exchangeable senior notes, net | 102,188 | 99,377 | ||||||
Securitization loan, net | 340,675 | — | ||||||
Accounts payable and accrued expenses | 23,507 | 12,862 | ||||||
Security deposits | 7,919 | 3,995 | ||||||
Prepaid rent | 2,919 | 1,549 | ||||||
Total liabilities | 788,208 | 286,783 | ||||||
Equity: | ||||||||
American Residential Properties, Inc. stockholders’ equity: | ||||||||
Preferred stock, $0.01 par value, 100,000,000 shares authorized; no shares issued and outstanding at December 31, 2014 and 2013 | — | — | ||||||
Common stock $0.01 par value, 500,000,000 shares authorized; 32,195,280 and 32,171,102 shares issued and outstanding at December 31, 2014 and 2013, respectively | 322 | 322 | ||||||
Additional paid-in capital | 628,662 | 628,210 | ||||||
Accumulated other comprehensive loss | (96 | ) | — | |||||
Accumulated deficit | (68,101 | ) | (31,122 | ) | ||||
Total American Residential Properties, Inc. stockholders’ equity | 560,787 | 597,410 | ||||||
Non-controlling interests | 11,778 | 10,009 | ||||||
Total equity | 572,565 | 607,419 | ||||||
Total liabilities and equity | $ | 1,360,773 | $ | 894,202 | ||||
The accompanying notes are an integral part of these consolidated financial statements.
59
AMERICAN RESIDENTIAL PROPERTIES, INC.
CONSOLIDATED STATEMENTS OF OPERATIONS
(amounts in thousands, except share and per-share amounts)
Year Ended December 31, | Period from March 30, (inception) to December 31, | ||||||||||||
2014 | 2013 | 2012 | |||||||||||
Revenue: | |||||||||||||
Self-managed rental revenue | $ | 76,757 | $ | 26,110 | $ | 1,746 | |||||||
Preferred operator rental revenue | 5,126 | 6,244 | 449 | ||||||||||
Management services (related party) | 393 | 442 | 238 | ||||||||||
Interest and other | 4,588 | 5,164 | 497 | ||||||||||
Total revenue | 86,864 | 37,960 | 2,930 | ||||||||||
Expenses: | |||||||||||||
Property operating and maintenance | 21,485 | 8,536 | 912 | ||||||||||
Real estate taxes | 14,787 | 6,095 | 608 | ||||||||||
Homeowners’ association fees | 2,145 | 1,170 | 330 | ||||||||||
Acquisition | 937 | 3,890 | 760 | ||||||||||
Depreciation and amortization | 47,298 | 22,193 | 1,804 | ||||||||||
General, administrative and other | 15,023 | 16,374 | 4,837 | ||||||||||
Interest | 22,664 | 5,113 | — | ||||||||||
Total expenses | 124,339 | 63,371 | 9,251 | ||||||||||
Loss from continuing operations before equity in net (loss) income of unconsolidated ventures | (37,475 | ) | (25,411 | ) | (6,321 | ) | |||||||
Equity in net (loss) income of unconsolidated ventures | (158 | ) | 60 | 83 | |||||||||
Net loss | (37,633 | ) | (25,351 | ) | (6,238 | ) | |||||||
Net loss attributable to non-controlling interests | 654 | 368 | 99 | ||||||||||
Net loss attributable to common stockholders | $ | (36,979 | ) | $ | (24,983 | ) | $ | (6,139 | ) | ||||
Basic and diluted loss per share: | |||||||||||||
Net loss per share attributable to common stockholders | $ | (1.15 | ) | $ | (0.92 | ) | $ | (0.53 | ) | ||||
Weighted-average number of shares of common stock outstanding | 32,143,934 | 27,130,348 | 11,536,193 | ||||||||||
The accompanying notes are an integral part of these consolidated financial statements.
60
AMERICAN RESIDENTIAL PROPERTIES, INC.
CONSOLIDATED STATEMENTS OF COMPREHENSIVE LOSS
(amounts in thousands)
Year Ended December 31, | Period from March 30, (inception to December 31, | ||||||||||
2014 | 2013 | 2012 | |||||||||
Net loss | $ | (37,633 | ) | $ | (25,351 | ) | $ | (6,238 | ) | ||
Other comprehensive loss: | |||||||||||
Change in unrealized loss on interest rate cap | (96 | ) | — | — | |||||||
Comprehensive loss | (37,729 | ) | (25,351 | ) | (6,238 | ) | |||||
Comprehensive loss attributable to non-controlling interests | 654 | 368 | 99 | ||||||||
Comprehensive loss attributable to common stockholders | $ | (37,075 | ) | $ | (24,983 | ) | $ | (6,139 | ) | ||
The accompanying notes are an integral part of these consolidated financial statements.
61
AMERICAN RESIDENTIAL PROPERTIES, INC.
CONSOLIDATED STATEMENTS OF EQUITY
(amounts in thousands, except share amounts)
Number of Shares Common Stock | Common Stock | Preferred Stock | Additional Paid-In Capital | Accumulated Other Comprehensive Loss | Accumulated Deficit | Non- Controlling Interests | Total Equity | ||||||||||||||||||||||||
Balance, March 30, 2012 (inception) | — | $ | — | $ | — | $ | — | $ | — | $ | — | $ | — | $ | — | ||||||||||||||||
Issuance of common stock | 18,387,257 | 184 | — | 346,851 | — | — | — | 347,035 | |||||||||||||||||||||||
Issuance of non-controlling interests | — | — | — | — | — | — | 3,500 | 3,500 | |||||||||||||||||||||||
Net loss | — | — | — | — | — | (6,139 | ) | (99 | ) | (6,238 | ) | ||||||||||||||||||||
Other comprehensive loss | — | — | — | — | — | — | — | — | |||||||||||||||||||||||
Stock-based compensation | — | — | — | — | — | — | 1,934 | 1,934 | |||||||||||||||||||||||
Balance, December 31, 2012 | 18,387,257 | 184 | — | 346,851 | — | (6,139 | ) | 5,335 | 346,231 | ||||||||||||||||||||||
Issuance of common stock | 13,737,600 | 137 | — | 265,756 | — | — | — | 265,893 | |||||||||||||||||||||||
Issuance of exchangeable notes | — | — | — | 15,360 | — | — | — | 15,360 | |||||||||||||||||||||||
Net loss | — | — | — | — | — | (24,983 | ) | (368 | ) | (25,351 | ) | ||||||||||||||||||||
Other comprehensive loss | — | — | — | — | — | — | — | — | |||||||||||||||||||||||
Stock-based compensation | 46,245 | 1 | — | 243 | — | — | 5,042 | 5,286 | |||||||||||||||||||||||
Balance, December 31, 2013 | 32,171,102 | 322 | — | 628,210 | — | (31,122 | ) | 10,009 | 607,419 | ||||||||||||||||||||||
Issuance of common stock | 32,736 | — | — | 164 | — | — | (164 | ) | — | ||||||||||||||||||||||
Repurchase of common stock | (8,558 | ) | — | — | (114 | ) | — | — | — | (114 | ) | ||||||||||||||||||||
Net loss | — | — | — | — | — | (36,979 | ) | (654 | ) | (37,633 | ) | ||||||||||||||||||||
Other comprehensive loss | — | — | — | — | (96 | ) | — | — | (96 | ) | |||||||||||||||||||||
Stock-based compensation | — | — | — | 402 | — | — | 2,587 | 2,989 | |||||||||||||||||||||||
Balance, December 31, 2014 | 32,195,280 | $ | 322 | $ | — | $ | 628,662 | $ | (96 | ) | $ | (68,101 | ) | $ | 11,778 | $ | 572,565 | ||||||||||||||
The accompanying notes are an integral part of these consolidated financial statements.
62
AMERICAN RESIDENTIAL PROPERTIES, INC.
CONSOLIDATED STATEMENTS OF CASH FLOWS
(amounts in thousands)
Year Ended December 31, | Period from March 30, (inception) to December 31, | |||||||||||
2014 | 2013 | 2012 | ||||||||||
Operating activities | ||||||||||||
Net loss | $ | (37,633 | ) | $ | (25,351 | ) | $ | (6,238 | ) | |||
Adjustments to reconcile net loss to net cash provided by (used in) operating activities: | ||||||||||||
Depreciation and amortization | 47,298 | 22,193 | 1,804 | |||||||||
Amortization of stock-based compensation | 2,989 | 5,286 | 1,934 | |||||||||
Amortization of deferred financing costs | 6,173 | 1,728 | — | |||||||||
Accretion of discount on senior exchangeable notes | 2,811 | 266 | — | |||||||||
Accretion of discount on securitization loan | 116 | — | — | |||||||||
Bad debt expense | 2,514 | 1,908 | 49 | |||||||||
Straight line rental revenue | (303 | ) | (666 | ) | (46 | ) | ||||||
Equity in net loss (income) of unconsolidated ventures | 158 | (60 | ) | (83 | ) | |||||||
Net (gain) on dispositions of real estate and other assets | (111 | ) | — | — | ||||||||
Distributions from unconsolidated ventures | — | 60 | 83 | |||||||||
Changes in operating assets and liabilities: | ||||||||||||
Restricted cash | (11,473 | ) | — | — | ||||||||
Rent and other receivables, net | (3,845 | ) | (2,462 | ) | (1,734 | ) | ||||||
Due from related party | — | — | — | |||||||||
Deferred leasing costs and lease intangibles, net | (6,898 | ) | (2,337 | ) | (178 | ) | ||||||
Other assets, net | (3,074 | ) | (8,015 | ) | (927 | ) | ||||||
Accounts payable, accrued expenses and other liabilities | 15,293 | 14,629 | 2,564 | |||||||||
Net cash provided by (used in) operating activities | 14,015 | 7,179 | (2,772 | ) | ||||||||
Investing activities: | ||||||||||||
Improvements of real estate | (52,755 | ) | (25,195 | ) | (2,819 | ) | ||||||
Property acquisitions, including acquired in-place leases | (455,934 | ) | (553,434 | ) | (216,417 | ) | ||||||
Proceeds from the sale of real estate | 959 | — | — | |||||||||
Investment in mortgage financings | (13,554 | ) | (66,621 | ) | (14,410 | ) | ||||||
Repayments from mortgage financings | 35,969 | 36,134 | 1,385 | |||||||||
Contributions to unconsolidated ventures | — | (18,000 | ) | (10,156 | ) | |||||||
Distributions from unconsolidated ventures | 762 | 1,449 | 96 | |||||||||
Increase in acquisition deposits | (2,279 | ) | (65 | ) | (217 | ) | ||||||
Net cash used in investing activities | (486,832 | ) | (625,732 | ) | (242,538 | ) | ||||||
Financing activities: | ||||||||||||
Borrowings under revolving credit facility | 470,000 | 378,000 | — | |||||||||
Repayments of revolving credit facility | (328,000 | ) | (209,000 | ) | — | |||||||
Proceeds from issuance of securitization loan | 340,559 | — | — | |||||||||
Proceeds from issuance of exchangeable senior notes | — | 115,000 | — | |||||||||
Repurchase of common stock | (114 | ) | — | — | ||||||||
Proceeds from issuance of common stock | — | 288,471 | 371,222 | |||||||||
Common stock issuance transaction costs | — | (22,578 | ) | (24,187 | ) | |||||||
Deferred financing costs | (12,652 | ) | (8,771 | ) | — | |||||||
Net cash provided by financing activities | 469,793 | 541,122 | 347,035 | |||||||||
Net (decrease) increase in cash and cash equivalents | (3,024 | ) | (77,431 | ) | 101,725 | |||||||
Cash and cash equivalents - beginning of period | 24,294 | 101,725 | — | |||||||||
Cash and cash equivalents - end of period | $ | 21,270 | $ | 24,294 | $ | 101,725 | ||||||
Supplemental schedule of noncash investing and financing activities | ||||||||||||
Accounts payable and accrued expenses for additions to investments in real estate | $ | 1,860 | $ | 1,215 | $ | 634 | ||||||
Cash paid for interest, net of amount capitalized | $ | 12,950 | $ | 2,390 | $ | — | ||||||
Acquisition of management company business in exchange for operating partnership units | $ | — | $ | — | $ | 3,500 | ||||||
The accompanying notes are an integral part of these consolidated financial statements.
63
AMERICAN RESIDENTIAL PROPERTIES, INC.
NOTES TO THE CONSOLIDATED FINANCIAL STATEMENTS
December 31, 2014
1. | Company’s Organization and Operations |
As used in these consolidated financial statements and related notes, the terms “American Residential Properties, Inc.,” the “Company,” “us,” “we” and “our” refer to American Residential Properties, Inc. We are an internally managed real estate company organized as a real estate investment trust, or REIT, that acquires, owns and manages single-family homes as rental properties. We own all of our assets and conduct substantially all of our operations through (i) American Residential Properties OP, L.P., a Delaware limited partnership, or our Operating Partnership, in which we have a 98.2% interest as of December 31, 2014 and for which, through our wholly owned subsidiary, American Residential GP, LLC, we serve as sole general partner, and (ii) American Residential Properties TRS, LLC, or our TRS, which is our taxable REIT subsidiary. We have elected to be taxed as a REIT for federal income tax purposes. As a REIT, we will generally not be subject to federal income taxes to the extent that we currently distribute all of our taxable income to our stockholders and meet other specific requirements.
We were incorporated in Maryland in March 2012 and completed our initial private offering of our common stock in May 2012, raising net proceeds of approximately $208.7 million. In December 2012 and January 2013, we raised an additional approximately $139.1 million of net proceeds from a follow-on private offering of our common stock and a private placement of our common stock. We contributed the net proceeds from these offerings and the sale of shares to our founders at incorporation to our Operating Partnership in exchange for an aggregate of 18,424,857 units of limited partnership interest in our OP units.
We completed our initial public offering, or our IPO, in May 2013, in which we issued and sold 13,700,000 shares of our common stock at a public offering price of $21.00 per share, and we received approximately $265.1 million of net proceeds, after deducting the underwriting discounts and commissions, structuring fee and other offering expenses payable by us.
As of December 31, 2014, we own 8,893 properties in Arizona, California, Colorado, Florida, Georgia, Illinois, Indiana, Nevada, North Carolina, Ohio, South Carolina, Tennessee and Texas.
The Company’s December 31, 2014 consolidated financial statements and results of operations include a comparison to the period from March 30, 2012 (inception) through December 31, 2012 and to the year ended December 31, 2013 . We were formed on March 30, 2012 (inception) and had no operating activity before May 11, 2012. We consider May 11, 2012, the closing date of our initial private offering and of our acquisition of the ARM assets, to be the date on which we first commenced investment activities.
2. | Summary of Significant Accounting Policies |
Basis of Accounting and Principles of Consolidation
The accompanying consolidated financial statements include the accounts of American Residential Properties, Inc., our Operating Partnership and the wholly owned subsidiaries of our Operating Partnership. All majority-owned subsidiaries are consolidated and included in our consolidated financial statements. All intercompany balances and transactions have been eliminated in consolidation.
The consolidated financial statements have been prepared in accordance with accounting principles generally accepted in the United States, or GAAP.
Use of Estimates
The preparation of consolidated financial statements in conformity with GAAP requires management to make judgments, estimates and assumptions that may affect the amounts reported in the consolidated financial statements and accompanying notes. Actual results could differ materially from those estimates.
Investment in Real Estate
Property acquired not subject to an existing lease is accounted for as an asset acquisition, with the property recorded at the purchase price, including acquisition costs, and allocated between land and building and improvements based upon their relative fair values at the date of acquisition. Property acquired with an existing lease is recorded as a business combination. For properties acquired through portfolio transactions, we determine whether the acquisition qualifies as a business combination based on the nature and status of the properties as of the acquisition date. A portfolio comprised of properties that are substantially leased at acquisition is treated as a business combination. A portfolio comprised of properties that are substantially vacant at acquisition is treated as an asset acquisition. For property acquisitions accounted for as business combinations, the land, building and improvements and the existing lease are recorded at fair value at the date of acquisition, with acquisition costs expensed as incurred.
64
Fair value is determined under the guidance of ASC Topic 820, Fair Value Measurements, primarily based on unobservable market data inputs, which are categorized as Level 3 inputs. In making estimates of fair values for purposes of allocating purchase price, we utilize our market knowledge and published market data. Our real estate portfolio is depreciated using the straight-line method over the estimated useful lives of the respective assets, ranging from 5 to 27.5 years.
We have acquired portfolios of leased properties from established local operators, or preferred operator, that retain day-to-day management responsibilities pursuant to a longer-term lease. In these arrangements, the preferred operator is responsible for all property-related expenses and we receive payments from the preferred operator that escalate over the term of the lease. In-place lease intangibles associated with homes managed by preferred operators are valued based on management’s estimates of lost rent and carrying costs. In-place lease intangibles associated with the acquisition of self-managed homes are valued based on management’s estimate of lost rent during the time it would take to locate a tenant and execute a lease if the property were vacant, considering current market conditions and costs to execute similar leases. In estimating lost rent and carrying costs, management considers market rents, real estate taxes, insurance, costs to execute similar leases (including leasing commissions) and other related costs. The value assigned to in-place leases is amortized on a straight-line basis as a component of depreciation and amortization expense over the remaining initial term of the related lease. The leases reflect market rental rates.
We incur costs to prepare our acquired properties to be rented. These costs (including direct internal costs) are capitalized and allocated to building costs. Costs related to the restoration or improvement of our properties (including direct internal costs) that improve and extend their useful lives are capitalized and depreciated over their estimated useful lives. Expenditures for ordinary repairs and maintenance are expensed as incurred.
Impairment of Long-Lived Assets
We evaluate our long-lived assets for impairment whenever events or changes in circumstances indicate that their carrying amount may not be recoverable. Significant indicators of impairment may include, but are not limited to, declines in home values, rental rates and occupancy percentages and significant changes in the economy. We make our assessment at the individual property level because it represents the lowest level of cash flows. If an impairment indicator exists, we compare the expected future undiscounted cash flows from the property against its net carrying amount. We prepare our future undiscounted cash flow analysis using estimates based on current rental rates, renewals and occupancy, operating expenses and inputs from our annual planning process and historical performance. When preparing these estimates, we consider each property’s historical results, current operating trends and current market conditions. These estimates may be impacted by variable factors, including inflation, expected rental rates, the general health of the economy and market competition. If the sum of the estimated undiscounted cash flows is less than the net carrying amount of the property, we record an impairment loss for the difference between the estimated fair value of the individual property and the carrying amount of the property at that date. To determine the estimated fair value, we consider both recent comparable homes sales and the use of discounted projected future cash flows. The rates used to discount projected future cash flows reflect market discount rates. No impairments were recorded during the years ended December 31, 2014 or 2013 or for the period from March 30 (inception) to December 31, 2012, respectively.
Revenue Recognition
We lease single-family residences we own and manage directly to tenants who occupy the properties under operating leases, generally, with terms of one year. We perform credit investigations on prospective tenants and obtain security deposits. Rental revenue, net of any concessions, is recognized on a straight-line basis over the term of the lease, which is not materially different than if it were recorded when due from tenants and recognized monthly as it is earned. Properties that are subject to longer-term operating arrangements with preferred operators are leased to the operator for a minimum of five to ten years with renewal options. These operators are responsible for taxes, insurance and maintenance of the properties under the terms of the operating arrangements. Under our preferred operator lease agreements, we earn base rental revenue paid monthly, with contractual minimum annual rent increases on each anniversary of the lease commencement date. We recognize rental revenue on a straight-line basis over the term of the lease. We also earn percentage rents on a quarterly basis equal to a fixed percentage of the gross revenue the preferred operator collects from its residential sub-tenants who occupy the homes. Percentage rental revenue is recorded when the gross revenue collected from the sub-tenants is known and the amount can be calculated.
Mortgage Financings
We hold mortgage financing receivables for investment. The receivables are carried at cost, net of related unamortized premiums or discounts, if any. The mortgage loans are secured by single-family homes.
Interest income on mortgage financings is recognized on the effective interest method applied on a loan-by-loan basis. Direct costs, if any, associated with funding loans are offset against any related fees received and the balance, along with any premium or discount, is deferred and amortized as an adjustment to interest income over the terms of the related loans using the effective interest method.
65
Mortgage loans as of December 31, 2014 and 2013 include approximately $21.0 million and $42.1 million of short-term loans with weighted-average interest rates of approximately 11.9% and 11.8%, and weighted-average remaining terms of approximately 100 and 106 days, respectively, and approximately $0.1 million and $1.4 million in long-term loans with weighted-average interest rates of approximately 8.0% and 8.0% and weighted-average remaining terms of approximately 28 and 29 years, respectively.
Cash and Cash Equivalents
Cash and cash equivalents are held in depository accounts with financial institutions that are members of the Federal Deposit Insurance Corporation, or the FDIC. Cash balances with institutions may be in excess of federally insured limits or may be invested in time deposits that are not insured by the institution or the FDIC or any other government agency. We have not realized any losses in such cash investments and we believe that these investments are not exposed to any significant credit risk. Cash equivalents consist of highly liquid investments with original maturities of three months or less when acquired. Such investments are stated at cost, which approximates fair value.
Restricted Cash
Restricted cash primarily consists of funds that are restricted as to withdrawal or use under the terms of certain contractual agreements, which include payments of real estate taxes, insurance, interest, management fees and tenant security deposits.
Acquisition Deposits
We have made earnest money deposits relating to offers to purchase rental properties. If the offers to purchase rental properties are not accepted, the deposits will be returned to us.
Rents and Other Receivables, Net
We maintain an allowance for doubtful accounts for estimated losses that may result from the inability of tenants, preferred operators or borrowers to make required rent or other payments. This allowance is estimated based on payment history and current credit status. If a tenant, preferred operator or borrower fails to make contractual payments beyond any allowance, we may recognize bad debt expense in future periods equal to the amount of unpaid rent, interest or principal and deferred rent. We generally do not require collateral or other security from our tenants, other than security deposits. Mortgage loans are secured by single-family homes. If estimates of collectability differ from the cash received, then the timing and amount of our reported revenue could be impacted.
Our rents and other receivables for self-managed and preferred operator homes are presented net of an allowance for doubtful accounts in our consolidated balance sheet of approximately $0.5 million and $0.6 million, respectively, for a total of $1.1 million as of December 31, 2014. As of December 31, 2013, the allowances for doubtful accounts for our rents and other receivables for self-managed and preferred operator homes were $0.6 million and $1.1 million, respectively, for a total of $1.7 million.
We recorded a provision for doubtful accounts for self-managed homes and preferred operator homes of approximately $1.6 million and $0.9 million, respectively, for a total of approximately $2.5 million for the year ended December 31, 2014. We recorded a provision for doubtful accounts for self-managed and preferred operator homes of approximately $1.1 million and $0.8 million, respectively, for a total of $1.9 million for the year ended December 31, 2013. We recorded a provision for doubtful accounts for self-managed and preferred operator homes of approximately $37,000 and $12,000, respectively, for the period from March 30, 2012 (inception) through December 31, 2012.
Deferred Leasing Costs and Lease Intangibles, Net
Deferred leasing commissions and other direct costs associated with leasing our properties (including direct internal costs) and in-place lease intangibles are capitalized and amortized on a straight-line basis over the terms of the related leases.
Deferred Financing Costs, Net
Financing costs are recorded at cost and consist of loan fees and other costs incurred in connection with obtaining debt. Amortization of deferred financing costs is computed using a method, which approximates the effective interest method over the remaining life of the debt, and is included in interest expense in the accompanying consolidated statements of operations.
Investments in Unconsolidated Ventures
Investments in ventures are generally accounted for under the equity method of accounting when we exercise significant influence over the venture but we do not serve as managing member or control the venture. Net income (loss) allocations are included in the investment balance along with the contributions made and distributions received over the life of the investment. In October 2012, we invested approximately $5.5 million in Flat Iron VI LLC, a joint venture in which our equity interest is approximately 78% of the total amount invested. In December 2012, we invested approximately $4.7 million in Siphon Draw LLC, a
66
joint venture in which our equity interest is approximately 80% of the total amount invested. In May 2013, we invested approximately $18.0 million in Red Rock River LLC, a joint-venture in which our equity interest is approximately 62% of the total amount invested. Each of these joint ventures used invested funds to purchase portfolios of residential mortgage loans.
Goodwill
Goodwill represents the estimated fair value of the real estate acquisition and management platform acquired from ARM (Note 9). Goodwill has an indefinite life and, accordingly, we do not amortize this asset but instead analyze it on an annual basis for impairment. ASC 350, Intangibles - Goodwill and Other, permits us to assess qualitative factors to determine whether it is more likely than not that the fair value of the reporting unit is less than the carrying amount as a basis to determine whether the two-step impairment test is necessary. We also have the option to bypass the qualitative assessment for any reporting unit in any period and proceed directly to performing the first step of the two-step goodwill impairment test. The first step in the impairment test compares the fair value of the reporting unit with its carrying amount. If the carrying amount exceeds fair value, the second step is required to determine the amount of the impairment loss by comparing the implied fair value of the reporting unit goodwill with the carrying amount of that goodwill. Impairment charges, if any, are recognized in operating results. No impairments have been recorded for the years ended December 31, 2014, 2013 or for the period from March 30, 2012 (inception) through December 31, 2012.
Other Assets, Net
Other assets include prepaid expenses, deposits, other receivables and other miscellaneous assets, including office property and equipment. Office property and equipment is recorded at cost and depreciated using the straight-line method over the estimated useful lives of the respective assets of three to seven years.
Income Taxes
We have elected to be taxed as a REIT under Sections 856 to 860 of the Code. We believe that we have operated in such a manner as to satisfy the requirements for qualification as a REIT. Accordingly, we will not be subject to federal income tax, provided that we qualify as a REIT and our distributions to our stockholders equal or exceed our REIT taxable income.
Qualification and taxation as a REIT depends upon our ability to meet the various qualification tests imposed under the Code related to the percentage of income that we earn from specified sources, the percentage of our assets that fall within specified categories, the diversity of our capital stock ownership, and the percentage of our earnings that we distribute. Accordingly, no assurance can be given that we will be organized or be able to operate in a manner so as to qualify or remain qualified as a REIT. If we fail to qualify as a REIT in any taxable year, we will be subject to federal and state income tax (including any applicable alternative minimum tax) on our taxable income at regular corporate tax rates, and we may be ineligible to qualify as a REIT for four subsequent tax years. Even if we qualify as a REIT, we may be subject to certain state and local income and franchise taxes, and our TRS will be subject to federal, state and local taxes on its income. Franchise taxes are included in general and administrative expenses in the accompanying consolidated statements of operations.
We have elected to treat our TRS as a taxable REIT subsidiary. Certain activities that we undertake will be conducted in our TRS, such as third-party property management and non-customary services for our tenants and holding assets that we cannot hold directly. Our TRS is subject to both federal and state income taxes.
We determine whether any tax position taken or expected to be taken meet the "more-likely-than-not" threshold of being sustained by the applicable federal, state or local tax authority. As of December 31, 2014 and 2013, we concluded that there is no tax liability relating to uncertain income tax positions. Our policy is to recognize interest related to any underpayment of income taxes as interest expense and to recognize any penalties as operating expenses. There was no accrual for interest or penalties at December 31, 2014 or 2013.
We file federal, state and local income tax returns. Federal and state tax returns filed for 2013 and 2012 are still subject to examination. We believe that we have appropriate support for the income tax positions taken on our tax returns. We have net operating loss carryforwards for income tax purposes at December 31, 2014 and 2013. These losses would be available to reduce future taxable income or distribution requirements until they expire, which varies by jurisdiction but generally is not more than 20 years from the tax year in which they originate. Based on all available evidence, we cannot conclude it is more likely than not these attributes will be utilized in the future and thus a valuation allowance has been recorded against them.
Stock-Based Payments
We have awarded stock-based compensation to certain employees and members of our Board of Directors in the form of long-term incentive plan, or LTIP, units and restricted shares of our common stock (Note 7). We estimate the fair value of the awards and recognize this value over the requisite vesting period. For LTIP units, the fair value is based on the market value of our common stock on the date of grant and a discount for lack of marketability estimated by a third-party consultant.
67
Earnings (Loss) Per Share
Basic earnings (loss) per share, or EPS, is computed by dividing the net loss attributable to common stockholders by the weighted-average number of shares of common stock outstanding for the period. Diluted EPS is computed by dividing net loss attributable to common stockholders as adjusted for dilutive securities, by the weighted-average number of shares of common stock outstanding plus dilutive securities. Any anti-dilutive securities are excluded from the diluted per-share calculation. Potentially dilutive securities include unvested restricted shares of our common stock, OP units, vested and unvested LTIP units and exchangeable senior notes. We intend to satisfy our exchange obligation for the principal amount of the exchangeable senior notes to the exchanging note holders entirely in cash. As we intend to settle the principal amount of the exchangeable senior notes in cash, the "if-converted" method to include debt in diluted EPS is not applicable and the treasury stock method is being used and as our stock price is below the conversion price, there is no impact.
Segment Reporting
ASC Topic 280, Segment Reporting, established standards for the manner in which public enterprises report information about operating segments. We view our operations as one reportable segment with activities related to leasing and operating single-family homes as rental properties.
Recent Accounting Pronouncements
From time to time, new accounting pronouncements are issued by the FASB or the SEC. We adopt the new pronouncements as of the specified effective date. Unless otherwise discussed, these new accounting pronouncements include technical corrections to existing guidance or introduce new guidance related to specialized industries or entities and therefore we believe will have minimal, if any, impact on our financial position or results of operations upon adoption.
In April 2014, the FASB issued ASU No. 2014-08, Reporting Discontinued Operations and Disclosures of Disposals of Components of an Entity, which changes the criteria for determining which disposals are presented as discontinued operations and modifies related disclosure requirements. This standard is effective for fiscal years beginning after December 15, 2014 and for interim periods within those fiscal years with early adoption permitted. The Company has adopted the provisions of this ASU, effective January 1, 2014, with an immaterial impact, and anticipates that the majority of property sales will not be classified as discontinued operations.
In May 2014, the FASB issued ASU No. 2014-09, Revenue from Contracts with Customers, which requires an entity to recognize the amount of revenue to which it expects to be entitled for the transfer of promised goods or services to customers. The ASU will replace most existing revenue recognition guidance in GAAP when it becomes effective. The new standard is effective for the Company on January 1, 2017. Early application is not permitted. The standard permits the use of either the retrospective or cumulative effect transition method. The Company is evaluating the effect that ASU 2014-09 will have on its consolidated financial statements and related disclosures. The Company has not yet selected a transition method nor has it determined the effect of the standard on its financial statements.
In August 2014, the FASB issued ASU No 2014-15, Disclosure of Uncertainties about an Entity's Ability to Continue as a Going Concern, which requires management to perform interim and annual assessments on an entity's ability to continue as a going concern within one year of the date the financial statements are issued and provides guidance on determining when and how to disclose going concern uncertainties in the financial statements. Certain disclosures will be required if conditions give rise to substantial doubt about an entity's ability to continue as a going concern. This guidance is effective for the Company on January 1, 2017 and is not expected to have an impact on the Company's financial position, results of operations or cash flows.
3. | Lease Intangibles |
Our identifiable intangible assets as of December 31, 2014 and 2013 are summarized as follows (amounts in thousands):
December 31, | |||||||
2014 | 2013 | ||||||
Acquired in-place leases | $ | 327 | $ | 1,823 | |||
Less: accumulated amortization | (222 | ) | (1,039 | ) | |||
Intangible lease assets, net | $ | 105 | $ | 784 | |||
The impact of the amortization of acquired in-place leases on our depreciation and amortization expense is approximately $1.1 million, $4.2 million and $0.5 million for the years ended December 31, 2014 and 2013 and for the period March 30, 2012 (inception) through December 31, 2012, respectively.
68
Our estimate of future amortization of the acquired in-place lease intangible assets in our balance sheet at December 31, 2014 is as follows (amounts in thousands):
Amortization | |||
2015 | $ | 103 | |
2016 | 2 | ||
Total amortization | $ | 105 | |
4. | Debt |
The following table details the Company's debt as of December 31, 2014 and 2013 (in thousands):
December 31, | |||||||
2014 | 2013 | ||||||
Credit Facility | $ | 311,000 | $ | 169,000 | |||
Exchangeable senior notes | 115,000 | 115,000 | |||||
Securitization Loan | 342,241 | — | |||||
Total debt before unamortized discount | 768,241 | 284,000 | |||||
Less: Total unamortized discount on debt | (14,378 | ) | (15,623 | ) | |||
Total debt | $ | 753,863 | $ | 268,377 | |||
Senior Secured Revolving Credit Facility
In January 2013, we entered into a $150 million senior secured revolving credit facility, or the Original Credit Facility, with a syndicate of major national banks. In September 2013, we entered into an amended and restated $290 million senior secured revolving credit facility, or the Credit Facility, with a syndicate of major national banks, which amended and restated in its entirety the $150 million Original Credit Facility. In October 2013 and December 2013, we entered into joinder agreements further expanding the Credit Facility to $380 million. In June 2014, we exercised the accordion feature, increasing our borrowing capacity to $500 million and we also amended the Credit Facility to increase the size of the accordion feature to allow further increases of the borrowing capacity to an aggregate maximum of $750 million, subject to meeting certain criteria and obtaining additional commitments from the lenders. The amount available for us to borrow under the Credit Facility is subject to limitations governed by calculations based on the cost, value and debt yield supported by our properties that form the borrowing base of the Credit Facility. The credit agreement requires us to comply with various financial covenants as well as customary affirmative and negative covenants that restrict our ability to, among other things, incur debt and liens, make investments, dispose of properties and make distributions. The Credit Facility is secured by our ownership interest in American Residential Leasing Company, LLC, which is a wholly owned subsidiary of our Operating Partnership. The Credit Facility contains certain financial covenants, including a maximum leverage ratio, a minimum tangible net worth, a minimum fixed charge coverage ratio and a minimum liquidity. As of December 31, 2014, we were in compliance with all of the financial covenants of the Credit Facility.
The Credit Facility had a maturity date of January 2015 with an optional one-year extension. Effective January 18, 2015, the maturity date under the Credit Facility was extended to January 18, 2016. Borrowings under the Credit Facility bear interest, at our option, at either the one-month, two-month, three-month or six-month Eurodollar rate or the base rate, plus, in each case, a spread based on a ratio of total indebtedness to total asset value (each as defined in the credit agreement that governs the Credit Facility) ranging from less than or equal to 45% to greater than 55%. The Eurodollar rate for an interest period is the London Interbank Offered Rate, or LIBOR, for a term equivalent to such period plus a spread ranging from 2.50% to 3.25% (determined as described in the preceding sentence) and the base rate for any day is a fluctuating rate per annum equal to the highest of (a) the Federal Funds Rate plus 0.50%, (b) Bank of America's "prime rate" for such day and (c) the one-month Eurodollar rate plus 1.00% plus a spread ranging from 1.50% to 2.25% (determined as described in the preceding sentence). We are also required to pay a quarterly fee on the unused portion of the Credit Facility at a rate of between 0.35% and 0.45% per annum, based on the actual daily unused balance during a fiscal quarter. For the years ended December 31, 2014, and 2013 the Company incurred non-utilization fees of $0.7 million and $0.5 million, respectively.
Prior to the completion of our IPO on May 14, 2013, $109.0 million was outstanding under the Original Credit Facility. Proceeds from the IPO were utilized to repay the entire outstanding balance. In August 2014, proceeds from the closing of the Securitization transaction were used to pay down the balance of the Credit Facility. Following such repayment, the outstanding borrowings under the Credit Facility were approximately $146 million. As of December 31, 2014 and 2013, $311.0 million and $169.0 million was outstanding under the Credit Facility, respectively, bearing interest at a weighted-average rate of 3.0%, with remaining availability of $152.8 million at December 31, 2014. As of February 28, 2015, we borrowed an additional $32.0 million.
69
As of December 31, 2014 and 2013, we have incurred $6.7 million and $5.0 million, respectively, in financing costs in connection with the Credit Facility, which are included in deferred financing costs, net on the accompanying consolidated balance sheets. These costs are being amortized to interest expense over the remaining initial term of the Credit Facility. Accumulated amortization of these deferred financing costs was $6.4 million and $1.7 million for the years ended December 31, 2014 and 2013, respectively.
Exchangeable Senior Notes
In November 2013, we issued and sold $115.0 million aggregate principal amount of 3.25% Exchangeable Senior Notes due 2018 (the “Notes”). The Notes are senior unsecured obligations of the Operating Partnership and rank equally in right of payment with all other existing and future senior unsecured indebtedness of the Operating Partnership. Interest is payable in arrears on May 15 and November 15 of each year, beginning May 15, 2014, until the maturity date of November 15, 2018. The Operating Partnership’s obligations under the Notes are fully and unconditionally guaranteed by the Company. The Notes bear interest at a rate of 3.25% per annum and contain an exchange settlement feature, which provides that the Notes may, under certain circumstances, be exchangeable for cash, shares of our common stock or a combination of cash and shares of our common stock, at the option of the Operating Partnership, based on an initial exchange rate of 46.9423 shares of our common stock per $1,000 principal amount of Notes. At the initial exchange rate, the Notes are exchangeable for our common stock at an exchange price of approximately $21.30 per share of our common stock, representing an approximately 22.5% premium over the last reported sale price of our common stock on November 21, 2013, which was $17.39 per share.
Prior to the close of business on the business day immediately preceding August 15, 2018, the Notes will be exchangeable at the option of the holders only under the following circumstances: (1) during any calendar quarter beginning after December 31, 2013 (and only during such quarter) if the closing sale price per share of our common stock is more than 130% of the then-current exchange price for at least 20 trading days (whether or not consecutive) in the period of 30 consecutive trading days ending on the last trading day of the preceding calendar quarter; (2) during the five consecutive business-day period following any five consecutive trading-day period in which the trading price per $1,000 principal amount of Notes was less than 98% of the product of the closing sale price per share of our common stock multiplied by the then-current exchange rate; or (3) upon the occurrence of specified corporate transactions described in the Indenture. On or after August 15, 2018, the Notes will be exchangeable at any time prior to the close of business on the second business day immediately preceding the maturity date. Subject to its election to satisfy its exchange obligations entirely in shares of our common stock, upon exchange, the Operating Partnership will pay or deliver, as the case may be, to exchanging holders in respect of each $1,000 principal amount of notes being exchanged a settlement amount either solely in cash, solely in shares or in a combination of cash and shares of our common stock.
In connection with the issuance of the Notes, we recorded approximately $99.1 million within exchangeable senior notes on the accompanying consolidated balance sheet, based on the fair value of the instrument using a straight-debt rate of 6.5% at the time of issuance, and approximately $15.4 million in additional paid-in-capital, net of $0.5 million in financing costs, in the accompanying consolidated statements of equity. The difference between the $115.0 million face amount and the $99.1 million will be accreted over the five year period ended November 15, 2018. As of December 31, 2014 and 2013, the unaccreted discount was $12.8 million and $15.6 million, respectively. We incurred $3.8 million in financing costs, of which $2.6 million and $3.3 million are included in deferred financing costs, net on the accompanying consolidated balance sheets as of December 31, 2014 and 2013, to be amortized to interest expense over the term of the Notes. We amortized $0.7 million and $0.1 million of deferred financing costs for the years ended December 31, 2014 and 2013, respectively.
The following table details the debt and equity components recognized related to the 3.25% Notes (in thousands):
December 31, | |||||||
2014 | 2013 | ||||||
Principal amount | $ | 115,000 | $ | 115,000 | |||
Unamortized discount | (12,812 | ) | (15,623 | ) | |||
Net carrying amount | 102,188 | 99,377 | |||||
Additional paid in capital | 15,360 | 15,360 | |||||
Securitization Loan
In August 2014, the Company completed a securitization transaction resulting in $340.6 million in total gross proceeds before issuance costs of $10.9 million. The transaction involves the issuance and sale of single-family rental pass-through certificates that represent beneficial ownership interests in a loan, or the Securitization Loan, secured by 2,876 homes transferred to a newly formed entity, ARP 2014-1 Borrower, LLC (the "Borrower"), an indirect subsidiary and consolidating entity, from the Company's portfolio of single-family properties. The loan has an initial term of two years, with three successive 12-month extension options providing there are no events of default, resulting in a fully extended maturity date of September 9, 2019, and requires that we maintain certain
70
covenants, including, but not limited to, a minimum debt yield on the collateral pool of properties. The effective weighted average of the fixed-rate spreads is 2.11% plus 1-month LIBOR. As of December 31, 2014, the Company was in compliance with all covenants under the loan agreement. The net balance at December 31, 2014, was $340.7 million, which is net of unamortized discount of $1.6 million. Approximately $10.9 million in financing costs will be amortized over five years, which is included in deferred financing costs, net on the accompanying consolidated balance sheets. We amortized $0.8 million of deferred financing costs for the year ended December 31, 2014.
Derivative and Hedging Activities
As part of certain lender requirements in connection with the Securitization Loan, we entered into an interest rate cap agreement with an aggregate notional amount of $342.2 million and LIBOR-based strike rate equal to 3.12% for the initial two year term of the Securitization Loan to hedge against interest rate fluctuations. This interest rate cap agreement was formally designated as a cash flow hedge at inception and will be regularly assessed for effectiveness on an on-going basis. During the year ended December 31, 2014, our interest rate cap agreement was 100% effective as a cash flow hedge and, as a result, changes in fair value have been classified in accumulated other comprehensive loss. These amounts will subsequently be reclassified into earnings in the period which the hedged transaction affects earnings. The fair value of our interest rate cap agreement is estimated to be $0.1 million as of December 31, 2014 and has been included in other assets, net in the accompanying consolidated balance sheets. The interest rate cap is valued using Level 2 observable market-based inputs, including interest rate curves.
Maturities
Future scheduled debt principal payments as of December 31, 2014 are as follows (amounts in thousands):
Total Debt | |||
2015 | $ | — | |
2016 (1) | 311,000 | ||
2017 | — | ||
2018 | 115,000 | ||
2019 | 342,241 | ||
Thereafter | — | ||
Total debt | $ | 768,241 | |
______________
(1) | In January 2015, we exercised the one year extension on the Credit Facility. |
5. | Earnings (Loss) Per Share |
Basic net income or loss attributable to common stockholders is computed by dividing reported net income or loss attributable to common stockholders by the weighted-average number of common and contingently issuable shares outstanding during each period.
A reconciliation of our net loss per share is as follows (amounts in thousands, except share and per-share amounts):
Year Ended December 31, | March 30, 2012 (inception) to December 31, | ||||||||||
2014 | 2013 | 2012 | |||||||||
Net loss attributable to common stockholders | $ | (36,979 | ) | $ | (24,983 | ) | $ | (6,139 | ) | ||
Weighted-average number of shares of common stock outstanding: | |||||||||||
Basic and diluted | 32,143,934 | 27,130,348 | 11,536,193 | ||||||||
Net loss per share of common stock, basic and diluted | $ | (1.15 | ) | $ | (0.92 | ) | $ | (0.53 | ) | ||
For all periods presented, no potentially dilutive securities were included in computing loss per share of common stock as their effect would be anti-dilutive. Potentially dilutive securities excluded were OP units, vested LTIP units, unvested LTIP units and unvested restricted shares of common stock. The weighted-average numbers of shares of potentially dilutive securities were as follows:
71
Year Ended December 31, | March 30, 2012 (inception) to December 31, | |||||||
2014 | 2013 | 2012 | ||||||
OP and vested LTIP units | 569,166 | 400,055 | 185,490 | |||||
Unvested LTIP units | 518,715 | 353,512 | 471,219 | |||||
Unvested restricted stock | 44,097 | 28,204 | — | |||||
Potentially dilutive shares | 1,131,978 | 781,771 | 656,709 | |||||
6. | Stockholders’ Equity |
On May 14, 2013, we completed our IPO of 13,700,000 shares of our common stock at a public offering price of $21.00 per share, and we received approximately $265.1 million of net proceeds, after deducting the underwriting discounts and commissions, structuring fee and other offering expenses payable by us.
7. | Stock Compensation |
We award stock-based compensation to certain employees and members of our Board of Directors through the American Residential Properties, Inc. 2012 Equity Incentive Plan, or our 2012 Equity Incentive Plan. Under our 2012 Equity Incentive Plan, the Compensation Committee of our Board of Directors has the ability to grant nonqualified stock options, incentive stock options, restricted shares of our common stock, restricted stock units, dividend equivalents, stock appreciation rights and other awards to our officers, employees, directors and other persons providing services to our Operating Partnership and its subsidiaries. The number of shares of our common stock available for grant under our 2012 Equity Incentive Plan is subject to an aggregate limit of 1,500,000 shares. Our 2012 Equity Incentive Plan expires on May 11, 2022, except as to any grants which are then outstanding. As of December 31, 2014, there were 472,128 shares of our common stock available for grant under our 2012 Equity Incentive Plan.
We recorded stock-based compensation cost of approximately $3.0 million and $5.3 million as part of general, administrative and other expense in the consolidated statements of operations for the years ended December 31, 2014 and 2013, respectively. The stock-based compensation cost recorded during the period March 30, 2012 (inception) through December 31, 2012 was $1.9 million.
LTIP Units
Under our 2012 Equity Incentive Plan, we may grant LTIP units. LTIP units are a special class of partnership interests in our Operating Partnership with certain restrictions, which are convertible into OP units, subject to satisfying vesting and other conditions. LTIP unit holders are entitled to receive the same distributions as holders of our OP units (only if we pay such distributions) on the unvested portion of their LTIP units. The vesting of LTIP units is determined at the time of the grant and may be based on performance criteria. Any unvested LTIP units are forfeited, except in limited circumstances, as determined by the Compensation Committee of our Board of Directors, when the recipient is no longer employed by us or when a director leaves our Board of Directors for any reason. LTIP units may be subject to full or partial accelerated vesting under certain circumstances, as described in the applicable award agreement.
Service-Based LTIP Units
Service-based LTIP units are valued at fair value on the date of grant and compensation expense is recognized over the vesting period, which approximates a straight-line basis. These shares generally vest over three years based on continued service or employment. We valued the service-based LTIP units at a per-unit value equivalent to the per-share offering price of our common stock sold in our private and public offerings less a discount for lack of marketability estimated with the assistance of a third-party consultant for grants issued prior to our IPO. Subsequent to our IPO, we valued the service-based LTIP units at the per-share market close trading price of our common stock on the date of grant less a discount for lack of marketability estimated with the assistance of a third-party consultant.
The following table summarizes information about the service-based LTIP units outstanding as of December 31, 2014:
72
Total Vested Units | Total Unvested Units | Total Outstanding Units | Weighted-Average Grant Date Fair Value (Per Unit) | |||||||||
Balance at December 31, 2012 | 10,490 | 493,432 | 503,922 | $ | 17.00 | |||||||
Granted | — | 35,261 | 35,261 | $ | 16.72 | |||||||
Vested | 340,285 | (340,285 | ) | — | $ | 17.04 | ||||||
Converted | (834 | ) | — | (834 | ) | $ | 17.00 | |||||
Forfeited | — | (14,166 | ) | (14,166 | ) | $ | 17.00 | |||||
Balance, December 31, 2013 | 349,941 | 174,242 | 524,183 | $ | 16.98 | |||||||
Granted | — | 70,274 | 70,274 | $ | 15.63 | |||||||
Vested | 90,467 | (90,467 | ) | — | $ | 16.76 | ||||||
Converted | (17,967 | ) | — | (17,967 | ) | $ | 17.00 | |||||
Forfeited | — | (4,166 | ) | (4,166 | ) | $ | 17.00 | |||||
Balance, December 31, 2014 | 422,441 | 149,883 | 572,324 | $ | 16.67 | |||||||
Upon the completion of our IPO in May 2013, a total of 262,460 service-based LTIP units vested in accordance with the 2012 Equity Incentive Plan.
Total unrecognized compensation cost related to unvested service-based LTIP units was approximately $1.3 million as of December 31, 2014, and is expected to be recognized in general, administrative and other expense over a weighted-average period of approximately 1.4 years, subject to the stated vesting conditions.
Market-Based LTIP Units
In November 2013, we issued 338,094 LTIP units, of which up to 50% will vest based on the percentage increase of the Company’s total stockholder return, or TSR, beginning on May 14, 2013 (the date of the closing of our initial public offering), and up to 50% will vest based on the relative outperformance of our TSR as compared to the percentage change of the SNL US REIT Equity Index, or the Index, over the same period. The market-based LTIP awards were valued on the date of grant using a Monte Carlo simulation method. The aggregate grant date fair value of the market-based LTIP units was $1.9 million.
In June 2014, we issued 39,136 LTIP units, of which up to 100% will vest based on the percentage increase of the Company's TSR beginning on January 1, 2014. The market-based LTIP awards were valued on the date of grant using a Monte Carlo simulation method. The aggregate grant date fair value of the market-based LTIP units was $0.4 million.
The following table summarizes information about the market-based LTIP units outstanding as of December 31, 2014:
Total Vested Units | Total Unvested Units | Total Outstanding Units | Weighted-Average Grant Date Fair Value (Per Unit) | |||||||||
Balance, December 31, 2012 | — | — | — | $ | — | |||||||
Granted | — | 338,094 | 338,094 | $ | 5.58 | |||||||
Vested | — | — | — | $ | — | |||||||
Converted | — | — | — | $ | — | |||||||
Forfeited | — | — | — | $ | — | |||||||
Balance, December 31, 2013 | — | 338,094 | 338,094 | $ | 5.58 | |||||||
Granted | — | 39,136 | 39,136 | $ | 10.12 | |||||||
Vested | — | — | — | $ | — | |||||||
Converted | — | — | — | $ | — | |||||||
Forfeited | — | — | — | $ | — | |||||||
Balance, December 31, 2014 | — | 377,230 | 377,230 | $ | 6.05 | |||||||
Total unrecognized compensation cost related to unvested market-based LTIP units totaled approximately $1.3 million as of December 31, 2014, and is expected to be recognized in general, administrative and other expense over a weighted-average period of approximately 3.2 years, subject to stated vesting conditions.
Restricted Stock
Under our 2012 Equity Incentive Plan, we may grant restricted shares of our common stock. Restricted shares of our common stock are valued at the per-share market close trading price of our common stock on the date of the grant and
73
compensation expense is recognized over the vesting period, which approximates a straight-line basis. These shares generally vest over three years based on continued service or employment.
The following table summarizes information about the shares of restricted common stock outstanding as of December 31, 2014:
Number of Shares | Weighted-Average Grant Date Fair Value (Per Share) | |||||
Unvested at December 31, 2012 | — | $ | — | |||
Granted | 47,327 | $ | 21.00 | |||
Vested | (5,042 | ) | $ | 21.00 | ||
Forfeited | (1,916 | ) | $ | 21.00 | ||
Unvested at December 31, 2013 | 40,369 | $ | 21.00 | |||
Granted | 17,944 | $ | 17.98 | |||
Vested | (20,178 | ) | $ | 20.11 | ||
Forfeited | (3,838 | ) | $ | 19.33 | ||
Unvested at December 31, 2014 | 34,297 | $ | 20.14 | |||
Total unrecognized compensation cost related to unvested shares of restricted common stock totaled approximately $0.5 million as of December 31, 2014, and is expected to be recognized in general, administrative and other expense over a weighted-average period of approximately 1.5 years, subject to stated vesting conditions.
8. | Fair Value Measurements |
Fair value is defined as the price that would be received to sell an asset or paid to transfer a liability in an orderly transaction between market participants at the measurement date (an exit price). The three levels of fair value defined in ASC 820-10, Fair Value Measurements, are as follows:
• | Level 1—Valuations based on quoted market prices in active markets for identical assets or liabilities that the reporting entity has the ability to access. |
• | Level 2—Valuations based on quoted market prices for similar assets or liabilities, quoted market prices in markets that are not active, or other inputs that are observable or can be corroborated by observable data for substantially the full term of the assets or liabilities. |
• | Level 3—Valuations based on inputs that are supported by little or no market activity and that are significant to the fair value of the assets or liabilities, which are typically based on the reporting entity’s own assumptions. |
Companies are required to disclose the estimated fair values of all financial instruments, even if they are not carried at their fair value. The fair values of financial instruments are estimates based upon market conditions and perceived risks as of December 31, 2014 and 2013. These estimates require management’s judgment and may not be indicative of the future fair values of the assets and liabilities.
Our financial instruments include cash and cash equivalents, restricted cash, acquisition deposits, rents and other receivables and accounts payable and accrued expenses. We consider the carrying amounts of these instruments to approximate fair value because of their short-term nature.
Our mortgage financings, the Credit Facility, the Notes and the Securitization Loan are also financial instruments, and we estimated their fair value based on market quotes for comparable instruments or discounted cash flow analysis using estimates of the amount and timing of future cash flows, market rates and credit spreads. The estimated fair value of the Credit Facility using Level 2 assumptions approximate the carrying amounts. The estimated fair values of our mortgage financing receivables using Level 3 assumptions approximates the carrying amount. In 2014 we entered into an interest rate cap designated as a cash flow hedge to reduce our exposure to interest rate risk. See Note 4 for disclosures on the fair value of our interest rate cap.
74
The fair value of our Notes and the Securitization Loan using Level 2 assumptions is as follows (amounts in thousands):
December 31, 2014 | December 31, 2013 | |||||||||||||||
Fair Value | Carrying Value | Fair Value | Carrying Value | |||||||||||||
Exchangeable Senior Notes (1) | $ | 116,581 | $ | 102,188 | $ | 99,377 | $ | 99,377 | ||||||||
Securitization Loan (2) | $ | 340,675 | $ | 340,675 | $ | — | $ | — | ||||||||
(1) The carrying amount of the Exchangeable Senior Notes includes a discount of $12.8 million and $15.6 million at December 31, 2014 and 2013, respectively.
(2) The fair value of the Securitization Loan approximates carrying value and includes a discount of $1.6 million.
9. | Transactions With Related Parties |
In connection with the closing of our initial private offering on May 11, 2012, we acquired from ARM the proprietary, vertically integrated real estate acquisition and management platform that Mr. Schmitz and Ms. Hawkes developed in exchange for 175,000 OP units, valued at $3.5 million, representing a 1.5% limited partnership interest in our Operating Partnership, and approximately $85,000 in cash. The OP units were valued at $20.00 per unit, equivalent to the offering price per share of our common stock sold in our initial private offering.
Prior to February 2013, we earned management services fees from ARM pursuant to a cancellable sub-management agreement for the provision of real estate management services to ARM. These services allowed ARM to fulfill its obligations to ARP Phoenix Fund I, LP, or Phoenix Fund, pursuant to a management agreement between ARM and Phoenix Fund. The general partner of Phoenix Fund is ARP Phoenix Fund I GP, LLC, which is owned by Mr. Schmitz and Ms. Hawkes. These services included property restoration, leasing and property management and disposition services with respect to the properties owned by Phoenix Fund. Under the sub-management agreement, ARM was required to reimburse our TRS for the actual expenses incurred by our TRS to perform its obligations under the sub-management agreement, plus a fee of 1.0% of the gross rental revenue earned from Phoenix Fund with respect to the properties managed by ARM.
In February 2013, ARM, Phoenix Fund and our TRS terminated the property management and sub-management agreements for the provision of real estate management services to Phoenix Fund, and our TRS entered into a management agreement directly with Phoenix Fund, pursuant to which our TRS performs the same services to Phoenix Fund for a fee in an amount equal to 6.0% of the gross rental revenue received by Phoenix Fund with respect to the properties managed by our TRS.
We earned approximately $0.4 million and $0.4 million during the years ended December 31, 2014 and 2013, respectively, under the prior and current management agreements, which are included in management services (related party) in our consolidated statements of operations. Accounts receivable of approximately $20,000 and $43,000 due from Phoenix Fund are included in rents and other receivables, net in our consolidated balance sheets at December 31, 2014 and 2013, respectively.
Phoenix Fund purchased 150,000 shares of our common stock in our initial private offering.
10. | Non-Controlling Interests |
Non-controlling common units of our Operating Partnership relate to the interest in our Operating Partnership that is not owned by us and are presented as non-controlling interests in the equity section of our consolidated balance sheets.
Non-controlling common units of our Operating Partnership have essentially the same economic characteristics as shares of our common stock as they share equally in the net income or loss and distributions of our Operating Partnership. Our limited partners have the right to redeem all or part of their non-controlling common units of our Operating Partnership following the one-year anniversary of issuance. At the time of redemption, we have the right to determine whether to redeem the non-controlling common units of our Operating Partnership for cash, based upon the fair value of an equivalent number of shares of our common stock at the time of redemption, or exchange them for unregistered shares of our common stock on a one-for-one basis, subject to adjustment in the event of stock splits, stock dividends, issuance of stock rights, specified extraordinary distribution and similar events. In the event of a termination or liquidation of us and our Operating Partnership, it is expected that in most cases each common unit would be entitled to a liquidating distribution equal to the amount payable with respect to each share of our common stock. As of December 31, 2014, there were 597,441 outstanding non-controlling common units of our Operating Partnership, representing an approximate 1.8% ownership interest in our Operating Partnership. These units are comprised of 175,000 units issued in connection with our acquisition of the assets and management platform from ARM and 422,441 vested LTIP units. As of December 31, 2013, there were 524,941 outstanding non-controlling common units of our Operating Partnership, representing an approximate 1.6% ownership interest in our Operating Partnership. These units are comprised of 175,000 units issued in connection with our acquisition of the assets and management platform from ARM and 349,941 vested LTIP units.
75
Net income or loss attributable to non-controlling common units of our Operating Partnership is allocated based on their relative ownership percentage of the Operating Partnership during the period. The non-controlling ownership interest percentage is determined by dividing the number of non-controlling common units outstanding by the total of the shares of our common stock and non-controlling units outstanding at the balance sheet date. The issuance or redemption of additional shares of our common stock or common units results in changes to our limited partners’ ownership interest in our Operating Partnership, as well as our net assets. As a result, all equity-related transactions result in an allocation between stockholders’ equity and the non-controlling common units of our Operating Partnership in the consolidated balance sheet to account for any change in ownership percentage during the period. Our limited partners’ weighted-average share of our net loss was 1.7% and 1.5% for the years ended December 31, 2014 and 2013, respectively.
11. | Commitments and Contingencies |
Operating Leases
We enter into operating lease agreements to provide office space for our corporate and support offices. Approximate future minimum obligations under the operating leases as of December 31, 2014 are as follows (amounts in thousands):
Future Minimum Operating Lease Payments | |||
2015 | $ | 832 | |
2016 | 813 | ||
2017 | 825 | ||
2018 | 839 | ||
2019 | — | ||
Thereafter | — | ||
Total | $ | 3,309 | |
Rent expense was approximately $800,000, $516,000 and $81,000 for the years ended December 31, 2014 and 2013, and the period March 30, 2012 (inception) through December 31, 2012, respectively, and is included within property operating and maintenance and general, administrative and other expenses on our consolidated statements of operations.
Litigation
From time to time, we are subject to potential liability under various claims and legal actions arising in the ordinary course of business. Liabilities are established for legal claims when payments associated with the claims become probable and the costs can be reasonably estimated. The actual costs of resolving legal claims may be substantially higher or lower than the amounts established for those claims. Based on information currently available, management is not aware of any legal claims that would have a material effect on our consolidated financial statements and therefore no accrual is required as of December 31, 2014.
Accepted Purchase Offers
As of December 31, 2014, we have committed to purchase single-family homes for a total purchase price of approximately $14.2 million. These are offers to purchase rental properties that were accepted by the sellers but had not closed as of December 31, 2014. As of December 31, 2013, we had committed to purchase single-family homes for a total purchase price of approximately $24 million, which were offers to purchase rental properties that were accepted by the sellers but did not close until 2014.
Homeowners’ Association Fees
Certain of our properties are located in communities that are subject to homeowners’ association, or HOA, fees. These fees are generally billed monthly and are subject to annual fee adjustments. The fees cover the costs of maintaining common areas and are generally paid for by us. HOA fees were approximately $2.1 million, $1.2 million and $0.3 million for the years ended December 31, 2014, 2013, and the period March 30, 2012 (inception) through December 31, 2012, respectively.
Concentrations
As of December 31, 2014, approximately 57% of our properties were located in Texas, Arizona and Georgia. This concentration may expose us to greater economic risks than if we owned a more geographically dispersed portfolio.
Tenant Security Deposits
As of December 31, 2014, we had $7.9 million in tenant security deposits. These security deposits are refundable, net of any charges or fees, upon expiration of the underlying leases. As of December 31, 2013, we had $4.0 million in tenant security deposits.
76
12. | Rental Revenue |
Our properties are leased to tenants under operating leases with initial expiration dates ranging from 2015 to 2023. Our leases on self-managed properties are leased to residential tenants with a term of generally one year, where the tenant is responsible for the payment of the property utilities and we are responsible for the payment of the property taxes, insurance, homeowners' association fees and property operating and maintenance costs (including ordinary repairs and maintenance). Our longer-term operating leases with preferred operators have lease terms with a minimum of five to ten years with renewal options. The operators/lessees under these longer-term leases are responsible for all property-level operating expenses, including taxes, insurance and maintenance, and other similar expenses of the property. The future minimum rental revenue to be received from tenants or lessees as of December 31, 2014 is as follows (amounts in thousands):
Future Minimum Rental Revenue | |||
2015 | $ | 55,889 | |
2016 | 7,088 | ||
2017 | 5,945 | ||
2018 | 410 | ||
2019 | 418 | ||
Thereafter | 1,483 | ||
Total | $ | 71,233 | |
13. | Selected Quarterly Financial Information (Unaudited) |
The following table sets forth our unaudited consolidated quarterly financial information for 2014 and 2013. We believe that we have included all adjustments, consisting only of normal recurring adjustments necessary for a fair statement of our selected quarterly data.
The calculation of basic and diluted per share amounts for each quarter is based on the weighted average shares outstanding for that period; consequently, the sum of the quarters may not necessarily be equal to the full year basic and diluted net income per share. (amounts in thousands, except per-share amounts)
For the Quarter Ended | ||||||||||||||||||||||||||||||||
Dec. 31, 2014 | Sept. 30, 2014 | June 30, 2014 | Mar. 31, 2014 | Dec. 31, 2013 | Sept. 30, 2013 | June 30, 2013 | Mar. 31, 2013 | |||||||||||||||||||||||||
Total revenue | $ | 25,171 | $ | 23,485 | $ | 20,754 | $ | 17,454 | $ | 13,236 | $ | 11,069 | $ | 8,408 | $ | 5,247 | ||||||||||||||||
Net loss | (12,770 | ) | (9,327 | ) | (7,742 | ) | (7,794 | ) | (8,517 | ) | (4,588 | ) | (8,187 | ) | (4,059 | ) | ||||||||||||||||
Net loss attributable to common stockholders | (12,539 | ) | (9,162 | ) | (7,609 | ) | (7,669 | ) | (8,378 | ) | (4,515 | ) | (8,071 | ) | (4,019 | ) | ||||||||||||||||
Net loss per share attributable to common stockholders: | ||||||||||||||||||||||||||||||||
Basic and diluted (loss)/earnings per share | $ | (0.39 | ) | $ | (0.28 | ) | $ | (0.24 | ) | $ | (0.24 | ) | $ | (0.26 | ) | $ | (0.14 | ) | $ | (0.31 | ) | $ | (0.22 | ) | ||||||||
14. | Subsequent Events |
For the period from January 1, 2015 to February 28, 2015, we acquired 123 single-family homes for a total purchase price of approximately $21.7 million and have contracted to acquire 30 single-family homes for a total purchase price of approximately $5.5 million.
77
AMERICAN RESIDENTIAL PROPERTIES, INC. | ||||||||||||||||||||||||||||||||||||||||||
SCHEDULE III - REAL ESTATE AND ACCUMULATED DEPRECIATION | ||||||||||||||||||||||||||||||||||||||||||
As of December 31, 2014 | ||||||||||||||||||||||||||||||||||||||||||
(dollar amounts in thousands) | ||||||||||||||||||||||||||||||||||||||||||
Encumbrances | Initial Cost to Company(2) | Cost Capitalized Subsequent to Acquisition (Improvements) | Gross Amounts as of December 31, 2014 | |||||||||||||||||||||||||||||||||||||||
Metropolitan Statistical Area/Metro Division | State | Number of Homes | Number of Encumbered Homes | Encumbrances(1) | Land | Depreciable Property | Depreciable Property | Land | Depreciable Property | Total | Accumulated Depreciation(3) | Date of Acquisition | ||||||||||||||||||||||||||||||
Anderson | IN | 3 | — | $ | — | $ | 58 | $ | 284 | $ | 45 | $ | 58 | $ | 329 | $ | 387 | $ | 17 | 2013-2014 | ||||||||||||||||||||||
Atlanta-Sandy Springs-Marietta | GA | 1,062 | 56 | 6,214 | 29,742 | 114,360 | 10,786 | 29,742 | 125,146 | 154,888 | 3,484 | 2012-2014 | ||||||||||||||||||||||||||||||
Austin-Round Rock | TX | 19 | 16 | 1,981 | 576 | 2,353 | 242 | 576 | 2,595 | 3,171 | 171 | 2013 | ||||||||||||||||||||||||||||||
Bakersfield | CA | 5 | 2 | 238 | 155 | 442 | 50 | 155 | 492 | 647 | 50 | 2012 | ||||||||||||||||||||||||||||||
Cape Coral-Fort Myers | FL | 138 | — | — | 581 | 5,435 | 836 | 581 | 6,271 | 6,852 | 499 | 2012 | ||||||||||||||||||||||||||||||
Charleston-North Charleston | SC | 15 | — | — | 453 | 1,336 | 138 | 453 | 1,474 | 1,927 | 104 | 2013-2014 | ||||||||||||||||||||||||||||||
Charlotte-Gastonia-Concord | NC-SC | 376 | 127 | 14,376 | 12,152 | 45,348 | 2,763 | 12,152 | 48,111 | 60,263 | 1,779 | 2013-2014 | ||||||||||||||||||||||||||||||
Chicago-Naperville-Joliet | IL | 511 | — | — | 13,423 | 52,150 | — | 13,423 | 52,150 | 65,573 | 3,535 | 2012-2014 | ||||||||||||||||||||||||||||||
Cincinnati-Middletown | OH | 84 | — | — | 3,025 | 10,313 | 575 | 3,025 | 10,888 | 13,913 | 636 | 2013-2014 | ||||||||||||||||||||||||||||||
Corpus Christi | TX | 240 | 104 | 13,231 | 7,645 | 34,986 | 2,693 | 7,645 | 37,679 | 45,324 | 1,703 | 2013-2014 | ||||||||||||||||||||||||||||||
Dallas-Fort Worth-Arlington | TX | 1,093 | 456 | 53,555 | 32,910 | 133,781 | 12,231 | 32,910 | 146,012 | 178,922 | 6,635 | 2012-2014 | ||||||||||||||||||||||||||||||
Deltona-Daytona Beach-Ormond Beach | FL | 6 | — | — | 59 | 538 | 23 | 59 | 561 | 620 | 40 | 2013 | ||||||||||||||||||||||||||||||
Denver-Aurora | CO | 3 | — | — | 132 | 418 | 68 | 132 | 486 | 618 | 39 | 2013 | ||||||||||||||||||||||||||||||
Durham | NC | 11 | 4 | 441 | 347 | 1,179 | 75 | 347 | 1,254 | 1,601 | 43 | 2013-2014 | ||||||||||||||||||||||||||||||
GA Nonmetropolitan Area | GA | 14 | 2 | 239 | 368 | 1,832 | 176 | 368 | 2,008 | 2,376 | 50 | 2013-2014 | ||||||||||||||||||||||||||||||
Greensboro-High Point | NC | 19 | 13 | 1,107 | 430 | 1,317 | 84 | 430 | 1,401 | 1,831 | 106 | 2013 | ||||||||||||||||||||||||||||||
Houston-Sugar Land-Baytown | TX | 1,106 | 437 | 48,441 | 29,398 | 124,801 | 8,234 | 29,398 | 133,035 | 162,433 | 7,786 | 2013-2014 | ||||||||||||||||||||||||||||||
Indianapolis-Carmel | IN | 535 | — | — | 4,777 | 26,322 | 4,263 | 4,777 | 30,585 | 35,362 | 2,000 | 2013-2014 | ||||||||||||||||||||||||||||||
Jacksonville | FL | 9 | — | — | 153 | 1,011 | 133 | 153 | 1,144 | 1,297 | 82 | 2013-2014 | ||||||||||||||||||||||||||||||
Jacksonville | NC | 3 | — | — | 106 | 317 | 13 | 106 | 330 | 436 | 19 | 2013 | ||||||||||||||||||||||||||||||
Lakeland | FL | 89 | 11 | 1,088 | 2,049 | 9,885 | 1,037 | 2,049 | 10,922 | 12,971 | 346 | 2013-2014 | ||||||||||||||||||||||||||||||
Las Vegas-Paradise | NV | 68 | 45 | 4,818 | 1,348 | 5,246 | 859 | 1,348 | 6,105 | 7,453 | 688 | 2012-2013 | ||||||||||||||||||||||||||||||
Los Angeles-Long Beach-Santa Ana | CA | 24 | 16 | 1,852 | 923 | 2,422 | 435 | 923 | 2,857 | 3,780 | 319 | 2012 | ||||||||||||||||||||||||||||||
Modesto | CA | 51 | — | — | 1,299 | 3,601 | 1,262 | 1,299 | 4,863 | 6,162 | 689 | 2012 | ||||||||||||||||||||||||||||||
Nashville-Davidson-Murfreesboro-Franklin | TN | 644 | 173 | 20,078 | 22,771 | 79,196 | 7,432 | 22,771 | 86,628 | 109,399 | 2,936 | 2013-2014 | ||||||||||||||||||||||||||||||
NC Nonmetropolitan Area | NC | 24 | — | — | 455 | 1,425 | 102 | 455 | 1,527 | 1,982 | 107 | 2013-2014 | ||||||||||||||||||||||||||||||
Orlando-Kissimmee | FL | 346 | 30 | 3,096 | 9,201 | 44,008 | 4,607 | 9,201 | 48,615 | 57,816 | 1,344 | 2013-2014 | ||||||||||||||||||||||||||||||
78
AMERICAN RESIDENTIAL PROPERTIES, INC. | ||||||||||||||||||||||||||||||||||||||||||
SCHEDULE III - REAL ESTATE AND ACCUMULATED DEPRECIATION | ||||||||||||||||||||||||||||||||||||||||||
As of December 31, 2014 | ||||||||||||||||||||||||||||||||||||||||||
(dollar amounts in thousands) | ||||||||||||||||||||||||||||||||||||||||||
Encumbrances | Initial Cost to Company(2) | Cost Capitalized Subsequent to Acquisition (Improvements) | Gross Amounts as of December 31, 2014 | |||||||||||||||||||||||||||||||||||||||
Metropolitan Statistical Area/Metro Division | State | Number of Homes | Number of Encumbered Homes | Encumbrances(1) | Land | Depreciable Property | Depreciable Property | Land | Depreciable Property | Total | Accumulated Depreciation(3) | Date of Acquisition | ||||||||||||||||||||||||||||||
Phoenix-Mesa-Scottsdale | AZ | 1,380 | 808 | 99,788 | 39,114 | 149,802 | 12,161 | 39,114 | 161,963 | 201,077 | 13,680 | 2012-2013 | ||||||||||||||||||||||||||||||
Raleigh-Cary | NC | 240 | 95 | 11,865 | 8,291 | 26,156 | 1,919 | 8,291 | 28,075 | 36,366 | 1,560 | 2013-2014 | ||||||||||||||||||||||||||||||
Riverside-San Bernardino-Ontario | CA | 213 | 171 | 26,967 | 8,900 | 24,547 | 5,168 | 8,900 | 29,715 | 38,615 | 3,933 | 2012-2013 | ||||||||||||||||||||||||||||||
Rome | GA | 2 | — | — | 23 | 68 | 22 | 23 | 90 | 113 | 9 | 2013 | ||||||||||||||||||||||||||||||
San Antonio | TX | 112 | 78 | 8,792 | 3,192 | 13,195 | 1,347 | 3,192 | 14,542 | 17,734 | 877 | 2013-2014 | ||||||||||||||||||||||||||||||
Sarasota-Bradenton-Venice | FL | 7 | — | — | 201 | 1,130 | 85 | 201 | 1,215 | 1,416 | 39 | 2014 | ||||||||||||||||||||||||||||||
Tampa-St. Petersburg-Clearwater | FL | 30 | 2 | 199 | 1,000 | 3,709 | 375 | 1,000 | 4,084 | 5,084 | 189 | 2013-2014 | ||||||||||||||||||||||||||||||
TN Nonmetropolitan Area | TN | 100 | 15 | 2,198 | 4,012 | 16,000 | 1,189 | 4,012 | 17,189 | 21,201 | 418 | 2013-2014 | ||||||||||||||||||||||||||||||
TX Nonmetropolitan Area | TX | 4 | 3 | 334 | 127 | 510 | 66 | 127 | 576 | 703 | 42 | 2013 | ||||||||||||||||||||||||||||||
Wilmington | NC | 73 | 36 | 4,349 | 2,805 | 8,498 | 678 | 2,805 | 9,176 | 11,981 | 546 | 2013-2014 | ||||||||||||||||||||||||||||||
Winston-Salem | NC | 234 | 176 | 16,994 | 6,950 | 21,506 | 863 | 6,950 | 22,369 | 29,319 | 1,510 | 2013-2014 | ||||||||||||||||||||||||||||||
8,893 | 2,876 | $ | 342,241 | $ | 249,151 | $ | 969,427 | $ | 83,035 | $ | 249,151 | $ | 1,052,462 | $ | 1,301,613 | $ | 58,010 | |||||||||||||||||||||||||
(1) Encumbrances include properties secured under the Securitization Loan. | ||||||||||||||||||||||||||||||||||||||||||
(2) All properties acquired to date for cash and no debt has been incurred. Excludes $327 of acquired in-place leases. | ||||||||||||||||||||||||||||||||||||||||||
(3) Except for amounts attributed to land, real estate related assets are depreciated over their estimated useful lives of 5 to 27.5 years using the straight-line method. | ||||||||||||||||||||||||||||||||||||||||||
79
AMERICAN RESIDENTIAL PROPERTIES, INC. | |||||||||||||
SCHEDULE III - REAL ESTATE AND ACCUMULATED DEPRECIATION | |||||||||||||
(amounts in thousands) | |||||||||||||
A summary of activity for investment in real estate and accumulated depreciation is as follows: | |||||||||||||
Year Ended December 31, | Period from March 30, (inception) to December 31, | ||||||||||||
2014 | 2013 | 2012 | |||||||||||
Change in investment in real estate: | |||||||||||||
Balance, beginning of period | $ | 793,606 | $ | 217,973 | $ | — | |||||||
Acquisitions (1) | 455,453 | 549,201 | 214,520 | ||||||||||
Improvements | 53,400 | 26,432 | 3,453 | ||||||||||
Dispositions | (846 | ) | — | — | |||||||||
Balance, end of period | $ | 1,301,613 | $ | 793,606 | $ | 217,973 | |||||||
Change in accumulated depreciation: | |||||||||||||
Balance, beginning of period | $ | (18,058 | ) | $ | (1,277 | ) | $ | — | |||||
Depreciation expense | (40,014 | ) | (16,781 | ) | (1,277 | ) | |||||||
Dispositions | 62 | — | — | ||||||||||
Balance, end of period | $ | (58,010 | ) | $ | (18,058 | ) | $ | (1,277 | ) | ||||
(1) Excludes $327 and $1,823 of acquired in-place leases for the year ended December 31, 2014 and 2013, respectively. | |||||||||||||
80
AMERICAN RESIDENTIAL PROPERTIES, INC. | |||||||
SCHEDULE IV - MORTGAGE LOANS ON REAL ESTATE | |||||||
As of December 31, 2014 | |||||||
(dollar amounts in thousands) | |||||||
Mortgages | Stated Interest Rate | Final Maturity Date (1) | Periodic Payment Terms | Face Amount of Mortgages | Carrying Amount of Mortgages | |||||||||||
Mortgage financings secured by single family homes | 11.0-12.0% | Mar-2015 to May-2018 | Interest | $ | 21,040 | $ | 21,040 | |||||||||
Long-term mortgage financings secured by single-family homes | 8.0 | % | Feb-2043 | 30-year Amortization | $ | 96 | $ | 56 | ||||||||
(1) Reflects scheduled maturity of the investment and does not consider any options to extend beyond the scheduled maturity. | ||||||||||||||||
Year Ended December 31, | |||||||||||||
2014 | 2013 | ||||||||||||
Reconciliation of Mortgage Loans on Real Estate | |||||||||||||
Balance, beginning of period | $ | 43,512 | $ | 13,025 | |||||||||
Additions during period: | |||||||||||||
New Mortgage Loans | 13,554 | 66,621 | |||||||||||
Deductions during period: | |||||||||||||
Collections of principal | (35,969 | ) | (36,134 | ) | |||||||||
Balance, end of period | $ | 21,097 | $ | 43,512 | |||||||||
81
Item 9. | Changes in and Disagreements with Accountants on Accounting and Financial Disclosure. |
None.
Item 9A. | Controls and Procedures |
Disclosure Controls and Procedures
An evaluation was performed under the supervision and with the participation of our Chief Executive Officer and Chief Financial Officer, of the effectiveness of the design and operation of our disclosure controls and procedures as defined in Rule 13a-15(e) under the Securities Exchange Act of 1934, as amended, or the Exchange Act, as of December 31, 2014. Based on that evaluation, our Chief Executive Officer and Chief Financial Officer have concluded that the design and operation of these disclosure controls and procedures were effective as of December 31, 2014.
Management’s Annual Report on Internal Control Over Financial Reporting
Our management is responsible for establishing and maintaining adequate internal control over financial reporting for the Company. Internal control over financial reporting is a process to provide reasonable assurance regarding the reliability of our financial reporting for external purposes in accordance with accounting principles generally accepted in the United States of America. Internal control over financial reporting includes maintaining records that in reasonable detail accurately and fairly reflect our transactions; providing reasonable assurance that transactions are recorded as necessary for preparation of our financial statements; providing reasonable assurance that receipts and expenditures of Company assets are made in accordance with management authorization; and providing reasonable assurance that unauthorized acquisition, use or disposition of Company assets that could have a material effect on our financial statements would be prevented or detected on a timely basis. Because of its inherent limitations, internal control over financial reporting is not intended to provide absolute assurance that a misstatement of our financial statements would be prevented or detected.
Management conducted an evaluation of the effectiveness of our internal control over financial reporting based on the 2013 Internal Control — Integrated Framework issued by the Committee of Sponsoring Organizations of the Treadway Commission. Based on this evaluation, management concluded that the Company’s internal control over financial reporting was effective as of December 31, 2014.
This Annual Report does not include an attestation report of the Company's registered public accounting firm. Under the JOBS Act enacted in 2012, we are defined as an "emerging growth company" and could remain as such until as late as December 31, 2018. So long as we qualify as an "emerging growth company," among other things, our independent registered public accounting firm will not be required to provide an attestation report on the effectiveness of our internal control.
Changes in Internal Control over Financial Reporting
There was no change in our internal control over financial reporting that occurred during our most recent fiscal quarter that has materially affected, or is reasonably likely to materially affect, our internal control over financial reporting.
Item 9B. | Other Information. |
None.
82
PART III
Item 10. | Directors, Executive Officers and Corporate Governance. |
The information required by this item is incorporated by reference from the Company's definitive proxy statement for its 2015 annual stockholders' meeting.
Item 11. | Executive Compensation. |
The information required by this item is incorporated by reference from the Company's definitive proxy statement for its 2015 annual stockholders' meeting.
Item 12. | Security Ownership of Certain Beneficial Owners and Management and Related Shareholder Matters. |
The information required by this item is incorporated by reference from the Company's definitive proxy statement for its 2015 annual stockholders' meeting.
Item 13. | Certain Relationships and Related Transactions, and Director Independence |
The information required by this item is incorporated by reference from the Company's definitive proxy statement for its 2015 annual stockholders' meeting.
Item 14. | Principal Accountant Fees and Services. |
The information required by this item is incorporated by reference from the Company's definitive proxy statement for its 2015 annual stockholders' meeting.
PART IV
Item 15. | Exhibits, Financial Statement Schedules. |
(a) The following documents are filed as part of this report:
1.Financial Statements.
The financial statements filed as part of this Annual Report on Form 10-K are listed in the index under Part II, Item 8.
2. Financial Statement Schedules.
The following financial statement schedules are included herein under Part II, Item 8. of this Annual Report on Form 10-K:
Schedule III - Real Estate and Accumulated Depreciation
Schedule IV - Mortgage Loans on Real Estate
All other financial statement schedules for which provision is made in Regulation S-X are either not required to be included herein under the related instructions or are inapplicable or the related information is included in the footnotes to the applicable financial statements and, therefore, have been omitted from this Item 15.
3. Exhibits.
The exhibits required by Item 601 of Regulation S-K, which are filed with this report or incorporated by reference herein, are set forth in the Exhibit Index. Management contracts or compensatory plans or arrangements are identified by an asterisk.
83
SIGNATURES
Pursuant to the requirements of the Securities Exchange Act of 1934, the Registrant has duly caused this report to be signed on its behalf by the undersigned thereunto duly authorized.
AMERICAN RESIDENTIAL PROPERTIES, INC. | |||
Date: March 16, 2015 | By: | /s/ STEPHEN G. SCHMITZ | |
Stephen G. Schmitz | |||
Chief Executive Officer | |||
Pursuant to the requirements of the Securities Exchange Act of 1934, this report has been signed below by the following persons on behalf of the registrant and in the capacities and on the dates indicated.
Signature | Title | Date | ||
/s/ STEPHEN G. SCHMITZ | Chief Executive Officer and Chairman of the Board | March 16, 2015 | ||
Stephen G. Schmitz | (principal executive officer) | |||
/s/ SHANT KOUMRIQIAN | Chief Financial Officer and Treasurer | March 16, 2015 | ||
Shant Koumriqian | (principal financial officer and principal accounting officer) | |||
/s/ LAURIE A. HAWKES | President, Chief Operating Officer and Director | March 16, 2015 | ||
Laurie A. Hawkes | ||||
/s/ DOUGLAS N. BENHAM | Director | March 16, 2015 | ||
Douglas N. Benham | ||||
/s/ DAVID M. BRAIN | Director | March 16, 2015 | ||
David M. Brain | ||||
/s/ KEITH R. GUERICKE | Director | March 16, 2015 | ||
Keith R. Guericke | ||||
/s/ TODD W. MANSFIELD | Director | March 16, 2015 | ||
Todd W. Mansfield | ||||
84
EXHIBIT INDEX
Exhibit No. | Description | |
3.1 | Articles of Amendment and Restatement of American Residential Properties, Inc. (incorporated by reference to Exhibit 3.1 to Amendment No. 1 to Registration Statement on Form S-11 (File No. 333-187450), filed with the SEC on April 22, 2013) | |
3.2 | Bylaws of American Residential Properties, Inc. (incorporated by reference to Exhibit 3.2 to Amendment No. 1 to Registration Statement on Form S-11 (File No. 333-187450), filed with the SEC on April 22, 2013) | |
3.3 | Agreement of Limited Partnership of American Residential Properties OP, L.P. (incorporated by reference to Exhibit 3.3 to Amendment No. 1 to Registration Statement on Form S-11 (File No. 333-187450), filed with the SEC on April 22, 2013) | |
4.1 | Indenture, dated November 27, 2013, among American Residential OP, L.P., as issuer, American Residential Properties, Inc., as guarantor, and U.S. Bank National Association, as trustee (incorporated by reference to Exhibit 4.1 to Current Report on Form 8-K, filed with the SEC on November 27, 2013) | |
4.2 | Form of Global Note representing the Operating Partnership’s 3.25% Exchangeable Senior Notes due 2018 (incorporated by reference to Exhibit 4.2 to Current Report on Form 8-K, filed with the SEC on November 27, 2013) | |
10.1* | American Residential Properties, Inc. 2012 Equity Incentive Plan (incorporated by reference to Exhibit 10.1 to Amendment No. 1 to Registration Statement on Form S-11 (File No. 333-187450), filed with the SEC on April 22, 2013) | |
10.2* | Amended and Restated Employment Agreement with Stephen G. Schmitz, dated April 19, 2013 (incorporated by reference to Exhibit 10.2 to Amendment No. 2 to Registration Statement on Form S-11 (File No. 333-187450), filed with the SEC on April 29, 2013) | |
10.3* | Amended and Restated Employment Agreement with Laurie A. Hawkes, dated April 19, 2013 (incorporated by reference to Exhibit 10.3 to Amendment No. 2 to Registration Statement on Form S-11 (File No. 333-187450), filed with the SEC on April 29, 2013) | |
10.4* | Employment Agreement with Shant Koumriqian, dated April 19, 2013 (incorporated by reference to Exhibit 10.4 to Amendment No. 1 to Registration Statement on Form S-11 (File No. 333-187450), filed with the SEC on April 22, 2013) | |
10.5* | Employment Agreement with Andrew G. Kent, dated April 19, 2013 (incorporated by reference to Exhibit 10.5 to Amendment No. 1 to Registration Statement on Form S-11 (File No. 333-187450), filed with the SEC on April 22, 2013) | |
10.6* | Separation Agreement, dated October 31, 2013, among American Residential Properties, Inc., certain of its subsidiaries and Andrew G. Kent (incorporated by reference to Exhibit 10.5 to Current Report on Form 8-K, filed with the SEC on November 6, 2013) | |
10.7* | Employment Agreement with Lani B Porter, dated April 19, 2013 (incorporated by reference to Exhibit 10.6 to Amendment No. 1 to Registration Statement on Form S-11 (File No. 333-187450), filed with the SEC on April 22, 2013) | |
10.8* | Amended and Restated Executive Severance and Change in Control Vesting Agreement, dated as of December 23, 2014, by and between American Residential Properties, Inc. and Christopher J. (“Jay”) Byce (incorporated by reference to Exhibit 10.1 to Current Report on Form 8-K, filed with the SEC on January 6, 2015) | |
10.9 | Form of Indemnification Agreement between American Residential Properties, Inc. and each of its officers and directors (incorporated by reference to Exhibit 10.7 to Amendment No. 1 to Registration Statement on Form S-11 (File No. 333-187450), filed with the SEC on April 22, 2013) | |
10.10* | LTIP Unit Vesting Agreement for Shant Koumriqian (time-based vesting), dated November 7, 2012 (incorporated by reference to Exhibit 10.12 to Amendment No. 1 to Registration Statement on Form S-11 (File No. 333-187450), filed with the SEC on April 22, 2013) | |
10.11* | LTIP Unit Vesting Agreement for Lani B Porter (time-based vesting), dated November 7, 2012 (incorporated by reference to Exhibit 10.15 to Amendment No. 1 to Registration Statement on Form S-11 (File No. 333-187450), filed with the SEC on April 22, 2013) | |
10.12* | Form of LTIP Unit Vesting Agreement (for independent directors) (incorporated by reference to Exhibit 10.16 to Amendment No. 1 to Registration Statement on Form S-11 (File No. 333-187450), filed with the SEC on April 22, 2013) | |
85
10.13* | Form of LTIP Unit Vesting Agreement (for employees) (incorporated by reference to Exhibit 10.17 to Amendment No. 1 to Registration Statement on Form S-11 (File No. 333-187450), filed with the SEC on April 22, 2013) | |
10.14* | Form of Restricted Stock Award Agreement (for employees) (incorporated by reference to Exhibit 10.18 to Amendment No. 1 to Registration Statement on Form S-11 (File No. 333-187450), filed with the SEC on April 22, 2013) | |
10.15* | Form of Restricted Stock Award Agreement (for executives) (incorporated by reference to Exhibit 10.19 to Amendment No. 1 to Registration Statement on Form S-11 (File No. 333-187450), filed with the SEC on April 22, 2013) | |
10.16* | LTIP Unit Performance-Based Vesting Agreement, dated November 5, 2013, among American Residential Properties, Inc., American Residential Properties OP, L.P. and Stephen G. Schmitz (incorporated by reference to Exhibit 10.1 to Current Report on Form 8-K, filed with the SEC on November 6, 2013) | |
10.17* | LTIP Unit Performance-Based Vesting Agreement, dated November 5, 2013, among American Residential Properties, Inc., American Residential Properties OP, L.P. and Laurie A. Hawkes (incorporated by reference to Exhibit 10.2 to Current Report on Form 8-K, filed with the SEC on November 6, 2013) | |
10.18* | LTIP Unit Performance-Based Vesting Agreement, dated November 5, 2013, among American Residential Properties, Inc., American Residential Properties OP, L.P. and Shant Koumriqian (incorporated by reference to Exhibit 10.3 to Current Report on Form 8-K, filed with the SEC on November 6, 2013) | |
10.19* | LTIP Unit Performance-Based Vesting Agreement, dated November 5, 2013, among American Residential Properties, Inc., American Residential Properties OP, L.P. and Lani B Porter (incorporated by reference to Exhibit 10.4 to Current Report on Form 8-K, filed with the SEC on November 6, 2013) | |
10.20* | Form of LTIP Unit Performance-Based Vesting Agreement (for executives) (incorporated by reference to Exhibit 10.1 to Form 10-Q, filed with the SEC on May 15, 2014) | |
10.21* | Form of LTIP Unit Vesting Agreement (time-based) (for executives) (incorporated by reference to Exhibit 10.2 to Form 10-Q, filed with the SEC on May 15, 2014) | |
10.22* | Executive Severance and Change in Control Agreement, dated as of June 12, 2014 and effective July 7, 2014, by and between American Residential Properties, Inc. and Patricia B. Dietz (incorporated by reference to Exhibit 10.1 to Current Report on Form 8-K, filed with the SEC on June 17, 2014) | |
10.23 | Registration Rights Agreement, dated as of May 11, 2012, between American Residential Properties, Inc. and FBR Capital Markets & Co. (incorporated by reference to Exhibit 10.20 to Amendment No. 1 to Registration Statement on Form S-11 (File No. 333-187450), filed with the SEC on April 22, 2013) | |
10.24 | Registration Rights Agreement, dated as of December 21, 2012, between American Residential Properties, Inc. and FBR Capital Markets & Co. (incorporated by reference to Exhibit 10.21 to Amendment No. 1 to Registration Statement on Form S-11 (File No. 333-187450), filed with the SEC on April 22, 2013) | |
10.25 | Contribution and Sale Agreement, dated as of May 11, 2012, among American Residential Management, Inc., Stephen G. Schmitz, Laurie A. Hawkes and American Residential Properties OP, L.P. (incorporated by reference to Exhibit 10.22 to Amendment No. 1 to Registration Statement on Form S-11 (File No. 333-187450), filed with the SEC on April 22, 2013) | |
10.26 | Credit Agreement, dated as of January 18, 2013 (incorporated by reference to Exhibit 10.23 to Amendment No. 1 to Registration Statement on Form S-11 (File No. 333-187450), filed with the SEC on April 22, 2013) | |
10.27 | Property Management Agreement, dated as of February 12, 2013, between American Residential Properties TRS, LLC and ARP Phoenix Fund I, LP (incorporated by reference to Exhibit 10.24 to Amendment No. 1 to Registration Statement on Form S-11 (File No. 333-187450), filed with the SEC on April 22, 2013) | |
10.28 | Amended and Restated Credit Agreement, dated as of September 17, 2013, by and among American Residential Properties, Inc., American Residential Properties OP, L.P. (the “Operating Partnership”), American Residential GP, LLC and American Residential Properties TRS, LLC, as guarantors, American Residential Leasing Company, LLC, as the borrower, certain other subsidiaries of the Operating Partnership, Bank of America, N.A., as administrative agent, and the other lenders party thereto (incorporated by reference to Exhibit 10.1 to Current Report of Form 8-K, filed with the SEC on September 23, 2013) | |
10.29 | Lender Joinder Agreement, dated as of September 27, 2013, by and among American Residential Properties, Inc., American Residential Properties OP, L.P. (the “Operating Partnership”), American Residential GP, LLC and American Residential Properties TRS, LLC, as guarantors, American Residential Leasing Company, LLC, as the borrower, certain other subsidiaries of the Operating Partnership, Bank of America, N.A., as administrative agent, and Citibank N.A, as lender (incorporated by reference to Exhibit 10.1 to Current Report on Form 8-K, filed with the SEC on October 3, 2013) | |
86
10.30 | Lender Joinder Agreement, dated as of December 16, 2013, by and among American Residential Properties, Inc., American Residential Properties OP, L.P (the "Operating Partnership"), American Residential GP, LLC and American Residential Properties TRS, LLC, as guarantors, American Residential Leasing Company, LLC, as the borrower, certain other subsidiaries of the Operating Partnership, JPMorgan Chase Bank, N.A, as lender, and Bank of America N.A, as administrative agent and as L/C Issuer (incorporated by reference to Exhibit 10.1 to Current Report on Form 8-K, filed with the SEC on December 19, 2013) | |
10.31 | Registration Rights Agreement, dated November 27, 2013, among American Residential OP, L.P. and American Residential Properties, Inc., on the one hand, and Morgan Stanley & Co. LLC and Merrill Lynch, Pierce, Fenner & Smith Incorporated, on the other hand, for themselves and the initial purchasers named in the Purchase Agreement filed as Exhibit 1.1 to Current Report on Form 8-K, filed with the SEC on November 27, 2013 (incorporated by reference to Exhibit 10.1 to Current Report on Form 8-K, filed with the SEC on November 27, 2013) | |
10.32 | Second Amendment to Amended and Restated Credit Agreement, dated as of June 27, 2014, by and among American Residential Properties, Inc., American Residential Properties OP, L.P., American Residential GP, LLC and American Residential Properties TRS, LLC, as guarantors, American Residential Leasing Company, LLC, as the borrower, Bank of America, N.A., as administrative agent, letters of credit issuer and a lender, and Deutsche Bank AG, New York Branch, Citibank, N.A., JPMorgan Chase Bank, N.A., Morgan Stanley Senior Funding, Inc., KeyBank National Association, Barclays Bank PLC, Raymond James Bank, N.A. and Comerica Bank, as lenders (incorporated by reference to Exhibit 10.1 to Current Report of Form 8-K (File No. 001-35899), filed with the SEC on July 1, 2014) | |
10.33 | Loan Agreement, dated as of August 26, 2014, between ARP 2014-1 Borrower, LLC, as Borrower, and German American Capital Corporation, as Lender (incorporated by reference to Exhibit 10.1 to Current Report on Form 8-K, filed with the SEC on August 28, 2014) | |
12.1† | Computation of Ratio to Earnings to Fixed Charges | |
21.1† | List of Subsidiaries of American Residential Properties, Inc. | |
23.1† | Consent of Ernst & Young LLP | |
31.1† | Certification of Chief Executive Officer pursuant to Rule 13a-14(a)/15d-14(a) of the Securities Exchange Act of 1934, as amended. | |
31.2† | Certification of Chief Financial Officer pursuant to Rule 13a-14(a)/15d-14(a) of the Securities Exchange Act of 1934, as amended. | |
32.1†† | Certification of Chief Executive Officer pursuant to 18 U.S.C. Section 1350, as adopted pursuant to Section 906 of the Sarbanes-Oxley Act of 2002. | |
32.2†† | Certification of Chief Financial Officer pursuant to 18 U.S.C. Section 1350, as adopted pursuant to Section 906 of the Sarbanes-Oxley Act of 2002. | |
101.INS | XBRL Instance Document(1) | |
101.SCH | XBRL Taxonomy Extension Schema Document(1) | |
101.CAL | XBRL Taxonomy Extension Calculation Linkbase Document(1) | |
101.DEF | XBRL Taxonomy Extension Definition Linkbase Document(1) | |
101.LAB | XBRL Taxonomy Extension Label Linkbase Document(1) | |
101.PRE | XBRL Taxonomy Extension Presentation Linkbase Document(1) | |
* | Management contract or compensatory plan or arrangement. |
† | Filed herewith. |
†† | Furnished herewith. |
(1) | Submitted electronically herewith. |
87