Attached files
| file | filename |
|---|---|
| EXCEL - IDEA: XBRL DOCUMENT - PATRICK INDUSTRIES INC | Financial_Report.xls |
| EX-23 - EXHIBIT 23 - PATRICK INDUSTRIES INC | ex23.htm |
| EX-12 - EXHIBIT 12 - PATRICK INDUSTRIES INC | ex12.htm |
| EX-21 - EXHIBIT 21 - PATRICK INDUSTRIES INC | ex21.htm |
| EX-32 - EXHIBIT 32 - PATRICK INDUSTRIES INC | ex32.htm |
| EX-10.16 - EXHIBIT 10.16 - PATRICK INDUSTRIES INC | ex10-16.htm |
| EX-31.1 - EXHIBIT 31.1 - PATRICK INDUSTRIES INC | ex31-1.htm |
| EX-31.2 - EXHIBIT 31.2 - PATRICK INDUSTRIES INC | ex31-2.htm |
UNITED STATES SECURITIES AND EXCHANGE COMMISSION
WASHINGTON, D.C. 20549
FORM 10-K
(Mark One)
[ X ] ANNUAL REPORT PURSUANT TO SECTION 13 OR 15(d) OF THE SECURITIES EXCHANGE ACT OF 1934
For the Fiscal Year Ended December 31, 2014
or
[ ] TRANSITION REPORT PURSUANT TO SECTION 13 OR 15(d) OF THE SECURITIES EXCHANGE ACT OF 1934
For the transition period from ……………… to ………………
Commission file number 000-03922
PATRICK INDUSTRIES, INC.
(Exact name of registrant as specified in its charter)
|
INDIANA |
35-1057796 |
|
(State or other jurisdiction of |
(I.R.S. Employer |
|
incorporation or organization) |
(Identification No.) |
| 107 W. FRANKLIN STREET, P.O. Box 638, ELKHART, IN | 46515 |
| (Address of principal executive offices) | (Zip Code) |
(574) 294-7511
(Registrant’s telephone number, including area code)
Securities registered pursuant to Section 12(b) of the Act:
|
Common stock, without par value (Title of each class) |
Nasdaq Stock Market LLC (Name of each exchange on which registered) |
Securities registered pursuant to Section 12(g) of the Act: None
Indicate by check mark if the registrant is a well-known seasoned issuer, as defined in Rule 405 of the Securities Act. Yes [ ] No [X]
Indicate by check mark if the registrant is not required to file reports pursuant to Section 13 or Section 15(d) of the Exchange Act. Yes [ ] No [X]
Indicate by check mark whether the registrant (1) has filed all reports required to be filed by Section 13 or 15(d) of the Securities Exchange Act of 1934 during the preceding 12 months (or for such shorter period that the registrant was required to file such reports), and (2) has been subject to such filing requirements for the past 90 days. Yes [X] No [ ]
Indicate by check mark whether the registrant has submitted electronically and posted on its corporate Web site, if any, every Interactive Data File required to be submitted and posted pursuant to Rule 405 of Regulation S-T during the preceding 12 months (or for such shorter period that the registrant was required to submit and post such files). Yes [X] No [ ]
Indicate by check mark if disclosure of delinquent filers pursuant to Item 405 of Regulation S-K is not contained herein, and will not be contained, to the best of registrant’s knowledge, in definitive proxy or information statements incorporated by reference in Part III of this Form 10-K or any amendment to this Form 10-K. [ ]
Indicate by check mark whether the registrant is a large accelerated filer, an accelerated filer, a non-accelerated filer, or a smaller reporting company. See the definitions of “large accelerated filer,” “accelerated filer” and “smaller reporting company” in Rule 12b-2 of the Exchange Act. Large accelerated filer [ ] Accelerated filer [X] Non-accelerated filer [ ] (Do not check if a smaller reporting company) Smaller reporting company [ ]
Indicate by check mark whether the registrant is a shell company (as defined in Rule 12b-2 of the Act). Yes [ ] No [X]
The aggregate market value of the voting stock held by non-affiliates of the registrant on June 27, 2014 (based upon the closing price on the Nasdaq Stock Market LLC and an estimate of 70.15% of shares owned by non-affiliates) was $328,084,901. The closing market price was $44.19 on that day and 10,583,628 shares of the registrant’s common stock were outstanding. As of February 27, 2015, there were 10,283,901 shares of the registrant’s common stock outstanding.
DOCUMENTS INCORPORATED BY REFERENCE
Portions of the registrant’s Proxy Statement for its Annual Meeting of Shareholders to be held on May 19, 2015 are incorporated by reference into Part III of this Form 10-K.
PATRICK INDUSTRIES, INC.
FORM 10-K
FISCAL YEAR ENDED DECEMBER 31, 2014
TABLE OF CONTENTS
|
PART I |
3 | |
|
ITEM 1. |
BUSINESS |
3 |
|
ITEM 1A. |
RISK FACTORS |
14 |
|
ITEM 1B. |
UNRESOLVED STAFF COMMENTS |
21 |
|
ITEM 2. |
PROPERTIES |
22 |
|
ITEM 3. |
LEGAL PROCEEDINGS |
23 |
|
ITEM 4. |
MINE SAFETY DISCLOSURES |
23 |
|
PART II |
23 | |
|
ITEM 5. |
MARKET FOR REGISTRANT’S COMMON EQUITY, RELATED STOCKHOLDER MATTERS, AND ISSUER PURCHASES OF EQUITY SECURITIES |
23 |
|
ITEM 6. |
SELECTED FINANCIAL DATA |
26 |
|
ITEM 7. |
MANAGEMENT’S DISCUSSION AND ANALYSIS OF FINANCIAL CONDITION AND RESULTS OF OPERATIONS |
26 |
|
ITEM 7A. |
QUANTITATIVE AND QUALITATIVE DISCLOSURES ABOUT MARKET RISK |
48 |
|
ITEM 8. |
FINANCIAL STATEMENTS AND SUPPLEMENTARY DATA |
48 |
|
ITEM 9. |
CHANGES IN AND DISAGREEMENTS WITH ACCOUNTANTS ON ACCOUNTING AND FINANCIAL DISCLOSURE |
48 |
|
ITEM 9A. |
CONTROLS AND PROCEDURES |
49 |
|
ITEM 9B. |
OTHER INFORMATION |
49 |
|
PART III |
50 | |
|
ITEM 10. |
DIRECTORS, EXECUTIVE OFFICERS AND CORPORATE GOVERNANCE |
50 |
|
ITEM 11. |
EXECUTIVE COMPENSATION |
50 |
|
ITEM 12. |
SECURITY OWNERSHIP OF CERTAIN BENEFICIAL OWNERS AND MANAGEMENT AND RELATED STOCKHOLDER MATTERS |
51 |
|
ITEM 13. |
CERTAIN RELATIONSHIPS AND RELATED TRANSACTIONS, AND DIRECTOR INDEPENDENCE |
51 |
|
ITEM 14. |
PRINCIPAL ACCOUNTING FEES AND SERVICES |
51 |
|
PART IV |
51 | |
|
ITEM 15. |
EXHIBITS AND FINANCIAL STATEMENT SCHEDULES |
51 |
|
SIGNATURES |
55 |
FINANCIAL SECTION
|
Index to Financial Statements and Financial Statement Schedules |
F-1 | |
|
Report of Independent Registered Public Accounting Firm, Crowe Horwath LLP |
F-2 | |
|
Consolidated Statements of Financial Position |
F-3 | |
|
Consolidated Statements of Income |
F-4 | |
|
Consolidated Statements of Comprehensive Income |
F-5 | |
|
Consolidated Statements of Shareholders’ Equity |
F-6 | |
|
Consolidated Statements of Cash Flows |
F-7 | |
|
Notes to Consolidated Financial Statements |
F-8 | |
|
Exhibits |
|
INFORMATION CONCERNING FORWARD-LOOKING STATEMENTS
This Form 10-K contains certain “forward-looking statements” within the meaning of the Private Securities Litigation Reform Act of 1995 with respect to financial condition, results of operations, business strategies, operating efficiencies or synergies, competitive position, industry growth and projections, growth opportunities for existing products, plans and objectives of management, markets for the common stock of Patrick Industries, Inc. (collectively, the “Company,” “we,”, “our” or “Patrick”) and other matters. Statements in this Form 10-K as well as other statements contained in the annual report and statements contained in future filings with the Securities and Exchange Commission (“SEC”) and publicly disseminated press releases, and statements which may be made from time to time in the future by management of the Company in presentations to shareholders, prospective investors, and others interested in the business and financial affairs of the Company, which are not historical facts, are forward-looking statements that involve risks and uncertainties that could cause actual results to differ materially from those set forth in the forward-looking statements. Patrick does not undertake to publicly update or revise any forward-looking statements, except as required by law. You should consider forward-looking statements, therefore, in light of various important factors, including those set forth in the reports and documents that the Company files with the SEC, including this Annual Report on Form 10-K for the year ended December 31, 2014.
There are a number of factors, many of which are beyond the control of the Company, which could cause actual results and events to differ materially from those described in the forward-looking statements. Many of these factors are identified in the “Risk Factors” section of this Form 10-K as set forth in Part I, Item 1A. These factors include, without limitation, the impact of any economic downturns especially in the residential housing market, a decline in consumer confidence levels, pricing pressures due to competition, costs and availability of raw materials, availability of commercial credit, availability of retail and wholesale financing for residential and manufactured homes, availability and costs of labor, inventory levels of retailers and manufacturers, levels of repossessed residential and manufactured homes, the financial condition of our customers, retention and concentration of significant customers, the ability to generate cash flow or obtain financing to fund growth, future growth rates in the Company's core businesses, the seasonality and cyclicality in the industries to which our products are sold, the ability to effectively manage the costs and the implementation of the new enterprise resource management system, the successful integration of acquisitions, interest rates, oil and gasoline prices, adverse weather conditions impacting retail sales, and our ability to remain in compliance with our credit agreement covenants. In addition, national and regional economic conditions and consumer confidence may affect the retail sale of recreational vehicles and residential and manufactured homes.
Any projections of financial performance or statements concerning expectations as to future developments should not be construed in any manner as a guarantee that such results or developments will, in fact, occur. There can be no assurance that any forward-looking statement will be realized or that actual results will not be significantly different from that set forth in such forward-looking statement. See Part I, Item 1A “Risk Factors” below for further discussion.
PART I
|
ITEM 1. |
BUSINESS |
Company Overview
Patrick Industries, Inc., which was founded in 1959 and incorporated in Indiana in 1961, is a major manufacturer of component products and distributor of building products and materials for the recreational vehicle (“RV”) and manufactured housing (“MH”) industries. In addition, we are a supplier to certain other industrial markets, such as kitchen cabinet, office and household furniture, fixtures and commercial furnishings, marine, and other industrial markets. We manufacture a variety of products including decorative vinyl and paper laminated panels, fabricated aluminum products, wrapped vinyl, paper and hardwood profile mouldings, solid surface, granite and quartz countertops, cabinet doors and components, hardwood furniture, fiberglass bath and shower fixtures, fiberglass and plastic component products including front and rear caps and marine helms, slide-out trim and fascia, interior passage doors, exterior graphics and RV painting, simulated wood and stone products, and slotwall panels and components, among others.
We are also an independent wholesale distributor of pre-finished wall and ceiling panels, drywall and drywall finishing products, electronics, wiring, electrical, and plumbing products, cement siding, fiber reinforced polyester (“FRP”) products, interior passage doors, roofing products, laminate and ceramic flooring, shower doors, furniture, fireplaces and surrounds, interior and exterior lighting products, and other miscellaneous products. We have a nationwide network of manufacturing and distribution centers for our products, thereby reducing in-transit delivery time and cost to the regional manufacturing plants of our customers. We believe that we are one of the few suppliers to the RV and MH industries that has such a nationwide network. We maintain 25 manufacturing plants and nine distribution facilities near our principal offices in Elkhart, Indiana, and operate seven other warehouse and distribution centers and seven other manufacturing plants in nine other states.
Approximately 84% and 91% of our consolidated net sales in 2014 and 2013, respectively, were decorative interior products and components, consisting primarily of manufactured panels, mouldings and trim, hardwood and pressed doors, furniture and fascia, countertops, and fiberglass products. We have no material patents, licenses, franchises, or concessions and do not conduct significant research and development activities.
Over the past several years, we have executed on a number of strategic initiatives including: the completion of 17 acquisitions and the introduction of over 260 new products and product line extensions (2010 through February 2015), the implementation of a branding strategy, increasing our market share, deleveraging our balance sheet, investing in property, plant and equipment, operational restructuring at certain manufacturing and distribution facilities, disposition of underperforming operations and facilities, aggressive management of inventory levels to changes in sales levels, and amending and refinancing our credit facility to provide continued capacity to execute on our strategic plan. The combination of improving economic conditions, particularly in the RV industry, and the execution of the strategic initiatives identified above, among others, resulted in our sales, operating income, net income and cash flows improving significantly in the four years ended December 31, 2014. In the Executive Summary section of Item 7, “Management’s Discussion and Analysis of Financial Condition and Results of Operations,” we provide an overview of the impact that macroeconomic conditions had on our operations and in the RV, MH and industrial markets in 2014.
We have continued to expand the breadth and the depth of our products and services through the integration of new and innovative product lines designed to bring value to our customers and create additional scale advantages. See “Strategic Acquisitions and Expansion” below and Note 4 to the Consolidated Financial Statements in Item 8 of this report for further details.
Patrick had two reportable operating segments in 2014, Manufacturing and Distribution. Financial information about these operating segments is included in Note 19 to the Consolidated Financial Statements and incorporated herein by reference.
Competitive Position
The RV and MH industries are highly competitive with low barriers to entry, which carries through to the suppliers to these industries. Across the Company’s range of products and services, competition exists primarily on price, product features, quality, and service. Several competitors compete in each product line with us on a regional and local basis. However, in order for a competitor to compete with us on a national basis, we believe that a substantial capital commitment and investment in personnel and facilities would be required. The industrial markets that we serve are also highly competitive.
Given the environment in the industries in which we operate, the Company has identified several operating strategies to maintain or enhance earnings through strategic acquisitions, productivity initiatives, expansion into new product lines, and optimization of capacity utilization.
Strategy
Overview
We believe that we have developed strong working relationships with our customers and suppliers, and have oriented our business to their needs. Our customers include all of the larger RV and MH manufacturers and a number of large to medium-sized industrial customers. The majority of our industrial customers are generally directly linked to the residential housing markets. Our RV and MH customers generally demand competitive prices, high quality standards, short lead times, and a high degree of flexibility from their suppliers. Our industrial customers generally are less price sensitive than our RV and MH customers, and are focused on consistent high quality products, exceptional customer service, and quick response time.
Our capital allocation strategy includes a balance of managing and utilizing our resources and leverage position to continue to grow and invest in the business model through strategic acquisitions, investment in infrastructure and capital expenditures to ensure both capacity and technology to support anticipated growth needs, and stock repurchases, among others. Additionally, because of the short lead times, which can include same day order, receipt and delivery, we continue to focus on managing our inventory levels to achieve a balance between increasing inventory turns and ensuring we have product on hand to meet customer demand levels.
As we explore new markets and industries, we believe that our core competencies and focus on executing on our strategic plan provide us with a strong foundation for future growth. In 2014, approximately 74% of our net sales were to the RV industry, 15% to the MH industry, and 11% to the industrial markets. In 2013, approximately 72% of our net sales were to the RV industry, 16% to the MH industry, and 12% to the industrial markets. The increase in wholesale unit shipments in the RV market relative to the other primary market sectors in which Patrick operates, the introduction of new products to the marketplace, and the impact of the acquisitions completed in the last five years, have led to an increase in our RV market sales concentration through 2014 when compared to prior periods.
Operating Strategies
Key operating strategies identified by management include the following:
Strategic Acquisitions and Expansion
We supply a broad variety of building materials and component products to the RV, MH and industrial markets. With our nationwide manufacturing and distribution capabilities and capacities, we believe that we are well positioned for continued market improvement in all industry sectors and the introduction of new products to further bring value to our customer base. In order to facilitate this initiative, we are focused on driving growth in all three of our primary markets through the acquisition of companies with strong management teams with a strategic fit to our core values, business model and customer presence, as well as additional product lines, facilities, or other assets to complement or expand our existing businesses. We believe there continues to be acquisition opportunities in all three primary markets that we serve.
From 2010 to 2012, we invested approximately $43 million, in the aggregate, to complete a total of nine acquisitions, which directly complemented our core competencies and product lines.
In 2013, we invested approximately $17 million to complete three acquisitions: Frontline Mfg., Inc. (“Frontline”), a manufacturer of fiberglass bath fixtures, including tubs, showers and combination tub/shower units for the RV, MH and residential housing markets; Premier Concepts, Inc. (“Premier”), a custom fabricator of solid surface, granite, and quartz countertops for the RV, MH and residential housing markets; and John H. McDonald Co., Inc. d/b/a West Side Furniture (“West Side”), a wholesale supplier of La-Z-Boy® recliners and the Serta® Trump Home™ mattress line, among other furniture products, to the RV market.
In 2014, we invested approximately $72 million to complete four acquisitions: Precision Painting, Inc., Carrera Custom Painting, Inc., and Millennium Paint, Inc., three related full service exterior full body painting operations that offer exterior painting and interior refurbishing for both OEMs and existing RV and fleet owners, and TDM Transport, Inc., a transportation operation that services their in-house customers (collectively referred to as “Precision Painting Group” or “Precision”); Foremost Fabricators, LLC (“Foremost”), a fabricator and distributor of fabricated aluminum products, FRP sheet and coil, and custom laminated products primarily used in the RV market; PolyDyn3, LLC (“PolyDyn3”), a custom fabricator of simulated wood and stone products for the RV market; and Charleston Corporation (“Charleston”), a manufacturer of fiberglass and plastic components primarily used in the RV, marine, and vehicle aftermarket industries. See Note 4 to the Consolidated Financial Statements.
In February 2015, we invested approximately $40 million to acquire Better Way Partners, LLC d/b/a Better Way Products (“Better Way”), a manufacturer of fiberglass front and rear caps, marine helms and related fiberglass components.
Diversification into Other Markets
While we continually seek to improve our position as a leading supplier to the RV and MH industries, we are also seeking to expand our product lines into other industrial, commercial, and institutional markets. Many of our products, such as countertops, hardwood and pressed cabinet doors, laminated panels and mouldings, drawer sides and fronts, slotwall, and shelving, have applications in the kitchen cabinet, retail fixtures, household furniture, and architectural markets. We have a dedicated sales force focused on increasing our industrial market penetration and on our diversification into additional commercial and institutional markets.
We believe that diversification into other industrial markets provides opportunities for improved operating margins with complementary products that increase our capacity utilization. In addition, we believe that our nationwide manufacturing and distribution capabilities have enabled us to be well positioned for new product expansion.
Additionally, we may explore strategic acquisition opportunities that are not directly tied to the three primary markets we serve in order to further leverage our core competencies in manufacturing and distribution and to diversify our end market exposure and presence.
Utilization of Manufacturing Capacity
Efficiency Optimization
We have the ability to increase revenues in all of our existing facilities without adding comparable incremental fixed costs. If economic conditions in certain parts of the country warrant, we will explore opportunities for further facility consolidation. However, we have remained committed to certain geographic areas, specifically where there is a larger concentration of MH manufacturers but where our revenues and profitability have been constrained in recent years. Additionally, we are focused on cross-training all of our manufacturing work force in our manufacturing cells within each facility to maximize our efficiencies and increase the flexibility of our labor force.
Plant Consolidations / Closures and Plant Expansion
Certain manufacturing and distribution operating facilities were either consolidated or expanded during 2013 and 2014 in an effort to continue to improve operating efficiencies in the plants through increased capacity utilization. In 2013, we purchased one of our distribution facilities that we had previously been leasing from an unrelated third party and leased additional facilities to accommodate larger inventory levels and growth in our manufacturing and distribution businesses. In 2014, we closed our leased distribution facility in Madisonville, Tennessee and consolidated the business into the existing Mt. Joy, Pennsylvania and Decatur, Alabama distribution facilities that engage in similar activities.
Product Development and New Product Introductions/Discontinuations
With our versatile manufacturing and distribution capabilities, we are continually striving to increase our presence in all of the markets that we serve and gain entrance into other markets. We remain committed to new product introduction and development initiatives. New product development is a key component of our strategy to grow our market share and revenue base, keep up with changing market conditions, and proactively address customer demand. We have a design center featuring our major product lines and a specialized design team that works exclusively with RV and MH manufacturers to meet their creative design and product needs including creating new styles and utilizing new colors, patterns, products, and wood types for panels and mouldings, cabinet doors, furniture, lighting and other products. We will continue to focus our time and attention to manufacturing and distributing products that fit within the strategic parameters of our current business model, including appropriate margin and inventory turn levels.
In addition to the new product offerings stemming from acquisitions, we further enhanced our product offerings to our customers in the RV, MH, and industrial markets through the introduction of several new products and the expansion of our existing product lines in 2014 including, on the manufacturing side, several new cabinet door styles, upgraded cabinetry and countertops, new slide-out trim, new styles of interior passage doors for RVs, pressed countertops, lighting packages, backsplashes and exterior graphics and paint. Our distribution line of products was expanded to include new faucets modeled after the residential market, residential furniture, televisions and sound bars, ceramic tile, flat-pack cabinets, power cords, flooring options and various building products.
Branding
In conjunction with our acquisition strategy, we continue to focus our efforts on providing specific product knowledge, expertise and support to our customers through a branding strategy which includes product managers for each of our key product lines, support staff, and strategic supplier relationships which allows us to partner with them as a supplier of choice to drive efficiency and maximize value by providing the expertise and product support in the products that we sell. Our primary product brands include Adorn, Custom Vinyls, Patrick Distribution, AIA Countertops, Quest Audio Video, Interior Components Plus, Gravure Ink, Praxis Group, Infinity Graphics, Décor Manufacturing, Gustafson Lighting, Creative Wood Designs, Middlebury Hardwood Products, Frontline Manufacturing, Premier Concepts, West Side Furniture, Precision Painting, Carrera Custom Painting, Millennium Paint, Foremost Fabricators, PolyDyn3, Charleston and Better Way Products. In addition, our industrial markets sector cross sells existing product lines and launches new products that are targeted to serve unique, consumer-driven channels under the Decorative Dynamics brand name.
Manufacturing Processes and Operations
Our lamination facilities utilize various materials such as lauan, medium-density fiberboard (“MDF”), gypsum, and particleboard, which are bonded by adhesives or a heating process to a number of products, including vinyl, paper, foil, and high-pressure laminates. Additionally, we offer high-pressure laminate bonded primarily to particleboard, which has many uses, including countertops, cabinetry, and office furniture, among others. We manufacture and fabricate solid surface, granite, quartz, and high-pressure laminate countertops for all of our primary markets, as well as slotwall panels and components for the retail store fixture markets. Roll-laminated products are used in the production of wall, cabinet, shelving, counter, and fixture products with a wide variety of finishes and textures. In conjunction with our manufacturing capabilities, we also provide value added processes, including custom fabrication, edge-banding, drilling, boring, and cut-to-size capabilities. We also manufacture various fiberglass bath and shower surrounds and fixtures.
We manufacture three distinct cabinet door product lines in both raised and flat panel designs, as well as square, shaker style, cathedral and arched panels. Our primary cabinet door product line is manufactured from raw lumber using solid oak, maple, cherry and other hardwood materials, and comes in a variety of finishes and glazes. Another line of doors is made of laminated fiberboard, and a third line uses membrane press technology to produce doors and components with vinyls of various thicknesses. Doors are also made with a number of outside decorative components such as rosettes, hardwood moulding, arched window trim, blocks and windowsills, among others. Our doors are sold mainly to the RV and MH industries. We also market to the cabinet manufacturers and “ready-to-assemble” furniture manufacturers.
Our vinyl printing facility produces a wide variety of decorative and textured vinyls, which are generally 50” in width and 3.2 mil nominal thickness, and are shipped in rolls ranging from 300-800 yards in length. This facility produces material both for sale to external customers and for internal use.
In 2014, we expanded our stable of products to the markets we serve with the acquisition of three related exterior full body painting operations (the Precision Group), a fabricator and distributor of fabricated aluminum and FRP products (Foremost), a custom fabricator of simulated wood and stone products (PolyDyn3), and a manufacturer of fiberglass and plastic components (Charleston). In February 2015, we acquired the operations of Better Way, a custom fiberglass fabricator for the RV, marine and transit vehicle markets.
Markets
We are engaged in the manufacturing and distribution of building products and material for use primarily by the RV and MH industries, and in other industrial markets. We continue to capture market share through our strategic acquisitions and new product initiatives, which have resulted in sales levels growing at a rate in excess of the general industry over the last five years.
Over the past five years, industry conditions in the RV industry have continued to improve as evidenced by higher production levels and wholesale unit shipments versus the prior year periods. We believe that industry-wide retail sales and the related production levels of RVs will be dependent on the overall strength of the economy, consumer confidence levels, conditions in the credit markets, and other demographic trends. Recreational vehicle purchases are generally consumer discretionary income purchases, and therefore, any situation which causes concerns related to discretionary income can have a negative impact on this market.
The MH industry, which has improved marginally in recent years, continues to be negatively impacted by the lack of financing alternatives and credit availability, and in certain areas, excess residential housing inventories. Financing concerns and the current credit situation in the residential housing market have put additional pressure on potential purchasers of manufactured homes, many of whom use conventional mortgage financing as a source of funding for purchases. While there is still overhang related to the overall economic environment and other conditions mentioned above, we believe that there is upside potential and limited risk as it relates to residential housing growth based on pent up demand, job growth, the availability of credit, and affordable interest rates. On average over the last 40 years, approximately three-fourths of total residential housing starts have been single-family housing starts. In addition, wholesale unit shipment levels in the MH industry have averaged approximately 9% to 11% of the level of single-family housing starts over the last 10 years.
Approximately 56% of our industrial revenue base in 2014 was associated with the U.S. residential housing market, and therefore, there is a direct correlation between the demand for our products in this market and new residential housing construction and remodeling activities.
In order to offset some of the impacts of the weakness in the residential housing market over the last several years, we have focused on diversification, strategic acquisitions, and bringing new and innovative products to the market. In addition, we have targeted certain sales efforts towards market segments that are less directly tied to residential new home construction, including the retail fixture, furniture, and countertop markets. As a result, we have seen a shift in our product mix, which has had a positive impact on revenues from the industrial markets. Additionally, we have gained market share and expanded into new geographic territories as a result of investment in new team members with significant product knowledge, relationships, and expertise in the commercial markets.
Recreational Vehicles
The RV industry has been characterized by cycles of growth and contraction in consumer demand, reflecting prevailing general economic conditions, which affect disposable income for leisure time activities. The deeper cycles have been tied to major economic and world events including the Gulf War, the September 11, 2001 terrorist attacks, and the “Great Recession” of 2007-2009. We believe that consumer confidence, the level of disposable income, equity securities market trends, and significant fluctuations in interest rates have an impact on RV sales. Over the past several years, however, we believe there has been a level of resilience in the RV marketplace, where RV buyers appear to have prioritized the purchase of a unit over other discretionary items in an effort to pursue their desired “RV lifestyle”. While concerns about the availability and price of gasoline can have an impact on RV demand, market trends also indicate that the average RV owner travels less distance but with similar frequency during periods of higher gas prices and less availability. Periods of lower gasoline prices can have a positive impact on RV retail purchases, however extended periods of lower fuel prices followed by a sudden increase in prices could have a negative impact on retail RV purchases in the short term while the market adjusts.
Demographic and ownership trends continue to point to favorable market growth in the long-term, both as the number of “baby-boomers” reaching retirement is steadily increasing, and as the RV owning population in the 35-54 year old demographic continues to grow. The U.S. Census Bureau estimates that there are expected to be approximately 10,000 “baby-boomers” reaching age 65 every day through 2029. Additionally, products such as sports-utility RVs and “toy haulers,” with a rear section to store and transport motorcycles, snowmobiles, ATVs, sand rails, and other leisure products, are attractive to younger buyers, and RV manufacturers are also providing an array of product choices, including producing lightweight towables and smaller fuel efficient motorhomes. Green technologies, such as lightweight composite materials, solar panels, and energy-efficient components are also options that can be added to an RV.
Recreational vehicle classifications are based upon standards established by the Recreational Vehicle Industry Association (“RVIA”). The principal types of recreational vehicles include: (1) Towables: conventional travel trailers, folding camping trailers, fifth wheel trailers, and truck campers which are lighter and less expensive than standard gas or diesel powered motorized units, representing a more attractive solution for the cost-conscious buyer; and (2) Motorized: motor homes. Both towable and motorized RV units are distinct from mobile homes, which are manufactured houses designed for permanent and semi-permanent residential dwelling. The Company estimates that its mix of RV revenues related to towable units and motorized units is consistent with the overall RV production mix. In both 2014 and 2013, towable and motorized unit shipments represented approximately 88% and 12%, respectively, of total RV wholesale shipments. Towable unit shipments increased approximately 11% and 10%, respectively, while motorized unit shipments rose approximately 15% and 36% in the comparable periods.
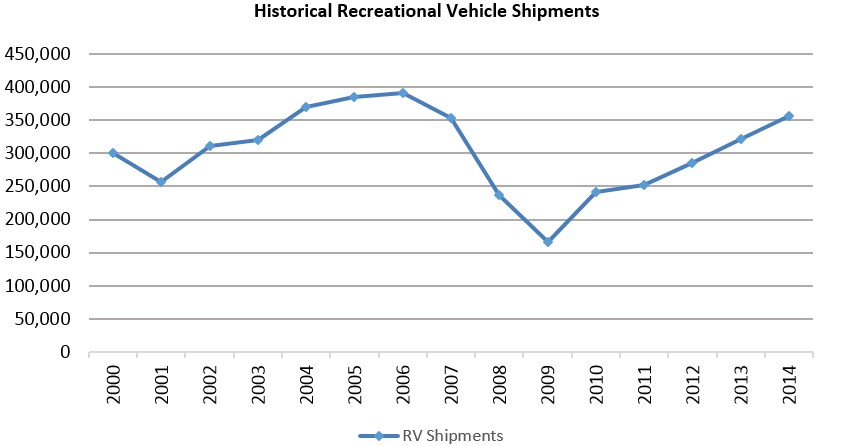
Sales of recreational vehicle products have been cyclical in the past. In the most recent major cycle, wholesale unit shipments in the RV industry declined from an all-time high of 390,500 units in 2006 to 165,700 units in 2009. The RV industry began to improve in the latter half of 2009 and into 2010 with shipment levels in 2010 increasing 46% from those in 2009. Unit shipment levels reached 321,127 units in 2013, which was the first time that shipment levels rose above 300,000 units since 2007. In 2014, shipment levels rose 11% to 356,735 units, resulting in a cumulative gain of approximately 115% since 2009. The RVIA is currently forecasting full year 2015 wholesale unit shipments to increase by approximately 6% compared to the 2014 level.
The following chart reflects historical wholesale unit shipment levels in the RV industry from 2000 through 2014 per RVIA statistics:
Manufactured Housing
Manufactured homes historically have been one of the principal means for first-time homebuyers to overcome the obstacles of large down payments and higher monthly mortgage payments due to the lower cost of construction as compared to site-built homes. Manufactured housing also provides a cost effective alternative for those individuals and families seeking to establish home ownership or whose credit ratings have been impacted by the economic and job environment over the past several years. In addition, manufactured homes are an attractive option for those who have migrated to temporary and multi-family housing alternatives, an attractive entry point for many first-time homebuyers and individuals and families looking to re-enter the homeownership market, or for retirees and others desiring a lifestyle in which home ownership is less burdensome than in the case of site-built homes.
Manufactured homes are constructed to the building standards of the U.S. Department of Housing and Urban Development (“HUD”) and are factory built and transported to a site where they are installed, often permanently. Some manufactured homes have design limitations imposed by the constraints of efficient production and over-the-road transit. Delivery expense limits the effective competitive shipping range of the manufactured homes to approximately 400 to 600 miles. Modular homes, which are built in accordance with state and local building codes, are factory built homes that are built in sections and transported to the site for installation. These homes and many HUD code homes are generally set on a foundation and are subject to land/home-financing terms and conditions.
The MH industry is affected by the availability, cost, and in many cases the credit requirements of alternative housing, such as apartments, town houses, condominiums and site-built housing, including repossessed residential housing inventory levels. From 1998 to 2009, annual industry-wide wholesale unit shipments of manufactured homes declined 87%. The 2009 level of 49,789 wholesale units was at the lowest level in the last 50 years. From the period of 2009-2013, MH unit shipments rose 21%. In 2014, MH unit shipments rose 7% but continued to trend well below historical levels.
Sales growth in the MH industry continues to be limited by the lack of financing alternatives and credit availability, and in certain geographic areas, excess residential housing inventories. While we do not anticipate significant growth in the MH market in 2015, we believe that there is opportunity for moderate growth with limited downside risk in the near-term, and more significant growth in the longer-term assuming improved availability of credit and recalibration of quality credit standards.
Factors that may favorably impact production levels further in this industry include quality credit standards in the residential housing market, favorable changes in financing regulations, higher interest rates on traditional residential housing loans, and improved conditions in the asset-backed securities markets for manufactured housing loans. While there is still some overhang related to the overall economic environment and other conditions mentioned above, we believe that there is also longer term potential for this industry as residential housing demand continues to improve. On average over the last 40 years, approximately three-fourths of total residential housing starts have been single-family housing starts. In addition, wholesale unit shipment levels in the MH industry have averaged approximately 9% to 11% of the level of single-family housing starts over the last 10 years.
The following chart reflects the historical wholesale unit shipment levels in the MH industry from a recent high in 2000 through 2014 per the Manufactured Housing Institute:
Other Markets
Many of our core manufacturing products, including paper/vinyl laminated panels, shelving, drawer-sides, high-pressure laminated panels, solid surface, granite, and quartz countertops, cut to size products, and fiberglass and plastic components are utilized in the kitchen cabinet, office and household furniture, fixtures and commercial furnishings, marine, and other industrial products markets. These markets are generally categorized by a more performance-than-price driven customer base, and provide an opportunity for us to diversify our customer base, while providing increased contribution to our core laminating and fabricating competencies. While the residential furniture markets have been impacted by import pressures, there has been a renewed interest in domestically produced products and the “Made in the USA” label. Additionally, other residential and commercial segments have been less vulnerable to import competition, and therefore provide opportunities for increased sales penetration and market share gains. Over the past three years, the residential housing market in particular has shown signs of improving across the country and that trend is expected to continue in fiscal 2015 resulting in increased demand for our products. Our sales to the industrial market generally lag new housing starts by six to nine months and will vary based on differences in regional economic prospects. We believe that we have the available capacity to increase industrial revenue and benefit from the diversity of multiple market segments, unique regional economies and varied customer strategies.
Marketing and Distribution
Our sales are to RV and MH manufacturers and other industrial products manufacturers. We have over 800 active customers. We have five customers that together accounted for approximately 67% and 66% of our consolidated net sales in 2014 and 2013, respectively. The Company's RV products include consolidated sales to two major manufacturers of RVs who each account for over 10% of consolidated net sales - Forest River, Inc. (a Berkshire Hathaway Company) (“Forest River”) and Thor Industries, Inc. (stock symbol: THO) (“Thor”). Both Forest River and Thor are comprised of various operating subsidiaries and brand names that operate within the parent company. For the years ended December 31, 2014 and 2013, our combined sales to the operating subsidiaries of Forest River and Thor, on a consolidated basis, accounted for 58% and 57% of our consolidated net sales, respectively.
A majority of products for distribution are generally purchased in railcar, container, or truckload quantities, warehoused, and then sold and delivered by us. In addition, approximately 18% and 23% of our distribution segment’s sales were from products shipped directly from the suppliers to our customers in 2014 and 2013, respectively. We typically experience a one to two week delay between issuing our purchase orders and the delivery of products to our warehouses or customers. We generally keep backup supplies of various commodity products in our warehouses to ensure that we have product on hand at all times for our distribution customers. Our customers do not maintain long-term supply contracts, and therefore we must bear the risk of accurate advanced estimation of customer orders. In periods of declining market conditions, customer order rates can decline, resulting in less efficient logistics planning and fulfillment and thus increasing delivery costs due to increased numbers of shipments with fewer products in each shipment. We have no significant backlog of orders.
With the acquisitions completed in 2014 and certain plant consolidations, we operate 16 warehouse and distribution centers and 32 manufacturing operations located in Alabama, Arizona, California, Georgia, Illinois, Indiana, Minnesota, Oregon, Pennsylvania, and Texas. By using these facilities, we are able to minimize our in-transit delivery time and cost to the regional manufacturing plants of our customers.
Patrick does not engage in significant marketing efforts nor does it incur significant marketing or advertising expenditures, other than attendance at certain trade shows and the activities of its sales personnel and the maintenance of customer relationships through price, quality of its products, service and customer satisfaction. In our design showroom located in Elkhart, Indiana, many of our manufactured and distribution products are on display for current and potential customers, their design and purchasing staff, and other key product managers and designers. We believe the design showroom provides additional opportunities to add value for our customers by allowing them to experience our large range of product offerings and related style and content options that we have available, as well as offering in-house custom design services to further differentiate our product lines. In addition, our Company website, www.patrickind.com, has allowed us to expand our Internet presence and further showcase our primary product brands to both existing and potential customers.
Suppliers
During the year ended December 31, 2014, we purchased approximately 52% of our raw materials and distributed products from twenty different suppliers. The five largest suppliers accounted for approximately 28% of our total purchases. We have terms and conditions with certain suppliers that specify exclusivity in certain areas, pricing structures, rebate agreements and other parameters.
Raw materials are primarily commodity products, such as lauan, gypsum, particleboard, other lumber products, resin, and overlays, among other which are available from many suppliers. We do not maintain long-term supply agreements. Our sales in the short-term could be negatively impacted in the event any unforeseen negative circumstances were to affect our major suppliers. We believe that we have a good relationship with all of our suppliers. Alternate sources of supply are available for all of our material purchases.
Regulation and Environmental Quality
The Company’s operations are subject to certain federal, state, and local regulatory requirements relating to the use, storage, discharge and disposal of hazardous chemicals used during their manufacturing processes. Over the past several years, Patrick has taken a proactive role in certifying that the composite wood substrate materials that it uses to produce products for its customers in the RV marketplace have complied with applicable emission standards developed by the California Air Resources Board (“CARB”). All suppliers and manufacturers of composite wood materials are required to comply with the current CARB regulations.
The Company is certified to sell Forestry Stewardship Council (“FSC”) materials to its customers at certain of its manufacturing branches. The FSC certification provides a link between responsible production and consumption of materials from the world’s forests and it assists our customers in making socially and environmentally responsible buying decisions on the products it purchases.
We believe that we are currently operating in compliance with applicable laws and regulations and have made reports and submitted information as required. The Company believes that the expense of compliance with these laws and regulations with respect to environmental quality, as currently in effect, will not have a material adverse effect on its financial condition or competitive position, and will not require any material capital expenditures for plant or equipment modifications.
Seasonality
Manufacturing operations in the RV and MH industries historically have been seasonal and generally had been at the highest levels when the climate is moderate. Accordingly, the Company’s sales and profits had generally been the highest in the second and third quarters. Seasonal industry trends in the past several years have included the impact related to the addition of major RV manufacturer open houses for dealers to the September/October timeframes, whereby dealers are delaying purchases until new product lines are introduced at these shows. This has resulted in seasonal softening in the RV industry beginning in the mid-third quarter and extending through October, and when combined with our increased concentration in the RV industry, led to a seasonal trend pattern in which the Company achieves its strongest sales and profit levels in the first half of the year.
Employees
As of December 31, 2014, we had 2,799 employees, 2,512 of which were engaged directly in production, warehousing, and delivery operations; 81 in sales; and 206 in office and administrative activities, which includes purchasing, inventory and production control, customer service, human resources, accounting, and information technology, among others. There were no manufacturing plants or distribution centers covered by collective bargaining agreements. Patrick continuously reviews benefits and other matters of interest to its employees and considers its relations with its employees to be good.
Executive Officers of the Company
The following table sets forth our executive officers as of December 31, 2014:
|
Name |
Position |
|
Todd M. Cleveland |
President and Chief Executive Officer |
|
Jeffrey M. Rodino |
Executive Vice President of Sales and Chief Operating Officer |
|
Andy L. Nemeth |
Executive Vice President of Finance, Chief Financial Officer, and Secretary-Treasurer |
|
Courtney A. Blosser |
Vice President of Human Resources |
Todd M. Cleveland (age 46) was appointed Chief Executive Officer in February 2009. Mr. Cleveland assumed the position of President and Chief Operating Officer of the Company in May 2008. Prior to that, Mr. Cleveland served as Executive Vice President of Operations and Sales and Chief Operating Officer from August 2007 to May 2008 following the acquisition of Adorn Holdings, Inc. (“Adorn”) by Patrick in May 2007. Mr. Cleveland spent 17 years with Adorn serving as President and Chief Executive Officer since 2004; President and Chief Operating Officer from 1998 to 2004; Vice President of Operations and Chief Operating Officer from 1994 to 1998; and other leadership roles from 1990 to 1994. Mr. Cleveland has over 24 years of manufactured housing, recreational vehicle, and industrial experience in various operating capacities.
Jeffrey M. Rodino (age 44) was appointed Chief Operating Officer of the Company in March 2013. In addition to this role, Mr. Rodino serves as the Executive Vice President of Sales, a position he has held since December 2011. Prior to that, Mr. Rodino served as Vice President of Sales for the Midwest from August 2009 to December 2011 and was elected an Officer in May 2010. Mr. Rodino also served in a variety of top-level sales and marketing roles after joining Patrick in 2007 and held similar key sales positions during his tenure with Adorn from 2001 until May 2007, when Adorn was acquired by Patrick. Mr. Rodino has over 21 years of experience in serving the recreational vehicle, manufactured housing and industrial markets.
Andy L. Nemeth (age 45) was elected Executive Vice President of Finance, Chief Financial Officer, and Secretary-Treasurer in May 2004. Prior to that, Mr. Nemeth was Vice President-Finance, Chief Financial Officer, and Secretary-Treasurer from 2003 to 2004, and Secretary-Treasurer from 2002 to 2003. Mr. Nemeth was a Division Controller from 1996 to 2002 and prior to that, he spent five years in public accounting with Coopers & Lybrand (now PricewaterhouseCoopers). Mr. Nemeth has over 23 years of manufactured housing, recreational vehicle, and industrial experience in various financial capacities.
Courtney A. Blosser (age 48) was appointed Vice President of Human Resources in October 2009 and elected an Officer in May 2010. Prior to that, Mr. Blosser served in executive level human resource leadership roles that included Corporate Director-Human Resources, Whirlpool Corporation from 2008 to 2009, and Vice President-Human Resources, Pfizer Inc. from 1999 to 2008. Mr. Blosser held human resource leadership roles of increasing responsibility with JM Smucker Company from 1989 to 1999. Mr. Blosser has over 26 years of operations and human resource experience in various industries.
Website Access to Company Reports
We make available free of charge through our website, www.patrickind.com, our Annual Report on Form 10-K, quarterly reports on Form 10-Q, current reports on Form 8-K, and all amendments to those reports as soon as reasonably practicable after such material is electronically filed with or furnished to the SEC. The charters of our Audit, Compensation, and Corporate Governance and Nominations Committees, our Corporate Governance Guidelines, our Code of Ethics and Business Conduct, and our Code of Ethics Applicable to Senior Executives are also available on the “Corporate Governance” portion of our website. Our Internet website and the information contained therein or incorporated therein are not intended to be incorporated into this Annual Report on Form
10-K.
Additionally, the public may read or copy any materials we file with the SEC at the SEC's public reference room located at 100 F Street N.E., Washington D.C. 20549. The public may obtain information on the operation of the public reference room by calling the SEC at 1-800-SEC-0330. The SEC maintains an Internet site that contains reports, proxy and information statements, and other information regarding issuers that file electronically with the SEC at www.sec.gov.
|
ITEM 1A. |
RISK FACTORS |
The Company’s consolidated results of operations, financial position and cash flows can be adversely affected by various risks related to its business. These risks include, but are not limited to, the principal factors listed below and the other matters set forth in this Annual Report on Form 10-K. All of these risks should be carefully considered.
Economic and business conditions that are beyond our control, including cyclicality and seasonality, and concerns over the sustainability of the economic recovery, have in the past had a significant adverse impact on our operating results, and could negatively impact our operating results in the future.
The three major markets in which we sell our products, RV, MH and industrial, have been characterized by cycles of growth and contraction in consumer demand, and are dependent upon various factors, including the general level of economic activity, consumer confidence, interest rates, access to financing, inventory and production levels, and the cost and availability of fuel. Economic and demographic factors can cause substantial fluctuations in production, which in turn impact sales and operating results. Consequently, the results for any prior period may not be indicative of results for any future period.
Manufacturing operations in the RV and MH industries historically have been seasonal and are generally at the highest levels when the climate is moderate. However, seasonal industry trends in the past several years have been different from prior years, primarily reflecting volatile economic conditions, fluctuations in RV dealer inventories, changing dealer show schedules, interest rates, access to financing, the cost of fuel, and increased demand from RV dealers. Consequently, future seasonal trends may be different from prior years.
In addition, a macroeconomic downturn has historically adversely affected our operating results and could again in the future. Companies in these markets are subject to volatility in production levels, shipments, sales and operating results due to changes in external factors such as general economic conditions, including credit availability, consumer confidence, employment rates, interest rates, inflation and other economic conditions affecting consumer demand, as well as demographic and political changes. We cannot predict the duration of an economic downturn, the timing or strength of a subsequent economic recovery or the extent to which an economic downturn will continue to negatively impact our business, financial condition and results of operations.
We may incur significant charges or be adversely impacted by the consolidation and/or closure of all or part of a manufacturing or distribution facility.
We periodically assess the cost structure of our operating facilities to distribute and/or manufacture and sell our products in the most efficient manner. Based on our assessments and if required by business conditions, we may make capital investments to move, discontinue manufacturing and/or distribution capabilities, or products and product lines, sell or close all or part of additional manufacturing and/or distribution facilities in the future. These changes could result in significant future charges or disruptions in our operations, and we may not achieve the expected benefits from these changes, which could result in an adverse impact on our operating results, cash flows, and financial condition.
The financial condition of our customers and suppliers may deteriorate as a result of weakening conditions in the economy and competitive conditions in their markets.
The markets we serve historically have been highly sensitive to changes in the economic environment. Weakening conditions in the economy could cause the financial condition of our customers and suppliers to deteriorate, which could negatively affect our business through the loss of sales or the inability to meet our commitments. Many of our customers participate in highly competitive markets and their financial condition may deteriorate as a result. A decline in the financial condition of our customers could hinder our ability to collect amounts owed by customers. In addition, such a decline could result in lower demand for our products and services.
Although we have a large number of customers, our sales are significantly concentrated with two customers, the loss of which could have a material adverse impact on our operating results and financial condition.
Two customers in the RV market accounted for a combined 58% of our consolidated net sales in 2014. The loss of either of these customers could have a material adverse impact on our operating results and financial condition. In addition, we do not have long-term agreements with our customers and cannot predict that we will maintain our current relationships with these customers or that we will continue to supply them at current levels.
A significant percentage of the Company’s sales are concentrated in the RV industry, and declines in the level of RV unit shipments or reductions in industry growth, could adversely impact our sales levels to this industry and our operating results.
In 2014, 74% of our net sales were to the RV industry versus 72% in 2013 and 69% in 2012. The increase in the Company’s sales concentration in the RV industry primarily resulted from an increase in RV wholesale unit shipment levels over the last several years, increased RV market penetration by the Company, and the Company’s completion of several RV-related acquisitions in the 2010 to 2014 period. Future declines in RV unit shipment levels or reductions in industry growth could significantly reduce the Company’s revenue from the RV industry and have a material adverse impact on our operating results in 2015 and other future periods.
The manufactured housing and recreational vehicle industries are highly competitive and some of our competitors may have greater resources than we do.
We operate in a highly competitive business environment and our sales could be negatively impacted by our inability to maintain or increase prices, changes in geographic or product mix, or the decision of our customers to purchase our competitors’ products instead of our products or to produce in-house products that we currently produce. We compete not only with other suppliers to the RV and MH producers but also with suppliers to traditional site-built homebuilders and suppliers of cabinetry. Sales could also be affected by pricing, purchasing, financing, advertising, operational, promotional, or other decisions made by purchasers of our products. Additionally, we cannot control the decisions made by suppliers of our distributed and manufactured products and therefore, our ability to maintain our exclusive and non-exclusive distributor contracts and agreements may be adversely impacted.
The greater financial resources or the lower amount of debt of certain of our competitors may enable them to commit larger amounts of capital in response to changing market conditions. Certain competitors may also have the ability to develop innovative new products that could put the Company at a competitive disadvantage. If we are unable to compete successfully against other manufacturers and suppliers to the RV and MH industries, we could lose customers and sales could decline, or we may not be able to improve or maintain profit margins on sales to customers or be able to continue to compete successfully in our core markets.
The cyclical nature of the domestic housing market has caused our sales and operating results to fluctuate. These fluctuations may continue in the future, which could result in operating losses during downturns.
The U.S. housing industry is cyclical and is influenced by many national and regional economic and demographic factors, including:
|
● |
terms and availability of financing for homebuyers and retailers; |
|
● |
overall consumer confidence and the level of discretionary consumer spending; |
|
● |
interest rates; |
|
● |
population and employment trends; |
|
● |
income levels; |
|
● |
housing demand; and |
|
● |
general economic conditions, including inflation, deflation and recessions. |
The RV and MH industries and the industrial markets can be affected by fluctuations in the residential housing market. As a result of the foregoing factors, our sales and operating results can fluctuate, and we expect that they will continue to fluctuate in the future. Moreover, cyclical and seasonal downturns in the residential housing market may cause us to experience operating losses.
Fuel shortages or high prices for fuel have had, and could continue to have, an adverse impact on our operations.
The products produced by the RV industry typically require gasoline or diesel fuel for their operation, or the use of a vehicle requiring gasoline or diesel fuel for their operation. There can be no assurance that the supply of gasoline and diesel fuel will continue uninterrupted or that the price or tax on fuel will not significantly increase in the future. Shortages of gasoline and diesel fuel have had a significant adverse effect on the demand for recreational vehicles in the past and would be expected to have an adverse effect on demand in the future. Rapid significant increases in fuel prices, as we experienced in recent years, appear to affect the demand for recreational vehicles when gasoline prices reach unusually high levels. Such a reduction in overall demand for recreational vehicles could have a materially adverse impact on our revenues and profitability.
We are dependent on third-party suppliers and manufacturers.
Generally, our raw materials, supplies and energy requirements are obtained from various sources and in the quantities desired. While alternative sources are available, our business is subject to the risk of price increases and periodic delays in delivery. Fluctuations in the prices of these requirements may be driven by the supply/demand relationship for that commodity, governmental regulation, economic conditions in other countries, religious holidays, natural disasters, and other events. In addition, if any of our suppliers seek bankruptcy relief or otherwise cannot continue their business as anticipated, the availability or price of these requirements could be adversely affected.
Increases in demand for our products could make it more difficult for us to obtain additional skilled labor, and available capacity may initially not be utilized efficiently.
In certain geographic regions in which we have manufacturing facilities, we have experienced, and could again experience, shortages of qualified employees. If demand continues to increase, we may not be able to increase production to timely satisfy demand, and may initially incur higher labor and production costs, which could adversely impact our financial condition and operating results.
The increased cost and limited availability of certain raw materials may have a material adverse effect on our business and results of operations.
Prices of certain materials, including gypsum, lauan, particleboard, MDF, aluminum and other commodity products, can be volatile and change dramatically with changes in supply and demand. Certain products are purchased from overseas and their availability is dependent upon climate changes, seasonal and religious holidays, political unrest, economic conditions overseas, natural disasters, vessel shipping schedules and port availability. Further, certain of our commodity product suppliers sometimes operate at or near capacity, resulting in some products having the potential of being put on allocation. We generally have been able to maintain adequate supplies of materials and to pass higher material costs on to our customers in the form of surcharges and base price increases where needed. However, it is not certain future price increases can be passed on to our customers without affecting demand or that limited availability of materials will not impact our production capabilities. Our sales levels and operating results could be negatively impacted by changes in any of these items.
We are subject to governmental and environmental regulations, and failure in our compliance efforts or events beyond our control could result in damages, expenses or liabilities that individually or in the aggregate would have a material adverse effect on our financial condition and results of operations.
Our manufacturing processes involve the use, handling, storage and contracting for recycling or disposal of hazardous or toxic substances or wastes. Accordingly, we are subject to various governmental and environmental regulations regarding these substances. In addition, the implementation of new regulations or amendments to existing regulations could significantly increase the cost of the Company’s products. We currently use materials that we believe comply with government regulations. We cannot presently determine what, if any, legislation may be adopted by Congress or state or local governing bodies, or the effect any such legislation may have on our customers or us. In addition, failure to comply with present or future regulations could result in fines or potential civil or criminal liability. Both scenarios could negatively impact our results of operations or financial condition.
Compliance with conflict minerals disclosure requirements will create additional compliance cost and may create reputational challenges.
The SEC adopted rules pursuant to Section 1502 of the Dodd-Frank Wall Street Reform and Consumer Protection Act setting forth new disclosure requirements concerning the use or potential use of certain minerals, deemed conflict minerals (tantalum, tin, gold and tungsten), that are mined from the Democratic Republic of Congo and adjoining countries. These requirements necessitate due diligence efforts on our part to assess whether such minerals are used in our products in order to make the relevant required annual disclosures. There will be costs associated with complying with these disclosure requirements, including for diligence to determine the sources of conflict minerals used in our products and other potential changes to products, processes or sources of supply because of such verification activities. The implementation of these rules could adversely affect the sourcing, supply and pricing of materials used in our products. As there may be only a limited number of suppliers offering conflict-free minerals, we cannot be sure that we will be able to obtain necessary conflict minerals from such suppliers in sufficient quantities or at competitive prices. We may also face reputational challenges if we determine that certain of our products contain minerals not determined to be conflict free or if we are unable to sufficiently verify the origins for all conflict minerals used in our products through the procedures we may implement.
The inability to attract and retain qualified executive officers and key personnel may adversely affect our operations.
While we include succession planning as part of our ongoing talent development and management process to help ensure the continuity of our business model, the loss of any of our executive officers or other key personnel could reduce our ability to manage our business and strategic plan in the short-term and could cause our sales and operating results to decline. In addition, our future success will depend on, among other factors, our ability to attract and retain executive management, key employees, and other qualified personnel.
Our ability to integrate acquired businesses may adversely affect operations.
As part of our business and strategic plan, we look for strategic acquisitions to provide shareholder value. Any acquisition will require the effective integration of an existing business and its administrative, financial, sales and marketing, manufacturing, and other functions to maximize synergies. Acquired businesses involve a number of risks that may affect our financial performance, including increased leverage, diversion of management resources, assumption of liabilities of the acquired businesses, and possible corporate culture conflicts. If we are unable to successfully integrate these acquisitions, we may not realize the benefits identified in our due diligence process, and our financial results may be negatively impacted. Additionally, significant unexpected liabilities could arise from these acquisitions.
Increased levels of indebtedness may harm our financial condition and results of operations.
As of December 31, 2014, we had approximately $101.1 million of total debt outstanding under our $165 million revolving credit facility (the “2012 Credit Facility”) that was established pursuant to our current credit agreement, as amended (the “2012 Credit Agreement”).
In certain circumstances, an increase in our level of indebtedness could have adverse consequences on our future operations, including making it more difficult for us to meet our payments on outstanding debt and we may not be able to find alternative financing sources to replace our indebtedness in such an event. Furthermore, such increases could (i) reduce the availability of our cash flow to fund working capital, capital expenditures, acquisitions and other general corporate purposes, and limit our ability to obtain additional financing for these purposes; (ii) limit our flexibility in planning for, or reacting to, and increasing our vulnerability to, changes in our business and the industry in which we operate; (iii) place us at a competitive disadvantage compared to our competitors that have less debt or are less leveraged; and (iv) create concerns about our credit quality which could result in the loss of supplier contracts and/or customers.
Our 2012 Credit Agreement contains various financial performance and other covenants. If we do not remain in compliance with these covenants, our 2012 Credit Agreement could be terminated and the amounts outstanding thereunder could become immediately due and payable.
We have debt outstanding that contains financial and non-financial covenants with which we must comply that place restrictions on us. There can be no assurance that we will maintain compliance with the financial covenants under our 2012 Credit Agreement. These covenants require that we comply with a maximum level of a consolidated total leverage ratio and a minimum level of a consolidated interest coverage ratio under the 2012 Credit Agreement, and adhere to annual capital expenditure limitations as defined by our 2012 Credit Agreement. If we fail to comply with the covenants contained in our 2012 Credit Agreement, the lenders could cause our debt to become due and payable prior to maturity or it could result in our having to refinance the indebtedness under unfavorable terms. If our debt were accelerated, our assets might not be sufficient to repay our debt in full and there can be no assurance that we would be able to refinance any or all of this indebtedness.
Due to industry conditions and our operating results, we have had limited access to sources of capital in the past. If we are unable to locate suitable sources of capital when needed, we may be unable to maintain or expand our business.
We depend on our cash balances, our cash flows from operations, and our 2012 Credit Facility to finance our operating requirements, capital expenditures and other needs. If the general recessionary economic conditions that impacted the economy in 2007-2010 should return in the future, production of RVs and manufactured homes could decline, resulting in reduced demand for our products. A decline in our operating results could negatively impact our liquidity. If our cash balances, cash flows from operations, and availability under our 2012 Credit Facility are insufficient to finance our operations and alternative capital is not available, we may not be able to expand our business and make acquisitions, or we may need to curtail or limit our existing operations.
We have letters of credit representing collateral for our casualty insurance programs and for general operating purposes that have been issued under our 2012 Credit Agreement. The inability to retain our current letters of credit, to obtain alternative letter of credit sources, or to retain our 2012 Credit Agreement to support these programs could require us to post cash collateral, reduce the amount of cash available for our operations, or cause us to curtail or limit existing operations.
Increased levels of inventory may adversely affect our profitability.
Our customers generally do not maintain long-term supply contracts and, therefore, we must bear the risk of advanced estimation of customer orders. We maintain an inventory to support these customers’ needs. Changes in demand, market conditions and/or product specifications could result in material obsolescence and a lack of alternative markets for certain of our customer specific products and could negatively impact operating results.
We could incur charges for impairment of assets, including goodwill and other long-lived assets, due to potential declines in the fair value of those assets or a decline in expected profitability of the Company or individual reporting units of the Company.
A portion of our total assets as of December 31, 2014 was comprised of goodwill, amortizable intangible assets, and property, plant and equipment. Under generally accepted accounting principles, each of these assets is subject to periodic review and testing to determine whether the asset is recoverable or realizable. The events or changes that could require us to test our goodwill and intangible assets for impairment include changes in our estimated future cash flows, changes in rates of growth in our industry or in any of our reporting units, and decreases in our stock price and market capitalization.
In the future, if sales demand or market conditions change from those projected by management, asset write-downs may be required. Significant impairment charges, although not always affecting current cash flow, could have a material effect on our operating results and financial position.
A variety of factors could influence fluctuations in the market price for our common stock.
The market price of our common stock could fluctuate in the future in response to a number of factors, including those discussed below. The market price of our common stock has in the past fluctuated and is likely to continue to fluctuate. Some of the factors that may cause the price of our common stock to fluctuate include:
|
● |
variations in our and our competitors’ operating results; | |
|
● |
historically low trading volume; | |
|
● |
high concentration of shares held by institutional investors and in particular our largest shareholder, Tontine Capital (as defined herein); | |
|
● |
announcements by us or our competitors of significant contracts, acquisitions, strategic partnerships, joint ventures or capital commitments; | |
|
● |
the gain or loss of significant customers; | |
|
● |
additions or departures of key personnel; | |
|
● |
events affecting other companies that the market deems comparable to us; | |
|
● |
general conditions in industries in which we operate; | |
|
● |
general conditions in the United States and abroad; | |
|
● |
the presence or absence of short selling of our common stock; | |
|
● |
future sales of our common stock or debt securities; | |
|
● |
announcements by us or our competitors of technological improvements or new products; and | |
|
● |
the sale by Tontine Capital or its announcement of an intention to sell, all or a portion of its equity interests in the Company. |
A significant portion of our common stock is held by Tontine Capital Partners, L.P. and affiliates (collectively, “Tontine Capital”), which has the ability to influence our affairs significantly, including all matters requiring shareholder approval, and whose interests may not be aligned with the interests of our other shareholders. In addition, the ownership of a major portion of our common stock is concentrated in the hands of a few holders.
Based on information contained in a filing by Tontine Capital with the SEC on February 27, 2015, the aggregate number of shares of the Company’s common stock beneficially owned by Tontine Capital was 1,877,680 or 18.3 % of our outstanding common stock.
Tontine Capital has the ability to influence our affairs significantly, including all matters requiring shareholder approval, including the election of our directors, the adoption of amendments to our Articles of Incorporation, the approval of mergers and sales of all or substantially all of our assets, decisions affecting our capital structure and other significant corporate transactions. In addition to its current major interest, pursuant to a Securities Purchase Agreement with Tontine Capital, dated April 10, 2007, if Tontine Capital (i) holds between 7.5% and 14.9% of our common stock then outstanding, Tontine Capital has the right to appoint one nominee to our board; or (ii) holds at least 15% of our common stock then outstanding, Tontine Capital has the right to appoint two nominees to our board. As of February 27, 2015, Tontine Capital has one director on the Company’s board of directors and has not exercised its right to nominate a second director to the board.
The interests of Tontine Capital may not in all cases be aligned with the interests of our other shareholders. The influence of Tontine Capital may also have the effect of deterring hostile takeovers, delaying or preventing changes in control or changes in management, or limiting the ability of our shareholders to approve transactions that they may deem to be in their best interests. In addition, Tontine Capital and its affiliates are in the business of investing in companies and may, from time to time, invest in companies that compete directly or indirectly with us. Tontine Capital and its affiliates may also pursue acquisition opportunities that may be complementary to our business and, as a result, those acquisition opportunities may not be available to us.
The ownership of a major portion of our common stock is concentrated in the hands of Tontine Capital and a few other holders. We are not able to predict whether or when Tontine Capital or other large stockholders will sell or otherwise dispose of additional shares of our common stock. Sales or other dispositions of our common stock by these stockholders could adversely affect prevailing market prices for our common stock.
In filings with the SEC, Tontine Capital has indicated that it may dispose of its equity interests in the Company at any time and from time to time. This public disclosure and any future dispositions of stock by Tontine Capital could adversely affect the market price of our common stock.
In filings with the SEC, Tontine Capital has indicated that it may dispose of its equity interests in the Company at any time and from time to time in the open market, through dispositions in kind to parties holding an ownership interest in Tontine Capital or otherwise. The public disclosure of such possible disposition may adversely affect the market price for our common stock due to the large number of shares involved. In addition, we are not able to predict whether or when Tontine Capital will dispose of its stock. Any such future disposition of stock by Tontine Capital may also adversely affect the market price of our common stock.
We are required to evaluate our internal controls over financial reporting under Section 404 of the Sarbanes-Oxley Act of 2002 and any adverse results from such evaluation could result in a loss of investor confidence in our financial reports and could have an adverse effect on our stock price.
Pursuant to Section 404 of the Sarbanes-Oxley Act of 2002, we are required to furnish a report by our management on our internal control over financial reporting. Such report contains, among other matters, an assessment of the effectiveness of our internal control over financial reporting as of the end of our fiscal year, including a statement as to whether or not our internal control over financial reporting is effective. This assessment must include disclosure of any material weaknesses in our internal control over financial reporting identified by management. Each year we must prepare or update the process documentation and perform the evaluation needed to comply with Section 404. During this process, if our management identifies one or more material weaknesses in our internal control over financial reporting, we will be unable to assert that such internal control is effective. Ensuring that we have adequate internal financial and accounting controls and procedures in place is a costly and time-consuming effort that needs to be re-evaluated frequently. We and our independent auditors may in the future discover areas of our internal controls that need further attention and improvement, particularly with respect to any businesses that we decide to acquire in the future. Any failure to implement required new or improved controls, or difficulties encountered in their implementation, could harm our operating results or cause us to fail to meet our reporting obligations. Investor perception that our internal controls are inadequate or that we are unable to produce accurate financial statements on a timely, consistent basis may adversely affect our stock price. Failure to comply with Section 404 could also potentially subject us to sanctions or investigations by the SEC, NASDAQ, or other regulatory authorities.
Certain provisions in our Articles of Incorporation and Amended and Restated By-laws may delay, defer or prevent a change in control that our shareholders each might consider to be in their best interest.
Our Articles of Incorporation and Amended and Restated By-laws contain provisions that are intended to deter coercive takeover practices and inadequate takeover bids by making them unacceptably expensive to the raider, and to encourage prospective acquirers to negotiate with our board of directors rather than to attempt a hostile takeover.
We have in place a Rights Agreement, which permits under certain circumstances each holder of common stock, other than potential acquirers, to purchase one one-hundredth of a share of a newly created series of our preferred stock at a purchase price of $30 or to acquire additional shares of our common stock at 50% of the current market price. The rights are not exercisable or transferable until a person or group acquires 20% or more of our outstanding common stock, except with respect to Tontine Capital and its affiliates and associates, which are exempt from the provisions of the Rights Agreement pursuant to an amendment signed on March 12, 2008. The effects of the Rights Agreement would be to discourage a stockholder from attempting to take over our company without negotiating with our Board of Directors.
Conditions within the insurance markets could impact our ability to negotiate favorable terms and conditions for various liability coverage and could potentially result in uninsured losses.
We generally negotiate our insurance contracts annually for property, casualty, workers compensation, general liability, health insurance, and directors and officers liability coverage. Due to conditions within these insurance markets and other factors beyond our control, future coverage limits, terms and conditions and the amount of the related premiums could have a negative impact on our operating results. While we continually measure the risk/reward of policy limits and coverage, the lack of coverage in certain circumstances could result in potential uninsured losses.
|
ITEM 1B. |
UNRESOLVED STAFF COMMENTS |
None.
|
ITEM 2. |
PROPERTIES |
As of December 31, 2014, the Company owned approximately 1,756,700 square feet of manufacturing and distribution facilities and leased approximately 1,457,700 square feet as listed below.
|
Location |
Use (1) |
Area Sq. Ft. |
Ownership or Lease Arrangement |
|
Elkhart, IN |
Distribution |
107,000 |
Owned |
|
Elkhart, IN |
Manufacturing |
182,000 |
Owned |
|
Elkhart, IN |
Administrative Offices |
35,000 |
Owned |
|
Elkhart, IN |
Manufacturing |
211,300 |
Leased to 2015 |
|
Elkhart, IN |
Manufacturing |
198,000 |
Leased to 2018 |
|
Elkhart, IN |
Distribution |
175,000 |
Owned |
|
Elkhart, IN |
Distribution |
85,000 |
Leased to 2016 |
|
Elkhart, IN |
Distribution |
96,700 |
Leased (2) |
|
Elkhart, IN |
Distribution |
72,000 |
Owned |
|
Elkhart, IN |
Design Center |
3,200 |
Leased to 2015 |
|
Elkhart, IN |
Manufacturing |
64,500 |
Owned |
|
Elkhart, IN |
Manufacturing |
59,400 |
Owned |
|
Elkhart, IN |
Manufacturing |
25,000 |
Owned |
|
Elkhart, IN |
Manufacturing |
26,000 |
Leased to 2017 |
|
Bremen, IN |
Manufacturing |
88,600 |
Owned |
|
Bremen, IN |
Manufacturing |
16,000 |
Leased to 2018 |
|
Bremen, IN |
Manufacturing |
12,000 |
Leased to 2018 |
|
Bremen, IN |
Manufacturing |
162,000 |
Owned |
|
Goshen, IN |
Distribution |
53,000 |
Leased to 2019 |
|
Goshen, IN |
Manufacturing |
40,000 |
Leased to 2019 |
|
Goshen, IN |
Manufacturing |
20,400 |
Leased to 2019 |
|
Goshen, IN |
Manufacturing |
24,600 |
Leased to 2019 |
|
Goshen, IN |
Manufacturing |
16,000 |
Leased to 2019 |
|
Goshen, IN |
Manufacturing |
32,800 |
Leased to 2019 |
|
Goshen, IN |
Distribution |
52,500 |
Leased to 2017 |
|
Ligonier, IN |
Manufacturing |
120,000 |
Leased to 2015 |
|
Ligonier, IN |
Manufacturing |
37,500 |
Leased to 2016 |
|
Middlebury, IN |
Manufacturing |
134,000 |
Owned |
|
Syracuse, IN |
Manufacturing |
142,600 |
Owned |
|
Syracuse, IN |
Manufacturing |
72,000 |
Leased to 2015 |
|
Warsaw, IN |
Manufacturing |
75,000 |
Leased to 2016 |
|
Warsaw, IN |
Manufacturing |
40,000 |
Leased to 2016 |
|
Decatur, AL |
Manufacturing & Distribution |
94,000 |
Owned |
|
Tolleson, AZ |
Manufacturing |
22,600 |
Leased to 2017 |
|
Fontana, CA |
Manufacturing & Distribution |
72,500 |
Leased to 2015 |
|
Valdosta, GA |
Distribution |
31,000 |
Owned |
|
Bensenville, IL |
Manufacturing |
54,400 |
Leased to 2018 |
|
Tualatin, OR |
Manufacturing |
46,200 |
Leased to 2015 |
|
Tualatin, OR |
Distribution |
30,000 |
Leased to 2015 |
|
Mt. Joy, PA |
Manufacturing & Distribution |
89,000 |
Owned |
|
Waco, TX |
Manufacturing & Distribution |
132,600 |
Owned |
|
New London, NC |
163,000 |
Owned (3) |
|
(1) |
Certain facilities may contain multiple manufacturing or distribution centers. |
|
(2) |
Leased on a month-to-month basis. | |
| (3) | Represents an owned building, formerly used for manufacturing and distribution that is currently leased to a third party on a month-to-month basis. |
Pursuant to the terms of the Company’s 2012 Credit Agreement, all of its owned facilities are subject to a mortgage and security interest. In addition, we utilize one contract warehouse located in Minnesota that houses certain of our distribution products inventory. Remuneration to the third party owner of this facility consists of a percentage of sales to our customers from this facility in exchange for storage space and delivery services.
Lease Expirations
We believe the facilities we occupy as of December 31, 2014 are adequate for the purposes for which they are currently being used and are well-maintained. We may, as part of our strategic operating plan, further consolidate and/or close certain owned facilities and, may not renew leases on property with near-term lease expirations. Use of our manufacturing facilities may vary with seasonal, economic, and other business conditions.
|
item 3. |
LEGAL PROCEEDINGS |
We are subject to claims and lawsuits in the ordinary course of business. In managements’ opinion, currently pending legal proceedings and claims against the Company will not, individually or in the aggregate, have a material adverse effect on our financial condition, results of operations, or cash flows.
|
ITEM 4. |
MINE SAFETY DISCLOSURES |
Not applicable.
PART II
|
ITEM 5. |
MARKET FOR REGISTRANT’S COMMON EQUITY, RELATED STOCKHOLDER MATTERS, AND ISSUER PURCHASES OF EQUITY SECURITIES |
Market Information
Our common stock is listed on The NASDAQ Global Stock MarketSM under the symbol PATK. The high and low trade prices per share of the Company’s common stock as reported on NASDAQ for each quarterly period during 2014 and 2013 were as follows:
|
1st Quarter |
2nd Quarter |
3rd Quarter |
4th Quarter | |
|
2014 |
$ 45.80 - $ 28.29 |
$ 45.85 - $ 37.32 |
$ 48.10 - $ 39.33 |
$ 47.17 - $ 34.74 |
|
2013 |
$ 17.36 - $ 10.78 |
$ 22.77 - $ 13.72 |
$ 31.30 - $ 20.69 |
$ 34.22 - $ 26.74 |
The quotations represent prices between dealers, do not include retail mark-ups, mark-downs, or commissions, and may not necessarily represent actual transactions.
Holders of Common Stock
As of February 27, 2015, we had approximately 300 shareholders of record in addition to beneficial owners of shares held in broker and nominee names.
Dividends
The Company did not pay cash dividends in 2014. Any future determination to pay cash dividends will be made by the Board of Directors in light of the Company’s earnings, financial position, capital requirements, and restrictions under the Company’s 2012 Credit Agreement, and such other factors as the Board of Directors deems relevant.
Purchases of Equity Securities by the Issuer or Affiliated Purchasers
(c) Issuer Purchases of Equity Securities
|
Period |
Total Number of Shares Purchased |
Average Price Paid Per Share (1) |
Total Number of Shares Purchased as Part of Publicly Announced Plans or Programs |
Maximum Dollar Value of Shares that May Yet Be Purchased Under the Plans or Programs (1) (2) |
||||||||||||
|
Sept. 29-Oct. 26, 2014 |
124,078 | $ | 39.72 | 124,078 | $ | 8,143,764 | ||||||||||
|
Oct. 27-Nov. 30, 2014 |
6,700 | 44.42 | 6,700 | 7,846,180 | ||||||||||||
|
Dec. 1-Dec. 31, 2014 |
41,243 | 43.01 | 41,243 | 6,072,142 | ||||||||||||
|
Total |
172,021 | 40.69 | 172,021 | |||||||||||||
|
(1) |
Includes commissions paid to repurchase shares as part of a publicly announced plan or program. |
|
(2) |
In February 2013, the Board authorized a stock repurchase program for purchasing up to $10.0 million of the Company’s common stock over the following 12 months. The timing and amount of purchases under the program will be determined by management based upon market conditions and other factors. In February 2014, the Board authorized an increase in the amount of the Company’s stock that may be acquired under the existing stock repurchase program over the next 12 months to $20.0 million, including the remaining amount available under the previous authorization. |
During 2013, the Company repurchased 407,330 shares at an average price of $14.92 for a total cost of $6.1 million.
In the fourth quarter of 2014, the Company repurchased 172,021 shares at an average price of $40.69 per share for a total cost of $7.0 million. In the full year 2014, the Company repurchased 344,750 shares at an average price of $40.40 per share for a total cost of $13.9 million.
On February 17, 2015, the Board authorized an increase in the amount of the Company’s stock that may be acquired under the stock buyback program over the next 12 months to $20.0 million, including the remaining amount available under the previous authorization.
In addition, in the first quarter of 2015 through February 27, 2015, the Company repurchased 130,500 shares, including 100,000 shares purchased from a major stockholder in a privately negotiated transaction, at an average price of $43.29 per share for a total cost of $5.7 million. Since the inception of the stock repurchase program in February 2013 through February 27, 2015, the Company repurchased, in the aggregate, 882,580 shares at an average price of $29.07 per share for a total cost of $25.7 million.
Stock Performance Graph
The following graph compares the cumulative 5-year total return to shareholders of the Company’s common stock relative to the cumulative total returns of the Russell 2000 index and a customized peer group of companies, which includes Arctic CAT Inc., Brunswick Corporation, Cavco Industries, Inc., Drew Industries Incorporated, Spartan Motors, Inc., Thor Industries, Inc., Trimas Corporation and Winnebago Industries, Inc. This graph assumes an initial investment of $100 (with reinvestment of all dividends) is assumed to have been made in our common stock, in the index and in the peer group on December 31, 2009 and its relative performance is tracked through December 31, 2014.
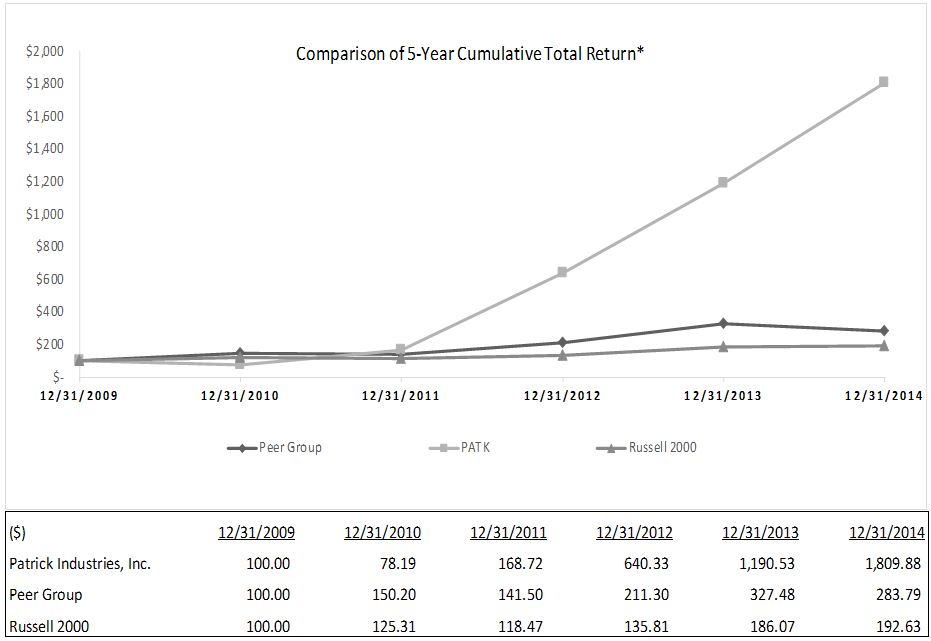
*The stock price performance included in this graph is not necessarily indicative of future stock price performance.
|
ITEM 6. |
SELECTED FINANCIAL DATA |
The following table summarizes certain selected historical financial and operating information of the Company for the five years ended December 31, 2014 and is derived from the Company’s Consolidated Financial Statements. Historical financial data may not be indicative of the Company’s future performance. The information set forth below should be read in conjunction with “Management’s Discussion and Analysis of Financial Condition and Results of Operations” and the Consolidated Financial Statements and Notes thereto included in Item 7 and Item 8 of this Report, respectively.
|
As of or for the Year Ended December 31 |
||||||||||||||||||||
|
2014 |
2013 |
2012 |
2011 |
2010 |
||||||||||||||||
|
(thousands except per share amounts) |
||||||||||||||||||||
|
Operating Data: |
||||||||||||||||||||
|
Net sales |
$ | 735,717 | $ | 594,931 | $ | 437,367 | $ | 307,822 | $ | 278,232 | ||||||||||
|
Gross profit |
118,503 | 91,023 | 65,744 | 44,308 | 29,638 | |||||||||||||||
|
Operating income |
51,471 | 40,945 | 27,040 | 13,475 | 6,406 | |||||||||||||||
|
Net income |
30,674 | 24,040 | 28,095 | 8,470 | 1,226 | |||||||||||||||
|
Basic net income per common share |
$ | 2.88 | $ | 2.24 | $ | 2.66 | $ | 0.87 | $ | 0.13 | ||||||||||
|
Diluted net income per common share |
$ | 2.87 | $ | 2.23 | $ | 2.64 | $ | 0.83 | $ | 0.12 | ||||||||||
|
Weighted average shares outstanding: |
||||||||||||||||||||
|
Basic |
10,634 | 10,733 | 10,558 | 9,757 | 9,351 | |||||||||||||||
|
Diluted |
10,693 | 10,786 | 10,637 | 10,156 | 9,863 | |||||||||||||||
|
Financial Data: |
||||||||||||||||||||
|
Total assets |
$ | 255,561 | $ | 174,187 | $ | 143,469 | $ | 85,770 | $ | 74,817 | ||||||||||
|
Total debt |
101,054 | 55,000 | 49,716 | 32,954 | 36,233 | |||||||||||||||
|
Shareholders' equity |
102,768 | 82,310 | 61,408 | 28,842 | 18,136 | |||||||||||||||
|
ITEM 7. |
MANAGEMENT’S DISCUSSION AND ANALYSIS OF FINANCIAL CONDITION AND RESULTS OF OPERATIONS |
This Management’s Discussion and Analysis of Financial Condition and Results of Operations (“MD&A”) should be read in conjunction with the Company’s Consolidated Financial Statements and Notes thereto included in Item 8 of this Report. In addition, this MD&A contains certain statements relating to future results that are forward-looking statements as that term is defined in the Private Securities Litigation Reform Act of 1995. See “Information Concerning Forward-Looking Statements” on page 3 of this Report.
This MD&A is divided into six major sections. The outline for our MD&A is as follows:
EXECUTIVE SUMMARY
Company Overview and Business Segments
Overview of Markets and Related Industry Performance
Acquisitions
Summary of 2014 Financial Results
2014 Initiatives and Challenges
Fiscal Year 2015 Outlook
CONSOLIDATED OPERATING RESULTS
Year Ended December 31, 2014 Compared to 2013
Year Ended December 31, 2013 Compared to 2012
BUSINESS SEGMENTS
Year Ended December 31, 2014 Compared to 2013
Year Ended December 31, 2013 Compared to 2012
LIQUIDITY AND CAPITAL RESOURCES
Cash Flows
Capital Resources
Summary of Liquidity and Capital Resources
Contractual Obligations
Off-Balance Sheet Arrangements
CRITICAL ACCOUNTING POLICIES
OTHER
Sale of Property
Purchase of Property
Inflation
EXECUTIVE SUMMARY
Company Overview and Business Segments
Patrick is a major manufacturer of component products and distributor of building products serving the recreational vehicle (“RV”) and manufactured housing (“MH”) industries, and certain other industrial markets, such as kitchen cabinet, office and household furniture, fixtures and commercial furnishings, marine and other industrial markets and operates coast-to-coast through locations in 10 states. Patrick's major manufactured products include decorative vinyl and paper laminated panels, fabricated aluminum products, wrapped vinyl, paper and hardwood profile mouldings, solid surface, granite and quartz countertops, cabinet doors and components, hardwood furniture, fiberglass bath and shower fixtures, fiberglass marine helms, front and rear caps for RVs, and plastic components, slide-out trim and fascia, interior passage doors, exterior graphics and RV painting, simulated wood and stone products, and slotwall panels and components, among others. The Company also distributes pre-finished wall and ceiling panels, drywall and drywall finishing products, electronics, wiring, electrical and plumbing products, cement siding, fiber reinforced polyester (“FRP”) products, interior passage doors, roofing products, laminate and ceramic flooring, shower doors, furniture, fireplaces and surrounds, interior and exterior lighting products, and other miscellaneous products. The Company has two reportable business segments: Manufacturing and Distribution, which contributed approximately 75% and 25%, respectively, to 2014 net sales.
Overview of Markets and Related Industry Performance
Fiscal 2014 reflected a continuation of solid growth in the RV market, which includes growth in both towable and motorized units, and improving conditions in the industrial markets, as evidenced by year over year growth in new housing starts. In addition, the MH market continued to reflect modest improvement with growth at a rate generally consistent with recent years. Overall, we have continued to capture market share through our strategic acquisitions, line extensions, and new product initiatives, which resulted in our 2014 sales levels increasing beyond the general industry results. While there remains general uncertainty related to the stability of the continued overall economic recovery, as well as the domestic political environment and volatility in international markets, the three primary markets that we serve have experienced steady growth in 2014, which we expect to continue into 2015. We are seeing resilience, in particular in the RV market, with what we believe to be upside potential in the immediate future based on current indicators including positive traffic on dealer retail lots, retail sales and wholesale shipment statistics trending similar to recent years, and overall balance related to dealer inventory levels when compared to original equipment manufacturer (“OEM”) production levels.
RV Industry
The RV industry, which is our primary market and comprised 74% of the Company’s 2014 sales, continued to strengthen as evidenced by higher retail sales activity, production levels, and wholesale unit shipments versus the prior year. According to the Recreational Vehicle Industry Association (“RVIA”), shipment levels reached 356,735 units in 2014, representing an increase of approximately 11% versus the prior year period, and resulted in 20 out of 21 quarter-over-quarter increases in shipments. Towable unit shipments increased 11% and motorized units increased 15% when compared to 2013.
We believe continued growth in 2015 in industry-wide retail sales and the related production levels of RVs will be dependent on the overall perception of the economy, consumer confidence levels, the domestic political and governmental environment, and equity securities market trends. On a macroeconomic level, as consumer confidence has improved over the last five years, there have been year-over-year increases in RV shipments for the same time period. We anticipate that this industry growth will continue into 2015, barring any global, political or other factors that negatively impact consumer confidence for an extended period of time. In addition, while increasing or sustained high levels of fuel prices have the potential to negatively impact RV retail unit sales in the short-term, we believe that the RV market has a “lifestyle” component to it that will continue to drive a solid base shipment level regardless of fuel price fluctuations. The correlation between the indicators mentioned above, as well as favorable demographic trends, leads us to believe that the RV industry has a positive longer-term outlook as overall economic conditions and consumer confidence continue to improve. We are anticipating steady growth in this market and further believe that RV dealers have the capacity to carry the additional inventory necessary to support this growth, which would maintain an overall balance in the industry from OEM wholesale shipments to dealer inventory levels to retail sales at this time. Additionally, the acquisitions we completed in recent years were primarily RV market-based, and contributed to an increase in our RV market sales concentration in both 2013 and 2014 when compared to earlier periods.
Although some consumers remain cautious when deciding whether to purchase discretionary items, such as RVs, long-term demographic trends favor RV industry growth fueled by the anticipated positive impact that aging baby boomers and the increasing number of buyers in the 35-54 year old age category are expected to have on the industry. In particular, lifestyle trends continue to spur demand for RVs, and RV manufacturers in response have sized their products to provide a mix of space, amenities, and price to fit a wide range of budget levels to fit the consumer base.
MH Industry
Sales growth in the MH industry, which represented approximately 15% of the Company’s 2014 sales, continues to be constrained by the lack of financing alternatives and credit availability, and in certain geographic areas, excess residential housing inventories. According to industry sources, wholesale unit shipments, which continue to trend well below historical levels, increased approximately 7% from 2013. While we do not anticipate significant growth in the MH market, we believe that demand has reached the bottom of the cycle and there is opportunity for moderate growth, with limited downside risk in the near-term assuming the availability of credit and recalibration of quality credit standards. Manufactured homes are a lower cost alternative to “stick-built” homes and an attractive entry point for many first-time homebuyers, and individuals and families looking to re-enter the home-ownership market, or whose credit ratings have been impacted by the economic and job environment over the past several years. We also believe manufactured housing to be an attractive option for those who have migrated to temporary and multi-family housing alternatives.
Factors that may favorably impact production levels further in this industry include quality credit standards in the residential housing market, favorable changes in financing laws, higher interest rates on traditional residential housing loans, and improved conditions in the asset-backed securities markets for manufactured housing loans. While there is still overhang related to the factors mentioned above, we believe that there is also longer term potential for this industry as residential housing demand recovers. On average over the last 40 years, approximately three-fourths of total residential housing starts have been single-family housing starts. In addition, wholesale unit shipment levels in the MH industry have averaged approximately 9% to 11% of the level of single-family housing starts over the last 10 years.
While we expect an increase in production levels in the MH industry in 2015, wholesale unit shipments in this industry continue to be well below the levels seen during the period of 2003 through 2007 that averaged approximately 124,400 units.
Industrial Market
The industrial market, which comprises primarily the kitchen cabinet industry, retail and commercial fixture market, household and office furniture market, and regional distributors, is primarily impacted by macroeconomic conditions, and more specifically, conditions in the residential housing market. The industrial market sector, which accounted for approximately 11% of the Company’s 2014 sales, saw new housing starts for 2014 increase by approximately 9% from 2013 (as reported by the U.S. Department of Commerce). We estimate approximately 56% of our industrial revenue base is directly tied to the residential housing market with the remaining 44% in the retail and commercial markets, mainly in the office, medical and institutional furnishings markets. We believe there is a direct correlation between the demand for our products in the residential housing market and new residential housing construction and remodeling activities. Our sales to this market generally lag new residential housing starts by six to nine months.
In order to offset some of the impacts of the weakness in the residential housing market in recent years, we have focused on diversification efforts, strategic acquisitions, and increased penetration into the commercial and multi-family housing markets with the addition of new sales territories and personnel. Additionally, we have targeted certain sales efforts towards market segments that are less directly tied to new single and multi-family home construction, including the marine, retail fixture, office, furniture, and countertop markets. As a result, we have seen a shift in our product mix, which has had a positive impact on revenues from the industrial markets.
We believe that projected continued low interest rates, overall expected economic improvement and pent up demand remain some of the drivers that will positively impact the housing industry for the next several years. The National Association of Home Builders (“NAHB”) (as of February 27, 2015) is forecasting an 11% increase in new housing starts in 2015 compared to 2014.
Raw Material Commodity Pricing
Based on the anticipated improvement and increased demand in 2014 in all three of the primary markets we serve, we are also expecting the cost of our raw materials in certain commodities to increase as well. Conversely, the recent decline in fuel prices is expected to result in price declines on certain petroleum based input costs, which are expected to be passed on to customers in certain areas and product lines. Historically, higher energy costs, the impact of natural disasters in various areas of the world, and increased demand in certain market sectors have driven up the costs of certain raw materials in the past and the Company continues to explore alternative sources of raw materials and components, both domestically and from overseas. Due to the volatile nature of pricing in the commodity markets, we generally pass both price increases and decreases through to our customer base.
Acquisitions
In 2014, the Company completed four acquisitions, all of which provided the opportunity for the Company to increase its product offerings, market share and per unit content primarily in the RV market:
|
● |
Four related companies based in Bremen, Indiana and Elkhart, Indiana: Precision Painting, Inc., Carrera Custom Painting, Inc., Millennium Paint, Inc., and TDM Transport, Inc. (collectively referred to as “Precision Painting Group” or “Precision”), for a net purchase price of $16.0 million. This acquisition provided the opportunity for the Company to establish a presence in the RV exterior full body painting market. |
|
● |
Foremost Fabricators, LLC (“Foremost”), a Goshen, Indiana-based fabricator and distributor of fabricated aluminum products, FRP sheet and coil, and custom laminated products primarily used in the RV market, for a net purchase price of $45.4 million. This acquisition provided the opportunity for the Company to establish a presence in the laminated and fabricated roll formed aluminum products market. |
|
● |
PolyDyn3, LLC (“PolyDyn3”), an Elkhart, Indiana-based custom fabricator of simulated wood and stone products such as headboards, fireplaces, ceiling medallions, columns and trims, for the RV market, for a net purchase price of $1.3 million. This acquisition provided the opportunity for the Company to bring in-house new production capabilities and product lines that were previously represented through one of the Company’s distribution business units. |
|
● |
Charleston Corporation (“Charleston”), a Bremen, Indiana-based manufacturer of fiberglass and plastic components primarily used in the RV, marine, and vehicle aftermarket industries, for a net purchase price of $9.5 million. This acquisition provided the opportunity for the Company to further expand its presence in the fiberglass components market. |
These 2014 acquisitions, combined with the 2013 acquisitions of Frontline Mfg., Inc. (“Frontline”), Premier Concepts, Inc. (“Premier”) and John H. McDonald Co., Inc. d/b/a West Side Furniture (“West Side”), and the 2012 acquisitions of Décor Mfg., LLC (“Décor”), Gustafson Lighting (“Gustafson”), Creative Wood Designs, Inc. (“Creative Wood”) and Middlebury Hardwood Products, Inc. (“Middlebury Hardwoods”), contributed to an increase in our RV market sales concentration in both 2014 and 2013 compared to earlier periods.
In addition, in February 2015, the Company acquired the business and certain assets of Better Way Partners, LLC d/b/a Better Way Products (“Better Way”) with operating facilities located in New Paris, Bremen and Syracuse, Indiana, for a net purchase price of approximately $40.0 million. Better Way is a manufacturer of fiberglass components primarily used in the RV, marine and transit vehicle markets.
Summary of 2014 Financial Results
Below is a summary of our 2014 financial results. Additional detailed discussions are provided elsewhere in this MD&A and in the Notes to the Consolidated Financial Statements.
|
● |
Net sales increased $140.8 million or 23.7% in 2014 to $735.7 million, compared to $594.9 million in 2013 primarily reflecting: (i) increased year over year shipments in the RV and MH industries as well as improved residential housing starts which represent the three primary markets the Company serves; (ii) the incremental impact of acquisitions completed during 2013 and 2014, including related market share growth; (iii) improved residential cabinet and office, medical and institutional furnishings sales in the industrial market; and (iv) increased market penetration in the RV market. Wholesale unit shipments in the RV and MH industries increased 11% and 7%, respectively, in 2014 compared to the prior year. New housing starts increased 9% for 2014 compared to the prior year. Excluding the revenue contributions of the 2013 and 2014 acquisitions, our organic growth for the full year 2014 was approximately 11%. |
|
● |
Gross profit increased $27.5 million to $118.5 million, or 16.1% of net sales in 2014, compared with gross profit of $91.0 million or 15.3% of net sales in 2013. Gross profit was positively impacted by higher sales levels relative to our overall fixed overhead costs, new higher margin product lines, organic revenue growth, and the acquisition-related revenue growth noted above. |
|
● |
Operating income increased $10.5 million to $51.5 million in 2014, compared to $41.0 million in 2013. Operating income in 2014 was positively impacted by the factors described above. |
|
● |
Net income was $30.7 million or $2.87 per diluted share in 2014, compared to $24.0 million or $2.23 per diluted share for 2013. The major factors that influenced net income for both periods are described above. |
2014 Initiatives and Challenges
In fiscal year 2014, our primary focus was on gaining market share through the introduction of new products to the marketplace and the execution of strategic acquisitions, maximizing operating efficiencies, managing and developing our talent pool, and further embedding our ‘Customer 1st’ performance oriented culture.
Specific execution items included the following:
|
● |
Invested approximately $72 million in four acquisitions during 2014 – Precision Painting Group (which consisted of four related companies), Foremost, PolyDyn3 and Charleston. These four acquisitions had estimated full year 2014 revenues, in the aggregate, of approximately $126 million, of which approximately $56 million was included in our full year 2014 operating results from the date of acquisition. |
|
● |
Reinvested approximately $6.5 million through capital expenditures, which included the ongoing project to replace our Enterprise Resource Planning (“ERP”) system, the replacement and upgrading of existing production equipment at several of our manufacturing operations, and strategic capital and maintenance expenditures. |
|
● |
Introduced over 60 new products to the market including line extensions. |
|
● |
Increased our market penetration by adjusting our focus to drive increased residential cabinet and office, medical, and institutional furnishings content as evidenced by a 16% year-over-year sales increase in the industrial market. |
|
● |
Increased our RV content per unit (based on a trailing twelve-month basis) to $1,536 in 2014 from $1,338 in 2013. |
|
● |
Increased our MH content per unit (based on a trailing twelve-month basis) to $1,692 in 2014 from $1,582 in 2013. |
Fiscal Year 2015 Outlook
The three primary markets that we serve experienced steady growth in 2014, which we expect to continue into 2015. The RVIA currently forecasts that RV unit shipment levels in 2015 will increase approximately 6% when compared to the full year 2014. In addition, we anticipate a further increase in production levels in the MH industry in 2015, reflecting improvement in the overall economy and consistent with the improvement in single-family residential housing starts. Based on the industry’s current annualized run rates, the Company projects wholesale MH unit shipments for full year 2015 to increase by approximately 10% compared to 2014. The NAHB (as of February 27, 2015) is currently forecasting an 11% year-over-year increase in new housing starts in 2015 compared to the prior year.
We believe we are well-positioned to increase revenues in all of the markets that we serve as the overall economic environment continues to improve. While our visibility related to longer-term industry conditions is limited to approximately six months, we expect to continue to see year over year revenue growth for fiscal year 2015, exclusive of the revenue contributions of the acquisitions completed in 2014.
We will continue to review our operations on a regular basis, balance appropriate risks and opportunities, and maximize efficiencies to support the Company’s long-term strategic growth goals. Our team remains focused on strategic acquisitions, capturing market share and increasing our per unit content, keeping costs aligned with revenue, maximizing operating efficiencies, talent management, and the execution of our organizational strategic agenda. Key focus areas for 2015 include strategic revenue growth, improved operating income and net income, earnings per share, earnings before interest, taxes, depreciation, and amortization (“EBITDA”), and free cash flow. Additional focus areas include:
| ● | Sales into additional commercial/institutional markets to diversify revenue base; | |
| ● | Further improvement of operating efficiencies in all manufacturing operations and corporate functions; | |
| ● | Acquisition of businesses/product lines that meet established criteria; | |
|
● |
Balance aggressive management of inventory quantities and pricing with the need to meet expected customer demand growth, as well as the addition of select key commodity suppliers; and | |
| ● | Ongoing development of existing product lines and the addition of new product lines. |
In conjunction with our organizational strategic agenda, we will continue to make targeted capital investments to support new business and leverage our operating platform, and we will continue to work towards our goal of fully integrating sales efforts to strengthen and broaden customer relationships and meet customer demands with the highest quality service and the goal of continually exceeding our customers’ expectations. In 2014, capital expenditures were approximately $6.5 million versus $8.7 million in 2013. The current capital plan for full year 2015 includes expenditures approximating up to $8.0 million, and includes the ongoing replacement of our ERP system, equipment upgrades to ensure that our facilities have the capacity, capabilities and technology to facilitate our growth plans, and other strategic capital and maintenance improvements.
CONSOLIDATED OPERATING RESULTS
Year Ended December 31, 2014 Compared to 2013
The following table sets forth the percentage relationship to net sales of certain items on the Company’s consolidated statements of income for the years ended December 31, 2014, 2013 and 2012.
|
Year Ended December 31, |
||||||||||||
|
2014 |
2013 |
2012 |
||||||||||
|
Net sales |
100.0 | % | 100.0 | % | 100.0 | % | ||||||
|
Cost of goods sold |
83.9 | 84.7 | 85.0 | |||||||||
|
Gross profit |
16.1 | 15.3 | 15.0 | |||||||||
|
Warehouse and delivery expenses |
3.6 | 3.4 | 3.6 | |||||||||
|
Selling, general and administrative expenses |
4.9 | 4.7 | 4.9 | |||||||||
|
Amortization of intangible assets |
0.6 | 0.4 | 0.3 | |||||||||
|
Gain on sale of fixed assets and acquisition of business |
- | (0.1 | ) | - | ||||||||
|
Operating income |
7.0 | 6.9 | 6.2 | |||||||||
|
Stock warrants revaluation |
- | - | 0.4 | |||||||||
|
Interest expense, net |
0.3 | 0.4 | 0.9 | |||||||||
|
Income taxes (credit) |
2.5 | 2.5 | (1.5 | ) | ||||||||
|
Net income |
4.2 | 4.0 | 6.4 | |||||||||
Net Sales. Net sales in 2014 increased $140.8 million or 23.7%, to $735.7 million from $594.9 million in 2013. The increase was primarily attributable to a 27% increase in the Company’s revenues from the RV industry, a 13% increase in revenues from the MH industry, and a 16% increase in revenues from the industrial markets. Excluding the revenue contributions of the acquisitions completed in 2014 and the incremental revenue contributions of the 2013 acquisitions, the Company estimates its organic growth in 2014 at approximately 11%, or $62.8 million of the total revenue increase. The remaining $78.0 million revenue increase in 2014 was attributable to the incremental contribution of the 2013 acquisitions (Frontline, Premier and West Side) and to the 2014 acquisitions (Precision, Foremost, PolyDyn3 and Charleston).
The sales increase in 2014 is also primarily attributable to: (i) increased RV market penetration, (ii) improved residential cabinet and office, medical and institutional furnishings business in the industrial market, (iii) an increase in wholesale unit shipments in the MH industry, and (iv) improved residential housing starts.
The RV industry, which represented approximately 74% of the Company’s sales in 2014, saw wholesale unit shipments increase by approximately 11% compared to 2013. The MH industry, which represented 15% of the Company’s 2014 sales, experienced a 7% increase in wholesale unit shipments compared to 2013. The industrial market sector accounted for approximately 11% of the Company’s sales in 2014. We estimate that approximately 56% of our industrial revenue base is directly tied to the residential housing market.
Cost of Goods Sold. Cost of goods sold increased $113.3 million or 22.5%, to $617.2 million in 2014 from $503.9 million in 2013. As a percentage of net sales, cost of goods sold decreased during 2014 to 83.9% from 84.7% in 2013.
Cost of goods sold as a percentage of net sales was positively impacted during 2014 by: (i) increased revenues relative to our overall fixed overhead costs; (ii) the impact of acquisitions completed during 2014 and 2013 and the addition of new higher margin product lines; and (iii) ongoing organizational and process changes that enhanced labor efficiencies and increased material yields.
In addition, increased demand in certain market sectors can result in fluctuating costs of certain commodities of raw materials and other products that we utilize and distribute from quarter to quarter. The Company continually explores alternative sources of raw materials and components, both domestically and from overseas.
Gross Profit. Gross profit increased $27.5 million or 30.2%, to $118.5 million in 2014 from $91.0 million in 2013. As a percentage of net sales, gross profit increased to 16.1% in 2014 from 15.3% in 2013. The improvement in gross profit dollars and the percentage of net sales in 2014 compared to 2013 reflected the positive impact of the factors discussed above under “Cost of Goods Sold”, including the positive contribution to gross profit of both organic and acquisition-related revenue growth, and disciplined cost control and management of certain low margin business.
Economic or industry-wide factors affecting the profitability of our RV, MH, and industrial businesses include the costs of commodities used to manufacture our products and the competitive environment that can cause gross margins to fluctuate from quarter-to-quarter and year-to-year.
Exclusive of any commodity pricing fluctuations, competitive pricing dynamics, or other circumstances outside of our control, we expect full year gross margins in 2015 to be generally consistent with those in 2014 with the potential to increase as a result of operating leverage from continued expected sales growth, partially offset by lower gross margins on certain acquisitions completed in 2014 when compared to historical consolidated gross margins.
Warehouse and Delivery Expenses. Warehouse and delivery expenses increased $6.0 million or 29.8%, to $26.2 million in 2014 from $20.2 million in 2013. The expense increase was primarily attributable to increased sales volumes.
As a percentage of net sales, warehouse and delivery expenses were 3.6% in 2014 and 3.4% in 2013. The increase as a percentage of net sales primarily reflected: (i) additional warehouse staff as a result of a 36% increase in our distribution revenues during 2014; (ii) increased overtime expenses for Company fleet drivers and greater utilization of more costly third party contract drivers in certain of our manufacturing and distribution operations, related to a shortage of qualified drivers to transport our products to our customers, primarily in the first half of 2014; and (iii) increased overall demand levels in other industries which resulted in increased freight rates, both with full truckload and less than full truckload carriers, in addition to increased driver wages, that were partially offset by a reduction in fuel costs, particularly in the fourth quarter of 2014. We expect the current reduction in fuel costs, if sustained throughout 2015, to positively impact our warehouse and delivery expenses in 2015.
Selling, General and Administrative (SG&A) Expenses. SG&A expenses increased $8.4 million or 30.0%, to $36.4 million in 2014 from $28.0 million in 2013. Additional headcount associated with certain recent acquisitions, increased stock-based compensation expense of approximately $2.0 million, and an increase in incentive compensation related to higher levels of profitability contributed to a net increase in selling and administrative wages, incentives and payroll taxes in 2014 compared to the prior year. In addition, SG&A expenses in 2013 included a gain of $0.3 million related to the recovery of a previously reserved receivable. As a percentage of net sales, SG&A expenses were 4.9% in 2014 and 4.7% in 2013.
Additionally, the Company incurred certain transaction-related expenses in 2014 in connection with acquisitions completed and those evaluated of approximately $0.8 million. The increase in SG&A expenses in 2014 was partially offset by the recognition of pretax gains of $1.0 million in the aggregate associated with one 2012 acquisition and two 2013 acquisitions in which the conditions for payment of contingent consideration were not achieved.
Amortization of Intangible Assets. Amortization of intangible assets increased $2.1 million in 2014 compared to the prior year, primarily reflecting the impact of businesses acquired in 2013 (Frontline, Premier and West Side), and in 2014 (Precision, Foremost, PolyDyn3 and Charleston). In the aggregate, in conjunction with the 2013 and 2014 acquisitions, the Company recognized $31.6 million in certain finite-lived intangible assets that are being amortized over periods ranging from three to 10 years.
(Gain) Loss on Sale of Fixed Assets. During 2013, the Company sold the facility that housed its distribution operation in Halstead, Kansas and recorded a pretax gain on sale of approximately $0.4 million.
Operating Income. Operating income increased $10.5 million or 25.7% to $51.5 million in 2014 from $41.0 million in 2013. Operating income in 2014 and 2013 included $3.1 million and $0.2 million, respectively, related to the acquisitions completed in each such year. The change in operating income is primarily attributable to the items discussed above.
Interest Expense, Net. Interest expense increased $0.2 million to $2.4 million in 2014 from $2.2 million in 2013 reflecting increased borrowings primarily to fund acquisitions offset by a lower effective interest rate compared to the prior year period.
Income Taxes. The Company recorded income taxes at a full year blended rate of 37.5% for 2014 and 38% for the full year 2013. As we continue to refine our federal and state income tax estimates, which are impacted by permanent differences impacting the effective tax rate and shifts in apportionment factors among states as a result of recent acquisition activity and other factors, we could experience further fluctuations in our combined effective income tax rate from period to period and for the full year 2015.
In 2014 and 2013, the Company realized a net tax benefit of approximately $1.1 million and $2.4 million, respectively, related to the realization of excess tax benefits on stock-based compensation, which had not been recorded as deferred tax assets at December 31, 2013 and 2012, respectively. These tax benefits were recorded to shareholders’ equity upon realization in 2014 and 2013 at the then estimated effective combined federal and state tax rate.
From a tax perspective, the Company had federal and state net operating loss carry forwards (“NOLs”) which resulted in virtually no cash taxes being paid other than franchise taxes and various state filing taxes prior to 2013. In 2013, the Company fully utilized its remaining federal NOL of approximately $9.8 million. In addition, the Company had various state NOLs of approximately $4.5 million at December 31, 2013, of which approximately $1.6 million were remaining to be utilized as of December 31, 2014.
The federal and state NOLs discussed above were used to partially offset the cash portion of the income tax provision for 2013 and, with respect to state NOLs only, for 2014. In 2014 and 2013, the Company made quarterly estimated tax payments consistent with its expected annual 2014 and 2013 federal and state income tax liability.
Net Income. Net income for 2014 was $30.7 million or $2.87 per diluted share compared to $24.0 million or $2.23 per diluted share for 2013. The changes in net income for 2014 reflected the impact of the items previously discussed.
Year Ended December 31, 2013 Compared to 2012
Net Sales. Net sales in 2013 increased $157.5 million or 36.0%, to $594.9 million from $437.4 million in 2012. The increase was primarily attributable to a 44% increase in the Company’s revenue from the RV industry, a 13% increase in revenues from the MH industry, and a 33% increase in revenues from the industrial markets.
Excluding the revenue contributions of the acquisitions completed in 2012 and 2013, the Company estimated its organic growth in 2013 at approximately 19% or $82.6 million of the total revenue increase. Of the remaining $74.9 million revenue increase in 2013, approximately $63.3 million was attributable to the incremental contribution of the 2012 acquisitions (Décor, Gustafson, Creative Wood, and Middlebury Hardwoods) and approximately $11.6 million was attributable to the 2013 acquisitions (Frontline, Premier, and West Side).
The sales increase in 2013 is also primarily attributable to: (i) increased RV market penetration, (ii) improved retail fixture and residential cabinet and furniture business in the industrial market, (iii) an increase in wholesale unit shipments in the MH industry, and (iv) improved residential housing starts. The increase was partially offset by the impact of the vertical integration efforts of one of our larger customers in the MH market that is producing in-house one of the product lines for certain of its facilities that we had previously been supplying. In addition, that same customer has set up distribution centers that provide certain product lines to several of its own manufacturing facilities that we had previously been supplying.
The RV industry, which represented approximately 72% of the Company’s sales in 2013, saw wholesale unit shipments increase by approximately 12% compared to 2012. The MH industry, which represented 16% of the Company’s 2013 sales, experienced a 10% increase in wholesale unit shipments compared to 2012. The industrial market sector accounted for approximately 12% of the Company’s sales in 2013. We estimate that approximately 60% of our industrial revenue base is directly tied to the residential housing market.
Cost of Goods Sold. Cost of goods sold increased $132.3 million or 35.6%, to $503.9 million in 2013 from $371.6 million in 2012. As a percentage of net sales, cost of goods sold decreased during 2013 to 84.7% from 85.0% in 2012.
Cost of goods sold as a percentage of net sales was positively impacted during 2013 by: (i) increased revenues relative to our overall fixed overhead costs, (ii) the impact of acquisitions completed during 2012 and 2013, (iii) actions to reduce or eliminate negative margins on certain products, (iv) increased revenues from the Distribution segment which generally has a lower cost of goods sold percentage than the Manufacturing segment, and (v) ongoing organizational and process changes that enhanced labor efficiencies, reduced scrap and returns, and increased material yields. Cost of goods sold as a percentage of net sales was negatively impacted by fluctuations in the costs of certain commodities used in the manufacturing of our products during 2013 compared to 2012.
Gross Profit. Gross profit increased $25.3 million or 38.4%, to $91.0 million in 2013 from $65.7 million in 2012. As a percentage of net sales, gross profit increased to 15.3% in 2013 from 15.0% in 2012. The improvement in gross profit dollars and the percentage of net sales in 2013 compared to 2012 reflected the positive impact of the factors discussed above under “Cost of Goods Sold”.
Economic or industry-wide factors affecting the profitability of our RV, MH, and industrial businesses included the costs of commodities used to manufacture our products and the competitive environment that can cause gross margins to fluctuate from quarter-to-quarter and year-to-year.
Warehouse and Delivery Expenses. Warehouse and delivery expenses increased $4.4 million or 27.7%, to $20.2 million in 2013 from $15.8 million in 2012. The expense increase was primarily attributable to increased sales volumes.
As a percentage of net sales, warehouse and delivery expenses were 3.4% in 2013 and 3.6% in 2012. The decrease as a percentage of net sales for 2013 primarily reflected better utilization of our fleet and truckload delivery capacities as a result of higher sales volumes, and the impact of increased distribution sales volume compared to its associated fixed costs.
Selling, General and Administrative (SG&A) Expenses. SG&A expenses increased $6.4 million or 29.3%, to $28.0 million in 2013 from $21.6 million in 2012. Additional headcount associated with recent acquisitions and an increase in accrued incentive compensation related to higher levels of profitability contributed to a net increase in selling and administrative wages, incentives and payroll taxes in 2013 compared to the prior year. In addition, SG&A expenses in 2013 included a gain of $0.3 million related to the recovery of a previously reserved receivable. As a percentage of net sales, SG&A expenses were 4.7% in 2013 and 4.9% in 2012.
Amortization of Intangible Assets. Amortization of intangible assets increased $0.8 million in 2013 compared to 2012, primarily reflecting the impact of businesses acquired in 2012 (Décor, Gustafson, Creative Wood, and Middlebury Hardwoods) and in 2013 (Frontline, Premier, and West Side). In the aggregate, in conjunction with the 2012 and 2013 acquisitions, the Company recognized $15.9 million in certain finite-lived intangible assets that are being amortized over periods ranging from three to 10 years.
Gain on Sale of Fixed Assets and Acquisition of Business. During 2013, the Company sold the facility that housed its distribution operation in Halstead, Kansas and recorded a pretax gain on sale of approximately $0.4 million.
In conjunction with the acquisition of Gustafson in 2012, the fair value of the net assets acquired of $3.0 million exceeded the purchase price of $2.8 million. As a result, the Company recognized a gain of $0.2 million associated with the acquisition. The gain was included in this line item for 2012 in addition to a gain on the sale of fixed assets for 2012 of $15,000.
Operating Income. Operating income increased $13.9 million or 51.4% to $40.9 million in 2013 from $27.0 million in 2012. The change in operating income was primarily attributable to the items discussed above.
Stock Warrants Revaluation. The stock warrants revaluation expense of $1.7 million in 2012 represented non-cash charges related to mark-to-market accounting for common stock warrants issued in 2008 to certain of the Company’s then existing lenders (the “2008 Warrants”).
In 2012, the Company issued an aggregate of 291,856 net shares of common stock to the remaining holders that exercised the remaining 2008 Warrants in cashless exercises. As of December 31, 2012, all of the 2008 Warrants had been exercised.
Interest Expense, Net. Interest expense decreased $1.8 million to $2.2 million in 2013 from $4.0 million in 2012. In 2013, borrowing rates under the 2012 Credit Facility (as defined herein) were lower than the interest rates under the prior credit facility in the comparable periods in 2012, as well as the interest rates on the March 2011 Notes (as defined herein), the September 2011 Notes (as defined herein), and the 10% Promissory Note issued in September 2011 to the seller of AIA, all of which were outstanding during the first 10 months of 2012. These notes were repaid in full in the fourth quarter of fiscal 2012.
Total debt outstanding during the first 10 months of 2012 included the March 2011 Notes, the September 2011 Notes, and the 10% Promissory Note. During 2012, the Company (i) made optional prepayments on each of March 30, 2012 and June 29, 2012 of $770,000 or 10% of the combined $7.7 million original principal amount of the Company’s March 2011 Notes and September 2011 Notes for a total prepayment of $1.54 million in the aggregate, and (ii) repaid $0.75 million principal amount of the 10% Promissory Note.
In the fourth quarter of 2012, the Company used borrowings under the 2012 Credit Facility to prepay the remaining principal outstanding under the March 2011 Notes, the September 2011 Notes, and the Promissory Note. Interest expense in 2012 included a non-cash charge of $0.7 million for the write-off of the remaining unamortized debt discount on the prepayment of the March 2011 Notes and the September 2011 Notes, and a charge of $0.3 million for premiums paid in conjunction with the prepayment of the March 2011 Notes and the September 2011 Notes.
Income Taxes. The Company recorded income taxes at a full year blended tax rate of 38% for 2013. The effective tax rate in 2012 was 0% exclusive of the non-cash income tax credit described below.
At January 1, 2012, the Company carried a full valuation allowance of $15.6 million against its deferred tax assets. In the second quarter of 2012, the Company determined that it was likely that the remaining net deferred tax assets would be realized based upon sustained profitability and forecasted future operating results. As a result of this determination, the Company reversed approximately $6.8 million of the valuation allowance in 2012, with the reversal recorded as a non-cash income tax credit on the Company’s consolidated statement of income. In addition, the Company reversed the balance of its valuation allowance in 2012 to fully offset its 2012 tax provision of approximately $8.8 million, resulting in the 0% effective tax rate described above for 2012.
At December 31, 2012, the Company had a gross federal net operating loss (“NOL”) carry forward of approximately $9.8 million that it fully utilized in 2013. In addition, the Company had various state NOLs of approximately $12.6 million at December 31, 2012, of which approximately $4.5 million were remaining to be utilized as of December 31, 2013.
As of December 31, 2012, both the federal and state NOLs included approximately $3.7 million of taxable deductions related to unrealized excess benefits on stock-based compensation, which had not been recorded as deferred tax assets. In 2013, the Company realized approximately $2.4 million of additional taxable deductions related to excess benefits on stock-based compensation, which had also not been recorded as deferred tax assets. In addition, in 2013, based on the utilization of the federal NOL and a portion of the state NOLs, the Company realized a tax benefit of approximately $2.4 million related to these excess benefits from stock-based compensation. The tax benefit was recorded to shareholders’ equity upon realization in 2013.
The federal and state NOLs discussed above were used to partially offset the cash portion of the income tax provision for 2013. In 2013, the Company made quarterly estimated tax payments consistent with its expected annual 2013 federal and state income tax liability.
Net Income. Net income for 2013 was $24.0 million or $2.23 per diluted share compared to $28.1 million or $2.64 per diluted share for 2012. The changes in net income for 2013 reflected the impact of the items previously discussed, including (i) an income tax provision of $14.7 million in 2013 or $1.37 per diluted share, and (ii) the reversal of the tax valuation allowance in 2012, which increased net income by $6.8 million in 2012 or $0.64 per diluted share.
BUSINESS SEGMENTS
The Company has determined that its reportable segments are those based on its method of internal reporting, which segregates its businesses by product category and production or distribution process. The Company regularly evaluates the performance of each segment and allocates resources to them based on a variety of indicators including sales, cost of goods sold, and operating income.
The Company’s reportable business segments are as follows:
|
● |
Manufacturing - The Company’s lamination operations utilize various materials, such as lauan, medium density fiberboard (“MDF”), gypsum, and particleboard, which are bonded by adhesives or a heating process to a number of products, including vinyl, paper, foil, and high-pressure laminates. These products are utilized to produce furniture, shelving, wall, counter, and cabinet products with a wide variety of finishes and textures. This segment also includes a cabinet door division, a fiberglass bath fixtures division, a hardwood furniture division, a vinyl printing division, a solid surface, granite, and quartz countertop fabrication division, an exterior graphics division, an RV painting division, a fabricated aluminum products division, a simulated wood and stone products division, and a fiberglass and plastic components division. Patrick’s major manufactured products also include wrapped vinyl, paper and hardwood profile mouldings, interior passage doors, and slotwall panels and components. |
|
● |
Distribution – The Company distributes pre-finished wall and ceiling panels, drywall and drywall finishing products, electronics, wiring, electrical and plumbing products, FRP products, cement siding, interior passage doors, roofing products, laminate and ceramic flooring, shower doors, furniture, fireplaces and surrounds, interior and exterior lighting products, and other miscellaneous products. |
Sales pertaining to the manufacturing and distribution segments as stated in the table below and in the following discussions include intersegment sales. Gross profit includes the impact of intersegment operating activity.
The table below presents information about the sales, gross profit, and operating income of the Company’s operating segments. A reconciliation to consolidated totals is presented in Note 19 to the Consolidated Financial Statements.
|
Years Ended December 31, |
||||||||||||
|
(thousands) |
2014 |
2013 |
2012 |
|||||||||
|
Sales |
||||||||||||
|
Manufacturing |
$ | 567,152 | $ | 477,702 | $ | 346,948 | ||||||
|
Distribution |
189,438 | 139,099 | 108,256 | |||||||||
|
Gross Profit |
||||||||||||
|
Manufacturing |
89,963 | 70,174 | 50,307 | |||||||||
|
Distribution |
29,063 | 23,060 | 18,101 | |||||||||
|
Operating Income |
||||||||||||
|
Manufacturing |
55,838 | 43,860 | 30,798 | |||||||||
|
Distribution |
10,659 | 8,040 | 5,727 | |||||||||
Year Ended December 31, 2014 Compared to 2013
Manufacturing
Sales. Sales increased $89.5 million or 18.7%, to $567.2 million from $477.7 million in 2013. This segment accounted for approximately 75% of the Company’s consolidated net sales in 2014. The sales increase reflected a 22%, 15%, and 15% increase in the Company’s revenue from the RV industry, MH industry, and industrial markets, respectively, on a year-over-year basis.
Approximately $53.2 million of the revenue improvement in 2014 was attributable to the incremental contribution of acquisitions completed in 2013 and to the 2014 acquisitions. There was minimal revenue contribution in 2014 related to the acquired operations of PolyDyn3 and Charleston. The remaining sales increase of $36.3 million is primarily attributable to: (i) increased RV market penetration; (ii) an increase in wholesale unit shipments in the RV and MH industries of 11% and 7% in 2014, respectively; and (iii) improved residential cabinet and office, medical and institutional furnishings sales in the industrial market.
We expect to continue to see overall revenue growth in fiscal 2015 compared to the prior year exclusive of the revenue contributions of the acquisitions completed in 2014.
Gross Profit. Gross profit increased $19.8 million to $90.0 million in 2014 from $70.2 in 2013. As a percentage of sales, gross profit increased to 15.9% in 2014 from 14.7% in 2013. Gross profit for 2014 improved primarily as a result of higher revenues relative to overall fixed overhead costs, the impact of acquisitions completed during 2013 and 2014, disciplined cost control and management of certain low margin business, and ongoing organizational and process changes that enhanced labor efficiencies and increased material yields.
Operating Income. Operating income increased $11.9 million to $55.8 million in 2014 from $43.9 million in 2013. Operating income in 2014 included $1.4 million attributable to the acquisitions completed in 2014. Operating income attributable to acquisitions completed in 2013 was immaterial. The improvement in operating income primarily reflects the increase in gross profit mentioned above that was partially offset in 2014 by: (i) increased labor costs for Company fleet drivers and greater utilization of more costly third party contract drivers, particularly in the first half of 2014, in certain manufacturing operations related to the driver shortage previously described; and (ii) to a lesser extent, higher SG&A expenses as a percentage of net sales in 2014 due to the incremental impact of acquisitions completed in 2013 and increased sales, salaried and administration spending to support expected growth.
Distribution
Sales. Sales increased $50.3 million or 36.2%, to $189.4 million in 2014 from $139.1 million in 2013. This segment accounted for approximately 25% of the Company’s consolidated net sales for 2014. The sales increase reflected a 49%, 11%, and 39% increase in the Company’s revenue from the RV industry, MH industry, and industrial markets, respectively, on a year-over-year basis.
Approximately $24.8 million of the revenue improvement in 2014 was attributable to the incremental contribution of acquisitions completed in 2013 and to the 2014 acquisitions. Sales were also positively impacted during 2014 by a 7% increase in wholesale unit shipments in the MH industry. We expect to continue to see overall revenue growth in fiscal 2015 compared to the prior year exclusive of the revenue contributions of the acquisitions completed in 2014.
Gross Profit. Gross profit increased $6.0 million to $29.1 million in 2014 from $23.1 million in 2013. As a percentage of sales, gross profit was 15.3% in 2014 compared to 16.6% in 2013. The decrease in gross profit as a percentage of sales for 2014 is primarily attributable to an increase in sales of both imported and domestic lower margin products at certain of the Company’s distribution facilities.
Operating Income. Operating income in 2014 increased $2.6 million to $10.6 million from $8.0 million in 2013. Operating income in 2014 included $1.7 million attributable to the acquisitions completed in 2014. Operating income attributable to acquisitions completed in 2013 was immaterial. The overall increase in revenue, as well as the acquisition of several new product lines associated with the West Side distribution business acquired in 2013, made a positive contribution to operating income in 2014. The increase in operating income in 2014 was partially offset by: (i) increased labor costs for Company fleet drivers and greater utilization of more costly third party contract drivers, particularly in the first half of 2014, in certain of our distribution operations related to the driver shortage previously described; (ii) unexpected inefficiencies in our shipping schedules due to the severe winter weather conditions in the Midwest in the first quarter of 2014; and (iii) distribution related overhead and assembly costs in one of our significantly growing distribution operations.
Unallocated Corporate Expenses
Unallocated corporate expenses in 2014 increased $1.5 million to $10.5 million from $9.0 million in 2013. Unallocated corporate expenses in 2014 included the impact of increased stock-based compensation expense in 2014 of approximately $2.0 million. In addition, the Company incurred certain transaction-related expenses in connection with the evaluation and completion of acquisition opportunities that were partially offset by the recognition of gains associated with certain transactions completed in 2012 and 2013 in which the conditions for payment of contingent consideration were not achieved. See “SG&A” discussion above for further details.
Year Ended December 31, 2013 Compared to 2012
Manufacturing
Sales. Sales increased $130.8 million or 37.7%, to $477.7 million in 2013 from $346.9 million in 2012. This segment accounted for approximately 77% of the Company’s consolidated net sales in 2013. The sales increase reflected a 44%, 11% and 37% increase in the Company’s revenue from the RV industry, MH industry, and industrial markets, respectively, on a year-over-year basis. The increase in revenue from the MH market was partially offset by the impact of the vertical integration efforts of one of our larger MH customers that is producing in-house one of the product lines for certain of its facilities that we had previously been supplying.
Approximately $54.2 million of the revenue improvement was attributable to the incremental contribution of acquisitions completed in 2012 (including related market share and industry growth). An additional $7.4 million of the revenue improvement was attributable to the contribution of the acquisitions completed in 2013 (Frontline and Premier). The remaining sales increase of $69.2 million in 2013 is primarily attributable to: (i) increased RV market penetration, (ii) an increase in wholesale unit shipments in the RV industry of 12% in 2013; (iii) an increase in MH wholesale unit shipments of 10% in 2013; and (iv) improved retail fixture and residential cabinet and furniture business in the industrial market.
Gross Profit. Gross profit increased $19.9 million to $70.2 million in 2013 from $50.3 million in 2012. As a percentage of sales, gross profit increased to 14.7% in 2013 from 14.5% in 2012. Gross profit for 2013 improved primarily as a result of: (i) higher revenues; (ii) the impact of acquisitions completed during 2012 and 2013; (iii) increased profitability at our Midwest manufacturing divisions, which benefited from actions to reduce or eliminate negative margins on certain products; and (iv) ongoing organizational and process changes that enhanced labor efficiencies, reduced scrap and returns, and increased material yields.
Operating Income. Operating income increased $13.1 million to $43.9 million in 2013 from $30.8 million in 2012. The improvement in operating income primarily reflects the increase in gross profit mentioned above and lower warehouse and delivery expenses as a percentage of sales.
Distribution
Sales. Sales increased $30.8 million or 28.5%, to $139.1 million in 2013 from $108.3 million in 2012. This segment accounted for approximately 23% of the Company’s consolidated net sales for 2013. The sales increase in 2013 reflected a 41% increase in the Company’s revenue from the RV industry and a 15% increase in revenue from the MH industry.
Approximately $9.1 million of the revenue improvement was attributable to the incremental contribution of the Gustafson acquisition completed in 2012 (including related market share and industry growth). An additional $4.2 million of the revenue improvement was attributable to the contribution of the West Side acquisition completed in 2013. Sales were also positively impacted during 2013 by a 10% increase in wholesale unit shipments in the MH industry, which is the primary market this segment serves.
Gross Profit. Gross profit increased $5.0 million to $23.1 million in 2013 from $18.1 million in 2012. As a percentage of sales, gross profit was 16.6% in 2013 compared to 16.7% in 2012.
Operating Income. Operating income in 2013 increased $2.3 million to $8.0 million from $5.7 million in 2012. The overall increase in revenues, as well as the acquisition of several new product lines during 2012 and 2013, in particular the Gustafson distribution business acquired in 2012 and the West Side furniture business acquired in 2013, made a positive contribution to operating income during 2013.
Unallocated Corporate Expenses
Unallocated corporate expenses in 2013 increased $0.8 million to $9.0 million from $8.2 million in 2012 primarily reflecting an increase in administrative wages, incentives, and payroll taxes, as well as additional headcount associated with recent acquisitions.
LIQUIDITY AND CAPITAL RESOURCES
Cash Flows
Operating Activities
Cash flows from operations represent the net income we earned in the reported periods adjusted for non-cash items and changes in operating assets and liabilities. Our primary sources of liquidity are cash flows from operating activities and borrowings under our credit facility. Our principal uses of cash are to support working capital demands, meet debt service requirements and support our capital allocation strategy, which includes acquisitions, capital expenditures, and repurchases of the Company’s common stock, among others.
Net cash provided by operating activities was $45.7 million in 2014 compared to $22.4 million in 2013. Net income was $30.7 million in 2014 compared to $24.0 million in the prior year. Net of acquisitions, trade receivables increased $1.9 million in 2014 and $1.5 million in 2013, reflecting increased sales levels in each of those periods, including the post-acquisition sales increases of the acquisitions completed in 2014, 2013 and 2012.
Inventories increased $1.7 million in 2014, net of acquisitions, and $7.5 million in 2013, net of acquisitions, primarily reflecting higher sales volumes and related higher inventory levels associated with acquisitions completed in 2014, 2013 and 2012. We will continue to work with our key suppliers to match lead-time and minimum order requirements and to take advantage of strategic buying opportunities, where possible. The $4.6 million increase in accounts payable and accrued liabilities compared to the $3.6 million net decrease in 2013 primarily reflected the timing of payments related to the Company’s cash management, purchase discount initiatives to maximize discounts available on inventory procurement, and the impact of acquisitions.
From a tax perspective, the Company had federal and state net operating loss carry forwards (“NOLs”) which resulted in virtually no cash taxes being paid other than franchise taxes and various state filing taxes prior to 2013. In 2013, the Company fully utilized its remaining federal NOL of approximately $9.8 million. In addition, the Company had various state NOLs of approximately $12.6 million at December 31, 2012 and $4.5 million at December 31, 2013, of which approximately $1.6 million were remaining to be utilized as of December 31, 2014.
In 2014 and 2013, the Company realized a net tax benefit of approximately $1.1 million and $2.4 million, respectively, related to the realization of excess tax benefits on stock-based compensation, which had not been recorded as deferred tax assets at December 31, 2013 and 2012, respectively. These tax benefits were recorded to shareholders’ equity upon realization in 2014 and 2013 at the then estimated effective combined federal and state tax rate.
Net cash provided by operating activities was $22.4 million in 2013 compared to $21.0 million in 2012. Net income was $24.0 million in 2013 compared to $28.1 million in the prior year, including a non-cash income tax credit of $6.8 million related to the reversal of the deferred tax valuation allowance. Trade receivables increased $1.5 million in 2013 primarily reflecting the post-acquisition sales increases of the acquisitions completed in 2012 and 2013. Trade receivables decreased $1.0 million in 2012 reflecting plant shutdowns by many of our larger customers in mid-to-late December 2012 for the holiday season. Inventories increased $7.5 million in 2013 compared to a $14.2 million increase in the comparable 2012 period, primarily reflecting the impact of acquisitions completed in the third quarter of 2013, an increase in sales volumes, and the Company’s strategic decision to increase inventory levels, particularly in its distribution operations, at year end to continue to be able to meet anticipated rising customer demand in the first quarter of 2014. The $3.6 million net decrease in accounts payable and accrued liabilities in 2013 compared to the $5.2 million net increase in 2012 primarily reflected the timing of payments related to the Company’s cash management and purchase discount initiatives to maximize discounts available on inventory procurement.
Investing Activities
Investing activities used cash of $78.6 million in 2014 primarily to fund: (i) the acquisitions of Precision, Foremost, PolyDyn3, and Charleston totaling $72.1 million; and (ii) capital expenditures of $6.5 million. Investing activities used cash of $24.3 million in 2013 primarily to fund: (i) the acquisitions of Frontline, Premier and West Side, together totaling $16.5 million; and (ii) capital expenditures of $8.7 million, which included the purchase of one of our distribution facilities that we had previously been leasing from an unrelated third party, for approximately $1.7 million. In addition, investing activities provided cash in 2013 of $1.0 million related to net proceeds from the sale of the Kansas distribution facility and the sale of various machinery and equipment. In addition, in the first quarter of 2015 through February 27, 2015, the Company used cash of $40.0 million to fund the acquisition of Better Way. See Note 4 to the Consolidated Financial Statements for additional details.
The capital plan for full year 2014 included spending related to the ongoing replacement of our current ERP system, equipment upgrades to ensure that our facilities have the capacity, capabilities and technology to facilitate our growth plans, and other strategic capital and maintenance improvements. Our current operating model forecasts capital expenditures for fiscal 2015 of approximately $8.0 million.
Cash used in investing activities of $37.2 million in 2012 was primarily to fund the acquisitions of Décor, Gustafson, Creative Wood, and Middlebury Hardwoods, which together totaled $29.3 million, and included the purchase of two operating facilities, and to fund capital expenditures of $7.9 million.
Financing Activities
Net cash flows provided by financing activities were $33.0 million in 2014 compared to $1.4 million in the comparable 2013 period. As of December 31, 2014, availability under the revolving line of credit under the 2012 Credit Facility was approximately $63.1 million (excluding cash on hand).
The net increase in borrowings of $46.1 million under the Company’s revolving line of credit in 2014 primarily reflected the funding of the Precision, Foremost, PolyDyn3 and Charleston acquisitions, stock repurchases and capital expenditures (in the aggregate totaling $92.6 million), net of debt reduction.
In 2013, the Company used cash to repurchase 407,330 shares of common stock for a total cost of $6.1 million, under the $10.0 million stock repurchase program authorized by the Board in February 2013. In 2014, the Company used cash to repurchase 344,750 shares of common stock for a total cost of $13.9 million, under the $20.0 million stock repurchase program authorized by the Board in February 2014, which included the remaining amount under the previous authorization. In total in 2013 and 2014, the Company repurchased 752,080 shares of common stock at a total cost of $20.0 million. In addition, in the first quarter of 2015 through February 27, 2015, the Company repurchased 130,500 shares of common stock for a total cost of $5.7 million. See Note 14 to the Consolidated Financial Statements for additional details.
Cash provided by financing activities in 2014 and 2013 also included $1.1 million and $2.4 million, respectively, at the then estimated effective combined federal and state tax rate, related to the realization of excess tax benefits on stock-based compensation. See the related discussion above under “Cash Flows – Operating Activities” for additional details.
Net cash flows provided by financing activities were $1.4 million in 2013 compared to $16.1 million in 2012. For 2013, net long-term debt borrowings of $5.3 million included borrowings on the 2012 Credit Facility to fund the September 2013 acquisitions that were offset in part by net debt repayments. As of December 31, 2013, availability under the revolving line of credit was approximately $22.9 million.
For 2012, net borrowings on the Company’s revolving line of credit of $16.9 million that were offset in part by (i) $0.8 million in scheduled principal payments on the 10% Promissory Note issued in September 2011 to the seller of AIA, and (ii) the optional prepayment on each of March 30, 2012 and June 29, 2012 of $770,000 or 10% of the combined $7.7 million original principal amount of the Company’s March 2011 Notes and September 2011 Notes. In addition, the Company used initial borrowings under the 2012 Credit Facility in part to prepay in full the remaining combined principal outstanding of $6.16 million of its March 2011 Notes and September 2011 Notes at a price of 104% of the principal amount prepaid plus accrued interest and to prepay the remaining $1.0 million of principal outstanding of the Promissory Note (reflected as net short-term debt payments). In addition, the Company used additional borrowings of approximately $19.8 million under the 2012 Credit Facility to fund the acquisition of Middlebury Hardwoods.
Capital Resources
2012 Credit Facility
On October 24, 2012, the Company entered into a credit agreement (the “2012 Credit Agreement”) with Wells Fargo Bank, National Association as the agent and lender (“Wells Fargo”), and Fifth-Third as participant (“Fifth-Third”), to establish a five-year $80.0 million revolving secured senior credit facility (the “2012 Credit Facility”).
On June 26, 2014 and November 7, 2014, the Company entered into amendments to the 2012 Credit Agreement to increase the maximum borrowing limit under the revolving line of credit (the “Revolver”) to $125.0 million and $165.0 million, respectively, and to add Key Bank as a participant (together with Wells Fargo and Fifth-Third, the “Lenders”). On February 13, 2015, the 2012 Credit Agreement was further amended to expand the 2012 Credit Facility to $185.0 million.
The 2012 Credit Agreement is secured by a pledge of substantially all of the assets of the Company pursuant to a Security Agreement, dated October 24, 2012, between the Company and Wells Fargo, as agent. The 2012 Credit Agreement includes certain definitions, terms and reporting requirements and includes the following provisions:
|
● |
The maturity date for the 2012 Credit Facility is October 24, 2017; |
|
● |
The interest rates for borrowings under the Revolver are the Base Rate plus the Applicable Margin or the London Interbank Offer Rate (“LIBOR”) plus the Applicable Margin, with a fee payable by the Company on unused but committed portions of the Revolver; |
|
● |
The Revolver includes a sub-limit up to $5 million for same day advances (“Swing Line”) which shall bear interest based upon the Base Rate plus the Applicable Margin; |
|
● |
Up to $20 million of the Revolver will be available as a sub-facility for the issuance of standby letters of credit, which are subject to certain expiration dates; |
|
● |
The financial covenants include requirements as to a consolidated total leverage ratio and a consolidated interest coverage ratio, and other covenants include limitations on permitted acquisitions, capital expenditures, indebtedness, restricted payments, and fundamental changes (see further details below); and |
|
● |
Customary prepayment provisions which require the prepayment of outstanding amounts under the Revolver based on predefined conditions. |
At December 31, 2014 the Company had $101.1 million outstanding under its Revolver which consisted of $97.0 million of borrowings under the LIBOR-based option and $4.1 million of borrowings under the Base Rate-based option. The interest rate for borrowings under the Revolver at December 31, 2014 was the Prime Rate plus 0.50% (or 3.75%), or LIBOR plus 1.50% (or 1.6875%). At December 31, 2013, the Company had $55.0 million of borrowings outstanding, all of which was under the LIBOR-based option of LIBOR plus 1.50% (or 1.6875%). The fee payable on committed but unused portions of the Revolver was 0.20% for both of these periods.
Pursuant to the 2012 Credit Agreement, the financial covenants include (a) a maximum consolidated total leverage ratio, measured on a quarter-end basis, not to exceed 3.50:1.00 for the 12 month period ending on such quarter-end; (b) a required minimum consolidated interest coverage ratio under the Revolver, measured on a quarter-end basis, of at least 2.25:1.00 for the 12 month period ending on such quarter-end; and (c) a limitation on annual capital expenditures of $12.0 million for 2013 and $10.0 million for 2014 and for subsequent fiscal years, exclusive of acquisitions. If the consolidated total leverage ratio is in excess of 3.00:1.00 and less than 3.50:1.00, the Company is considered to be in compliance with this financial covenant provided it maintains an asset coverage ratio of at least 1.00 to 1.00 as of the close of each period.
The consolidated total leverage ratio is the ratio for any period of (i) consolidated total indebtedness to (ii) earnings before interest, taxes, depreciation, and amortization (“EBITDA”). Consolidated total indebtedness for any period is the sum of (i) total debt outstanding under the Revolver, (ii) capital leases and letters of credit outstanding, and (iii) deferred payment obligations. The asset coverage ratio for any period is the ratio of (i) eligible amounts of the Company’s trade payables, inventory and fixed assets, minus certain reserves as defined under the 2012 Credit Agreement to (ii) the sum of outstanding obligations under the 2012 Credit Facility.
The consolidated interest coverage ratio for any period is the ratio of (i) EBITDA minus depreciation to (ii) the sum of consolidated interest expense plus restricted payments made by the Company.
In 2014 and 2013, the Company was in compliance with all of its debt covenants at each reporting date as required under the terms of the 2012 Credit Agreement. The required maximum total leverage ratio, minimum interest coverage ratio, and the annual capital expenditures limitation amounts compared to the actual amounts as of and for the fiscal period ended December 31, 2014 are as follows:
|
(thousands except ratios) |
Covenant |
Actual |
||||||
|
Consolidated leverage ratio (12-month period) |
3.50 | 1.45 | ||||||
|
Consolidated interest coverage ratio (12-month period) |
2.25 | 4.07 | ||||||
|
Annual capital expenditures limitation |
$ | 10,000 | $ | 6,542 | ||||
Secured Senior Subordinated Notes
March 2011 and September 2011 Notes
In March 2011, the Company issued $2.5 million principal amount of Secured Senior Subordinated Notes (the “March 2011 Notes”) to each of Tontine Capital Overseas Master Fund II, L.P., a Cayman Islands limited partnership (“TCOMF2”) and Northcreek Mezzanine Fund I, L.P. (“Northcreek”), or $5.0 million in the aggregate. In September 2011, the Company issued in the aggregate $2.7 million principal amount of Secured Senior Subordinated Notes (the “September 2011 Notes”) to Northcreek and an affiliate of Northcreek. In 2012, the Company repaid in full the remaining principal amount of its March 2011 Notes and September 2011 Notes.
Subordinated Secured Promissory Note
In connection with the AIA acquisition in 2011, the Company issued a 10% promissory note to the seller of AIA in the principal amount of $2.0 million, which was repaid in full in 2012.
2008 Warrants
In 2008, the Company issued warrants to purchase shares of common stock to its then existing lenders (the “2008 Warrants”). In 2012, the Company issued an aggregate of 291,856 net shares of common stock to the remaining holders that exercised the remaining 2008 Warrants in cashless exercises. In addition, the Company recognized a stock warrants revaluation expense of $1.7 million in 2012 that represented the non-cash charges related to mark-to-market accounting for the 2008 Warrants. As of December 31, 2012, all of the 2008 Warrants had been exercised.
Summary of Liquidity and Capital Resources
Our primary sources of liquidity are cash flow from operations, which includes selling our products and collecting receivables, available cash reserves and borrowing capacity available under the 2012 Credit Facility. Our principal uses of cash are to support working capital demands, meet debt service requirements and support our capital allocation strategy, which includes acquisitions, capital expenditures, and repurchases of the Company’s common stock, among others.
Borrowings under the revolving line of credit under the 2012 Credit Facility are subject to a maximum borrowing limit of $165.0 million (as of December 31, 2014) and of $185.0 million (effective February 13, 2015) and are subject to variable rates of interest. The unused availability under the 2012 Credit Facility as of December 31, 2014 was $63.1 million (excluding cash and cash equivalents as of December 31, 2014). We believe that our existing cash and cash equivalents, cash generated from operations, and available borrowings under our 2012 Credit Facility will be sufficient to meet our anticipated cash needs for working capital and capital expenditures for at least the next 12 months, based on our current cash flow budgets and forecasts of our short-term and long-term liquidity needs.
Our ability to access unused borrowing capacity under the 2012 Credit Facility as a source of liquidity is dependent on our maintaining compliance with the financial covenants as specified under the terms of the 2012 Credit Agreement. For the fiscal years ended December 31, 2014 and 2013, we were in compliance with all of our debt covenants at each reporting date as required under the terms of the 2012 Credit Agreement. Based on our 2015 operating plan, we expect to continue to maintain compliance with the financial covenants under the 2012 Credit Agreement in 2015.
In 2015, our management team is focused on increasing market share, maintaining margins, keeping costs aligned with revenue, further improving operating efficiencies, managing inventory levels and pricing, acquiring businesses and product lines that meet established criteria, and the ongoing implementation of our new ERP system at our operating divisions that have not yet been converted, all of which may impact our sources and uses of cash from period to period and impact our liquidity levels. In addition, future liquidity and capital resources may be impacted as we continue to make targeted capital investments to support new business and leverage our operating platform and to repurchase common stock in conjunction with the Company’s previously announced stock buyback program.
Our working capital requirements vary from period to period depending on manufacturing volumes primarily related to the RV and MH industries, the timing of deliveries, and the payment cycles of our customers. In the event that our operating cash flow is inadequate and one or more of our capital resources were to become unavailable, we would seek to revise our operating strategies accordingly. We will continue to assess our liquidity position and potential sources of supplemental liquidity in view of our operating performance, current economic and capital market conditions, and other relevant circumstances.
Contractual Obligations
The following table summarizes our contractual cash obligations at December 31, 2014, and the future periods during which we expect to settle these obligations. We have provided additional details about some of these obligations in our Notes to the Consolidated Financial Statements.
|
Payments due by period |
||||||||||||||||||||
|
(thousands) |
2015 |
2016-2017 | 2018-2019 |
Thereafter |
Total |
|||||||||||||||
|
Revolving line of credit (1) |
$ | - | $ | 101,054 | $ | - | $ | - | $ | 101,054 | ||||||||||
|
Interest payments on long-term debt (2) |
1,790 | 3,283 | - | - | 5,073 | |||||||||||||||
|
Deferred compensation payments |
344 | 718 | 608 | 1,628 | 3,298 | |||||||||||||||
|
Purchase obligations (3) |
1,381 | - | - | - | 1,381 | |||||||||||||||
|
Facility leases |
3,640 | 4,636 | 1,417 | - | 9,693 | |||||||||||||||
|
Equipment leases |
2,060 | 3,488 | 1,889 | 575 | 8,012 | |||||||||||||||
|
Capital leases (4) |
117 | 54 | - | - | 171 | |||||||||||||||
|
Total contractual cash obligations |
$ | 9,332 | $ | 113,233 | $ | 3,914 | $ | 2,203 | $ | 128,682 | ||||||||||
|
(1) |
The estimated long-term debt payment of $101.1 million in 2017 is based on the terms of the 2012 Credit Facility that is scheduled to mature on October 24, 2017. |
|
(2) |
Scheduled interest payments reflect expense related to long-term debt obligations and are calculated based on interest rates in effect at December 31, 2014 for the revolving line of credit: (a) LIBOR-based portion – 1.6875%; and (b) Base Rate-based portion – 3.75%. The projected interest payments exclude non-cash interest that would normally be included in interest expense on the Company’s consolidated statements of income. |
|
(3) |
The purchase obligations are primarily comprised of purchase orders issued in the normal course of business. |
|
(4) |
Capital lease obligations include both principal and interest payments. |
We also have commercial commitments as described below (in thousands):
| Other Commercial Commitments |
Total Amount Committed |
Outstanding at 12/31/14 |
Date of Expiration | ||||||
|
Letters of Credit |
$ | 20,000 (1) | $ | 145 |
December 31, 2015 | ||||
| $ | 100 |
December 31, 2015 | |||||||
| $ | 520 |
January 1, 2016 | |||||||
|
(1) |
The $20.0 million commitment for the Letters of Credit is a sub-limit contained within the $165.0 million credit line as of December 31, 2014. |
Off-Balance Sheet Arrangements
Other than the commercial commitments set forth above, we have no off-balance sheet arrangements.
CRITICAL ACCOUNTING POLICIES
The preparation of financial statements in conformity with accounting principles generally accepted in the U.S. requires management to make estimates and assumptions that affect the reported amounts of assets and liabilities, the disclosure of contingent assets and liabilities at the date of the financial statements and the reported amounts of revenues and expenses during the reporting period. The SEC has defined a company’s most critical accounting policies as those that are most important to the portrayal of its financial condition and results of operations, and which require the Company to make its most difficult and subjective judgments, often as a result of the need to make estimates of matters that are inherently uncertain. Although management believes that its estimates and assumptions are reasonable, they are based upon information available when they are made. Actual results may differ significantly from these estimates under different assumptions or conditions. Other significant accounting policies are described in Note 2 to the Consolidated Financial Statements. The Company has identified the following critical accounting policies and judgments:
Trade Receivables. We are engaged in the manufacturing and distribution of building products and material for use primarily by the manufactured housing and recreational vehicle industries and other industrial markets. Trade receivables consist primarily of amounts due to us from our normal business activities. We control credit risk related to our trade receivables through credit approvals, credit limits and monitoring procedures, and perform ongoing credit evaluations of our customers. In assessing the carrying value of its trade receivables, the Company estimates the recoverability by making assumptions based on factors such as current overall and industry-specific economic conditions, historical and anticipated customer performance, historical write-off and collection experience, the level of past-due amounts, and specific risks identified in the accounts receivable portfolio. Additional changes to the allowance could be necessary in the future if a customer’s creditworthiness deteriorates, or if actual defaults are higher than the Company’s historical experience. Any difference could result in an increase or decrease in the allowance for doubtful accounts.
Inventories. Inventories are stated at the lower of cost (First-In, First-Out (FIFO) Method) or market. Based on the inventory aging and other considerations for realizable value, the Company writes down the carrying value to market value where appropriate. The Company reviews inventory on-hand and records provisions for obsolete inventory based on current assessments of future demands, market conditions, and related management initiatives. Any significant unanticipated changes in demand could have a significant impact on the value of the Company’s inventory and operating results. Based on the Company’s estimates and assumptions, an allowance for inventory obsolescence of $1.8 million, $1.3 million, and $1.1 million was established at December 31, 2014, 2013 and 2012, respectively. If market conditions or customer requirements change and are less favorable than those projected by management, inventory allowances are adjusted accordingly.
Impairment of Long-Lived Assets. The Company records impairment losses on long-lived assets, other than goodwill and indefinite-lived intangible assets, used in operations when events and circumstances indicate that the assets might be impaired and the undiscounted future cash flows estimated to be generated by those assets are less than the carrying amount of those items. Events that may indicate that certain long-lived assets might be impaired include a significant downturn in the economy or the RV or MH industries, and/or a loss of a major customer or several customers. Our cash flow estimates are based on historical results adjusted to reflect our best estimate of future market and operating conditions and forecasts. The net carrying value of assets not recoverable is reduced to fair value. Our estimates of fair value represent our best estimate based on industry trends and reference to market rates and transactions. The recoverability of PP&E is evaluated whenever events or changes in circumstances indicate that the carrying amount of the assets may not be recoverable, primarily based on estimated selling price, appraised value or projected future cash flows. No events or changes in circumstances occurred that required the Company to assess the recoverability of its property and equipment for the years ended December 31, 2014, 2013 and 2012, and therefore the Company has not recognized any impairment charges for those years.
All of the Company’s goodwill and long-lived asset impairment assessments are based on established fair value techniques, including discounted cash flow analysis. These analyses require management to estimate both future cash flows and an appropriate discount rate to reflect the risk inherent in the current business model. The assumptions supporting valuation models, including discount rates, are determined using the best estimates as of the date of the impairment review. These estimates are subject to significant uncertainty, and differences in actual future results may require further impairment charges, which may be significant.
Impairment of Goodwill and Other Acquired Intangible Assets. The Company has made acquisitions in the past that included goodwill and other intangible assets. Goodwill represents the excess of cost over the fair value of the net assets acquired. Other intangible assets acquired are classified as customer relationships, non-compete agreements, and trademarks.
Goodwill and indefinite-lived intangible assets such as trademarks are not amortized but are subject to an annual (or under certain circumstances more frequent) impairment test in the fourth quarter based on their estimated fair value. We test more frequently, if there are indicators of impairment, or whenever such circumstances suggest that the carrying value of goodwill or trademarks may not be recoverable. These indicators include a sustained significant decline in our share price and market capitalization, a decline in our expected future cash flows, or a significant adverse change in the business climate. A significant adverse change in the business climate could result in a significant loss of market share or the inability to achieve previously projected revenue growth. No material events occurred during 2014, 2013 or 2012 that indicated the existence of impairment with respect to our reported goodwill, trademarks, or other intangible assets.
Goodwill and other intangible assets are allocated to the Company’s reporting units at the date they are initially recorded. We perform impairment reviews of goodwill at the reporting unit level, one level below the business segment. A reporting unit constitutes a business for which discrete profit and loss financial information is available. The Company’s reportable segments, Manufacturing and Distribution, are those based on the Company’s method of internal reporting, which segregates its businesses by product category and production/distribution process.
Once goodwill has been allocated to a reporting unit, it generally no longer retains its identification with a particular acquisition, but instead becomes identified with the reporting unit as a whole. The Company’s Manufacturing segment includes goodwill originating from the acquisitions of Gravure Ink (acquired in the Adorn Holdings, Inc. acquisition), Quality Hardwoods Sales, AIA, Infinity Graphics, Décor, Creative Wood, Middlebury Hardwoods, Frontline, Premier, Precision, Foremost, PolyDyn3 and Charleston. While Gravure Ink, AIA, Infinity Graphics, Décor, Creative Wood, Middlebury Hardwoods, Frontline, Premier, Precision, Foremost, PolyDyn3 and Charleston remain reporting units of the Company for which impairment is assessed, Quality Hardwoods is assessed for impairment as part of the Company’s hardwood door reporting unit. The Company’s Distribution segment includes goodwill originating from the acquisitions of Blazon, West Side and Foremost, which remain reporting units for which impairment is assessed.
Finite-lived intangible assets that meet certain criteria continue to be amortized over their useful lives and are also subject to an impairment test based on estimated undiscounted cash flows when impairment indicators exist. Newly acquired indefinite-lived assets are more vulnerable to impairments as the assets are recorded at fair value and are then subsequently measured at the lower of fair value or carrying value at the end of each reporting period. As such, immediately after acquisition, even a small decline in the outlook for these products can negatively impact our ability to recover the carrying value and can result in an impairment loss.
In 2012, we changed our methodology of evaluating goodwill for impairment. Based on revised guidance issued by the Financial Accounting Standards Board (“FASB”), we chose the option to first perform a qualitative assessment of the composition of the Company’s goodwill for impairment for the years ended December 31, 2014, 2013 and 2012. If the qualitative assessment indicates it is more likely than not that the fair value of the reporting unit is less than its carrying value, the Company then performs a quantitative assessment. When estimating fair value with the quantitative assessment, the Company calculates the present value of future cash flows based on projected future operating results and business plans, forecasted sales volumes, discount rates, comparable marketplace fair value data from within a comparable industry grouping, current industry and economic conditions, and historical results. If the fair value exceeds the carrying value, goodwill and other intangible assets are not impaired and no further steps are required.
Based on the results of our qualitative analysis, and where determined appropriate, our quantitative assessment analysis, we determined that the estimated fair value substantially exceeded the carrying value for each of our reporting units within the Manufacturing segment and within the Distribution segment. The goodwill allocated to the Manufacturing and Distribution segment reporting units as of December 31, 2014 was $25.6 million and $6.3 million, respectively. The comparable goodwill asset balances at December 31, 2013 were $13.7 million and $2.8 million, respectively.
Our qualitative assessment included an evaluation of macroeconomic conditions, RV and MH industry and market considerations including wholesale unit shipment levels, cost factors including price fluctuations on major commodities both purchased for use in various manufactured products and for distribution to customers, overall financial performance of the Company including the ability to re-finance our credit facility under more favorable terms, completion of acquisitions, an increase in our product line offerings and an expansion of our customer base, changes in our stock price valuation, and other relevant specific events.
In addition, there are no long-lived assets or asset groups, including tangible assets, for which we have determined that undiscounted cash flows are not substantially in excess of the carrying value or that could materially impact our operating results or total shareholders’ equity.
We have not made any other material changes to our methods of evaluating goodwill and intangible asset impairments during the last two years other than the performance of a qualitative assessment to test goodwill for impairment in 2014 and 2013. We do not believe there is a reasonable likelihood that there will be a material change in the estimates or assumptions used to determine impairment in the foreseeable future.
Deferred Income Taxes. The carrying value of the Company’s deferred tax assets assumes that the Company will be able to generate sufficient taxable income in future years to utilize these deferred tax assets. If these assumptions change, the Company may be required to record valuation allowances against its gross deferred tax assets, which would cause the Company to record additional income tax expense in the Company’s consolidated statements of income. Management evaluates the potential the Company will be able to realize its gross deferred tax assets and assesses the need for valuation allowances on a quarterly basis. There was no tax valuation allowance at December 31, 2014 and 2013. See Note 12 to the Consolidated Financial Statements for further details.
OTHER
Sale of Property
Not applicable.
Purchase of Property
In July 2014, the Company acquired (i) four owned facilities that housed the manufacturing operations pertaining to the acquisition of Precision. In November 2014, the Company acquired two owned facilities that housed the manufacturing operations pertaining to the acquisition of Charleston.
Inflation
The prices of key raw materials, consisting primarily of lauan, gypsum, particleboard, aluminum and components used by the Company that are made from these raw materials, are influenced by demand and other factors specific to these commodities, such as the price of oil, rather than being directly affected by inflationary pressures. Prices of certain commodities have historically been volatile and continued to fluctuate in 2014. During periods of rising commodity prices, we have generally been able to pass the increased costs to our customers in the form of surcharges and price increases. We do not believe that inflation had a material effect on results of operations for the periods presented.
|
ITEM 7A. |
QUANTITATIVE AND QUALITATIVE DISCLOSURES ABOUT MARKET RISK |
We are subject to market risk primarily in relation to our cash and short-term investments. The interest rate we may earn on the cash we invest in short-term investments is subject to market fluctuations. We utilize a mix of investment maturities based on our anticipated cash needs and evaluation of existing interest rates and market conditions. While we attempt to minimize market risk and maximize return, changes in market conditions may significantly affect the income we earn on our cash and cash equivalents and short-term investments.
At December 31, 2014, our total debt obligations under our 2012 Credit Agreement were under either LIBOR-based or prime rate-based interest rates. A 100 basis point increase in the underlying LIBOR and prime rates would result in additional annual interest cost of approximately $1.0 million, assuming average related revolving debt subject to variable rates of $101.1 million, which was the amount of related borrowings at December 31, 2014 subject to variable rates.
|
ITEM 8. |
FINANCIAL STATEMENTS AND SUPPLEMENTARY DATA |
The information required by this item is set forth in Item 15(a)(1) of Part IV on page 51 of this Annual Report.
|
ITEM 9. |
CHANGES IN AND DISAGREEMENTS WITH ACCOUNTANTS ON ACCOUNTING AND FINANCIAL DISCLOSURE |
Not applicable.
|
ITEM 9A. |
CONTROLS AND PROCEDURES |
Disclosure Controls and Procedures
The Company maintains “disclosure controls and procedures”, as such term is defined under Securities Exchange Act Rule 13a-15(e), that are designed to ensure that information required to be disclosed in our Securities Exchange Act of 1934, as amended (the “Exchange Act”) reports is recorded, processed, summarized and reported within the time periods specified in the SEC’s rules and forms, and that such information is accumulated and communicated to our management, including our Chief Executive Officer and Chief Financial Officer, as appropriate to allow for timely decisions regarding required disclosures. In designing and evaluating the disclosure controls and procedures, the Company’s management recognizes that any controls and procedures, no matter how well designed and operated, can provide only reasonable assurance of achieving the desired control objectives and the Company’s management necessarily is required to apply its judgment in evaluating the cost-benefit relationship of possible controls and procedures.
Under the supervision and with the participation of our senior management, including our Chief Executive Officer and Chief Financial Officer, the Company conducted an evaluation of the effectiveness of the design and operation of our disclosure controls and procedures. Based on this evaluation, our Chief Executive Officer and Chief Financial Officer concluded as of the Evaluation Date that our disclosure controls and procedures were effective such that the information relating to the Company, including consolidated subsidiaries, required to be disclosed in our reports filed under the Exchange Act is recorded, processed, summarized, and reported within the time periods specified in the SEC’s rules and forms, and is accumulated and communicated to the Company’s management, including our Chief Executive Officer and Chief Financial Officer, as appropriate to allow timely decisions regarding required disclosure.
Management’s Annual Report on Internal Control Over Financial Reporting
We are responsible for establishing and maintaining adequate internal control over financial reporting, as defined in Rule 13a-15(f) and 15d-15(f) under the Exchange Act. Our internal control system was designed to provide reasonable assurance regarding the fair and reliable preparation and presentation of our published financial statements. We continually evaluate our system of internal control over financial reporting to determine if changes are appropriate based upon changes in our operations or the business environment in which we operate.
All internal control systems, no matter how well designed, have inherent limitations. Therefore, even those systems determined to be effective can provide only reasonable assurance with respect to financial statement preparation and presentation.
Under the supervision and with the participation of our management, including our Chief Executive Officer and Chief Financial Officer, we conducted an assessment of the effectiveness of our internal control over financial reporting based on the framework in the 1992 Internal Control - Integrated Framework issued by the Committee of Sponsoring Organizations of the Treadway Commission (COSO). This assessment included a review of the documentation of controls, an assessment of the design effectiveness of controls, testing of the operating effectiveness of controls, and a conclusion on this evaluation. As permitted under SEC guidance, management’s assessment of and conclusion regarding the design and effectiveness of internal control over financial reporting excluded the internal control over financial reporting of the operations of businesses acquired in 2014, which are described in Note 4 to the Consolidated Financial Statements. Based on our assessment, we have concluded that our internal control over financial reporting was effective as of December 31, 2014.
The Company’s independent registered public accounting firm, Crowe Horwath LLP, audited our internal control over financial reporting as of December 31, 2014, as stated in their report in the section entitled “Report of Independent Registered Public Accounting Firm” included elsewhere in this Form 10-K, which expresses an unqualified opinion on the effectiveness of the Company’s internal control over financial reporting as of December 31, 2014.
Changes in internal control over financial reporting
There have been no changes in our internal control over financial reporting that occurred during the fourth quarter ended December 31, 2014 or subsequent to the date the Company completed its evaluation, that have materially affected, or are reasonably likely to materially affect, our internal control over financial reporting.
|
ITEM 9B. |
OTHER INFORMATION |
None.
PART III
|
ITEM 10. |
DIRECTORS, EXECUTIVE OFFICERS AND CORPORATE GOVERNANCE |
Directors of the Company
The information required by this item with respect to directors is set forth in our Proxy Statement for the Annual Meeting of Shareholders to be held on May 19, 2015, under the captions “Election of Directors” and “Section 16(a) Beneficial Ownership Reporting Compliance,” which information is hereby incorporated herein by reference.
Executive Officers of the Registrant
The information required by this item is set forth under the caption “Executive Officers of the Company” in Part I of this Annual Report.
Audit Committee
Information on our Audit Committee is contained under the caption “Audit Committee” in our Proxy Statement for the Annual Meeting of Shareholders to be held on May 19, 2015 and is incorporated herein by reference.
The Company has determined that John A. Forbes, Michael A. Kitson, Larry D. Renbarger, and Walter E. Wells all qualify as “audit committee financial experts” as defined in Item 407(d)(5)(ii) of Regulation S-K, and that these directors are “independent” as the term is used in 407(a)(1) of Regulation S-K.
Code of Ethics and Business Conduct
We have adopted a Code of Ethics and Business Conduct Policy applicable to all employees. Additionally, we have adopted a Code of Ethics Applicable to Senior Executives including, but not limited to, the Chief Executive Officer and Chief Financial Officer of the Company. Our Code of Ethics and Business Conduct, and our Code of Ethics Applicable to Senior Executives are available on the Company’s web site at www.patrickind.com under “Corporate Governance”. We intend to post on our web site any substantive amendments to, or waivers from, our Corporate Governance Guidelines and our Code of Ethics Applicable to Senior Executives. We will provide shareholders with a copy of these policies without charge upon written request directed to the Company’s Corporate Secretary at the Company’s address.
Corporate Governance
Information on our corporate governance practices is contained under the caption “Corporate Governance” in our Proxy Statement for the Annual Meeting of Shareholders to be held on May 19, 2015 and incorporated herein by reference.
|
ITEM 11. |
EXECUTIVE COMPENSATION |
The information required by this item is set forth in the Company’s Proxy Statement for the Annual Meeting of Shareholders to be held on May 19, 2015, under the captions “Executive Compensation – Compensation of Executive Officers and Directors,” “Compensation Committee Interlocks and Director Participation,” and “Compensation Committee Report,” and is incorporated herein by reference.
|
ITEM 12. |
SECURITY OWNERSHIP OF CERTAIN BENEFICIAL OWNERS AND MANAGEMENT AND RELATED STOCKHOLDER MATTERS |
The information required by this item is set forth in our Proxy Statement for the Annual Meeting of Shareholders to be held on May 19, 2015, under the captions “Equity Compensation Plan Information” and “Security Ownership of Certain Beneficial Owners and Management,” and is incorporated herein by reference.
|
ITEM 13. |
CERTAIN RELATIONSHIPS AND RELATED TRANSACTIONS, AND DIRECTOR INDEPENDENCE |
The information required by this item is set forth in our Proxy Statement for the Annual Meeting of Shareholders to be held on May 19, 2015, under the captions “Related Party Transactions” and “Independent Directors,” and is incorporated herein by reference.
|
ITEM 14. |
PRINCIPAL ACCOUNTING FEES AND SERVICES |
The information required by this item is set forth in our Proxy Statement for the Annual Meeting of Shareholders to be held on May 19, 2015, under the heading “Independent Public Accountants,” and is incorporated herein by reference.
PART IV
|
ITEM 15. |
EXHIBITS AND FINANCIAL STATEMENT SCHEDULES |
|
(a) |
(1) The financial statements listed in the accompanying Index to the Financial Statements on page F-1 of the separate financial section of this Report are incorporated herein by reference. |
| (3) The exhibits required to be filed as part of this Annual Report on Form 10-K are listed under (c) below. | |
| (c) | Exhibits |
|
Exhibit Number |
Exhibits | ||
|
2.1 |
Asset Purchase Agreement, dated October 26, 2012, between Patrick Industries, Inc., Middlebury Hardwood Products, Inc. and its Shareholders (filed as Exhibit 2.1 to the Company’s Form 8-K filed on October 30, 2012 and incorporated herein by reference). | ||
| 2.2 |
Asset Purchase Agreement, dated June 27, 2014, between Patrick Industries, Inc., Foremost Fabricators, LLC and its Members (filed as Exhibit 2.1 to the Company’s Form 8-K filed on July 3, 2014 and incorporated herein by reference). | ||
| 3.1 | Articles of Incorporation of Patrick Industries, Inc. (filed as Exhibit 3.1 to the Company’s Form 10-K filed on March 30, 2010 and incorporated herein by reference). | ||
|
3.2 |
Amended and Restated By-laws (filed as Exhibit 3.1 to the Company’s Form 8-K on January 21, 2009 and incorporated herein by reference). | ||
|
Exhibit Number |
Exhibits | ||
|
4.1 |
Rights Agreement, dated March 21, 2006, between Patrick Industries, Inc. and National City Bank, as Rights Agent (filed as Exhibit 10.1 to the Company’s Form 8-K filed on March 23, 2006 and incorporated herein by reference). | ||
|
4.2 |
Amendment No. 1 to Rights Agreement, dated May 18, 2007, between Patrick Industries, Inc. and National City Bank, as Rights Agent (filed as Exhibit 10.5 to the Company’s Form 8-K filed on May 24, 2007 and incorporated herein by reference). | ||
|
4.3 |
Amendment No. 2 to Rights Agreement, dated March 12, 2008, between Patrick Industries, Inc. and National City Bank, as Rights Agent (filed as Exhibit 10.3 to the Company’s Form 8-K filed on March 13, 2008 and incorporated herein by reference). | ||
|
4.4 |
Second Amended and Restated Registration Rights Agreement, dated as of December 11, 2008, by and among Patrick Industries, Inc., Tontine Capital Partners, L.P., Tontine Capital Overseas Master Fund, L.P. and the lenders party thereto (filed as Exhibit 10.3 to the Company’s Form 8-K filed on December 15, 2008 and incorporated herein by reference). | ||
|
4.5 |
Amendment No. 1 dated as of March 31, 2011, to the Second Amended and Restated Registration Rights Agreement, by and among Patrick Industries, Inc., Tontine Capital Partners, L.P., Tontine Capital Overseas Master Fund, L.P. and the lenders party thereto (filed as Exhibit 10.9 to the Company’s Form 8-K filed on April 5, 2011 and incorporated herein by reference). | ||
|
4.6 |
Amendment No. 2 dated as of September 16, 2011, to the Second Amended and Restated Registration Rights Agreement, between Patrick Industries, Inc. and Tontine Capital Overseas Master Fund II, L.P., Northcreek Mezzanine Fund I, L.P., and Stinger Northcreek PATK LLC (filed as Exhibit 10.7 to the Company’s Form 8-K filed on September 22, 2011 and incorporated herein by reference). | ||
|
10.1 |
Patrick Industries, Inc. 2009 Omnibus Incentive Plan (filed as Appendix A to the Company’s revised Definitive Proxy Statement on Schedule 14A filed on October 20, 2009 and incorporated herein by reference). | ||
|
10.2* |
Form of Employment Agreements with Executive Officers (filed as Exhibit 10.2 to the Company’s Form 10-K filed on March 30, 2010 and incorporated herein by reference). | ||
|
10.3* |
Form of Officers Retirement Agreement (filed as Exhibit 10.3 to the Company’s Form 10-K filed on March 30, 2010 and incorporated herein by reference). | ||
|
10.4* |
Form of Non-Qualified Stock Option Award (filed as Exhibit 10.4 to the Company’s Form 10-K filed on March 14, 2014 and incorporated herein by reference). | ||
| 10.5* |
Form of Officer and Employee Restricted Stock Award (filed as Exhibit 10.5 to the Company’s Form 10-K filed on March 30, 2010 and incorporated herein by reference). | ||
|
10.6* |
Form of Officer and Employee Time Based Restricted Share Award and Performance Contingent Restricted Share Award (filed as Exhibit 10.7 to the Company’s Form 10-K filed on March 29, 2012 and incorporated herein by reference). | ||
| 10.7 | Form of Non-Employee Director Restricted Share Award (filed as Exhibit 10.2 to the Company’s Form 10-Q filed on November 8, 2011 and incorporated herein by reference). | ||
| 10.8* | Form of Stock Appreciation Rights Award (filed as Exhibit 10.9 to the Company’s Form 10-K filed on March 14, 2014 and incorporated herein by reference). | ||
| 10.9* | Form of Performance Share Unit Award (filed as Exhibit 10.1 to the Company’s Form 10-Q filed on May 8, 2014 and incorporated herein by reference). | ||
|
Exhibit Number |
Exhibits | ||
|
10.10 |
Credit Agreement, dated as of October 24, 2012, between Patrick Industries, Inc., the lenders party thereto and Wells Fargo Bank, National Association, as the Agent (filed as Exhibit 10.1 to the Company’s Form 8-K filed on October 30, 2012 and incorporated herein by reference). | ||
| 10.11 | First Amendment, dated November 16, 2012, to the Credit Agreement, dated as of October 24, 2012, between Patrick Industries, Inc., the lenders party thereto and Wells Fargo Bank, National Association, as the Agent (filed as Exhibit 10.21 to the Company’s Form 10-K filed on March 29, 2013 and incorporated herein by reference). | ||
| 10.12 | Second Amendment, dated June 28, 2013, to the Credit Agreement, dated as of October 24, 2012, between Patrick Industries, Inc., the lenders party thereto and Wells Fargo Bank, National Association, as the Agent (filed as Exhibit 10.1 to the Company’s Form 10-Q filed on August 13, 2013 and incorporated herein by reference). | ||
| 10.13 | Third Amendment, dated November 30, 2013, to the Credit Agreement, dated as of October 24, 2012, between Patrick Industries, Inc., the lenders party thereto and Wells Fargo Bank, National Association, as the Agent (filed as Exhibit 10.13 to the Company’s Form 10-K filed on March 14, 2014 and incorporated herein by reference). | ||
| 10.14 | Fourth Amendment, dated June 26, 2014, to the Credit Agreement, dated as of October 24, 2012, between Patrick Industries, Inc., the lenders party thereto and Wells Fargo Bank, National Association, as the Agent (filed as Exhibit 10.1 to the Company’s Form 8-K filed on July 3, 2014 and incorporated herein by reference). | ||
| 10.15 | Fifth Amendment, dated November 7, 2014, to the Credit Agreement, dated as of October 24, 2012, between Patrick Industries, Inc., the lenders party thereto and Wells Fargo Bank, National Association, as the Agent (filed as Exhibit 10.1 to the Company’s Form 8-K on November 12, 2014 and incorporated herein by reference). | ||
| 10.16** | Sixth Amendment, dated February 13, 2015, to the Credit Agreement, dated as of October 24, 2012, between Patrick Industries, Inc., the lenders party thereto and Wells Fargo Bank, National Association, as the Agent. | ||
|
10.17 |
Security Agreement, dated as of October 24, 2012, between Patrick Industries, Inc., the other Grantors party thereto and Wells Fargo Bank, National Association, as the Agent (filed as Exhibit 10.2 to the Company’s Form 8-K filed on October 30, 2012 and incorporated herein by reference). | ||
|
12** |
Statement of Computation of Operating Ratios. | ||
|
21** |
Subsidiaries of the Registrant. | ||
| 23** | Consent of Crowe Horwath LLP. | ||
|
31.1** |
Certification pursuant to Section 302 of the Sarbanes-Oxley Act of 2002 by Chief Executive Officer. | ||
|
31.2** |
Certification pursuant to Section 302 of the Sarbanes-Oxley Act of 2002 by Chief Financial Officer. | ||
|
32** |
Certification pursuant to 18 U.S.C. Section 1350. | ||
XBRL Exhibits.
Interactive Data Files. The following materials are filed electronically with this Annual Report on Form 10-K:
|
101.INS |
XBRL Instance Document |
|
101.SCH |
XBRL Taxonomy Schema Document |
|
101.CAL |
XBRL Taxonomy Calculation Linkbase Document |
|
101.DEF |
XBRL Taxonomy Definition Linkbase Document |
|
101.LAB |
XBRL Taxonomy Label Linkbase Document |
|
101.PRE |
XBRL Taxonomy Presentation Linkbase Document |
Attached as Exhibits 101 to this report are the following financial statements from the Company’s Annual Report on Form 10-K for the year ended December 31, 2014 formatted in XBRL (“eXtensible Business Reporting Language”): (i) the Consolidated Statements of Financial Position, (ii) the Consolidated Statements of Income, (iii) the Consolidated Statements of Comprehensive Income, (iv) the Consolidated Statements of Shareholders’ Equity, and (v) the Consolidated Statements of Cash Flows, and the related Notes to these financial statements in detail tagging format.
*Management contract or compensatory plan or arrangement.
**Filed herewith.
All other financial statement schedules are omitted because they are not applicable or the required information is immaterial or is shown in the Notes to the Consolidated Financial Statements.
SIGNATURES
Pursuant to the requirements of Section 13 or 15(d) of the Securities Exchange Act of 1934, the registrant has duly caused this report to be signed on its behalf by the undersigned, thereunto duly authorized.
|
|
PATRICK INDUSTRIES, INC. | ||
|
|
|
|
|
|
|
|
|
|
|
Date: March 13, 2015 |
|
By: |
/s/ Todd M. Cleveland |
|
|
|
|
Todd M. Cleveland |
|
|
|
|
President and Chief Executive Officer |
Pursuant to the Requirements of the Securities Exchange Act of 1934, this report has been signed below by the following persons on behalf of the registrant and in the capacities and on the dates indicated.
|
Signature |
|
Title |
|
Date |
|
|
|
|
|
|
|
/s/ Paul E. Hassler |
|
Chairman of the Board |
|
March 13, 2015 |
|
Paul E. Hassler |
|
|
|
|
|
|
|
|
|
|
|
/s/ Todd M. Cleveland |
|
President and Chief Executive Officer and Director |
|
March 13, 2015 |
|
Todd M. Cleveland |
|
(Principal Executive Officer) |
|
|
|
|
|
|
|
|
|
/s/ Andy L. Nemeth |
|
Executive Vice President-Finance, Secretary Treasurer, Chief Financial Officer and Director |
|
March 13, 2015 |
|
Andy L. Nemeth |
|
(Principal Financial and Accounting Officer) |
|
|
|
|
|
|
|
|
|
/s/ Joseph M. Cerulli |
|
Director |
|
March 13, 2015 |
|
Joseph M. Cerulli |
|
|
|
|
|
|
|
|
|
|
|
/s/ John A. Forbes |
|
Director |
|
March 13, 2015 |
|
John A. Forbes |
|
|
|
|
|
|
|
|
|
|
|
/s/ Michael A. Kitson |
|
Director |
|
March 13, 2015 |
|
Michael A. Kitson |
|
|
|
|
|
|
|
|
|
|
| /s/ Larry D. Renbarger | Director | March 13, 2015 | ||
| Larry D. Renbarger | ||||
|
/s/ Walter E. Wells |
Director | March 13, 2015 | ||
| Walter E. Wells |
PATRICK INDUSTRIES, INC.
Index to the Financial Statements
|
Report of Independent Registered Public Accounting Firm, Crowe Horwath LLP |
F-2 |
|
Financial Statements: |
|
|
Consolidated Statements of Financial Position |
F-3 |
|
Consolidated Statements of Income |
F-4 |
|
Consolidated Statements of Comprehensive Income |
F-5 |
|
Consolidated Statements of Shareholders' Equity |
F-6 |
|
Consolidated Statements of Cash Flows |
F-7 |
|
Notes to Consolidated Financial Statements |
F-8 |
Report of Independent Registered Public Accounting Firm
To the Shareholders and Board of Directors of Patrick Industries, Inc.:
We have audited the accompanying consolidated statements of financial position of Patrick Industries, Inc. and subsidiary (the “Company”) as of December 31, 2014 and 2013, and the related statements of income, comprehensive income, shareholders' equity, and cash flows for each of the years in the three-year period ended December 31, 2014. We also have audited the Company's internal control over financial reporting as of December 31, 2014, based on criteria established in the 1992 Internal Control – Integrated Framework issued by the Committee of Sponsoring Organizations of the Treadway Commission (COSO). The Company's management is responsible for these financial statements, for maintaining effective internal control over financial reporting, and for its assessment of the effectiveness of internal control over financial reporting, included in the accompanying “Management’s Annual Report on Internal Control Over Financial Reporting”. Our responsibility is to express an opinion on these financial statements and an opinion on the company's internal control over financial reporting based on our audits.
We conducted our audits in accordance with the standards of the Public Company Accounting Oversight Board (United States). Those standards require that we plan and perform the audits to obtain reasonable assurance about whether the financial statements are free of material misstatement and whether effective internal control over financial reporting was maintained in all material respects. Our audits of the financial statements included examining, on a test basis, evidence supporting the amounts and disclosures in the financial statements, assessing the accounting principles used and significant estimates made by management, and evaluating the overall financial statement presentation. Our audit of internal control over financial reporting included obtaining an understanding of internal control over financial reporting, assessing the risk that a material weakness exists, and testing and evaluating the design and operating effectiveness of internal control based on the assessed risk. Our audits also included performing such other procedures, as we considered necessary in the circumstances. We believe that our audits provide a reasonable basis for our opinions.
A company's internal control over financial reporting is a process designed to provide reasonable assurance regarding the reliability of financial reporting and the preparation of financial statements for external purposes in accordance with generally accepted accounting principles. A company's internal control over financial reporting includes those policies and procedures that (1) pertain to the maintenance of records that, in reasonable detail, accurately and fairly reflect the transactions and dispositions of the assets of the company; (2) provide reasonable assurance that transactions are recorded as necessary to permit preparation of financial statements in accordance with generally accepted accounting principles, and that receipts and expenditures of the company are being made only in accordance with authorizations of management and directors of the company; and (3) provide reasonable assurance regarding prevention or timely detection of unauthorized acquisition, use, or disposition of the company's assets that could have a material effect on the financial statements.
Because of its inherent limitations, internal control over financial reporting may not prevent or detect misstatements. Also, projections of any evaluation of effectiveness to future periods are subject to the risk that controls may become inadequate because of changes in conditions, or that the degree of compliance with the policies or procedures may deteriorate.
As permitted, the Company has excluded the operations of businesses acquired during 2014, which are described in Note 4 of the consolidated financial statements, from the scope of the accompanying “Management’s Annual Report on Internal Control Over Financial Reporting”. As such, they have also been excluded from the scope of our audit of internal control over financial reporting.
In our opinion, the financial statements referred to above present fairly, in all material respects, the financial position of Patrick Industries, Inc. and subsidiary as of December 31, 2014 and 2013, and the results of their operations and their cash flows for each of the years in the three-year period ended December 31, 2014 in conformity with accounting principles generally accepted in the United States of America. Also in our opinion, the Company maintained, in all material respects, effective internal control over financial reporting as of December 31, 2014, based on criteria established in the 1992 Internal Control – Integrated Framework issued by COSO.
|
|
/s/ Crowe Horwath LLP |
Elkhart, Indiana
March 13, 2015
PATRICK INDUSTRIES, INC.
CONSOLIDATED STATEMENTS OF FINANCIAL POSITION
|
As of December 31, |
||||||||
|
(thousands) |
2014 |
2013 |
||||||
|
ASSETS |
||||||||
|
Current Assets |
||||||||
|
Cash and cash equivalents |
$ | 123 | $ | 34 | ||||
|
Trade receivables, net of allowance for doubtful accounts (2014: $175; 2013: $225) |
32,637 | 22,644 | ||||||
|
Inventories |
71,020 | 56,510 | ||||||
|
Deferred tax assets |
4,563 | 3,762 | ||||||
|
Prepaid expenses and other |
6,453 | 4,749 | ||||||
|
Total current assets |
114,796 | 87,699 | ||||||
|
Property, plant and equipment, net |
57,353 | 42,117 | ||||||
|
Goodwill |
31,630 | 16,495 | ||||||
|
Other intangible assets, net |
49,544 | 25,611 | ||||||
|
Deferred financing costs, net of accumulated amortization (2014: $1,770; 2013: $1,405) |
1,024 | 1,283 | ||||||
|
Other non-current assets |
1,214 | 982 | ||||||
|
TOTAL ASSETS |
$ | 255,561 | $ | 174,187 | ||||
|
LIABILITIES AND SHAREHOLDERS’ EQUITY |
||||||||
|
Current Liabilities |
||||||||
|
Accounts payable |
$ | 29,754 | $ | 18,826 | ||||
|
Accrued liabilities |
15,388 | 13,585 | ||||||
|
Total current liabilities |
45,142 | 32,411 | ||||||
|
Long-term debt |
101,054 | 55,000 | ||||||
|
Deferred compensation and other |
2,239 | 2,546 | ||||||
|
Deferred tax liabilities |
4,358 | 1,920 | ||||||
|
TOTAL LIABILITIES |
152,793 | 91,877 | ||||||
|
COMMITMENTS AND CONTINGENCIES |
||||||||
|
SHAREHOLDERS’ EQUITY |
||||||||
|
Preferred stock, no par value; authorized 1,000,000 shares |
- | - | ||||||
|
Common stock, no par value; authorized 20,000,000 shares; issued 2014 - 10,333,720 shares; issued 2013 - 10,568,430 shares |
54,769 | 53,863 | ||||||
|
Additional paid-in-capital |
7,459 | 6,604 | ||||||
|
Accumulated other comprehensive income |
31 | 54 | ||||||
|
Retained earnings |
40,509 | 21,789 | ||||||
|
TOTAL SHAREHOLDERS’ EQUITY |
102,768 | 82,310 | ||||||
|
TOTAL LIABILITIES AND SHAREHOLDERS’ EQUITY |
$ | 255,561 | $ | 174,187 | ||||
See accompanying Notes to Consolidated Financial Statements.
PATRICK INDUSTRIES, INC.
CONSOLIDATED STATEMENTS OF INCOME
|
(thousands except per share data) |
For the years ended December 31, |
|||||||||||
|
2014 |
2013 |
2012 |
||||||||||
|
NET SALES |
$ | 735,717 | $ | 594,931 | $ | 437,367 | ||||||
|
Cost of goods sold |
617,214 | 503,908 | 371,623 | |||||||||
|
GROSS PROFIT |
118,503 | 91,023 | 65,744 | |||||||||
|
Operating Expenses: |
||||||||||||
|
Warehouse and delivery |
26,163 | 20,158 | 15,782 | |||||||||
|
Selling, general and administrative |
36,362 | 27,979 | 21,637 | |||||||||
|
Amortization of intangible assets |
4,477 | 2,371 | 1,523 | |||||||||
|
(Gain) loss on sale of fixed assets and acquisition of business |
30 | (430 | ) | (238 | ) | |||||||
|
Total operating expenses |
67,032 | 50,078 | 38,704 | |||||||||
|
OPERATING INCOME |
51,471 | 40,945 | 27,040 | |||||||||
|
Stock warrants revaluation |
- | - | 1,731 | |||||||||
|
Interest expense, net |
2,393 | 2,171 | 4,037 | |||||||||
|
Income before income taxes (credit) |
49,078 | 38,774 | 21,272 | |||||||||
|
Income taxes (credit) |
18,404 | 14,734 | (6,823 | ) | ||||||||
|
NET INCOME |
$ | 30,674 | $ | 24,040 | $ | 28,095 | ||||||
|
BASIC NET INCOME PER COMMON SHARE |
$ | 2.88 | $ | 2.24 | $ | 2.66 | ||||||
|
DILUTED NET INCOME PER COMMON SHARE |
$ | 2.87 | $ | 2.23 | $ | 2.64 | ||||||
|
Weighted average shares outstanding - Basic |
10,634 | 10,733 | 10,558 | |||||||||
|
Weighted average shares outstanding - Diluted |
10,693 | 10,786 | 10,637 | |||||||||
See accompanying Notes to Consolidated Financial Statements.
PATRICK INDUSTRIES, INC.
CONSOLIDATED STATEMENTS OF COMPREHENSIVE INCOME
|
(thousands) |
For the years ended December 31, |
|||||||||||
|
2014 |
2013 |
2012 |
||||||||||
|
NET INCOME |
$ | 30,674 | $ | 24,040 | $ | 28,095 | ||||||
|
Change in accumulated pension obligation, net of tax (Note 13) |
(23 | ) | 37 | 200 | ||||||||
|
COMPREHENSIVE INCOME |
$ | 30,651 | $ | 24,077 | $ | 28,295 | ||||||
See accompanying Notes to Consolidated Financial Statements.
PATRICK INDUSTRIES, INC.
CONSOLIDATED STATEMENTS OF SHAREHOLDERS' EQUITY
Years Ended December 31, 2014, 2013 and 2012
|
(thousands except share data) |
Preferred Stock |
Common Stock |
Additional Paid-in-Capital |
Accumulated Other Comprehensive Income (Loss) |
Retained Earnings (Accumulated Deficit) |
Total |
||||||||||||||||||
|
Balance December 31, 2011 |
$ | - | $ | 54,242 | $ | 1,293 | $ | (183 | ) | $ | (26,510 | ) | $ | 28,842 | ||||||||||
|
Net income |
- | - | - | - | 28,095 | 28,095 | ||||||||||||||||||
|
Change in accumulated pension obligation, net of tax |
- | - | - | 200 | - | 200 | ||||||||||||||||||
|
Issuance of 100,000 shares for an acquisition |
- | 600 | 42 | - | - | 642 | ||||||||||||||||||
|
Issuance of 291,856 shares upon exercise of common stock warrants |
- | 275 | 2,647 | - | - | 2,922 | ||||||||||||||||||
|
Issuance of 362,250 shares upon exercise of common stock options |
- | 113 | 323 | - | - | 436 | ||||||||||||||||||
|
Shares used to pay taxes on stock grants |
- | (531 | ) | - | - | - | (531 | ) | ||||||||||||||||
|
Stock-based compensation expense |
- | 802 | - | - | - | 802 | ||||||||||||||||||
|
Balance December 31, 2012 |
$ | - | $ | 55,501 | $ | 4,305 | $ | 17 | $ | 1,585 | $ | 61,408 | ||||||||||||
|
Net income |
- | - | - | - | 24,040 | 24,040 | ||||||||||||||||||
|
Change in accumulated pension obligation, net of tax |
- | - | - | 37 | - | 37 | ||||||||||||||||||
|
Stock repurchases under buyback program |
- | (2,081 | ) | (161 | ) | - | (3,836 | ) | (6,078 | ) | ||||||||||||||
|
Realization of excess tax benefit on stock-based compensation |
- | - | 2,409 | - | - | 2,409 | ||||||||||||||||||
|
Issuance of 46,000 shares upon exercise of common stock options |
- | 13 | 51 | - | - | 64 | ||||||||||||||||||
|
Shares used to pay taxes on stock grants |
- | (882 | ) | - | - | - | (882 | ) | ||||||||||||||||
|
Stock-based compensation expense |
- | 1,312 | - | - | - | 1,312 | ||||||||||||||||||
|
Balance December 31, 2013 |
$ | - | $ | 53,863 | $ | 6,604 | $ | 54 | $ | 21,789 | $ | 82,310 | ||||||||||||
|
Net income |
- | - | - | - | 30,674 | 30,674 | ||||||||||||||||||
|
Change in accumulated pension obligation, net of tax |
- | - | - | (23 | ) | - | (23 | ) | ||||||||||||||||
|
Stock repurchases under buyback program |
- | (1,758 | ) | (216 | ) | - | (11,954 | ) | (13,928 | ) | ||||||||||||||
|
Realization of excess tax benefit on stock-based compensation |
- | - | 1,071 | - | - | 1,071 | ||||||||||||||||||
|
Issuance of 15,000 shares upon exercise of common stock options |
- | 26 | - | - | - | 26 | ||||||||||||||||||
|
Shares used to pay taxes on stock grants |
- | (644 | ) | - | - | - | (644 | ) | ||||||||||||||||
|
Stock-based compensation expense |
- | 3,282 | - | - | - | 3,282 | ||||||||||||||||||
|
Balance December 31, 2014 |
$ | - | $ | 54,769 | $ | 7,459 | $ | 31 | $ | 40,509 | 102,768 | |||||||||||||
See accompanying Notes to Consolidated Financial Statements.
PATRICK INDUSTRIES, INC.
CONSOLIDATED STATEMENTS OF CASH FLOWS
|
(thousands) |
For the years ended December 31, |
|||||||||||
|
2014 |
2013 |
2012 |
||||||||||
|
CASH FLOWS FROM OPERATING ACTIVITIES |
||||||||||||
|
Net income |
$ | 30,674 | $ | 24,040 | $ | 28,095 | ||||||
|
Adjustments to reconcile net income to net cash provided by operating activities: |
||||||||||||
|
Depreciation |
5,956 | 4,926 | 4,063 | |||||||||
|
Amortization of intangible assets |
4,477 | 2,371 | 1,523 | |||||||||
|
Stock-based compensation expense |
3,282 | 1,312 | 802 | |||||||||
|
Deferred compensation expense |
133 | 367 | 194 | |||||||||
|
Provision for bad debts |
137 | 24 | 340 | |||||||||
|
Deferred income taxes |
1,652 | 3,983 | 8,401 | |||||||||
|
Reduction of tax valuation allowance |
- | - | (15,570 | ) | ||||||||
|
(Gain) loss on sale of fixed assets and acquisition of business |
30 | (430 | ) | (238 | ) | |||||||
|
Stock warrants revaluation |
- | - | 1,731 | |||||||||
|
Increase in cash surrender value of life insurance |
(134 | ) | (24 | ) | (88 | ) | ||||||
|
Deferred financing cost amortization |
365 | 430 | 543 | |||||||||
|
Amortization of debt discount |
- | - | 832 | |||||||||
|
Change in operating assets and liabilities, net of the effects of acquisitions: |
||||||||||||
|
Trade receivables |
(1,942 | ) | (1,477 | ) | 1,034 | |||||||
|
Inventories |
(1,660 | ) | (7,482 | ) | (14,182 | ) | ||||||
|
Prepaid expenses and other |
(1,521 | ) | (1,576 | ) | (1,279 | ) | ||||||
|
Accounts payable and accrued liabilities |
4,625 | (3,648 | ) | 5,188 | ||||||||
|
Payments on deferred compensation obligations |
(333 | ) | (385 | ) | (392 | ) | ||||||
|
Net cash provided by operating activities |
45,741 | 22,431 | 20,997 | |||||||||
|
CASH FLOWS FROM INVESTING ACTIVITIES |
||||||||||||
|
Capital expenditures |
(6,542 | ) | (8,669 | ) | (7,895 | ) | ||||||
|
Proceeds from sale of property, equipment and facility |
113 | 1,021 | 34 | |||||||||
|
Business acquisitions |
(72,094 | ) | (16,511 | ) | (29,262 | ) | ||||||
|
Other |
(98 | ) | (97 | ) | (99 | ) | ||||||
|
Net cash used in investing activities |
(78,621 | ) | (24,256 | ) | (37,222 | ) | ||||||
|
CASH FLOWS FROM FINANCING ACTIVITIES |
||||||||||||
|
Long-term debt borrowings, net |
46,054 | 5,284 | 16,930 | |||||||||
|
Short-term debt payments, net |
- | - | (1,000 | ) | ||||||||
|
Stock repurchases under buyback program |
(13,928 | ) | (6,078 | ) | - | |||||||
|
Realization of excess tax benefit on stock-based compensation |
1,071 | 2,409 | - | |||||||||
|
Payment of deferred financing costs |
(106 | ) | (101 | ) | (257 | ) | ||||||
|
Proceeds from exercise of stock options, including tax benefit |
26 | 64 | 436 | |||||||||
|
Payments on capital lease obligations |
(148 | ) | (153 | ) | - | |||||||
|
Net cash provided by financing activities |
32,969 | 1,425 | 16,109 | |||||||||
|
Increase (decrease) in cash and cash equivalents |
89 | (400 | ) | (116 | ) | |||||||
|
Cash and cash equivalents at beginning of year |
34 | 434 | 550 | |||||||||
|
Cash and cash equivalents at end of year |
$ | 123 | $ | 34 | $ | 434 | ||||||
See accompanying Notes to Consolidated Financial Statements.
PATRICK INDUSTRIES, INC.
NOTES TO CONSOLIDATED FINANCIAL STATEMENTS
|
1. |
BASIS OF PRESENTATION |
Nature of Business
Patrick Industries, Inc. (“Patrick” or the “Company”) operations consist of the manufacture and distribution of building products and materials for use primarily by the recreational vehicle (“RV”), manufactured housing (“MH”), and industrial markets for customers throughout the United States and Canada. The Company maintains 32 manufacturing plants and 16 distribution facilities located in 10 states. Patrick operates in two business segments: Manufacturing and Distribution.
Principles of Consolidation and Basis of Presentation
The accompanying consolidated financial statements have been prepared pursuant to the rules and regulations of the Securities and Exchange Commission and in accordance with accounting principles generally accepted in the United States of America (“U.S. GAAP”). The consolidated financial statements include the accounts of Patrick and its wholly owned subsidiary, Adorn Holdings, Inc. (“Adorn”). All significant intercompany accounts and transactions have been eliminated in consolidation. Unallocated expenses, when combined with the operating segments and after the elimination of intersegment revenues, total to the amounts included in the consolidated financial statements.
In preparation of Patrick’s consolidated financial statements as of December 31, 2014, management evaluated all material subsequent events or transactions that occurred after the balance sheet date through the date of issuance of the Form 10-K for potential recognition or disclosure in the consolidated financial statements. See Notes 4, 9, 14 and 18 for events that occurred subsequent to the balance sheet date.
Use of Estimates
The preparation of the consolidated financial statements in conformity with U.S. GAAP requires management to make estimates and assumptions that affect the amounts reported in the consolidated financial statements and accompanying notes. Significant estimates include the valuation of goodwill, the valuation of long-lived assets, the allowance for doubtful accounts, excess and obsolete inventories, and deferred tax asset valuation allowances. Actual results could differ from the amounts reported.
|
2. |
SUMMARY OF SIGNIFICANT ACCOUNTING POLICIES AND PRACTICES |
Revenue Recognition
The Company ships product based on specific orders from customers and revenue is recognized at the time of passage of title and risk of loss to the customer, which is generally upon delivery. The Company’s selling price is fixed and determined at the time of shipment and collectability is reasonably assured and not contingent upon the customer’s use or resale of the product.
The Company records freight billed to customers in net sales and the corresponding costs incurred for shipping and handling are recorded in warehouse and delivery expenses. The amounts recorded in warehouse and delivery expenses related to these customer billed freight costs were $0.9 million, $0.8 million and $0.7 million for 2014, 2013 and 2012, respectively.
Estimated costs related to customer volume rebates and sales incentives are accrued as a reduction of revenue at the time products are sold.
Costs and Expenses
Cost of goods sold includes material costs, direct and indirect labor, overhead expenses, inbound freight charges, inspection costs, internal transfer costs, receiving costs, and other costs.
Warehouse and delivery expenses include salaries and wages, building rent and insurance, and other overhead costs related to distribution operations and delivery costs related to the shipment of finished and distributed products to customers. Purchasing costs are included in selling, general and administrative (“SG&A”) expenses.
Income Per Common Share
Basic net income per common share is computed by dividing net income by the weighted-average number of common shares outstanding. Diluted net income per common share is computed by dividing net income by the weighted-average number of common shares outstanding, plus the dilutive effect of stock options, stock appreciation rights, restricted stock units, and warrants (collectively “Common Stock Equivalents”). The dilutive effect of Common Stock Equivalents is calculated under the treasury stock method using the average market price for the period. Certain Common Stock Equivalents were not included in the computation of diluted net income per common share because the exercise prices of those Common Stock Equivalents were greater than the average market price of the common shares. See Note 15 for the calculation of both basic and diluted net income per common share.
Cash and Cash Equivalents
The Company considers all highly liquid investments with a maturity of three months or less at the time of purchase to be cash equivalents.
Trade Receivables
Trade receivables consist primarily of amounts due to the Company from its normal business activities. In assessing the carrying value of its trade receivables, the Company estimates the recoverability by making assumptions based on factors such as current overall and industry-specific economic conditions, historical and anticipated customer performance, historical write-off and collection experience, the level of past-due amounts, and specific risks identified in the trade receivables portfolio.
The following table summarizes the changes in the allowance for doubtful accounts:
|
(thousands) |
2014 |
2013 |
2012 |
|||||||||
|
Balance at January 1 |
$ | 225 | $ | 275 | $ | 815 | ||||||
|
Provisions made during the year |
137 | 24 | 340 | |||||||||
|
Write-offs |
(193 | ) | (149 | ) | (892 | ) | ||||||
|
Recoveries during the year |
6 | 75 | 12 | |||||||||
|
Balance at December 31 |
$ | 175 | $ | 225 | $ | 275 | ||||||
Inventories
Inventories are stated at the lower of cost (First-In, First-Out (FIFO) Method) or market. Based on the inventory aging and other considerations for realizable value, the Company writes down the carrying value to market value where appropriate. The Company reviews inventory on-hand and records provisions for obsolete inventory based on current assessments of future demands, market conditions, and related management initiatives. Any significant unanticipated changes in demand could have a significant impact on the value of the Company’s inventory and operating results. The cost of manufactured inventories includes raw materials, inbound freight, labor and overhead. The Company’s distribution inventories include the cost of raw materials and inbound freight.
Property, Plant and Equipment
Property, plant and equipment (“PP&E”) is generally recorded at cost. However, PP&E acquired in connection with an acquisition is recorded at fair value. Depreciation is computed primarily by the straight-line method applied to individual items based on estimated useful lives, which generally range from 10 to 30 years for buildings and improvements, and from three to seven years for machinery, equipment and transportation equipment. Leasehold improvements are amortized over the lesser of their useful lives or the related lease term. When properties are retired or disposed, the costs and accumulated depreciation are eliminated and the resulting profit or loss is recognized in the results of operations. Long-lived assets other than goodwill and intangible assets that are held for sale are recorded at the lower of the carrying value or the fair market value less the estimated cost to sell. The recoverability of PP&E is evaluated whenever events or changes in circumstances indicate that the carrying amount of the assets may not be recoverable, primarily based on estimated selling price, appraised value or projected future cash flows.
Goodwill and Intangible Assets
Assets and liabilities acquired in business combinations are accounted for using the purchase method and are recorded at their respective fair values. Upon acquisition, goodwill and other intangible assets are assigned to reporting units which are one level below the Company’s business segments. Goodwill and indefinite-lived intangible assets are not amortized but are subject to an annual (or under certain circumstances more frequent) impairment test based on their estimated fair value. The Company performs the required test for goodwill and indefinite-lived intangible assets impairment in the fourth quarter, or more frequently, if events or changes in circumstances indicate that the carrying value may exceed the fair value. Finite-lived intangible assets relate to customer relationships and non-compete agreements. Finite-lived intangible assets that meet certain criteria continue to be amortized over their useful lives and are also subject to an impairment test based on estimated undiscounted cash flows when impairment indicators exist. Intangible assets acquired in business combinations are initially recorded at their estimated fair values as determined by an income valuation approach using Level III fair value inputs.
The goodwill impairment test is a two-step process, which requires the Company to make assumptions regarding fair value. First, the fair value of the reporting unit is compared to its carrying value. In 2012, the Company changed its methodology for evaluating goodwill for impairment. Based on revised guidance issued by the Financial Accounting Standards Board (“FASB”), the Company may first perform a qualitative assessment of the composition of its goodwill for impairment. If the qualitative assessment indicates it is more likely than not that the fair value of the reporting unit is less than its carrying value, the Company then performs a quantitative assessment. When estimating fair value with the quantitative assessment, the Company calculates the present value of future cash flows based on projected future operating results and business plans, forecasted sales volumes, discount rates, comparable marketplace fair value data from within a comparable industry grouping, current industry and economic conditions, and historical results. If the fair value exceeds the carrying value, goodwill and other intangible assets are not impaired and no further steps are required.
If the estimated fair value is less than the carrying value, the second step is completed to compute the impairment amount by determining the “implied fair value” of goodwill. This determination requires the allocation of the estimated fair value of the reporting unit to the assets and liabilities of the reporting unit. Any remaining unallocated fair value represents the “implied fair value” of goodwill, which is compared to the corresponding carrying value to compute the goodwill impairment amount that is recorded and charged to operations.
Impairment of Long-Lived Assets
When events or conditions warrant, the Company evaluates the recoverability of long-lived assets other than goodwill and indefinite-lived intangible assets and considers whether these assets are impaired. The Company assesses the recoverability of these assets based upon several factors, including management's intention with respect to the assets and their projected future undiscounted cash flows. If projected undiscounted cash flows are less than the carrying amount of the assets, the Company adjusts the carrying amounts of such assets to their estimated fair value. A significant adverse change in the Company’s business climate in future periods could result in a significant loss of market share or the inability to achieve previously projected revenue growth and could lead to a required assessment of the recoverability of the Company’s long-lived assets, which may subsequently result in an impairment charge.
Deferred Financing Costs
Deferred financing costs are classified as non-current assets on the statement of financial position and are amortized over the life of the related debt or credit facility using the straight-line method.
Fair Value of Financial Instruments
The Company’s financial instruments consist principally of cash and cash equivalents, trade receivables, debt and accounts payable. The Company believes cash and cash equivalents, trade receivables, and accounts payable are recorded at amounts that approximate their current market values because of the relatively short maturities of these financial instruments. The carrying value of the long-term debt instruments approximates the fair value based upon terms and conditions available to the Company in comparison to the terms and conditions of the outstanding debt.
The Company follows accounting guidance on fair value measurements, which defines fair value as the exchange price that would be received for an asset or paid to transfer a liability (an exit price) in the principal or most advantageous market for the asset or liability in an orderly transaction between market participants on the measurement date. The guidance establishes a fair value hierarchy, which requires an entity to maximize the use of observable inputs and minimize the use of unobservable inputs when measuring fair value. The standard describes three levels of inputs that may be used to measure fair value:
Level 1 inputs – Quoted prices (unadjusted) for identical assets or liabilities in active markets that the entity has the ability to access as of the measurement date.
Level 2 inputs – Significant other observable inputs other than Level 1 prices such as quoted prices for similar assets or liabilities; quoted prices in markets that are not active; and other inputs that are observable or can be corroborated by observable market data.
Level 3 inputs – Significant unobservable inputs that reflect a company’s own assumptions about the assumptions that market participants would use in pricing an asset or liability.
Income Taxes
Deferred taxes are provided on an asset and liability method whereby deferred tax assets are recognized for deductible temporary differences and operating loss carry-forwards and deferred tax liabilities are recognized for taxable temporary differences. Temporary differences are the differences between the reported amounts of assets and liabilities and their tax basis. Deferred tax assets are recognized in the current year to the extent future deferred tax liability timing differences are expected to reverse. Deferred tax assets and liabilities are adjusted for the effects of changes in tax laws and rates on the date of enactment. Deferred tax assets are reduced by a valuation allowance when, in the opinion of management, it is more likely than not that some portion or all of the deferred tax assets may not be realized.
The Company reports a liability, if any, for unrecognized tax benefits resulting from uncertain tax positions taken or expected to be taken in a tax return. The Company recognizes interest and penalties, if any, related to unrecognized tax benefits in income tax expense.
|
3. |
RECENTLY ISSUED ACCOUNTING PRONOUNCEMENTS |
Revenue Recognition
In May 2014, the FASB issued new accounting guidance on revenue from contracts with customers, which will supersede nearly all existing revenue recognition guidance under U.S. GAAP. The core principal of the guidance is that an entity should recognize revenue when it transfers promised goods or services to customers in an amount that reflects the consideration to which the entity expects to be entitled in exchange for those goods or services. The guidance also requires additional disclosure about the nature, amount, timing and uncertainty of revenue and cash flows arising from customer contracts, including significant judgments and changes in judgments and assets recognized from costs incurred to obtain or fulfill a contract. The guidance is effective for annual and interim periods beginning after December 15, 2016 and early adoption is not permitted.
The guidance permits two methods of transition upon adoption: full retrospective and modified retrospective. Under the full retrospective method, prior periods would be restated under the new revenue standard, providing a comparable view across all periods presented. Under the modified retrospective method, prior periods would not be restated. Rather, revenues and other disclosures for pre-2017 periods would be provided in the notes to the financial statements as previously reported under the current revenue standard. The impact from the adoption of this guidance on the Company's consolidated financial statements has not been determined at this time. The Company is also working to determine the appropriate method of transition to the guidance.
Stock Compensation
In June 2014, the FASB issued revised guidance on accounting for share-based payments that will require that a performance target that affects vesting and could be achieved after the requisite service period be treated as a performance condition. The revised guidance is effective for annual and interim periods beginning after December 15, 2015 and early adoption is permitted. The Company is currently evaluating the provisions of this guidance and has not yet determined the impact, if any, that the implementation of this guidance will have on its results of operations or financial condition.
|
4. |
ACQUISITIONS |
General
The Company completed a total of 11 acquisitions in the three years ended December 31, 2014, 2013 and 2012 as discussed below. Each of the acquisitions was funded through borrowings under the Company’s credit facility in existence at the time of acquisition. Assets acquired and liabilities assumed in the individual acquisitions were recorded on the Company’s consolidated statements of financial position at their estimated fair values as of the respective dates of acquisition.
The excess of the purchase consideration over the fair value of the net assets acquired was recorded as goodwill, which represents the value of leveraging the Company’s existing purchasing, manufacturing, sales, and systems resources with the organizational talent and expertise of the acquired companies’ respective management teams to maximize efficiencies, revenue impact, market share growth, and net income. Intangible asset values were estimated using income based valuation methodologies. The disclosure of the amortization periods assigned to finite-lived intangible assets is more fully disclosed in Note 7.
For the years ended December 31, 2014, 2013 and 2012, revenue of approximately $56 million, $12 million and $29 million, respectively, was included in the Company’s consolidated statements of income pertaining to the businesses acquired in each such year.
For the years ended December 31, 2014, 2013 and 2012, operating income of approximately $3.1 million, $0.2 million and $1.3 million, respectively, was included in the Company’s consolidated statements of income pertaining to the businesses acquired in each such year. Acquisition-related costs in the aggregate associated with the businesses acquired in 2014, 2013 and 2012 were immaterial.
2015 Acquisition
Better Way Partners, LLC d/b/a Better Way Products
On February 17, 2015, the Company announced that it had completed the acquisition of the business and certain assets of Better Way Partners, LLC d/b/a Better Way Products (“Better Way”), a manufacturer of fiberglass front and rear caps, marine helms and related fiberglass components primarily used in the RV, marine and transit vehicle markets, for a net purchase price of approximately $40.0 million. The acquisition of Better Way, with operating facilities located in New Paris, Bremen and Syracuse, Indiana, provides the opportunity for the Company to further expand its presence in the fiberglass components market and increase its product offerings, market share and per unit content.
The acquisition was funded under the Company’s 2012 Credit Facility (as defined herein). The Company is in the process of allocating the purchase consideration to the fair value of the assets acquired and expects to provide a summary in its Report on Form 10-Q for the quarter ended March 29, 2015. The results of operations for Better Way will be included in the Company’s condensed consolidated financial statements and the Manufacturing operating segment from the date of acquisition.
2014 Acquisitions
Precision Painting Group
In June 2014, the Company acquired the business and certain assets of four related companies based in Bremen, Indiana and Elkhart, Indiana: Precision Painting, Inc., Carrera Custom Painting, Inc., Millennium Paint, Inc., and TDM Transport, Inc. (collectively referred to as “Precision Painting Group” or “Precision”), for a net purchase price of $16.0 million. The Precision Painting Group is comprised of three full service exterior full body painting operations that offer exterior painting and interior refurbishing for both OEMs and existing RV and fleet owners, and a transportation operation that services their in-house customers.
This acquisition provided the opportunity for the Company to establish a presence in the RV exterior full body painting market and increase its product offerings, market share and per unit content. The results of operations for Precision are included in the Company’s consolidated financial statements and the Manufacturing operating segment from the date of acquisition. The purchase price allocation and all required purchase accounting adjustments were finalized in the fourth quarter of 2014. The following summarizes the fair values of the assets acquired and the liabilities assumed as of the date of acquisition:
|
(thousands) |
||||
|
Trade receivables |
$ | 1,425 | ||
|
Inventories |
208 | |||
|
Property, plant and equipment |
7,032 | |||
|
Prepaid expenses |
10 | |||
|
Accounts payable and accrued liabilities |
(997 | ) | ||
|
Intangible assets |
4,492 | |||
|
Goodwill |
3,843 | |||
|
Total net purchase price |
$ | 16,013 |
Foremost Fabricators, LLC
In June 2014, the Company acquired the business and certain assets of Goshen, Indiana-based Foremost Fabricators, LLC (“Foremost”), a fabricator and distributor of fabricated aluminum products, fiber reinforced polyester (“FRP”) sheet and coil, and custom laminated products primarily used in the RV market, for a net purchase price of $45.4 million.
This acquisition provided the opportunity for the Company to establish a presence in the laminated and fabricated roll formed aluminum products market and increase its product offerings, market share and per unit content. The results of operations for Foremost are included in the Company’s consolidated financial statements and the Manufacturing and Distribution operating segments from the date of acquisition. The purchase price allocation and all required purchase accounting adjustments were finalized in the fourth quarter of 2014. The following summarizes the fair values of the assets acquired and the liabilities assumed as of the date of acquisition:
|
(thousands) |
||||
|
Trade receivables |
$ | 4,868 | ||
|
Inventories |
11,415 | |||
|
Property, plant and equipment |
3,934 | |||
|
Prepaid expenses |
129 | |||
|
Accounts payable and accrued liabilities |
(4,302 | ) | ||
|
Intangible assets |
20,905 | |||
|
Goodwill |
8,407 | |||
|
Total net purchase price |
$ | 45,356 |
PolyDyn3, LLC
In September 2014, the Company acquired the business and certain assets of Elkhart, Indiana-based PolyDyn3, LLC (“PolyDyn3”), a custom fabricator of simulated wood and stone products such as headboards, fireplaces, ceiling medallions, columns and trims, for the RV market, for a net purchase price of $1.3 million.
This acquisition provided the opportunity for the Company to bring in-house new production capabilities and product lines that were previously represented through one of the Company’s Distribution segment business units, and increase its product offerings, market share and per unit content. The results of operations for PolyDyn3 are included in the Company’s consolidated financial statements and the Manufacturing operating segment from the date of acquisition. The purchase price allocation and all required purchase accounting adjustments were finalized in the fourth quarter of 2014. The following summarizes the fair values of the assets acquired and the liabilities assumed as of the date of acquisition:
|
(thousands) |
||||
|
Trade receivables |
$ | 86 | ||
|
Inventories |
194 | |||
|
Property, plant and equipment |
683 | |||
|
Prepaid expenses |
125 | |||
|
Accounts payable and accrued liabilities |
(124 | ) | ||
|
Intangible assets |
230 | |||
|
Goodwill |
57 | |||
|
Total net purchase price |
$ | 1,251 |
Charleston Corporation
In November 2014, the Company acquired the business and certain assets of Bremen, Indiana-based Charleston Corporation (“Charleston”), a manufacturer of fiberglass and plastic components primarily used in the RV, marine, and vehicle aftermarket industries, for a net purchase price of $9.5 million.
This acquisition provided the opportunity for the Company to further expand its presence in the fiberglass components market and increase its product offerings, market share and per unit content. The results of operations for Charleston are included in the Company’s consolidated financial statements and the Manufacturing operating segment from the date of acquisition. The purchase price allocation and all required purchase accounting adjustments were finalized in the fourth quarter of 2014. The following summarizes the fair values of the assets acquired and the liabilities assumed as of the date of acquisition:
|
(thousands) |
||||
|
Trade receivables |
$ | 1,931 | ||
|
Inventories |
1,033 | |||
|
Property, plant and equipment |
3,056 | |||
|
Prepaid expenses |
7 | |||
|
Accounts payable and accrued liabilities |
(2,042 | ) | ||
|
Intangible assets |
2,783 | |||
|
Goodwill |
2,706 | |||
|
Total net purchase price |
$ | 9,474 |
2013 Acquisitions
Frontline Mfg., Inc.
In September 2013, the Company acquired the business and certain assets of Warsaw, Indiana-based Frontline Mfg., Inc. (“Frontline”), a manufacturer of fiberglass bath fixtures including tubs, showers and combination tub/shower units for the RV, MH, and residential housing markets, for a net purchase price of $5.2 million, which included a contingent payment that may be paid based on future performance. The fair value of the contingent consideration arrangement was estimated by applying the income approach and included assumptions related to the probability of future payments and discounted cash flows. In 2014, the Company determined that the contingent consideration would not be paid as the conditions for payment were not achieved. As a result, the Company recognized a pretax gain of $0.3 million associated with the non-payment of the contingent consideration which is included in the line item “Selling, general and administrative” on the consolidated statements of income for the year ended December 31, 2014.
This acquisition provided the opportunity for the Company to establish a presence in the fiberglass bath fixtures market and increase its product offerings, market share and per unit content. The results of operations for Frontline are included in the Company’s consolidated financial statements and the Manufacturing operating segment from the date of acquisition. The purchase price allocation and all required purchase accounting adjustments were finalized in the second quarter of 2014. The following summarizes the fair values of the assets acquired and the liabilities assumed as of the date of acquisition:
|
(thousands) |
||||
|
Trade receivables |
$ | 1,545 | ||
|
Inventories |
250 | |||
|
Property, plant and equipment |
917 | |||
|
Prepaid expenses |
21 | |||
|
Accounts payable and accrued liabilities |
(2,135 | ) | ||
|
Intangible assets |
2,092 | |||
|
Goodwill |
2,490 | |||
|
Total net purchase price |
$ | 5,180 |
Premier Concepts, Inc.
In September 2013, the Company acquired the business and certain assets of Warsaw, Indiana-based Premier Concepts, Inc. (“Premier”), a custom fabricator of solid surface, granite, and quartz countertops for the RV, MH and residential housing markets, for a net purchase price of $2.6 million, which included a contingent payment that may be paid based on future performance. The fair value of the contingent consideration arrangement was estimated by applying the income approach and included assumptions related to the probability of future payments and discounted cash flows. In 2014, the Company determined that the contingent consideration would not be paid, as the conditions for payment were not achieved. As a result, the Company recognized a pretax gain of $0.2 million associated with the non-payment of the contingent consideration which is included in the line item “Selling, general and administrative” on the consolidated statements of income for the year ended December 31, 2014.
This acquisition provided the opportunity for the Company to expand its presence in the countertops market and increase its product offerings, market share and per unit content. The results of operations for Premier are included in the Company’s consolidated financial statements and the Manufacturing operating segment from the date of acquisition. The purchase price allocation and all required purchase accounting adjustments were finalized in the second quarter of 2014. The following summarizes the fair values of the assets acquired and the liabilities assumed as of the date of acquisition:
|
(thousands) |
||||
|
Trade receivables |
$ | 764 | ||
|
Inventories |
347 | |||
|
Property, plant and equipment |
561 | |||
|
Accounts payable and accrued liabilities |
(1,357 | ) | ||
|
Intangible assets |
1,210 | |||
|
Goodwill |
1,095 | |||
|
Total net purchase price |
$ | 2,620 |
John H. McDonald Co., Inc. d/b/a West Side Furniture
In September 2013, the Company acquired the business and certain assets of Goshen, Indiana-based John H. McDonald Co., Inc. d/b/a West Side Furniture (“West Side”), a wholesale supplier of La-Z-Boy® recliners and the Serta® Trump Home™ mattress line, among other furniture products, to the RV market, for a net purchase price of $8.7 million.
This acquisition provided the opportunity for the Company to expand its presence in the wholesale furniture business for the RV industry, and increase its product offerings, market share and per unit content. The results of operations for West Side are included in the Company’s consolidated financial statements and the Distribution operating segment from the date of acquisition. The following summarizes the fair values of the assets acquired and the liabilities assumed as of the date of acquisition:
|
(thousands) |
||||
|
Trade receivables |
$ | 902 | ||
|
Inventories |
1,439 | |||
|
Property, plant and equipment |
324 | |||
|
Prepaid expenses |
9 | |||
|
Accounts payable and accrued liabilities |
(2,094 | ) | ||
|
Intangible assets |
5,461 | |||
|
Goodwill |
2,670 | |||
|
Total net purchase price |
$ | 8,711 |
2012 Acquisitions
Décor Mfg., LLC
In March 2012, the Company acquired the business and certain assets of Tualatin, Oregon-based Décor Mfg., LLC (“Décor”), a manufacturer of laminated and wrapped products for the Northwestern U.S.-based RV industry, for a net purchase price of $4.3 million. The acquisition was funded through borrowings under the Company's 2011 Credit Facility (as defined herein), and the issuance of 100,000 shares or $0.6 million of Patrick common stock. The value of the common stock issued was based on the closing stock price of $6.42 per share on March 2, 2012.
This acquisition provided the opportunity to expand the Company’s revenues to its existing customer base in the RV industry sector and significantly expanded the Company’s RV presence in the Northwest. The results of operations for Décor are included in the Company’s consolidated financial statements and the Manufacturing operating segment from the date of acquisition. The following summarizes the fair value of the assets acquired and the liabilities assumed as of the date of acquisition:
|
(thousands) |
||||
|
Trade receivables |
$ | 1,280 | ||
|
Inventories |
903 | |||
|
Property, plant and equipment |
400 | |||
|
Prepaid expenses |
22 | |||
|
Accounts payable and accrued liabilities |
(1,375 | ) | ||
|
Intangible assets |
1,663 | |||
|
Goodwill |
1,440 | |||
|
Total net purchase price |
$ | 4,333 |
Gustafson Lighting
In July 2012, the Company acquired the business and certain assets of Elkhart, Indiana-based Gustafson Lighting (“Gustafson”), a distributor of interior and exterior lighting products, ceiling fans and accessories, including glass and glass pads, hardware and lampshades to the RV industry, for a net purchase price of $2.8 million. The acquisition was completed pursuant to a foreclosure and private sale under the Uniform Commercial Code with Capital Source Finance, LLC.
This acquisition provided the opportunity for the Company to increase its market share and per unit content. The results of operations for Gustafson are included in the Company’s consolidated financial statements and the Distribution operating segment from the date of acquisition. The fair value of the net assets acquired of $3.0 million exceeded the purchase consideration of $2.8 million. As a result, the Company recognized a gain of $0.2 million associated with the acquisition. The gain is included in the line item “(Gain) loss on sale of fixed assets and acquisition of business” in the consolidated statements of income for the year ended December 31, 2012. The following summarizes the fair values of the assets acquired and the liabilities assumed as of the date of acquisition:
|
(thousands) |
||||
|
Trade receivables |
$ | 982 | ||
|
Inventories |
1,262 | |||
|
Property, plant and equipment |
1,221 | |||
|
Prepaid expenses |
20 | |||
|
Accounts payable and accrued liabilities |
(816 | ) | ||
|
Intangible assets |
337 | |||
|
Goodwill |
(223 | ) | ||
|
Total net purchase price |
$ | 2,783 |
Creative Wood Designs, Inc.
In September 2012, the Company acquired the business and certain assets of Ligonier, Indiana-based Creative Wood Designs, Inc. (“Creative Wood”), a manufacturer of hardwood furniture including interior hardwood tables, chairs, dinettes, trim, fascia, mouldings, and other miscellaneous products, for a net purchase price of $3.0 million, which included two subsequent contingent payments based on future performance, the first of which was paid in the fourth quarter of 2013. The fair value of the contingent consideration arrangement was estimated by applying the income approach and included assumptions related to the probability of future payments and discounted cash flows. In 2014, the Company determined that the second contingent consideration payment would not be made as the conditions for payment were not achieved. As a result, the Company recognized a pretax gain of $0.5 million associated with the non-payment of the contingent consideration which is included in the line item “Selling, general and administrative” on the consolidated statements of income for the year ended December 31, 2014.
This acquisition provided the opportunity to expand the Company’s revenues to its existing customer base in the RV industry sector. The results of operations for Creative Wood are included in the Company’s consolidated financial statements and the Manufacturing operating segment from the date of acquisition. The following summarizes the fair values of the assets acquired and the liabilities assumed as of the date of acquisition:
|
(thousands) |
||||
|
Trade receivables |
$ | 927 | ||
|
Inventories |
1,423 | |||
|
Property, plant and equipment |
1,429 | |||
|
Prepaid expenses |
24 | |||
|
Accounts payable and accrued liabilities |
(1,570 | ) | ||
|
Other liabilities |
(958 | ) | ||
|
Intangible assets |
757 | |||
|
Goodwill |
994 | |||
|
Total net purchase price |
$ | 3,026 |
Middlebury Hardwood Products, Inc.
In October 2012, the Company acquired the business and certain assets of Middlebury, Indiana-based Middlebury Hardwood Products, Inc. (“Middlebury Hardwoods”), a manufacturer of hardwood cabinet doors, components and other hardwood products for the RV, MH, and residential kitchen cabinet industries, for a net purchase price of $19.8 million.
This acquisition provided the opportunity for the Company to increase its market share and per unit content in the cabinet door market. The results of operations for Middlebury Hardwoods are included in the Company’s consolidated financial statements and the Manufacturing operating segment from the date of acquisition. The following summarizes the fair values of the assets acquired and the liabilities assumed as of the date of acquisition:
|
(thousands) |
||||
|
Trade receivables |
$ | 1,872 | ||
|
Inventories |
1,719 | |||
|
Property, plant and equipment |
7,171 | |||
|
Prepaid expenses |
144 | |||
|
Accounts payable and accrued liabilities |
(1,223 | ) | ||
|
Intangible assets |
6,470 | |||
|
Goodwill |
3,609 | |||
|
Total net purchase price |
$ | 19,762 |
Pro Forma Information (Unaudited)
The following pro forma information assumes the Foremost and Middlebury Hardwoods acquisitions occurred as of the beginning of the year immediately preceding each such acquisition. The pro forma information contains the actual operating results of Foremost and Middlebury Hardwoods, combined with the results prior to their respective acquisition dates adjusted to reflect the pro forma impact of the acquisitions occurring as of the beginning of the year immediately preceding each such acquisition.
The pro forma information includes financing and interest expense charges based on the actual incremental borrowings incurred in connection with each transaction as if it occurred as of the beginning of the year immediately preceding each such acquisition.
In addition, the pro forma information includes amortization expense of (i) $0.9 million and $1.8 million for the years ended December 31, 2014 and 2013, respectively, related to intangible assets acquired in the Foremost acquisition; and (ii) $0.5 million related to the intangible assets acquired in the Middlebury Hardwoods acquisition for the year ended December 31, 2012. Pro forma information related to the other businesses acquired in 2014, 2013 and 2012 is not included in the table below, as their financial results were not considered significant to the Company’s operating results for the periods presented.
|
(thousands except per share data) |
2014 |
2013 |
2012 |
|||||||||
|
Revenue |
$ | 775,603 | $ | 664,471 | $ | 469,002 | ||||||
|
Net income |
31,953 | 25,077 | 28,785 | |||||||||
|
Basic net income per common share |
3.00 | 2.34 | 2.73 | |||||||||
|
Diluted net income per common share |
2.99 | 2.32 | 2.71 | |||||||||
The pro forma information is presented for informational purposes only and is not necessarily indicative of the results of operations that actually would have been achieved had the acquisitions been consummated as of that time, nor is it intended to be a projection of future results.
|
5. |
INVENTORIES |
Inventories as of December 31, 2014 and 2013 consist of the following classes:
|
(thousands) |
2014 |
2013 |
||||||
|
Raw materials |
$ | 39,283 | $ | 24,135 | ||||
|
Work in process |
5,607 | 4,870 | ||||||
|
Finished goods |
4,897 | 3,877 | ||||||
|
Less: reserve for inventory obsolescence |
(1,288 | ) | (938 | ) | ||||
|
Total manufactured goods, net |
48,499 | 31,944 | ||||||
|
Materials purchased for resale (distribution products) |
23,049 | 24,904 | ||||||
|
Less: reserve for inventory obsolescence |
(528 | ) | (338 | ) | ||||
|
Total materials purchased for resale (distribution products), net |
22,521 | 24,566 | ||||||
|
Total inventories |
$ | 71,020 | $ | 56,510 | ||||
The following table summarizes the reserve for inventory obsolescence:
|
(thousands) |
2014 |
2013 |
2012 |
|||||||||
|
Balance at January 1 |
$ | 1,276 | $ | 1,106 | $ | 701 | ||||||
|
Charged to operations |
2,071 | 1,045 | 1,123 | |||||||||
|
Deductions from reserves |
(1,531 | ) | (875 | ) | (718 | ) | ||||||
|
Balance at December 31 |
$ | 1,816 | $ | 1,276 | $ | 1,106 | ||||||
|
6. |
PROPERTY, PLANT AND EQUIPMENT |
Property, plant and equipment, net, consists of the following classes at December 31, 2014 and 2013:
|
(thousands) |
2014 |
2013 |
||||||
|
Land and improvements |
$ | 2,635 | $ | 1,637 | ||||
|
Building and improvements |
37,798 | 29,663 | ||||||
|
Machinery and equipment |
76,010 | 66,365 | ||||||
|
Transportation equipment |
1,664 | 1,506 | ||||||
|
Leasehold improvements |
2,332 | 1,889 | ||||||
|
Property, plant and equipment, at cost |
120,439 | 101,060 | ||||||
|
Less: accumulated depreciation and amortization |
(63,086 | ) | (58,943 | ) | ||||
|
Property, plant and equipment, net |
$ | 57,353 | $ | 42,117 | ||||
For the years ended December 31, 2014 and 2013, no events or changes in circumstances occurred that required the Company to assess the recoverability of its property, plant and equipment, and therefore the Company did not recognize any impairment charges.
|
7. |
GOODWILL AND OTHER INTANGIBLE ASSETS |
Goodwill and other intangible assets are allocated to the Company’s reporting units at the date they are initially recorded. Goodwill and indefinite-lived intangible assets are not amortized but are subject to an impairment test based on their estimated fair value performed annually in the fourth quarter (or under certain circumstances more frequently as warranted). Goodwill impairment testing is performed at the reporting unit level, one level below the business segment. The Company’s Manufacturing segment includes goodwill originating from the acquisitions of Gravure Ink (acquired in the Adorn acquisition), Quality Hardwoods Sales (“Quality Hardwoods”), A.I.A. Countertops, LLC (“AIA”), Infinity Graphics, Décor, Creative Wood, Middlebury Hardwoods, Frontline, Premier, Precision, Foremost, PolyDyn3, and Charleston. While Gravure Ink, AIA, Infinity Graphics, Décor, Creative Wood, Middlebury Hardwoods, Frontline, Premier, Precision, Foremost, PolyDyn3 and Charleston remain reporting units of the Company for which impairment is assessed, Quality Hardwoods is assessed for impairment as part of the Company’s hardwood door reporting unit. The Company’s Distribution segment includes goodwill originating from the acquisitions of Blazon International Group (“Blazon”), West Side, and Foremost, which remain reporting units for which impairment is assessed.
Finite-lived intangible assets that meet certain criteria continue to be amortized over their useful lives and are subject to an impairment test based on estimated undiscounted cash flows when impairment indicators exist. The Company assesses finite-lived intangible assets for impairment if events or changes in circumstances indicate that the carrying value may exceed the fair value.
There was no impairment for goodwill and other intangible assets for the years ended December 31, 2014, 2013 and 2012.
The Company acquired the following intangible assets in various acquisitions from 2012 through 2014 that were determined to be business combinations. The goodwill recognized is expected to be deductible for income tax purposes. See Note 4 for further details.
|
(thousands) |
Customer Relationships |
Non-Compete Agreements |
Trademarks |
Total Other Intangible Assets |
Goodwill |
Total Intangible Assets |
||||||||||||||||||
|
2012 |
||||||||||||||||||||||||
|
Décor |
$ | 655 | $ | 384 | $ | 624 | $ | 1,663 | $ | 1,440 | $ | 3,103 | ||||||||||||
|
Gustafson |
178 | 16 | 143 | 337 | - | 337 | ||||||||||||||||||
|
Creative Wood |
207 | 312 | 238 | 757 | 994 | 1,751 | ||||||||||||||||||
|
Middlebury Hardwoods |
5,920 | 140 | 410 | 6,470 | 3,609 | 10,079 | ||||||||||||||||||
|
2013 |
||||||||||||||||||||||||
|
Frontline |
1,411 | 460 | 221 | 2,092 | 2,490 | 4,582 | ||||||||||||||||||
|
Premier |
863 | 203 | 144 | 1,210 | 1,095 | 2,305 | ||||||||||||||||||
|
West Side |
4,166 | 998 | 297 | 5,461 | 2,670 | 8,131 | ||||||||||||||||||
|
2014 |
||||||||||||||||||||||||
|
Precision |
2,904 | 1,105 | 483 | 4,492 | 3,843 | 8,335 | ||||||||||||||||||
|
Foremost |
15,485 | 1,350 | 4,070 | 20,905 | 8,407 | 29,312 | ||||||||||||||||||
|
PolyDyn3 |
201 | 23 | 6 | 230 | 57 | 287 | ||||||||||||||||||
|
Charleston |
2,011 | 443 | 329 | 2,783 | 2,706 | 5,489 | ||||||||||||||||||
Goodwill
Changes in the carrying amount of goodwill for the years ended December 31, 2014 and 2013 by segment are as follows:
|
(thousands) |
Manufacturing |
Distribution |
Total |
|||||||||
|
Balance - December 31, 2012 |
$ | 10,257 | $ | 105 | $ | 10,362 | ||||||
|
Acquisitions |
3,463 | 2,670 | 6,133 | |||||||||
|
Balance - December 31, 2013 |
13,720 | 2,775 | 16,495 | |||||||||
|
Acquisitions |
11,589 | 3,546 | 15,135 | |||||||||
|
Balance - December 31, 2014 |
$ | 25,309 | $ | 6,321 | $ | 31,630 | ||||||
Other Intangible Assets
Intangible assets are comprised of customer relationships, non-compete agreements and trademarks. Customer relationships and non-compete agreements represent finite-lived intangible assets that have been recorded in the Manufacturing and Distribution segments along with related amortization expense. As of December 31, 2014, the remaining intangible assets balance of $49.5 million is comprised of $9.0 million of trademarks which have an indefinite life, and therefore, no amortization expense has been recorded, and $40.5 million pertaining to customer relationships and non-compete agreements which are being amortized over periods ranging from 3 to 19 years.
For the finite-lived intangible assets attributable to the 2014 acquisitions, the useful life pertaining to non-compete agreements was three years for Precision, PolyDyn3 and Charleston, and five years for Foremost. The useful life pertaining to customer relationships for each of the 2014 acquisitions (Precision, Foremost, PolyDyn3 and Charleston) was 10 years. Trademarks have an indefinite life, and therefore, no amortization expense has been recorded.
Amortization expense for the Company’s intangible assets in the aggregate was $4.5 million, $2.4 million and $1.5 million for 2014, 2013 and 2012, respectively.
Other intangible assets, net consist of the following at December 31, 2014 and 2013:
|
(thousands) |
2014 |
Weighted Average Useful Life (years) |
2013 |
Weighted Average Useful Life (years) | ||||||
|
Customer relationships |
$ | 44,269 |
11 |
$ | 23,668 |
11 | ||||
|
Non-compete agreements |
6,338 |
3 |
3,417 |
3 | ||||||
|
Trademarks |
9,006 | 4,166 | ||||||||
| 59,613 | 31,251 | |||||||||
|
Less: accumulated amortization |
(10,069 | ) | (5,640 | ) | ||||||
|
Other intangible assets, net |
$ | 49,544 | $ | 25,611 | ||||||
Changes in the carrying value of other intangible assets for the years ended December 31, 2014 and 2013 by segment are as follows:
|
(thousands) |
Manufacturing |
Distribution |
Total |
|||||||||
|
Balance - December 31, 2012 |
$ | 18,242 | $ | 977 | $ | 19,219 | ||||||
|
Acquisitions |
3,302 | 5,461 | 8,763 | |||||||||
|
Amortization |
(1,918 | ) | (453 | ) | (2,371 | ) | ||||||
|
Balance - December 31, 2013 |
19,626 | 5,985 | 25,611 | |||||||||
|
Acquisitions |
20,048 | 8,362 | 28,410 | |||||||||
|
Amortization |
(3,183 | ) | (1,294 | ) | (4,477 | ) | ||||||
|
Balance - December 31, 2014 |
$ | 36,491 | $ | 13,053 | $ | 49,544 | ||||||
Amortization expense for the next five fiscal years ending December 31 related to finite-lived intangible assets as of December 31, 2014 is estimated to be (in thousands): 2015 - $5,750; 2016 - $5,407; 2017 - $4,612; 2018 - $4,317; and 2019 - $4,182.
|
8. |
DERIVATIVE FINANCIAL INSTRUMENTS |
2008 Warrants Subject to Revaluation
In 2008, the Company issued warrants to purchase shares of common stock to its then existing lenders (the “2008 Warrants”). In 2012, the Company issued an aggregate of 291,856 net shares of common stock to the remaining holders that exercised the remaining 2008 Warrants in cashless exercises. In addition, the Company recognized a stock warrants revaluation expense of $1.7 million in 2012 that represented the non-cash charges related to mark-to-market accounting for the 2008 Warrants. As of December 31, 2012, all of the 2008 Warrants had been exercised.
|
9. |
DEBT |
Total long-term debt outstanding as of December 31, 2014 and December 31, 2013 was $101.1 million and $55.0 million, respectively.
2012 Credit Facility
On October 24, 2012, the Company entered into a credit agreement (the “2012 Credit Agreement”) with Wells Fargo Bank, National Association as the agent and lender (“Wells Fargo”), and Fifth-Third as participant (“Fifth-Third”), to establish a five-year $80.0 million revolving secured senior credit facility (the “2012 Credit Facility”).
On June 26, 2014 and November 7, 2014, the Company entered into amendments to the 2012 Credit Agreement to increase the maximum borrowing limit under the revolving line of credit (the “Revolver”) to $125.0 million and $165.0 million, respectively, and to add Key Bank as a participant (together with Wells Fargo and Fifth-Third, the “Lenders”). On February 13, 2015, the 2012 Credit Agreement was further amended to expand the 2012 Credit Facility to $185.0 million.
The 2012 Credit Agreement is secured by a pledge of substantially all of the assets of the Company pursuant to a Security Agreement, dated October 24, 2012, between the Company and Wells Fargo, as agent. The 2012 Credit Agreement includes certain definitions, terms and reporting requirements and includes the following provisions:
|
● |
The maturity date for the 2012 Credit Facility is October 24, 2017; |
|
● |
The interest rates for borrowings under the Revolver are the Base Rate plus the Applicable Margin or the London Interbank Offer Rate (“LIBOR”) plus the Applicable Margin, with a fee payable by the Company on unused but committed portions of the Revolver; |
|
● |
The Revolver includes a sub-limit up to $5.0 million for same day advances (“Swing Line”) which shall bear interest based upon the Base Rate plus the Applicable Margin; |
|
● |
Up to $20.0 million of the Revolver will be available as a sub-facility for the issuance of standby letters of credit, which are subject to certain expiration dates; |
|
● |
The financial covenants include requirements as to a consolidated total leverage ratio and a consolidated interest coverage ratio, and other covenants include limitations on permitted acquisitions, capital expenditures, indebtedness, restricted payments, and fundamental changes (see further details below); and |
|
● |
Customary prepayment provisions, which require the prepayment of outstanding amounts under the Revolver based on predefined conditions. |
At December 31, 2014, the Company had $101.1 million outstanding under its Revolver, which consisted of $97.0 million of borrowings under the LIBOR-based option and $4.1 million of borrowings under the Base Rate-based option. The interest rate for borrowings under the Revolver at December 31, 2014 was the Prime Rate plus 0.50% (or 3.75%), or LIBOR plus 1.50% (or 1.6875%). At December 31, 2013, the Company had $55.0 million of borrowings outstanding, all of which was under the LIBOR-based option of LIBOR plus 1.50% (or 1.6875%). The fee payable on committed but unused portions of the Revolver was 0.20% for both of these periods.
Pursuant to the 2012 Credit Agreement, the financial covenants include (a) a maximum consolidated total leverage ratio, measured on a quarter-end basis, not to exceed 3.50:1.00 for the 12 month period ending on such quarter-end; (b) a required minimum consolidated interest coverage ratio under the Revolver, measured on a quarter-end basis, of at least 2.25:1.00 for the 12 month period ending on such quarter-end; and (c) a limitation on annual capital expenditures of $12.0 million for 2013 and $10.0 million for 2014 and for subsequent fiscal years, exclusive of acquisitions. If the consolidated total leverage ratio is in excess of 3.00:1.00 and less than 3.50:1.00, the Company is considered to be in compliance with this financial covenant provided it maintains an asset coverage ratio of at least 1.00 to 1.00 as of the close of each period.
The consolidated total leverage ratio is the ratio for any period of (i) consolidated total indebtedness to (ii) earnings before interest, taxes, depreciation, and amortization (“EBITDA”). Consolidated total indebtedness for any period is the sum of (i) total debt outstanding under the Revolver, (ii) capital leases and letters of credit outstanding, and (iii) deferred payment obligations. The asset coverage ratio for any period is the ratio of (i) eligible amounts of the Company’s trade payables, inventory and fixed assets, minus certain reserves as defined under the 2012 Credit Agreement to (ii) the sum of outstanding obligations under the 2012 Credit Facility.
The consolidated interest coverage ratio for any period is the ratio of (i) EBITDA minus depreciation to (ii) the sum of consolidated interest expense plus restricted payments made by the Company.
In 2014 and 2013, the Company was in compliance with all of its debt covenants at each reporting date as required under the terms of the 2012 Credit Agreement. The required maximum total leverage ratio, minimum interest coverage ratio, and the annual capital expenditures limitation amounts compared to the actual amounts as of and for the fiscal period ended December 31, 2014 are as follows:
|
(thousands except ratios) |
Covenant |
Actual |
||||||
|
Consolidated leverage ratio (12-month period) |
3.50 | 1.45 | ||||||
|
Consolidated interest coverage ratio (12-month period) |
2.25 | 4.07 | ||||||
|
Annual capital expenditures limitation |
$ | 10,000 | $ | 6,542 | ||||
Aggregate maturities of long-term debt for the next five years ending December 31 are: 2015 - 2016: $0; and 2017- $101.1 million. The revolver long-term debt balance of $101.1 million at December 31, 2014 is due to mature in 2017 in accordance with the terms of the 2012 Credit Facility.
The Company was contingently liable for three standby letters of credit totaling $0.8 million at December 31, 2014 that exist to meet credit requirements for the Company’s insurance providers. The unused availability under the 2012 Credit Facility as of December 31, 2014 was $63.1 million.
Interest expense for the years ended December 31, 2014, 2013 and 2012 (in thousands) was $2,393, $2,171, and $4,037, respectively.
Interest paid for the years ended December 31, 2014, 2013 and 2012 (in thousands) was $2,368, $2,225, and $3,907, respectively.
Prior to October 24, 2012, the Company’s debt financing was supported by its credit agreement, dated March 31, 2011, as amended, among the Company, Wells Fargo Capital Finance, LLC (“WFCF”), as the lender and agent, and Fifth-Third as participant (the “2011 Credit Agreement”), which consisted of a $50.0 million revolving secured senior credit facility (the “2011 Credit Facility”). The 2012 Credit Facility replaced the 2011 Credit Facility, which was scheduled to mature on March 31, 2015.
Secured Senior Subordinated Notes
March 2011 and September 2011 Notes
In March 2011, the Company issued $2.5 million principal amount of Secured Senior Subordinated Notes (the “March 2011 Notes”) to each of Tontine Capital Overseas Master Fund II, L.P., a Cayman Islands limited partnership (“TCOMF2”) and Northcreek Mezzanine Fund I, L.P. (“Northcreek”), or $5.0 million in the aggregate. In September 2011, the Company issued in the aggregate $2.7 million principal amount of Secured Senior Subordinated Notes (the “September 2011 Notes”) to Northcreek and an affiliate of Northcreek. In 2012, the Company repaid in full the remaining principal amount of its March 2011 Notes and September 2011 Notes.
Subordinated Secured Promissory Note
In connection with the AIA acquisition in 2011, the Company issued a 10% promissory note to the seller of AIA in the principal amount of $2.0 million, which was repaid in full in 2012.
|
10. |
FAIR VALUE MEASUREMENTS |
Level 2 represents financial instruments lacking quoted prices (unadjusted) from active market exchanges, including over-the-counter exchange-traded financial instruments. The prices for the financial instruments are determined using prices for recently traded financial instruments with similar underlying terms as well as directly or indirectly observable inputs. Financial instruments included in Level 2 of the fair value hierarchy included the 2008 Warrants (until the remaining warrants were exercised in 2012). See Note 8 for further details.
The carrying amounts of cash and cash equivalents, trade receivables, and accounts payable approximated fair value as of December 31, 2014 and 2013 because of the relatively short maturities of these financial instruments. The carrying amount of long-term debt approximated fair value as of December 31, 2014 and 2013, based upon terms and conditions available to the Company at those dates in comparison to the terms and conditions of its outstanding long-term debt.
|
11. |
ACCRUED LIABILITIES |
Accrued liabilities as of December 31, 2014 and 2013 include the following:
|
(thousands) |
2014 |
2013 |
||||||
|
Employee compensation and benefits |
$ | 8,360 | $ | 7,855 | ||||
|
Property taxes |
1,147 | 841 | ||||||
|
Customer incentives |
2,748 | 2,339 | ||||||
|
Accrued income taxes |
864 | 204 | ||||||
|
Other |
2,269 | 2,346 | ||||||
|
Total accrued liabilities |
$ | 15,388 | $ | 13,585 | ||||
|
12. |
INCOME TAXES |
The provision for income taxes (credit) for the years ended December 31, 2014, 2013 and 2012 consists of the following:
|
(thousands) |
2014 |
2013 |
2012 |
|||||||||
|
Current: |
||||||||||||
|
Federal |
$ | 13,632 | $ | 8,647 | $ | 211 | ||||||
|
State |
3,120 | 2,104 | 134 | |||||||||
|
Total current |
16,752 | 10,751 | 345 | |||||||||
|
Deferred: |
||||||||||||
|
Federal |
1,496 | 3,670 | (6,320 | ) | ||||||||
|
State |
156 | 313 | (848 | ) | ||||||||
|
Total deferred |
1,652 | 3,983 | (7,168 | ) | ||||||||
|
Income taxes (credit) |
$ | 18,404 | $ | 14,734 | $ | (6,823 | ) | |||||
A reconciliation of the differences between the actual provision (credit) for income taxes and the tax provisions for income taxes at the federal statutory income tax rate (35% in 2014 and 2013, and 34% in 2012) for each of the years ended December 31, 2014, 2013 and 2012 is as follows:
|
(thousands) |
2014 |
2013 |
2012 |
|||||||||
|
Tax provision, at federal statutory income tax rate |
$ | 17,177 | $ | 13,571 | $ | 7,232 | ||||||
|
State taxes, net of federal benefit |
2,167 | 1,706 | 1,101 | |||||||||
|
Deferred tax valuation allowance |
- | - | (15,570 | ) | ||||||||
|
Other, net |
(940 | ) | (543 | ) | 414 | |||||||
|
Income taxes (credit) |
$ | 18,404 | $ | 14,734 | $ | (6,823 | ) | |||||
Deferred income tax assets and liabilities are computed annually for differences between the financial statement and tax basis of assets and liabilities that will result in deductible or taxable amounts in the future based on enacted tax laws and rates applicable to the periods in which the differences are expected to affect taxable income. Income tax expense is the tax payable or refundable for the current period plus or minus the change in deferred tax assets and liabilities during the period.
The Company evaluates current conditions in the RV, MH and residential housing markets, and overall credit markets, as well as consumer confidence and the general economy in the U.S. to determine sustainability of the Company’s levels of profitability in the future. In the absence of specific favorable factors, the Company evaluates recording a valuation allowance for deferred tax assets in a tax jurisdiction when it has cumulative financial accounting losses in recent years.
As of January 1, 2012, the Company had a tax valuation allowance (the “Valuation Allowance”) for deferred tax assets net of deferred tax liabilities (collectively, “Net Deferred Tax Assets”) not expected to be utilized of $15.6 million. In the second quarter of 2012, the Company determined that it was likely that its Net Deferred Tax Assets would be realized based upon sustained profitability and forecasted future operating results. As a result of this determination, the Company reversed approximately $6.8 million of the Valuation Allowance in 2012, exclusive of the reversal expected to result from the Company’s estimated full year tax provision (the “2012 Tax Provision”), with the reversal recorded as a non-cash income tax credit. Excluding the $6.8 million reversal of the Valuation Allowance discussed above, the Company’s 2012 Tax Provision based on its taxable income position approximated $8.8 million, which was fully offset by the reversal of the remaining Valuation Allowance.
The Valuation Allowance did not impact the Company’s ability to utilize its federal and state net operating loss carry forwards (the “NOLs”) to offset taxable earnings for federal and state tax purposes. In 2013, the Company fully utilized its remaining gross federal NOL carry forward of approximately $9.8 million. In addition, the Company had various state NOLs of approximately $12.6 million at December 31, 2012 and $4.5 million at December 31, 2013, of which approximately $1.6 million were remaining to be utilized as of December 31, 2014 and will expire in varying amounts between 2015 and 2030. While the Company recorded income taxes at an estimated full year effective rate of 37.5% in 2014 and 38% in 2013, the federal and state NOLs were used to partially offset the cash portion of the income tax liability for 2013 and, with respect to state NOLs only, 2014.
As of December 31, 2012, both the federal and state NOLs included approximately $3.7 million of taxable deductions related to unrealized excess benefits on stock-based compensation, which had not been recorded as deferred tax assets. In 2014 and 2013, the Company realized approximately $2.7 million and $2.4 million, respectively, of additional taxable deductions related to excess benefits on stock-based compensation, which had not been recorded as deferred tax assets at December 31, 2013 and 2012. These tax benefits were recorded to shareholders’ equity upon realization in 2014 and 2013.
The Company did not reflect any unrecognized tax benefits in its financial statements as of December 31, 2014 or December 31, 2013 and does not expect any significant changes relating to unrecognized tax benefits in the twelve months following December 31, 2014.
The composition of the deferred tax assets and liabilities as of December 31, 2014 and 2013 is as follows:
|
(thousands) |
2014 |
2013 |
||||||
|
Gross deferred tax assets: |
||||||||
|
Trade receivables allowance |
$ | 69 | $ | 89 | ||||
|
Inventory capitalization |
898 | 546 | ||||||
|
Accrued expenses |
3,155 | 2,615 | ||||||
|
Deferred compensation |
891 | 974 | ||||||
|
Inventory reserves |
756 | 531 | ||||||
|
AMT and other tax credit carry-forwards |
- | 9 | ||||||
|
State NOL carry-forwards |
67 | 201 | ||||||
|
Stock-based compensation |
1,530 | 538 | ||||||
|
Pension liability |
13 | 6 | ||||||
|
Intangibles |
- | 89 | ||||||
|
Gross deferred tax assets |
7,379 | 5,598 | ||||||
|
Gross deferred tax liabilities: |
||||||||
|
Prepaid expenses |
(363 | ) | (207 | ) | ||||
|
Depreciation expense |
(4,936 | ) | (3,549 | ) | ||||
|
Intangibles |
(1,875 | ) | - | |||||
|
Gross deferred tax liabilities |
(7,174 | ) | (3,756 | ) | ||||
|
Net deferred tax assets |
$ | 205 | $ | 1,842 | ||||
The deferred tax amounts above have been reflected on the consolidated statements of financial position as of December 31, 2014 and 2013 as follows:
|
(thousands) |
2014 |
2013 |
||||||
|
Current deferred tax assets, net |
$ | 4,563 | $ | 3,762 | ||||
|
Long-term deferred tax liabilities, net |
(4,358 | ) | (1,920 | ) | ||||
|
Deferred tax assets, net |
$ | 205 | $ | 1,842 | ||||
The Company paid income taxes of $16.7 million and $8.2 million in 2014 and 2013, respectively. As a result of the NOLs exceeding the Company’s taxable income, there were no federal or state income taxes paid in the year ended December 31, 2012 and virtually no other cash taxes paid other than franchise taxes and various state filing taxes.
The Company is subject to periodic audits by domestic tax authorities. For the majority of tax jurisdictions, the U.S. federal statute of limitations remains open for the years 2011 and later.
|
13. |
SHAREHOLDERS’ EQUITY |
Preferred Stock
The Company has 1,000,000 shares of preferred stock authorized, without par value, the issuance of which is subject to approval by the Board of Directors (the “Board”). The Board has the authority to fix the number, rights, preferences and limitations of the shares, subject to applicable laws and the provisions of the Articles of Incorporation.
Common Stock
The Company has 20,000,000 shares of common stock authorized, without par value, of which 10,333,720 shares and 10,568,430 shares were issued and outstanding as of December 31, 2014 and 2013, respectively.
The Company issued 110,040 shares in 2014, 121,723 shares in 2013, and 777,542 shares in 2012 related to stock-based compensation plans and for the exercise of stock warrants and stock options. The shares issued were net of repurchases made by the Company of 14,484 shares in 2014, 38,704 shares in 2013, and 38,864 shares in 2012 for the sole purpose of satisfying the minimum tax withholding obligations of employees upon the vesting of stock awards held by the employees.
In addition, in 2012, the Company issued 100,000 shares in connection with the acquisition of Décor. In 2014 and 2013, the Company repurchased 344,750 shares and 407,330 shares, respectively of its common stock through a stock repurchase program. See Note 14 for further details.
The Company’s common stock does not have a stated par value. As a result, repurchases of common stock have been reflected, using an average cost method, as a reduction of common stock, additional paid-in-capital and retained earnings in the Company’s consolidated statements of financial position.
Accumulated Other Comprehensive Income (Loss)
U.S. GAAP defines comprehensive income as non-shareholder changes in equity. The components of and changes in accumulated other comprehensive income (loss) as of December 31, 2014, 2013 and 2012 were immaterial.
Shareholder Rights Plan
On March 21, 2006, in conjunction with the expiration of the Shareholder Rights Agreement dated March 20, 1996, the Company’s Board adopted a Shareholder Rights Agreement granting new rights to holders of the Company’s common stock. Under the agreement, the Company authorized and declared a dividend distribution of one right payable on March 31, 2006 for each share of common stock of the Company outstanding on March 31, 2006, and the issuance of one right for each share of common stock subsequently issued prior to the separation date as defined in the Shareholder Rights Agreement. Each right entitles the holder to purchase 1/100th of a preferred share at the exercise price (currently $30.00), and in an unfriendly takeover situation, to purchase Company common stock having a market value equal to two times the exercise price. Also, if the Company is merged into another corporation, or if 50% or more of the Company’s assets are sold, then rights-holders are entitled, upon payment of the exercise price, to buy common shares of the acquiring corporation’s common stock having a then current market value equal to two times the exercise price. In either situation, these rights are not available to the acquiring party. However, these exercise features will not be activated if the acquiring party makes an offer to acquire all of the Company’s outstanding shares at a price that is judged by the Board to be fair to Patrick shareholders. The rights may be redeemed by the Company under certain circumstances at the rate of $0.01 per right. The rights will expire on March 21, 2016. The Company has authorized 1,000,000 shares of Preferred Stock Series A, no par value, in connection with this plan, none of which have been issued.
On March 12, 2008, in connection with a private placement of common stock with affiliates of TCOMF2 (collectively, “Tontine Capital”), the Company amended the provisions of the Shareholder Rights Agreement to exempt all Tontine Capital entities or any of their affiliates or associates.
|
14. |
STOCK REPURCHASE PROGRAM |
In February 2013, the Company’s Board authorized a stock repurchase program for purchasing up to $10.0 million of the Company’s common stock from time to time through open market or private transactions over the following 12 months. During 2013, the Company repurchased 407,330 shares at an average price of $14.92 for a total cost of $6.1 million.
In February 2014, the Board authorized an increase in the amount of the Company’s stock that may be acquired under the existing stock repurchase program over the next 12 months to $20.0 million, including the remaining amount available under the previous authorization. During 2014, the Company repurchased 344,750 shares at an average price of $40.40 per share for a total cost of $13.9 million.
On February 17, 2015, the Board authorized an increase in the amount of the Company’s stock that may be acquired under the existing stock repurchase program over the next 12 months to $20.0 million, including the remaining amount available under the previous authorization. In the first quarter of 2015 through February 27, 2015, the Company repurchased 130,500 shares, including 100,000 shares purchased from a major stockholder in a privately negotiated transaction, at an average price of $43.29 per share for a total cost of $5.7 million. Since the inception of the stock repurchase program in February 2013 through February 27, 2015, the Company repurchased, in the aggregate, 882,580 shares at an average price of $29.07 per share for a total cost of $25.7 million.
|
15. |
INCOME PER COMMON SHARE |
Income per common share is calculated for the years ended December 31, 2014, 2013 and 2012 as follows:
|
(thousands except per share data) |
2014 | 2013 | 2012 | |||||||||
|
Net income for basic and diluted per share calculation |
$ | 30,674 | $ | 24,040 | $ | 28,095 | ||||||
|
Weighted average common shares outstanding - basic |
10,634 | 10,733 | 10,558 | |||||||||
|
Effect of potentially dilutive securities |
59 | 53 | 79 | |||||||||
|
Weighted average common shares outstanding - diluted |
10,693 | 10,786 | 10,637 | |||||||||
|
Basic net income per common share |
$ | 2.88 | $ | 2.24 | $ | 2.66 | ||||||
|
Diluted net income per common share |
$ | 2.87 | $ | 2.23 | $ | 2.64 |
|
16. |
LEASE COMMITMENTS |
Leases
The Company leases office, manufacturing, and warehouse facilities and certain equipment under various non-cancelable agreements, which expire at various dates through 2024. These agreements contain various renewal options and provide for minimum annual rentals plus the payment of real estate taxes, insurance, and normal maintenance on the properties.
At December 31, 2014, future minimum lease payments required under facility and equipment operating leases that have initial or remaining non-cancelable lease terms in excess of one year are as follows:
|
(thousands) |
Facility Leases |
Equipment Leases |
||||||
|
2015 |
$ | 3,640 | $ | 2,060 | ||||
|
2016 |
2,522 | 1,897 | ||||||
|
2017 |
2,114 | 1,591 | ||||||
|
2018 |
1,121 | 1,189 | ||||||
|
2019 |
296 | 700 | ||||||
|
Thereafter |
- | 575 | ||||||
|
Total minimum lease payments |
$ | 9,693 | $ | 8,012 | ||||
The total rent expense (in thousands) included in the consolidated statements of income for the years ended December 31, 2014, 2013 and 2012 is $6,746, $5,206, and $4,178, respectively.
|
17. |
COMMITMENTS AND CONTINGENCIES |
Legal
The Company is subject to proceedings, lawsuits, audits, and other claims arising in the normal course of business. All such matters are subject to uncertainties and outcomes that are not predictable with assurance. Accruals for these items, when applicable, have been provided to the extent that losses are deemed probable and are reasonably estimable. These accruals are adjusted from time to time as developments warrant.
Although the ultimate outcome of these matters cannot be ascertained on the basis of present information, amounts already provided, availability of insurance coverage and legal advice received, it is the opinion of management that the ultimate resolution of these proceedings, lawsuits, and other claims will not have a material adverse effect on the Company’s consolidated financial position, results of operations, or cash flows.
Self-Insurance
The Company has a self-insured health plan for its employees under which there is both a participant stop-loss and an aggregate stop-loss based on total participants. The Company is potentially responsible for annual claims not to individually exceed $250,000 at December 31, 2014.
|
18. |
COMPENSATION PLANS |
Deferred Compensation Obligations
The Company has deferred compensation agreements with certain key employees. The agreements provide for monthly benefits for ten years subsequent to retirement, disability, or death. The Company has accrued an estimated liability based upon the present value of an annuity needed to provide the future benefit payments. The assumed discount rate to measure the liability was 4.5% for both of the years ended December 31, 2014 and 2013. The Company recognized expense of $0.1 million, $0.4 million and $0.2 million for the years ended December 31, 2014, 2013 and 2012, respectively, in conjunction with this plan. Life insurance contracts have been purchased which may be used to fund these agreements. The contracts are recorded at their cash surrender value in the statements of financial position. Any differences between actual proceeds and cash surrender value are recorded as gains or losses in the periods presented. Additionally, the Company records gains or losses on the cash surrender value in the period incurred. The gains recognized were immaterial for all periods presented.
Bonus Plan
The Company pays bonuses to certain management and sales personnel. Historically, bonuses are determined annually and are based upon corporate and divisional income levels and the achievement of individually defined performance criteria. The charge to operations amounted to approximately $4.8 million, $4.2 million and $4.1 million for the years ended December 31, 2014, 2013 and 2012, respectively.
Profit-Sharing Plan
The Company has a qualified profit-sharing plan, more commonly known as a 401(k) plan, for all of its full-time and part-time eligible employees upon meeting certain conditions. The plan provides for matching contributions by the Company as defined in the agreement. The contributions and related expense for the years ended December 31, 2014, 2013 and 2012 were immaterial.
Stock Option, Stock Appreciation Rights, and Stock-Based Incentive Plans
The Company has various stock option and stock-based incentive plans and various agreements whereby stock options, restricted stock awards, and stock appreciation rights (“SARS”) were made available to certain key employees, directors, and others based upon meeting various individual, divisional or company-wide performance criteria and time-based criteria. All such awards qualify and are accounted for as equity awards. Equity incentive plan awards are intended to retain and reward key employees for outstanding performance and efforts as they relate to the Company’s short-term and long-term objectives and its strategic plan.
The Company’s 2009 Omnibus Incentive Plan (the “Plan”) permits the future granting of share options and share awards to its employees, directors and other service providers. Option awards are generally granted with an exercise price equal to, or greater than, the market price of the Company’s stock at the date of grant.
The Company recorded compensation expense of $3.3 million, $1.3 million and $0.8 million for the years ended December 31, 2014, 2013 and 2012, respectively, on the consolidated statements of income for its stock-based compensation plans. As of December 31, 2014, there was approximately $5.0 million of total unrecognized compensation cost related to share-based compensation arrangements granted under incentive plans. That cost is expected to be recognized over a weighted-average period of approximately 18.4 months.
Compensation expense related to the fair value of stock awards as of the grant date is calculated based on the Company’s closing stock price on the date of grant. In addition, the Company estimates the fair value of all stock option and SARS awards as of the grant date by applying the Black-Scholes option-pricing model. The use of this valuation model involves assumptions that are judgmental and highly sensitive in the determination of compensation expense and include the dividend yield, exercise price, and forfeiture rate. Expected volatilities take into consideration the historical volatility of the Company’s common stock. The expected term of options and SARS represents the period of time that the options and SARS granted are expected to be outstanding based on historical Company trends. The risk free interest rate is based on the U.S. Treasury yield curve in effect at the time of grant for instruments of a similar term.
Stock Options:
Stock options vest pro-ratably over three years and have nine to ten-year contractual terms.
The following table summarizes the Company’s option activity during the years ended December 31, 2014, 2013 and 2012 for the options granted in 2009 and 2013:
|
Years ended December 31 |
2014 | 2013 | 2012 | |||||||||||||||||||||
|
(shares in thousands) |
Shares |
Weighted Average Exercise Price |
Shares |
Weighted Average Exercise Price |
Shares |
Weighted Average Exercise Price |
||||||||||||||||||
|
Total Options: |
||||||||||||||||||||||||
|
Outstanding beginning of year |
244 | $ | 22.97 | 90 | $ | 1.54 | 452 | $ | 1.27 | |||||||||||||||
|
Granted during the year |
- | - | 200 | 27.67 | - | - | ||||||||||||||||||
|
Forfeited during the year |
- | - | - | - | - | - | ||||||||||||||||||
|
Exercised during the year |
(15 | ) | 1.75 | (46 | ) | 1.39 | (362 | ) | 1.20 | |||||||||||||||
|
Outstanding, end of year |
229 | $ | 24.35 | 244 | $ | 22.97 | 90 | $ | 1.54 | |||||||||||||||
|
Vested Options: |
||||||||||||||||||||||||
|
Vested during the year |
67 | $ | 27.67 | - | - | 141 | $ | 1.25 | ||||||||||||||||
|
Eligible, end of year for exercise |
96 | $ | 19.74 | 44 | $ | 1.70 | 90 | $ | 1.54 | |||||||||||||||
|
Aggregate intrinsic value ($ in thousands): |
||||||||||||||||||||||||
|
Total options outstanding |
$ | 4,499 | $ | 1,457 | $ | 1,265 | ||||||||||||||||||
|
Options exercisable |
$ | 2,325 | $ | 1,205 | $ | 1,265 | ||||||||||||||||||
|
Options exercised |
$ | 616 | $ | 856 | $ | 4,759 | ||||||||||||||||||
|
Weighted average fair value of options granted during the year |
N/A |
$ | 6.33 |
N/A |
||||||||||||||||||||
The aggregate intrinsic value (excess of market value over the option exercise price) in the table above is before income taxes, and assuming the Company’s closing stock price of $43.98, $28.93 and $15.56 per share as of December 31, 2014, 2013 and 2012, respectively, is the price that would have been received by the option holders had those option holders exercised their options as of that date.
The cash received from the exercise of stock options was approximately $26,000, $64,000 and $0.4 million in 2014, 2013 and 2012, respectively. The income tax benefit related to the stock options exercised in 2014, 2013 and 2012 was $0.2 million, $0.3 million and $1.0 million, respectively. The grant date fair value of stock options vested in 2014 and 2012 was $1.8 million and $0.2 million, respectively. There were no stock options that vested in 2013.
A summary of options outstanding and exercisable at December 31, 2014 is as follows:
|
Options Outstanding |
Options Exercisable |
|||||||||||||||||||
|
(shares in thousands) |
Shares Outstanding |
Remaining Contractual Life (years) |
Exercise Price |
Shares Exercisable |
Exercise Price |
|||||||||||||||
|
2009 Grants: |
||||||||||||||||||||
|
Exercise price - |
$0.75 | 2 | 4.4 | $ | 0.75 | 2 | $ | 0.75 | ||||||||||||
|
Exercise price - |
$1.75 | 27 | 4.4 | 1.75 | 27 | 1.75 | ||||||||||||||
|
2013 Grant: |
||||||||||||||||||||
|
Exercise price - |
$27.67 | 200 | 8.0 | $ | 27.67 | 67 | $ | 27.67 | ||||||||||||
The following table presents assumptions used in the Black-Scholes model for the stock options granted in 2013. There were no stock options granted in 2012 and 2014.
|
2013 |
||||
|
Dividend rate |
- | % | ||
|
Risk-free interest rate |
0.64 | % | ||
|
Expected option life (years) |
3 | |||
|
Price volatility |
32.42 | % | ||
As of December 31, 2014, there was approximately $0.8 million of total unrecognized compensation expense related to the stock options, which is expected to be recognized over a weighted-average remaining life of approximately 23 months.
Stock Appreciation Rights (SARS):
On December 18, 2013, the Company’s Compensation Committee of the Board approved the grant of 200,000 SARS under the 2009 Plan divided into four tranches of 50,000 shares each, at strike prices of $27.67, $33.20, $39.84 and $47.81 per share. The SARS vest pro-ratably over three years from the grant date and have nine-year contractual terms. The SARS are to be settled in shares of common stock, or at the sole discretion of the Board in cash. The grant date fair value of these awards totaled $0.9 million and this amount is being amortized over the three-year vesting period. During 2014, SARS representing 66,667 shares in the aggregate, which equates to one third of each tranche, vested and none were exercised. The intrinsic value of these vested SARS at December 31, 2014 was $0.4 million, which was calculated based upon the Company’s closing stock price of $43.98 on December 31, 2014. The remaining contractual life of the SARS is eight years at December 31, 2014.
The following table presents assumptions used in the Black-Scholes model for the SARS granted in 2013. There were no SARS granted in 2012 and 2014.
| 2013 | ||||
|
Dividend rate |
-% | |||
|
Risk-free interest rate |
0.64% | - | 1.55% | |
|
Expected option life (years) |
3 | - | 4 | |
|
Price volatility |
32.42% | |||
As of December 31, 2014, there was approximately $0.6 million of total unrecognized compensation expense related to the SARS which is expected to be recognized over a weighted-average remaining life of approximately 23 months.
Restricted Stock and Restricted Stock Units:
The Company’s stock-based awards consist of both restricted stock awards and restricted stock units (“RSUs”). As of December 31, 2014, there was approximately $3.6 million of total unrecognized compensation expense related to restricted stock, which is expected to be recognized over a weighted-average remaining life of approximately 17 months.
In the first quarter of 2015, the Board approved restricted stock grants totaling 84,836 shares on February 16, 2015 at a grant date price per share of $46.96. The restricted shares cliff-vest over a three-year period based on performance- and time-based contingencies. The Company expects to expense approximately $4.0 million related to those shares pro-ratably over the vesting period on the consolidated statement of income.
Restricted Stock
Restricted stock awards possess voting rights, are included in the calculation of actual shares outstanding, and include both performance- and time-based contingencies. The grant date fair value of the awards is expensed over the related service or performance period. Time-based shares cliff vest at the conclusion of the required service period, which ranges from one to three years. The performance contingent shares are earned based on the achievement of a cumulative financial performance target over a three-year period and vest at the conclusion of the measurement period.
The following table summarizes the activity for restricted stock for the years ended December 31, 2014, 2013 and 2012:
|
2014 |
2013 |
2012 |
||||||||||||||||||||||
|
Weighted-Average |
Weighted-Average |
Weighted-Average |
||||||||||||||||||||||
|
Grant Date |
Grant Date |
Grant Date |
||||||||||||||||||||||
|
(shares in thousands) |
Shares |
Stock Price |
Shares |
Stock Price |
Shares |
Stock Price |
||||||||||||||||||
|
Unvested beginning of year |
392 | $ | 8.02 | 412 | $ | 4.96 | 405 | $ | 2.01 | |||||||||||||||
|
Granted during the year |
111 | 37.03 | 114 | 15.21 | 162 | 8.98 | ||||||||||||||||||
|
Vested during the year |
(161 | ) | 4.64 | (134 | ) | 4.74 | (155 | ) | 1.46 | |||||||||||||||
|
Unvested, end of year |
342 | $ | 19.00 | 392 | $ | 8.02 | 412 | $ | 4.96 | |||||||||||||||
RSUs
Since RSUs do not possess voting rights, they are not included in the calculation of shares outstanding. The RSUs include a performance-based contingency. The grant date fair value of the awards is expensed over the related performance period. The performance contingent RSUs are earned based on the achievement of a cumulative financial performance target over a three-year period and vest at the conclusion of the measurement period. In 2014, the Company granted 14,667 RSUs at a weighted-average grant date stock price of $37.22 per share.
|
19. |
SEGMENT INFORMATION |
The Company has determined that its reportable segments are those based on its method of internal reporting, which segregates its businesses by product category and production or distribution process.
A description of the Company’s reportable segments is as follows:
Manufacturing - The Company’s lamination operations utilize various materials, such as lauan, medium density fiberboard (“MDF”), gypsum, and particleboard, which are bonded by adhesives or a heating process to a number of products, including vinyl, paper, foil, and high-pressure laminates. These products are utilized to produce furniture, shelving, wall, counter, and cabinet products with a wide variety of finishes and textures. This segment also includes a cabinet door division, a fiberglass bath fixtures division, a hardwood furniture division, a vinyl printing division, a solid surface, granite, and quartz countertop fabrication division, an exterior graphics division, an RV painting division, a fabricated aluminum products division, a simulated wood and stone products division, and a fiberglass and plastic components division. Patrick’s major manufactured products also include wrapped vinyl, paper and hardwood profile mouldings, interior passage doors, and slotwall panels and components. The Manufacturing segment contributed approximately 75%, 77% and 76% of the Company’s net sales for the years ended December 31, 2014, 2013 and 2012, respectively.
Distribution – The Company distributes pre-finished wall and ceiling panels, drywall and drywall finishing products, electronics, wiring, electrical and plumbing products, FRP products, cement siding, interior passage doors, roofing products, laminate and ceramic flooring, shower doors, furniture, fireplaces and surrounds, interior and exterior lighting products, and other miscellaneous products. The Distribution segment contributed approximately 25%, 23% and 24% of the Company’s net sales for the years ended December 31, 2014, 2013 and 2012, respectively.
The accounting policies of the segments are the same as those described in Note 2, except that segment data includes intersegment sales. Assets are identified to the segments with the exception of cash, prepaid expenses, land and buildings, and certain deferred assets, which are identified with the corporate division. The corporate division charges rents to the segments for use of the land and buildings based upon estimated market rates. The Company accounts for intersegment sales similar to third party transactions, which reflect current market prices. The Company also records certain income from purchase incentive agreements as corporate division revenue. The Company evaluates the performance of its segments and allocates resources to them based on a variety of indicators including sales, cost of goods sold, operating income and total identifiable assets. In addition, certain significant items (the majority of which are non-cash in nature), are presented in the table below
The table below presents information about the operating income, segment assets, and certain other items that are either used by or provided to the chief operating decision maker of the Company as of and for the years ended December 31, 2014, 2013 and 2012 (in thousands):
|
2014 |
||||||||||||
|
Manufacturing |
Distribution |
Total |
||||||||||
|
Net outside sales |
$ | 548,796 | $ | 186,921 | $ | 735,717 | ||||||
|
Intersegment sales |
18,356 | 2,517 | 20,873 | |||||||||
|
Total sales |
567,152 | 189,438 | 756,590 | |||||||||
|
Cost of goods sold |
477,189 | 160,375 | 637,564 | |||||||||
|
Operating income |
55,838 | 10,659 | 66,497 | |||||||||
|
Identifiable assets |
167,278 | 50,869 | 218,147 | |||||||||
|
Depreciation and amortization |
7,087 | 1,560 | 8,647 | |||||||||
|
2013 |
||||||||||||
|
Manufacturing |
Distribution |
Total |
||||||||||
|
Net outside sales |
$ | 458,438 | $ | 136,493 | $ | 594,931 | ||||||
|
Intersegment sales |
19,264 | 2,606 | 21,870 | |||||||||
|
Total sales |
477,702 | 139,099 | 616,801 | |||||||||
|
Cost of goods sold |
407,528 | 116,039 | 523,567 | |||||||||
|
Operating income |
43,860 | 8,040 | 51,900 | |||||||||
|
Identifiable assets |
98,058 | 41,449 | 139,507 | |||||||||
|
Depreciation and amortization |
4,906 | 625 | 5,531 | |||||||||
|
2012 |
||||||||||||
|
Manufacturing |
Distribution |
Total |
||||||||||
|
Net outside sales |
$ | 330,941 | $ | 106,426 | $ | 437,367 | ||||||
|
Intersegment sales |
16,007 | 1,830 | 17,837 | |||||||||
|
Total sales |
346,948 | 108,256 | 455,204 | |||||||||
|
Cost of goods sold |
296,641 | 90,155 | 386,796 | |||||||||
|
Operating income |
30,798 | 5,727 | 36,525 | |||||||||
|
Identifiable assets |
85,523 | 25,745 | 111,268 | |||||||||
|
Depreciation and amortization |
3,851 | 399 | 4,250 | |||||||||
Consolidated net sales by product type were as follows for the years ended December 31:
|
Consolidated net sales by product type: |
2014 |
2013 |
2012 |
|||||||||
|
Decorative interior products and components |
$ | 615,285 | $ | 541,364 | $ | 392,048 | ||||||
|
Non-decorative interior products and components |
54,025 | 53,567 | 45,319 | |||||||||
|
Exterior products and other |
66,407 | - | - | |||||||||
|
Consolidated net sales |
$ | 735,717 | $ | 594,931 | $ | 437,367 | ||||||
A reconciliation of certain line items pertaining to the total reportable segments to the consolidated financial statements as of and for the years ended December 31, 2014, 2013 and 2012 is as follows (in thousands):
|
2014 |
2013 |
2012 |
||||||||||
|
Net sales: |
||||||||||||
|
Total Sales for reportable segments |
$ | 756,590 | $ | 616,801 | $ | 455,204 | ||||||
|
Elimination of intersegment sales |
(20,873 | ) | (21,870 | ) | (17,837 | ) | ||||||
|
Consolidated net sales |
$ | 735,717 | $ | 594,931 | $ | 437,367 | ||||||
|
Cost of goods sold: |
||||||||||||
|
Total cost of goods sold for reportable segments |
$ | 637,564 | $ | 523,567 | $ | 386,796 | ||||||
|
Elimination of intersegment cost of goods sold |
(20,873 | ) | (21,870 | ) | (17,837 | ) | ||||||
|
Other |
523 | 2,211 | 2,664 | |||||||||
|
Consolidated cost of goods sold |
$ | 617,214 | $ | 503,908 | $ | 371,623 | ||||||
|
Operating income: |
||||||||||||
|
Operating income for reportable segments |
$ | 66,497 | $ | 51,900 | $ | 36,525 | ||||||
|
Gain (loss) on sale of fixed assets and acquisition of business |
(30 | ) | 430 | 238 | ||||||||
|
Unallocated corporate expenses |
(10,519 | ) | (9,014 | ) | (8,200 | ) | ||||||
|
Amortization |
(4,477 | ) | (2,371 | ) | (1,523 | ) | ||||||
|
Consolidated operating income |
$ | 51,471 | $ | 40,945 | $ | 27,040 | ||||||
|
Consolidated total assets: |
||||||||||||
|
Identifiable assets for reportable segments |
$ | 218,147 | $ | 139,507 | $ | 111,268 | ||||||
|
Corporate property and equipment |
24,854 | 22,871 | 22,025 | |||||||||
|
Current and long-term assets not allocated to segments |
8,602 | 9,544 | 7,028 | |||||||||
|
Intangibles and other assets not allocated to segments |
3,958 | 2,265 | 3,148 | |||||||||
|
Consolidated total assets |
$ | 255,561 | $ | 174,187 | $ | 143,469 | ||||||
|
Depreciation and amortization: |
||||||||||||
|
Depreciation and amortization for reportable segments |
$ | 8,647 | $ | 5,531 | $ | 4,250 | ||||||
|
Corporate depreciation and amortization |
1,786 | 1,766 | 1,336 | |||||||||
|
Consolidated depreciation and amortization |
$ | 10,433 | $ | 7,297 | $ | 5,586 | ||||||
Amortization expense related to intangible assets in the Manufacturing segment for the years ended December 31, 2014, 2013 and 2012 was $3.2 million, $1.9 million, and $1.2 million, respectively. Intangible assets amortization expense in the Distribution segment was $1.3 million, $0.5 million, and $0.3 million in 2014, 2013 and 2012, respectively.
Unallocated corporate expenses include corporate general and administrative expenses comprised of wages, insurance, taxes, supplies, travel and entertainment, professional fees and other.
Major Customers
The Company had one RV customer that accounted for approximately 41% and 28% of the trade receivables balance at December 31, 2014 and 2013, respectively. There were no other customers that accounted for more than 10% of the trade receivables balance at December 31, 2014 and 2013.
The Company had two customers in the RV market that each accounted for over 10% of consolidated net sales. One RV customer accounted for approximately 34% of consolidated net sales in each of the three years ended December 31, 2014, 2013 and 2012. In addition, sales to a different RV customer accounted for approximately 24%, 23% and 20% of consolidated net sales in 2014, 2013 and 2012, respectively.
|
20. |
QUARTERLY FINANCIAL DATA (UNAUDITED) |
Selected quarterly financial data for the years ended December 31, 2014 and 2013 is as follows:
|
(thousands except per share data) |
1Q |
2Q |
3Q |
4Q |
2014 |
|||||||||||||||
|
Net sales |
$ | 170,150 | $ | 187,855 | $ | 188,138 | $ | 189,574 | $ | 735,717 | ||||||||||
|
Gross profit |
27,147 | 31,819 | 30,028 | 29,509 | 118,503 | |||||||||||||||
|
Net income |
6,896 | 9,231 | 7,254 | 7,293 | 30,674 | |||||||||||||||
|
Net income per common share (1): |
||||||||||||||||||||
|
Basic |
$ | 0.64 | $ | 0.86 | $ | 0.68 | $ | 0.70 | $ | 2.88 | ||||||||||
|
Diluted |
0.64 | 0.86 | 0.68 | 0.69 | 2.87 | |||||||||||||||
|
(thousands except per share data) |
1Q |
2Q |
3Q |
4Q |
2013 |
|||||||||||||||
|
Net sales |
$ | 142,120 | $ | 159,576 | $ | 146,623 | $ | 146,612 | $ | 594,931 | ||||||||||
|
Gross profit |
22,436 | 25,160 | 21,823 | 21,604 | 91,023 | |||||||||||||||
|
Net income |
6,019 | 7,557 | 5,452 | 5,012 | 24,040 | |||||||||||||||
|
Net income per common share (1): |
||||||||||||||||||||
|
Basic |
$ | 0.55 | $ | 0.70 | $ | 0.51 | $ | 0.47 | $ | 2.24 | ||||||||||
|
Diluted |
0.55 | 0.70 | 0.51 | 0.47 | 2.23 | |||||||||||||||
(1) Basic and diluted net income per common share are computed independently for each of the quarters presented. Therefore, the sum of quarterly basic and diluted net income per common share information may not equal annual basic and diluted net income per common share.
F-36