Attached files
| file | filename |
|---|---|
| EX-23 - EXHIBIT 23 - KONA GRILL INC | ex23.htm |
| EX-21 - EXHIBIT 21 - KONA GRILL INC | ex21.htm |
| EX-32.1 - EXHIBIT 32.1 - KONA GRILL INC | ex32-1.htm |
| EX-31.1 - EXHIBIT 31.1 - KONA GRILL INC | ex31-1.htm |
| EX-31.2 - EXHIBIT 31.2 - KONA GRILL INC | ex31-2.htm |
| EX-32.2 - EXHIBIT 32.2 - KONA GRILL INC | ex32-2.htm |
| EXCEL - IDEA: XBRL DOCUMENT - KONA GRILL INC | Financial_Report.xls |
UNITED STATES
SECURITIES AND EXCHANGE COMMISSION
WASHINGTON, D.C. 20549
FORM 10-K
(Mark one)
|
☒ |
ANNUAL REPORT PURSUANT TO SECTION 13 OR 15(d) OF THE SECURITIES EXCHANGE ACT OF 1934 |
| For the fiscal year ended December 31, 2014 |
or
|
□ |
TRANSITION REPORT PURSUANT TO SECTION 13 OR 15(d) OF THE SECURITIES EXCHANGE ACT OF 1934 |
| For the transition period from _____ to _____ |
Commission File Number 001-34082
Kona Grill, Inc.
(Exact Name of Registrant as Specified in Its Charter)
|
Delaware |
20-0216690 |
|
(State or other jurisdiction of incorporation or organization) |
(I.R.S. Employer Identification No.) |
7150 East Camelback Road, Suite 333
Scottsdale, Arizona 85251
(480) 922-8100
(Address, including zip code, and telephone number, including area code, of principal executive offices)
Securities registered pursuant to Section 12(b) of the Act:
|
Title of Each Class |
Name of Each Exchange on Which Registered |
| Common Stock, par value $0.01 per share | NASDAQ Global Market |
Securities registered pursuant to Section 12(g) of the Act:
None
Indicate by check mark if the registrant is a well-known seasoned issuer, as defined in Rule 405 of the Securities Act. Yes ☐ No ☒
Indicate by check mark if the registrant is not required to file reports pursuant to Section 13 or Section15(d) of the Act. Yes ☐ No ☒
Indicate by check mark whether the registrant (1) has filed all reports required to be filed by Section 13 or 15(d) of the Securities Exchange Act of 1934 during the preceding 12 months (or for such shorter period that the registrant was required to file such reports), and (2) has been subject to such filing requirements for the past 90 days. Yes ☒ No ☐
Indicate by check mark whether the registrant has submitted electronically and posted on its corporate Web site, if any, every Interactive Data File required to be submitted and posted pursuant to Rule 405 of Regulation S-T (§ 232.405 of this chapter) during the preceding 12 months (or for such shorter period that the registrant was required to submit and post such files). Yes ☒ No ☐
Indicate by check mark if disclosure of delinquent filers pursuant to Item 405 of Regulation S-K (§229.405 of this chapter) is not contained herein, and will not be contained, to the best of registrant’s knowledge, in definitive proxy or information statements incorporated by reference in Part III of this Form 10-K or any amendment to this Form 10-K. ☐
Indicate by check mark whether the registrant is a large accelerated filer, an accelerated filer, a non-accelerated filer, or a smaller reporting company. See definitions of “large accelerated filer,” “accelerated filer,” and “smaller reporting company” in Rule 12b-2 of the Exchange Act. (Check one):
|
Large accelerated filer ☐ |
Accelerated filer ☐ |
Non-accelerated filer ☐ |
Smaller reporting company ☒ |
Indicate by check mark whether the registrant is a shell company (as defined in Rule 12b-2 of the Exchange Act). Yes ☐ No ☒
The aggregate market value of common stock held by non-affiliates of the registrant as of the last business day of the registrant’s most recently completed second fiscal quarter, June 30, 2014, was $160,210,000, calculated based on the closing price of the registrant’s common stock as reported by the NASDAQ Global Market. For purposes of this computation, all officers, directors, and 10% beneficial owners of the registrant are deemed to be affiliates. Such determination should not be deemed to be an admission that such officers, directors, or 10% beneficial owners are, in fact, affiliates of the registrant.
As of March 6, 2015, there were 11,252,563 shares of the registrant’s common stock outstanding.
Documents Incorporated by Reference
Portions of the registrant’s definitive proxy statement for the 2015 Annual Meeting of Stockholders, to be filed with the Commission within 120 days after the end of the fiscal year ended December 31, 2014, are incorporated by reference into Part III of this report.
KONA GRILL, INC.
Annual Report on Form 10-K
For the Year Ended December 31, 2014
TABLE OF CONTENTS
|
PART I | ||
|
Item 1. |
Business |
1 |
|
Item 1A. |
Risk Factors |
11 |
|
Item 1B. |
Unresolved Staff Comments |
24 |
|
Item 2. |
Properties |
24 |
|
Item 3. |
Legal Proceedings |
25 |
|
Item 4. |
Mine Safety Disclosures |
25 |
|
PART II | ||
|
Item 5. |
Market for Registrant’s Common Equity, Related Stockholder Matters and Issuer Purchases of Equity Securities |
25 |
|
Item 6. |
Selected Financial Data |
27 |
|
Item 7. |
Management’s Discussion and Analysis of Financial Condition and Results of Operations |
28 |
|
Item 7A. |
Quantitative and Qualitative Disclosures About Market Risk |
43 |
|
Item 8. |
Financial Statements and Supplementary Data |
44 |
|
Item 9. |
Changes in and Disagreements With Accountants on Accounting and Financial Disclosure |
44 |
|
Item 9A. |
Controls and Procedures |
44 |
|
Item 9B. |
Other Information |
45 |
|
PART III | ||
|
Item 10. |
Directors, Executive Officers and Corporate Governance |
45 |
|
Item 11. |
Executive Compensation |
45 |
|
Item 12. |
Security Ownership of Certain Beneficial Owners and Management and Related Stockholder Matters |
45 |
|
Item 13. |
Certain Relationships and Related Transactions, and Director Independence |
45 |
|
Item 14. |
Principal Accountant Fees and Services |
45 |
|
PART IV | ||
|
Item 15. |
Exhibits and Financial Statement Schedules |
45 |
|
Signatures |
47 | |
|
Index to Consolidated Financial Statements |
F-1 | |
Statements Regarding Forward-Looking Statements
The statements contained in this report on Form 10-K that are not purely historical are forward-looking statements within the meaning of applicable securities laws. Forward-looking statements include statements regarding our “expectations,” “anticipation,” “intentions,” “beliefs,” or “strategies” regarding the future. Forward-looking statements relating to our future economic performance, plans and objectives for future operations, and projections of sales and other financial items are based on our beliefs as well as assumptions made by and information currently available to us. Actual results could differ materially from those currently anticipated as a result of a number of factors, including those discussed in Item 1A, “Risk Factors.”
PART I
|
Item 1. |
Business |
Overview
Kona Grill, Inc. (referred to herein as the “Company” or “we,” “us,” and “our”) currently owns and operates 30 polished casual restaurants in 19 states. Our restaurants offer freshly prepared food, attentive service, and an upscale contemporary ambiance that create an exceptional, yet affordable dining experience that we believe exceeds many traditional casual dining restaurants with whom we compete. Our high-volume polished casual restaurants feature a diverse selection of flavorful American food, internationally influenced appetizers and entrees and an extensive selection of award-winning sushi. Our menu items are prepared from scratch at each restaurant location and incorporate over 40 signature sauces and dressings, creating memorable flavor profiles that appeal to a diverse group of customers. Our diverse menu is complemented by a full service bar offering a broad assortment of wines, specialty cocktails, and beers. We believe that our innovative high-quality recipes, generous portions, and flexible price points provide customers with an excellent value proposition and allow us to attract a diverse customer base.
Our restaurants seat an average of 294 customers and are comprised of multiple dining areas that incorporate modern design elements to create an upscale ambiance that reinforces our high standards of food and service. Our main dining area, full-service bar, indoor/outdoor patio, and sushi bar provide a choice of atmospheres and a variety of environments designed to attract new customers and encourage repeat visits from regular customers. We locate our restaurants in high-activity areas such as retail centers, shopping malls, urban entertainment districts, and lifestyle centers that are situated near commercial office space and residential housing to attract customers throughout the day.
We believe that the portability of our concept has been successfully demonstrated in a variety of markets across the United States (U.S.). We plan to grow organically through unit expansion, with a target of 20% unit growth annually over the next several years by strategically expanding the Kona Grill concept in both new and existing markets. Furthermore, given the broad appeal of our concept across the U.S. and the increased demand for polished casual dining concepts overseas, we believe there is a significant opportunity to expand our concept in Latin America, the Middle East and beyond over the long term.
Competitive Strengths
The restaurant business is intensely competitive with respect to food quality, price-value relationships, ambiance, service and location. We believe that the key strengths of our business include the following:
|
● |
Innovative Menu Selections with Mainstream Appeal. We offer a menu of freshly prepared, high quality food that includes a diverse selection of flavorful American favorites with an international influence and award-winning sushi items to appeal to a wide range of tastes, preferences, and price points. We prepare our dishes from scratch at each restaurant location using original recipes with generous portions and creative and appealing presentations that adhere to standards that we believe are much closer to fine dining than typical casual dining. Our more than 40 signature sauces and dressings create memorable flavor profiles and further differentiate our menu items. With an average check during 2014 of approximately $25 per customer, we believe we provide an exceptional price-value proposition that helps create a lasting relationship between Kona Grill and our customers. |
|
● |
Distinctive Polished Casual Dining Experience. Our polished casual dining concept captures some of the best elements of fine dining including a variety of exceptional food options, attentive service, and an extensive wine and cocktail list, and combines them with the traditional casual dining attributes, like a broad menu with attractive price points and a choice of environments suitable for any dining occasion. Our creative menu, personalized service, and contemporary restaurant design blend together to create an inviting polished casual dining experience. We design our restaurants with a unique layout and utilize modern, eye-catching design elements to enhance the customer experience. Our multiple dining areas provide customers with a number of distinct dining environments and atmospheres to suit a range of dining occasions. Our open exhibition-style kitchen and sushi bar further emphasize the quality and freshness of our food that are the cornerstones of our concept. |
|
● |
Significant Bar and Happy Hour Business. Our high-energy bar and patio offer a distinctive atmosphere where customers can enjoy our alcoholic beverage offerings. Our patio is a popular place for customers to enjoy our high-value happy hour and reverse happy hour offerings, where full portions of select items are offered at reduced price points. Our patio, which is enclosed in colder climate locations, provides a year-round sales opportunity and is a key driver in generating business during non-traditional periods. Aggregate restaurant sales during these non-peak periods accounted for 24.7% of our total sales during 2014, which we believe provides us with a competitive advantage. |
|
● |
Personalized Customer Service. Our commitment to provide prompt, friendly, and efficient service enhances our food, reinforces our upscale ambiance, and helps distinguish us from other traditional casual dining restaurants. We train our service personnel to be cordial, friendly, and knowledgeable about all aspects of the restaurant, especially the menu and the wine list, which helps us provide personalized customer service that is designed to ensure an enjoyable dining experience and exceed our customers’ expectations. Our kitchen staff completes extensive training to ensure that menu items are precisely prepared to provide a consistent quality of taste. We believe our focus on high service standards underscores our customer-centric philosophy. |
|
● |
Multiple Daypart Model. Our appetizers, flatbreads, entrees, and sushi offerings provide a flexible selection of items that can be ordered individually or shared allowing customers to dine with us during traditional lunch and dinner meal periods as well as between customary dining periods such as in the late afternoon and late night. The lively ambiance of our patio and bar areas provides an energetic social forum that attracts a young professional clientele during non-peak periods, as well as provides a unique atmosphere for all of our customers to enjoy before or after they dine with us. Our sushi bar provides another dining venue for customers while offering a wide selection of creative and flavorful menu items for our health conscious customers. We believe that our ability to attract customers throughout the day distinguishes us from many other casual dining chains and helps us maximize sales and leverage our fixed operating costs. |
|
● |
Attractive Unit Economics. During 2014, the average unit volume of our comparable base restaurants was $4.4 million. We believe our average unit volume helps us attract high-quality employees, leverage fixed costs, and makes us a desirable tenant for landlords. We expect the average cash investment for new restaurants to be approximately $2.5 million, net of landlord tenant improvement allowances and excluding preopening expenses. Based on historical experience, restaurants that are subject to ground leases and do not receive landlord tenant improvement allowances may require a significantly higher cash investment, but typically have lower average rental costs over the duration of the lease. |
Growth Strategy
We believe that there are significant opportunities to grow our sales and increase our brand awareness throughout the United States and internationally. The following sets forth the key elements of our growth strategy.
Pursue Disciplined Restaurant Growth
We review potential sites in both new and existing markets that meet our target customer demographics, real estate, and investment return criteria. We believe the location of our restaurants plays a pivotal role in determining the long-term profitability of each restaurant and, accordingly, we spend significant time and resources to evaluate each prospective site. We utilize a disciplined site selection process involving our management team and Board of Directors. Our site selection criteria for new restaurants include locating our restaurants near high activity areas such as retail centers, shopping malls, and lifestyle and entertainment centers. In addition, we focus on areas that have above-average density and income populations, have high customer traffic throughout the day from thriving businesses or retail markets, and are convenient for and appealing to business and leisure travelers. We also focus on sites that have great visibility and ample parking to support high volumes of traffic.
We plan to grow organically through unit expansion, with a target of 20% unit growth annually over the next several years. We achieved a unit growth rate of 20% for 2014, with five openings during the year, including the Fort Worth, Texas restaurant in the first quarter, the El Paso, Texas location in the second quarter and the Sarasota, Florida; Alpharetta, Georgia and Columbus, Ohio restaurants in the fourth quarter. We plan to open seven restaurants during 2015, which equates to 23% unit growth. We currently have twelve signed leases for new restaurant openings in 2015 and beyond and continue working diligently to build our pipeline for future growth.
With the acceleration of unit growth in 2014, we have incurred significant preopening expense in 2014 and expect to continue to incur such expenses in 2015 as we increase the number of new restaurant openings in 2015. We expect the opening of new units to place downward pressure on our profitability as significant preopening expenses are incurred while operating profit from the new restaurants will likely not be significant in the first few months of each new restaurant’s operation as a result of start-up inefficiencies typically associated with opening new restaurants. Although the actual preopening expenses for a particular location depend upon numerous factors, we expect to incur cash preopening expenses of approximately $425,000 per location, and non-cash preopening rent expense ranging from $50,000 to $100,000 per location.
Our growth strategy for developing new restaurants also includes expansion in existing markets that have the appropriate demographics to support multiple restaurants. Operating multiple restaurants in existing markets enables us to leverage our brand equity as well as gain operating efficiencies associated with regional supervision, marketing, purchasing, and hiring. In addition, our ability to hire qualified employees is enhanced in markets where we enjoy greater brand awareness and we are able to utilize existing employees in new restaurants. Our expansion plans currently do not involve any franchised restaurant operations in the U.S.
In addition, we have started to explore our potential expansion into international markets. Given the strength our concept has enjoyed thus far in the U.S. and the increased demand for polished casual dining concepts overseas, we believe there is a significant opportunity to expand our concept in Latin America, the Middle East and beyond. Similar to other brands with international expansion, we plan to utilize a franchise model for development outside the U.S. Under this model, we will provide training and operational support to our partners without committing, or putting at risk, capital for restaurant construction in these international markets. Our international strategy is still in its early stages as it will take time for us to identify franchise partners and negotiate franchise agreements and for our partners to find quality real estate and construct the restaurants. We will then need to train the local team on our food and hospitality standards to ensure a successful execution of our strategy. We expect to make several investments in the coming year, including developing marketing materials, obtaining trademarks in the requisite markets and incurring incremental travel and networking expenses in order to build the right foundation for our growth.
Grow Existing Restaurant Sales
Our goal for existing restaurants is to increase unit volumes through the execution of our differentiated business model and complimented with ongoing social marketing efforts as well as local market advertising and other initiatives designed to generate awareness and trial of our concept and increase the frequency of customer visits. While many segments within the restaurant industry experienced a decline in same-store sales and customer traffic during 2014, our restaurant sales for comparable base restaurants, which include those units open for more than 18 months, increased 3.8% compared to 2013. The increase reflects a 2.9% increase in customer traffic and a 0.9% increase in average check per person. Our same-store sales for 2014 successfully lapped a 1.4% same-store sales increase during 2013. We believe the strength of our differentiated concept and the appeal of our new design enables us to gain market share, as evidenced by the positive same-store sales growth in the last seven quarters and in the past 17 out of 18 quarters.
We also continue to focus on our four wall execution with key initiatives designed to drive traffic, increase sales and enhance the customer experience while building our business for long-term growth. Our food-based promotions, which include innovative seasonal menu items, are offered four times during the year. These initiatives are highly successful in keeping our menu fresh and exciting while also providing a great venue to test the popularity of new menu items and the opportunity to place top-selling items on our regular menu. We continue to enhance our wine list and utilize our Wine Down Wednesday offering to drive customer traffic by offering a 50% discount on bottle wines each Wednesday. Our value-driven happy hour price-points help drive incremental sales and customer traffic during non-peak hours. Our To Go program and catering services continued to gain traction and increased in absolute dollars year over year. We had record gift card sales during the holiday season, with a 38% increase year over year, driven by targeted marketing initiatives. Furthermore, we continue to focus on the quality of our service and hospitality and improve our customer satisfaction with extensive training for our service staff on our wine list, drink and menu offerings. We continue to grow our customer loyalty program, Konavore, which has grown to over 225,000 members since its inception in 2010. We utilize this e-mail based program to communicate new menu offerings, restaurant specific events, and other marketing messages to keep Kona Grill top of mind for consumers. We have also increased our presence in social marketing and interactive advertising. Furthermore, we utilize a customer satisfaction survey across the entire brand to provide valuable feedback that our management team can respond to immediately. We believe we can generate additional sales through these programs at a reasonable cost per restaurant.
Continue Strategic Investments in Personnel and Systems
We believe that successful execution of our growth strategies will enable Kona Grill to be a leading polished casual dining restaurant operator in the United States. During the past two years, we have made strategic personnel investments in order to re-ignite the expansion of our concept and continue making additional investments in both operations and development personnel to support our accelerated new unit expansion and international business development initiatives. Additionally, we continue to implement information systems and tools to enhance our business while ensuring that strong financial controls are in place to minimize risks associated with our current growth strategy.
Expansion Strategy and Site Selection
We believe the location of our restaurants is critical to our long-term success and, accordingly, we devote significant time and resources to analyzing each prospective site. Our restaurant expansion strategy focuses primarily on penetrating new markets in major metropolitan areas throughout the United States and existing markets where demographic information supports the building of additional restaurants. In general, we prefer to open restaurants in high-profile sites within specific trade areas with the following considerations:
|
● |
suitable demographic characteristics, including residential and commercial population density and above-average household incomes; |
|
● |
great visibility; |
|
● |
high traffic patterns; |
|
● |
general accessibility; |
|
● |
availability of suitable parking; |
|
● |
proximity of shopping areas and office parks; |
|
● |
degree of competition and the operating performance of those competitors within the trade area; and |
|
● |
general availability of restaurant-level employees. |
These sites generally include high-volume retail centers, shopping malls, and lifestyle and entertainment centers.
We thoroughly analyze each prospective location before presenting the site to our Real Estate Committee, comprised of members of the Board of Directors, for review. Prior to committing to a restaurant site and signing a lease, our Chief Executive Officer, Vice President of Development and a member of the Real Estate Committee visit the prospective site and evaluate the proposed economics of the restaurant based on demographic data and other relevant criteria to assure that the site will meet our return on investment criteria.
We lease all of our restaurant sites under lease terms that vary by restaurant; however, we generally lease space (freestanding or in-line) for 10 to 20 years and negotiate at least two five-year renewal options. Our rent structures vary from lease to lease, but generally provide for the payment of both minimum base rent and contingent rent based on restaurant sales. We are also generally responsible for a proportionate share of common area maintenance, property tax, insurance, and other occupancy-related expenses.
We believe our average unit volumes, differentiated menu and multi-daypart model make us an attractive tenant and provide us with multiple opportunities to obtain suitable leasing terms from landlords. As a result of the locations we select, which are often in new retail center or shopping mall developments, our restaurant development timeframes vary according to the landlord’s construction schedule and other factors that are beyond our control. Once the site has been turned over to us, the typical lead-time from commencement of construction to opening is approximately six months.
Unit Economics
We target a 31% to 33% net cash-on-cash return for our restaurants once they reach their mature level of operations. Maturation periods vary from restaurant to restaurant, but generally range from two to four years. During 2014, the average unit volume of our comparable base restaurants was $4.4 million, a 4.3% increase from 2013 demonstrating the strength and broad appeal of our concept. We generated restaurant-level operating profit of $21.4 million during 2014, an increase of 18.3% from prior year. Our restaurant operating margin for comparable base restaurants was 18.7% in 2014 which was at the high end of our targeted range of 18% to 19%. The cash-based performance target for our restaurant operations does not include field supervision, corporate support expenses, preopening expenses, or non-cash items such as depreciation and amortization; and does not represent a targeted return on investment in our common stock.
Our investment cost for new restaurants varies significantly depending upon the location of the restaurant, the type of lease entered into and the amount of tenant improvement allowance we receive from landlords. We expect the cash investment cost of our prototype restaurant on average to be approximately $2.5 million, net of landlord tenant improvement allowances averaging between $0.7 million and $1.2 million, and excluding cash preopening expenses of approximately $425,000.
Our ability to generate sales throughout the day is a key strength of our concept. The following table depicts the amount and percentage of contribution for each daypart of overall restaurant sales during 2014.
2014 Sales by Daypart
|
Sales |
Percent |
|||||||
|
(Dollars in thousands) |
||||||||
|
Lunch (Open to 3 p.m.) |
$ | 29,025 | 24.4 | % | ||||
|
Dinner (5 p.m. to 9 p.m.) |
60,622 | 50.9 | % | |||||
|
Non-Peak (3 p.m. to 5 p.m. and 9 p.m. to Close) |
29,450 | 24.7 | % | |||||
|
Total All Day |
$ | 119,097 | 100.0 | % | ||||
Menu
Our menu offers customers a diverse selection of flavorful American favorites with an international influence and award-winning sushi items. This diverse menu is an important factor in differentiating ourselves from other polished casual dining competitors. We offer over 40 freshly prepared signature sauces and dressings, which distinguish and complement our dishes and create delicious flavor profiles that appeal to our customers. Our menu items are prepared from scratch at each restaurant location using fresh high quality ingredients and adhere to food standards that we believe are much closer to fine dining than typical casual dining.
Our menu features a selection of appetizers, salads, soups, flatbreads, sandwiches, noodles, seafood, signature entrees, and desserts. We round out our menu with over 60 hand-made award-winning sushi choices. Our appetizers include socially interactive items that can be eaten individually or easily shared among customers. Our signature entrees feature various sauces and offer customers generous portions that are impressive in presentation and in taste. For example, our most popular entrée is the Macadamia Nut Chicken served with shoyu-cream sauce and accompanied by parmesan garlic mashed potatoes and seasonal vegetables. Other favorites include Miso-Sake Sea Bass served with shrimp and pork fried rice and a seasonal vegetable and Pan-Seared Ahi served with steamed white rice, baby bok choy and a sweet chili sauce.
We are also known for our extensive assortment of sushi that includes traditional favorites as well as distinctive specialty sushi and sashimi items such as our Voodoo Roll made with spicy crawfish mix and avocado rolled inside of seaweed and topped with a habanero tuna mix and chili masago, or the Bama Roll made with crab mix, cream cheese and jalapeno in soy paper topped with tuna, avocado, fish roe and spicy mayo. Our menu, coupled with an expansive selection of sushi, offers ample choices for health conscious customers. We take great pride in providing our customers the full Kona Grill experience without compromising their dietary needs and restrictions. We offer extensive gluten-free, vegetarian and vegan menus. We also feature a bento box with a variety of selections of protein and side dishes for the enjoyment of our young customers.
Each of our restaurants has a dedicated kitchen staff member, whom we refer to as our saucier, to oversee the preparation of more than 40 signature sauces and dressings that are made from scratch using only high-quality ingredients and fresh products. Each sauce is designed according to a proprietary recipe for specific menu items and includes unique flavors and combinations such as our honey cilantro, shoyu-cream, and spicy aioli dipping sauces, and our sesame-soy and honey dijon dressings. We believe that these distinctive sauces and dressings provide a unique flavor profile, which further distinguishes Kona Grill from its competitors. Our flavorful sauces and dressings also enhance the overall dining experience for our customers by allowing them to not only experience new tastes but to also share their favorite sauces with others, helping to foster customer loyalty and a socially interactive dining experience.
The versatility of our menu enables us to provide customers with dishes that can be enjoyed outside of the traditional lunch and dinner meal periods, as well as to serve our customers’ requirements for a variety of dining occasions, including everyday dining, business lunches, social gatherings and special occasions. We also offer group dining menus and sushi platters to provide additional opportunities to service our customers. In general, our menu is consistent from location to location. We typically update our menu in the spring and the fall and make enhancements to existing items or introduce new items based on customer feedback, which helps ensure that we are meeting the needs of our customers.
Our restaurants also offer an extensive selection of domestic and imported bottled and draft beers, over 50 selections of wines by the glass or bottle, and an extensive selection of liquors and specialty cocktail drinks. During our weekday happy hour (3 p.m. to 7 p.m.), reverse happy hour (9 p.m. to 11 p.m.) and Sunday happy hour in select markets, we offer discounts on selected food and alcoholic beverage items. Happy hour times may vary by location due to local liquor laws. Alcoholic beverage sales represented approximately 30% of our total restaurant sales during 2014.
Decor and Atmosphere
We design our restaurants to offer our customers a unique dining experience in a setting that is relevant for today and tomorrow. Each of our restaurants is individually designed with a contemporary look that is adaptable to varying real estate opportunities while incorporating signature elements such as our saltwater aquarium, multiple dining areas and open floor plan. Our customers can expect to find a warm and inviting atmosphere that aligns with our innovative food and drink offerings and high quality service. Our design incorporates exotic veneers, various tiles and textures, vertical beveled stone, raised fabric panels, and fire and water elements. The layout of our restaurants focuses on creating multiple dining areas for our customers while maintaining an open atmosphere that allows customers to have a panoramic view of the entire restaurant and exhibition kitchen and sushi bar. Each restaurant features varying water elements, including our signature aquarium with bright and colorful exotic fish, plants, and unique under water decor. We also utilize a variety of directional lighting styles and custom design elements to add warmth to all dining spaces throughout our restaurants.
Regardless of the experience customers are looking for, our restaurant design offers a variety of dining experiences to fit every mood and occasion. Our indoor/outdoor patio with a full service bar incorporates a high-energy, socially interactive atmosphere for customers to enjoy appetizers or sushi while they wait to dine with us, and serves as a destination for many of our frequent customers during the late afternoon and late night periods. Our restaurant in Fort Worth, Texas features a rooftop patio with a retractable roof. We also have enclosed patios in colder climates to maximize utilization of the patio throughout the year. Alternatively, our dining room provides a warm and intimate ambience for special occasions or dinner with friends and family. For sushi enthusiasts, we showcase our highly trained sushi chefs creating their masterpieces at our expansive sushi bar.
Food Preparation, Quality Control, and Purchasing
We believe that we have some of the highest food quality standards in the industry. Our standards are designed to protect food products throughout the preparation process. We provide detailed specifications to suppliers for food ingredients, products, and supplies. We strive to maintain quality and consistency in our restaurants through careful hiring, training and supervision of personnel. Our restaurant general managers and executive chefs generally receive nine weeks of training while our other restaurant managers and sous chefs receive seven weeks of training. We require annual recertification training for all employees, and each employee receives an operations manual relating to food and beverage preparation and restaurant operations. We also instruct kitchen managers and staff on safety, sanitation, housekeeping, repair and maintenance, product and service specifications, ordering and receiving products, and quality assurance. All of our restaurant managers are compliant with Hazard Analysis and Critical Control Point, or HACCP. We monitor minimum cook temperature requirements and conduct twice-a-day kitchen and food quality inspections to further assure the safety and quality of all of the items we use in our restaurants. We have a ServSafe alcohol certification program, where every front of house employee is trained and tested to ensure we are providing responsible alcohol service. Additionally, we engage a third party service provider to perform quarterly inspections at all of our restaurants to monitor and ensure compliance with required guidelines.
We are committed to purchasing high-quality ingredients for our restaurants at reasonable prices. We use only the freshest ingredients and, as a result, we maintain only modest inventories. We have arrangements with local produce distributors and specialty food suppliers who provide high-quality ingredients and perishable food products. We believe that competitively priced alternative distribution sources are available should those channels be necessary. We source all of our products and supplies with reputable and high-quality providers that are capable of providing consistent, reliable distribution to all of our restaurants.
Our goal is to maximize purchasing efficiencies and obtain the lowest possible prices for ingredients, products, and supplies, while maintaining the highest quality. Our corporate office coordinates national supply contracts, negotiates prices for food supply throughout all of our restaurants, monitors quality control and consistency of the food supplied to restaurants, and oversees delivery of food on a nationwide basis. In order to provide the freshest ingredients and products, and to maximize operating efficiencies between purchase and usage, we utilize an automated food cost and inventory system to assist each restaurant’s management team in determining daily order requirements for food ingredients, products, and supplies. The management team orders accordingly from approved suppliers, and all deliveries are inspected to assure that the items received meet our quality specifications and negotiated prices.
Restaurant Operations
Executive and Restaurant Management
Our executive management team continually monitors restaurant operations to assure the quality of products and services and the maintenance of facilities. Restaurant management and our corporate office institute procedures to enhance efficiency, reduce costs and provide centralized and individual restaurant support systems. Our corporate operations team and district managers have primary responsibility for oversight of our restaurants and participate in analyzing restaurant-level performance and strategic planning. We currently employ five district managers who are each responsible for overseeing the restaurants in a specific region. The district managers’ responsibilities include supporting the general managers and helping each general manager achieve the sales and cash flow targets for their restaurant as well as providing insight for decision making in such areas as food and beverage, people development, and systems to enhance the efficiency of operations and the dining experience for our customers. In addition, our corporate food and beverage team includes a vice president, a corporate chef, a corporate sushi chef, three regional culinary partners and an operations support manager who are responsible for educating, coaching, and developing kitchen personnel, implementing systems to improve the efficiency of kitchen operations, and developing new menu offerings.
Our typical restaurant management team consists of a general manager, assistant general manager, two front-of-the-house managers, executive chef, sous chef, and head sushi chef. Our restaurants employ on average approximately 75 non-management employees, many of whom work part-time. The general manager is responsible for the day-to-day operations of the restaurant, including the hiring, training, personnel development, execution of local marketing programs, and operating results. The chefs are responsible for overseeing the preparation of menu and sushi items, maintaining product quality, and closely monitoring food costs and department labor costs. We also employ a kitchen staff member who is dedicated to the preparation of our signature sauces and dressings.
Training
In order to maintain quality and consistency in each of our restaurants, we carefully train and supervise restaurant personnel and adhere to high standards related to personnel performance, food and beverage preparation, and maintenance of our restaurants. All of our restaurant personnel participate in both initial and ongoing training programs under the direction of our director of training. Each restaurant manager completes a formal training program that is comprised of a mix of classroom and on-the-job instruction. Programs for general managers and executive chefs provide nine weeks of training. Programs for other managers provide seven weeks of training and may involve work in our other restaurants and cross training of various duties. The training covers all aspects of management philosophy and overall restaurant operations, including supervisory skills, operating and performance standards, accounting procedures, IT systems and employee selection and training necessary for top-quality restaurant operations. The training programs also involve intensive understanding and testing of our menu, learning the ingredients of various menu items, and other key service protocols. In addition, our hourly staff goes through a series of in-depth interactive training for their positions.
We implement these programs by hiring dedicated corporate personnel as well as designating high-performing existing restaurant personnel to assist in training. Our training personnel are involved in training for both new employees hired in anticipation of new restaurant openings as well as for ongoing training in existing restaurants. When we open a new restaurant, we provide training to restaurant personnel in every position for several weeks prior to and after the opening to assure the smooth and efficient operation of the restaurant from the first day it opens to the public.
Recruitment and Retention
Our future growth and success is highly dependent upon our ability to attract, develop, and retain qualified individuals who are capable of successfully managing our high-volume, upscale casual restaurants. We believe that our unit volume, the image and atmosphere of the Kona Grill concept, and career advancement and employee benefit programs enable us to attract high quality management and restaurant personnel. We offer restaurant management personnel competitive wages and benefits, including medical insurance and participation in our 401(k) plan with a company match. We motivate and prepare our restaurant personnel by providing them with opportunities for increased responsibility and advancement through a formal management development program. Furthermore, the management team of each restaurant shares in a bonus tied to the sales and overall profitability of their restaurant. We believe that our compensation package for managers and restaurant employees is comparable to or better than those provided by other polished casual restaurants. We believe our compensation policies help us attract quality personnel.
Information Systems
We believe that our management information systems enable us to increase the speed and accuracy of order-taking and pricing, efficiently schedule labor to better serve customers, monitor labor costs, assist in product purchasing and menu mix management, promptly access financial and operating data, and improve the accuracy and efficiency of restaurant-level information and reporting.
We utilize an integrated information system to manage the flow of information within each of our restaurants and between each restaurant and our corporate office. This system includes a point-of-sale (POS) local area network that helps facilitate the operations of the restaurant by recording sales transactions and printing orders in the appropriate locations within the restaurant. Additionally, we utilize the POS system to authorize, batch, and transmit credit card transactions, record employee time clock information, and produce a variety of management reports. The POS is integrated with food cost and labor scheduling software as well as our financial reporting system and incorporates a redundancy and back-up emergency operating plan on a temporary basis if the system experiences downtime.
We transmit electronically select information that is captured from the POS system to our corporate office on a daily basis. This information flow enables senior management to monitor operating results with daily and weekly sales analysis, detailed labor and food cost information, and comparisons between actual and budgeted operating results. We anticipate continually updating both our restaurant information systems and corporate office information systems to enhance operations. We believe our information systems are secure and scalable as we continue to build our brand.
Advertising and Marketing
Our ongoing advertising and marketing strategy consists of loyalty programs, social media, grass-root local marketing, various public relations activities and word-of-mouth recommendations. We believe that these mediums are key components in driving customer trial and usage. We expect to continue to invest in marketing, branding and advertising efforts, primarily to introduce our concept in new markets and to increase comparable restaurant sales and solidify brand awareness in existing markets.
We implement a coordinated public relations effort in conjunction with each new restaurant opening. Approximately 60 days before a scheduled restaurant opening, we collaborate with the local media to publicize our restaurant and generate awareness of our brand. This effort is usually supplemented by targeted marketing campaigns, social media and other marketing efforts, including hosting a high profile event in which we invite local leaders and community members as part of our preopening practice activities to introduce our concept to the local market. In addition, we use our website, www.konagrill.com, to continue promoting our brand awareness.
Competition
The restaurant industry is highly competitive. Key competitive factors in the industry include the taste, quality, and price of food products and drink offerings, quality and speed of customer service, brand name identification, attractiveness of facilities, restaurant location, and overall dining experience.
We believe we compete favorably with respect to each of these factors, as follows:
|
● |
We offer a diverse selection of flavorful American favorites with an international influence and award-winning sushi items; |
|
● |
We appeal to multiple demographic and psychographic profiles; |
|
● |
We strive to maintain quality and consistency in each of our restaurants through the careful training and supervision of restaurant personnel and adherence to high standards related to personnel performance, food and beverage preparation, and maintenance of our restaurants; |
|
● |
Our innovative menu with attractive price points, attentive service, and contemporary restaurant design with multiple environments blend together to create our polished casual dining experience and enables us to attract a broad customer demographic. |
Although we believe we compete favorably with respect to each of these factors, there are a substantial number of restaurant operations that compete directly and indirectly with us, many of which have significantly greater financial resources, higher revenue, and greater economies of scale. The restaurant business is often affected by changes in consumer tastes and discretionary spending patterns; national and regional employment statistics; demographic trends; weather conditions; the cost and availability of raw materials, labor, and energy; purchasing power; governmental regulations; and local competitive factors. Any change in these or other related factors could adversely affect our restaurant operations. Accordingly, we must constantly evolve and refine the critical elements of our restaurant concept over time to protect their longer-term competitiveness. Additionally, there is competition for highly qualified restaurant management employees and for attractive locations suitable for upscale, high volume restaurants.
Trademarks
We have registered the service marks “Kona Grill” and “Konavore” with the United States Patent and Trademark Office. We believe that our trademarks and other proprietary rights, such as our distinctive menu offerings and signature sauce recipes, have significant value and are important to the marketing of our concept. We have protected in the past and will continue to vigorously protect our proprietary rights. We cannot predict, however, whether steps taken by us to protect our proprietary rights will be adequate to prevent misappropriation of these rights or the use by others of restaurant features based upon, or otherwise similar to, our concept. It may be difficult for us to prevent others from copying elements of our concept and any litigation to enforce our rights will likely be costly. In addition, other local restaurant companies with names similar to ours may try to prevent us from using our marks in those locales.
Government Regulation
Each of our restaurants is subject to licensing and regulation by state and local departments and bureaus of alcohol control, health, sanitation, zoning, and fire and to periodic review by state and municipal authorities for areas in which the restaurants are located. In addition, we are subject to local land use, zoning, building, planning, and traffic ordinances and regulations in the selection and acquisition of suitable sites for developing new restaurants. Delays in obtaining, or denials of, or revocation or temporary suspension of, necessary licenses or approvals could have a material adverse impact on our restaurant development.
Alcoholic beverage control regulations require each of our restaurants to apply to a state authority and, in certain locations, county and municipal authorities for a license and permit to sell alcoholic beverages on the premises. Typically, licenses must be renewed annually and may be subject to penalties, temporary suspension or revocation for cause at any time. Alcoholic beverage control regulations impact many aspects of the daily operations of our restaurants, including the minimum age of patrons and employees, hours of operation, inventory control and handling, and storage and dispensing of alcoholic beverages. We have not encountered any material problems relating to alcoholic beverage licenses or permits to date. The failure of a restaurant to obtain or retain its liquor license would adversely affect that restaurant’s operations and profitability.
We are subject to “dram shop” statutes in most of the states in which we operate. Those statutes generally provide a person who has been injured by an intoxicated person the right to recover damages from an establishment that wrongfully served alcoholic beverages to such person. We carry liquor liability coverage as part of our existing comprehensive general liability insurance which we believe is consistent with coverage in the full-service restaurant industry. Even though we carry liquor liability insurance, a judgment against us under a “dram shop” statute in excess of our liability coverage could have a material adverse effect on our operations.
Our operations are also subject to federal and state laws governing such matters as wages, working conditions, citizenship requirements, and overtime. Several states have set minimum wage rates higher than the current federal level. A significant number of hourly personnel at our restaurants are paid at rates related to state and federal minimum wage laws and, accordingly, state minimum wage increases implemented during the last several years have increased our labor costs. Increases in the minimum wage rate or the cost of workers’ compensation insurance, changes in tip-credit provisions, employee benefit costs (including costs associated with mandated health insurance coverage), or other costs associated with employees could adversely affect our operating results. To our knowledge, we are in compliance in all material respects with applicable federal, state, and local laws affecting our business.
Employees
As of February 27, 2015, we employed 2,743 people of whom 2,692 worked in our restaurants and 51 were corporate management and staff personnel. None of our employees are covered by a collective bargaining agreement. We have never experienced a major work stoppage, strike, or labor dispute. We consider our relations with our employees to be favorable.
Access to Information
Our website is located at www.konagrill.com. The information on our website is not part of this filing. Through our website, we make available free of charge our annual report on Form 10-K, quarterly reports on Form 10-Q, current reports on Form 8-K, proxy statements, and any amendments to those reports filed or furnished to the Securities and Exchange Commission. These reports are available as soon as reasonably practicable after we electronically file these reports with the SEC. We also post on our website the charters of our Audit, Compensation, and Nominating Committees; Code of Business Conduct and Ethics and Code of Ethics for the CEO and Senior Financial Officers; and any other corporate governance materials required by SEC or NASDAQ regulations. These documents are also available in print to any stockholder requesting a copy from our corporate secretary at our executive offices.
|
Item 1A. |
Risk Factors |
Risks Related to Our Business
Our future operating results may fluctuate significantly due to our limited number of existing restaurants and the expenses required to open new restaurants.
We currently operate 30 restaurants, five of which opened during 2014, and we expect to open seven additional restaurants in 2015. The capital resources required to develop each new restaurant are significant. We estimate that the cost of opening a new Kona Grill restaurant currently ranges from $3.2 million to $3.7 million, exclusive of landlord tenant improvement allowances and approximately $425,000 in cash preopening expenses and assuming that we do not purchase the underlying real estate. Actual costs may vary significantly depending upon a variety of factors, including the site and size of the restaurant and conditions in the local real estate and employment markets. The combination of our relatively small number of existing restaurants, the significant investment associated with each new restaurant, and the average unit volumes of our new restaurants may cause our results of operations to fluctuate significantly, and poor operating results at any one restaurant or a delay or cancellation in the planned opening of a restaurant could materially affect the financial performance and perception of our company, making the investment risks related to any one location much larger than those associated with most other restaurant companies.
Our sales and ability to continue to be profitable could be adversely affected if comparable restaurant sales increases are less than we expect, and we may not successfully increase comparable restaurant sales or they may decrease.
While future sales growth will depend substantially on opening new restaurants, changes in comparable restaurant sales will also affect our sales growth and will continue to be a critical factor in generating future profits. This is because the profit margin on comparable restaurant sales is generally higher, as comparable restaurant sales increases enable fixed costs to be spread over a higher sales base. Conversely, declines in comparable restaurant sales can have a significant adverse effect on profitability due to the loss of the positive impact on profit margins associated with comparable restaurant sales increases.
Our comparable restaurant sales increased 3.8%, 1.4%, 2.7%, 8.8% and 0.9% during 2014, 2013, 2012, 2011 and 2010, respectively, but declined 9.3% and 7.2% during 2009 and 2008, respectively. As our units continue in operation, it may be more difficult to continue to achieve significant increases in comparable restaurant sales. Further, the impact of the factors noted below may lower our expectations for comparable restaurant sales.
|
• |
changes in consumer preferences and discretionary spending, including weaker consumer spending in periods of economic difficulty or uncertainty; |
|
• |
consumer understanding and acceptance of the Kona Grill experience and perception of the Kona Grill brand; |
|
• |
our ability to increase menu prices without adversely impacting customer traffic to such a degree that the impact of the decrease in customers equals or exceeds the benefit of the menu price increase; |
|
• |
any “trade down” by customers or other reduction in average check per person in response to price increases, which could reduce or eliminate the benefit of the price increase on comparable restaurant sales; | |
|
• |
competition, either from our competitors in the restaurant industry, or from our own restaurants within the same market in the event customers who frequent one of our restaurants begin to visit one of our new restaurants instead; | |
|
• |
executing our strategies effectively, including our development strategy, menu improvement initiatives and marketing and branding strategies, each of which may not have the impact we expect; |
|
• |
turnover of key operations and restaurant personnel; | |
|
• |
weather, road construction and other factors limiting access to our restaurants; and |
|
• |
changes in government regulation. |
A number of these factors are beyond our control. As a result, it is possible that we will not achieve our targeted comparable restaurant sales or that the change in comparable restaurant sales could be negative. If this were to happen, sales and profitability would be adversely affected and our stock price would likely decline. Further, many of our competitors have substantially greater financial, marketing and other resources than we do to withstand prolonged periods of declines in comparable restaurant sales and regional and national restaurant companies continue to expand their operations into our current and anticipated market areas, thereby increasing competition for market share.
We depend upon high levels of consumer traffic at the sites where our restaurants are located and any adverse change in consumer activity could negatively affect our restaurant sales and may require us to record an impairment charge for restaurants performing below expectations.
Our restaurants are primarily located in high-activity areas such as retail centers, shopping malls, and lifestyle centers. We depend on high consumer traffic rates at these centers to attract customers to our restaurants. In general, such visit frequencies are significantly affected by many factors, including national, regional, or local economic conditions, anchor tenants closing in retail centers or shopping malls in which we operate, changes in consumer preferences or shopping patterns, higher frequency of online shopping, changes in discretionary consumer spending, increasing gasoline prices, or otherwise. If visitor rates to these centers decline, our unit volumes could decline and adversely affect our results of operations, including recording an impairment charge for restaurants that are performing below expectations. We may be required to record impairment charges in the future if certain restaurants perform below expectations.
We have a limited number of restaurants upon which to evaluate our company, and you should not rely on our history as an indication of our future results.
We currently operate 30 restaurants, approximately 23% of which have been operating for less than18 months. Consequently, the results we have achieved to date with a relatively small number of restaurants may not be indicative of those restaurants’ long-term performance or the potential performance of new restaurants. A number of factors historically have affected and are likely to continue to affect our average unit volumes and comparable restaurant sales, including the following:
|
|
● |
our ability to execute effectively our business strategy; |
|
|
● |
our ability to successfully select and secure sites for our concept; |
|
|
● |
the operating performance of new and existing restaurants; |
|
|
● |
competition in our markets; |
|
|
● |
hiring, training, development and retention of key operations or restaurant personnel; |
|
|
● |
consumer trends; and |
|
|
● |
changes in political or economic conditions. |
Our average unit volume and same-store sales may not increase at the rate achieved over recent periods. In addition, we have closed three of our restaurants opened to date due to lower sales volume, including a restaurant in Naples, Florida in September 2008, a restaurant in West Palm Beach, Florida in July 2011, and a restaurant in Sugar Land, Texas in September 2011. Changes in our average unit volumes and comparable restaurant sales could cause the price of our common stock to fluctuate substantially.
Our future expansion in existing markets may cause sales in some of our existing restaurants to decline.
Our future growth strategy includes opening new restaurants in our existing markets. We may be unable to attract enough customers to our new restaurants for them to operate profitably. In addition, customers to our new restaurants may be former customers of one of our existing restaurants in that market, which may reduce customer visits and sales at those existing restaurants, adversely affecting our operating results.
Our ability to open new restaurants may be adversely affected by delays or problems associated with securing suitable restaurant locations and leases and by other factors, some of which are beyond our control and the timing of which is difficult to forecast accurately.
Due in part to the unique nature of each proposed restaurant location, we cannot predict the timing or ultimate success of our site selection process or our ability to open new restaurants on a timely basis after we have identified sites. We plan to grow organically through unit expansion, with a target of 20% unit growth annually over the next several years by strategically expanding the Kona Grill concept in both new and existing markets. We plan to open seven new restaurants in 2015 and currently have twelve signed leases for 2015 openings and beyond.
There can be no assurance that our unit growth goal will be realized because our ability to open new restaurants depends upon a number of factors, many of which are beyond our control, including the following:
|
● |
the availability and cost of suitable restaurant locations for development and our ability to compete successfully for those locations; |
|
● |
difficulty negotiating leases with acceptable terms; |
|
● |
cash flow generated by our existing restaurants; |
|
● |
delay or cancellation of new site development by developers and landlords, which may become increasingly common during periods of economic uncertainty or tight credit; |
|
● |
difficulty managing construction and development costs of new restaurants at affordable levels, particularly in competitive markets; |
|
● |
labor shortages or disputes experienced by our landlords or outside contractors; |
|
● |
unforeseen engineering or environmental problems with the leased premises; |
|
● |
our ability to secure governmental approvals and permits, including liquor licenses, construction permits, and occupancy permits; |
|
● |
the ability of our corporate staff to develop a greater number of new restaurants than our company has developed during the past several years while successfully managing existing restaurants; |
|
● |
obstacles to hiring and training qualified operating personnel in the local market; |
|
● |
inclement weather, natural disasters and other calamities; and |
|
● |
general economic conditions. |
A lack of availability of suitable locations for new restaurants or a decline in the quality of the locations of our current restaurants may adversely affect our sales and results of operations.
The success of our restaurants depends in large part on their location. As demographic and economic patterns change, current locations may not continue to be attractive or profitable. Possible declines in neighborhoods and trade areas where our restaurants are located or adverse economic conditions in areas surrounding those neighborhoods could result in reduced sales at those locations. In addition, desirable locations for new restaurant openings may not be available at an acceptable cost. The occurrence of one or more of these events could have a significant adverse effect on our sales and results of operations.
Any deterioration in general economic conditions could have a material adverse impact on our landlords or on businesses neighboring our locations, which could adversely affect our revenues and results of operations.
Any deterioration in general economic conditions could result in our landlords being unable to obtain financing or remain in good standing under their existing financing arrangements which could result in their failure to satisfy obligations to us under leases, including failures to fund or reimburse agreed-upon tenant improvement allowances. Any such failure could adversely impact our operations. Our restaurants are generally located in retail developments with nationally recognized co-tenants, which help increase overall customer traffic into those retail developments. Some of our co-tenants have or may cease operations in the future or have deferred openings or failed to open in a retail development after committing to do so. These failures may lead to reduced customer traffic and a general deterioration in the surrounding retail centers in which our restaurants are located and may contribute to lower customer traffic at our restaurants. If these retail developments experience high vacancy rates, we could experience decreases in customer traffic. As a result, our results of operations could be adversely affected. Furthermore, the credit and lending industry continue to be restrictive. Lenders are taking a more active role in reviewing tenant leases and prospective tenancies and have been more restrictive in approving tenancies and financing. This may affect our ability to lease sites at terms as favorable as we have received in the past.
In addition, if our landlords are unable to obtain sufficient credit to continue to properly manage their retail centers, we may experience a drop in the level of quality of such centers where we operate restaurants. Our future development of new restaurants may also be adversely affected by the negative financial situations of developers and potential landlords. Landlords may try to delay or cancel recent development projects (as well as renovations of existing projects), which could reduce the number of appropriate locations available that we would consider for our new restaurants. Furthermore, the failure of landlords to obtain licenses or permits for development projects on a timely basis, which is beyond our control, may negatively impact our ability to implement our development plan.
Unexpected expenses and low market acceptance of our restaurant concept could adversely affect the profitability of restaurants that we open in new markets.
As part of our expansion strategy, we have opened and plan to open restaurants in markets in which we have no prior operating experience and in which our brand may not be well-known. These new markets may have different competitive conditions, consumer tastes, and discretionary spending patterns than restaurants in our existing markets. As a result, we may incur costs related to the opening, operation, and promotion of these new restaurants that are greater than those incurred in markets with longer operating history. Accordingly, sales at restaurants opening in new markets may take longer to achieve or may not achieve average unit volumes comparable with our existing restaurants.
Our growth and our planned remodeling of our existing restaurants may strain our infrastructure and resources, which could slow our development of new restaurants and adversely affect our ability to manage our existing restaurants.
We plan to continue opening new restaurants and currently expect to open seven new restaurants during 2015. Further, we plan to maintain and enhance the quality of our customers’ dining experience through remodeling certain of our existing restaurants. Our continued expansion and planned remodeling will increase demands on our available cash resources, as well as demands on our management team, restaurant management systems and resources, financial controls and information systems. These increased demands may adversely affect our ability to open new restaurants and to manage and when appropriate, remodel our existing restaurants. If we fail to continue to improve our infrastructure or to manage other factors necessary for us to meet our expansion objectives, our growth rate and operating results could be adversely affected.
Any decision to either reduce or accelerate the pace of openings may positively or adversely affect our comparative financial performance.
Our preopening expenses continue to be significant, and the amount of such expenses incurred in any one year or quarter is dependent on the number of restaurants expected to be opened during that time period. As such, our decision to either decrease or increase the rate of openings may have a significant impact on our financial performance for a particular period. Therefore, if we decide to reduce our new restaurant openings, our comparable preopening expenses will be lower and the effect on our comparative financial performance should be favorable. Conversely, if the rate at which we develop and open new restaurants is increased to higher levels in the future, the resulting increase in preopening expenses will have an unfavorable short-term impact on our comparative financial performance.
We may require additional capital in the future as a result of changes in our restaurant operations or growth plans, and our inability to raise such capital could harm our operations and restrict our growth.
Changes in our restaurant operations, lower than anticipated restaurant sales, increased food or labor costs, increased property expenses, or other events, including those described in this report, may cause us to seek additional debt or equity financing on an accelerated basis. Financing may not be available to us on acceptable terms, and our failure to raise capital when needed could negatively impact our restaurant growth plans as well as our financial condition and results of operations. Additional equity financing, if available, may be dilutive to the holders of our common stock. Debt financing may involve significant cash payment obligations, covenants, and financial ratios that may restrict our ability to operate and grow our business, and would cause us to incur additional interest expense and financing costs.
Our new restaurants, once opened, may not be profitable, and may adversely impact the sales of our existing restaurants.
Historically, many of our new restaurants have opened with an initial ramp-up period typically lasting 18 months or more, during which they generated sales and income below the levels at which we expect them to operate. This is in part due to the time it takes to build a customer base in a new market or area, higher fixed costs relating to increased labor and other start-up inefficiencies that are typical of new restaurants. It may also be difficult for us to attract a customer base if we are not able to staff our restaurants with employees who perform to our high standards. If we are unable to build the customer base that we expect for new restaurant locations or overcome the higher fixed costs associated with new restaurant locations, new restaurants may not have similar results as our existing restaurants and may not be profitable.
We may not be successful in our international business development, or such expansion may adversely affect our financial performance.
We plan to explore future expansion into international markets, including Latin America and the Middle East. Similar to other brands with international expansion, we plan to utilize a franchise model for development outside the U.S., providing training and operational support to our partners without committing, or putting at risk, capital for restaurant construction in these international markets. Our international strategy is still in its early stages as it will take time for us to identify franchise partners and negotiate franchise agreements and for our partners to find quality real estate and construct the restaurants. We will then need to train the local team on our food and hospitality standards to ensure a successful execution of our strategy. We expect to make several investments in the coming year, including developing marketing materials, obtaining trademarks in the requisite markets and incurring incremental travel and networking expenses in order to build the right foundation for our growth.
As we are at the early stage of exploring our international market expansion, we may not be fully aware of the significant development efforts involved and barriers to entry into these markets. Accordingly, even though we are attempting to manage the necessary capital investment through the utilization of the franchise model, we may incur more expenses than originally anticipated and our investment may take additional time to come to fruition. Furthermore, there is a risk that we may not be successful in our international business development efforts. In that case, we may not be able to recover all of the investments incurred. Further, our attempt to expand internationally could result in significant distraction or diversion of resources from our domestic unit expansion and existing operations in the U.S.
There is no assurance that we will find the proper franchisees and other partners to successfully expand internationally, or that the franchised restaurants in foreign markets will gain market acceptance or be able to operate on a profitable basis. Our international operations are subject to many of the same risks associated with our domestic operations, as well as a number of additional risks. These include, among other things, international economic and political conditions, and differing cultures and consumer preferences.
Our international expansion and global brand development efforts could negatively affect our brand or could result in sanctions or liability for violations of regulations or legal actions.
Our business expansion into international markets could create new risks to our brand and reputation. We believe that we will be able to select high-caliber international operating partners with significant experience in restaurant operations; however, there is risk that our brand value could be harmed by factors outside of our control, including, but not limited to:
|
● |
difficulties in achieving the consistency of product quality and service as compared to restaurants we operate in the United States; |
|
● |
changes to our recipes required due to cultural differences; |
|
● |
inability to obtain adequate and reliable supplies of ingredients and products necessary to execute our diverse menu; and |
|
● |
differences, changes or uncertainties in economic, regulatory, legal, social and political conditions. |
Further, as we expand our brand internationally, we will need to comply with regulations and legal requirements, including those related to the protection of our trademarks, trade secrets and other intellectual property - see “Our failure to protect our trademarks, service marks, or trade secrets could negatively affect our competitive position and the value of the Kona Grill brand” below. We will have additional exposure to foreign tax laws and regulations which currently do not affect us. Additionally, we will need to comply with both domestic laws affecting United States businesses that operate internationally and foreign laws in the countries in which we expand our restaurants, such as the Foreign Corrupt Practices Act, under which we do not currently have exposure. Failure to comply with any such legal requirements could subject us to monetary liabilities and other sanctions. Also, we may become subject to lawsuits or other legal actions resulting from the acts or omissions of our operating partners and, even though we may have taken reasonable steps to protect against such liabilities, including by obtaining contractual indemnifications and insurance coverage, there is no assurance that we will not incur liability that is not covered by such protection, or incur costs and expenses as a result of our operating partners’ conduct even when we are not legally liable. Any of these risks could harm our business, results of operations and financial condition.
Failure to attract, retain and motivate effective leaders and the loss of key personnel could negatively impact our business.
Our future success is highly dependent upon our ability to attract and retain key management and operations personnel. We must be able to attract, retain and motivate a sufficient number of qualified management and operations personnel, including culinary and training personnel, district managers, general managers and executive chefs. Our executive officers provide a vision for our company, execute our business strategy, and maintain consistency in the operating standards of our restaurants. The ability of key management and operations personnel to maintain consistency in the quality and diversity of our menu offerings as well as service and hospitality for our customers is a critical factor in our future success. Any failure to attract, retain, and motivate key personnel may harm our reputation and result in a loss of business.
Our restaurants are subject to natural disasters and other events which are beyond our control and for which we may not be able to obtain insurance at reasonable rates.
We endeavor to insure our restaurants against wind, flood, and other disasters, but we may not be able to obtain insurance for these types of events for all of our restaurants at reasonable rates. A devastating natural disaster or other event in the vicinity of one of our restaurants could result in substantial losses and have a material adverse effect on our results of operations.
If our distributors or suppliers do not provide food and beverages to us in a timely fashion, we may experience short-term supply shortages and increased food and beverage costs.
We currently use a national food distribution service company and other regional distributors to provide food and beverage products to all of our restaurants. If our suppliers cease doing business with us, we could experience short-term supply shortages in some or all of our restaurants and could be required to purchase food and beverage products at higher prices until we are able to secure alternative supply sources. In addition, any delay in replacing suppliers or distributors on acceptable terms could, in extreme cases, require us to remove temporarily items from the menus of one or more of our restaurants, which also could adversely affect our business.
Adverse weather conditions and natural disasters could adversely affect our results of operations.
Adverse weather conditions can impact customer traffic at our restaurants, cause the temporary underutilization of outdoor patio seating and in more severe cases such as hurricanes, tornadoes and other natural disasters, cause temporary closures, sometimes for prolonged periods, which would negatively impact our restaurant sales. Changes in weather could result in interruptions to the availability of utilities, and shortages or interruption in the supply of food items and other supplies, which could increase our costs and negatively impact our operations.
Our failure to protect our trademarks, service marks, or trade secrets could negatively affect our competitive position and the value of the Kona Grill brand.
Our business prospects depend in part on our ability to develop favorable consumer recognition of the Kona Grill name. Although Kona Grill is a federally registered trademark, our trademarks and service marks could be imitated in ways that we cannot prevent. Alternatively, third parties may attempt to cause us to change our name or not operate in a certain geographic region if our name is confusingly similar to their name. In addition, we rely on trade secrets, proprietary know-how, concepts, and recipes. Our methods of protecting this information may not be adequate. Moreover, we may face claims of misappropriation or infringement of third parties’ rights that could interfere with our use of this information. Defending these claims may be costly and, if unsuccessful, may prevent us from continuing to use this proprietary information in the future, and may result in a judgment or monetary damages. Additionally, we do not maintain confidentiality and non-competition agreements with all of our executives, key personnel, or suppliers. If competitors independently develop or otherwise obtain access to our trade secrets, proprietary know-how, or recipes, the appeal of our restaurants could be reduced and our business could be harmed.
Furthermore, as our international business development is still at an early stage, we have not registered all of our trademarks and service marks throughout the world as doing so may not be feasible because of associated costs or various foreign trademark law prohibitions. Our inability to effectively protect our intellectual property domestically or internationally may result in limiting our ability to globally expand our brand thereby adversely affecting our financial performance.
Our business could be adversely impacted if our information technology and computer systems do not perform properly or if we fail to protect our customers’ or our employees’ information. Additionally, the inappropriate use of social media vehicles could harm our reputation and adversely impact our business.
We rely heavily on information technology to conduct our business, including point-of-sale processing in our restaurants, management of our supply chain, collection of cash, payment of obligations and various other processes and procedures. Our ability to efficiently manage our business depends significantly on the reliability and capacity of these systems. Any material failure, interruption of service, or compromised data security, problems with maintenance, upgrading or transitioning to replacement systems or a breach in security of these systems could cause delays in customer service and reduce efficiency in our operations and could otherwise adversely affect our operations. While we take data security very seriously and expend significant resources to ensure that our information technology operates securely and effectively, any security breaches could result in disruptions to operations or unauthorized disclosure of confidential information, and significant capital investments might be required to remediate such security breaches. Further, if customer or employee confidential data is compromised, our operations could be adversely affected, our reputation could be harmed, or we could be subject to litigation or the imposition of penalties resulting from violation of federal and state laws and payment card industry regulations. As privacy and information security laws and regulations change, we may incur additional costs to ensure that we remain in compliance.
Additionally, we rely on search engine marketing and social media platforms to attract and retain customers as part of our marketing efforts. A variety of risks are associated with the use of social media, including the improper disclosure of proprietary information, negative comments about our company, exposure of personally identifiable information, fraud, or outdated information. The inappropriate use of social media vehicles by our customers or employees could increase our costs, lead to litigation or result in negative publicity that could damage our reputation.
A data security breach involving a customer’s or employee’s personal data could have a material adverse effect on our business, could adversely affect our reputation and could result in litigation against us or the imposition of penalties, which could adversely affect our financial performance.
We receive and maintain certain personal information about our customers and employees. For example, we transmit confidential credit card information in connection with credit card transactions, and we are required to collect and maintain certain personal information in connection with our employment practices, including the administration of our benefit plans. The collection and use of this information by us is regulated at the federal and state levels, and the regulatory environment related to information security and privacy is increasingly demanding. If our security and information systems are compromised or our employees or authorized third parties fail to comply with these laws and regulations and this information is obtained by unauthorized persons or used inappropriately, it could adversely affect our reputation and could result in litigation against us or the imposition of penalties, which could have a material adverse effect on our financial performance.
In addition, our ability to accept credit cards as payment in our restaurants and for on-line gift card orders depends on us remaining compliant with standards set by the PCI Security Standards Council. These standards require certain levels of system security and procedures to protect our customers’ credit card and other personal information. We utilize both internal resources and external consultants to reduce the likelihood of any security failures or breaches. However, we can provide no assurance that these security measures will be successful. If these security measures are not successful, we may become subject to litigation against us or the imposition of regulatory penalties, which could result in negative publicity and significantly harm our reputation, any of which could have a material adverse effect on our financial performance.
Risks Related to the Restaurant Industry
Changes in food and supply costs could adversely affect our results of operations.
Our profitability depends in part on our ability to anticipate and react to changes in food and supply costs. Like all restaurant companies, we are susceptible to increases in food costs as a result of factors beyond our control, such as general economic conditions, seasonal fluctuations, weather conditions, demand, food safety concerns, product recalls and government regulations. Although we can purchase certain commodities under contract, we currently do not use financial management strategies or have long-term contracts in place for the majority of commodities to reduce our exposure to price fluctuations. Changes in the price or availability of seafood, poultry, beef, grains, dairy or produce could affect our ability to offer a broad menu and price offering to customers and could reduce our operating margins and adversely affect our results of operations. We may not be able to anticipate and react to changing food costs through our purchasing practices and menu price adjustments in the future, and failure to do so could negatively impact our sales and results of operations.
Changes in governmental regulation may adversely affect our ability to maintain our existing and future operations and to open new restaurants.
We are subject to the Fair Labor Standards Act (which governs such matters as minimum wages, overtime and other working conditions), along with the Americans with Disabilities Act, the Immigration Reform and Control Act of 1986, various family leave mandates and a variety of other laws enacted, or rules and regulations promulgated by federal, state and local governmental authorities that govern these and other employment matters, including tip credits, working conditions, safety standards and immigration status. We expect increases in payroll expenses as a result of federal and state mandated increases in the minimum wage, and although such increases are not expected to be material, we cannot assure you that there will not be material increases in the future. Enactment and enforcement of various federal, state and local laws, rules and regulations on immigration and labor organizations may adversely impact the availability and costs of labor for our restaurants in a particular area or across the United States. Other labor shortages or increased employee turnover could also increase labor costs. In addition, our vendors may be affected by higher minimum wage standards or availability of labor, which may increase the price of goods and services they supply to us.
We offer eligible full-time salaried employees and eligible variable-hour employees the opportunity to enroll in healthcare coverage subsidized by us. Our employees may or may not choose to participate in our healthcare plans. However, under the comprehensive U.S. health care reform law enacted in 2010, the Affordable Care Act, changes that became effective in 2014, and especially the employer mandate and employer penalties that became effective January 1, 2015, will increase our labor costs significantly. In 2015, we adopted a qualifying plan under the Affordable Care Act for our eligible variable-hour employees, which will increase our healthcare expenses. It is also possible that even in light of recent changes in the healthcare plans we offer, healthcare plans offered by other companies with which we compete for employees will make us less attractive to our current or potential employees. And in any event, implementing the requirements of the Affordable Care Act has imposed additional administrative costs on us, and those costs may increase over time. The costs and other effects of these new healthcare requirements cannot be determined with certainty, but they may have a material adverse effect on our financial and operating results.
We are also subject to laws and regulations, which vary from jurisdiction to jurisdiction, relating to nutritional content and menu labeling. Compliance with these laws and regulations may lead to increased costs and operational complexity, changes in sales mix and profitability, and increased exposure to governmental investigations or litigation. We cannot reliably anticipate any changes in customer behavior if we alter our recipes to comply with such laws and regulations. This could have adverse effects on our sales or results of operations.
Furthermore, we are subject to federal and state environmental regulations, and although these have not had a material negative effect on our operations, we cannot ensure that there will not be a material negative effect in the future. In particular, the U.S. has increased focus on environmental matters such as climate change, greenhouse gases and water conservation. This increased focus may lead to new initiatives directed at regulating an as yet unspecified array of environmental matters. These efforts could result in increased taxation or in future restrictions on or increases in costs associated with food and other restaurant supplies, transportation costs and utility costs, any of which could decrease our operating profits and/or necessitate future investments in our restaurant facilities and equipment to achieve compliance. Further, more stringent and varied requirements of local and state governmental bodies with respect to zoning, land use and environmental factors could delay, prevent or make cost prohibitive the continuing operations of an existing restaurant or the development of new restaurants in particular locations.
The impact of current laws and regulations, the effect of future changes in laws or regulations that impose additional requirements and the consequences of litigation relating to current or future laws and regulations, or our inability to respond effectively to significant regulatory or public policy issues, could increase our compliance and other costs of doing business and therefore have an adverse effect on our results of operations. Failure to comply with the laws and regulatory requirements of federal, state and local authorities could result in, among other things, revocation of required licenses, administrative enforcement actions, fines and civil and criminal liability. Compliance with these laws and regulations can be costly and can increase our exposure to litigation or governmental investigations or proceedings.
Regulations affecting the operation of our restaurants could increase operating costs, restrict our growth, or require us to suspend operations.
Each of our restaurants must obtain licenses from regulatory authorities allowing it to sell liquor, beer, and wine, and each restaurant must obtain a food service license from local health authorities. Each restaurant’s liquor license must be renewed annually and may be revoked or suspended at any time for cause, including violation by us or our employees of any laws and regulations relating to the minimum drinking age, over serving, advertising, wholesale purchasing, and inventory control. Each restaurant is also subject to local health inspections. Failure to pass one or multiple inspections may result in temporary or permanent suspension of operations and could significantly impact our reputation. In certain states, including states where we have existing restaurants or where we may open restaurants in the future, the number of liquor licenses available is limited and licenses are traded at market prices. Liquor, beer, and wine sales comprise a significant portion of our sales, representing 30% of our sales during 2014. Therefore, if we are unable to maintain our existing licenses, or if we choose to open a restaurant in those states, the cost of a new license could be significant. Obtaining and maintaining licenses is an important component of each of our restaurant’s operations, and the failure to obtain or maintain food and liquor licenses and other required licenses, permits, and approvals would adversely impact our restaurants and our growth strategy.
Negative publicity surrounding our restaurants or the consumption of beef, seafood, poultry, or produce generally, or shifts in consumer tastes, could negatively impact the popularity of our restaurants, our sales, and our results of operations.
The popularity of our restaurants in general, and our menu offerings in particular, are key factors to the success of our operations. Negative publicity resulting from poor food quality, illness, injury, or other health concerns, whether related to one of our restaurants or to the beef, seafood, poultry, or produce industries in general (such as negative publicity concerning salmonella, e-coli, Hepatitis A, mercury poisoning and other food-borne illnesses), or operating problems related to one or more of our restaurants, could make our brand and menu offerings less appealing to consumers. In addition, other shifts in consumer preferences away from the kinds of food we offer, whether because of dietary or other health concerns or otherwise, would make our restaurants less appealing and adversely affect our sales and results of operations. If our restaurants are unable to compete successfully with other restaurants in new and existing markets, our results of operations will be harmed and we may not achieve profitability.
Litigation concerning our food quality, employment practices, liquor liability, and other issues could result in significant expenses to us and could divert resources from our operations.
Like other restaurants, we may receive complaints or litigation from, and potential liability to, our customers involving food-borne illness or injury or other operational issues. We may also be subject to complaints or allegations from, and potential liability to, our former, existing, or prospective employees involving our restaurant employment practices and procedures. In addition, we are subject to state “dram shop” laws and regulations, which generally provide that a person injured by an intoxicated person may seek to recover damages from an establishment that wrongfully served alcoholic beverages to such person. Recent litigation against restaurant chains has resulted in significant judgments, including punitive damages, under “dram shop” statutes. While we carry liquor liability coverage as part of our existing comprehensive general liability insurance, we may still be subject to a judgment in excess of our insurance coverage and we may not be able to obtain or continue to maintain such insurance coverage at reasonable costs, if at all. Regardless of whether any claims against us are valid or whether we are liable, our sales may be adversely affected by publicity resulting from such claims. Such claims may also be expensive to defend and may divert time and money away from our operations and adversely affect our business.
Labor shortages or increases in labor costs could slow our growth or adversely affect our business.
Our success depends in part on our ability to attract, motivate, and retain a sufficient number of qualified employees, including restaurant managers and kitchen managers, necessary to continue our operations. This ability is especially critical to our company because of our relatively small number of existing restaurants. If we are unable to recruit and retain a sufficient number of qualified employees, our business and growth strategy could be adversely affected.
Competition for qualified restaurant employees in current or prospective markets could require us to pay higher wages and benefits, which could result in higher labor costs. In addition, we have a substantial number of hourly employees who are paid rates based upon the federal or state minimum wage and who rely on tips for a significant portion of their income. Government-mandated increases in minimum wages, overtime pay, health benefits, or increased tax reporting and tax payment requirements for employees who receive gratuities, or a reduction in the number of states that allow tips to be credited toward minimum wage requirements, could increase our labor costs. We may be unable to generate enough operating efficiencies or increase our prices proportionately in order to mitigate these increased costs on to our customers, in which case our operating margins would be adversely affected.
Risks Related to Ownership of Our Common Stock
The market price for our common stock may be volatile.
Many factors could cause the market price of our common stock to rise and fall, including the following:
|
● |
actual or anticipated fluctuations in our quarterly or annual financial results; |
|
● |
the financial guidance we may provide to the public, any changes in such guidance, or our failure to meet such guidance; |
|
● |
the failure of industry or securities analysts to maintain coverage of our company, changes in financial estimates by any industry or securities analysts that follow our company, or our failure to meet such estimates; |
|
● |
changes in the market valuations of other companies in the restaurant industry; |
|
● |
actual or anticipated variations in comparable restaurant sales or operating results; whether in our operations or those of our competitors; |
|
● |
changes in the consumer preferences or spending; |
|
● |
various market factors or perceived market factors, including rumors, whether or not correct, involving us, our customers, our strategic partners, or our competitors; |
|
● |
sales, or anticipated sales, of large blocks of our stock; |
|
● |
short selling of our common stock by investors; |
|
● |
additions or departures of key personnel; |
|
● |
regulatory or political developments; |
|
● |
litigation and governmental or regulatory investigations; |
|
● |
acquisitions or strategic alliances by us or by our competitors; and |
|
● |
general economic, political, and financial market conditions or events. |
Due to the volatility of our stock price, we also may become the target of securities litigation. Securities litigation could result in substantial costs and divert our management’s attention and resources from the business as well as depress the price of our common stock.
Our current principal stockholders own a large percentage of our voting stock, which allows them to control substantially all matters requiring stockholder approval.
Two of our independent directors and our chief executive officer together currently own approximately 23% of our outstanding common stock. As a result, these investors may have significant influence over a decision to enter into any corporate transaction and may have the ability to prevent any transaction that requires the approval of stockholders, regardless of whether or not our other stockholders believe that such transaction is in their own best interests. Such concentration of voting power could have the effect of delaying, deterring, or preventing a change of control or other business combination, which could in turn have an adverse effect on the market price of our common stock or prevent our stockholders from realizing a premium over the then-prevailing market price for their shares of common stock.
The large number of shares eligible for public sale could depress the market price of our common stock.
The market price for our common stock could decline as a result of sales of a large number of shares of our common stock in the market, and the perception that these sales could occur may depress the market price. As of December 31, 2014, we had outstanding 11,209,138 shares of common stock, all of which shares are either freely tradable or otherwise eligible for sale under Rule 144 under the Securities Act of 1933. In addition, we have 1,439,887 shares available for issuance under our stock award and employee stock purchase plans. We have filed registration statements under the securities laws to register the common stock to be issued under these plans. As a result, shares issued under these plans will be freely tradable without restriction unless acquired by affiliates of our company, who will be subject to the volume and other limitations of Rule 144.
We may not continue to buy back shares of common stock under our share repurchase program, which could have an adverse effect on the market price of our common stock.
In November 2011, our Board of Directors approved a stock repurchase and retirement program under which we were authorized to purchase up to $5.0 million of common stock. We completed the 2011 authorization in February 2012, purchasing and retiring 858,663 shares. In May 2012, our Board of Directors authorized another stock repurchase and retirement program of up to $5.0 million of our outstanding common stock. As of December 31, 2014, we have repurchased and retired $3.2 million or 387,109 shares under the 2012 authorization, with $203,000 or 24,098 shares during 2013. We did not repurchase and retire any common stock during 2014.
The authorization of the program does not have an expiration date and it does not require us to purchase a specific dollar amount of shares. This authorization may be modified, suspended or terminated at any time. The timing and number of shares purchased pursuant to the share purchase authorization are subject to a number of factors, including current market conditions, legal constraints and available cash. If we do not continue to repurchase shares of our common stock, this could have an adverse effect on the market price of our common stock.
Provisions in our certificate of incorporation, our bylaws, and Delaware law could make it more difficult for a third party to acquire us, discourage a takeover, and adversely affect existing stockholders.
Our certificate of incorporation, our bylaws, and the Delaware General Corporation Law contain provisions that may have the effect of making more difficult, delaying, or deterring attempts by others to obtain control of our company, even when these attempts may be viewed to be in the best interests of stockholders. These include provisions on our maintaining a classified Board of Directors and limiting the stockholders’ powers to remove directors or take action by written consent instead of at a stockholders’ meeting. Our certificate of incorporation also authorizes our Board of Directors, without stockholder approval, to issue one or more series of preferred stock, which could have voting and conversion rights that adversely affect or dilute the voting power of the holders of common stock. Delaware law also imposes conditions on the voting of “control shares” and on certain business combination transactions with “interested stockholders.” These provisions and others that could be adopted in the future could deter unsolicited takeovers or delay or prevent changes in our control or management, including transactions in which stockholders might otherwise receive a premium for their shares over then current market prices. These provisions may also limit the ability of stockholders to approve transactions that they may deem to be in their best interests.
Since we do not expect to pay any dividends for the foreseeable future, holders of our common stock may be forced to sell their stock in order to obtain a return on their investment.
We do not anticipate that we will pay any dividends to holders of our common stock in the foreseeable future. Instead, we plan to reinvest any earnings to finance our restaurant operations and growth plans, or for a stock repurchase program. Accordingly, stockholders must rely on sales of their common stock after price appreciation, which may never occur, as the only way to realize any return on their investment. As a result, investors seeking cash dividends should not purchase our common stock.
We are considered an accelerated filer as of the end of fiscal 2014, and we will no longer be able to report as a smaller reporting company in the near future, and as a result, we have to comply with increased disclosure and governance requirements.
Based on our public float (market value of securities held by non-affiliates) as of June 30, 2014, we are classified as an "accelerated filer" as of December 31, 2014. Further, starting with our reports covering 2015, we no longer qualify as a “smaller reporting company.” As a non-accelerated filer and a smaller reporting company, we have been able to take advantage of certain exemptions from various reporting and governance requirements that are applicable to other public companies, including not being required to comply with the auditor attestation requirements of Section 404 of the Sarbanes-Oxley Act.
As an accelerated filer and a company that will no longer considered a smaller reporting company, we are subject to higher professional expenses due to the auditor attestation requirements for SOX 404 compliance, which will adversely affect our net income. Further, we cannot predict if investors will find our common stock less attractive because we can no longer rely on these exemptions which may result in additional costs of compliance. If some investors find our common stock less attractive as a result, there may be a less active trading market for our common stock and our stock price may be more volatile. There are no assurances that investors will find our common stock more attractive, or that there will be a more active trading market for our common stock or that our stock price will be less volatile, when we are considered an accelerated filer.
If we are unable to maintain effective internal control over financial reporting in the future, the accuracy and timeliness of our financial reporting may be adversely affected.
Pursuant to Section 404 of the Sarbanes-Oxley Act, we are required to furnish a report by our management on our internal control over financial reporting. The report contains, among other matters, an assessment of the effectiveness of our internal control over financial reporting as of the end of our fiscal year, including a statement as to whether or not our internal control over financial reporting is effective. This assessment must include disclosure of any material weaknesses in our internal control over financial reporting identified by management.
While we have determined that our internal control over financial reporting was effective as of December 31, 2014, as indicated in our Management's Annual Report on Internal Control over Financial Reporting included in this Annual Report on Form 10-K, we must continue to monitor and assess our internal control over financial reporting. If our management identifies one or more material weaknesses in our internal control over financial reporting and such weakness remains uncorrected at fiscal year-end, we will be unable to assert such internal control is effective at fiscal year-end. If we are unable to assert that our internal control over financial reporting is effective at fiscal year-end (or if our independent registered public accounting firm is unable to express an opinion on the effectiveness of our internal controls or concludes that we have a material weakness in our internal controls), we could lose investor confidence in the accuracy and completeness of our financial reports, which could have a material adverse effect on our reputation and the price of our common stock.
|
Item 1B. |
Unresolved Staff Comments |
Not applicable.
|
Item 2. |
Properties |
We currently operate 30 restaurants in 19 states. Each of our restaurants and our corporate office are located in a leased facility. As of December 31, 2014, our restaurant leases had expiration dates ranging from 2016 to 2029, typically with options to renew for at least a five-year period. The following table sets forth our current restaurant locations and corporate office.
|
State |
City |
Location |
Year |
Square |
Number of | |||||
|
Arizona |
Scottsdale |
Scottsdale Fashion Square |
1998 |
5,964 |
274 | |||||
|
Arizona |
Chandler |
Chandler Fashion Center |
2001 |
7,389 |
320 | |||||
|
Missouri |
Kansas City |
Country Club Plaza |
2002 |
7,455 |
248 | |||||
|
Nevada |
Las Vegas |
Boca Park Fashion Village |
2003 |
7,390 |
286 | |||||
|
Colorado |
Denver |
Cherry Creek Mall |
2004 |
5,920 |
243 | |||||
|
Nebraska |
Omaha |
Village Pointe |
2004 |
7,800 |
339 | |||||
|
Indiana |
Carmel |
Clay Terrace |
2004 |
7,500 |
356 | |||||
|
Texas |
San Antonio |
The Shops at La Cantera |
2005 |
7,200 |
295 | |||||
|
Texas |
Dallas |
North Park Mall |
2006 |
6,890 |
296 | |||||
|
Illinois |
Lincolnshire |
Lincolnshire Commons |
2006 |
6,850 |
284 | |||||
|
Texas |
Houston |
Houston Galleria |
2006 |
7,555 |
310 | |||||
|
Illinois |
Oak Brook |
Oak Brook Promenade |
2006 |
6,998 |
291 | |||||
|
Texas |
Austin |
The Domain |
2007 |
7,000 |
298 | |||||
|
Michigan |
Troy |
Big Beaver Road |
2007 |
7,000 |
257 | |||||
|
Connecticut |
Stamford |
Stamford Town Center |
2007 |
8,197 |
309 | |||||
|
Louisiana |
Baton Rouge |
Perkins Rowe |
2007 |
7,200 |
260 | |||||
|
Arizona |
Gilbert |
San Tan Village |
2008 |
6,770 |
257 | |||||
|
Arizona |
Phoenix |
City North |
2008 |
7,510 |
370 | |||||
|
Virginia |
Richmond |
West Broad Village |
2009 |
7,000 |
282 | |||||
|
New Jersey |
Woodbridge |
Woodbridge Conference Center |
2009 |
7,000 |
281 | |||||
|
Minnesota |
Eden Prairie |
Windsor Plaza |
2009 |
7,000 |
310 | |||||
|
Florida |
Tampa |
MetWest International |
2009 |
7,500 |
338 | |||||
|
Maryland |
Baltimore |
Downtown Baltimore |
2010 |
6,972 |
280 | |||||
|
Idaho |
Boise |
The Village at Meridian |
2013 |
6,913 |
303 | |||||
|
Texas |
The Woodlands |
The Woodlands Town Center |
2013 |
8,494 |
269 | |||||
|
Texas |
Fort Worth |
West 7th |
2014 |
7,500 |
344 | |||||
|
Texas |
El Paso |
Fountains at Farah |
2014 |
6,996 |
286 | |||||
|
Florida |
Sarasota |
University Town Center |
2014 |
7,000 |
287 | |||||
|
Georgia |
Alpharetta |
Avalon |
2014 |
7,156 |
297 | |||||
|
Ohio |
Columbus |
Easton Town Center |
2014 |
5,079 |
242 | |||||
|
Arizona |
Scottsdale |
Corporate Office at Scottsdale Fashion Square |
2004 |
9,820 |
— |
____________________
|
(1) |
Number of seats includes dining room, patio seating, sushi bar, bar, and private dining room (where applicable). |
|
Item 3. |
Legal Proceedings |
See Note 12 of Notes to Consolidated Financial Statements in Part IV of this report for a summary of legal proceedings.
|
Item 4. |
Mine Safety Disclosures |
Not applicable.
PART II
|
Item 5. |
Market for Registrant’s Common Equity, Related Stockholder Matters and Issuer Purchases of Equity Securities |
Market Information
Our common stock has traded on the NASDAQ Global Market under the symbol KONA since our initial public offering on August 16, 2005. The following table sets forth high and low sale prices of our common stock for each calendar quarter indicated as reported on the NASDAQ Global Market.
|
High |
Low |
|||||||
|
2014 |
||||||||
|
First quarter |
$ | 22.00 | $ | 14.10 | ||||
|
Second quarter |
$ | 24.68 | $ | 17.80 | ||||
|
Third quarter |
$ | 20.59 | $ | 16.02 | ||||
|
Fourth quarter |
$ | 25.78 | $ | 17.50 | ||||
|
2013 |
||||||||
|
First quarter |
$ | 9.73 | $ | 8.15 | ||||
|
Second quarter |
$ | 11.76 | $ | 8.65 | ||||
|
Third quarter |
$ | 13.90 | $ | 10.87 | ||||
|
Fourth quarter |
$ | 18.69 | $ | 11.48 | ||||
On March 6, 2015, the closing sale price of our common stock was $26.11 per share. On March 6, 2015, there were 15 holders of record of our common stock.
Recent Sales of Unregistered Securities
None.
Dividend Policy
We have not paid any dividends to holders of our common stock since our initial public offering and do not anticipate that we will pay any dividends to holders of our common stock in the foreseeable future, but instead we currently plan to retain any earnings to finance our restaurant operations and the growth of our business. Payments of any cash dividends in the future, however, is within the discretion of our Board of Directors and will depend on our financial condition, results of operations, and capital and legal requirements as well as other factors deemed relevant by our Board of Directors.
Issuer Purchase of Equity Securities
None.
PRICE PERFORMANCE GRAPH
The following line graph compares cumulative total stockholder returns for the period from December 31, 2009 through December 31, 2014 for (1) our common stock; (2) the NASDAQ Composite (U.S.) Index; and (3) the peer group. The calculations of cumulative stockholder return for the NASDAQ Composite (U.S.) Index and the peer group include reinvestment of dividends, if any. Our peer group consists of BJ’s Restaurants, Inc.; Bravo Brio Restaurant Group, Inc.; Granite City Food & Brewery Ltd.; and The Cheesecake Factory Incorporated. Our peer group companies all compete in the polished casual segment of the restaurant industry.
The performance shown is not necessarily indicative of future performance. This graph is not “soliciting material,” is not deemed filed with the Securities and Exchange Commission and is not to be incorporated by reference in any of our filings under the Securities Act of 1933, as amended, or the Securities Exchange Act of 1934, as amended, whether made before or after the date hereof and irrespective of any general incorporation language in any such filing.
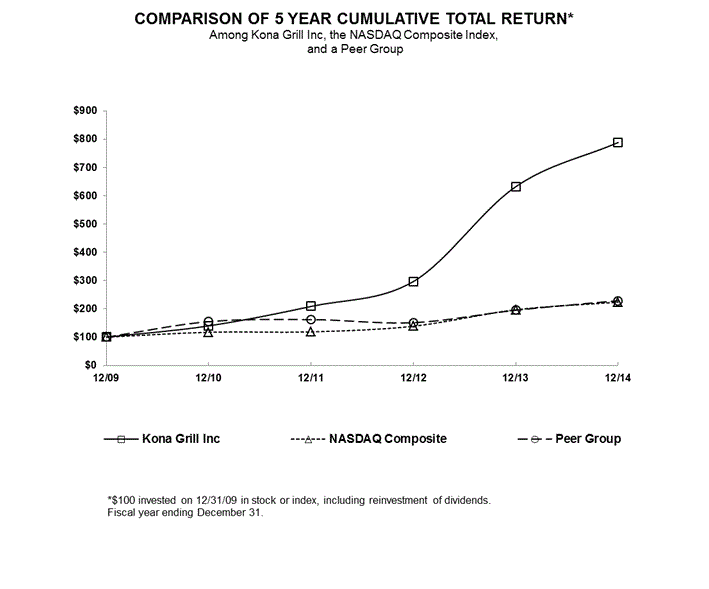
|
Item 6. |
Selected Financial Data |
The following selected consolidated financial data has been derived from audited financial statements and should be read in conjunction with the consolidated financial statements and notes thereto and Item 7, “Management’s Discussion and Analysis of Financial Condition and Results of Operations.”
|
Year Ended December 31, |
||||||||||||||||||||
|
2014 |
2013 |
2012 |
2011 |
2010 |
||||||||||||||||
|
(In thousands, except per share data) |
||||||||||||||||||||
|
Statement of Comprehensive Income (Loss) Data: |
||||||||||||||||||||
|
Restaurant sales |
$ | 119,097 | $ | 98,250 | $ | 96,021 | $ | 93,657 | $ | 82,735 | ||||||||||
|
Costs and expenses: |
||||||||||||||||||||
|
Cost of sales |
32,964 | 26,853 | 26,246 | 25,579 | 22,459 | |||||||||||||||
|
Labor |
40,336 | 33,166 | 31,968 | 30,896 | 28,640 | |||||||||||||||
|
Occupancy |
8,061 | 6,702 | 6,253 | 6,573 | 6,523 | |||||||||||||||
|
Restaurant operating expenses |
16,358 | 13,456 | 13,534 | 13,977 | 12,923 | |||||||||||||||
|
General and administrative |
10,715 | 7,854 | 7,037 | 8,395 | 7,072 | |||||||||||||||
|
Preopening expense |
2,481 | 1,162 | — | — | 567 | |||||||||||||||
|
Depreciation and amortization |
7,220 | 5,918 | 5,749 | 5,856 | 5,612 | |||||||||||||||
|
Insurance recoveries and other |
— | 32 | (120 | ) | — | — | ||||||||||||||
|
Total costs and expenses |
118,135 | 95,143 | 90,667 | 91,276 | 83,796 | |||||||||||||||
|
Income (loss) from operations |
962 | 3,107 | 5,354 | 2,381 | (1,061 | ) | ||||||||||||||
|
Write off of deferred financing costs and other |
39 | 66 | — | — | — | |||||||||||||||
|
Interest expense, net |
220 | 160 | 66 | 58 | 71 | |||||||||||||||
|
Income (loss) before income taxes |
703 | 2,881 | 5,288 | 2,323 | (1,132 | ) | ||||||||||||||
|
Provision for income taxes |
— | 169 | 36 | 9 | 10 | |||||||||||||||
|
Income (loss) from continuing operations |
703 | 2,712 | 5,252 | 2,314 | (1,142 | ) | ||||||||||||||
|
Loss from discontinued operations, net of taxes (1) |
— | — | 466 | 288 | 435 | |||||||||||||||
|
Net income (loss) |
$ | 703 | $ | 2,712 | $ | 4,786 | $ | 2,026 | $ | (1,577 | ) | |||||||||
| Net income (loss) per share — Basic: | ||||||||||||||||||||
| Continuing operations | $ | 0.07 | $ | 0.32 | $ | 0.60 | $ | 0.25 | $ | (0.12 | ) | |||||||||
| Discontinued operations | — | — | (0.05 | ) | (0.03 | ) | (0.05 | ) | ||||||||||||
| Net income (loss) | $ | 0.07 | $ | 0.32 | $ | 0.55 | $ | 0.22 | $ | (0.17 | ) | |||||||||
| Net income (loss) per share — Diluted: | ||||||||||||||||||||
| Continuing operations | $ | 0.07 | $ | 0.31 | $ | 0.59 | $ | 0.24 | $ | (0.12 | ) | |||||||||
| Discontinued operations | — | — | (0.05 | ) | (0.03 | ) | (0.05 | ) | ||||||||||||
| Net income (loss) | $ | 0.07 | $ | 0.31 | $ | 0.54 | $ | 0.21 | $ | (0.17 | ) | |||||||||
| Weighted average shares outstanding: | ||||||||||||||||||||
| Basic | 9,870 | 8,573 | 8,726 | 9,242 | 9,167 | |||||||||||||||
| Diluted | 10,263 | 8,762 | 8,868 | 9,428 | 9,167 | |||||||||||||||
| Balance Sheet Data (at end of period): | ||||||||||||||||||||
| Cash and cash equivalents | $ | 36,578 | $ | 5,881 | $ | 7,989 | $ | 6,327 | $ | 2,555 | ||||||||||
| Investments | 178 | 177 | 177 | 176 | 174 | |||||||||||||||
| Working capital (deficit) | 27,018 | (6,476 | ) | 1,044 | (2,380 | ) | (4,878 | ) | ||||||||||||
| Total assets | 94,370 | 49,868 | 39,325 | 41,347 | 42,060 | |||||||||||||||
| Total debt | — | 3,500 | 370 | 132 | 636 | |||||||||||||||
| Total stockholders’ equity | 65,426 | 22,358 | 18,868 | 17,684 | 16,989 | |||||||||||||||
_________________________
|
(1) |
As a result of our decision to close two restaurants during 2011, the results of operations for these restaurants, including asset impairment, lease termination, and restaurant-level closing costs, are classified as discontinued operations for all periods presented. See Note 2 to the consolidated financial statements. |
|
Item 7. |
Management’s Discussion and Analysis of Financial Condition and Results of Operations |
The following discussion and analysis should be read in conjunction with our consolidated financial statements and related notes contained elsewhere in this report. This discussion contains forward-looking statements that involve risks, uncertainties, and assumptions. Our actual results may differ materially from those anticipated in these forward-looking statements as a result of a variety of factors, including those set forth under Item 1A, “Risk Factors” and elsewhere in this report.
Overview
We currently own and operate 30 restaurants located in 19 states. We offer freshly prepared food, attentive service, and a contemporary ambiance that create a satisfying yet affordable dining experience that we believe exceeds the experience at many traditional casual dining restaurants with which we compete. Our high-volume polished casual restaurants feature a diverse selection of flavorful American favorites with an international influence and award-winning sushi items. Our menu items are freshly prepared and incorporate over 40 signature sauces and dressings that we make from scratch at each restaurant location, creating broad-based appeal for the lifestyle and taste trends of a diverse group of customers. We believe that our diverse menu and generous portions, combined with an average check of approximately $25 per person, offer our customers an attractive price-value proposition.
We plan to grow organically through unit expansion, with a goal of 20% unit growth annually over the next several years. We achieved a unit growth rate of 20% for 2014, with five openings during the year, including the Fort Worth, Texas restaurant in the first quarter, the El Paso, Texas location in the second quarter and the Sarasota, Florida; Alpharetta, Georgia and Columbus, Ohio restaurants in the fourth quarter. We plan to open seven restaurants during 2015, which equates to 23% unit growth. We currently have twelve signed leases for new restaurant openings in 2015 and beyond and continue working diligently to build our pipeline for future growth.
In addition, we have started to explore expansion into international markets. Given the strength our concept has enjoyed thus far in the U.S. and the increased demand for polished casual dining concepts overseas, we believe there is a significant opportunity to expand our concept in Latin America, the Middle East and beyond. Similar to other brands with international expansion, we plan to utilize a franchise model for development outside the U.S. Under this model, we will provide training and operational support to our partners without committing or putting our capital at risk in these international markets. Our international strategy is still in its early stages as it will take time for us to identify franchise partners and negotiate franchise agreements and for our partners to find quality real estate and construct the restaurants. We will then need to train the local team on our food and hospitality standards to ensure a successful execution of our strategy. We expect to make several investments in the coming year, including developing marketing materials, obtaining trademarks in the requisite markets and incurring incremental travel and networking expenses in order to build the right foundation for our growth.
Our same-store sales increased 3.8% year over year, with 2.9% growth in customer traffic and 0.9% growth in check average. The 3.8% same-store sales growth in 2014 was in addition to a 1.4% increase in same-store sales in 2013. We have generated positive same-store sales in each of the last seven quarters and in 17 out of the last 18 quarters.
We continue to focus on growing sales while remaining disciplined with our costs. The average unit volume of our comparable base restaurants increased to $4.4 million, or 4.3% in 2014 compared to $4.3 million in 2013 despite continuing cautious consumer spending and a highly competitive industry landscape. Our income from operations was $1.0 million in 2014 compared to $3.1 million in 2013 and our net income was $0.7 million in 2014 compared to $2.7 million in 2013. In each case, as described in more detail under “Year Ended December 31, 2014 Compared to Year Ended December 31, 2013,” a significant part of the year over year change was driven by preopening expense related to our growth strategy, incremental operating costs for new restaurant locations, and higher general and administrative expenses in support of our accelerated unit growth and SOX 404 compliance.
Our restaurant operating profit, defined as restaurant sales minus cost of sales, labor, occupancy, and restaurant operating expenses, increased $3.3 million, or 18.3% to $21.4 million in the 2014 from $18.1 million in the prior year. Restaurant operating profit as a percentage of restaurant sales of 18.0% in 2014 included operating inefficiencies of five new restaurants that opened during 2014 compared to the 2013 restaurant operating profit as a percentage of restaurant sales of 18.4% which included operating inefficiencies of the two new locations opened in the fourth quarter of 2013. Our Adjusted EBITDA, defined as income from operations plus depreciation and amortization, preopening expense and stock-based compensation, grew 6.9% year over year to $11.5 million from $10.8 million in 2013. Adjusted EBITDA as a percentage of restaurant sales was 9.7% in 2014 compared to 11.0% in the prior year, reflecting our investment in human capital to accelerate our unit growth, start-up costs for international business development as well as increased audit and professional fees associated with SOX 404 compliance and tax planning strategies. See “Key Measures” and “Financial Performance Overview” below for further information on restaurant operating profit and Adjusted EBITDA, including a reconciliation to our income from operations.
Our cost of sales, labor, and other operating expenses for our restaurants open at least 12 months generally trend consistently with restaurant sales, and we analyze those costs as a percentage of restaurant sales. Our typical new restaurants experience gradually increasing unit volumes as customers discover our concept and we generate market awareness. We anticipate that our new restaurants will take approximately six to twelve months to achieve the majority of operating efficiencies as a result of challenges typically associated with opening and operating new restaurants, including lack of market recognition and the need to hire and sufficiently train employees, as well as other factors. We expect cost of sales and labor expenses as a percentage of restaurant sales to be higher when we open a new restaurant, but to decrease as a percentage of restaurant sales as the restaurant matures and as the restaurant management and employees become more efficient in operating that unit. Occupancy and a portion of restaurant operating expenses are fixed. As a result, the volume and timing of newly opened restaurants has had, and is expected to continue to have, an impact on cost of sales, labor, occupancy, and restaurant operating expenses measured as a percentage of restaurant sales.
Our general and administrative costs for 2014 have increased and are expected to further increase in 2015 as we make investments in development and operations personnel and infrastructure to accelerate new unit growth and incur start-up costs for our international business development. The increase in 2014 as compared to 2013 also reflected the higher stock-based compensation expense and higher professional fees associated with tax planning strategies and being required to comply with the auditor attestation requirements of Section 404 of the Sarbanes-Oxley Act resulting from our higher market capitalization. Over the longer term, we expect our general and administrative spending to generally decrease as a percentage of restaurant sales as we leverage these investments and realize the benefits of higher sales volumes.
We incurred preopening expense of $2.5 million, attributable to the aforementioned five openings in 2014 and in preparation for the planned openings in the first half of 2015. Although the actual preopening expenses for a particular location depend upon numerous factors, we expect cash preopening expenses of approximately $425,000 per location, and non-cash preopening rent expense ranging from $50,000 to $100,000 per location. Accordingly, we expect the opening of new units to place downward pressure on our profitability as significant preopening expenses are incurred while operating profit from the new restaurants will likely not be significant in the first few months of each new restaurant’s operation as a result of challenges typically associated with opening new restaurants. We expect to open seven new restaurants in 2015.
On June 25, 2014, we completed a public offering of 2.6 million shares of our common stock at an offering price of $18.50 per share. We sold an aggregate of 2.3 million shares, and the remaining 0.3 million shares were sold by certain selling stockholders. Net proceeds from this offering of $40.9 million have been and will be used for new unit expansion, capital expenditures and general corporate purposes.
On June 30, 2014, we paid off the $3.5 million outstanding borrowings under our credit facility with existing cash on hand. On November 7, 2014, we amended the credit facility and increased the line of credit from $20 million to $35 million. Our entire $35 million credit facility was available as of December 31, 2014.
Key Measures We Use to Evaluate Our Company
Key measures we use to evaluate and assess our business include the following:
Number of Restaurant Openings. Number of restaurant openings reflects the number of restaurants opened during a particular reporting period.
Same-Store Sales Percentage Change. Same-store sales percentage change reflects the periodic change in restaurant sales for the comparable restaurant base. In calculating the percentage change in same-store sales, we include a restaurant in the comparable restaurant base after it has been in operation for more than 18 months. We adjust the sales included in the same-store sales calculation for restaurant closures, primarily as a result of remodels, so that the periods will be comparable. Same-store sales growth can be generated by an increase in customer traffic counts or by increases in the per person average check amount. Menu price changes and the mix of menu items sold can affect the per person average check amount.
Average Weekly Sales. Average weekly sales represent the average of restaurant sales for the comparable or non-comparable restaurant base measured over the applicable operating weeks for the reported periods.
Average Unit Volume. Average unit volume represents the average restaurant sales for the comparable restaurant base.
Restaurant Operating Profit. Restaurant operating profit is defined as restaurant sales minus cost of sales, labor, occupancy, and restaurant operating expenses. Restaurant operating profit does not include general and administrative expenses, depreciation and amortization, or preopening expenses. We believe restaurant operating profit is an important component of financial results because it is a widely used metric within the restaurant industry to evaluate restaurant-level productivity, efficiency, and performance prior to application of corporate overhead. We use restaurant operating profit as a percentage of restaurant sales as a key metric to evaluate our restaurants’ financial performance compared with our competitors. This measure provides useful information regarding our financial condition and results of operations and allows investors to better determine future financial results driven by growth and to compare restaurant level profitability.
Adjusted EBITDA. Adjusted EBITDA is defined as income from operations plus depreciation and amortization, preopening expense and stock-based compensation. Adjusted EBITDA is presented because: (i) we believe it is a useful measure for investors to assess the operating performance of our business without the effect of non-cash items such as depreciation and amortization expenses and stock-based compensation as well as the costs of opening new restaurants; (ii) we believe that investors will find these measures useful in assessing our ability to service or incur indebtedness; and (iii) we use Adjusted EBITDA internally as a benchmark to evaluate our operating performance and compare our performance to that of our competitors.
Key Financial Definitions
Restaurant Sales. Restaurant sales include gross food and beverage sales, net of promotions and discounts.
Cost of Sales. Cost of sales consists of food and beverage costs and related delivery fees.
Labor. Labor includes all direct and indirect labor costs incurred in operations.
Occupancy. Occupancy includes all rent payments associated with the leasing of real estate, including base, percentage and straight-line rent, real estate taxes, and common area maintenance expense. We record tenant improvement allowances as a reduction of occupancy expense over the term of the lease.
Restaurant Operating Expenses. Restaurant operating expenses consist of all other restaurant-level operating costs, the major components of which are utilities, credit card fees, advertising, supplies, marketing, repair and maintenance, and other expenses. Other operating expenses contain both variable and fixed components.
General and Administrative. General and administrative includes all corporate and administrative functions that support operations and provide infrastructure to facilitate our future growth. Components of this category include management and staff salaries, bonuses, stock-based compensation and related employee benefits, travel, information systems, human resources, corporate rent, professional and consulting fees, and corporate insurance costs.
Preopening Expense. Preopening expense consists of costs incurred prior to opening a new restaurant and is comprised principally of manager salaries, payroll and related training costs for new employees, including food and beverage costs associated with practice and rehearsal of service activities, and rent expense incurred from the date we obtain possession of the property until opening. We expense restaurant preopening expenses as incurred. We expect preopening expenses to commence six to eight months prior to a restaurant opening. Although the actual preopening expenses for a particular location depend upon numerous factors, our historical cash preopening expenses average approximately $425,000 per location, and non-cash preopening rent expense typically ranges from $50,000 to $100,000 per location. Our preopening costs will fluctuate from period to period depending upon the number of restaurants opened, the timing of new restaurant openings, the location of the restaurants, and the complexity of the staff hiring and training process.
Depreciation and Amortization. Depreciation and amortization expense consists of the depreciation of property and equipment. Depreciation and amortization expense also includes gains or losses on the disposal of fixed assets, primarily associated with remodel activities.
Interest Expense, net. Interest expense consists of the cost of servicing our debt obligations, the amortization of debt issuance costs and commitment fees on the line of credit. Interest expense is offset by interest earned on cash and investment balances. We capitalize interest incurred on borrowings for restaurant construction.
Provision for Income Taxes. Provision for income taxes represents amounts due for federal and state income taxes.
Discontinued Operations. Discontinued operations include the historical operating results as well as lease termination and exit costs attributable to closed restaurants.
Financial Performance Overview
The following table sets forth certain information regarding our financial performance for 2014, 2013 and 2012. There were 23 restaurants in the comparable restaurant base as of December 31, 2014, 2013 and 2012. There were seven and two restaurants in the non-comparable base as of December 31, 2014 and 2013, respectively.
|
Year Ended December 31, |
||||||||||||
|
2014 |
2013 |
2012 |
||||||||||
|
Restaurant sales growth |
21.2 |
% |
2.3 |
% |
2.5 |
% | ||||||
|
Same-store sales percentage change (1) |
3.8 |
% |
1.4 |
% |
2.7 |
% | ||||||
|
Average weekly sales – comparable restaurant base |
$ | 85,000 | $ | 81,700 | $ | 80,300 | ||||||
|
Average weekly sales – non-comparable restaurant base |
$ | 85,700 | $ | 101,600 | $ | — | ||||||
|
Average unit volume (in thousands) (2) |
$ | 4,433 | $ | 4,250 | $ | 4,190 | ||||||
|
Restaurant operating profit (in thousands) (3) |
$ | 21,378 | $ | 18,073 | $ | 18,020 | ||||||
|
Restaurant operating profit as a percentage of sales (3) |
18.0 |
% |
18.4 |
% |
18.8 |
% | ||||||
|
Adjusted EBITDA (in thousands) (4) |
$ | 11,519 | $ | 10,771 | $ | 11,501 | ||||||
|
Adjusted EBITDA as a percentage of sales (4) |
9.7 |
% |
11.0 |
% |
12.0 |
% | ||||||
|
(1) |
Same-store sales percentage change reflects the periodic change in restaurant sales for the comparable restaurant base compared to the prior year. In calculating the percentage change for same-store sales, we include a restaurant in the comparable restaurant base the first full calendar quarter after it has been in operation for more than 18 months. We remove restaurants from the comparable base for periods in which they are closed, primarily related to remodel activities. |
|
(2) |
Includes only those restaurants in the comparable restaurant base. |
|
(3) |
Restaurant operating profit is not a financial measurement determined in accordance with U.S. generally accepted accounting principles (see reconciliation below) and should not be considered in isolation or as an alternative to income from operations. Restaurant operating profit may not be comparable to the same or similarly titled measures computed by other companies. We believe restaurant operating profit is an important component of financial results because it is a widely used metric within the restaurant industry to evaluate restaurant-level productivity, efficiency, and performance. We use restaurant operating profit as a percentage of restaurant sales as a key metric to evaluate our restaurants’ financial performance compared with our competitors. |
|
(4) |
Adjusted EBITDA is not a financial measure determined in accordance with U.S. generally accepted accounting principles (see reconciliation below) and should not be considered in isolation or as an alternative to income from operations. Adjusted EBITDA is defined as income from operations plus depreciation and amortization, preopening expense and stock-based compensation. Adjusted EBITDA is presented because: (i) we believe it is a useful measure for investors to assess the operating performance of our business without the effect of non-cash items such as depreciation and amortization expenses and stock-based compensation as well as the costs of opening new restaurants; (ii) we believe that investors will find these measures useful in assessing our ability to service or incur indebtedness; and (iii) we use Adjusted EBITDA internally as a benchmark to evaluate our operating performance and compare our performance to that of our competitors. |
The following tables set forth our reconciliation of Adjusted EBITDA and restaurant operating profit to our income from operations, the most comparable U.S. GAAP measure.
|
Year Ended December 31, |
||||||||||||
|
2014 |
2013 |
2012 |
||||||||||
|
(In thousands) |
||||||||||||
|
Income from operations |
$ | 962 | $ | 3,107 | $ | 5,354 | ||||||
|
Depreciation and amortization |
7,220 | 5,918 | 5,749 | |||||||||
|
Preopening expense |
2,481 | 1,162 | — | |||||||||
|
Stock-based compensation |
856 | 584 | 398 | |||||||||
|
Adjusted EBITDA |
11,519 | 10,771 | 11,501 | |||||||||
|
General and administrative |
10,715 | 7,854 | 7,037 | |||||||||
|
Stock-based compensation |
(856 | ) | (584 | ) | (398 | ) | ||||||
|
Insurance recoveries and other |
— | 32 | (120 | ) | ||||||||
|
Restaurant operating profit |
$ | 21,378 | $ | 18,073 | $ | 18,020 | ||||||
|
Percent of Restaurant Sales |
||||||||||||
|
Year Ended December 31, |
||||||||||||
|
2014 |
2013 |
2012 |
||||||||||
|
Income from operations |
0.8 | % | 3.2 | % | 5.6 | % | ||||||
|
Depreciation and amortization |
6.1 | 6.0 | 6.0 | |||||||||
|
Preopening expense |
2.1 | 1.2 | — | |||||||||
|
Stock-based compensation |
0.7 | 0.6 | 0.4 | |||||||||
|
Adjusted EBITDA |
9.7 | 11.0 | 12.0 | |||||||||
|
General and administrative |
9.0 | 8.0 | 7.3 | |||||||||
|
Stock-based compensation |
(0.7 | ) | (0.6 | ) | (0.4 | ) | ||||||
|
Insurance recoveries and other |
— | — | (0.1 | ) | ||||||||
|
Restaurant operating profit |
18.0 | % | 18.4 | % | 18.8 | % | ||||||
Certain percentage amounts may not sum to total due to rounding.
Store Growth Activity
|
2014 |
2013 |
2012 |
||||||||||
|
Beginning Restaurants |
25 | 23 | 23 | |||||||||
|
Openings |
5 | 2 | — | |||||||||
|
Total |
30 | 25 | 23 | |||||||||
Results of Operations
The following table sets forth, for the years indicated, our consolidated statements of comprehensive income expressed as a percentage of restaurant sales.
| Year Ended December 31, | ||||||||||||
| 2014 | 2013 | 2012 | ||||||||||
|
Restaurant sales |
100.0 | % | 100.0 | % | 100.0 | % | ||||||
|
Costs and expenses: |
||||||||||||
|
Cost of sales |
27.7 | 27.3 | 27.3 | |||||||||
|
Labor |
33.9 | 33.8 | 33.3 | |||||||||
|
Occupancy |
6.8 | 6.8 | 6.5 | |||||||||
|
Restaurant operating expenses |
13.7 | 13.7 | 14.1 | |||||||||
|
General and administrative |
9.0 | 8.0 | 7.3 | |||||||||
|
Preopening expense |
2.1 | 1.2 | — | |||||||||
|
Depreciation and amortization |
6.1 | 6.0 | 6.0 | |||||||||
|
Insurance recoveries and other |
— | 0.0 | (0.1 | ) | ||||||||
|
Total costs and expenses |
99.2 | 96.8 | 94.4 | |||||||||
|
Income from operations |
0.8 | 3.2 | 5.6 | |||||||||
|
Write off of deferred financing costs |
0.0 | 0.1 | — | |||||||||
|
Interest expense, net |
0.2 | 0.2 | 0.1 | |||||||||
|
Income before income taxes |
0.6 | 2.9 | 5.5 | |||||||||
|
Provision for income taxes |
— | 0.2 | 0.0 | |||||||||
|
Income from continuing operations |
0.6 | 2.8 | 5.5 | |||||||||
|
Loss from discontinued operations, net of tax |
— | — | 0.5 | |||||||||
|
Net income |
0.6 | % | 2.8 | % | 5.0 | % | ||||||
Certain percentage amounts may not sum to the total due to rounding.
Year Ended December 31, 2014 Compared with Year Ended December 31, 2013
Restaurant Sales. Restaurant sales increased $20.8 million or 21.2% in 2014, $16.3 million of which related to contributions from our five new restaurants opened during 2014 and a full year of sales for two restaurants opened in the fourth quarter of 2013. Our same-store sales increased 3.8% year over year, with a 2.9% growth in customer traffic and a 0.9% growth in check average. The 3.8% same-store sales growth in 2014 compares to a 1.4% increase in same-store sales in 2013.
Cost of Sales. Cost of sales increased $6.1 million, or 22.8% to $33.0 million in 2014 compared to $26.9 million in the prior year. New locations opened since the fourth quarter of 2013 accounted for $4.8 million of the total increase. As a percentage of restaurant sales, cost of sales was 27.7% compared to 27.3% in 2013, reflecting primarily new unit inefficiencies and commodity pricing pressure particularly from beef and dairy.
Labor. Labor expense for our restaurants increased to $40.3 million, or 21.6%, from $33.2 million in 2013. Labor costs for new locations accounted for $6.2 million of the total $7.1 million increase. Labor expenses as a percentage of restaurant sales increased to 33.9% compared to 33.8% in the prior year as the labor leverage achieved by our comparable base units on higher sales volume partially mitigated inefficiencies associated with our non-comparable base units.
Occupancy. Occupancy expenses increased $1.4 million or 20.3% to $8.1 million in 2014 from $6.7 million in 2013. The higher occupancy expenses are primarily associated with base rent and common area maintenance charges associated with the new locations coupled with the lower benefit of tenant allowance amortization mainly at certain restaurant locations as lease options were exercised or certain lease provisions lapsed. Occupancy expenses as a percentage of restaurant sales were 6.8% in both 2014 and 2013.
Restaurant Operating Expenses. Restaurant operating expenses increased $2.9 million, or 21.6%, to $16.4 million in 2014 compared to $13.5 million in the prior year. Of the total increase, $2.1 million is attributable to the additional operating expenses associated with our non-comparable base restaurants. The year over year increase in absolute dollars was driven by higher utilities, credit card fees, paper and sanitation supplies, smallwares, linens, professional services, travel related training costs and repairs and maintenance expenses. The higher variable expenses were driven by year over year sales volume increase while the higher repairs and maintenance expenses reflected the additional maintenance efforts associated with the average age of certain of our locations. Restaurant operating expenses as a percentage of restaurant sales were 13.7% in both years.
General and Administrative. General and administrative expenses increased by $2.9 million, or 36.4% to $10.7 million from $7.9 million year over year. As a percentage of sales, general and administrative expenses increased 100 basis points to 9.0% in 2014 compared to 8.0% in the prior year. Increased costs associated with additional headcount investment to support our unit growth expansion and start-up efforts for our international franchising strategy, higher travel costs for increased real estate development activities, increased stock-based compensation expense due to our higher stock price as well as higher audit and professional fees primarily associated with SOX 404 compliance and tax planning strategies contributed to the year over year increase.
Preopening Expense. Preopening expense was $2.5 million in 2014 compared to $1.2 million in 2013. The year over year increase was primarily attributable to the El Paso location which opened in June of 2014, the opening of the Alpharetta, Sarasota and Columbus restaurants which opened in the fourth quarter of 2014 and expenses for restaurants scheduled to open in the first half of 2015. Preopening expense of $1.2 million in 2013 was attributable to the Boise, The Woodlands and Fort Worth locations. We opened the Boise and The Woodlands restaurants in October and December 2013, respectively, while the Fort Worth restaurant was opened in February 2014.
Depreciation and Amortization. Depreciation and amortization expense increased $1.3 million or 22.0% to $7.2 million in 2014 from $5.9 million in the prior year. Depreciation and amortization expense as a percentage of restaurant sales was 6.1% and 6.0% of restaurant sales in 2014 and 2013, respectively. The increase in absolute dollars was attributable to the seven new restaurants opened since the fourth quarter of 2013 and asset additions associated with two remodels in the fourth quarter of 2013 partially offsetting the impact of fully depreciated assets in 2014.
Write off of Deferred Financing Costs. In April 2013, we entered into a $20 million credit facility with KeyBank and Stearns Bank. We paid off the outstanding term loan balance with cash on hand and terminated the $6.5 million Stearns Bank credit facility. In conjunction with this transaction, we wrote off $66,000 in deferred loan fees related to the Stearns Bank agreement in the second quarter of 2013. In November 2014, we modified the credit facility with KeyBank, increasing the credit line from $20 million to $35 million and removing Stearns Bank as a participant in the agreement. As a result, we wrote off the remaining $39,000 Stearns Bank deferred loan fees in the fourth quarter of 2014.
Interest Expense, Net. Net interest expense is attributable to the amortization of deferred loan fees, the commitment fees associated with the KeyBank credit facility and interest incurred on borrowings under the credit facility partially offset by interest income earned from cash and investment balances. Interest expense increased slightly year over year driven by higher deferred loan fee amortization and higher commitment fees. We paid off all outstanding borrowings under the credit facility in June 2014.
Provision for Income Taxes. We recognized no income tax expense in 2014 based upon the net operating loss position resulting from our tax planning strategies conducted in 2014. We recognized income tax expense of $169,000 in 2013 as we generated taxable income in excess of our federal and state net operating loss carryforwards in the prior year.
Year Ended December 31, 2013 Compared with Year Ended December 31, 2012
Restaurant Sales. Restaurant sales increased by $2.3 million, or 2.3%, to $98.3 million in 2013 from $96.0 million in 2012, primarily attributable to a 1.4% increase in comparable restaurant sales and a $1.3 million contribution from new restaurants opened during 2013. These increases were partially offset by lost sales associated with remodels, which resulted in the closure of two restaurants for nine operating weeks. The increase in comparable restaurant sales wass driven by higher average check per person of 1.2%, largely resulting from a 3% menu price increase in March 2013. Customer traffic during the year also increased 0.2% compared to 2012.
Cost of Sales. Cost of sales increased $0.7 million, or 2.3%, to $26.9 million year over year from $26.2 million. Cost of sales as a percentage of restaurant sales remained flat at 27.3% as we were able to mitigate pricing pressure from produce, shrimp and beef costs and higher wine cost associated with promotional offerings during 2013 with the benefits of the 3% menu price increase at the end of March 2013, lower seafood cost from sourcing management and improved management of liquor costs year over year.
Labor. Labor expense for our restaurants increased $1.2 million, or 3.7%, to $33.2 million in 2013 compared to $32.0 million in 2012. The increase relates to higher wages on increased sales volume, and higher medical and workers compensation costs year over year. Labor expenses as a percentage of restaurant sales increased to 33.8% compared to 33.3% in 2012, reflecting in part higher than anticipated labor costs from the remodel closures, labor inefficiencies associated with the two new restaurant openings and higher benefit costs year over year.
Occupancy. Occupancy expenses increased $0.4 million, or 7.2% to $6.7 million in 2013 from $6.3 million in 2012. The increase is primarily associated with higher common area maintenance charges and the lower benefit of tenant allowance amortization at certain restaurant locations as lease options were exercised and the tenant allowance was amortized over a longer period. Occupancy expenses as a percentage of restaurant sales increased 0.3% to 6.8% in 2013 compared to 6.5% in 2012.
Restaurant Operating Expenses. Restaurant operating expenses decreased slightly year over year. Improved management of certain operating expenses including printing, aquarium maintenance, marketing, training and travel more than offset higher repair and maintenance, utilities, bank fees and paper supplies. Restaurant operating expenses as a percentage of restaurant sales decreased to 13.7% in 2013 compared to 14.1% in 2012.
General and Administrative. General and administrative expenses increased by $0.8 million, or 11.6% to $7.9 million from $7.0 million year over year. General and administrative expenses as a percentage of sales increased year over year to 8.0% from 7.3% in 2012. The year over year increase is attributable to higher salaries and benefits associated with increased staffing to support our growth strategy, higher travel costs associated with increased real estate development and lease-related activities, increased stock-based compensation expense partially resulting from higher stock prices, and the reversal of severance charges associated with a former executive officer in the 2012 period. The increase is partially offset by lower legal and professional fees in 2013 compared to 2012.
Preopening Expense. Preopening expense of $1.2 million in 2013 was attributable to the Boise, The Woodlands and Fort Worth locations. We opened the Boise and The Woodlands restaurants in October and December 2013, respectively, while the Fort Worth restaurant was opened in February 2014. We did not open any new restaurants in 2012.
Depreciation and Amortization. Depreciation and amortization expense increased $0.2 million or 2.9% to $5.9 million in 2013, primarily due to the write off of fixed assets associated with our remodels in 2013 and depreciation expense for the two new restaurants. Depreciation and amortization expense as a percentage of restaurant sales remained flat at 6.0% in both 2013 and 2012.
Insurance Recoveries and Other. Insurance recoveries and other in 2012 represent an insurance settlement for property and facility damage and for a business interruption claim, net of other non-recurring items incurred. We recognized a gain of $317,000 for business interruption and furniture replacement claims associated with a fire at our Troy, Michigan restaurant in 2012. We also recognized tax expense for sales tax audit matters in 2013 and 2012.
Write off of Deferred Financing Costs. In April 2013, we entered into a $20 million credit facility with KeyBank and Stearns Bank. We paid off the outstanding term loan balance with cash on hand and terminated the $6.5 million Stearns Bank credit facility. In conjunction with this transaction, we wrote off $66,000 in deferred loan fees related to the Stearns Bank agreement in the second quarter of 2013.
Interest Expense. Interest expense increased $0.1 million in 2013 as compared to 2012. The increase is attributable to the amortization of deferred loan fees, the commitment fees associated with the KeyBank credit facility and interest incurred on borrowings under the credit facility. Interest expense in 2012 primarily related to debt service costs for our term loan with Stearns Bank.
Discontinued Operations. Discontinued operations in 2012 represent lease termination and legal costs attributable to the Sugar Land restaurant which was closed in 2011. Our loss from discontinued operations of $466,000 was attributable to the settlement of all outstanding lease termination obligations for the Sugar Land location in the third quarter of 2012.
Provision for Income Taxes. We recorded a provision for income taxes of $169,000 and $36,000, respectively, during 2013 and 2012. The year over year increase in the provision wass attributable to higher federal and state taxes for the year as we generated taxable income in excess of our federal and state net operating loss carryforwards.
Potential Fluctuations in Quarterly Results and Seasonality
Our quarterly operating results may fluctuate significantly as a result of a variety of factors, including the following:
|
● |
timing of new restaurant openings and related expenses; |
|
● |
fluctuations in commodity and food protein prices; |
|
● |
preopening costs for our newly-opened restaurants and operating costs for those locations, which are often materially greater during the first several months of operation than thereafter; |
|
● |
timing of restaurant remodels and potential lost sales associated with remodel closures; |
|
● |
labor availability and costs for hourly and management personnel; |
|
● |
profitability of our restaurants, especially in new markets; |
|
● |
increases and decreases in comparable restaurant sales; |
|
● |
impairment of long-lived assets and any loss on restaurant closures; |
|
● |
changes in borrowings and interest rates; |
|
● |
general economic conditions; |
|
● |
weather conditions or natural disasters; |
|
● |
timing of certain holidays; |
|
● |
changes in government regulations; |
|
● |
settlements, damages and legal costs associated with litigation; |
|
● |
new or revised regulatory requirements and accounting pronouncements; and |
|
● |
changes in consumer preferences and competitive conditions. |
Quarterly Results of Operations
The following table presents unaudited consolidated statement of comprehensive income (loss) data for each of the eight quarters in the period ended December 31, 2014. We believe that all necessary adjustments have been included to present fairly the quarterly information when read in conjunction with our annual financial statements and related notes. Certain reclassifications of prior year’s financial statement amounts have been made to conform to the current year presentation. The operating results for any quarter are not necessarily indicative of the results for any subsequent quarter.
| Quarter Ended | ||||||||||||||||||||||||||||||||
| 2014 | 2013 | |||||||||||||||||||||||||||||||
| Mar 31 | Jun 30 | Sept 30 | Dec 31 | Mar 31 | Jun 30 | Sept 30 | Dec 31 | |||||||||||||||||||||||||
| (In thousands, except per share data) | ||||||||||||||||||||||||||||||||
|
Restaurant sales |
$ | 27,616 | $ | 29,886 | $ | 30,037 | $ | 31,558 | $ | 23,496 | $ | 25,796 | $ | 24,507 | $ | 24,451 | ||||||||||||||||
|
Costs and expenses: |
||||||||||||||||||||||||||||||||
|
Cost of sales |
7,510 | 8,210 | 8,385 | 8,859 | 6,453 | 6,968 | 6,755 | 6,677 | ||||||||||||||||||||||||
|
Labor |
9,426 | 9,900 | 10,128 | 10,882 | 7,866 | 8,408 | 8,277 | 8,615 | ||||||||||||||||||||||||
|
Occupancy |
1,843 | 2,001 | 2,063 | 2,154 | 1,615 | 1,697 | 1,691 | 1,699 | ||||||||||||||||||||||||
|
Restaurant operating expenses |
3,848 | 4,023 | 4,109 | 4,378 | 3,171 | 3,401 | 3,382 | 3,502 | ||||||||||||||||||||||||
|
General and administrative |
2,576 | 2,443 | 2,584 | 3,112 | 1,875 | 2,010 | 1,905 | 2,064 | ||||||||||||||||||||||||
|
Preopening |
390 | 509 | 534 | 1,048 | — | 41 | 356 | 765 | ||||||||||||||||||||||||
|
Depreciation and amortization |
1,687 | 1,717 | 1,850 | 1,966 | 1,429 | 1,412 | 1,395 | 1,682 | ||||||||||||||||||||||||
|
Insurance recoveries and other |
— | — | — | — | — | — | — | 32 | ||||||||||||||||||||||||
|
Total costs and expenses |
27,280 | 28,803 | 29,653 | 32,399 | 22,409 | 23,937 | 23,761 | 25,036 | ||||||||||||||||||||||||
|
Income (loss) from operations |
336 | 1,083 | 384 | (841 | ) | 1,087 | 1,859 | 746 | (585 | ) | ||||||||||||||||||||||
|
Write off of deferred financing costs and other |
— | — | — | 39 | — | 66 | — | — | ||||||||||||||||||||||||
|
Interest expense, net |
60 | 64 | 60 | 36 | 3 | 41 | 52 | 64 | ||||||||||||||||||||||||
|
Income (loss) before income taxes |
276 | 1,019 | 324 | (916 | ) | 1,084 | 1,752 | 694 | (649 | ) | ||||||||||||||||||||||
|
Provision (benefits) for income taxes |
25 | — | (25 | ) | — | 80 | 195 | 34 | (140 | ) | ||||||||||||||||||||||
|
Net income (loss) |
$ | 251 | $ | 1,019 | $ | 349 | $ | (916 | ) | $ | 1,004 | $ | 1,557 | $ | 660 | $ | (509 | ) | ||||||||||||||
| Net income (loss) per share: | ||||||||||||||||||||||||||||||||
|
Basic |
$ | 0.03 | $ | 0.12 | $ | 0.03 | $ | (0.08 | ) | $ | 0.12 | $ | 0.18 | $ | 0.08 | $ | (0.06 | ) | ||||||||||||||
|
Diluted |
$ | 0.03 | $ | 0.11 | $ | 0.03 | $ | (0.08 | ) | $ | 0.12 | $ | 0.18 | $ | 0.08 | $ | (0.06 | ) | ||||||||||||||
|
Weighted average shares outstanding: |
||||||||||||||||||||||||||||||||
|
Basic |
8,609 | 8,770 | 10,984 | 11,117 | 8,543 | 8,567 | 8,585 | 8,598 | ||||||||||||||||||||||||
|
Diluted |
8,882 | 9,081 | 11,273 | 11,117 | 8,643 | 8,692 | 8,778 | 8,598 | ||||||||||||||||||||||||
|
Comprehensive income (loss) |
$ | 251 | $ | 1,019 | $ | 349 | $ | (916 | ) | $ | 1,004 | $ | 1,557 | $ | 660 | $ | (509 | ) | ||||||||||||||
Liquidity and Capital Resources
Currently, our primary capital requirements are for new restaurant development and remodeling of existing restaurants. Similar to many restaurant companies, we utilize operating lease arrangements for all of our restaurant locations. We believe that our operating lease arrangements provide appropriate leverage for our capital structure in a financially efficient manner. We are typically required to expend cash for leasehold improvements, furniture, fixtures and equipment to construct and equip each restaurant. We also require capital resources to maintain our existing base of restaurants, including remodeling, and to further expand and strengthen the capabilities of our corporate and information technology infrastructures.
The following tables set forth, as of the dates and for the periods indicated, a summary of our key liquidity measurements (amounts in thousands):
|
December 31, |
||||||||
|
2014 |
2013 |
|||||||
|
Cash and short-term investments |
$ | 36,756 | $ | 6,058 | ||||
|
Net working capital (deficit) |
27,018 | (6,476 | ) | |||||
|
Year Ended December 31, |
||||||||
|
2014 |
2013 |
|||||||
|
Cash provided by operating activities |
$ | 14,744 | $ | 9,460 | ||||
|
Capital expenditures |
21,855 | 14,445 | ||||||
Future Capital Requirements
Our capital requirements, including development costs related to the opening of new restaurants, have historically been significant. Over the past year, we funded development of new restaurants and remodels primarily from cash flows from operations, borrowings under our credit agreement and funds raised in our public offering of stock. Our future cash requirements and the adequacy of available funds will depend on many factors, including the operating performance of our current restaurants, the pace of expansion and remodels, real estate markets, site locations, the nature of the arrangements negotiated with landlords and the capital market accessibility.
We plan to grow organically through unit expansion, with a goal of 20% unit growth annually over the next several years. We achieved a unit growth rate of 20% for 2014, with five openings during the year. We plan to open seven restaurants during 2015, which equates to 23% unit growth. We plan to remodel five restaurants during 2015 and incur maintenance capital expenditures for existing restaurants and our corporate office. We also are diligently working on our real estate pipeline and expect to incur capital expenditures during 2015 for restaurants scheduled to open during the first half of 2016. We expect to spend approximately $40 million in capital expenditures in 2015, exclusive of tenant improvement allowances, for the planned construction and remodel of these restaurants.
In addition, we have started to explore expansion into international markets. Similar to other brands with international expansion, we plan to utilize a franchise model for development outside the U.S. Under this model, we will provide training and operational support to our partners without committing, or putting at risk, capital for restaurant construction in these international markets. We expect to make several investments in the coming year, including developing marketing materials, obtaining trademarks in the requisite markets and incurring incremental travel and networking expenses in order to build the right foundation for our growth.
On June 25, 2014, we completed a public offering of 2.6 million shares of our common stock at an offering price of $18.50 per share. We sold an aggregate of 2.3 million shares, of which 0.3 million shares were sold pursuant to the underwriters’ exercise of their option to purchase additional shares. The remaining 0.3 million shares were sold by certain selling stockholders. The aggregate net proceeds received for the offering totaled $40.9 million, reflecting gross proceeds of $43.4 million, less underwriting discounts and expenses of $2.2 million and other offering costs of $0.3 million. Net proceeds from the offering are being used for new unit expansion, capital expenditures and general corporate purposes.
On June 30, 2014, we paid off the $3.5 million outstanding borrowings under our credit facility with existing cash on hand. On November 7, 2014, we amended the credit facility and increased the line of credit from $20 million to $35 million. Our entire $35 million credit facility was available as of December 31, 2014.
As of December 31, 2014, we had working capital of $27.0 million and no borrowings under the credit facility. We believe existing cash and short-term investments of $36.8 million, the ability to draw on our $35 million credit facility and cash flow from operations will be sufficient to fund property additions for new restaurants and planned remodels of existing restaurants over the next several years.
Any reduction of our cash flow from operations or an inability to draw on our credit facility may cause a delay or cancellation of future restaurant development or remodels of existing restaurants. Financing to construct new restaurants or remodels for amounts in excess of our current cash and short-term investments and the line of credit availability may not be available on acceptable terms, or at all, and our failure to raise capital when needed could impact our growth plans, financial condition, and results of operations. Additional equity financing may result in dilution to current stockholders and debt financing, if available, may involve significant cash payment obligations or financial covenants and ratios that may restrict our ability to operate our business.
Debt and Credit Agreements
On April 19, 2013, we entered into a Credit Agreement for a $20 million revolving line of credit maturing on April 19, 2017 with KeyBank National Association (“KeyBank”) and Stearns Bank National Association (“Stearns Bank”). On November 7, 2014, we entered into an Amended and Restated Credit Agreement (the “Amended Credit Agreement”) with KeyBank to (i) increase the credit facility from $20 million to $35 million, and (ii) extend the maturity date of the credit facility to November 7, 2019. The credit facility is secured by our personal property and assets. Certain of our wholly owned subsidiaries have also guaranteed the credit facility.
The interest rate under the Amended Credit Agreement is KeyBank’s prime rate or LIBOR, at our option, plus an applicable margin depending on our leverage ratio. The LIBOR margins range from 1.5% to 2.5% and the base rate margins range from 0.5% to 1.5%. Payments on the credit facility are interest only, payable quarterly with respect to each base rate loan and at varying times with respect to LIBOR rate loans, with outstanding principal and interest due at maturity. Prepayment is permitted at any time without penalty, subject to certain restrictions on the order of repayment or prepayment. We are obligated to pay a commitment fee at an annual rate of 0.175% to 0.350%, depending on our leverage ratio, times the unused total revolving commitment of the credit facility based on the average daily amount outstanding under the credit facility for the previous quarter. The commitment fee is payable quarterly in arrears.
During the fourth quarter of 2013, we borrowed $3.5 million against the credit facility at the one-month LIBOR rate of approximately 3.4%, including the LIBOR margin. We paid off all outstanding borrowings under the credit facility with existing cash on hand on June 30, 2014. The entire $35 million under the credit facility was available at December 31, 2014.
During 2014, 2013 and 2012, we incurred gross interest expense of $269,000, $171,000 and $67,000, consisting primarily of loan fee amortization of $104,000, $79,000 and $16,000 in 2014, 2013 and 2012, respectively, and commitment fees of $91,000 and $70,000 in 2014 and 2013, respectively. We also capitalized $29,000 and $7,000 of interest costs in 2014 and 2013, respectively.
Fees incurred to establish the credit facility totaled $198,000 and $356,000 in 2014 and 2013, respectively. Unamortized loan fees of $403,000 at December 31, 2014 are being amortized over the life of the credit facility and included in other assets in the consolidated balance sheet.
The credit facility also requires us to comply with certain covenants, including (a) a minimum fixed charge coverage ratio of less than 1.50 and (b) a maximum leverage ratio of 5.0 to 1.0 through March 31, 2016 and 4.75 to 1.0 from April 1, 2016 through the maturity date. As of December 31, 2013, there was a technical event of default related to a default judgment and accordingly, all borrowings under the credit facility were classified as a current liability at December 31, 2013. The default judgment was subsequently set aside on April 7, 2014. We were in compliance with all covenants at December 31, 2014.
Prior to closing on the credit facility, we had loan agreements with Stearns Bank for a $0.5 million term loan and a $6.5 million credit line. We did not have any borrowings under the Stearns Bank credit line prior to its termination in April 2013. We utilized existing cash to pay off the outstanding balance on the Stearns Bank term loan on April 19, 2013 and wrote off $66,000 in deferred loan fees related to the prior loan agreements during the second quarter of 2013. In conjunction with the modification of the credit facility in November 2014, we wrote off the remaining Stearns Bank deferred loan fees of $39,000 in the fourth quarter of 2014.
Stock Repurchase and Retirement Program
In November 2011, our Board of Directors approved a stock repurchase and retirement program under which we were authorized to purchase up to $5,000,000 of common stock. We completed the 2011 authorization in February 2012, purchasing and retiring 858,663 shares.
In May 2012, our Board of Directors authorized another stock repurchase and retirement program of up to $5,000,000 of our outstanding common stock. As of December 31, 2014, we have repurchased and retired $3.2 million or 387,109 shares under the 2012 authorization, with $203,000 or 24,098 shares during 2013. We did not repurchase and retire any shares during 2014.
The authorization of the program does not have an expiration date and it does not require us to purchase a specific dollar amount of shares. This authorization may be modified, suspended or terminated at any time. The timing and number of shares purchased pursuant to the share purchase authorization are subject to a number of factors, including current market conditions, legal constraints and available cash.
Cash Flows
The following table summarizes our primary sources and uses of cash during the past three years:
|
2014 |
2013 |
2012 |
||||||||||
|
(In thousands) |
||||||||||||
|
Net cash provided by (used in): |
||||||||||||
|
Operating activities |
$ | 14,744 | $ | 9,460 | $ | 7,352 | ||||||
|
Investing activities |
(21,858 |
) |
(14,536 |
) |
(1,776 |
) | ||||||
|
Financing activities |
37,811 | 2,968 | (3,914 |
) | ||||||||
|
Net increase (decrease) in cash and cash equivalents |
$ | 30,697 | $ | (2,108 |
) |
$ | 1,662 | |||||
Operating Activities. We generated $14.7 million, $9.5 million and $7.4 million of operating cash flows in 2014, 2013 and 2012, respectively. The increase in each comparative period was primarily due to the timing of payments for accounts payable and accrued expenses and an increase in deferred rent as a result of recording tenant improvement allowances for new restaurants, partially offset by lower net income.
Investing activities. We fund the development and construction of new restaurants and remodels primarily with cash flows from operations, borrowings under our credit facility and funds we raised in a 2014 public offering of our common stock. Capital expenditures in 2014 increased to $21.9 million, or over 50% from 2013, driven by the additions of leasehold improvements, equipment and furniture and fixtures for five restaurants opened during 2014, maintenance capital expenditures for existing restaurants as well as expenditures for restaurants scheduled to be opened in 2015. Capital expenditures in 2013 were $14.4 million consisting of architecture and design fees, general contractor costs, furniture and equipment purchases and other construction related costs associated with our Boise, The Woodlands and Fort Worth locations, the significant remodel of our Scottsdale and San Antonio restaurants as well as maintenance capital expenditures for existing restaurants.
Financing Activities. We generated $37.8 million of cash flows from financing activities in 2014, consisting mainly of $40.9 million of net proceeds from our offering of 2.345 million shares and $0.6 million from stock option exercises and employee stock purchases. The cash inflow partially offset a $3.5 million debt repayment on the KeyBank credit facility borrowings and $0.2 million in fees incurred for the KeyBank credit facility upsizing in November 2014. Net cash provided by financing activities was $3.0 million in 2013, primarily attributable to the $3.5 million borrowings from our KeyBank Credit Facility, $0.1 million in excess income tax benefits from stock option exercises and $0.3 million in proceeds from employee stock option exercises and employee stock plan purchases, partially offset by $0.4 million in payments on the Stearns Bank term loan, $0.4 million in fees for the KeyBank Credit Facility and $0.2 million for the purchase and retirement of our common stock under the May 2012 authorization.
Aggregate Contractual Obligations
The following table sets forth our contractual commitments as of December 31, 2014 (in thousands).
|
Payments Due by Period |
||||||||||||||||||||
|
Contractual Obligations |
Total |
Less than 1 year |
1-3 years |
3-5 years |
More than 5 years |
|||||||||||||||
|
Operating leases |
$ | 103,386 | $ | 9,512 | $ | 24,512 | $ | 21,359 | $ | 48,003 | ||||||||||
The table above reflects obligations for all leases signed for restaurants to be opened but does not include obligations related to lease renewal option periods even if it is reasonably assured that we will exercise the related option. We have evaluated and determined that we do not have any purchase obligations.
Off-Balance Sheet Arrangements
We had no off-balance sheet guarantees or off-balance sheet arrangements as of December 31, 2014.
Critical Accounting Policies
Critical accounting policies are those that we believe are most important to the portrayal of our financial condition and results of operations and also require our most difficult, subjective or complex judgments. Judgments or uncertainties regarding the application of these policies may result in materially different amounts being reported under various conditions or using different assumptions. We consider the following policies to be the most critical in understanding the judgment that is involved in preparing our consolidated financial statements.
Property and Equipment
We record property and equipment at cost less accumulated depreciation, and we select useful lives that reflect the estimated economic lives of the underlying assets. We amortize leasehold improvements over the shorter of the useful life of the asset or the related lease term. We calculate depreciation using the straight-line method for financial statement purposes. We capitalize improvements and expense repairs and maintenance costs as incurred. We are often required to exercise judgment in our decision whether to capitalize an asset or expense an expenditure that is for maintenance and repairs. The useful life of property and equipment and the determination as to what constitutes a capitalized cost versus a repair and maintenance expense involves judgment by management, which may produce different amounts of repair and maintenance or depreciation expense if different assumptions were used.
We evaluate property and equipment for impairment whenever events or changes in restaurant operating results indicate that the carrying value of those assets may not be recoverable. Factors considered include, but are not limited to, significant underperformance relative to expected historical or projected future operating results; significant negative industry or economic trends; and significant changes in laws and regulations, legal factors or in the business climate. The assessment of impairment is performed on a restaurant-by-restaurant basis. The recoverability is assessed by comparing the carrying value of the asset to the undiscounted cash flows expected to be generated by the asset. This assessment process requires the use of estimates and assumptions regarding future cash flows and estimated useful lives, which are subject to a significant degree of judgment. If indicators of impairment are present and if we determine that the carrying value of the asset exceeds the fair value of the restaurant assets, an impairment charge is recorded to reduce the carrying value of the asset to its fair value. Calculation of fair value requires significant estimates and judgments which could vary significantly based on our assumptions.
We continue to monitor the operating performance of each individual restaurant. We may be required to record impairment charges in the future if certain restaurants perform below expectations.
Leasing Activities
We lease all of our restaurant properties. At the inception of the lease, we evaluate each property and classify the lease as an operating or capital lease in accordance with applicable accounting standards. We exercise significant judgment in determining the estimated fair value of the restaurant as well as the discount rate used to discount the future minimum lease payments. The term used for this evaluation includes renewal option periods only in instances in which the exercise of the renewal option can reasonably be assured and failure to exercise such option would result in an economic penalty. All of our restaurant leases are classified as operating leases.
Our lease term used for straight-line rent expense is calculated from the date we take possession of the leased premises through the lease termination date. There is potential for variability in our “rent holiday” period which typically begins on the possession date and ends on the store open date. Factors that may affect the length of the rent holiday period generally include construction related delays. Extension of the rent holiday period due to delays in restaurant opening will result in greater rent expensed during the rent holiday period.
We record contingent rent expense based on a percentage of restaurant sales amounts that exceed a specified sales threshold, over the periods the liability is incurred. Contingent rent expense is recorded prior to achievement of specified sales levels if achievement of such amounts is considered probable and estimable.
Leasehold improvements financed by the landlord through tenant improvement allowances are capitalized as leasehold improvements with the tenant improvement allowances recorded as deferred lease incentives. Deferred lease incentives are amortized on a straight-line basis over the lesser of the life of the asset or the lease term, including option periods which in the judgment of management are reasonably assured of renewal (same term that is used for related leasehold improvements) and are recorded as a reduction of occupancy expense. As part of the initial lease terms, we negotiate with our landlords to secure these tenant improvement allowances. There is no guarantee that we will receive tenant improvement allowances for any of our future locations, which would result in additional occupancy expenses.
In an exposure draft issued in 2010, the FASB, together with the International Accounting Standards Board, has proposed a comprehensive set of changes in accounting for leases. While the Exposure Draft addresses new financial accounting rules for both, lessors and lessees, the primary focus will likely be on changes affecting lessees. The lease accounting model contemplated by the new standard is a “right of use” model that assumes that each lease creates an asset (the lessee’s right to use the leased asset) and a liability (the future rent payment obligations) which should be reflected on a lessee’s balance sheet to fairly represent the lease transaction and the lessee’s related financial obligations. All of our restaurant leases are accounted for as operating leases, with no related assets and liabilities on our balance sheet. However, changes in lease accounting rules or their interpretation, or changes in underlying assumptions, estimates or judgments by us could significantly change our reported or expected financial performance.
Income Taxes
We provide for income taxes based on our estimate of federal and state tax liabilities. These estimates consider, among other items, effective rates for state and local income taxes, allowable tax credits for items such as taxes paid on reported tip income, estimates related to depreciation and amortization expense allowable for tax purposes, and the tax deductibility of certain other items. Our estimates are based on information available to us at the time we prepare the income tax provision. Income tax returns are subject to audit by federal, state, and local governments, generally years after the returns are filed. These returns could be subject to material adjustments or differing interpretations of the tax laws.
Deferred income tax assets and liabilities are recognized for the expected future income tax consequences of carryforwards and temporary differences between the book and tax basis of assets and liabilities. Deferred tax assets and liabilities are measured using the income tax rate in effect during the year in which the differences are expected to reverse. The realization of tax benefits of deductible temporary differences and operating loss or tax credit carryforwards will depend on whether we have sufficient taxable income within the carryback and carryforward periods permitted by tax law to allow for utilization of the deductible amounts and carryforwards. We record net deferred tax assets to the extent we believe these assets will more likely than not be realized. In making this determination, we consider all available positive and negative evidence, including scheduled reversals of deferred tax liabilities, projected future taxable income, tax planning strategies and recent financial operations. In the event we determine that we would be able to realize our deferred income tax assets in the future in excess of their net recorded amount, we will make an adjustment to the valuation allowance which would reduce our provision for income taxes.
Stock-Based Compensation
We apply the Black-Scholes valuation model in determining the fair value of stock option awards, which requires the use of a number of highly complex and subjective variables. These variables include, but are not limited to the actual and projected employee and director stock option exercise behavior, expected volatility, risk-free interest rate, expected dividends, and expected term. Expected volatility is based on the historical volatility of our stock. We utilize historical data to estimate option exercise and employee termination behavior within the valuation model. The risk-free interest rate is based on the U.S. Treasury yield curve in effect at the time of grant for the expected term of the option. We also estimate forfeitures at the time of grant and revise these estimates, if necessary, in subsequent periods if actual forfeitures differ from those estimates. We estimate forfeitures based on our expectation of future experience while considering our historical experience. Changes in the subjective assumptions can materially affect the estimate of fair value of stock-based compensation and consequently, the related amount recognized in the consolidated statement of comprehensive income. We are also required to establish deferred tax assets for expense relating to options that would be expected to generate a tax deduction under their original terms. The recoverability of such assets are dependent upon the actual deduction that may be available at exercise and can further be impaired by either the expiration of the option or an overall valuation reserve on deferred tax assets.
We believe the estimates and assumptions related to these critical accounting policies are appropriate under the circumstances; however, should future events result in unanticipated consequences, there could be a material impact on our future financial condition or results of operations.
Recent Accounting Pronouncements
See Note 1 Recently Issued Accounting Standards to our consolidated financial statements.
|
Item 7A. |
Quantitative and Qualitative Disclosures About Market Risk |
The following discussion of market risks contains forward-looking statements. Actual results may differ materially from the following discussion based on general conditions in the commodity markets.
Primary Market Risk Exposures
Our primary market risk exposure is commodity costs. Many of the food products purchased by us can be subject to volatility due to changes in weather, production, availability, seasonality, international demand, and other factors outside our control. Substantially all of our food and supplies are available from several sources, which help to diversify our overall commodity cost risk. We also believe that we have the ability to increase certain menu prices in response to food commodity price increases.
We may also face market risk exposure due to the variable interest rates on the credit line obtained from KeyBank. Interest on the loans is subject to adjustment based on changes to the LIBOR rate. Interest rate fluctuations may adversely impact our financial condition or results of operations.
|
Item 8. |
Financial Statements and Supplementary Data |
Reference is made to the consolidated financial statements, the notes thereto, and the report thereon, commencing on page F-1 of this report, which financial statements, notes, and report are incorporated herein by reference.
|
Item 9. |
Changes in and Disagreements With Accountants on Accounting and Financial Disclosure |
Not applicable.
|
Item 9A. |
Controls and Procedures |
Evaluation of Disclosure Controls and Procedures
Disclosure controls and procedures (as defined in Exchange Act Rules 13a-15(e) and 15d-15(e)) are our controls and other procedures that are designed to ensure that information required to be disclosed by us in the reports that we file or submit under the Exchange Act is recorded, processed, summarized and reported within the time periods specified in the Securities and Exchange Commission’s rules and forms. Disclosure controls and procedures include, without limitation, controls and procedures designed to ensure that information required to be disclosed by us in the reports that we file or submit under the Exchange Act is accumulated and communicated to our management, including our Chief Executive Officer and Chief Financial Officer, as appropriate, to allow timely decisions regarding required disclosure. We have evaluated the effectiveness of the design and operation of our disclosure controls and procedures as of December 31, 2014. Based on that evaluation, the Chief Executive Officer and Chief Financial Officer concluded that our disclosure controls and procedures are effective.
Changes in Internal Control Over Financial Reporting
There has not been any change in our internal control over financial reporting during our fourth fiscal quarter that has materially affected, or is reasonably likely to materially affect, our internal control over financial reporting.
Management’s Report on Internal Control Over Financial Reporting
We are responsible for establishing and maintaining adequate internal control over financial reporting. As defined in the securities laws, internal control over financial reporting is a process designed by, or under the supervision of, our principal executive and principal financial officer and effected by our Board of Directors, management, and other personnel, to provide reasonable assurance regarding the reliability of financial reporting and the preparation of financial statements for external purposes in accordance with generally accepted accounting principles and includes those policies and procedures that (i) pertain to the maintenance of records that in reasonable detail accurately and fairly reflect the acquisitions and dispositions of our assets; (ii) provide reasonable assurance that transactions are recorded as necessary to permit preparation of financial statements in accordance with generally accepted accounting principles, and that our receipts and expenditures are being made only in accordance with authorizations of management and directors; and (iii) provide reasonable assurance regarding prevention or timely detection of unauthorized acquisition, use or disposition of our assets that could have a material effect on the financial statements.
Because of its inherent limitations, internal control over financial reporting may not prevent or detect misstatements. Also, projections of any evaluation of effectiveness to future periods are subject to the risk that controls may become inadequate because of changes in conditions, or that the degree of compliance with the policies or procedures may deteriorate.
Management assessed the effectiveness of our internal control over financial reporting as of December 31, 2014, based on the framework set forth by the Committee of Sponsoring Organizations of the Treadway Commission in Internal Control—Integrated Framework (the “2013 framework”). Based on that assessment, management concluded that, as of December 31, 2014, our internal control over financial reporting was effective based on the criteria established in the 2013 framework.
Our independent registered public accounting firm, Ernst & Young LLP, has issued an attestation report on the effectiveness of our internal control over financial reporting as of December 31, 2014. This report is included in the Annual Report on Form 10-K.
|
Item 9B. |
Other Information |
Not applicable.
PART III
|
Item 10. |
Directors, Executive Officers and Corporate Governance |
The information required by this Item relating to our directors, executive officers and corporate governance is incorporated herein by reference to the definitive Proxy Statement to be filed pursuant to Regulation 14A of the Exchange Act for our 2015 Annual Meeting of Stockholders.
|
Item 11. |
Executive Compensation |
The information required by this Item is incorporated herein by reference to the information contained in the definitive Proxy Statement to be filed pursuant to Regulation 14A of the Exchange Act for our 2015 Annual Meeting of Stockholders.
|
Item 12. |
Security Ownership of Certain Beneficial Owners and Management and Related Stockholder Matters |
The information required by this Item is incorporated herein by reference to the information contained in the definitive Proxy Statement to be filed pursuant to Regulation 14A of the Exchange Act for our 2015 Annual Meeting of Stockholders.
|
Item 13. |
Certain Relationships and Related Transactions, and Director Independence |
The information required by this Item is incorporated herein by reference to the information contained in the definitive Proxy Statement to be filed pursuant to Regulation 14A of the Exchange Act for our 2015 Annual Meeting of Stockholders.
|
Item 14. |
Principal Accountant Fees and Services |
The information required by this Item is incorporated herein by reference to the information contained in the definitive Proxy Statement to be filed pursuant to Regulation 14A of the Exchange Act for our 2015 Annual Meeting of Stockholders.
PART IV
|
Item 15. |
Exhibits and Financial Statement Schedules |
|
(a) |
The following documents are filed as a part of the report: |
(1) Financial Statements
Financial Statements are listed in the Index to Consolidated Financial Statements on page F-1 of this report.
(2) Financial Statement Schedules
No financial statement schedules are included because such schedules are not applicable, are not required, or because required information is included in the consolidated financial statements or notes thereto.
(3) Exhibits
|
Exhibit |
Exhibit | |
|
3.1 |
Amended and Restated Certificate of Incorporation of the Registrant (1) | |
|
3.3 |
Amended and Restated Bylaws of Kona Grill, Inc., as of October 30, 2007 (5) | |
|
3.4 |
Certificate of Designations, Preferences, and Rights of Series A Junior Participating Preferred Stock of Kona Grill, Inc. (6) | |
|
4.1 |
Form of Common Stock Certificate (2) | |
|
10.11* |
Kona Grill, Inc. 2005 Stock Award Plan (1) | |
|
10.12* |
Kona Grill, Inc. 2005 Employee Stock Purchase Plan (amended as of August 15, 2005) (3) | |
| 10.15* | Form of Stock Option Agreement (2005 Stock Award Plan) (4) | |
|
10.16* |
Kona Grill, Inc. 2012 Stock Award Plan (9) | |
|
10.30* |
Employment Agreement, dated as of February 5, 2015, between the Company and Berke Bakay (7) | |
|
10.35 |
Mediated Settlement Agreement by and between Sugar Land Mall, LLC f/k/a GGP-Sugar Land Mall, LP and KDGE Kona Grill, Inc., Kona Grill, Inc. and Kona Texas Restaurant, Inc. f/k/a Texas Kona Grill, Inc. dated September 14, 2012 (8) | |
|
10.36 |
Form of Stock Option Agreement (2012 Stock Award Plan)( 11) | |
|
10.37 |
Amended and Restated Credit Agreement by and among Kona Grill, Inc. as borrower, the Lending Institutions named therein (as Lenders) and KeyBank National Association (as the Administrative Agent) dated as of November 7, 2014 (12) | |
|
10.38 |
Subsidiary Guaranty made by the subsidiary guarantors listed therein and KeyBank National Association (as the Administrative Agent) dated as of April 19, 2013 (10) | |
|
10.39 |
Pledge and Security Agreement among Kona Grill, Inc., Kona Restaurant Holdings, Inc., Kona Sushi, Inc., Kona Macadamia, Inc., Kona Texas Restaurants, Inc. and KeyBank National Association (as the Administrative Agent) dated as of April 19, 2013 (10) | |
|
21 |
List of Subsidiaries | |
|
23 |
Consent of Independent Registered Public Accounting Firm | |
|
31.1 |
Certification of Chief Executive Officer pursuant to Rule 13a-14(a) and Rule 15d-14(a), promulgated under the Securities Exchange Act of 1934, as amended | |
|
31.2 |
Certification of Chief Financial Officer pursuant to Rule 13a-14(a) and Rule 15d-14(a), promulgated under the Securities Exchange Act of 1934, as amended | |
|
32.1 |
Certification pursuant to 18 U.S.C. Section 1350, as adopted pursuant to Section 906 of the Sarbanes-Oxley Act of 2002 | |
|
32.2 |
Certification pursuant to 18 U.S.C. Section 1350, as adopted pursuant to Section 906 of the Sarbanes-Oxley Act of 2002 | |
|
101 |
The following materials from Kona Grill Inc.’s Annual Report on Form 10-K for the years ended December 31, 2014, formatted in Extensive Business Reporting Language (XBRL), (i) Consolidated Balance Sheets, (ii) Consolidated Statements of Comprehensive Income, (iii) Consolidated Statements of Stockholders’ Equity, (iv) Consolidated Statements of Cash Flows, and (v) the Notes to the Consolidated Financial Statements | |
* Management contract or compensatory plan or arrangement in which directors or executive officers are eligible to participate.
|
(1) |
Incorporated by reference to Amendment No. 1 to the Registrant’s Registration Statement on Form S-1 (Registration No. 333-125506), as filed on July 8, 2005. |
|
(2) |
Incorporated by reference to Amendment No. 2 to the Registrant’s Registration Statement on Form S-1 (Registration No. 333-125506), as filed on July 21, 2005. |
|
(3) |
Incorporated by reference to the Registrant’s Registration Statement on Form S-8 (Registration No. 333-127593), as filed with the Commission on August 16, 2005. |
|
(4) |
Incorporated by reference to the Registrant’s Quarterly Report on Form 10-Q for the quarter ended March 31, 2006, as filed with the Commission on May 8, 2006. |
|
(5) |
Incorporated by reference to the Registrant’s Form 8-K filed on November 5, 2007. |
|
(6) |
Incorporated by reference to the Registrant’s Form 8-K filed on May 28, 2008. |
|
(7) |
Incorporated by reference to the Registrant’s Form 8-K filed on February 11, 2015. |
|
(8) |
Incorporated by reference to the Registrant’s Form 8-K filed on September 14, 2012. |
|
(9) |
Incorporated by reference to the Registrant’s Registration Statement on Form S-8 (Registration No. 333-187314), as filed with the Commission on March 15, 2013. |
|
(10) |
Incorporated by reference to the Registrant’s Form 8-K filed April 24, 2013. |
|
(11) |
Incorporated by reference to the Registrant’s Annual Report on Form 10-K for the year ended December 31, 2012, as filed with the Commission on March 15, 2013. |
|
(12) |
Incorporated by reference to the Registrant’s Form 8-K filed on November 12, 2014. |
Signatures
Pursuant to the requirements of Section 13 or 15(d) of the Securities Exchange Act of 1934, the registrant has duly caused this report to be signed on its behalf by the undersigned, thereunto duly authorized.
|
|
Kona Grill, Inc. |
| |
|
|
|
|
|
|
|
|
|
|
|
|
/s/ Berke Bakay |
| |
|
|
|
Berke Bakay |
|
|
|
|
President and Chief Executive Officer |
|
| Date: March 12, 2015 | |||
POWER OF ATTORNEY
Pursuant to the requirement of the Securities Exchange Act of 1934, this report has been signed below by the following persons on behalf of the registrant and in the capacities and on the dates indicated.
|
Signature |
Capacity |
Date |
|
/s/ Berke Bakay |
President, Chief Executive Officer and Director (Principal Executive Officer) |
March 12, 2015 |
| Berke Bakay | ||
|
|
||
|
/s/ Christi Hing |
Chief Financial Officer (Principal Financial and Accounting Officer) |
March 12, 2015 |
| Christi Hing | ||
|
/s/ Richard J. Hauser |
Director |
March 12, 2015 |
| Richard J. Hauser | ||
|
/s/ James R. Jundt |
Director |
March 12, 2015 |
| James R. Jundt | ||
|
/s/ Marcus E. Jundt |
Director |
March 12, 2015 |
| Marcus E. Jundt | ||
|
/s/ Leonard Newman |
Director |
March 12, 2015 |
|
Leonard Newman |
||
|
/s/ Steven W. Schussler |
Director |
March 12, 2015 |
| Steven W. Schussler | ||
|
/s/ Anthony L. Winczewski |
Director |
March 12, 2015 |
| Anthony L. Winczewski |
KONA GRILL, INC.
INDEX TO CONSOLIDATED FINANCIAL STATEMENTS
| Page | |
|
Reports of Independent Registered Public Accounting Firm |
F-2 |
|
Consolidated Balance Sheets |
F-4 |
|
Consolidated Statements of Comprehensive Income |
F-5 |
|
Consolidated Statements of Stockholders’ Equity |
F-6 |
|
Consolidated Statements of Cash Flows |
F-7 |
|
Notes to Consolidated Financial Statements |
F-8 |
REPORT OF INDEPENDENT REGISTERED PUBLIC ACCOUNTING FIRM
The Board of Directors and Stockholders of Kona Grill, Inc.
We have audited the accompanying consolidated balance sheets of Kona Grill, Inc. as of December 31, 2014 and 2013, and the related consolidated statements of comprehensive income, stockholders' equity and cash flows for each of the three years in the period ended December 31, 2014. These financial statements are the responsibility of Company’s management. Our responsibility is to express an opinion on these financial statements based on our audits.
We conducted our audits in accordance with the standards of the Public Company Accounting Oversight Board (United States). Those standards require that we plan and perform the audit to obtain reasonable assurance about whether the financial statements are free of material misstatement. An audit includes examining, on a test basis, evidence supporting the amounts and disclosures in the financial statements. An audit also includes assessing the accounting principles used and significant estimates made by management, as well as evaluating the overall financial statement presentation. We believe that our audits provide a reasonable basis for our opinion.
In our opinion, the financial statements referred to above present fairly, in all material respects, the consolidated financial position of Kona Grill, Inc. at December 31, 2014 and 2013, and the consolidated results of its operations and its cash flows for each of the three years in the period ended December 31, 2014, in conformity with U.S. generally accepted accounting principles.
We also have audited, in accordance with the standards of the Public Company Accounting Oversight Board (United States), Kona Grill, Inc.’s internal control over financial reporting as of December 31, 2014, based on criteria established in Internal Control-Integrated Framework issued by the Committee of Sponsoring Organizations of the Treadway Commission (2013 framework) and our report dated March 12, 2015 expressed an unqualified opinion thereon.
/s/ Ernst & Young LLP
Phoenix, Arizona
March 12, 2015
REPORT OF INDEPENDENT REGISTERED PUBLIC ACCOUNTING FIRM
The Board of Directors and Stockholders of Kona Grill, Inc.
We have audited Kona Grill, Inc.’s internal control over financial reporting as of December 31, 2014, based on criteria established in Internal Control-Integrated Framework issued by the Committee of Sponsoring Organizations of the Treadway Commission (2013 framework) (the COSO criteria). Kona Grill, Inc.’s management is responsible for maintaining effective internal control over financial reporting, and for its assessment of the effectiveness of internal control over financial reporting included in the accompanying Management’s Report on Internal Control over Financial Reporting. Our responsibility is to express an opinion on the company’s internal control over financial reporting based on our audit.
We conducted our audit in accordance with the standards of the Public Company Accounting Oversight Board (United States). Those standards require that we plan and perform the audit to obtain reasonable assurance about whether effective internal control over financial reporting was maintained in all material respects. Our audit included obtaining an understanding of internal control over financial reporting, assessing the risk that a material weakness exists, testing and evaluating the design and operating effectiveness of internal control based on the assessed risk, and performing such other procedures as we considered necessary in the circumstances. We believe that our audit provides a reasonable basis for our opinion.
A company’s internal control over financial reporting is a process designed to provide reasonable assurance regarding the reliability of financial reporting and the preparation of financial statements for external purposes in accordance with generally accepted accounting principles. A company’s internal control over financial reporting includes those policies and procedures that (1) pertain to the maintenance of records that, in reasonable detail, accurately and fairly reflect the transactions and dispositions of the assets of the company; (2) provide reasonable assurance that transactions are recorded as necessary to permit preparation of financial statements in accordance with generally accepted accounting principles, and that receipts and expenditures of the company are being made only in accordance with authorizations of management and directors of the company; and (3) provide reasonable assurance regarding prevention or timely detection of unauthorized acquisition, use, or disposition of the company’s assets that could have a material effect on the financial statements.
Because of its inherent limitations, internal control over financial reporting may not prevent or detect misstatements. Also, projections of any evaluation of effectiveness to future periods are subject to the risk that controls may become inadequate because of changes in conditions, or that the degree of compliance with the policies or procedures may deteriorate.
In our opinion, Kona Grill, Inc. maintained, in all material respects, effective internal control over financial reporting as of December 31, 2014, based on the COSO criteria.
We also have audited, in accordance with the standards of the Public Company Accounting Oversight Board (United States), the consolidated balance sheets of Kona Grill, Inc. as of December 31, 2014 and 2013, and the related consolidated statements of comprehensive income, stockholders’ equity, and cash flows for each of the three years in the period ended December 31, 2014 and our report dated March 12, 2015 expressed an unqualified opinion thereon.
/s/ Ernst & Young LLP
Phoenix, Arizona
March 12, 2015
KONA GRILL, INC.
CONSOLIDATED BALANCE SHEETS
(In thousands, except share data)
| December 31, | ||||||||
| 2014 | 2013 | |||||||
| ASSETS | ||||||||
|
Current assets: |
||||||||
|
Cash and cash equivalents |
$ | 36,578 | $ | 5,881 | ||||
|
Investments |
178 | 177 | ||||||
|
Receivables |
387 | 845 | ||||||
|
Other current assets |
2,122 | 1,499 | ||||||
|
Total current assets |
39,265 | 8,402 | ||||||
|
Other assets |
1,171 | 1,114 | ||||||
|
Property and equipment, net |
53,934 | 40,352 | ||||||
|
Total assets |
$ | 94,370 | $ | 49,868 | ||||
|
LIABILITIES AND STOCKHOLDERS’ EQUITY |
||||||||
|
Current liabilities: |
||||||||
|
Accounts payable |
$ | 3,205 | $ | 2,726 | ||||
|
Accrued expenses |
9,042 | 8,652 | ||||||
|
Current portion of debt obligations |
— | 3,500 | ||||||
|
Total current liabilities |
12,247 | 14,878 | ||||||
|
Deferred rent |
16,697 | 12,632 | ||||||
|
Total liabilities |
28,944 | 27,510 | ||||||
|
Commitments and contingencies (Note 12) |
||||||||
|
Stockholders’ equity: |
||||||||
|
Preferred stock, $0.01 par value, 2,000,000 shares authorized; none issued |
— | — | ||||||
|
Common stock, $0.01 par value, 15,000,000 shares authorized,11,325,338 shares issued and 11,209,138 shares outstanding at December 31, 2014 and 8,718,922 shares issued and 8,602,722 shares outstanding at December 31, 2013 |
113 | 87 | ||||||
|
Additional paid-in capital |
96,422 | 54,083 | ||||||
|
Accumulated deficit |
(30,109 | ) | (30,812 | ) | ||||
|
Treasury stock, at cost, 116,200 shares at December 31, 2014 and 2013 |
(1,000 | ) | (1,000 | ) | ||||
|
Total stockholders’ equity |
65,426 | 22,358 | ||||||
|
Total liabilities and stockholders’ equity |
$ | 94,370 | $ | 49,868 | ||||
See accompanying notes to the consolidated financial statements.
KONA GRILL, INC.
CONSOLIDATED STATEMENTS OF COMPREHENSIVE INCOME
(In thousands, except per share data)
| Year Ended December 31, | ||||||||||||
| 2014 | 2013 | 2012 | ||||||||||
|
Restaurant sales |
$ | 119,097 | $ | 98,250 | $ | 96,021 | ||||||
|
Costs and expenses: |
||||||||||||
|
Cost of sales |
32,964 | 26,853 | 26,246 | |||||||||
|
Labor |
40,336 | 33,166 | 31,968 | |||||||||
|
Occupancy |
8,061 | 6,702 | 6,253 | |||||||||
|
Restaurant operating expenses |
16,358 | 13,456 | 13,534 | |||||||||
|
General and administrative |
10,715 | 7,854 | 7,037 | |||||||||
|
Preopening expense |
2,481 | 1,162 | — | |||||||||
|
Depreciation and amortization |
7,220 | 5,918 | 5,749 | |||||||||
|
Insurance recoveries and other |
— | 32 | (120 | ) | ||||||||
|
Total costs and expenses |
118,135 | 95,143 | 90,667 | |||||||||
|
Income from operations |
962 | 3,107 | 5,354 | |||||||||
|
Write off of deferred financing costs and other |
39 | 66 | — | |||||||||
|
Interest expense, net |
220 | 160 | 66 | |||||||||
|
Income before income taxes |
703 | 2,881 | 5,288 | |||||||||
|
Provision for income taxes |
— | 169 | 36 | |||||||||
|
Income from continuing operations |
703 | 2,712 | 5,252 | |||||||||
|
Loss from discontinued operations, net of tax |
— | — | 466 | |||||||||
|
Net income |
$ | 703 | $ | 2,712 | $ | 4,786 | ||||||
|
Net income per share – Basic (Note 1): |
||||||||||||
|
Continuing operations |
$ | 0.07 | $ | 0.32 | $ | 0.60 | ||||||
|
Discontinued operations |
— | — | (0.05 | ) | ||||||||
|
Net income |
$ | 0.07 | $ | 0.32 | $ | 0.55 | ||||||
|
Net income per share – Diluted (Note 1): |
||||||||||||
|
Continuing operations |
$ | 0.07 | $ | 0.31 | $ | 0.59 | ||||||
|
Discontinued operations |
— | — | (0.05 | ) | ||||||||
|
Net income |
$ | 0.07 | $ | 0.31 | $ | 0.54 | ||||||
|
Weighted average shares outstanding (Note 1): |
||||||||||||
|
Basic |
9,870 | 8,573 | 8,726 | |||||||||
|
Diluted |
10,263 | 8,762 | 8,868 | |||||||||
|
Comprehensive income |
$ | 703 | $ | 2,712 | $ | 4,786 | ||||||
See accompanying notes to the consolidated financial statements.
KONA GRILL, INC.
CONSOLIDATED STATEMENTS OF STOCKHOLDERS’ EQUITY
(In thousands)
|
Additional |
||||||||||||||||||||||||
|
Common Stock |
Paid-in |
Accumulated |
Treasury |
Stockholders’ |
||||||||||||||||||||
|
Shares |
Amount |
Capital |
Deficit |
Stock |
Equity |
|||||||||||||||||||
|
Balances at December 31, 2011 |
8,956 | $ | 91 | $ | 56,903 | $ | (38,310 |
) |
$ | (1,000 | ) | $ | 17,684 | |||||||||||
|
Stock-based compensation |
— | — | 398 | — | — | 398 | ||||||||||||||||||
|
Issuance of common stock under the Employee Stock Purchase Plan and exercise of stock options and warrants |
384 | 4 | 1,532 | — | — | 1,536 | ||||||||||||||||||
|
Purchase and retirement of common stock |
(793 | ) | (8 | ) | (5,528 | ) | — | — | (5,536 | ) | ||||||||||||||
|
Net income |
— | — | — | 4,786 | — | 4,786 | ||||||||||||||||||
|
Other comprehensive income |
— | — | — | — | — | — | ||||||||||||||||||
|
Total comprehensive income |
4,786 | |||||||||||||||||||||||
|
Balances at December 31, 2012 |
8,547 | 87 | 53,305 | (33,524 |
) |
(1,000 |
) |
18,868 | ||||||||||||||||
|
Stock-based compensation |
— | — | 584 | — | — | 584 | ||||||||||||||||||
|
Issuance of common stock under the Employee Stock Purchase Plan and exercise of stock options and warrants |
80 | — | 310 | — | — | 310 | ||||||||||||||||||
|
Purchase and retirement of common stock |
(24 | ) | — | (203 | ) | — | — | (203 | ) | |||||||||||||||
|
Tax benefits for stock option exercises |
— | — | 87 | — | — | 87 | ||||||||||||||||||
|
Net income |
— | — | — | 2,712 | — | 2,712 | ||||||||||||||||||
|
Other comprehensive income |
— | — | — | — | — | — | ||||||||||||||||||
|
Total comprehensive income |
2,712 | |||||||||||||||||||||||
|
Balances at December 31, 2013 |
8,603 | 87 | 54,083 | (30,812 |
) |
(1,000 |
) |
22,358 | ||||||||||||||||
|
Stock-based compensation |
— | — | 856 | — | — | 856 | ||||||||||||||||||
|
Issuance of common stock under the Employee Stock Purchase Plan and exercise of stock options, net of share repurchase for minimum tax withholdings |
261 | 3 | 627 | — | — | 630 | ||||||||||||||||||
|
Issuance of common stock, net of offering expenses |
2,345 | 23 | 40,856 | — | — | 40,879 | ||||||||||||||||||
|
Net income |
— | — | — | 703 | — | 703 | ||||||||||||||||||
|
Other comprehensive income |
— | — | — | — | — | — | ||||||||||||||||||
|
Total comprehensive income |
703 | |||||||||||||||||||||||
|
Balances at December 31, 2014 |
11,209 | $ | 113 | $ | 96,422 | $ | (30,109 |
) |
$ | (1,000 |
) |
$ | 65,426 | |||||||||||
See accompanying notes to the consolidated financial statements.
KONA GRILL, INC.
CONSOLIDATED STATEMENTS OF CASH FLOWS
(In thousands)
|
Year Ended December 31, |
||||||||||||
|
2014 |
2013 |
2012 |
||||||||||
|
Operating activities |
||||||||||||
|
Net income |
$ | 703 | $ | 2,712 | $ | 4,786 | ||||||
|
Adjustments to reconcile net income to net cash provided by operating activities: |
||||||||||||
|
Depreciation and amortization |
7,176 | 5,708 | 5,735 | |||||||||
|
Stock-based compensation |
856 | 584 | 398 | |||||||||
|
Excess income tax benefits from stock option exercises |
— | (87 |
) |
— | ||||||||
|
Loss on disposal of assets |
44 | 210 | 14 | |||||||||
|
Gain on insurance recoveries |
— | — | (317 |
) | ||||||||
|
Amortization of deferred financing costs |
104 | 79 | 16 | |||||||||
|
Write off of deferred financing costs |
39 | 66 | — | |||||||||
|
Change in operating assets and liabilities: |
||||||||||||
|
Receivables |
458 | (559 |
) |
34 | ||||||||
|
Other current assets |
(623 |
) |
(365 |
) |
69 | |||||||
|
Accounts payable |
323 | 200 | 52 | |||||||||
|
Accrued expenses |
1,599 | (10 |
) |
(1,571 |
) | |||||||
|
Deferred rent |
4,065 | 922 | (1,864 |
) | ||||||||
|
Net cash provided by operating activities |
14,744 | 9,460 | 7,352 | |||||||||
|
Investing activities |
||||||||||||
|
Purchase of property and equipment |
(21,855 |
) |
(14,445 |
) |
(1,794 |
) | ||||||
|
(Increase) decrease in other assets |
(3 |
) |
(91 |
) |
18 | |||||||
|
Net cash used in investing activities |
(21,858 |
) |
(14,536 |
) |
(1,776 |
) | ||||||
|
Financing activities |
||||||||||||
|
Debt borrowings |
— | 3,500 | 500 | |||||||||
|
Debt repayments |
(3,500 |
) |
(370 |
) |
(262 |
) | ||||||
|
Fees paid for credit facility |
(198 |
) |
(356 |
) |
(152 |
) | ||||||
|
Proceeds from issuance of common stock, net of issuance expense |
40,879 | — | — | |||||||||
|
Proceeds from issuance of common stock under the Employee Stock Purchase Plan and exercise of stock options |
1,466 | 310 | 1,536 | |||||||||
|
Payment for withholding tax from net settled stock option exercise |
(836 |
) |
— | — | ||||||||
|
Excess income tax benefits from stock option exercises |
— | 87 | — | |||||||||
|
Purchase and retirement of common stock |
— | (203 |
) |
(5,536 |
) | |||||||
|
Net cash provided by (used in) financing activities |
37,811 | 2,968 | (3,914 |
) | ||||||||
|
Net increase (decrease) in cash and cash equivalents |
30,697 | (2,108 |
) |
1,662 | ||||||||
|
Cash and cash equivalents at the beginning of the year |
5,881 | 7,989 | 6,327 | |||||||||
|
Cash and cash equivalents at the end of the year |
$ | 36,578 | $ | 5,881 | $ | 7,989 | ||||||
|
Supplemental disclosures of cash flow information |
||||||||||||
|
Cash paid for interest (net of capitalized interest) |
$ | 161 | $ | 112 | $ | 26 | ||||||
|
Cash paid for income taxes, net of refunds |
$ | 110 | $ | 100 | $ | 64 | ||||||
|
Noncash investing activities |
||||||||||||
|
Accounts payable and accrued expenses related to property and equipment purchases |
$ | 2,060 | $ | 3,112 | $ | 214 | ||||||
See accompanying notes to the consolidated financial statements.
KONA GRILL, INC.
NOTES TO THE CONSOLIDATED FINANCIAL STATEMENTS
1. The Company and Summary of Significant Accounting Policies
Description of Business
Kona Grill, Inc., including its wholly-owned subsidiaries, (referred to herein as the “Company” or “we,” “us,” and “our”) owns and operates polished casual dining restaurants under the name “Kona Grill.” Our restaurants feature a diverse selection of flavorful American favorites and award-winning sushi items that are prepared fresh daily at each restaurant location. As of December 31, 2014, we owned and operated 30 restaurants in 19 states throughout the United States.
Basis of Presentation
The consolidated financial statements include the accounts and operations of the Company and its wholly owned subsidiaries. All significant intercompany balances and transactions have been eliminated in consolidation.
Reclassifications
Certain reclassifications of prior year’s financial statement amounts have been made to conform to the current year presentation.
Use of Estimates
The preparation of financial statements in conformity with U.S. generally accepted accounting principles requires management to make estimates and assumptions that affect the amounts reported in the consolidated financial statements and accompanying notes. Actual results could differ from those estimates.
Cash and Cash Equivalents
We consider all highly liquid investments that are readily convertible into cash and have an original maturity of three months or less at the time of purchase to be cash equivalents. Amounts receivable from credit card processors are also considered cash equivalents because they are both short-term and highly liquid in nature and are typically converted to cash within several business days of the sales transaction.
Investments
Investments consist primarily of certificates of deposit that are generally highly liquid in nature. We classify our investments based on the intended holding period.
Inventory
Inventory consists of food and beverage products that are valued at the lower of cost or market using the first-in, first-out method. Inventory is included in other current assets in the accompanying consolidated balance sheets.
Fair Value Measurements
Fair value is defined as the price that would be received to sell an asset or paid to transfer a liability in an orderly transaction between market participants at the measurement date. As such, fair value is a market-based measurement that is determined based on assumptions that market participants would use in pricing an asset or a liability. As a basis for considering such assumptions, a three-tier value hierarchy was established, which prioritizes the inputs used in the valuation methodologies in measuring fair value.
|
Level 1: |
Fair values determined by quoted prices in active markets for identical assets or liabilities that the reporting entity has the ability to access. |
KONA GRILL, INC.
NOTES TO THE CONSOLIDATED FINANCIAL STATEMENTS
|
Level 2: |
Fair values utilize inputs other than quoted prices that are observable for the asset or liability, and may include quoted prices for similar assets and liabilities in active markets, and inputs other than quoted prices that are observable for the asset or liability. |
|
Level 3: |
Fair values determined by unobservable inputs that are not corroborated by market data and may reflect the reporting entity’s own assumptions market participants would use in pricing the asset or liability. |
Concentration of Credit Risk
Financial instruments that potentially subject us to a concentration of credit risk principally consist of cash and cash equivalents, investments and accounts receivable. Concentration of credit risk is limited by diversifying cash deposits among a variety of high credit-quality issuers. At times, cash and cash equivalent balances may be in excess of the FDIC insurance limit.
Property and Equipment
Property and equipment are stated at cost less accumulated depreciation. We capitalize all direct costs on the construction of leasehold improvements and interest incurred during the construction and development period. Leasehold improvements are amortized over the shorter of the useful life of the asset or the related lease term that includes reasonably assured lease renewals as determined on the date of acquisition of the leasehold improvement. Improvements that materially extend the life of an asset are capitalized while repair and maintenance costs are expensed as incurred.
Depreciation and amortization are recorded on a straight-line basis over the following estimated useful lives:
|
Furniture and fixtures |
5-7 years |
|
Equipment |
2-7 years |
|
Computer software and electronic equipment |
3 years |
|
Leasehold improvements |
Shorter of the useful life or the lease term |
We evaluate property and equipment for impairment whenever events or changes in restaurant operating results indicate that the carrying value of those assets may not be recoverable. Factors considered include, but are not limited to, significant underperformance relative to expected historical or projected future operating results; significant negative industry or economic trends; and significant changes in legal factors or in the business climate. The assessment of impairment is performed on a restaurant-by-restaurant basis. Recoverability is assessed by comparing the carrying value of the asset to the undiscounted cash flows expected to be generated by the asset. This assessment process requires the use of estimates and assumptions regarding future cash flows and estimated useful lives, which are subject to a significant degree of judgment. If indicators of impairment are present and if we determine that the carrying value of the asset exceeds the fair value of the restaurant assets, an impairment charge is recorded to reduce the carrying value of the asset to its fair value.
Leases
We lease our restaurant locations under operating lease agreements with initial terms of approximately 10 to 20 years. Most of these agreements require minimum annual rent payments plus contingent rent payments based on a percentage of restaurant sales which exceed the minimum base sales threshold. Contingent rent payments, to the extent they exceed minimum payments, are accrued over the periods in which the liability is incurred. Rent expense associated with these contingent payments is recorded prior to the achievement of specified sales levels if exceeding such amount is considered probable and is estimable. The lease agreements typically also require scheduled increases to minimum annual rent payments. For leases that contain rent escalations, we record the total rent payable over the initial lease term, starting on the date we gain possession of the property (including the construction period), on a straight-line basis. Any difference between minimum rent and straight-line rent is recorded as deferred rent. Deferred rent also includes tenant improvement allowances which are amortized as a reduction of rent expense on a straight-line basis over the term of the lease. As part of the initial lease terms, we negotiate with our landlords to secure these tenant improvement allowances and record such allowances as lease incentive receivables when determined to be collectible. These amounts are included in receivables on the balance sheet.
KONA GRILL, INC.
NOTES TO THE CONSOLIDATED FINANCIAL STATEMENTS
Revenue Recognition
Revenues from food, beverage, and alcohol sales are recognized when payment is tendered at the point of sale. Restaurant sales are recorded net of promotions and discounts. Revenues from gift card sales are recognized upon redemption. Prior to redemption, the outstanding balances of all gift cards are included in accrued expenses in the accompanying consolidated balance sheets.
Sales Taxes
Revenues are presented net of sales taxes. The sales tax obligation is included in accrued expenses until the taxes are remitted to the appropriate taxing authorities.
Advertising and Marketing Costs
Advertising and marketing costs are expensed as incurred. Advertising and marketing expense for 2014, 2013 and 2012 was $461,000, $382,000 and $473,000, respectively, and is included in restaurant operating expenses in the accompanying consolidated statements of comprehensive income. We maintain a customer loyalty club (the Konavore program), an email-based marketing program designed to communicate new menu offerings, restaurant specific events, and other marketing messages to keep Kona Grill top of mind for consumers. The Konavore loyalty program offers members a discount coupon upon enrolling in the program and a discount coupon for a member’s birthday. These coupons are recognized upon redemption and recorded in the financial statements as a sales discount. Costs associated with the redemption of a promotion in the form of a coupon for discounted product are recorded in cost of sales as these coupons are typically redeemed with the purchase of additional food and beverage items. Costs associated with promotional giveaways of food and beverages to local businesses and sponsorship of events are viewed as advertising in nature and recorded in restaurant operating expenses.
Preopening Expense
Costs directly related to the opening of new restaurants, including employee relocation, travel, employee payroll and related training costs, and rent expense subsequent to the date we take possession of the property through the restaurant opening are expensed as incurred.
Insurance Recoveries and Other
Insurance recoveries and other represent an insurance settlement for property and facility damage and for a business interruption claim, net of other non-recurring items incurred. In 2012, we recognized a gain of $317,000 for business interruption and furniture replacement claims associated with a fire at our Troy, Michigan restaurant. We also recognized additional tax expense for sales tax audit matters in 2013 and 2012.
Stock-Based Compensation
We maintain stock award plans under which we may issue incentive stock options, non-qualified stock options, restricted stock, and other types of awards to employees, directors, and consultants. Stock options issued under these plans are granted with an exercise price at or above the fair market value of the underlying common stock on the date of grant and expire five years from the date of grant. Employee stock options generally vest 25% each year over a four-year period, while annual recurring awards for non-employee director options vest 25% each quarter over a one-year period. Certain stock option awards for executive officers may vest earlier in the event of a change of control or termination, as defined in the executive officer’s employment agreement. We apply the Black-Scholes valuation model in determining the fair value of stock option grants. We recognize compensation cost for our stock awards using a graded vesting schedule on a straight line basis over the requisite service period.
KONA GRILL, INC.
NOTES TO THE CONSOLIDATED FINANCIAL STATEMENTS
Income Taxes
We utilize the liability method of accounting for income taxes. Under the liability method, deferred tax assets and liabilities are computed at each balance sheet date for temporary differences between the consolidated financial statements and tax basis of assets and liabilities that will result in taxable or deductible amounts in the future based on tax rates in effect in the years in which the temporary differences are expected to affect taxable income. Valuation allowances are established when necessary to reduce deferred tax assets to the amounts that will more likely than not be realized.
We recognize the impact of a tax position in our financial statements if that position more likely than not will be sustained upon examination by a tax authority. We recognize accrued interest and penalties related to uncertain tax positions as income tax expense.
Net Income Per Share
Basic net income per share is computed by dividing net income by the weighted average number of common shares outstanding during the year. Diluted net income per share includes the dilutive effect of potential stock option and warrant exercises, which are calculated using the treasury stock method. For 2014, 2013 and 2012, there were 197,000, 76,000, and 452,000 stock options outstanding, respectively, that were not included in the dilutive earnings per share calculation because the effect would have been anti-dilutive.
The following table sets forth the computation of basic and diluted net income (loss) per share:
|
Year Ended December 31, |
||||||||||||
|
2014 |
2013 |
2012 |
||||||||||
|
(In thousands, except per share data) |
||||||||||||
|
Numerator: |
||||||||||||
|
Income from continuing operations |
$ | 703 | $ | 2,712 | $ | 5,252 | ||||||
|
Loss from discontinued operations, net of tax |
— | — | (466 |
) | ||||||||
|
Net income |
$ | 703 | $ | 2,712 | $ | 4,786 | ||||||
|
Denominator: |
||||||||||||
|
Weighted average shares — basic |
9,870 | 8,573 | 8,726 | |||||||||
|
Effect of dilutive stock options and warrants |
393 | 189 | 142 | |||||||||
|
Weighted average shares — diluted |
10,263 | 8,762 | 8,868 | |||||||||
|
Net income per share – Basic: |
||||||||||||
|
Continuing operations |
$ | 0.07 | $ | 0.32 | $ | 0.60 | ||||||
|
Discontinued operations |
— | — | (0.05 |
) | ||||||||
|
Net income |
$ | 0.07 | $ | 0.32 | $ | 0.55 | ||||||
|
Net income per share – Diluted: |
||||||||||||
|
Continuing operations |
$ | 0.07 | $ | 0.31 | $ | 0.59 | ||||||
|
Discontinued operations |
— | — | (0.05 |
) | ||||||||
|
Net income |
$ | 0.07 | $ | 0.31 | $ | 0.54 | ||||||
Recently Issued Accounting Standards
In May 2014, the Financial Accounting Standards Board amended the Accounting Standards Codification and created Topic 606, Revenue from Contracts with Customers, to clarify the principles for recognizing revenue. This guidance requires that an entity recognize revenue to depict the transfer of promised goods or services to customers at an amount that reflects the consideration to which the entity expects to be entitled in exchange for those goods or services. This guidance will be effective for the Company beginning January 1, 2017 and must be adopted using either a full retrospective approach for all periods presented in the period of adoption or a modified retrospective approach. We are currently assessing the method of adoption and the potential impact this guidance may have on our financial position, results of operations and cash flows.
KONA GRILL, INC.
NOTES TO THE CONSOLIDATED FINANCIAL STATEMENTS
2. Discontinued Operations
During the third quarter of 2011, we closed our Sugar Land restaurant and recognized $618,000 associated with estimated lease termination costs. On April 18, 2012, the landlord, Sugar Land Mall, LLC, commenced an action against us in the District Court for Fort Bend County, Texas, seeking outstanding rent and charges for the remaining term of the lease, attorney fees, clean-up and other expenses associated with the re-letting of the premise, as well as unspecified damages. In September 2012, we entered into an agreement with the landlord to settle all outstanding lease termination obligations for $950,000. The incremental lease termination costs and related attorney fees were included in loss from discontinued operations in our consolidated statements of comprehensive income.
3. Investments
The following is a summary of our investments (in thousands):
|
Adjusted Cost |
Gross Unrealized Losses |
Estimated Fair Value |
||||||||||
|
December 31, 2014 |
||||||||||||
|
Short-term investments: |
||||||||||||
|
Certificates of deposit |
$ | 178 | $ | — | $ | 178 | ||||||
|
Total investments |
$ | 178 | $ | — | $ | 178 | ||||||
|
December 31, 2013 |
||||||||||||
|
Short-term investments: |
||||||||||||
|
Certificates of deposit |
$ | 177 | $ | — | $ | 177 | ||||||
|
Total investments |
$ | 177 | $ | — | $ | 177 | ||||||
4. Fair Value Measurements
The carrying value for certain of our financial instruments, including cash and cash equivalents, accounts receivable and accounts payable approximates fair value because of their short-term nature. Our investments represent certificates of deposit and are considered available-for-sale securities that are valued using market observable inputs (Level 2). Our debt in 2013 was valued using primarily Level 2 inputs including, current applicable rates for similar instruments and approximates the carrying value of such obligations.
5. Property and Equipment
Property and equipment consisted of the following (in thousands):
|
December 31, |
||||||||
|
2014 |
2013 |
|||||||
|
Leasehold improvements |
$ | 69,643 | $ | 55,810 | ||||
|
Equipment |
19,378 | 15,808 | ||||||
|
Furniture and fixtures |
6,950 | 4,768 | ||||||
| 95,971 | 76,386 | |||||||
|
Less accumulated depreciation and amortization |
(46,860 |
) |
(40,324 |
) | ||||
| 49,111 | 36,062 | |||||||
|
Construction in progress |
4,823 | 4,290 | ||||||
|
Total property and equipment, net |
$ | 53,934 | $ | 40,352 | ||||
KONA GRILL, INC.
NOTES TO THE CONSOLIDATED FINANCIAL STATEMENTS
6. Accrued Expenses
Accrued expenses consisted of the following (in thousands):
|
December 31, |
||||||||
|
2014 |
2013 |
|||||||
|
Accrued payroll |
$ | 3,054 | $ | 2,557 | ||||
|
Gift cards |
1,961 | 1,586 | ||||||
|
Sales taxes |
1,354 | 907 | ||||||
|
Accrued construction and remodel (1) |
1,067 | 2,275 | ||||||
|
Accrued occupancy |
399 | 264 | ||||||
|
Business and income taxes |
92 | 328 | ||||||
|
Other |
1,115 | 735 | ||||||
|
Total accrued expenses |
$ | 9,042 | $ | 8,652 | ||||
|
(1) |
Balance is attributable to property additions for our new restaurants and remodels. |
7. Debt and Credit Agreements
On April 19, 2013, we entered into a Credit Agreement for a $20 million revolving line of credit maturing on April 19, 2017 with KeyBank National Association (“KeyBank”) and Stearns Bank National Association (“Stearns Bank”). On November 7, 2014, we entered into an Amended and Restated Credit Agreement (the “Amended Credit Agreement”) with KeyBank to (i) increase the credit facility from $20 million to $35 million, and (ii) extend the maturity date of the credit facility to November 7, 2019. The credit facility is secured by our personal property and assets. Certain of our wholly owned subsidiaries have also guaranteed the credit facility.
The interest rate under the Amended Credit Agreement is KeyBank’s prime rate or LIBOR, at our option, plus an applicable margin depending on our leverage ratio. The LIBOR margins range from 1.5% to 2.5% and the base rate margins range from 0.5% to 1.5%. Payments on the credit facility are interest only, payable quarterly with respect to each base rate loan and at varying times with respect to LIBOR rate loans, with outstanding principal and interest due at maturity. Prepayment is permitted at any time without penalty, subject to certain restrictions on the order of repayment or prepayment. We are obligated to pay a commitment fee at an annual rate of 0.175% to 0.350%, depending on our leverage ratio, times the unused total revolving commitment of the credit facility based on the average daily amount outstanding under the credit facility for the previous quarter. The commitment fee is payable quarterly in arrears.
During the fourth quarter of 2013, we borrowed $3.5 million against the credit facility at the one-month LIBOR rate of approximately 3.4%, including the LIBOR margin. We paid off all outstanding borrowings under the credit facility with existing cash on hand on June 30, 2014. The entire $35 million under the credit facility was available at December 31, 2014.
During 2014, 2013 and 2012, we incurred gross interest expense of $269,000, $171,000 and $67,000, consisting primarily of loan fee amortization of $104,000, $79,000 and $16,000 in 2014, 2013 and 2012, respectively, and commitment fees of $91,000 and $70,000 in 2014 and 2013, respectively. We also capitalized $29,000 and $7,000 of interest costs in 2014 and 2013, respectively.
Fees incurred to establish the credit facility totaled $198,000 and $356,000 in 2014 and 2013, respectively. Unamortized loan fees of $403,000 at December 31, 2014 are being amortized over the life of the credit facility and included in other assets in the consolidated balance sheet.
The credit facility also requires us to comply with certain covenants, including (a) a minimum fixed charge coverage ratio of less than 1.50 and (b) a maximum leverage ratio of 5.0 to 1.0 through March 31, 2016 and 4.75 to 1.0 from April 1, 2016 through the maturity date. As of December 31, 2013, there was a technical event of default related to the matter described in Note 12 and accordingly, all borrowings under the credit facility were classified as a current liability at December 31, 2013. The default judgment was subsequently set aside on April 7, 2014. We were in compliance with all covenants at December 31, 2014.
KONA GRILL, INC.
NOTES TO THE CONSOLIDATED FINANCIAL STATEMENTS
Prior to closing on the credit facility, we had loan agreements with Stearns Bank for a $0.5 million term loan and a $6.5 million credit line. We did not have any borrowings under the Stearns Bank credit line prior to its termination in April 2013. We utilized existing cash to pay off the outstanding balance on the Stearns Bank term loan on April 19, 2013 and wrote off $66,000 in deferred loan fees related to the prior loan agreements during the second quarter of 2013. In conjunction with the modification of the credit facility in November 2014, we wrote off the remaining Stearns Bank deferred loan fees of $39,000 in the fourth quarter of 2014.
8. Income Taxes
Income tax expense from continuing operations consisted of the following (in thousands):
|
Year Ended December 31, |
||||||||||||
|
2014 |
2013 |
2012 |
||||||||||
|
Current: |
||||||||||||
|
Federal |
$ | — | $ | 71 | $ | — | ||||||
|
State |
— | 98 | 36 | |||||||||
| — | 169 | 36 | ||||||||||
|
Deferred: |
||||||||||||
|
Federal |
— | — | — | |||||||||
|
State |
— | — | — | |||||||||
| — | — | — | ||||||||||
|
Total |
$ | — | $ | 169 | $ | 36 | ||||||
Income tax expense differed from amounts computed by applying the federal statutory rate to income from continuing operations before provision for income taxes as follows (in thousands):
|
Year Ended December 31, |
||||||||||||
|
2014 |
2013 |
2012 |
||||||||||
|
Income tax expense at federal statutory rate |
$ | 239 | $ | 979 | $ | 1,798 | ||||||
|
State income taxes, net of federal benefit |
41 |
|
91 |
|
56 | |||||||
|
Nondeductible expenses |
484 | 394 | 365 | |||||||||
|
Business tax credit |
(1,959 | ) | (1,057 |
) |
(1,018 |
) | ||||||
|
Other |
(32 | ) | (78 |
) |
26 | |||||||
|
Change in valuation reserve |
1,227 | (160 |
) |
(1,191 |
) | |||||||
|
Total |
$ | — | $ | 169 | $ | 36 | ||||||
The temporary differences that give rise to significant portions of deferred tax assets and liabilities were as follows (in thousands):
|
December 31, |
||||||||
|
2014 |
2013 |
|||||||
|
Deferred tax assets (liabilities): |
||||||||
|
Net operating loss carryforward |
$ | 3,114 | $ | 831 | ||||
|
Deferred rent |
6,258 | 4,735 | ||||||
|
Business tax credits |
9,414 | 7,462 | ||||||
|
Organizational and preopening costs |
39 | 48 | ||||||
|
Stock-based compensation |
371 | 377 | ||||||
|
Accrued expenses |
58 | 59 | ||||||
|
Property and equipment |
(1,879 |
) |
2,762 | |||||
|
Other |
475 | 349 | ||||||
|
Net deferred tax assets |
17,850 | 16,623 | ||||||
|
Valuation allowance |
(17,850 |
) |
(16,623 |
) | ||||
|
Total |
$ | — | $ | — | ||||
KONA GRILL, INC.
NOTES TO THE CONSOLIDATED FINANCIAL STATEMENTS
The valuation allowance increased $1.2 million at December 31, 2014 and decreased $160,000 at December 31, 2013. At December 31, 2014, we had $29.1 million in state net operating loss carryforwards that will begin expiring in 2015 and $9.4 million in federal business tax credit carryforwards, the majority of which is comprised of FICA tip credit carryforwards that will begin expiring in 2025. These credits and certain state net operating loss carryforwards are also subject to annual limitations due to ownership change rules under the Internal Revenue Code. We have a full valuation allowance for these carryforwards due to the uncertainty surrounding their future utilization. The realization of our deferred tax assets ultimately depends on the existence of sufficient taxable income in the appropriate taxing jurisdictions in future periods. We have analyzed, and will continue to analyze, the positive and negative evidence to support our conclusion regarding the appropriate amount of our valuation allowance. The valuation allowance could be reduced in a subsequent period if there is sufficient evidence to support a conclusion that it is more likely than not that the state net operating loss carryforwards and/or the FICA tip credit carryforwards will be realized. Future changes in our valuation allowance could have a material effect on our results of operations in the period recorded.
As of December 31, 2014 and 2013, we had no unrecognized tax benefits. We recognize interest and penalties related to uncertain tax positions in income tax expense. For the years ended December 31, 2014 and 2013, provision for income taxes includes no interest and penalties on unrecognized tax benefits. We had no accrued interest and penalties at December 31, 2014.
We are subject to U.S. federal income tax as well as income tax of multiple state jurisdictions. The earliest tax year still subject to examination by a significant taxing jurisdiction is 2011.
9. Stockholders’ Equity
Preferred Stock
We are authorized to issue 2,000,000 shares of preferred stock with a par value of $0.01. There were no shares of preferred stock that were issued or outstanding at December 31, 2014 or 2013.
Common Stock
Stock Purchase and Retirement Program
In November 2011, our Board of Directors approved a stock repurchase and retirement program under which we were authorized to purchase up to $5,000,000 of common stock. We completed the 2011 authorization in February 2012, purchasing and retiring 858,663 shares.
In May 2012, our Board of Directors authorized another stock repurchase and retirement program of up to $5,000,000 of our outstanding common stock. As of December 31, 2014, we have repurchased and retired $3.2 million or 387,109 shares under the 2012 authorization, with $203,000 or 24,098 shares during 2013. We did not repurchase and retire any shares during 2014.
The authorization of the program does not have an expiration date and it does not require us to purchase a specific dollar amount of shares. This authorization may be modified, suspended or terminated at any time. The timing and number of shares purchased pursuant to the share purchase authorization are subject to a number of factors, including current market conditions, legal constraints and available cash.
KONA GRILL, INC.
NOTES TO THE CONSOLIDATED FINANCIAL STATEMENTS
Common Stock Offering
On June 25, 2014, we completed a public offering of 2,645,000 shares of our common stock at an offering price of $18.50 per share. We sold an aggregate of 2,345,000 shares, of which 345,000 shares were sold pursuant to the underwriters’ exercise of their option to purchase additional shares. The remaining 300,000 shares were sold by certain selling stockholders. The aggregate net proceeds received for the offering totaled $40.9 million, reflecting gross proceeds of $43.4 million, less underwriting discounts and expenses of $2.2 million and other offering costs of $0.3 million. Net proceeds from the offering have been and will be used for new unit expansion, capital expenditures and general corporate purposes.
10. Stock-Based Compensation
Stock Options
We maintain stock award plans under which we may issue incentive stock options, non-qualified stock options, restricted stock, and other types of awards to employees, directors, and consultants. We typically grant non-qualified stock options with an exercise price at the fair market value of the underlying common stock on the date of grant and such options expire five years from the date of grant. Employee stock options generally vest 25% each year over a four-year period, while annual recurring awards for non-employee director options vest 25% each quarter over a one-year period.
We previously granted stock options under our 2005 Stock Award Plan (the “2005 Plan”) and adopted the 2012 Stock Award Plan (the “2012 Plan”) in March 2012. Any award granted earlier under the 2005 Plan continues to be governed by the terms of that plan. The 2012 Plan was approved by our shareholders in May 2012. Upon effectiveness of the 2012 Plan, no further awards were granted under the 2005 Plan, and the available share reserve under the 2005 Plan was added to the share reserve under the 2012 Plan. The total shares of common stock reserved for issuance under the 2012 Plan totaled 2,200,000, of which 365,854 shares were available for grant as of December 31, 2014.
We account for stock-based compensation using the fair value recognition provisions. Compensation expense is recognized ratably over the vesting term of the option and is included in general and administrative expenses. The following table presents information related to stock-based compensation:
|
Year Ended December 31, |
||||||||||||
|
2014 |
2013 |
2012 |
||||||||||
|
Stock-based compensation |
$ | 856,000 | $ | 584,000 | $ | 398,000 | ||||||
The fair value of each option award is estimated on the date of grant using the Black-Scholes option pricing model and is affected by assumptions regarding a number of highly complex and subjective variables. These variables include, but are not limited to, the actual and projected employee stock option exercise behavior, expected volatility, risk-free interest rate, expected dividends, and expected term. Expected volatility is based on the historical volatility of our stock. The expected term of the options represents the estimated period of time until exercise and is based on historical experience of similar awards, giving consideration to the contractual terms, vesting schedules and expectations of future employee behavior. The risk-free interest rate is based on the U.S. Treasury yield curve in effect at the time of grant for the expected term of the option. We have not paid dividends in the past and do not plan to pay any dividends in the near future. Compensation expense is recognized only for those options expected to vest, with forfeitures estimated based on our historical experience and future expectations. The fair value of stock options granted was estimated at the date of grant using the Black-Scholes option pricing model with the following weighted average assumptions:
|
2014 |
2013 |
2012 |
||||||||||
|
Expected volatility |
36.8 | % | 38.8 | % | 58.5 | % | ||||||
|
Risk-free interest rate |
0.7 | % | 0.6 | % | 0.6 | % | ||||||
|
Dividend yield |
0.0 | % | 0.0 | % | 0.0 | % | ||||||
|
Expected life (in years) |
2.9 | 3.4 | 3.6 | |||||||||
|
Weighted average fair value per option granted |
$ | 4.15 | $ | 2.53 | $ | 2.87 | ||||||
KONA GRILL, INC.
NOTES TO THE CONSOLIDATED FINANCIAL STATEMENTS
Activities under our stock award plans during 2014, 2013 and 2012 were as follows:
|
Shares Under Option |
Weighted Average Exercise Price |
Weighted Average Remaining Contractual Term (years) |
Aggregate Intrinsic Value |
|||||||||||||
|
Outstanding options at December 31, 2011 |
900,981 | 6.13 | ||||||||||||||
|
Granted |
402,800 | 6.66 | ||||||||||||||
|
Forfeited |
(350,500 |
) |
8.07 | |||||||||||||
|
Exercised |
(279,339 |
) |
4.55 | |||||||||||||
|
Outstanding options at December 31, 2012 |
673,942 | 6.09 | ||||||||||||||
|
Granted |
276,800 | 8.87 | ||||||||||||||
|
Forfeited |
(90,104 |
) |
9.39 | |||||||||||||
|
Exercised |
(77,341 |
) |
3.63 | |||||||||||||
|
Outstanding options at December 31, 2013 |
783,297 | 6.94 | ||||||||||||||
|
Granted |
309,900 | 16.24 | ||||||||||||||
|
Forfeited |
(26,650 |
) |
13.08 | |||||||||||||
|
Exercised |
(326,297 |
) |
6.82 | |||||||||||||
|
Outstanding options at December 31, 2014 |
740,250 | $ | 10.66 | 3.1 | $ | 9,201,000 | ||||||||||
|
Exercisable at December 31, 2014 |
191,325 | $ | 8.49 | 2.6 | $ | 2,794,000 | ||||||||||
The intrinsic value of options exercised during 2014, 2013, and 2012 was $5,026,000, $527,000 and $646,000 respectively. The total fair value of shares vested during 2014, 2013 and 2012 was $669,000, $489,000 and $262,000, respectively. As of December 31, 2014, there was approximately $1,163,000 of unrecognized stock-based compensation expense related to unvested share-based compensation arrangements, which is expected to be recognized over a weighted average period of 2.4 years.
Information regarding options outstanding and exercisable at December 31, 2014 is as follows:
|
Options Outstanding |
Options Exercisable |
|||||||||||||||||||||
|
Range of Exercise Prices |
Shares |
Weighted Average Remaining Contractual Life (years) |
Weighted Average Exercise Price |
Shares |
Weighted Average Exercise Price |
|||||||||||||||||
| $ 1.92 | – |
$ 4.99 |
42,225 | 0.8 | $ | 4.57 | 27,850 | $ | 4.36 | |||||||||||||
| $ 5.15 | – |
$ 8.71 |
410,650 | 2.6 | $ | 7.51 | 125,950 | $ | 7.22 | |||||||||||||
| $11.82 | – |
$12.54 |
11,600 | 3.5 | $ | 11.98 | 2,900 | $ | 11.98 | |||||||||||||
| $16.12 | – |
$18.12 |
275,775 | 4.1 | $ | 16.23 | 34,625 | $ | 16.12 | |||||||||||||
| 740,250 | 3.1 | $ | 10.66 | 191,325 | $ | 8.49 | ||||||||||||||||
11. Employee Benefit Plans
Defined Contribution Plan
We maintain a voluntary defined contribution plan covering eligible employees as defined in the plan documents. Participating employees may elect to defer the receipt of a portion of their compensation, subject to applicable laws, and contribute such amount to one or more investment options. We currently match in cash a certain percentage of the employee contributions to the plan and also pay for related administrative expenses. Matching contributions made during 2014, 2013 and 2012 were $216,000, $219,000 and $174,000, respectively.
KONA GRILL, INC.
NOTES TO THE CONSOLIDATED FINANCIAL STATEMENTS
Employee Stock Purchase Plan
During 2005, our Board of Directors and stockholders approved the 2005 Employee Stock Purchase Plan (ESPP) and reserved 425,000 shares of common stock for issuance thereunder. The ESPP permits eligible employees to purchase common stock at a discount through payroll deductions up to 15% of employees’ eligible earnings during the offering period. The purchase price per share at which shares of common stock are sold in an offering under the ESPP is equal to 95% of the fair market value of common stock on the last day of the applicable offering period. During 2014, 2013 and 2012, 2,298 shares, 2,610 shares and 4,948 shares, respectively, were purchased under the ESPP.
12. Commitments and Contingencies
Leases
We lease our restaurant locations under operating leases having terms expiring from 2016 to 2029. The leases typically include renewal clauses of five years exercisable at the option of our company and rent escalation clauses stipulating specific rent increases. We record deferred rent to recognize rent evenly over the lease term. Certain of these leases require the payment of contingent rentals based on a percentage of gross revenues above specified minimum amounts as defined in the respective lease agreement. The leases typically require us to pay our proportionate share of common area maintenance, property tax, insurance, and other occupancy-related costs. We also lease office facilities and certain equipment under operating lease agreements.
Rent expense on all operating leases was as follows (in thousands):
|
Year Ended December 31, |
||||||||||||
|
2014 |
2013 |
2012 |
||||||||||
|
Straight-line minimum base rent |
$ | 7,391 | $ | 6,160 | $ | 5,992 | ||||||
|
Contingent rent |
168 | 99 | 128 | |||||||||
|
Total rent |
$ | 7,559 | $ | 6,259 | $ | 6,120 | ||||||
As of December 31, 2014, future minimum lease payments under operating leases, including all signed leases for restaurants to be opened and excluding unexercised renewal options periods, were as follows (in thousands):
|
2015 |
$ | 9,512 | ||
|
2016 |
12,829 | |||
|
2017 |
11,683 | |||
|
2018 |
10,950 | |||
|
2019 |
10,409 | |||
|
Thereafter |
48,003 | |||
|
Total minimum lease payments |
$ | 103,386 |
Litigation
We are engaged in various legal actions, which arise in the ordinary course of our business. Although there can be no assurance as to the ultimate disposition of these matters, it is the opinion of our management, based upon the information available at this time, that the expected outcome of these matters, individually or in the aggregate, will not have a material adverse effect on the results of operations or financial condition of our company.
On February 10, 2014, Kona Grill Macadamia, Inc., a wholly-owned subsidiary of the Company (“Macadamia”), filed a Motion to Set Aside Default Judgment in the Circuit Court of Jackson County, Kansas City Missouri relating to a default judgment of approximately $3.5 million entered on December 18, 2013 against Macadamia. The underlying personal injury claim, Frank Neal Goss v. Kona Macadamia, Inc. and Anthony DeAngelo, revolves around a fight that two alleged restaurant patrons had outside of the Company’s Kansas City restaurant on March 1, 2011, which is claimed to have resulted in physical injury to the plaintiff. Following the hearing held on April 3, 2014, the Circuit Court issued a written order on April 7, 2014 granting Macadamia’s Motion to Set Aside Default Judgment. The underlying personal injury case is proceeding in the Circuit Court, and on April 16, 2014, Macadamia filed its answer to the plaintiff’s petition. On August 8, 2014, Macadamia filed its responses to the plaintiff’s first interrogatories and request for documents. On August 18, 2014, the plaintiff’s counsel requested additional time to serve the lawsuit on Mr. DeAngelo. To date, there has been no return of service on Mr. DeAngelo filed. At a conference held on October 27, 2014, plaintiff’s counsel indicated that plaintiff continues to attempt to serve Mr. DeAngelo. The court established a deadline of August 17, 2015 for summary judgment motions and scheduled the matter for trial in December 2015. We believe that we have a strong defense to the claim asserted by the plaintiff and insurance coverage for the claim.
KONA GRILL, INC.
NOTES TO THE CONSOLIDATED FINANCIAL STATEMENTS
13. Selected Quarterly Financial Data (Unaudited)
Summarized quarterly unaudited financial data for 2014 and 2013 is as follows (in thousands, except per share data):
|
2014 |
||||||||||||||||
|
|
March 31 |
June 30 |
September 30 |
December 31 |
||||||||||||
|
Restaurant sales |
$ | 27,616 | $ | 29,886 | $ | 30,037 | $ | 31,558 | ||||||||
|
Income (loss) from operations |
336 | 1,083 | 384 | (841 | ) | |||||||||||
|
Net income (loss) |
251 | 1,019 | 349 | (916 | ) | |||||||||||
|
Diluted net income (loss) per share (1) |
$ | 0.03 | $ | 0.11 | $ | 0.03 | $ | (0.08 | ) | |||||||
|
2013 |
||||||||||||||||
|
March 31 |
June 30 |
September 30 |
December 31 |
|||||||||||||
|
Restaurant sales |
$ | 23,496 | $ | 25,796 | $ | 24,507 | $ | 24,451 | ||||||||
|
Income (loss) from operations |
1,087 | 1,859 | 746 | (585 | ) | |||||||||||
|
Net income (loss) |
1,004 | 1,557 | 660 | (509 | ) | |||||||||||
|
Diluted net income (loss) per share (1) |
$ | 0.12 | $ | 0.18 | $ | 0.08 | $ | (0.06 | ) | |||||||
|
____________ |
||||||||||||||||
|
(1) |
Net income (loss) per share calculations for each quarter are based on the weighted average diluted shares outstanding for that quarter and may not total to the full year amount. |
F-19