Attached files
| file | filename |
|---|---|
| EX-32.2 - EX-32.2 - BRYN MAWR BANK CORP | d845943dex322.htm |
| EX-32.1 - EX-32.1 - BRYN MAWR BANK CORP | d845943dex321.htm |
| EX-21.1 - EX-21.1 - BRYN MAWR BANK CORP | d845943dex211.htm |
| EX-31.1 - EX-31.1 - BRYN MAWR BANK CORP | d845943dex311.htm |
| EX-23.1 - EX-23.1 - BRYN MAWR BANK CORP | d845943dex231.htm |
| EX-31.2 - EX-31.2 - BRYN MAWR BANK CORP | d845943dex312.htm |
| EXCEL - IDEA: XBRL DOCUMENT - BRYN MAWR BANK CORP | Financial_Report.xls |
Table of Contents
UNITED STATES
SECURITIES AND EXCHANGE COMMISSION
Washington, DC 20549
Form 10-K
(Mark One)
| x | ANNUAL REPORT PURSUANT TO SECTION 13 or 15(d) OF THE SECURITIES EXCHANGE ACT OF 1934 |
For the fiscal year ended December 31, 2014
| ¨ | TRANSITION REPORT PURSUANT TO SECTION 13 or 15(d) OF THE SECURITIES EXCHANGE ACT OF 1934 |
for the transition period from to
Commission file number 001-35746.
BRYN MAWR BANK CORPORATION
(Exact name of registrant as specified in its charter)
| Pennsylvania | 23-2434506 | |
| (State of other jurisdiction of Incorporation or Organization) |
(I.R.S. Employer Identification Number) | |
| 801 Lancaster Avenue, Bryn Mawr, Pennsylvania | 19010 | |
| (Address of principal executive offices) | (Zip Code) | |
(610) 525-1700
(Registrant’s telephone number, including area code)
Securities registered pursuant to Section 12(b) of the Act:
| Title of each class |
Name of each exchange on which registered | |
| Common Stock ($1 par value) | The Nasdaq Stock Market LLC |
Securities registered pursuant to Section 12(g) of the Act: None
Indicate by check mark if the registrant is a well-known seasoned issuer, as defined in Rule 405 of the Securities Act. Yes ¨ No x
Indicate by check mark if registrant is not required to file reports pursuant to Section 13 or 15(d) of the Exchange Act. Yes ¨ No x
Indicate by check mark whether the registrant (1) has filed all reports required to be filed by Section 13 of 15(d) of the Securities Exchange Act of 1934 during the preceding 12 months (or for such shorter period than the registrant was required to file such reports), and (2) has been subject to such filing requirements for the past 90 days. Yes x No ¨
Indicate by check mark whether the registrant has submitted electronically and posted on its corporate Web site, if any, every Interactive Data File required to be submitted and posted pursuant to Rule 405 of Regulation S-T (§ 232.405 of this chapter) during the preceding 12 months (or for such shorter period that the registrant was required to submit and post such files). Yes x No ¨
Indicate by check mark if disclosure of delinquent filers pursuant to Item 405 of Regulation S-K (& 229.405 of this chapter) is not contained herein, and will not be contained, to the best of Registrant’s knowledge, in definitive proxy or information statements incorporated by reference in Part III of this Form 10-K or any amendment to this Form 10-K. x
Indicate by check mark whether the registrant is a large accelerated filer, an accelerated filer, a non-accelerated filer, or a smaller reporting company. See the definitions of “large accelerated filer,” “accelerated filer” and “smaller reporting company” in Rule 12b-2 of the Exchange Act.
| Large Accelerated Filer | ¨ | Accelerated Filer | x | |||
| Non-Accelerated Filer | ¨ | Smaller Reporting Company | ¨ | |||
Indicate by checkmark whether the Registrant is a shell company (as defined by Rule 126-2 of the Exchange Act): Yes ¨ No x
The aggregate market value of shares of common stock held by non-affiliates of Registrant (including fiduciary accounts administered by affiliates) was $386,410,111 on June 30, 2014 based on the price at which our common stock was last sold on that date.*
As of March 5, 2015, there were 17,707,987 shares of common stock outstanding.
Documents Incorporated by Reference: Portions of the Definitive Proxy Statement of Registrant to be filed with the Commission pursuant to Regulation 14A with respect to the Registrant’s Annual Meeting of Shareholders to be held on April 30, 2015 (“2015 Proxy Statement”), as indicated, are incorporated by reference in Part III hereof.
| * | Registrant does not admit by virtue of the foregoing that its officers and directors are “affiliates” as defined in Rule 405. |
Table of Contents
Form 10-K
Bryn Mawr Bank Corporation
Table of Contents
SPECIAL CAUTIONARY NOTICE REGARDING FORWARD LOOKING STATEMENTS
Certain of the statements contained in this report and the documents incorporated by reference herein may constitute forward-looking statements for the purposes of the Securities Act of 1933, as amended and the Securities Exchange Act of 1934, as amended, and may involve known and unknown risks, uncertainties and other factors which may cause actual results, performance or achievements of the Bryn Mawr Bank Corporation (the “Corporation”) to be materially different from future results, performance or achievements expressed or implied by such forward-looking statements. These forward-looking statements include statements with respect to the Corporation’s financial goals, business plans, business prospects, credit quality, credit risk, reserve adequacy, liquidity, origination and sale of residential mortgage loans, mortgage servicing rights, the effect of changes in accounting standards, and market and pricing trends loss. The words The words “may”, “would”, “could”, “will”, “likely”, “expect,” “anticipate,” “intend”, “estimate”, “plan”, “forecast”, “project” and “believe” and similar expressions are intended to identify such forward-looking statements. The Corporation’s actual results may differ materially from the results anticipated by the forward-looking statements due to a variety of factors, including without limitation:
| • | local, regional, national and international economic conditions and the impact they may have on us and our customers and our assessment of that impact; |
| • | our need for capital; |
| • | lower demand for our products and services and lower revenues and earnings could result from an economic recession; |
| • | lower earnings could result from other-than-temporary impairment charges related to our investment securities portfolios or other assets; |
| • | changes in monetary or fiscal policy, or existing statutes, regulatory guidance, legislation or judicial decisions that adversely affect our business, including changes in federal income tax or other tax regulations; |
| • | changes in the level of non-performing assets and charge-offs; |
| • | changes in estimates of future reserve requirements based upon the periodic review thereof under relevant regulatory and accounting requirements; |
| • | other changes in accounting requirements or interpretations; |
| • | the accuracy of assumptions underlying the establishment of provisions for loan and lease losses and estimates in the value of collateral, and various financial assets and liabilities; |
| • | inflation, securities market and monetary fluctuations; |
| • | changes in the securities markets with respect to the market values of financial assets and the stability of particular securities markets; |
| • | changes in interest rates, spreads on interest-earning assets and interest-bearing liabilities, and interest rate sensitivity; |
| • | prepayment speeds, loan originations and credit losses; |
| • | sources of liquidity and financial resources in the amounts, at the times and on the terms required to support our future business; |
| • | legislation or other governmental action affecting the financial services industry as a whole, us or our subsidiaries individually or collectively, including changes in laws and regulations (including laws and regulations concerning taxes, banking, securities and insurance) with which we must comply; |
| • | results of examinations by the Federal Reserve Board, including the possibility that such regulator may, among other things, require us to increase our allowance for loan losses or to write down assets; |
| • | our common stock outstanding and common stock price volatility; |
| • | fair value of and number of stock-based compensation awards to be issued in future periods; |
Table of Contents
| • | with respect to our recent acquisition of Continental Bank Holdings, Inc. (“CBHI”), our business and the business of CBHI will not be integrated successfully or such integration may be more difficult, time-consuming or costly than expected; |
| • | revenues following the completion of our acquisition of CBHI may be lower than expected; |
| • | deposit attrition, operating costs, customer loss and business disruption following our acquisition of CBHI, including, without limitation, difficulties in maintaining relationships with employees, may be greater than expected; |
| • | material differences in the actual financial results of our merger and acquisition activities compared with expectations, such as with respect to the full realization of anticipated cost savings and revenue enhancements within the expected time frame, including as to our acquisition of CBHI; |
| • | our success in continuing to generate new business in our existing markets, as well as their success in identifying and penetrating targeted markets and generating a profit in those markets in a reasonable time; |
| • | our ability to continue to generate investment results for customers and the ability to continue to develop investment products in a manner that meets customers’ needs; |
| • | changes in consumer and business spending, borrowing and savings habits and demand for financial services in the relevant market areas; |
| • | rapid technological developments and changes; |
| • | the effects of competition from other commercial banks, thrifts, mortgage companies, finance companies, credit unions, securities brokerage firms, insurance companies, money-market and mutual funds and other institutions operating in our market areas and elsewhere including institutions operating locally, regionally, nationally and internationally together with such competitors offering banking products and services by mail, telephone, computer and the internet; |
| • | our ability to continue to introduce competitive new products and services on a timely, cost-effective basis and the mix of those products and services; |
| • | containing costs and expenses; |
| • | protection and validity of intellectual property rights; |
| • | reliance on large customers; |
| • | technological, implementation and cost/financial risks in contracts; |
| • | the outcome of pending and future litigation and governmental proceedings; |
| • | any extraordinary events (such as natural disasters, acts of terrorism, wars or political conflicts); |
| • | ability to retain key employees and members of senior management; |
| • | the ability of key third-party providers to perform their obligations to us and our subsidiaries; and |
| • | Our success in managing the risks involved in the foregoing. |
All written or oral forward-looking statements attributed to the Corporation are expressly qualified in their entirety by use of the foregoing cautionary statements. All forward-looking statements included in this Report and the documents incorporated by reference herein are based upon the Corporation’s beliefs and assumptions as of the date of this Report. The Corporation assumes no obligation to update any forward-looking statement. In light of these risks, uncertainties and assumptions, the forward-looking statements discussed in this Report or incorporated documents might not occur and you should not put undue reliance on any forward-looking statements.
Table of Contents
PART I
| ITEM 1. | BUSINESS |
GENERAL
The Bryn Mawr Trust Company (the “Bank”) received its Pennsylvania banking charter in 1889 and is a member of the Federal Reserve System. In 1986, Bryn Mawr Bank Corporation (the “Corporation”) was formed and on January 2, 1987, the Bank became a wholly-owned subsidiary of the Corporation. The Bank and Corporation are headquartered in Bryn Mawr, Pennsylvania, a western suburb of Philadelphia. The Corporation and its subsidiaries offer a full range of personal and business banking services, consumer and commercial loans, equipment leasing, mortgages, insurance and wealth management services, including investment management, trust and estate administration, retirement planning, custody services, and tax planning and preparation from 19 full-service branches, seven Life Care Community offices, five wealth offices and a full-service insurance agency throughout Montgomery, Delaware, Chester and Dauphin counties of Pennsylvania and New Castle county in Delaware. The Corporation’s common stock trades on the NASDAQ Stock Market (“NASDAQ”) under the symbol BMTC.
The goal of the Corporation is to become the preeminent community bank and wealth management organization in the Philadelphia area. The Corporation’s strategy to achieve this goal includes investing in foundational strength to support its growth, leveraging the strength of its brand, building out its core franchise and targeting high potential markets, basing its sales strategy on high performing relationships, concentrating on core product solutions and broadening the scope of its product offerings, using the Corporation’s human resources as a strategic advantage, engaging in inorganic growth by strategically acquiring small to mid-sized banks, insurance brokerages, wealth management companies, and advisory and planning services firms, and lifting out high performing teams where strategically advantageous.
The Corporation operates in a highly competitive market area that includes local, national and regional banks as competitors along with savings banks, credit unions, insurance companies, trust companies, registered investment advisors and mutual fund families. The Corporation and its subsidiaries are regulated by many agencies, including the Securities and Exchange Commission (“SEC”), Federal Deposit Insurance Corporation (“FDIC”), the Federal Reserve and the Pennsylvania and Delaware Departments of Banking.
WEBSITE DISCLOSURES
The Corporation files with the Securities and Exchange Commission (the “SEC”) and makes available, free of charge, through its website, its Annual Report on Form 10-K, Quarterly Reports on Form 10-Q, Current Reports on Form 8-K, and all amendments to those reports as soon as reasonably practicable after the reports are electronically filed with the SEC. These reports can be obtained on the Corporation’s website at www.bmtc.com by following the link, “About Us,” followed by “Investor Relations.” The information contained on or connected to our website is not incorporated by reference into this Annual Report on Form 10-K. Further copies of these reports are located at the SEC’s Public Reference Room at 100 F Street, NE, Washington, D.C. 20549. Information on the operation of the Public Reference Room can be obtained by calling the SEC at 1-800-SEC-0330. The SEC maintains a website that contains reports, proxy and information statements, and other information regarding our filings, at www.sec.gov.
OPERATIONS
| • | Bryn Mawr Bank Corporation |
The Corporation has no active staff as of December 31, 2014. The Corporation is the sole shareholder of the stock of the Bank. Additionally, the Corporation performs several functions including shareholder communications, shareholder recordkeeping, the distribution of dividends and the periodic filing of reports and payment of fees to NASDAQ, the SEC and other regulatory agencies.
1
Table of Contents
As of December 31, 2014, the Corporation and its subsidiaries had 403 full time and 41 part time employees, totaling 424 full time equivalent staff.
ACTIVE SUBSIDIARIES OF THE CORPORATION
The Corporation has three active subsidiaries which provide various services as described below:
| • | Lau Associates |
Lau Associates LLC is a nationally recognized independent, family wealth office serving high net worth individuals and families, with special expertise in planning intergenerational inherited wealth. Lau Associates employed twelve full time employees as of December 31, 2014, and are included in the Corporation’s employment numbers. Lau Associates LLC is a wholly-owned subsidiary of the Corporation.
| • | The Bryn Mawr Trust Company of Delaware |
The Bryn Mawr Trust Company of Delaware (“BMTC-DE”) is a limited purpose trust company located in Greenville, DE and has the ability to be named and serve as a corporate fiduciary under Delaware law. BMTC-DE employed three full-time and two part time employees as of December 31, 2014. BMTC-DE employees are included in the Corporation’s employment numbers. Being able to serve as a corporate fiduciary under Delaware law is advantageous as Delaware statutes are widely recognized as being favorable with respect to the creation of tax-advantaged trust structures, LLCs and related wealth transfer vehicles for families and individuals throughout the United States. BMTC-DE is a wholly-owned subsidiary of the Corporation.
| • | The Bryn Mawr Trust Company |
The Bank is engaged in commercial and retail banking business, providing basic banking services, including the acceptance of demand, time and savings deposits and the origination of commercial, real estate and consumer loans and other extensions of credit including leases. The Bank also provides a full range of wealth management services including trust administration and other related fiduciary services, custody services, investment management and advisory services, employee benefit account and IRA administration, estate settlement, tax services, financial planning and brokerage services. As of December 31, 2014, the market value of assets under management, administration, supervision and asset management/brokerage by the Bank’s Wealth Management Division was $7.699 billion.
The Bank presently has 19 full-service branch offices, seven Life Care Community locations and a full-service insurance agency. See the section titled “COMPETITION” later in this item for additional information.
ACTIVE SUBSIDIARIES OF THE BANK
The Bank has two active subsidiaries providing various services as described below:
| • | Powers Craft Parker & Beard, Inc. |
Powers Craft Parker & Beard, Inc. (“PCPB”) is a wholly-owned subsidiary of the Bank. On October 1, 2014, the Bank acquired 100% of the stock of PCPB and merged the entity with and into its existing full-service insurance agency, Insurance Counsellors of Bryn Mawr, Inc. (“ICBM”). The surviving entity operates under the PCPB name. PCPB is a full-service insurance agency, through which the Bank offers insurance and related products and services to its customer base. This includes casualty, property and allied insurance lines, as well as life insurance, annuities, medical insurance and accident and health insurance for groups and individuals.
As of December 31, 2014, PCPB employed 13 full-time employees, of which eleven were licensed insurance agents. PCPB employees are included in the Corporation’s employment numbers above.
2
Table of Contents
| • | Bryn Mawr Equipment Finance, Inc. |
Bryn Mawr Equipment Finance, Inc. (“BMEF”) is a Delaware corporation registered to do business in Pennsylvania. BMEF is a small-ticket equipment financing company servicing customers nationwide from its Bryn Mawr location. BMEF is a wholly-owned subsidiary of the Bank and had eight employees as of December 31, 2014. BMEF employees are included in the Corporation’s employment numbers above.
BUSINESS COMBINATIONS
The Corporation and its subsidiaries engaged in the following business combinations since January 1, 2009
| • | Powers Craft Parker & Beard, Inc. |
On October 1, 2014, the Bank acquired Powers Craft Parker & Beard, Inc. (“PCPB”), a full-service insurance agency headquartered in Rosemont, Pennsylvania. The consideration paid by the Bank was $7.0 million, of which $5.4 million was paid at closing and three contingent cash payments, each of which shall not exceed $542 thousand, will be payable on each of September 30, 2015, September 30, 2016 and September 30, 2017, based upon revenues for the related periods.
| • | First Bank of Delaware |
On November 17, 2012 the Corporation acquired $70.3 million of deposits, $76.6 million of loans and a branch location from First Bank of Delaware (“FBD”). The cash consideration paid by the Corporation was $10.6 million.
| • | Davidson Trust Company |
On May 25, 2012, the Corporation acquired the Davidson Trust Company (“DTC”) for cash and contingent cash consideration of $10.5 million. The acquisition of DTC increased the Corporation’ wealth management assets under management by approximately $1.0 billion.
| • | Private Wealth Management Group of the Hershey Trust Company |
On May 27, 2011, the Corporation acquired the Private Wealth Management Group of the Hershey Trust Company (“PWMG”) for stock, cash and contingent cash consideration of $18.4 million. The acquisition of DTC increased the Corporation’ wealth management assets under management by approximately $1.1 billion.
| • | First Keystone Financial Inc. |
On July 1, 2010, the merger of First Keystone Financial, Inc. (“FKF”) with and into the Corporation and the two step merger of FKF’s wholly-owned subsidiary, First Keystone Bank with and into the Bank, were completed. The 85% stock and 15% cash transaction was valued at $31.3 million and increased the assets of the Corporation by $490 million.
SOURCES OF THE CORPORATION’S REVENUE
| • | Continuing Operations |
See Note 28, Segment Information, in the Notes to the Consolidated Financial Statements located in this Annual Report on Form 10-K for additional information. The Corporation had no discontinued operations in 2012, 2013 or 2014.
3
Table of Contents
FINANCIAL INFORMATION ABOUT SEGMENTS
The financial information concerning the Corporation’s business segments is incorporated by reference to this Annual Report on Form 10-K in the section captioned Management’s Discussion and Analysis of Financial Condition and Results of Operations (“MD&A”) and Note 28, Segment Information in the Notes to Consolidated Financial Statements.
COMPETITION
The Corporation and its subsidiaries, including the Bank, compete for deposits, loans and wealth management services in Delaware, Montgomery, Chester, Dauphin and Philadelphia counties in Pennsylvania and New Castle County in Delaware. The Corporation has a significant presence in the affluent Philadelphia suburbs along the Route 30 corridor, also known as the “Main Line”. The Corporation has 19 full-service branches and seven Life Care Community offices.
The markets in which the Corporation competes are highly competitive. The Corporation’s direct competition in attracting deposits, loans and wealth management services come from commercial banks, investment management companies, savings and loan associations, and trust companies. The Corporation also competes with credit unions, on-line banking enterprises, consumer finance companies, mortgage companies, insurance companies, stock brokerage companies, investment advisory companies and other entities providing one or more of the services and products offered by the Corporation.
The Corporation is able to compete with the other firms because of its consistent level of customer service, excellent reputation, professional expertise, full product line, and its competitive rates and fees. However, there are several negative factors relative to the Corporation’s ability to compete with large institutions such as its limited number of locations, smaller advertising budget, lower technology budget, ability to spread out fixed costs and other lack-of-scale type disadvantages.
The acquisition of Lau Associates in July 2008 and the formation of BMTC-DE allowed the Corporation to establish a presence in the State of Delaware, where it competes for wealth management business. The November 2012 acquisition of certain loan and deposit accounts and a branch location from First Bank of Delaware enabled the Corporation to further expand its banking segment in the state of Delaware by establishing a full-service branch along the Route 202 corridor.
The acquisition of FKF in 2010 expanded the Corporation’s footprint significantly into Delaware County, Pennsylvania, and the acquisition of PWMG in 2011 enabled the Wealth Management Division to extend into central Pennsylvania by continuing to operate the former PWMG offices located in Hershey, Pennsylvania. The May 2012 acquisition of DTC allowed the Corporation to further expand its range of services and bring deeper market penetration in our core market area. The October 2014 acquisition of PCPB enabled the Bank to expand its range of insurance solutions to both individuals as well as business clients.
In addition, BMEF competes on a national level for its leasing customers.
FINANCIAL INFORMATION ABOUT GEOGRAPHIC AREAS
The geographic information required by Item 101(d) of Regulation S-K promulgated under the Securities Exchange Act of 1934, as amended, is impracticable for the Corporation to calculate; however, the Corporation does not believe that a material amount of revenues in any of the last three years was attributable to customers outside of the United States, nor does it believe that a material amount of its long-lived assets, in any of the past three years, was located outside of the United States.
4
Table of Contents
SUPERVISION AND REGULATION
The Corporation and its subsidiaries, including the Bank, are subject to extensive regulation under both federal and state law. To the extent that the following information describes statutory provisions and regulations which apply to the Corporation and its subsidiaries, it is qualified in its entirety by reference to those statutory provisions and regulations:
| • | Bank Holding Company Regulation |
The Corporation, as a bank holding company, is regulated under the Bank Holding Company Act of 1956, as amended (the “Act”). The Act limits the business of bank holding companies to banking, managing or controlling banks, performing certain servicing activities for subsidiaries and engaging in such other activities as the Federal Reserve Board may determine to be closely related to banking. The Corporation and its non-bank subsidiaries are subject to the supervision of the Federal Reserve Board and the Corporation is required to file, with the Federal Reserve Board, an annual report and such additional information as the Federal Reserve Board may require pursuant to the Act and the regulations which implement the Act. The Federal Reserve Board also conducts inspections of the Corporation and each of its non-banking subsidiaries.
The Act requires each bank holding company to obtain prior approval by the Federal Reserve Board before it may acquire (i) direct or indirect ownership or control of more than 5% of the voting shares of any company, including another bank holding company or a bank, unless it already owns a majority of such voting shares, or (ii) all, or substantially all, of the assets of any company.
The Act also prohibits a bank holding company from engaging in, or from acquiring direct or indirect ownership or control of more than 5% of the voting shares of any company engaged in non-banking activities unless the Federal Reserve Board, by order or regulation, has found such activities to be so closely related to banking or to managing or controlling banks as to be appropriate. The Federal Reserve Board has, by regulation, determined that certain activities are so closely related to banking or to managing or controlling banks, so as to permit bank holding companies, such as the Corporation, and its subsidiaries formed for such purposes, to engage in such activities, subject to obtaining the Federal Reserve Board’s approval in certain cases.
Under the Act, a bank holding company and its subsidiaries are prohibited from engaging in certain tie-in arrangements in connection with any extension or provision of credit, lease or sale of property or furnishing any service to a customer on the condition that the customer provide additional credit or service to the bank, to its bank holding company or any other subsidiaries of its bank holding company or on the condition that the customer refrain from obtaining credit or service from a competitor of its bank holding company. Further, the Bank, as a subsidiary bank of a bank holding company, such as the Corporation, is subject to certain restrictions on any extensions of credit it provides to the Corporation or any of its non-bank subsidiaries, investments in the stock or securities thereof, and on the taking of such stock or securities as collateral for loans to any borrower.
In addition, the Federal Reserve Board may issue cease-and-desist orders against bank holding companies and non-bank subsidiaries to stop actions believed to present a serious threat to a subsidiary bank. The Federal Reserve Board also regulates certain debt obligations and changes in control of bank holding companies.
Under Federal Reserve Board policy, a bank holding company is expected to act as a source of financial strength to each of its subsidiary banks and to commit resources, including capital funds during periods of financial stress, to support each such bank. Consistent with its “source of strength” policy for subsidiary banks, the Federal Reserve Board has stated that, as a matter of prudent banking, a bank holding company generally should not maintain a rate of cash dividends unless its net income available to common shareholders has been sufficient to fund fully the dividends, and the prospective rate of earnings retention appears to be consistent with the company’s capital needs, asset quality and overall financial condition.
Federal law also grants to federal banking agencies the power to issue cease and desist orders when a depository institution or a bank holding company or an officer or director thereof is engaged in or is about to
5
Table of Contents
engage in unsafe and unsound practices. The Federal Reserve Board may require a bank holding company, such as the Corporation, to discontinue certain of its activities or activities of its other subsidiaries, other than the Bank, or divest itself of such subsidiaries if such activities cause serious risk to the Bank and are inconsistent with the Bank Holding Company Act or other applicable federal banking laws.
| • | Federal Reserve Board and Pennsylvania Department of Banking and Securities Regulations |
The Corporation’s Pennsylvania state chartered bank, The Bryn Mawr Trust Company, is regulated and supervised by the Pennsylvania Department of Banking and Securities (the “Department of Banking”) and subject to regulation by The Federal Reserve Board and the FDIC. The Department of Banking and the Federal Reserve Board regularly examine the Bank’s reserves, loans, investments, management practices and other aspects of its operations and the Bank must furnish periodic reports to these agencies. The Bank is a member of the Federal Reserve System.
The Bank’s operations are subject to certain requirements and restrictions under federal and state laws, including requirements to maintain reserves against deposits, limitations on the interest rates that may be paid on certain types of deposits, restrictions on the types and amounts of loans that may be granted and the interest that may be charged thereon, limitations on the types of investments that may be made and the types of services which may be offered. Various consumer laws and regulations also affect the operations of the Bank. These regulations and laws are intended primarily for the protection of the Bank’s depositors and customers rather than holders of the Corporation’s stock.
The regulations of the Department of Banking restrict the amount of dividends that can be paid to the Corporation by the Bank. Payment of dividends is restricted to the amount of the Bank’s 2015 net income plus its net retained earnings for the previous two years. As of December 31, 2014, this amount was approximately $32.4 million plus net income to be earned in 2015. However, the amount of dividends paid by the Bank cannot reduce capital levels below levels that would cause the Bank to be less than adequately capitalized. The payment of dividends by the Bank to the Corporation is the source on which the Corporation currently depends to pay dividends to its shareholders.
As a bank incorporated under and subject to Pennsylvania banking laws and insured by the FDIC, the Bank must obtain the prior approval of the Department of Banking and the Federal Reserve Board before establishing a new branch banking office. Depending on the type of bank or financial institution, a merger of the Bank with another institution is subject to the prior approval of one or more of the following: the Department of Banking, the FDIC, the Federal Reserve Board and the Office of the Comptroller of the Currency and any other regulatory agencies having primary supervisory authority over any other party to the merger. An approval of a merger by the appropriate bank regulatory agency would depend upon several factors, including whether the merged institution is a federally insured state bank, a member of the Federal Reserve System, or a national bank. Additionally, any new branch expansion or merger must comply with branching restrictions provided by state law. The Pennsylvania Banking Code permits Pennsylvania banks to establish branches anywhere in the state.
On October 24, 2012, Pennsylvania enacted three new laws known as the “Banking Law Modernization Package,” all of which became effective on December 24, 2012. The intended goal of the new law, which applies to the Bank, is to modernize Pennsylvania’s banking laws and to reduce regulatory burden at the state level where possible, given the increased regulatory demands at the federal level as described below.
The new law also permits banks to disclose formal enforcement actions initiated by the Department of Banking, clarifies that the Department of Banking has examination and enforcement authority over subsidiaries as well as affiliates of regulated banks and bolsters the Department of Banking’s enforcement authority over its regulated institutions by clarifying its ability to remove directors, officers and employees from institutions for violations of laws or orders or for any unsafe or unsound practice or breach of fiduciary duty. Changes to existing law also allow the Department of Banking to assess civil money penalties of up to $25,000 per violation.
6
Table of Contents
The new law also sets a new standard of care for bank officers and directors, applying the same standard that exists for non-banking corporations in Pennsylvania. The standard is one of performing duties in good faith, in a manner reasonably believed to be in the best interests of the institutions and with such care, including reasonable inquiry, skill and diligence, as a person of ordinary prudence would use under similar circumstances. Directors may rely in good faith on information, opinions and reports provided by officers, employees, attorneys, accountants, or committees of the board, and an officer may not be held liable simply because he or she served as an officer of the institution.
| • | Deposit Insurance Assessments |
The deposits of the Bank are insured by the FDIC up to the limits set forth under applicable law and are subject to deposit insurance premium assessments. The FDIC imposes a risk based deposit premium assessment system, under which the amount of FDIC assessments paid by an individual insured depository institution, such as the Bank, is based on the level of risk incurred in its activities.
In addition to deposit insurance assessments, banks are subject to assessments to pay the interest on Financing Corporation bonds. The Financing Corporation was created by Congress to issue bonds to finance the resolution of failed thrift institutions. The FDIC sets the Financing Corporation assessment rate every quarter. The Financing Corporation assessment for the fourth quarter of 2014 was an annual rate of 0.60 basis points, which resulted in a $115 thousand FICO assessment payment by the Bank in 2014.
| • | Government Monetary Policies |
The monetary and fiscal policies of the Federal Reserve Board and the other regulatory agencies have had, and will probably continue to have, an important impact on the operating results of the Bank through their power to implement national monetary policy in order to, among other things, curb inflation or combat a recession. The monetary policies of the Federal Reserve Board may have a major effect upon the levels of the Bank’s loans, investments and deposits through the Federal Reserve Board’s open market operations in United States government securities, through its regulation of, among other things, the discount rate on borrowing of depository institutions, and the reserve requirements against depository institution deposits. It is not possible to predict the nature and impact of future changes in monetary and fiscal policies.
The earnings of the Bank and, therefore, of the Corporation are affected by domestic economic conditions, particularly those conditions in the trade area as well as the monetary and fiscal policies of the United States government and its agencies.
| • | Safety and Soundness |
The Federal Reserve Board also has authority to prohibit a bank holding company from engaging in any activity or transaction deemed by the Federal Reserve Board to be an unsafe or unsound practice. The payment of dividends could, depending upon the financial condition of the Bank or Corporation, be such an unsafe or unsound practice and the regulatory agencies have indicated their view that it generally would be an unsafe and unsound practice to pay dividends except out of current operating earnings. The ability of the Bank to pay dividends in the future is presently and could be further influenced, among other things, by applicable capital guidelines discussed below or by bank regulatory and supervisory policies. The ability of the Bank to make funds available to the Corporation is also subject to restrictions imposed by federal law. The amount of other payments by the Bank to the Corporation is subject to review by regulatory authorities having appropriate authority over the Bank or Corporation and to certain legal limitations.
| • | Capital Adequacy |
Federal and state banking laws impose on banks certain minimum requirements for capital adequacy. Federal banking agencies have issued certain “risk-based capital” guidelines, and certain “leverage” requirements on member banks such as the Bank. By policy statement, the Banking Department also imposes those
7
Table of Contents
requirements on the Bank. Banking regulators have authority to require higher minimum capital ratios for an individual bank or bank holding company in view of its circumstances.
Minimum Capital Ratios. The risk-based guidelines require all banks to maintain two “risk-weighted assets” ratios. The first is a minimum ratio of total capital (“Tier 1” and “Tier 2” capital) to risk-weighted assets equal to 8.00%; the second is a minimum ratio of “Tier 1” capital to risk-weighted assets equal to 4.00%. Assets are assigned to five risk categories, with higher levels of capital being required for the categories perceived as representing greater risk. In making the calculation, certain intangible assets must be deducted from the capital base. The risk-based capital rules are designed to make regulatory capital requirements more sensitive to differences in risk profiles among banks and bank holding companies and to minimize disincentives for holding liquid assets.
The risk-based capital rules also account for interest rate risk. Institutions with interest rate risk exposure above a normal level would be required to hold extra capital in proportion to that risk. A bank’s exposure to declines in the economic value of its capital due to changes in interest rates is a factor that the banking agencies will consider in evaluating a bank’s capital adequacy. The rule does not codify an explicit minimum capital charge for interest rate risk. The Corporation currently monitors and manages its assets and liabilities for interest rate risk, and believes its interest rate risk practices are prudent and are in-line with industry standards. The Corporation is not aware of any new or proposed rules or standards relating to interest rate risk that would materially adversely affect our operations.
The “leverage” ratio rules require banks which are rated the highest in the composite areas of capital, asset quality, management, earnings, liquidity and sensitivity to market risk to maintain a ratio of “Tier 1” capital to “adjusted total assets” (equal to the bank’s average total assets as stated in its most recent quarterly Call Report filed with its primary federal banking regulator, minus end-of-quarter intangible assets that are deducted from Tier 1 capital) of not less than 3.00%. For banks which are not the most highly rated, the minimum “leverage” ratio will range from 4.00% to 5.00%, or higher at the discretion of the bank’s primary federal regulator, and is required to be at a level commensurate with the nature of the level of risk of the bank’s condition and activities.
For purposes of the capital requirements, “Tier 1” or “core” capital is defined to include common stockholders’ equity and certain noncumulative perpetual preferred stock and related surplus. “Tier 2” or “qualifying supplementary” capital is defined to include a bank’s allowance for loan and lease losses up to 1.25% of risk-weighted assets, plus certain types of preferred stock and related surplus, certain “hybrid capital instruments” and certain term subordinated debt instruments.
On July 2, 2013, the Federal Reserve approved final rules that substantially amend the regulatory risk-based capital rules applicable to the Corporation and the Bank. The FDIC and the OCC have subsequently approved these rules. The final rules were adopted following the issuance of proposed rules by the Federal Reserve in June 2012 and implement the “Basel III” regulatory capital reforms and changes required by the Dodd-Frank Act. “Basel III” refers to two consultative documents released by the Basel Committee on Banking Supervision in December 2009, the rules text released in December 2010, and loss absorbency rules issued in January 2011, which include significant changes to bank capital, leverage and liquidity requirements.
The rules include new risk-based capital and leverage ratios, which will be phased in from 2015 to 2019, and will refine the definition of what constitutes “capital” for purposes of calculating those ratios. The new minimum capital level requirements applicable to the Corporation and the Bank under the final rules are:
| (i) | a new common equity Tier 1 capital ratio of 4.5%; |
| (ii) | a Tier 1 capital ratio of 6% (increased from 4%); |
| (iii) | a total capital ratio of 8% (unchanged from current rules); and |
| (iv) | a Tier 1 leverage ratio of 4% for all institutions. |
The final rules also establish a “capital conservation buffer” above the new regulatory minimum capital requirements, which must consist entirely of common equity Tier 1 capital.
8
Table of Contents
The capital conservation buffer will be phased-in over four years beginning on January 1, 2016, as follows: the maximum buffer will be 0.625% of risk-weighted assets for 2016, 1.25% for 2017, 1.875% for 2018, and 2.5% for 2019 and thereafter. This will result in the following minimum ratios beginning in 2019:
| (i) | a common equity Tier 1 capital ratio of 7.0%; |
| (ii) | a Tier 1 capital ratio of 8.5%; and |
| (iii) | a total capital ratio of 10.5%. |
Under the final rules, institutions are subject to limitations on paying dividends, engaging in share repurchases, and paying discretionary bonuses if its capital level falls below the buffer amount. These limitations establish a maximum percentage of eligible retained income that could be utilized for such actions.
Basel III provided discretion for regulators to impose an additional buffer, the “countercyclical buffer,” of up to 2.5% of common equity Tier 1 capital to take into account the macro-financial environment and periods of excessive credit growth. However, the final rules permit the countercyclical buffer to be applied only to “advanced approach banks” ( i.e. , banks with $250 billion or more in total assets or $10 billion or more in total foreign exposures), which currently excludes the Corporation and the Bank. The final rules also implement revisions and clarifications consistent with Basel III regarding the various components of Tier 1 capital, including common equity, unrealized gains and losses, as well as certain instruments that will no longer qualify as Tier 1 capital, some of which will be phased out over time. However, the final rules provide that small depository institution holding companies with less than $15 billion in total assets as of December 31, 2009 (which includes the Corporation) will be able to permanently include non-qualifying instruments that were issued and included in Tier 1 or Tier 2 capital prior to May 19, 2010 in additional Tier 1 or Tier 2 capital until they redeem such instruments or until the instruments mature.
In addition, the final rules provide for smaller banking institutions (less than $250 billion in consolidated assets) an opportunity to make a one-time election to opt out of including most elements of accumulated other comprehensive income in regulatory capital. Importantly, the opt-out excludes from regulatory capital not only unrealized gains and losses on available-for-sale debt securities, but also accumulated net gains and losses on cash-flow hedges and amounts attributable to defined benefit postretirement plans. The opt-out election must be elected on the first Call Report filed after January 1, 2015.
The final rules also contain revisions to the prompt corrective action framework, which is designed to place restrictions on insured depository institutions, including the Bank, if their capital levels begin to show signs of weakness. These revisions took effect January 1, 2015. Under the prompt corrective action requirements, which are designed to complement the capital conservation buffer, insured depository institutions will be required to meet the following increased capital level requirements in order to qualify as “well capitalized:”
| (i) | a new common equity Tier 1 capital ratio of 6.5%; |
| (ii) | a Tier 1 capital ratio of 8% (increased from 6%); |
| (iii) | a total capital ratio of 10% (unchanged from current rules); and |
| (iv) | a Tier 1 leverage ratio of 5% (increased from 4%). |
The final rules set forth certain changes for the calculation of risk-weighted assets, which we are required to utilize as of January 1, 2015. The standardized approach final rule utilizes an increased number of credit risk exposure categories and risk weights, and also addresses:
| (i) | an alternative standard of creditworthiness consistent with Section 939A of the Dodd-Frank Act; |
| (ii) | revisions to recognition of credit risk mitigation; |
| (iii) | rules for risk weighting of equity exposures and past due loans; |
9
Table of Contents
| (iv) | revised capital treatment for derivatives and repo-style transactions; and disclosure requirements for top-tier banking organizations with $50 billion or more in total assets that are not subject to the “advance approach rules” that apply to banks with greater than $250 billion in consolidated assets. |
| • | Prompt Corrective Action |
Federal banking law mandates certain “prompt corrective actions,” which Federal banking agencies are required to take, and certain actions which they have discretion to take, based upon the capital category into which a Federally regulated depository institution falls. Regulations have been adopted by the Federal bank regulatory agencies setting forth detailed procedures and criteria for implementing prompt corrective action in the case of any institution that is not adequately capitalized. Under the rules, an institution will be deemed to be “adequately capitalized” or better if it exceeds the minimum Federal regulatory capital requirements. However, it will be deemed “undercapitalized” if it fails to meet the minimum capital requirements, “significantly undercapitalized” if it has a total risk-based capital ratio that is less than 6.0%, a Tier 1 risk-based capital ratio that is less than 3.0%, or a leverage ratio that is less than 3.0%, and “critically undercapitalized” if the institution has a ratio of tangible equity to total assets that is equal to or less than 2.0%. The rules require an undercapitalized institution to file a written capital restoration plan, along with a performance guaranty by its holding company or a third party. In addition, an undercapitalized institution becomes subject to certain automatic restrictions including a prohibition on the payment of dividends, a limitation on asset growth and expansion, and in certain cases, a limitation on the payment of bonuses or raises to senior executive officers, and a prohibition on the payment of certain “management fees” to any “controlling person”. Institutions that are classified as undercapitalized are also subject to certain additional supervisory actions, including increased reporting burdens and regulatory monitoring, a limitation on the institution’s ability to make acquisitions, open new branch offices, or engage in new lines of business, obligations to raise additional capital, restrictions on transactions with affiliates, and restrictions on interest rates paid by the institution on deposits. In certain cases, bank regulatory agencies may require replacement of senior executive officers or directors, or sale of the institution to a willing purchaser. If an institution is deemed to be “critically undercapitalized” and continues in that category for four quarters, the statute requires, with certain narrowly limited exceptions, that the institution be placed in receivership. The Bank is currently regarded as “well capitalized” for regulatory capital purposes. See Note 25 in the Notes to Consolidated Financial Statements in this Annual Report on Form 10-K for more information regarding the Bank’s and Corporation’s regulatory capital ratios.
| • | Gramm-Leach Bliley Act |
The Gramm-Leach-Bliley Act (“GLB Act”) repealed provisions of the Glass-Steagall Act, which prohibited commercial banks and securities firms from affiliating with each other and engaging in each other’s businesses. Thus, many of the barriers prohibiting affiliations between commercial banks and securities firms have been eliminated.
The GLB Act amended the Glass-Steagall Act to allow new “financial holding companies” (“FHC”) to offer banking, insurance, securities and other financial products to consumers. Specifically, the GLB Act amends section 4 of the Act in order to provide for a framework for the engagement in new financial activities. A bank holding company may elect to become a financial holding company if all its subsidiary depository institutions are well-capitalized and well-managed. If these requirements are met, a bank holding company may file a certification to that effect with the Federal Reserve Board and declare that it elects to become a FHC. After the certification and declaration is filed, the FHC may engage either de novo or through an acquisition in any activity that has been determined by the Federal Reserve Board to be financial in nature or incidental to such financial activity. Bank holding companies may engage in financial activities without prior notice to the Federal Reserve Board if those activities qualify under the new list in section 4(k) of the Act. However, notice must be given to the Federal Reserve Board, within 30 days after the FHC has commenced one or more of the financial activities. The Corporation has not elected to become an FHC at this time.
10
Table of Contents
Under the GLB Act, a bank subject to various requirements is permitted to engage through “financial subsidiaries” in certain financial activities permissible for affiliates of FHC’s. However, to be able to engage in such activities a bank must continue to be “well-capitalized” and well-managed and receive at least a “satisfactory” rating in its most recent Community Reinvestment Act examination.
| • | Community Reinvestment Act |
The Community Reinvestment Act requires banks to help serve the credit needs of their communities, including providing credit to low and moderate income individuals and areas. Should the Bank fail to serve adequately the communities it serves, potential penalties may include regulatory denials to expand branches, relocate, add subsidiaries and affiliates, expand into new financial activities and merge with or purchase other financial institutions.
| • | Privacy of Consumer Financial Information |
The GLB Act also contains a provision designed to protect the privacy of each consumer’s financial information in a financial institution. Pursuant to the requirements of the GLB Act, the financial institution regulators have promulgated final regulations intended to better protect the privacy of a consumer’s financial information maintained in financial institutions. The regulations are designed to prevent financial institutions, such as the Bank, from disclosing a consumer’s nonpublic personal information to third parties that are not affiliated with the financial institution.
However, financial institutions can share a customer’s personal information or information about business and corporations with their affiliated companies. The regulations also provide that financial institutions can disclose nonpublic personal information to nonaffiliated third parties for marketing purposes but the financial institution must provide a description of its privacy policies to the consumers and give the consumers an opportunity to opt-out of such disclosure and, thus, prevent disclosure by the financial institution of the consumer’s nonpublic personal information to nonaffiliated third parties.
These privacy regulations will affect how consumer’s information is transmitted through diversified financial companies and conveyed to outside vendors. The Bank does not believe the privacy regulations will have a material adverse impact on its operations in the near term.
| • | Consumer Protection Rules – Sale of Insurance Products |
In addition, as mandated by the GLB Act, the regulators have published consumer protection rules which apply to the retail sales practices, solicitation, advertising or offers of insurance products, including annuities, by depository institutions such as banks and their subsidiaries.
The rules provide that before the sale of insurance or annuity products can be completed, disclosures must be made that state (i) such insurance products are not deposits or other obligations of or guaranteed by the FDIC or any other agency of the United States, the Bank or its affiliates; and (ii) in the case of an insurance product that involves an investment risk, including an annuity, that there is an investment risk involved with the product, including a possible loss of value.
The rules also provide that the Bank may not condition an extension of credit on the consumer’s purchase of an insurance product or annuity from the Bank or its affiliates or on the consumer’s agreement not to obtain or a prohibition on the consumer obtaining an insurance product or annuity from an unaffiliated entity.
The rules also require formal acknowledgement from the consumer that such disclosures have been received. In addition, to the extent practical, the Bank must keep insurance and annuity sales activities physically separate from the areas where retail banking transactions are routinely accepted from the general public.
11
Table of Contents
| • | Sarbanes-Oxley Act |
The Sarbanes-Oxley Act of 2002 (the “Sarbanes-Oxley Act”) addresses, among other matters, increased disclosures; audit committees; certification of financial statements by the principal executive officer and the principal financial officer; evaluation by management of our disclosure controls and procedures and our internal control over financial reporting; auditor reports on our internal control over financial reporting; forfeiture of bonuses and profits made by directors and senior officers in the twelve (12) month period covered by restated financial statements; a prohibition on insider trading during Corporation stock blackout periods; disclosure of off-balance sheet transactions; a prohibition applicable to companies, other than federally insured financial institutions, on personal loans to their directors and officers; expedited filing of reports concerning stock transactions by a company’s directors and executive officers; the formation of a public accounting oversight board; auditor independence; and increased criminal penalties for violation of certain securities laws.
| • | Patriot Act of 2001 |
The Patriot Act of 2001, which was enacted in the wake of the September 11, 2001 attacks, includes provisions designed to combat international money laundering and advance the U.S. government’s war against terrorism. The Patriot Act and the regulations which implement it contain many obligations which must be satisfied by financial institutions, including the Bank. Those regulations impose obligations on financial institutions, such as the Bank, to maintain appropriate policies, procedures and controls to detect, prevent and report money laundering and terrorist financing and to verify the identity of their customers. The failure of a financial institution to maintain and implement adequate programs to combat money laundering and terrorist financing could have serious legal and reputational consequences for the financial institution.
| • | Government Policies and Future Legislation |
As the enactment of the GLB Act and the Sarbanes-Oxley Act confirm, from time to time various laws are passed in the United States Congress as well as the Pennsylvania legislature and by various bank regulatory authorities which would alter the powers of, and place restrictions on, different types of banks and financial organizations. It is impossible to predict whether any potential legislation or regulations will be adopted and the impact, if any, of such adoption on the business of the Corporation or its subsidiaries, especially the Bank.
| • | Dodd-Frank Wall Street Reform and Consumer Protection Act |
The federal government is considering a variety of reforms related to banking and the financial industry. Among those reforms is the Dodd-Frank Wall Street Reform and Consumer Protection Act (the “Dodd-Frank Act”), that was enacted by Congress on July 15, 2010, and was signed into law by President Obama on July 21, 2010. The Dodd-Frank Act is intended to promote financial stability in the U.S., reduce the risk of bailouts and protect against abusive financial services practices by improving accountability and transparency in the financial system and ending the concept of “too big to fail” institutions by giving regulators the ability to liquidate large financial institutions. It is the broadest overhaul of the U.S. financial system since the Great Depression and the overall impact on the Corporation and its subsidiaries is unknown at this time.
The Dodd-Frank Act has significantly changed the current bank regulatory structure and will affect into the immediate future the lending and investment activities and general operations of depository institutions and their holding companies.
The Dodd-Frank Act requires the FRB to establish minimum consolidated capital requirements for bank holding companies that are as stringent as those required for insured depository institutions; the components of Tier 1 capital would be restricted to capital instruments that are currently considered to be Tier 1 capital for insured depository institutions. In addition, the proceeds of trust preferred securities are excluded from Tier 1 capital unless (i) such securities are issued by bank holding companies with assets of less than $500 million or (ii) such securities were issued prior to May 19, 2010 by bank or savings and loan holding companies with less than $15 billion of assets.
12
Table of Contents
The Dodd-Frank Act also created a new Consumer Financial Protection Bureau with extensive powers to implement and enforce consumer protection laws. The Consumer Financial Protection Bureau has broad rulemaking authority for a wide range of consumer protection laws that apply to all banks, among other things, including the authority to prohibit “unfair, deceptive or abusive” acts and practices. However, institutions of less than $10 billion in assets, such as the Bank, will continue to be examined for compliance with consumer protection and fair lending laws and regulations by, and be subject to the enforcement authority of, their prudential regulators.
The Dodd-Frank Act made many other changes in banking regulation. Those include allowing depository institutions, for the first time, to pay interest on business checking accounts, requiring originators of securitized loans to retain a percentage of the risk for transferred loans, establishing regulatory rate-setting for certain debit card interchange fees and establishing a number of reforms for mortgage originations. Effective October 1, 2011, the debit-card interchange fee was capped at $0.21 per transaction, plus an additional 5 basis point charge to cover fraud losses. These fees are much lower than the current market rates. Although the regulation only impacts banks with assets above $10.0 billion, we believe that the provisions could result in a reduction in interchange revenue in the future.
The Dodd-Frank Act also broadened the base for FDIC insurance assessments. The FDIC was required to promulgate rules revising its assessment system so that it is based on the average consolidated total assets less tangible equity capital of an insured institution instead of deposits. That rule took effect April 1, 2011. The Dodd-Frank Act also permanently increased the maximum amount of deposit insurance for banks, savings institutions and credit unions to $250,000 per depositor, retroactive to January 1, 2008.
All of the provisions of the Dodd-Frank Act are not yet effective, and the Dodd-Frank Act requires various federal agencies to promulgate numerous and extensive implementing regulations over the next several years. It is therefore difficult to predict at this time what impact the Dodd-Frank Act and implementing regulations will have on the Corporation and the Bank. The changes resulting from the Dodd-Frank Act could limit our business activities, require changes to certain of our business practices, impose upon us more stringent capital, liquidity and leverage requirements or otherwise materially and adversely affect us. These changes may also require us to invest significant management attention and resources to evaluate and make any changes necessary to comply with new statutory and regulatory requirements. Failure to comply with the new requirements could also materially and adversely affect us.
| ITEM 1A. | RISK FACTORS |
Investment in the Corporation’s Common Stock involves risk. The market price of the Corporation’s Common Stock may fluctuate significantly in response to a number of factors including those that follow. The following list contains certain risks that may be unique to the Corporation and to the banking industry. The following list of risks should not be viewed as an all-inclusive list or in any particular order.
Increases in FDIC insurance premiums may adversely affect the Corporation’s earnings
In response to the impact of economic conditions since 2008 on banks generally and on the FDIC deposit insurance fund, the FDIC changed its risk-based assessment system and increased base assessment rates. On November 12, 2009, the FDIC adopted a rule requiring banks to prepay three years’ worth of premiums to replenish the depleted insurance fund. In February 2011, as required under the Dodd-Frank Act, the FDIC issued a ruling pursuant to which the assessment base against which FDIC assessments for deposit insurance are made will change. Instead of FDIC insurance assessments being based upon an insured bank’s deposits, FDIC insurance assessments are now generally based on an insured bank’s total average assets minus average tangible equity. With this change, the Corporation expects that its overall FDIC insurance cost will decline. However, a change in the risk categories applicable to the Corporation’s bank subsidiaries, further adjustments to base assessment rates and any special assessments could have a material adverse effect on the Corporation.
13
Table of Contents
The Dodd-Frank Act also requires that the FDIC take steps necessary to increase the level of the Deposit Insurance Fund to 1.35% of total insured deposits by September 30, 2020. In October 2010, the FDIC adopted a Restoration Plan to achieve that goal. Certain elements of the Restoration Plan are left to future FDIC rulemaking, as are the potential for increases to the assessment rates, which may become necessary to achieve the targeted level of the DIF. Future FDIC rulemaking in this regard may have a material adverse effect on the Corporation.
The steadiness of other financial institutions could have detrimental effects on our routine funding transactions
Routine funding transactions may be adversely affected by the actions and soundness of other financial institutions. Financial service institutions are interrelated as a result of trading, clearing, lending, borrowing or other relationships. Transactions are executed on a daily basis with different industries and counterparties, and routinely executed with counterparties in the financial services industry. As a result, a rumor, default or failures within the financial services industry could lead to market-wide liquidity problems which in turn could materially impact the financial condition of the Corporation.
The Corporation may need to raise additional capital in the future and such capital may not be available when needed or at all
We are required by federal and state regulatory authorities to maintain adequate levels of capital to support our operations and may need to raise additional capital in the future to provide us with sufficient capital resources to meet our regulatory and business needs. We cannot assure you that such capital will be available to us on acceptable terms or at all. If the Corporation is unable to generate sufficient additional capital though its earnings, or other sources, it would be necessary to slow earning asset growth and or pass up possible acquisition opportunities, which may result in a reduction of future net income growth. Further, an inability to raise additional capital on acceptable terms when needed could have a material adverse effect on our business, financial condition and results of operations.
Financial turmoil may increase our other-than-temporary-impairment (“OTTI”) charges
If the Corporation incurs OTTI charges that result in its falling below the “well capitalized” regulatory requirement, the it may need to raise additional capital.
If sufficient wholesale funding to support earning asset growth is unavailable, the Corporation’s net income may decrease
The Corporation recognizes the need to grow both wholesale and non-wholesale funding sources to support earning asset growth and to provide appropriate liquidity. The Corporation’s asset growth over the past few years has been funded with various forms of wholesale funding which is defined as wholesale deposits (primarily certificates of deposit) and borrowed funds (FHLB advances, Federal advances and Federal fund line borrowings). Wholesale funding at December 31, 2014 represented approximately 21.5% of total funding compared to 16.2% at December 31, 2013 and 12.1% at December 31, 2012. Wholesale funding is subject to certain practical limits such as the FHLB’s Maximum Borrowing Capacity and the Corporation’s liquidity targets. Additionally, regulators might consider wholesale funding beyond certain points to be imprudent and might suggest that future asset growth be reduced or halted.
In the absence of wholesale funding sources, the Corporation might need to reduce earning asset growth through the reduction of current production, sale of assets, and/or the participating out of future and current loans or leases. This in turn might reduce future net income of the Corporation.
The amount loaned to us is generally dependent on the value of the collateral pledged and the Corporation’s financial condition. These lenders could reduce the percentages loaned against various collateral categories, eliminate certain types of collateral and otherwise modify or even terminate their loan programs, particularly to the extent they are required to do so because of capital adequacy or other balance sheet concerns, or if disruptions
14
Table of Contents
in the capital markets occur. Any change or termination of our borrowings from the FHLB, the Federal Reserve or correspondent banks may have an adverse effect on our liquidity and profitability.
The capital and credit markets are volatile and could cause the price of our stock to fluctuate
The capital and credit markets periodically experience volatility. In some cases, the markets may produce downward pressure on stock prices and credit availability for certain issuers seemingly without regard to those issuers’ underlying financial strength. Market volatility may result in a material adverse effect on our business, financial condition and results of operations and/or our ability to access capital. Several factors could cause the market price for our common stock to fluctuate substantially in the future, including without limitation:
| • | announcements of developments related to our business; |
| • | fluctuations in our results of operations; |
| • | sales of substantial amounts of our securities into the marketplace; |
| • | general conditions in our markets or the worldwide economy; |
| • | a shortfall in revenues or earnings compared to securities analysts’ expectations; |
| • | changes in analysts’ recommendations or projections; |
| • | our announcement of new acquisitions or other projects; and |
| • | Regulatory changes we are required to comply with; |
A return to recessionary conditions or status quo in the current economic environment could result in increases in our level of non-performing loans and/or reduce demand for our products and services, which would lead to lower revenue, higher loan losses and lower earnings.
Falling home prices and sharply reduced sales volumes, along with the collapse of the United States’ subprime mortgage industry in 2008 that followed a national home price peak in mid-2006, significantly contributed to a recession that officially lasted until June 2009, although the effects continued thereafter. Dramatic declines in real estate values and high levels of foreclosures resulted in significant asset write-downs by financial institutions, which caused many financial institutions to seek additional capital, to merge with other institutions and, in some cases, to fail. A return of recessionary conditions and/or negative developments in the domestic and international credit markets may significantly affect the markets in which we do business, the value of our loans and investments, and our ongoing operations, costs and profitability. Declines in real estate values and sales volumes and a return to high unemployment levels may result in higher than expected loan delinquencies, increases in our levels of nonperforming and classified assets and a decline in demand for our products and services. These negative events may cause us to incur losses and may adversely affect our capital, liquidity, and financial condition.
Previously enacted and potential future legislation, including legislation to reform the U.S. financial regulatory system, could adversely affect our business
Market conditions have resulted in creation of various programs by the United States Congress, the Treasury, the Federal Reserve and the FDIC that were designed to enhance market liquidity and bank capital. As these programs expire, are withdrawn or reduced, the impact on the financial markets, banks in general and their customers is unknown. This could have the effect of, among other things, reducing liquidity, raising interest rates, reducing fee revenue, limiting the ability to raise capital, all of which could have an adverse impact on the financial condition of the Bank and the Corporation.
Additionally, the federal government has passed a variety of other reforms related to banking and the financial industry including, without limitation, the Dodd-Frank Act. The Dodd-Frank Act imposes significant regulatory and compliance changes. Effects of the Dodd-Frank Act on our business include:
| • | changes to regulatory capital requirements; |
15
Table of Contents
| • | exclusion of hybrid securities, including trust preferred securities, issued on or after May 19, 2010 from tier 1 capital; |
| • | creation of new government regulatory agencies (such as the Financial Stability Oversight Council, which will oversee systemic risk, and the Consumer Financial Protection Bureau, which will develop and enforce rules for bank and non-bank providers of consumer financial products); |
| • | potential limitations on federal preemption; |
| • | changes to deposit insurance assessments; |
| • | regulation of debit interchange fees we earn; |
| • | changes in retail banking regulations, including potential limitations on certain fees we may charge; and |
| • | changes in regulation of consumer mortgage loan origination and risk retention. |
In addition, the Dodd-Frank Act restricts the ability of banks to engage in certain proprietary trading or to sponsor or invest in private equity or hedge funds, commonly referred to as the Volker Rule. The Dodd-Frank Act also contains provisions designed to limit the ability of insured depository institutions, their holding companies and their affiliates to conduct certain swaps and derivatives activities and to take certain principal positions in financial instruments.
Some provisions of the Dodd-Frank Act became effective immediately upon its enactment. Many provisions, however, will require regulations to be promulgated by various federal agencies in order to be implemented, some of which have been proposed by the applicable federal agencies. The provisions of the Dodd-Frank Act may have unintended effects, which will not be clear until implementation. The changes resulting from the Dodd-Frank Act could limit our business activities, require changes to certain of our business practices, impose upon us more stringent capital, liquidity and leverage requirements or otherwise materially and adversely affect us. These changes may also require us to invest significant management attention and resources to evaluate and make any changes necessary to comply with new statutory and regulatory requirements. Failure to comply with the new requirements could also materially and adversely affect us.
The Consumer Financial Protection Bureau (“CFPB”) may reshape the consumer financial laws through rulemaking and enforcement of unfair, deceptive or abusive practices, which may directly impact the business operations of depository institutions offering consumer financial products or services including the Bank.
The CFPB has broad rulemaking authority to administer and carry out the purposes and objectives of the “Federal consumer financial laws, and to prevent evasions thereof,” with respect to all financial institutions that offer financial products and services to consumers. The CFPB is also authorized to prescribe rules applicable to any covered person or service provider identifying and prohibiting acts or practices that are “unfair, deceptive, or abusive” in connection with any transaction with a consumer for a consumer financial product or service, or the offering of a consumer financial product or service (“UDAP authority”). The potential reach of the CFPB’s broad new rulemaking powers and UDAP authority on the operations of financial institutions offering consumer financial products or services including the Bank is currently unknown.
Potential losses incurred in connection with possible repurchases and indemnification payments related to mortgages that we have sold into the secondary market may require us to increase our financial statement reserves in the future.
We engage in the origination and sale of residential mortgages into the secondary market. In connection with such sales, we make certain representations and warranties, which, if breached, may require us to repurchase such loans or indemnify the purchasers of such loans for actual losses incurred in respect of such loans. These representations and warranties vary based on the nature of the transaction and the purchaser’s or insurer’s requirements but generally pertain to the ownership of the mortgage loan, the real property securing the loan and
16
Table of Contents
compliance with applicable laws and applicable lender and government-sponsored entity underwriting guidelines in connection with the origination of the loan. While we believe our mortgage lending practices and standards to be adequate, we have settled a small number of claims we consider to be immaterial; however we may receive requests in the future, which could be material in volume. If that were to happen, we could incur losses in connection with loan repurchases and indemnification claims, and any such losses might exceed our financial statement reserves, requiring us to increase such reserves. In that event, any losses we might have to recognize and any increases we might have to make to our reserves could have a material adverse effect on our business, financial position, results of operations or cash flows.
Accounting standards periodically change and the application of our accounting policies and methods may require the Corporation to make estimates about matters that are uncertain
The regulatory bodies that establish accounting standards, including, among others, the Financial Accounting Standards Board and the SEC, periodically revise or issue new financial accounting and reporting standards that govern the preparation of our consolidated financial statements. The effect of such revised or new standards on our financial statements can be difficult to predict and can materially impact how we record and report our financial condition and results of operations.
In addition, the Corporation must exercise judgment in appropriately applying many of our accounting policies and methods so they comply with generally accepted accounting principles. In some cases, the Corporation may have to select a particular accounting policy or method from two or more alternatives. In some cases, the accounting policy or method chosen might be reasonable under the circumstances and yet might result in our reporting materially different amounts than would have been reported if we had selected a different policy or method. Accounting policies are critical to fairly presenting our financial condition and results of operations and may require the Corporation to make difficult, subjective or complex judgments about matters that are uncertain.
Rapidly changing interest rate environment could reduce the Corporation’s net interest margin, net interest income, fee income and net income
Interest and fees on loans and securities, net of interest paid on deposits and borrowings, are a significant part of the Corporation’s net income. Interest rates are key drivers of the Corporation’s net interest margin and subject to many factors beyond the control of the Corporation. As interest rates change, net interest income is affected. Rapidly increasing interest rates in the future could result in interest expense increasing faster than interest income because of divergence in financial instrument maturities and/or competitive pressures. Further, substantially higher interest rates generally reduce loan demand and may result in slower loan growth. Decreases or increases in interest rates could have a negative effect on the spreads between the interest rates earned on assets and the rates of interest paid on liabilities, and therefore decrease net interest income. Also, changes in interest rates might also impact the values of equity and debt securities under management and administration by the Wealth Management Division which may have a negative impact on fee income. See the section captioned “Net Interest Income” in the MD&A section of this Annual Report on Form 10-K for additional details regarding interest rate risk.
Provision for loan and lease losses and level of non-performing loans may need to be modified in connection with internal or external changes
All borrowers carry the potential to default and our remedies to recover may not fully satisfy money previously loaned. We maintain an allowance for loan losses, which is a reserve established through a provision for loan losses charged to expense, which represents the Corporation’s best estimate of probable credit losses that have been incurred within the existing portfolio of loans. The allowance, in the judgment of the Corporation, is necessary to reserve for estimated loan losses and risks inherent in the loan portfolio. The level of the allowance for loan losses reflects the Corporation’s continuing evaluation of industry concentrations; specific credit risks; loan loss experience; current loan portfolio quality; present economic conditions; and unidentified losses inherent
17
Table of Contents
in the current loan portfolio. The determination of the appropriate level of the allowance for loan losses inherently involves a high degree of subjectivity and requires us to make significant estimates of current credit risks using existing qualitative and quantitative information, all of which may undergo material changes. Changes in economic conditions affecting borrowers, new information regarding existing loans, identification of additional problem loans and other factors, both within and outside of our control, may require an increase in the allowance for loan losses. In addition, bank regulatory agencies periodically review our allowance for loan losses and may require an increase in the provision for loan losses or the recognition of additional loan charge-offs, based on judgments different than those of the Corporation. An increase in the allowance for loan losses results in a decrease in net income, and possibly risk-based capital, and may have a material adverse effect on our financial condition and results of operations.
The design of the allowance for loan loss methodology is a dynamic process that must be responsive to changes in environmental factors. Accordingly, at times the allowance methodology may be modified in order to incorporate changes in various factors including, but not limited to, levels and trends of delinquencies and charge-offs, trends in volume and types of loans, national and economic trends and industry conditions.
The Corporation’s controls and procedures may fail or be circumvented
The Corporation diligently reviews and updates the its internal controls over financial reporting, disclosure controls and procedures, and corporate governance policies and procedures. Any failure or undetected circumvention of these controls could have a material adverse impact on our financial condition and results of operations.
Decreased residential mortgage origination, volume and pricing decisions of competitors could affect our net income
The Corporation originates, sells and services residential mortgage loans. Changes in interest rates and pricing decisions by our loan competitors affect demand for the Corporation’s residential mortgage loan products, the revenue realized on the sale of loans and revenues received from servicing such loans for others, ultimately reducing the Corporation’s net income. New regulations, increased regulatory reviews, and/or changes in the structure of the secondary mortgage markets which the Corporation utilizes to sell mortgage loans may be introduced and may increase costs and make it more difficult to operate a residential mortgage origination business.
The Corporation’s performance and financial condition may be adversely affected by regional economic conditions and real estate values
The Bank’s loan and deposit activities are largely based in eastern Pennsylvania. As a result, the Corporation’s consolidated financial performance depends largely upon economic conditions in this eastern Pennsylvania region. This region experienced deteriorating local economic conditions during 2008 through 2011, and a continued downturn in the regional real estate market could harm our financial condition and results of operations because of the geographic concentration of loans within this regional area and because a large percentage of our loans are secured by real property. If there is further decline in real estate values, the collateral for the Corporation’s loans will provide less security. As a result, the Corporation’s ability to recover on defaulted loans by selling the underlying real estate will be diminished, and the Bank will be more likely to suffer losses on defaulted loans.
Additionally, a significant portion of the Corporation’s loan portfolio is invested in commercial real estate loans. Often in a commercial real estate transaction, repayment of the loan is dependent on rental income. Economic conditions may affect the tenant’s ability to make rental payments on a timely basis, and may cause some tenants not to renew their leases, each of which may impact the debtor’s ability to make loan payments. Further, if expenses associated with commercial properties increase dramatically, the tenant’s ability to repay, and therefore the debtor’s ability to make timely loan payments, could be adversely affected.
18
Table of Contents
All of these factors could increase the amount of the Corporation’s non-performing loans, increase its provision for loan and lease losses and reduce the Corporation’s net income.
Economic troubles may negatively affect our leasing business
The Corporation’s leasing business which began operations in September 2006, consists of nation-wide leasing various types of equipment to businesses with an average original equipment cost of approximately $23 thousand per lease. Continued economic sluggishness may result in higher credit losses than we would experience in our traditional lending business, as well as potential increases in state regulatory burdens such as state income taxes, personal property taxes and sales and use taxes.
A general economic slowdown could impact Wealth Management Division revenues
A general economic slowdown could decrease the value of Wealth Management Division assets under management and administration resulting in lower fee income, and clients potentially seeking alternative investment opportunities with other providers, which resulting in lower fee income to the Corporation.
Our ability to realize our deferred tax asset may be reduced, which may adversely impact results of operations
Realization of a deferred tax asset requires us to exercise significant judgment and is inherently uncertain because it requires the prediction of future occurrences. The deferred tax asset may be reduced in the future if estimates of future income or our tax planning strategies do not support the amount of the deferred tax asset. If it is determined that a valuation allowance of its deferred tax asset is necessary, the Corporation may incur a charge to earnings.
Environmental risk associated with our lending activities could affect our results of operations and financial condition
A significant portion of our loan portfolio is secured by real property. In the course of our business, we may own or foreclose and take title to real estate and could become subject to environmental liabilities with respect to these properties. We may become responsible to a governmental agency or third parties for property damage, personal injury, investigation and clean-up costs incurred by those parties in connection with environmental contamination, or may be required to investigate or clean-up hazardous or toxic substances, or chemical releases at a property. The costs associated with environmental investigation or remediation activities could be substantial. If we were to become subject to significant environmental liabilities, it could have a material adverse effect on our results of operations and financial condition.
Technological systems failures, interruptions and security breaches could negatively impact our operations
Communications and information systems are essential to the conduct of our business, as we use such systems to manage our customer relationships, our general ledger, our deposits, and our loans. While we have established policies and procedures to prevent or limit the impact of systems failures, interruptions, and security breaches, there can be no assurance that such events will not occur or that they will be adequately addressed if they do. In addition, any compromise of our security systems could deter customers from using our web site and our online banking service, which involve the transmission of confidential information. Although we rely on commonly used security and processing systems to provide the security and authentication necessary to effect the secure transmission of data, these precautions may not protect our systems from compromises or breaches of security.
In addition, we outsource certain of our data processing to third-party providers. If our third-party providers encounter difficulties, or if we have difficulty in communicating with them, our ability to adequately process and account for customer transactions could be affected, and our business operations could be adversely impacted. Threats to information security also exist in the processing of customer information through various other vendors and their personnel.
19
Table of Contents
The occurrence of any systems failure, interruption, or breach of security could damage our reputation and result in a loss of customers and business, could subject us to additional regulatory scrutiny, or could expose us to civil litigation and possible financial liability. Any of these occurrences could have a material adverse effect on our financial condition and results of operations.
Additionally, financial products and services have become increasingly technology-driven. Our ability to meet the needs of our customers competitively, and in a cost-efficient manner, is dependent on our ability to keep pace with technological advances and to invest in new technology as it becomes available. Many of our competitors have greater resources to invest in technology than we do and may be better equipped to market new technology-driven products and services. The ability to keep pace with technological change is important, and the failure to do so on our part could have a material adverse impact on our business and therefore on our financial condition and results of operations.
The Corporation is subject to certain operational risks, including, but not limited to, customer or employee fraud and data processing system failures and errors
Employee errors and misconduct could subject us to financial losses or regulatory sanctions and seriously harm our reputation. Misconduct by our employees could include hiding unauthorized activities from us, improper or unauthorized activities on behalf of our customers or improper use of confidential information. It is not always possible to prevent employee errors and misconduct, and the precautions we take to prevent and detect this activity may not be effective in all cases. Employee errors could also subject us to financial claims for negligence.
We maintain a system of internal controls and insurance coverage to mitigate operational risks, including data processing system failures and errors and customer or employee fraud. Should our internal controls fail to prevent or detect an occurrence, or if any resulting loss is not insured or exceeds applicable insurance limits, it could have a material adverse effect on our business, results of operations and financial condition.
Potential acquisitions may disrupt the Corporation’s business and dilute shareholder value
We regularly evaluate opportunities to strengthen our current market position by acquiring and investing in banks and in other complementary businesses, or opening new branches. As a result, we may engage in negotiations or discussions that, if they were to result in a transaction, could have a material effect on our operating results and financial condition, including short and long-term liquidity. Our acquisition activities could be material to us. For example, we could issue additional shares of common stock in a purchase transaction, which could dilute current shareholders’ ownership interest. These activities could require us to use a substantial amount of cash, other liquid assets, and/or incur debt. In addition, if goodwill recorded in connection with our prior or potential future acquisitions were determined to be impaired, then we would be required to recognize a charge against our earnings, which could materially and adversely affect our results of operations during the period in which the impairment was recognized. Any potential charges for impairment related to goodwill would not directly impact cash flow or tangible capital.
Our acquisition activities could involve a number of additional risks, including the risks of:
| • | incurring time and expense associated with identifying and evaluating potential acquisitions and negotiating potential transactions, resulting in the Corporation’s attention being diverted from the operation of our existing business; |
| • | using inaccurate estimates and judgments to evaluate credit, operations, management, and market risks with respect to the target institution or assets; |
| • | potential exposure to unknown or contingent liabilities of banks and businesses we acquire; |
| • | the time and expense required to integrate the operations and personnel of the combined businesses; |
20
Table of Contents
| • | experiencing higher operating expenses relative to operating income from the new operations; |
| • | creating an adverse short-term effect on our results of operations; |
| • | losing key employees and customers as a result of an acquisition that is poorly received; |
| • | risk of significant problems relating to the conversion of the financial and customer data of the entity being acquired into the Corporation’s financial and customer product systems; and, |
| • | potential impairment of intangible assets created in business acquisitions. |
There is no assurance that we will be successful in overcoming these risks or any other problems encountered in connection with pending or potential acquisitions. Our inability to overcome these risks could have an adverse effect on our levels of reported net income, ROE and ROA, and our ability to achieve our business strategy and maintain our market value.
Attractive acquisition opportunities may not be available to us in the future which could limit the growth of our business
We may not be able to sustain a positive rate of growth or be able to expand our business. We expect that other banking and financial service companies, many of which have significantly greater resources than us, will compete with us in acquiring other financial institutions if we pursue such acquisitions. This competition could increase prices for potential acquisitions that we believe are attractive. Also, acquisitions are subject to various regulatory approvals. If we fail to receive the appropriate regulatory approvals for a transaction, we will not be able to consummate such transaction which we believe to be in our best interests. Among other things, our regulators consider our capital, liquidity, profitability, regulatory compliance and levels of goodwill and intangibles when considering acquisition and expansion proposals. Other factors, such as economic conditions and legislative considerations, may also impede or prohibit our ability to expand our market presence. If we are not able to successfully grow our business, our financial condition and results of operations could be adversely affected.
The financial services industry is very competitive, and such competition could affect our operating results
The Corporation faces competition in attracting and retaining deposits, making loans, and providing other financial services such as trust and investment management services throughout the Corporation’s market area. The Corporation’s competitors include other community banks, larger banking institutions, trust companies and a wide range of other financial institutions such as credit unions, registered investment advisors, financial planning firms, leasing companies, government-sponsored enterprises, on-line banking enterprises, mutual fund companies, insurance companies and other non-bank businesses. Many of these competitors have substantially greater resources than the Corporation. This is especially evident in regards to advertising and public relations spending. For a more complete discussion of our competitive environment, see “Business – Competition” in Item 1 above. If the Corporation is unable to compete effectively, the Corporation may lose market share and income from deposits, loans, and other products may be reduced.
Additionally, increased competition among financial services companies due to consolidation of certain competing financial institutions and the conversion of certain investment banks to bank holding companies may adversely affect our ability to market our products and services.
The Corporation’s common stock is subordinate to all of our existing and future indebtedness; regulatory and contractual restrictions may limit or prevent us from paying dividends on our common stock; and we are not limited on the amount of indebtedness we and our subsidiaries may incur in the future
Our common stock ranks junior to all indebtedness, including our outstanding subordinated debentures, and other non-equity claims on the Corporation with respect to assets available to satisfy claims on the Corporation, including in a liquidation of the Corporation. Additionally, unlike indebtedness, where principal and interest
21
Table of Contents
would customarily be payable on specified due dates, in the case of our common stock, dividends are payable only when, as and if authorized and declared by our Board of Directors and depend on, among other things, our results of operations, financial condition, debt service requirements, other cash needs and any other factors our Board of Directors deems relevant. Under Pennsylvania law we are subject to restrictions on payments of dividends out of lawfully available funds. Also, the Corporation’s right to participate in a distribution of assets upon a subsidiary’s liquidation or reorganization is subject to the prior claims of the subsidiary’s creditors.
In addition, we are not limited by our common stock in the amount of debt or other obligations we or our subsidiaries may incur in the future. Accordingly, we and our subsidiaries may incur substantial amounts of additional debt and other obligations that will rank senior to our common stock or to which our common stock will be structurally subordinated.
There may be future sales of additional common stock or other dilution of our equity, which may adversely affect the market price of our common stock
We are not restricted from issuing additional common stock or other securities. Additionally, our shareholders may in the future approve the authorization of additional classes or series of stock which may have distribution or other rights senior to the rights of our common stock, or may be convertible into or exchangeable for, or may represent the right to receive, common stock or substantially similar securities. The future issuance of shares of our common stock or any other such future equity classes or series could have a dilutive effect on the holders of our common stock. Additionally, the market value of our common stock could decline as a result of sales by us of a large number of shares of common stock or any future class or series of stock in the market or the perception that such sales could occur.
Downgrades in U.S. government and federal agency securities could adversely affect the Corporation
In addition to causing economic and financial market disruptions, any downgrades in U.S. government and federal agency securities, or failures to raise the U.S. debt limit if necessary in the future, could, among other things, materially adversely affect the market value of the U.S. and other government and governmental agency securities that we hold, the availability of those securities as collateral for borrowing, and our ability to access capital markets on favorable terms, as well as have other material adverse effects on the operation of our business and our financial results and condition. In particular, it could increase interest rates and disrupt payment systems, money markets, and long-term or short-term fixed income markets, adversely affecting the cost and availability of funding, which could negatively affect profitability. Also, the adverse consequences as a result of the downgrade could extend to the borrowers of the loans the bank makes and, as a result, could adversely affect its borrowers’ ability to repay their loans.
Additional risk factors also include the following all of which may reduce revenues and/or increase expenses and/or pull the Corporation’s attention away from core banking operations which may ultimately reduce the Corporation’s net income:
| • | Inability to hire or retain key professionals, management and staff; |
| • | Changes in securities analysts’ estimates of financial performance; |
| • | Volatility of stock market prices and volumes; |
| • | Rumors or erroneous information; |
| • | Changes in market values of similar companies; |
| • | New developments in the banking industry; |
| • | Variations in quarterly or annual operating results; |
| • | New litigation or changes in existing litigation; |
| • | Regulatory actions; |
22
Table of Contents
| • | Restructuring of government-sponsored enterprises such as Fannie Mae and Freddie Mac; |
| • | Changes in accounting policies or procedures as may be required by the Financial Accounting Standards Board or other regulatory agencies. |
| ITEM 1B. | UNRESOLVED STAFF COMMENTS |
None.
| ITEM 2. | PROPERTIES |
As of December 31, 2014, the Corporation owns or leases 19 full-service branch locations, seven limited-service Life Care Community branches and eight other office properties which serve as administrative offices.
The following table details the Corporation’s properties and deposits as of December 31, 2014:
| Property Address |
Owned/Leased | Net Book Value as of December 31, 2014 (dollars in thousands) |
Total Deposits as of December 31, 2014 (dollars in thousands) |
|||||||||
| Full Service Branches (Banking Segment): |
||||||||||||
| 801 Lancaster Ave., Bryn Mawr, PA 19010* |
Owned | $ | 5,055 | $ | 708,796 | |||||||
| 50 W. Lancaster Ave., Ardmore, PA 19003 |
Leased | 2,087 | 96,017 | |||||||||
| 5000 Pennell Rd., Aston, PA 19014 |
Leased | 383 | 24,541 | |||||||||
| 135 E. City Avenue, Bala Cynwyd, PA 19004 |
Leased | 2,343 | 20,781 | |||||||||
| 3218 Edgemont Ave., Brookhaven, PA 19015 |
Owned | 705 | 58,657 | |||||||||
| US Rts. 1 and 100, Chadds Ford, PA 19317 |
Leased | 19 | 33,833 | |||||||||
| 23 E. Fifth St., Chester, PA 19013 |
Leased | 61 | 20,631 | |||||||||
| 31 Baltimore Pk., Chester Heights, PA 19017 |
Leased | 402 | 57,391 | |||||||||
| 237 N. Pottstown Pk., Exton, PA 19341 |
Leased | 719 | 55,265 | |||||||||
| 18 W. Eagle Rd., Havertown, PA 19083 |
Owned | 931 | 86,212 | |||||||||
| 106 E. Street Rd., Kennett Square, PA 19348 |
Leased | 476 | 28,129 | |||||||||
| 22 W. State St., Media, PA 19063 |
Owned | 3,216 | 63,346 | |||||||||
| 3601 West Chester Pk., Newtown Square, PA 19073 |
Leased | 1,008 | 57,522 | |||||||||
| 39 W. Lancaster Ave., Paoli, PA 19301 |
Owned | 1,371 | 68,963 | |||||||||
| 330 Dartmouth Ave., Swarthmore, PA 19081 |
Owned | 697 | 45,464 | |||||||||
| 849 Paoli Pk., West Chester, PA 19380 |
Leased | 1,263 | 42,085 | |||||||||
| 330 E. Lancaster Ave., Wayne, PA 19087 |
Owned | 1,572 | 132,044 | |||||||||
| One Tower Bridge, West Conshohocken, PA 19428 |
Leased | 3 | 29,024 | |||||||||
| 1000 Rocky Run Parkway, Wilmington, DE 19803 |
Leased | 416 | 26,092 | |||||||||
| Life Care Community Offices (Banking Segment): |
||||||||||||
| 601 N. Ithan Ave., Bryn Mawr, PA 19010 |
Leased | — | 5,630 | |||||||||
| 1400 Waverly Rd, Gladwyne, PA 19035 |
Leased | — | 3,633 | |||||||||
| 3300 Darby Rd., Haverford, PA 19041 |
Leased | — | 5,440 | |||||||||
| 11 Martins Run, Media, PA 19063 |
Leased | — | 4,038 | |||||||||
| 535 Gradyville Rd., Newtown Square, PA 19073 |
Leased | 16 | 10,412 | |||||||||
| 404 Cheswick Pl., Bryn Mawr, PA 19010 |
Leased | — | 2,957 | |||||||||
| 1615 E. Boot Rd., West Chester, PA 19380 |
Leased | — | 1,125 | |||||||||
23
Table of Contents
| Property Address |
Owned/Leased | Net Book Value as of December 31, 2014 (dollars in thousands) |
Total Deposits as of December 31, 2014 (dollars in thousands) |
|||||||||
| Other Administrative Offices (Banking and Wealth Management Segments) |
||||||||||||
| 2, 6 S. Bryn Mawr Ave., Bryn Mawr, PA 19010 |
Leased | 401 | Not applicable | |||||||||
| 10 S. Bryn Mawr Ave., Bryn Mawr, PA 19010*** |
Owned | 667 | Not applicable | |||||||||
| 4093 W. Lincoln Hwy., Exton, PA 19341** |
Leased | — | Not applicable | |||||||||
| 16 Campus Blvd., Newtown Square, PA 19073** |
Leased | — | Not applicable | |||||||||
| 322 E. Lancaster Ave., Wayne, PA 19087 |
Owned | 2,050 | Not applicable | |||||||||
| 1 West Chocolate Avenue, Hershey, PA 17033*** |
Leased | 8 | Not applicable | |||||||||
| 20 Montchanin Rd, Suite 185 Greenville, DE 19807** |
Leased | 27 | Not applicable | |||||||||
| 20 North Waterloo Rd, Devon PA 19380*** |
Leased | 167 | Not applicable | |||||||||
| Subsidiary Offices (Wealth Management Segment): |
||||||||||||
| Powers Craft Parker & Beard Inc., 15 Garrett Avenue, Rosemont, PA 19010 |
Leased | 180 | Not applicable | |||||||||
| Lau Associates – 20 Montchanin Rd, Suite 110, Greenville, DE 19087 |
Leased | 166 | Not applicable | |||||||||
| BMTC-DE – 20 Montchanin Rd, Suite 100 Greenville, DE 19807 |
Leased | 31 | Not applicable | |||||||||
|
|
|
|
|
|||||||||
| Total: |
$ | 26,440 | $ | 1,688,028 | ||||||||
| * | Corporate headquarters and executive offices |
| ** | Lending office |
| *** | Wealth Management office |
| ITEM 3. | LEGAL PROCEEDINGS |
Neither the Corporation nor any of its subsidiaries is a party to, nor is any of their property the subject of, any material legal proceedings other than ordinary routine litigation incident to their businesses.
| ITEM 4. | MINE SAFETY DISCLOSURES |
Not Applicable.
24
Table of Contents
PART II
| ITEM 5. | MARKET FOR THE REGISTRANT’S COMMON EQUITY, RELATED STOCKHOLDER MATTERS AND ISSUER PURCHASES OF EQUITY SECURITIES |
The Corporation’s common stock is traded on the NASDAQ Stock Market under the symbol BMTC. As of December 31, 2014, there were 590 holders of record of the Corporation’s common stock.
The following table sets forth the range of high and low sales prices for the common stock for each full quarterly period within the two most recent fiscal years as well as the quarterly dividends paid.
| 2014 | 2013 | |||||||||||||||||||||||
| High | Low | Dividend Declared |
High | Low | Dividend Declared |
|||||||||||||||||||
| 1st Quarter |
$ | 30.44 | $ | 26.48 | $ | 0.18 | $ | 23.64 | $ | 21.78 | $ | 0.17 | ||||||||||||
| 2nd Quarter |
$ | 30.44 | $ | 26.50 | $ | 0.18 | $ | 24.06 | $ | 22.28 | $ | 0.17 | ||||||||||||
| 3rd Quarter |
$ | 30.98 | $ | 28.33 | $ | 0.19 | $ | 28.33 | $ | 23.97 | $ | 0.17 | ||||||||||||
| 4th Quarter |
$ | 31.76 | $ | 27.44 | $ | 0.19 | $ | 31.76 | $ | 25.13 | $ | 0.18 | ||||||||||||
The information regarding dividend restrictions is set forth in Note 24 – “Dividend Restrictions” in the accompanying Notes to Consolidated Financial Statements in this Annual Report on Form 10-K.
25
Table of Contents
| • | Comparison of Cumulative Total Return Chart |
The following chart compares the yearly percentage change in the cumulative shareholder return on the Corporation’s common stock during the five years ended December 31, 2014, with (1) the Total Return for the NASDAQ Market Index; (2) the Total Return Index for SNL Bank and Thrift Index; and (3) the Total Return Index for SNL Mid-Atlantic Bank Index . This comparison assumes $100.00 was invested on December 31, 2009, in our common stock and the comparison groups and assumes the reinvestment of all cash dividends prior to any tax effect and retention of all stock dividends.
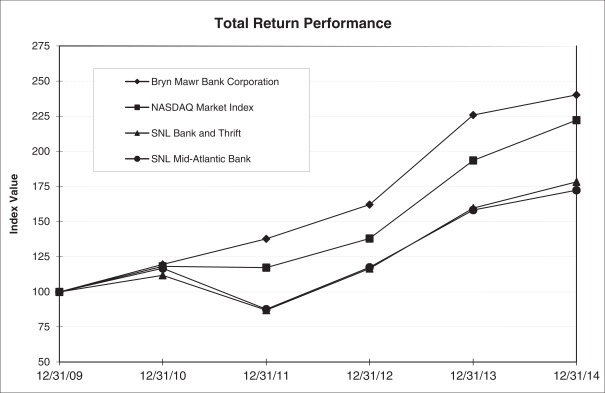
| Five Year Cumulative Total Return Summary |
||||||||||||||||||||||||
| As of December 31, | ||||||||||||||||||||||||
| 2009 | 2010 | 2011 | 2012 | 2013 | 2014 | |||||||||||||||||||
| Bryn Mawr Bank Corporation |
$ | 100.00 | $ | 119.51 | $ | 137.69 | $ | 162.12 | $ | 225.79 | $ | 240.21 | ||||||||||||
| NASDAQ Market Index |
$ | 100.00 | $ | 118.15 | $ | 117.22 | $ | 138.02 | $ | 193.47 | $ | 222.16 | ||||||||||||
| SNL Bank and Thrift |
$ | 100.00 | $ | 111.64 | $ | 86.81 | $ | 116.57 | $ | 159.61 | $ | 178.18 | ||||||||||||
| SNL Mid-Atlantic Bank |
$ | 100.00 | $ | 116.66 | $ | 87.64 | $ | 117.4 | $ | 158.25 | $ | 172.41 | ||||||||||||
| • | Equity Compensation Plan Information |
Equity compensation plan information is incorporated by reference to Item 12 of this Annual Report on Form 10-K. Additional information regarding the Corporation’s equity compensation plans can be found at Note 18 – “Stock Based Compensation” in the accompanying Notes to Consolidated Financial Statements found in this Annual Report on Form 10-K.
26
Table of Contents
| • | Issuer Purchases of Equity Securities |
The following tables present the repurchasing activity of the Corporation during the fourth quarter of 2014:
Shares Repurchased in the 4th Quarter of 2014
| Period: |
Total Number of Shares Purchased |
Average Price Paid per Share |
Total Number of Shares Purchased as Part of Publicly Announced Plans or Programs |
Maximum Number of Shares that May Yet Be Purchased Under the Plan or Programs(2) |
||||||||||||
| Oct. 1, 2014 – Oct. 31, 2014 |
870 | (1) | $ | 29.80 | — | 195,705 | ||||||||||
| Nov. 1, 2014 – Nov. 30, 2014 |
— | — | — | 195,705 | ||||||||||||
| Dec. 1, 2014 – Dec. 31, 2014 |
— | — | — | 195,705 | ||||||||||||
|
|
|
|
|
|||||||||||||
| Total |
870 | $ | 29.80 | — | ||||||||||||
|
|
|
|
|
|||||||||||||
| (1) | On February 24, 2006, the Board of Directors of the Corporation adopted a new stock repurchase program (the “2006 Program”) under which the Corporation may repurchase up to 450,000 shares of the Corporation’s common stock, not to exceed $10 million. The 2006 Program was publicly announced in a Press Release dated February 24, 2006. There is no expiration date on the 2006 Program. All shares purchased through the 2006 Program were accomplished in open market transactions. |
| (2) | On October 1, 2014, 870 shares were purchased by the Corporation’s deferred compensation plan trusts through open market transactions. |
27
Table of Contents
| ITEM 6. | SELECTED FINANCIAL DATA |
| Earnings | As of or for the Twelve Months Ended December 31, | |||||||||||||||||||
| (dollars in thousands) | 2014 | 2013 | 2012 | 2011 | 2010 | |||||||||||||||
| Interest income |
$ | 82,906 | $ | 78,417 | $ | 73,323 | $ | 74,562 | $ | 64,897 | ||||||||||
| Interest expense |
6,078 | 5,427 | 8,588 | 11,661 | 12,646 | |||||||||||||||
|
|
|
|
|
|
|
|
|
|
|
|||||||||||
| Net interest income |
76,828 | 72,990 | 64,735 | 62,901 | 52,251 | |||||||||||||||
| Provision for loan and lease losses |
884 | 3,575 | 4,003 | 6,088 | 9,854 | |||||||||||||||
|
|
|
|
|
|
|
|
|
|
|
|||||||||||
| Net interest income after provision for loan and lease losses |
75,944 | 69,415 | 60,732 | 56,813 | 42,397 | |||||||||||||||
| Non-interest income |
48,322 | 48,355 | 46,386 | 34,059 | 29,299 | |||||||||||||||
| Non-interest expense |
81,418 | 80,740 | 74,901 | 61,729 | 58,206 | |||||||||||||||
|
|
|
|
|
|
|
|
|
|
|
|||||||||||
| Income before income taxes |
42,848 | 37,030 | 32,217 | 29,143 | 13,490 | |||||||||||||||
| Income taxes |
15,005 | 12,586 | 11,070 | 9,541 | 4,444 | |||||||||||||||
|
|
|
|
|
|
|
|
|
|
|
|||||||||||
| Net Income |
$ | 27,843 | $ | 24,444 | $ | 21,147 | $ | 19,602 | $ | 9,046 | ||||||||||
|
|
|
|
|
|
|
|
|
|
|
|||||||||||
| Per Share Data |
||||||||||||||||||||
| Weighted-average shares outstanding |
13,566,239 | 13,311,215 | 13,090,110 | 12,659,824 | 10,680,377 | |||||||||||||||
| Dilutive potential Common Stock |
294,801 | 260,395 | 151,736 | 82,313 | 12,312 | |||||||||||||||
|
|
|
|
|
|
|
|
|
|
|
|||||||||||
| Adjusted weighted-average shares |
13,861,040 | 13,571,610 | 13,241,846 | 12,742,137 | 10,692,689 | |||||||||||||||
| Earnings per common share: |
||||||||||||||||||||
| Basic |
$ | 2.05 | $ | 1.84 | $ | 1.62 | $ | 1.55 | $ | 0.85 | ||||||||||
| Diluted |
$ | 2.01 | $ | 1.80 | $ | 1.60 | $ | 1.54 | $ | 0.85 | ||||||||||
| Dividends declared |
$ | 0.74 | $ | 0.69 | $ | 0.64 | $ | 0.60 | $ | 0.56 | ||||||||||
| Dividends declared per share to net income per basic common share |
36.1 | % | 37.5 | % | 39.5 | % | 38.7 | % | 65.9 | % | ||||||||||
| Shares outstanding at year end |
13,769,336 | 13,650,354 | 13,412,690 | 13,106,353 | 12,181,247 | |||||||||||||||
| Book value per share |
$ | 17.83 | $ | 16.84 | $ | 15.18 | $ | 14.07 | $ | 13.14 | ||||||||||
| Tangible book value per share |
$ | 13.59 | $ | 13.02 | $ | 11.08 | $ | 10.81 | $ | 11.11 | ||||||||||
| Profitability Ratios |
||||||||||||||||||||
| Tax-equivalent net interest margin |
3.93 | % | 3.98 | % | 3.85 | % | 3.96 | % | 3.79 | % | ||||||||||
| Return on average assets |
1.32 | % | 1.23 | % | 1.15 | % | 1.13 | % | 0.61 | % | ||||||||||
| Return on average equity |
11.56 | % | 11.53 | % | 10.91 | % | 11.10 | % | 6.72 | % | ||||||||||
| Non-interest expense to net-interest income and non-interest income |
65.1 | % | 66.5 | % | 67.4 | % | 63.7 | % | 71.4 | % | ||||||||||
| Non-interest income to net-interest income and non-interest income |
38.6 | % | 39.9 | % | 41.7 | % | 35.1 | % | 35.9 | % | ||||||||||
| Average equity to average total assets |
11.38 | % | 10.63 | % | 10.58 | % | 10.19 | % | 9.02 | % | ||||||||||
28
Table of Contents
| Earnings | As of or for the Twelve Months Ended December 31, | |||||||||||||||||||
| (dollars in thousands) | 2014 | 2013 | 2012 | 2011 | 2010 | |||||||||||||||
| Financial Condition |
||||||||||||||||||||
| Total assets |
$ | 2,246,506 | $ | 2,061,665 | $ | 2,035,885 | $ | 1,773,373 | $ | 1,730,388 | ||||||||||
| Total liabilities |
2,001,032 | 1,831,767 | 1,832,321 | 1,588,994 | 1,570,350 | |||||||||||||||
| Total shareholders’ equity |
245,474 | 229,898 | 203,564 | 184,379 | 160,038 | |||||||||||||||
| Interest-earning assets |
2,092,164 | 1,905,398 | 1,879,412 | 1,629,607 | 1,600,125 | |||||||||||||||
| Portfolio loans and leases |
1,652,257 | 1,547,185 | 1,398,456 | 1,295,392 | 1,196,717 | |||||||||||||||
| Investment securities |
233,473 | 289,245 | 318,061 | 275,258 | 320,047 | |||||||||||||||
| Goodwill |
35,502 | 32,843 | 32,897 | 24,689 | 17,659 | |||||||||||||||
| Intangible assets |
22,998 | 21,998 | 18,014 | 7,064 | 5,421 | |||||||||||||||
| Deposits |
1,688,028 | 1,634,682 | 1,382,369 | 1,341,432 | 937,887 | |||||||||||||||
| Borrowings |
283,970 | 170,718 | 183,158 | 204,724 | 169,388 | |||||||||||||||
| Wealth assets under management, administration, supervision and brokerage |
7,699,908 | 6,663,212 | 4,831,631 | 3,412,890 | 2,871,143 | |||||||||||||||
| Capital Ratios |
||||||||||||||||||||
| Ratio of tangible common equity to tangible assets |
8.61 | % | 7.60 | % | 8.19 | % | 7.93 | % | 7.51 | % | ||||||||||
| Tier 1 capital to risk weighted assets |
12.00 | % | 11.02 | % | 11.16 | % | 11.21 | % | 9.41 | % | ||||||||||
| Total regulatory capital to risk weighted assets |
12.87 | % | 12.02 | % | 13.74 | % | 13.62 | % | 12.53 | % | ||||||||||
| Asset quality |
||||||||||||||||||||
| Allowance as a percentage of portfolio loans and leases |
0.88 | % | 1.03 | % | 0.98 | % | 0.86 | % | 1.18 | % | ||||||||||
| Non-performing loans and leases as a percentage of portfolio loans and leases |
0.61 | % | 1.06 | % | 1.11 | % | 0.79 | % | 0.78 | % | ||||||||||
Information related to accounting changes may be found under the caption “New Accounting Pronouncements” at Note 1-W in the accompanying Notes to Consolidated Financial Statements found in this Annual Report on Form 10-K.
29
Table of Contents
| ITEM 7. | MANAGEMENT’S DISCUSSION AND ANALYSIS OF FINANCIAL CONDITION AND RESULTS OPERATIONS (“MD&A”) |
Brief History of the Corporation
The Bryn Mawr Trust Company (the “Bank”) received its Pennsylvania banking charter in 1889 and is a member of the Federal Reserve System. In 1986, Bryn Mawr Bank Corporation (the “Corporation”) was formed and on January 2, 1987, the Bank became a wholly-owned subsidiary of the Corporation. The Bank and Corporation are headquartered in Bryn Mawr, Pennsylvania, a western suburb of Philadelphia. The Corporation and its subsidiaries offer a full range of personal and business banking services, consumer and commercial loans, equipment leasing, mortgages, insurance and wealth management services, including investment management, trust and estate administration, retirement planning, custody services, and tax planning and preparation from 19 full-service branches, seven limited-hour, retirement community offices and five wealth offices located throughout Montgomery, Delaware, Chester and Dauphin counties of Pennsylvania and New Castle county in Delaware. The common stock of the Corporation trades on the NASDAQ Stock Market (“NASDAQ”) under the symbol BMTC.
The Corporation operates in a highly competitive market area that includes local, national and regional banks as competitors along with savings banks, credit unions, insurance companies, trust companies, registered investment advisors and mutual fund families. The Corporation and its subsidiaries are regulated by many agencies including the Securities and Exchange Commission (“SEC”), NASDAQ, Federal Deposit Insurance Corporation (“FDIC”), the Federal Reserve and the Pennsylvania Department of Banking and Securities. The goal of the Corporation is to become the preeminent community bank and wealth management organization in the Philadelphia area.
During the five years ended December 31, 2014, the Corporation and Bank completed the following five transactions:
Powers Craft Parker and Beard, Inc.
On October 1, 2014, the acquisition of Powers Craft Parker and Beard, Inc. (“PCPB”), a full-service insurance brokerage headquartered in Rosemont, Pennsylvania, was completed. The consideration paid by the Bank was $7.0 million, of which $5.4 million was paid at closing and three contingent cash payments, not exceed $542 thousand each, will be payable on each of September 30, 2015, September 30, 2016 and September 30, 2017, subject to the attainment of certain revenue targets during the related periods. The acquisition will enable the Bank to offer a comprehensive line of insurance solutions to both individual and business clients. The transaction was accounted for as a business combination.
First Bank of Delaware
On November 17, 2012, the acquisition of $70.3 million of deposits, $76.6 million of loans and a branch location from First Bank of Delaware (“FBD”), by the Corporation was completed. The transaction, which was accounted for as a business combination, enabled the Corporation to expand its banking arm into the Delaware market by opening its first full-service branch there, complementing its existing wealth management operations in the state.
Davidson Trust Company
On May 15, 2012, the acquisition of Davidson Trust Company (“DTC”) by the Corporation was completed. The transaction was accounted for as a business combination. The acquisition of DTC initially increased the Corporation’s wealth management division assets under management by $1.0 billion. The structure of the Corporation’s existing wealth management segment allowed for the immediate integration of DTC and was able to take advantage of the various synergies that exist between the two companies.
The Private Wealth Management Group of The Hershey Trust Company
On May 27, 2011, the acquisition of the Private Wealth Management Group of the Hershey Trust Company (“PWMG”) by the Corporation was completed. The transaction was accounted for as a business combination.
30
Table of Contents
The acquisition of PWMG initially increased the Corporation’s wealth management division assets under management by $1.1 billion. The acquisition of PWMG allowed the Corporation to establish a presence in central Pennsylvania by maintaining the former PWMG offices in Hershey, Pennsylvania.
First Keystone Financial, Inc.
On July 1, 2010, the merger of First Keystone Financial, Inc. (“FKF”) with and into the Corporation, and the two step merger of FKF’s wholly-owned subsidiary, First Keystone Bank with and into the Bank, were completed.
The transaction was accounted for as a business combination. The merger with FKF, a federally chartered thrift institution with assets of approximately $480 million, enabled the Corporation to increase its regional footprint with the addition of eight full service branch locations, primarily in Delaware County, Pennsylvania. The geographic locations of the acquired branches were such that it was not necessary to close any of the former FKF branches. By expanding into these new areas within Delaware County, Pennsylvania, the Corporation has been able to extend its successful sales culture as well as offer its reputable wealth management products and other value-added services to a wider segment of the region’s population.
Subsequent Period Acquisition
On January 1, 2015, the Corporation completed its previously announced merger with Continental Bank Holdings, Incorporated, (“CBHI”) which increased the Corporation’s assets by approximately $678 million. For more information on the transaction, please refer to Note 29, Subsequent Events, in the accompanying Notes to Consolidated Financial Statements.
Results of Operations
The following is management’s discussion and analysis of the significant changes in the results of operations, capital resources and liquidity presented in the accompanying consolidated financial statements. The Corporation’s consolidated financial condition and results of operations are comprised primarily of the Bank’s financial condition and results of operations. Current performance does not guarantee, and may not be indicative of, similar performance in the future. For more information on the factors that could affect performance, see “Special Cautionary Notice Regarding Forward Looking Statements” immediately following the index at the beginning of this document.
Critical Accounting Policies, Judgments and Estimates
The accounting and reporting policies of the Corporation and its subsidiaries conform to U.S. generally accepted accounting principles (“GAAP”). All inter-company transactions are eliminated in consolidation and certain reclassifications are made when necessary in order to conform the previous years’ financial statements to the current year’s presentation. In preparing the consolidated financial statements, management is required to make estimates and assumptions that affect the reported amount of assets and liabilities as of the dates of the balance sheets and revenues and expenditures for the periods presented. Therefore, actual results could differ from these estimates.
The Allowance for Loan and Lease Losses (the “Allowance”)
The Allowance involves a higher degree of judgment and complexity than other significant accounting policies. The Allowance is calculated with the objective of maintaining a reserve level believed by the Corporation to be sufficient to absorb estimated credit losses present in the loan portfolio as of the reporting date. The Corporation’s determination of the adequacy of the allowance is based on frequent evaluations of the loan and lease portfolio and other relevant factors. However, this evaluation is inherently subjective as it requires material estimates, including, among others, expected default probabilities, the amounts and timing of expected cash flows on impaired loans and leases, the value of collateral, estimated losses on consumer loans and residential
31
Table of Contents
mortgages and the relevance of historical loss experience. The process also considers economic conditions and inherent risks in the loan and lease portfolio. All of these factors may be susceptible to significant change. To the extent actual outcomes differ from the Corporation’s estimates, additional provision for loan and lease losses (the “Provision”) may be required that would adversely impact earnings in future periods. See the section of this document titled Asset Quality and Analysis of Credit Risk for additional information.
Other significant accounting policies are presented in Note 1, Summary of Significant Accounting Policies, in the Notes to Consolidated Financial Statements. The Corporation’s accounting policies have not substantively changed any aspect of its overall approach in the application of the foregoing policies.
Fair Value Measurement of Investment Securities Available-for-Sale and Assessment for Impairment of Certain Investment Securities
The Corporation may designate its investment securities as held-to-maturity, available-for-sale or trading. Each of these designations affords different treatment for changes in the fair market values of investment securities in the Corporation’s financial statements that are otherwise identical. Should evidence emerge which indicates that management’s intent or ability to maintain the securities as originally designated is not supported, reclassifications among the three designations may be necessary and, as a result, may require adjustments to the Corporation’s financial statements.
Valuation of Goodwill and Other Intangible Assets
Goodwill and other intangible assets have been recorded on the books of the Corporation in connection with its acquisitions. The Corporation completes a goodwill impairment analysis at least on an annual basis, or more often, if events and circumstances indicate that there may be impairment. The Corporation also completes an annual impairment test for other intangible assets, or more often, if events and circumstances indicate a possible impairment. There was no goodwill impairment and no material impairment to identifiable intangibles recorded during 2014 or 2013. There can be no assurance that future impairment assessments or tests will not result in a charge to earnings.
Overview of General Economic, Regulatory and Governmental Environment
The U.S. has been a bastion of both economic growth and currency strength and stability on the global stage throughout 2014 and as we enter the early days of 2015. Real GDP growth came in at a very robust 5% in the third quarter of 2014, after registering strong growth of 4.6% in the second quarter. The resiliency of the U.S. economy is very notable, given the fact that the first quarter came in at a negative 2.1% rate due to the unusually severe winter weather. Third quarter growth was driven by a further improvement in consumer spending (+3.2%), non-residential fixed investment (+8.9%), federal government spending (+9.9%) and exports (+4.5%).
Consumer spending, which represents about two-thirds of domestic GDP, was aided by a number of factors, including a better jobs picture. The civilian unemployment rate dropped to 5.6% in December 2014, from a high of 7.0% earlier in 2014. Non-farm payroll employment growth accelerated through the course of 2014, registering an average gain of 246,000 new jobs in the fourth calendar quarter. According to Bureau of Labor Statistics data, average hourly earnings remain subdued, but some acceleration is expected in 2015.
Consumer spending has been aided by the dramatic decline in energy prices, primarily crude oil, since June of 2014. The decline in the price of crude has led to the drop in the price of refined petroleum products, such as gasoline, jet fuel and heating oil. As of January 24, 2015, the national average for the price of regular unleaded gasoline had dropped to $2.04 per gallon, according to the Automobile Association of America. It is believed that the majority of savings from lower gas prices will be spent by households, which should further enhance the consumer-based U.S. economy.
32
Table of Contents
Executive Overview
2014 Compared to 2013
Income Statement
The Corporation reported net income of $27.8 million or $2.01 diluted earnings per share for the twelve months ended December 31, 2014, as compared to $24.4 million, or $1.80 diluted earnings per share, for the same period in 2013. Return on average equity (“ROE”) and return on average assets (“ROA”) for the twelve months ended December 31, 2014, were 11.56% and 1.32%, respectively, as compared to 11.53% and 1.23%, respectively, for the same period in 2013. The increase in net income for the twelve months ended December 31, 2014, as compared to the same period in 2013, was related to a $3.8 million increase in net interest income and a $2.7 million decrease in Provision. Partially offsetting these improvements were increases of $678 thousand in non-interest expense and $2.4 million in income tax expense for the twelve months ended December 31, 2014, as compared to the same period in 2013.
The $3.8 million, or 5.2%, increase in the Corporation’s tax-equivalent net interest income for the twelve months ended December 31, 2014, as compared to the same period in 2013, was largely attributed to the $153.9 million increase in average portfolio loans between the periods. In addition to this increase in average interest-earning assets, average interest-bearing liabilities increased by $68.7 million, primarily related to a $60.0 million increase in long-term FHLB advances and other borrowings. The average rate paid on interest-bearing liabilities increased by 3 basis points while the average yield earned on interest-earning assets decreased by 3 basis points between the periods. The Corporation’s tax-equivalent net interest margin decreased by 5 basis points, to 3.93% for the twelve months ended December 31, 2014 from 3.98% for the same period in 2013.
For the twelve months ended December 31, 2014, the Provision of $884 thousand was a decrease of $2.7 million from the $3.6 million for the same period in 2013. Net loan and lease charge offs for the twelve months ended December 31, 2014 totaled $1.8 million, a decrease of $672 thousand from the same period in 2013.
Non-interest income for the twelve months ended December 31, 2014 was $48.3 million, a slight decrease of $33 thousand as compared to the same period in 2013. An increase of $1.6 million in wealth management revenue along with increases of $479 thousand, $475 thousand and $559 thousand in net gain on sale of investment securities available for sale, net gain on sale of other real estate owned, and insurance commissions, respectively, were offset by a $2.4 million decrease in net gain on sale of residential mortgages between the periods.
Non-interest expense for the twelve months ended December 31, 2014, was $81.4 million, an increase of $678 thousand, as compared to the same period in 2013. Contributing to this increase were increases in occupancy and furniture, fixtures and equipment expense totaling $974 thousand and increases of $488 thousand and $561 thousand in due diligence and merger-related expenses and professional fees, respectively, between the periods. These cost increases were partially offset by a $1.1 million decrease in other operating expenses and a $347 thousand decrease in costs related to early extinguishment of debt.
Balance Sheet
Asset quality remained stable as of December 31, 2014. The Allowance of $14.6 million was 0.88% of portfolio loans and leases, as of December 31, 2014, as compared to $15.5 million, or 1.00% of portfolio loans and leases, at December 31, 2013. The decrease in the Allowance as of December 31, 2014, as compared to December 31, 2013, is reflective of improvements in various loan quality indicators as well as economic environment indicators as of December 31, 2014.
Total portfolio loans and leases of $1.65 billion at December 31, 2014 increased $105.1 million, or 6.8%, as compared to $1.55 billion at December 31, 2013. The loan growth was concentrated in the commercial mortgage, commercial and industrial, and construction segments of the portfolio.
33
Table of Contents
The Corporation’s available for sale investment portfolio at December 31, 2014 had a fair market value of $229.6 million, as compared to $285.8 million at December 31, 2013, as cash inflows from maturities, calls and pay downs were utilized for loan origination.
Deposits of $1.69 billion, as of December 31, 2014, increased $96.7 million from December 31, 2013. The 6.1% increase was the result of a $62.6 million increase in wholesale deposits and a $56.5 million increase in core deposits. These increases were partially offset by a $22.4 million decrease in retail time deposits, as the Corporation continued its planned run-off of its higher-rate certificates of deposit. Non-interest-bearing deposits comprised 26.5% of deposits as of December 31, 2014, relatively unchanged from its December 31, 2013 level of 26.8%.
Wealth Assets
Wealth assets under management, administration, supervision and brokerage increased to $7.7 billion as of December 31, 2014, an increase of $432 million from $7.3 billion as of December 31, 2013.
2013 Compared to 2012
Income Statement
The Corporation reported net income of $24.4 million or $1.80 diluted earnings per share for the twelve months ended December 31, 2013, as compared to $21.1 million, or $1.60 diluted earnings per share, for the same period in 2012. ROE and ROA for the twelve months ended December 31, 2013, were 11.53% and 1.23%, respectively, as compared to 10.91% and 1.15%, respectively, for the same period in 2012. The increase in net income for the twelve months ended December 31, 2013, as compared to the same period in 2012, was largely related to an $8.3 million increase in net interest income, which reflected a 12.8% increase. A $2.0 million increase in non-interest income was offset by a $5.8 million increase in non-interest expense and a $1.5 million increase in income tax expense for the twelve months ended December 31, 2013 as compared to the same period in 2012.
The $8.3 million, or 12.8%, increase in the Corporation’s tax-equivalent net interest income for the twelve months ended December 31, 2013, as compared to the same period in 2012, was largely attributed to the $144.4 million increase in average portfolio loans between the periods, as the $76.6 million of loans acquired in the FBD transaction at the end of 2012 were supplemented by robust organic loan growth during 2013. In addition to this increase in average interest-earning assets, average interest-bearing liabilities also increased by $73.4 million, partially as the result of the deposits acquired from FBD. However, the average rate paid on interest-bearing liabilities declined by 27 basis points between the periods. The Corporation’s tax-equivalent net interest margin increased to 3.98% for the twelve months ended December 31, 2013 from 3.85% for the same period in 2012.
For the twelve months ended December 31, 2013, the provision for loan and lease losses of $3.6 million was a decrease of $428 thousand from the $4.0 million for the same period in 2012. Net loan and lease charge offs for the twelve months ended December 31, 2013 totaled $2.5 million, a $154 thousand decrease from the same period in 2012.
Non-interest income for the twelve months ended December 31, 2013 was $48.4 million, an increase of $2.0 million as compared to the same period in 2012. Contributing to the increase was a $5.4 million increase in wealth management revenue between the periods. Partially offsetting this increase were decreases of $2.6 million and $1.4 million in the gains on sale of residential mortgage loans and available for sale investment securities, respectively, between the periods.
Non-interest expense for the twelve months ended December 31, 2013, was $80.7 million, an increase of $5.8 million, as compared to the same period in 2012. Contributing to this increase were a $3.9 million increase in salaries and employee benefits expense and a $1.2 million increase in occupancy and equipment expense between the periods, as the Corporation has implemented several infrastructure improvements during the year.
34
Table of Contents
Components of Net Income
Net income is comprised of five major elements:
| • | Net Interest Income, or the difference between the interest income earned on loans, leases and investments and the interest expense paid on deposits and borrowed funds; |
| • | Provision For Loan and Lease Losses, or the amount added to the Allowance to provide for estimated inherent losses on portfolio loans and leases; |
| • | Non-Interest Income, which is made up primarily of wealth management revenue, gains and losses from the sale of residential mortgage loans, gains and losses from the sale of available for sale investment securities and other fees from loan and deposit services; |
| • | Non-Interest Expense, which consists primarily of salaries and employee benefits, occupancy, intangible asset amortization, professional fees and other operating expenses; and |
| • | Income Taxes, which include state and federal jurisdictions. |
Net Interest Income
Rate/Volume Analyses (Tax-equivalent Basis)*
The rate volume analysis in the table below analyzes dollar changes in the components of interest income and interest expense as they relate to the change in balances (volume) and the change in interest rates (rate) of tax-equivalent net interest income for the years 2014 as compared to 2013 and 2013 as compared to 2012, allocated by rate and volume. The change in interest income / expense due to both volume and rate has been allocated to changes in volume.
| Year Ended December 31, | ||||||||||||||||||||||||
| (dollars in thousands) | 2014 Compared to 2013 | 2013 Compared to 2012 | ||||||||||||||||||||||
| increase/(decrease) | Volume | Rate | Total | Volume | Rate | Total | ||||||||||||||||||
| Interest Income: |
||||||||||||||||||||||||
| Interest-bearing deposits with banks |
$ | 36 | $ | (1 | ) | $ | 35 | $ | 13 | $ | 18 | $ | 31 | |||||||||||
| Investment securities – taxable |
(347 | ) | 198 | (149 | ) | (211 | ) | — | (211 | ) | ||||||||||||||
| Investment securities – nontaxable |
(24 | ) | 30 | 6 | 402 | (80 | ) | 322 | ||||||||||||||||
| Loans and leases |
5,527 | (926 | ) | 4,601 | 7,538 | (2,498 | ) | 5,040 | ||||||||||||||||
|
|
|
|
|
|
|
|
|
|
|
|
|
|||||||||||||
| Total interest income |
5,192 | (699 | ) | 4,493 | 7,742 | (2,560 | ) | 5,182 | ||||||||||||||||
|
|
|
|
|
|
|
|
|
|
|
|
|
|||||||||||||
| Interest expense: |
||||||||||||||||||||||||
| Savings, NOW and market rate accounts |
1 | (83 | ) | (82 | ) | 345 | (856 | ) | (511 | ) | ||||||||||||||
| Wholesale non-maturity deposits |
33 | 335 | 368 | (20 | ) | (17 | ) | (37 | ) | |||||||||||||||
| Wholesale time deposits |
127 | (107 | ) | 20 | (16 | ) | 34 | 18 | ||||||||||||||||
| Time deposits |
(167 | ) | — | (167 | ) | (257 | ) | (487 | ) | (744 | ) | |||||||||||||
| Borrowed funds – long-term |
653 | (131 | ) | 522 | (375 | ) | (1,516 | ) | (1,891 | ) | ||||||||||||||
| Borrowed funds – short-term |
— | (10 | ) | (10 | ) | 6 | (2 | ) | 4 | |||||||||||||||
|
|
|
|
|
|
|
|
|
|
|
|
|
|||||||||||||
| Total interest expense |
647 | 4 | 651 | (317 | ) | (2,844 | ) | (3,161 | ) | |||||||||||||||
|
|
|
|
|
|
|
|
|
|
|
|
|
|||||||||||||
| Interest differential |
$ | 4,545 | $ | (703 | ) | $ | 3,842 | $ | 8,059 | $ | 284 | $ | 8,343 | |||||||||||
|
|
|
|
|
|
|
|
|
|
|
|
|
|||||||||||||
| * | The tax rate used in the calculation of the tax-equivalent income is 35%. |
35
Table of Contents
Analysis of Interest Rates and Interest Differential
The table below presents the major asset and liability categories on an average daily basis for the periods presented, along with tax-equivalent interest income and expense and key rates and yields:
| For the Year Ended December 31, | ||||||||||||||||||||||||||||||||||||
| 2014 | 2013 | 2012 | ||||||||||||||||||||||||||||||||||
| (dollars in thousands) | Average Balance |
Interest Income/ Expense |
Average Rates Earned/ Paid |
Average Balance |
Interest Income/ Expense |
Average Rates Earned/ Paid |
Average Balance |
Interest Income/ Expense |
Average Rates Earned/ Paid |
|||||||||||||||||||||||||||
| Assets: |
||||||||||||||||||||||||||||||||||||
| Interest-bearing deposits with banks |
$ | 83,163 | $ | 193 | 0.23 | % | $ | 67,124 | $ | 158 | 0.24 | % | $ | 60,389 | $ | 127 | 0.21 | % | ||||||||||||||||||
| Investment securities – available for sale: |
||||||||||||||||||||||||||||||||||||
| Taxable |
233,054 | 3,740 | 1.60 | % | 282,978 | 3,849 | 1.36 | % | 299,598 | 4,060 | 1.36 | % | ||||||||||||||||||||||||
| Tax – Exempt |
34,689 | 594 | 1.71 | % | 37,890 | 588 | 1.55 | % | 16,685 | 302 | 1.81 | % | ||||||||||||||||||||||||
|
|
|
|
|
|
|
|
|
|
|
|
|
|||||||||||||||||||||||||
| Total investment securities – available for sale |
267,743 | 4,334 | 1.62 | % | 320,868 | 4,437 | 1.38 | % | 316,283 | 4,362 | 1.38 | % | ||||||||||||||||||||||||
| Investment securities – trading |
3,591 | 33 | 0.92 | % | 2,106 | 73 | 3.47 | % | 1,431 | 37 | 2.59 | % | ||||||||||||||||||||||||
| Loans and leases(1)(2)(3) |
1,609,220 | 78,781 | 4.90 | % | 1,455,284 | 74,180 | 5.10 | % | 1,310,883 | 69,140 | 5.27 | % | ||||||||||||||||||||||||
|
|
|
|
|
|
|
|
|
|
|
|
|
|||||||||||||||||||||||||
| Total interest-earning assets |
1,963,717 | 83,341 | 4.24 | % | 1,845,382 | 78,848 | 4.27 | % | 1,688,986 | 73,666 | 4.36 | % | ||||||||||||||||||||||||
| Cash and due from banks |
12,730 | 12,946 | 12,890 | |||||||||||||||||||||||||||||||||
| Allowance for loan and lease losses |
(15,836 | ) | (14,800 | ) | (13,469 | ) | ||||||||||||||||||||||||||||||
| Other assets |
154,871 | 150,972 | 144,594 | |||||||||||||||||||||||||||||||||
|
|
|
|
|
|
|
|||||||||||||||||||||||||||||||
| Total assets |
$ | 2,115,482 | $ | 1,994,500 | $ | 1,833,001 | ||||||||||||||||||||||||||||||
|
|
|
|
|
|
|
|||||||||||||||||||||||||||||||
| Liabilities: |
||||||||||||||||||||||||||||||||||||
| Savings, NOW, and market rate accounts |
$ | 955,977 | 1,675 | 0.17 | % | $ | 955,977 | 1,757 | 0.18 | % | $ | 828,675 | 2,268 | 0.27 | % | |||||||||||||||||||||
| Wholesale deposits |
99,059 | 627 | 0.63 | % | 55,774 | 238 | 0.43 | % | 64,071 | 257 | 0.40 | % | ||||||||||||||||||||||||
| Time deposits |
126,097 | 596 | 0.47 | % | 162,397 | 763 | 0.47 | % | 195,778 | 1,507 | 0.77 | % | ||||||||||||||||||||||||
|
|
|
|
|
|
|
|
|
|
|
|
|
|||||||||||||||||||||||||
| Total interest-bearing deposits |
1,183,285 | 2,898 | 0.24 | % | 1,174,148 | 2,758 | 0.23 | % | 1,088,524 | 4,032 | 0.37 | % | ||||||||||||||||||||||||
| Subordinated debentures |
— | — | — | — | % | 18,327 | 931 | 5.08 | % | |||||||||||||||||||||||||||
| Short-term borrowings |
15,960 | 17 | 0.11 | % | 16,457 | 25 | 0.15 | % | 13,525 | 21 | 0.16 | % | ||||||||||||||||||||||||
| FHLB advances and other borrowings |
227,137 | 3,163 | 1.39 | % | 167,089 | 2,644 | 1.58 | % | 163,888 | 3,604 | 2.20 | % | ||||||||||||||||||||||||
|
|
|
|
|
|
|
|
|
|
|
|
|
|||||||||||||||||||||||||
| Total interest-bearing liabilities |
1,426,382 | 6,078 | 0.43 | % | 1,357,694 | 5,427 | 0.40 | % | 1,284,264 | 8,588 | 0.67 | % | ||||||||||||||||||||||||
| Non-interest-bearing deposits |
426,274 | 400,254 | 329,631 | |||||||||||||||||||||||||||||||||
| Other liabilities |
22,048 | 24,502 | 25,242 | |||||||||||||||||||||||||||||||||
|
|
|
|
|
|
|
|||||||||||||||||||||||||||||||
| Total non-interest-bearing liabilities |
448,322 | 424,756 | 354,873 | |||||||||||||||||||||||||||||||||
|
|
|
|
|
|
|
|||||||||||||||||||||||||||||||
| Total liabilities |
1,874,704 | 1,782,450 | 1,639,137 | |||||||||||||||||||||||||||||||||
| Shareholders’ equity |
240,778 | 212,050 | 193,864 | |||||||||||||||||||||||||||||||||
|
|
|
|
|
|
|
|||||||||||||||||||||||||||||||
| Total liabilities and shareholders’ equity |
$ | 2,115,482 | $ | 1,994,500 | $ | 1,833,001 | ||||||||||||||||||||||||||||||
|
|
|
|
|
|
|
|||||||||||||||||||||||||||||||
| Net interest spread |
3.81 | % | 3.87 | % | 3.69 | % | ||||||||||||||||||||||||||||||
| Effect of non-interest-bearing sources |
0.12 | % | 0.11 | % | 0.16 | % | ||||||||||||||||||||||||||||||
|
|
|
|
|
|
|
|
|
|
|
|
|
|||||||||||||||||||||||||
| Net interest income/margin on earning assets |
$ | 77,263 | 3.93 | % | $ | 73,421 | 3.98 | % | $ | 65,078 | 3.85 | % | ||||||||||||||||||||||||
|
|
|
|
|
|
|
|
|
|
|
|
|
|||||||||||||||||||||||||
| Tax-equivalent adjustment (tax rate 35%) |
$ | 435 | 0.02 | % | $ | 431 | 0.02 | % | $ | 343 | 0.02 | % | ||||||||||||||||||||||||
|
|
|
|
|
|
|
|
|
|
|
|
|
|||||||||||||||||||||||||
| (1) | Non-accrual loans have been included in average loan balances, but interest on non-accrual loans has not been included for purposes of determining interest income. |
| (2) | Includes portfolio loans and leases and loans held for sale. |
| (3) | Interest on loans and leases includes deferred fees (costs) of $248, $109 and $(12) for the years ended December 31, 2014, 2013 and 2012, respectively. |
36
Table of Contents
Tax-Equivalent Net Interest Income and Margin – 2014 Compared to 2013
The tax-equivalent net interest margin decreased 5 basis points to 3.93% for the twelve months ended December 31, 2014, as compared to 3.98%, for the same period in 2013.
Tax-equivalent net interest income for the twelve months ended December 31, 2014 of $77.3 million, was $3.8 million, or 5.2%, higher than the tax-equivalent net interest income of $73.4 million for the same period in 2013. Largely responsible for the increase was the $153.9 million increase in average loans and leases between the periods, with commercial real estate, commercial and industrial, construction and residential mortgages primarily contributing to the growth. Partially offsetting the increase in average loans and leases was a $68.7 million increase in interest-bearing liabilities comprised primarily of a $60.0 million increase in long-term FHLB advances and other borrowings. The increased funds from the borrowings along with the cash inflows from the investment portfolio helped to fund the strong loan demand. The tax-equivalent yield earned on portfolio loans for the twelve months ended December 31, 2014 decreased by 20 basis points, while the tax-equivalent rate paid on interest-bearing deposits increased by 1 basis point, as compared to the same period in 2013. The accretion of the fair value marks related to loans acquired in the FKB and FBD transactions increased the tax-equivalent net interest margin by 14 basis points for the twelve months ended December 31, 2014, as compared to 17 basis points for the same period in 2013. The effect of the decline in tax-equivalent yield earned on loans and leases was compensated for by the increase in the volume of loans and leases between the periods.
Tax-Equivalent Net Interest Income and Margin – 2013 Compared to 2012
The tax-equivalent net interest margin increased 13 basis points to 3.98% for the twelve months ended December 31, 2013, as compared to 3.85%, for the same period in 2012.
Tax-equivalent net interest income for the twelve months ended December 31, 2013 of $73.4 million, was $8.3 million, or 12.8%, higher than the tax-equivalent net interest income of $65.1 million for the same period in 2012. Largely responsible for the increase was the $144.4 million increase in average loans and leases between the periods as the $76.6 million of loans acquired from FBD in November of 2012 were supplemented by strong organic loan growth during 2013. Partially offsetting the increase in average loans and leases was an $85.6 million increase in interest-bearing deposits, a portion of which were acquired from FBD near the end of 2012. The accretion of the fair value marks related to loans acquired in the FKB and FBD transactions increased the tax-equivalent net interest margin by 17 basis points for the twelve months ended December 31, 2013, as compared to 10 basis points for the same period in 2012. The tax-equivalent rate paid on interest-bearing deposits declined 14 basis points for the twelve months ended December 31, 2013, to 0.23%, while the yield earned on loans and leases declined 17 basis points, to 5.10%. Although the decline in tax-equivalent yield earned on loans and leases outpaced the decline in tax-equivalent rate paid on interest-bearing deposits, the increase in the volume of loans and leases between the periods outpaced that of interest-bearing deposits by $58.8 million.
In addition to the strong loan growth experienced during 2013, the prepayment of the Corporation’s $22.5 million of subordinated debt during the third and fourth quarters of 2012 along with the prepayment of $20.0 million of higher-rate FHLB borrowings during the first quarter of 2013 contributed to the reduction in tax-equivalent rate paid on interest-bearing liabilities.
37
Table of Contents
Tax-Equivalent Net Interest Margin – Quarterly Comparison
The tax-equivalent net interest margin and related components for the past five quarters are shown in the table below:
| Quarter |
Year |
Earning-Asset |
Interest-Bearing |
Net Interest |
Effect of Non- |
Tax-Equivalent | ||||||
| 4th |
2014 | 4.14% | 0.43% | 3.71% | 0.13% | 3.84% | ||||||
| 3rd |
2014 | 4.18% | 0.43% | 3.75% | 0.12% | 3.87% | ||||||
| 2nd |
2014 | 4.34% | 0.42% | 3.92% | 0.11% | 4.03% | ||||||
| 1st |
2014 | 4.32% | 0.42% | 3.90% | 0.12% | 4.02% | ||||||
| 4th |
2013 | 4.33% | 0.40% | 3.93% | 0.10% | 4.03% |
Interest Rate Sensitivity
The Corporation actively manages its interest rate sensitivity position. The objectives of interest rate risk management are to control exposure of net interest income to risks associated with interest rate movements and to achieve sustainable growth in net interest income. The Corporation’s Asset Liability Committee (“ALCO”), using policies and procedures approved by the Corporation’s Board of Directors, is responsible for the management of the Corporation’s interest rate sensitivity position. The Corporation manages interest rate sensitivity by changing the mix, pricing and re-pricing characteristics of its assets and liabilities, through the management of its investment portfolio, its offerings of loan and selected deposit terms and through wholesale funding. Wholesale funding consists of multiple sources including borrowings from the FHLB, the Federal Reserve Bank of Philadelphia’s discount window, certificates of deposit from institutional brokers, Certificate of Deposit Account Registry Service (“CDARS”), Insured Network Deposit (“IND”) Program, Charity Deposits Corporation (“CDC”) (formerly known as Institutional Deposit Corporation (“IDC”)), Insured Cash Sweep (“ICS”) and Pennsylvania Local Government Investment Trust (“PLGIT”).
The Corporation uses several tools to manage its interest rate risk including interest rate sensitivity analysis, or gap analysis, market value of portfolio equity analysis, interest rate simulations under various rate scenarios and tax-equivalent net interest margin reports. The results of these reports are compared to limits established by the Corporation’s ALCO policies and appropriate adjustments are made if the results are outside the established limits.
The following table demonstrates the annualized result of an interest rate simulation and the estimated effect that a parallel interest rate shift, or “shock”, in the yield curve and subjective adjustments in deposit pricing, might have on the Corporation’s projected net interest income over the next 12 months.
This simulation assumes that there is no growth in interest-earning assets or interest-bearing liabilities over the next twelve months. The changes to net interest income shown below are in compliance with the Corporation’s policy guidelines.
Summary of Interest Rate Simulation
| Change in Net Interest December 31, 2014 |
Change in Net Interest December 31, 2013 |
|||||||||||||||
| Amount | Percentage | Amount | Percentage | |||||||||||||
| +300 basis points |
$ | 5,144 | 6.65 | % | $ | 6,289 | 8.19 | % | ||||||||
| +200 basis points |
$ | 2,812 | 3.64 | % | $ | 3,537 | 4.61 | % | ||||||||
| +100 basis points |
$ | 755 | 0.98 | % | $ | 1,146 | 1.49 | % | ||||||||
| -100 basis points |
$ | (1,983 | ) | (2.56 | )% | $ | (1,868 | ) | (2.43 | )% | ||||||
38
Table of Contents
The above interest rate simulation suggests that the Corporation’s balance sheet is slightly asset sensitive as of December 31, 2014 in the +100 basis point scenario, demonstrating that a 100 basis point increase in interest rates would have a small, but positive impact on net interest income over the next 12 months. The Corporation’s balance sheet is more asset-sensitive in the other rate increase and decrease scenarios. It should be noted, however, that the balance sheet is less asset sensitive, in a rising-rate environment, as of December 31, 2014 than it was as of December 31, 2013. This change in sensitivity is primarily related to a revision in the assumptions used for determining interest rate increases on non-maturity deposits in a rising-rate environment. The ALCO reviewed the model’s assumptions during the first quarter of 2014 and determined that a more reactive approach to adjusting deposit rates in rising-rate scenarios was appropriate, as the ongoing low-rate environment may have impacted customer behavior by heightening their sensitivity to rising rates.
The interest rate simulation is an estimate based on assumptions, which are derived from past behavior of customers, along with expectations of future behavior relative to interest rate changes. In today’s uncertain economic environment and the current extended period of very low interest rates, the reliability of the Corporation’s assumptions in the interest rate simulation model is more uncertain than in other periods. Actual customer behavior may be significantly different than expected behavior, which could cause an unexpected outcome and may result in lower net interest income.
Gap Analysis
The interest sensitivity, or gap analysis, identifies interest rate risk by showing repricing gaps in the Corporation’s balance sheet. All assets and liabilities are reflected based on behavioral sensitivity, which is usually the earliest of either: repricing, maturity, contractual amortization, prepayments or likely call dates. Non-maturity deposits, such as NOW, savings and money market accounts are spread over various time periods based on the expected sensitivity of these rates considering liquidity and the investment preferences of the Corporation. Non-rate-sensitive assets and liabilities are spread over time periods to reflect the Corporation’s view of the maturity of these funds.
39
Table of Contents
Non-maturity deposits (demand deposits in particular), are recognized by the Bank’s regulatory agencies to have different sensitivities to interest rate environments. Consequently, it is an accepted practice to spread non-maturity deposits over defined time periods in order to capture that sensitivity. Commercial demand deposits are often in the form of compensating balances, and fluctuate inversely to the level of interest rates; the maturity of these deposits is reported as having a shorter life than typical retail demand deposits. Additionally, the Bank’s regulatory agencies have suggested distribution limits for non-maturity deposits. However, the Corporation has taken a more conservative approach than these limits would suggest by forecasting these deposit types with a shorter maturity. The following table presents the Corporation’s gap analysis as of December 31, 2014:
| (dollars in millions) | 0 to 90 Days |
91 to 365 Days |
1 - 5 Years |
Over 5 Years |
Non-Rate Sensitive |
Total | ||||||||||||||||||
| Assets: |
||||||||||||||||||||||||
| Interest-bearing deposits with banks |
$ | 202.6 | $ | — | $ | — | $ | — | $ | — | $ | 202.6 | ||||||||||||
| Investment securities(1) |
48.1 | 64.8 | 90.6 | 30.0 | — | 233.5 | ||||||||||||||||||
| Loans and leases(2) |
479.6 | 201.8 | 733.9 | 240.8 | — | 1,656.1 | ||||||||||||||||||
| Allowance |
— | — | — | — | (14.6 | ) | (14.6 | ) | ||||||||||||||||
| Cash and due from banks |
— | — | — | — | 16.7 | 16.7 | ||||||||||||||||||
| Other assets |
— | — | — | — | 152.2 | 152.2 | ||||||||||||||||||
|
|
|
|
|
|
|
|
|
|
|
|
|
|||||||||||||
| Total assets |
$ | 730.3 | $ | 266.6 | $ | 824.5 | $ | 270.8 | $ | 154.3 | $ | 2,246.5 | ||||||||||||
|
|
|
|
|
|
|
|
|
|
|
|
|
|||||||||||||
| Liabilities and shareholders’ equity: |
||||||||||||||||||||||||
| Demand, non-interest-bearing |
$ | 28.1 | $ | 84.1 | $ | 121.8 | $ | 212.9 | $ | — | $ | 446.9 | ||||||||||||
| Savings, NOW and market rate |
69.4 | 208.3 | 479.0 | 225.9 | — | 982.6 | ||||||||||||||||||
| Time deposits |
32.8 | 49.0 | 36.6 | — | — | 118.4 | ||||||||||||||||||
| Wholesale non-maturity deposits |
66.7 | — | — | — | — | 66.7 | ||||||||||||||||||
| Wholesale time deposits |
3.2 | 24.1 | 46.2 | — | — | 73.5 | ||||||||||||||||||
| Short-term borrowings |
23.8 | — | — | — | — | 23.8 | ||||||||||||||||||
| FHLB advances and other borrowings |
55.3 | 5.1 | 191.7 | 8.0 | — | 260.1 | ||||||||||||||||||
| Other liabilities |
— | — | — | — | 29.0 | 29.0 | ||||||||||||||||||
| Shareholders’ equity |
8.7 | 17.5 | 140.3 | 79.0 | — | 245.5 | ||||||||||||||||||
|
|
|
|
|
|
|
|
|
|
|
|
|
|||||||||||||
| Total liabilities and shareholders’ equity |
$ | 288.0 | $ | 388.1 | $ | 1,015.6 | $ | 525.8 | $ | 29.0 | $ | 2,246.5 | ||||||||||||
|
|
|
|
|
|
|
|
|
|
|
|
|
|||||||||||||
| Interest-earning assets |
$ | 730.3 | $ | 266.6 | $ | 824.5 | $ | 270.8 | $ | — | $ | 2,092.2 | ||||||||||||
| Interest-bearing liabilities |
251.2 | 286.5 | 753.5 | 233.9 | — | 1,525.1 | ||||||||||||||||||
|
|
|
|
|
|
|
|
|
|
|
|
|
|||||||||||||
| Difference between interest-earning assets and interest-bearing liabilities |
$ | 479.1 | $ | (19.9 | ) | $ | 71.0 | $ | 36.9 | $ | — | $ | 567.1 | |||||||||||
|
|
|
|
|
|
|
|
|
|
|
|
|
|||||||||||||
| Cumulative difference between interest earning assets and interest-bearing liabilities |
$ | 479.1 | $ | 459.2 | $ | 530.1 | $ | 567.1 | $ | — | $ | 567.1 | ||||||||||||
|
|
|
|
|
|
|
|
|
|
|
|
|
|||||||||||||
| Cumulative earning assets as a % of cumulative interest bearing liabilities |
291 | % | 185 | % | 141 | % | 137 | % | ||||||||||||||||
| (1) | Investment securities include available for sale and trading. |
| (2) | Loans include portfolio loans and leases and loans held for sale. |
The table above indicates that the Corporation is asset sensitive and should experience an increase in net interest income in the near term, if interest rates rise. Accordingly, if rates decline, net interest income should decline. Actual results may differ from expected results for many reasons including market reactions, competitor responses, customer behavior and/or regulatory actions.
40
Table of Contents
Provision for Loan and Lease Losses
General Discussion of the Allowance for Loan and Lease Losses
The balance of the allowance for loan and lease losses is determined based on the Corporation’s review and evaluation of the loan and lease portfolio in relation to past loss experience, the size and composition of the portfolio, current economic events and conditions, and other pertinent factors, including the Corporation’s assumptions as to future delinquencies, recoveries and losses.
Increases to the Allowance are implemented through a corresponding Provision (expense) in the Corporation’s statement of income. Loans and leases deemed uncollectible are charged against the Allowance. Recoveries of previously charged-off amounts are credited to the Allowance.
While the Corporation considers the Allowance to be adequate, based on information currently available, future additions to the Allowance may be necessary due to changes in economic conditions or the Corporation’s assumptions as to future delinquencies, recoveries and losses and the Corporation’s intent with regard to the disposition of loans. In addition, the Pennsylvania Department of Banking and the Federal Reserve Bank of Philadelphia, as an integral part of their examination process, periodically review the Corporation’s Allowance.
The Corporation’s Allowance is comprised of four components that are calculated based on various independent methodologies. All components of the Allowance are based on Management’s estimates. These estimates are summarized earlier in this document under the heading “Critical Accounting Policies, Judgments and Estimates.”
The four components of the Allowance are as follows:
| • | Specific Loan Evaluation Component – Loans and leases for which management has reason to believe it is probable that it will not be able to collect all contractually due amounts of principal and interest are evaluated for impairment on an individual basis and a specific allocation of the Allowance is assigned, if necessary. |
| • | Historical Charge-Off Component – Homogeneous pools of loans are evaluated to determine average historic charge-off rates. Management applies a rolling, sixteen quarter charge-off history as a look-back period to determine these average charge-off rates. Management evaluates the length of this look-back period in order to determine its appropriateness. In addition, management develops an estimate of a loss emergence period for each segment of the loan portfolio. The loss emergence period estimates the time between the occurrence of a loss event for a borrower and an actual charge-off of a loan. |
| • | Qualitative Factors Component – Various qualitative factors are considered as they relate to the different homogeneous loan pools in order to adjust the historic charge-off rates so that they reflect current economic conditions that may not be accurately reflected in the historic charge-off rates. These factors may include delinquency trends, economic conditions, loan terms, credit grades, concentrations of credit, regulatory environment and other relevant factors. The resulting adjustments are combined with the historic charge-off rates and result in an allocation rate for each homogeneous loan pool. |
| • | Unallocated Component – This amount represents the margin of imprecision inherent in the underlying assumptions used in the methodologies for estimating the specific, historical, and qualitative losses in the portfolio discussed above. There are many factors considered, such as the inherent delay in obtaining information regarding a customer’s financial information or changes in their business condition, the judgmental nature of loan and lease evaluations, the delay in interpreting economic trends, and the judgmental nature of collateral assessments. |
As part of the process of calculating the Allowance for the different segments of the loan and lease portfolio, management considers certain credit quality indicators. For the commercial mortgage, construction and commercial and industrial loan segments, periodic reviews of the individual loans are performed by both in-
41
Table of Contents
house employees as well as an external loan review service. The results of these reviews are reflected in the risk grade assigned to each loan. These internally assigned grades are as follows:
| • | Pass – Loans considered satisfactory with no indications of deterioration. |
| • | Special mention – Loans classified as special mention have a potential weakness that deserves management’s close attention. If left uncorrected, these potential weaknesses may result in deterioration of the repayment prospects for the loan or of the institution’s credit position at some future date. |
| • | Substandard – Loans classified as substandard are inadequately protected by the current net worth and payment capacity of the obligor or of the collateral pledged, if any. Substandard loans have well-defined weaknesses that may jeopardize the liquidation of the collateral and repayment of the debt. They are characterized by the distinct possibility that the institution will sustain some loss if the deficiencies are not corrected. |
| • | Doubtful – Loans classified as doubtful have all the weaknesses inherent in those classified as substandard, with the added characteristic that the weaknesses make collection or liquidation in full, on the basis of currently existing facts, conditions, and values, highly questionable and improbable. Loan balances classified as doubtful have been reduced by partial charge-offs and are carried at their net realizable values. |
Consumer credit exposure, which includes residential mortgages, home equity lines and loans, leases and consumer loans, are assigned a credit risk profile based on payment activity (that is, their delinquency status).
Refer to Note 5-F in the Notes to Consolidated Financial Statements for details regarding credit quality indicators associated with the Corporation’s loan and lease portfolio.
Portfolio Segmentation – The Corporation’s loan and lease portfolio is divided into specific segments of loans and leases having similar characteristics. These segments are as follows:
| • | Commercial mortgage |
| • | Home equity lines and loans |
| • | Residential mortgage |
| • | Construction |
| • | Commercial and industrial |
| • | Consumer |
| • | Leases |
Refer to Note 5 in the Notes to Consolidated Financial Statements and page 41 of this MD&A under the heading Portfolio Loans and Leases for details of the Corporation’s loan and lease portfolio, broken down by portfolio segment.
Impairment Measurement – In accordance with guidance provided by ASC 310-10, “Accounting by Creditors for Impairment of a Loan”, the Corporation employs one of three methods to determine and measure impairment:
| • | the Present Value of Future Cash Flow Method; |
| • | the Fair Value of Collateral Method; |
| • | the Observable Market Price of a Loan Method. |
42
Table of Contents
Loans and leases for which there is an indication that all contractual payments may not be collectible are evaluated for impairment on an individual basis. Loans that are evaluated on an individual basis include non-performing loans, troubled debt restructurings and purchased credit-impaired loans.
Nonaccrual Loans – In general, loans and leases that are delinquent on contractually due principal or interest payments for more than 89 days are placed on nonaccrual status and any unpaid interest is reversed as a charge to interest income. When the loan resumes payment, all payments (principal and interest) are applied to reduce principal. After a period of six months of satisfactory performance, the loan may be placed back on accrual status. Any interest payments received during the nonaccrual period that had been applied to reduce principal are reversed and recorded as a deferred fee which accretes to interest income over the remaining term of the loan or lease. In certain cases, the Corporation may have information about a particular loan or lease that may indicate a future disruption or curtailment of contractual payments. In these cases, the Corporation will preemptively place the loan or lease on nonaccrual status.
Troubled Debt Restructurings (“TDRs”) – The Corporation follows guidance provided by ASC 310-40, “Troubled Debt Restructurings by Creditors.” A restructuring of a debt constitutes a TDR if the creditor, for economic or legal reasons related to the debtor’s financial difficulties grants a concession to the debtor that it would not otherwise consider in the normal course of business. A concession may include an extension of repayment terms which would not normally be granted, a reduction of interest rate or the forgiveness of principal and/or accrued interest. If the debtor is experiencing financial difficulty and the creditor has granted a concession, the Corporation will make the necessary disclosures related to the TDR. In certain cases, a modification may be made in an effort to retain a customer who is not experiencing financial difficulty. This type of modification is not considered to be a TDR. Once a loan or lease has been modified and is considered a TDR, it is reported as an impaired loan or lease. If the loan or lease deemed a TDR has performed for at least six months at the level prescribed by the modification, it is not considered to be non-performing; however, it will generally continue to be reported as impaired. Loans and leases that have performed for at least six months are reported as TDRs in compliance with modified terms.
Refer to Note 5-G in the Notes to Consolidated Financial Statements for more information regarding the Corporation’s TDRs.
Charge-off Policy – The Corporation’s charge-off policy is that, on a periodic basis, not less often than quarterly, delinquent and non-performing loans that exceed the following limits are considered for charge-off:
| • | Open-ended consumer loans exceeding 180 days past due. |
| • | Closed-ended consumer loans exceeding 120 days past due. |
| • | All commercial/business purpose loans exceeding 180 days past due. |
| • | All leases exceeding 120 days past due. |
Any other loan or lease, for which the Corporation has reason to believe collectability is unlikely, and for which sufficient collateral does not exist, is also charged off.
Refer to Note 5-F in the Notes to Consolidated Financial Statements for more information regarding the Corporation’s charge-offs and factors which influenced Management’s judgment with respect thereto.
Loans Acquired in Mergers and Acquisitions
In accordance with GAAP, the loans acquired from FKF and FBD were recorded at their fair value with no carryover of the previously associated allowance for loan loss.
43
Table of Contents
Certain loans were acquired which exhibited deteriorated credit quality since origination and for which the Corporation does not expect to collect all contractual payments. Accounting for these purchased credit-impaired loans is done in accordance with ASC 310-30, “Accounting for Certain Loans or Debt Securities Acquired in a Transfer”. The loans were recorded at fair value, reflecting the present value of the amounts expected to be collected. Income recognition on these loans is based on a reasonable expectation about the timing and amount of cash flows to be collected. Acquired loans deemed impaired and considered collateral dependent, with the timing of the sale of loan collateral indeterminate, remain on non-accrual status and have no accretable yield.
Management evaluates purchased credit-impaired loans individually for further impairment. The balance of the Corporation’s loan and lease portfolio is evaluated on either an individual basis or on a collective basis for impairment. Refer to Notes 5-F and 5-H in the Notes to Consolidated Financial Statements for a more information regarding the Corporation’s impaired loans and leases.
Asset Quality and Analysis of Credit Risk
As of December 31, 2014, total non-performing loans and leases were $10.1 million, representing 0.61% of portfolio loans and leases, as compared to $10.5 million, or 0.68% of portfolio loans and leases, as of December 31, 2013. The $434 thousand decrease in non-performing loans and leases was related to a $1.1 million decrease in nonperforming commercial and industrial loans, a $567 thousand decrease in nonperforming construction loans and a $201 thousand decrease in nonperforming home equity loans and lines. These decreases were partially offset by a $1.3 million increase in nonperforming residential mortgage loans.
The Provision for each of the twelve month periods ended December 31, 2014, 2013 and 2012 was $884 thousand, $3.6 million and $4.0 million, respectively. As of December 31, 2014, the Allowance of $14.6 million represents 0.88% of portfolio loans and leases, as compared to the Allowance, as of December 31, 2013, of $15.5 million, which represented 1.00% of portfolio loans and leases as of that date. The decrease in the Allowance, as a percentage of portfolio loans and leases, from December 31, 2013 to December 31, 2014, is reflective of management’s consideration of historic charge-off rates combined with various qualitative factors related to the loan portfolio as well as improving economic indicators as of December 31, 2014.
As of December 31, 2014, the Corporation had other real estate owned (“OREO”) valued at $1.1 million, as compared to $855 thousand as of December 31, 2013. The properties comprising the balance as of December 31, 2014 include four single-family residential properties. All properties are recorded at their estimated fair values less costs to sell.
As of December 31, 2014, the Corporation had $8.5 million of TDRs, of which $4.2 million were in compliance with the modified terms for six months or greater, and hence, excluded from non-performing loans and leases. As of December 31, 2013, the Corporation had $9.0 million of TDRs, of which $7.3 million were in compliance with the modified terms.
Impaired loans and leases are those for which it is probable that the Corporation will not be able to collect all scheduled principal and interest payments in accordance with the original terms of the loans and leases. Included in impaired loans and leases are non-accrual loans and leases and TDRs. Purchased credit-impaired loans are not included in impaired loan and lease totals. As of December 31, 2014, the Corporation had $13.7 million of impaired loans and leases, as compared to impaired loans and leases of $17.6 million as of December 31, 2013. Refer to Note 5-H in the Notes to Consolidated Financial Statements for more information regarding the Corporation’s impaired loans and leases.
The Corporation continues to be diligent in its credit underwriting process and very proactive with its loan review process, including the services of an independent outside loan review firm, which helps identify developing credit issues. These proactive steps include the procurement of additional collateral (preferably
44
Table of Contents
outside the current loan structure) whenever possible and frequent contact with the borrower. Management believes that timely identification of credit issues and appropriate actions early in the process serve to mitigate overall losses.
Non-Performing Assets, TDRs and Related Ratios as of or for the Twelve Months Ended December 31,
| (dollars in thousands) | 2014 | 2013 | 2012 | 2011 | 2010 | |||||||||||||||
| Non-accrual loans and leases |
$ | 10,096 | $ | 10,530 | $ | 14,040 | $ | 14,315 | $ | 9,497 | ||||||||||
| Loans 90 days or more past due and still accruing |
— | — | 728 | — | 10 | |||||||||||||||
|
|
|
|
|
|
|
|
|
|
|
|||||||||||
| Total non-performing loans and leases |
10,096 | 10,530 | 14,768 | 14,315 | 9,507 | |||||||||||||||
| Other real estate owned |
1,147 | 855 | 906 | 549 | 2,527 | |||||||||||||||
|
|
|
|
|
|
|
|
|
|
|
|||||||||||
| Total non-performing assets |
$ | 11,243 | $ | 11,385 | $ | 15,674 | $ | 14,864 | $ | 12,034 | ||||||||||
|
|
|
|
|
|
|
|
|
|
|
|||||||||||
| Troubled debt restructurings included in non-performing assets |
$ | 4,315 | $ | 1,699 | $ | 3,106 | $ | 4,300 | $ | 1,879 | ||||||||||
| TDRs in compliance with modified terms |
4,157 | 7,277 | 8,008 | 7,166 | 4,693 | |||||||||||||||
|
|
|
|
|
|
|
|
|
|
|
|||||||||||
| Total TDRs |
$ | 8,472 | $ | 8,976 | $ | 11,114 | $ | 11,466 | $ | 6,572 | ||||||||||
|
|
|
|
|
|
|
|
|
|
|
|||||||||||
| Allowance for loan and lease losses to non-performing loans and leases |
144.5 | % | 147.3 | % | 97.7 | % | 89.1 | % | 108.1 | % | ||||||||||
| Non-performing loans and leases to total loans and leases |
0.61 | % | 0.68 | % | 1.06 | % | 1.11 | % | 0.79 | % | ||||||||||
| Allowance for loan losses to total portfolio loans and leases |
0.88 | % | 1.00 | % | 1.03 | % | 0.98 | % | 0.86 | % | ||||||||||
| Non-performing assets to total assets |
0.50 | % | 0.55 | % | 0.77 | % | 0.84 | % | 0.69 | % | ||||||||||
| Period end portfolio loans and leases |
$ | 1,652,257 | $ | 1,547,185 | $ | 1,398,456 | $ | 1,295,392 | $ | 1,196,717 | ||||||||||
| Average portfolio loans and leases |
$ | 1,608,248 | $ | 1,453,555 | $ | 1,307,140 | $ | 1,250,071 | $ | 1,037,158 | ||||||||||
| Allowance for loan and lease losses |
$ | 14,586 | $ | 15,515 | $ | 14,425 | $ | 12,753 | $ | 10,275 | ||||||||||
| Interest income that would have been recorded on impaired loans if the loans had been current in accordance with their original terms and had been outstanding throughout the period or since origination |
$ | 533 | $ | 1,074 | $ | 1,417 | $ | 1,445 | $ | 838 | ||||||||||
| Interest income on impaired loans included in net income for the period |
$ | 341 | $ | 365 | $ | 507 | $ | 550 | $ | 436 | ||||||||||
As of December 31, 2014, the Corporation is not aware of any loan or lease, other than those disclosed in the table above, for which it has any serious doubt as to the borrower’s ability to pay in accordance with the terms of the loan.
45
Table of Contents
Summary of Changes in the Allowance for Loan and Lease Losses
| (dollars in thousands) | 2014 | 2013 | 2012 | 2011 | 2010 | |||||||||||||||
| Balance, January 1 |
$ | 15,515 | $ | 14,425 | $ | 12,753 | $ | 10,275 | $ | 10,424 | ||||||||||
| Charge-offs: |
||||||||||||||||||||
| Consumer |
(144 | ) | (194 | ) | (96 | ) | (92 | ) | (456 | ) | ||||||||||
| Commercial and industrial |
(415 | ) | (781 | ) | (458 | ) | (633 | ) | (7,019 | ) | ||||||||||
| Real estate |
(1,231 | ) | (891 | ) | (818 | ) | (1,732 | ) | (689 | ) | ||||||||||
| Construction |
— | (737 | ) | (1,131 | ) | (1,174 | ) | (135 | ) | |||||||||||
| Leases |
(410 | ) | (376 | ) | (364 | ) | (1,017 | ) | (2,395 | ) | ||||||||||
|
|
|
|
|
|
|
|
|
|
|
|||||||||||
| Total charge-offs |
(2,200 | ) | (2,979 | ) | (2,867 | ) | (4,648 | ) | (10,694 | ) | ||||||||||
| Recoveries: |
||||||||||||||||||||
| Consumer |
17 | 10 | 7 | 11 | 2 | |||||||||||||||
| Commercial and industrial |
98 | 65 | 143 | 307 | — | |||||||||||||||
| Real estate |
47 | 105 | 79 | 190 | 15 | |||||||||||||||
| Construction |
60 | 24 | 15 | — | — | |||||||||||||||
| Leases |
165 | 290 | 292 | 530 | 674 | |||||||||||||||
|
|
|
|
|
|
|
|
|
|
|
|||||||||||
| Total Recoveries |
387 | 494 | 536 | 1,038 | 691 | |||||||||||||||
|
|
|
|
|
|
|
|
|
|
|
|||||||||||
| Net charge-offs |
(1,813 | ) | (2,485 | ) | (2,331 | ) | (3,610 | ) | (10,003 | ) | ||||||||||
| Provision for loan and lease losses |
884 | 3,575 | 4,003 | 6,088 | 9,854 | |||||||||||||||
|
|
|
|
|
|
|
|
|
|
|
|||||||||||
| Balance, December 31 |
$ | 14,586 | $ | 15,515 | $ | 14,425 | $ | 12,753 | $ | 10,275 | ||||||||||
|
|
|
|
|
|
|
|
|
|
|
|||||||||||
| Ratio of net charge-offs to average portfolio loans outstanding |
0.11 | % | 0.17 | % | 0.18 | % | 0.29 | % | 0.96 | % | ||||||||||
Allocation of Allowance for Loan and Lease Losses
The following table sets forth an allocation of the allowance for loan and lease losses by portfolio segment. The specific allocations in any particular portfolio segment may be changed in the future to reflect then-current conditions. Accordingly, the Corporation considers the entire allowance to be available to absorb losses in any portfolio segment.
| December 31, | ||||||||||||||||||||||||||||||||||||||||
| 2014 | 2013 | 2012 | 2011 | 2010 | ||||||||||||||||||||||||||||||||||||
| (dollars in thousands) | % Loans to Total Loans |
% Loans to Total Loans |
% Loans to Total Loans |
% Loans to Total Loans |
% Loans to Total Loans |
|||||||||||||||||||||||||||||||||||
| Allowance at end of period applicable to: |
||||||||||||||||||||||||||||||||||||||||
| Commercial mortgage |
$ | 3,948 | 41.8 | % | $ | 3,797 | 40.4 | % | $ | 3,907 | 39.1 | % | $ | 3,165 | 32.4 | % | $ | 2,534 | 32.2 | % | ||||||||||||||||||||
| Home equity lines and loans |
1,917 | 11.0 | 2,204 | 12.3 | 1,857 | 13.9 | 1,707 | 16.0 | 1,563 | 18.1 | ||||||||||||||||||||||||||||||
| Residential mortgage |
1,736 | 19.0 | 2,446 | 19.4 | 2,024 | 20.6 | 1,592 | 23.7 | 843 | 21.9 | ||||||||||||||||||||||||||||||
| Construction |
1,367 | 4.0 | 845 | 3.0 | 1,019 | 1.9 | 1,384 | 4.1 | 633 | 3.8 | ||||||||||||||||||||||||||||||
| Commercial and industrial |
4,533 | 20.3 | 5,011 | 21.2 | 4,637 | 20.9 | 3,816 | 20.6 | 3,565 | 20.0 | ||||||||||||||||||||||||||||||
| Consumer |
238 | 1.1 | 259 | 1.1 | 189 | 1.3 | 119 | 0.9 | 115 | 1.0 | ||||||||||||||||||||||||||||||
| Leases |
468 | 2.8 | 604 | 2.6 | 493 | 2.3 | 532 | 2.3 | 766 | 3.0 | ||||||||||||||||||||||||||||||
| Unallocated |
379 | — | 349 | — | 299 | — | 438 | — | 256 | — | ||||||||||||||||||||||||||||||
|
|
|
|
|
|
|
|
|
|
|
|
|
|
|
|
|
|
|
|
|
|||||||||||||||||||||
| Total |
$ | 14,586 | 100.0 | % | $ | 15,515 | 100.0 | % | $ | 14,425 | 100.0 | % | $ | 12,753 | 100.0 | % | $ | 10,275 | 100.0 | % | ||||||||||||||||||||
|
|
|
|
|
|
|
|
|
|
|
|
|
|
|
|
|
|
|
|
|
|||||||||||||||||||||
46
Table of Contents
Non-Interest Income
2014 Compared to 2013
Non-interest income for the twelve months ended December 31, 2014 was $48.3 million, a slight decrease of $33 thousand as compared to the same period in 2013. An increase of $1.6 million in wealth management revenue along with increases of $479 thousand, $475 thousand and $559 thousand in net gain on sale of investment securities available for sale, net gain on sale of other real estate owned, and insurance commissions, respectively, were offset by a $2.4 million decrease in net gain on sale of residential mortgages between the periods.
The increase in wealth management services revenue is the result of the success of the Wealth Management Division’s strategic initiatives, market appreciation and other new business between the dates, which helped increase the division’s assets under management, administration, supervision and brokerage by $432 million, to $7.7 billion as of December 31, 2014 from $7.3 billion as of December 31, 2013.
The decrease in the gain on sale of residential mortgage loans was the result of the decline in the volume of residential mortgage loans originated for resale. For the twelve months ended December 31, 2014, the Corporation originated $55.6 million of residential mortgage loans for resale, as compared to $129.0 million for the same period in 2013. The decrease in the volume of residential mortgage loan originations was primarily the result of rising interest rates, which substantially curtailed the refinancing boom that had wound down by the second quarter of 2013.
The increase in the gain on sale of available for sale investment securities was related to the Corporation’s effort to reduce the duration of its portfolio in anticipation of the acquisition of the CBHI portfolio, which will have a longer duration. The sale of $23.9 million of available for sale investment securities resulted in a net gain on sale of $471 thousand for the twelve months ended December 31, 2013, as compared to a net loss on sale of $8 thousand for the same period in 2013.
The increase in net gain on sale of other real estate owned was the result of the sale of seven bank-owned properties during the twelve months ended December 31, 2014 for which the Corporation recorded net gain on sale of $175 thousand, an increase of $475 thousand from the $300 thousand loss recorded in 2013.
The $559 thousand increase in insurance commission income was a direct result of the October 1, 2014 acquisition of PCPB and reflects only one quarter of revenue from this new subsidiary.
2013 Compared to 2012
For the twelve months ended December 31, 2013, non-interest income was $48.4 million, an increase of $2.0 million from the $46.4 million for the same period in 2012. Contributing to this increase was the $5.4 million, or 18.1%, increase in fees for wealth management services from $29.8 million for the twelve months ended December 31, 2012, to $35.2 million for the same period in 2013. Substantially offsetting the increase in wealth management revenue was a $2.6 million decrease in the gain on sale of residential mortgage loans and a $1.4 million decrease in the gain on sale of available for sale investment securities.
The increase in wealth management services revenue is partially the result of a full year’s impact of the wealth assets acquired in the May 2012 DTC acquisition, which initially added $1.0 billion to the Corporation’s assets under management, administration, supervision and brokerage, as compared to only a seven month impact in 2012. In addition, the success of the Wealth Management division’s strategic initiatives, market appreciation and other new business between the dates helped increase the division’s assets under management, administration, supervision and brokerage by $605 million, to $7.3 billion.
The decrease in the gain on sale of residential mortgage loans was the result of a sharp decline in the volume of residential mortgage loans originated for resale. For the twelve months ended December 31, 2013, the Corporation originated $129.0 million of residential mortgage loans for resale, as compared to $204.8 million for
47
Table of Contents
the same period in 2012. The decrease in the volume of residential mortgage loan originations was the result of rising interest rates, which substantially curtailed the refinancing boom that had occurred between the third quarter of 2012 and the second quarter of 2013.
The decrease in the gain on sale of available for sale investment securities was related to the Corporation’s effort to reduce the duration of its portfolio. The sale of these investments resulted in a net loss on sale of $8 thousand for the twelve months ended December 31, 2013, as compared to a net gain on sale of $1.4 million for the same period in 2012.
Non-Interest Expense
2014 Compared to 2013
Non-interest expense for the twelve months ended December 31, 2014 was $81.4 million, an increase of $678 thousand, as compared to the same period in 2013. The increase was comprised of increases of $443 thousand and $531 thousand in occupancy and furniture, fixtures and equipment expense, respectively. The increases in these two categories were related to certain infrastructure improvement projects, including systems upgrades, which were completed and placed into service during 2014, as well as the newly acquired offices of PCPB. In addition, due diligence and merger-related expenses increased by $488 thousand for the twelve months ended December 31, 2014 as compared to the same period in 2013, related to the October 2014 PCPB transaction and the CBHI merger, which was completed on January 1, 2015. Professional fees for 2014 increased by $561 thousand, as the Corporation engaged the services of consultants related to the development and implementation of various systems upgrades. These cost increases were partially offset by a $264 thousand decrease in amortization of mortgage servicing rights, related to the slow-down in mortgage refinancing activity and a $347 thousand decrease in costs associated with early extinguishment of debt that occurred in 2013. A $767 thousand increase in salaries and wages for twelve months ended December 31, 2014, as compared to the same period in 2013 was related to the additional staff from PCPB as well as annual increases. The $690 thousand gain on curtailment of nonqualified pension plan that occurred in 2013 was not repeated in 2014. Offsetting these increases was a $1.5 million decrease in employee benefits expense related to reduced pension costs. In addition, other operating expense decreased by $1.1 million during the twelve months ended December 31, 2014, as compared to the same period in 2013. Refer to Note 21 in the Notes to Consolidated Financial Statements for further details regarding the decrease in other operating expenses between the periods. As a result of actuarial assumptions related to the Corporation’s pension plans, management expects the employee benefits expense related to the pension to increase by approximately $1.8 million in 2015 as compared to 2014. The expense increase is related to a 90 basis point reduction in the discount rate, the transition to new mortality tables and the lower-than-anticipated return on pension assets during 2014.
2013 Compared to 2012
Non-interest expense for the twelve months ended December 31, 2013 was $80.7 million, an increase of $5.8 million, or 7.8%, as compared to the same period in 2012. The increase was comprised of increases of $3.9 million and $1.2 million in salaries and employee benefits and occupancy-related expenses, respectively. These personnel and facilities-related expenses were partially related to the full-service branch that opened in Bala Cynwyd at the end of 2012, a full year of staff and office space in connection with the May 2012 acquisition of DTC, increased stock-based compensation costs, along with annual salary increases. In addition, other operating expenses increased by $2.6 million in 2013, as compared to 2012. The increase in other operating expenses was related to increased telecommunication costs, information technology costs and deferred compensation expense. Refer to Note 21 in the Notes to Consolidated Financial Statements for further details regarding the increase in other operating expenses between the periods. Partially offsetting these cost increases was a $744 thousand decrease in due diligence and merger-related expenses and a $690 thousand gain on the curtailment of a nonqualified defined-benefit pension plan.
48
Table of Contents
Secondary Market Sold-Loan Repurchase Demands
In the course of originating residential mortgage loans and selling those loans in the secondary market, the Corporation makes various representations and warranties to the purchasers of the mortgage loans. Each residential mortgage loan originated by the Corporation is evaluated by an automated underwriting application, which verifies the underwriting criteria and certifies the loan’s eligibility for sale to the secondary market. Any exceptions discovered during this process are remedied prior to sale. These representations and warranties also apply to underwriting the real estate appraisal opinion of value for the collateral securing these loans. Under the representations and warranties, failure by the Corporation to comply with the underwriting and appraisal standards could result in the Corporation’s being required to repurchase the mortgage loan or to reimburse the investor for losses incurred (make whole requests) if such failure cannot be cured by the Corporation within the specified period following discovery. For the twelve months ended December 31, 2014, 2013 and 2012, the Corporation has received a limited number of investor repurchase demands and recorded a contingent liability for their settlement. The accruals related to investor repurchase demands totaled $78 thousand and $66 thousand for the twelve months ended December 31, 2013 and 2012, respectively, and were included in other non-interest expense. There was no accrual for investor repurchase demands recorded in 2014.
Income Taxes
Income taxes for the twelve months ended December 31, 2014 were $15.0 million as compared to $12.6 million and $11.1 million for the same periods in 2014 and 2013, respectively. The effective tax rate for the twelve month periods ended December 31, 2014, 2013 and 2012 was 35.0%, 34.0% and 34.3%, respectively. The increase in effective tax rate for 2014 as compared to 2013 was related to the non-tax-deductibility of certain due diligence and merger-related expenses incurred during 2014. The slight decrease in the effective tax rate for the twelve months ended December 31, 2013, as compared to the rate for the same period in 2012, was primarily related to a change in method used to account for the Corporation’s deferred compensation plan, which resulted in a tax benefit not previously recognized. For more information related to income taxes, refer to Note 17 in the Notes to Consolidated Financial Statements.
Balance Sheet Analysis
Asset Changes
Total assets as of December 31, 2014 increased to $2.25 billion from $2.06 billion as of December 31, 2013. The $184.8 million increase was attributable to a $138.2 million increase in cash and cash equivalents and $105.1 million increase in portfolio loans and leases which were partially offset by a decreases of $56.2 million in available for sale investment securities. Cash flows from maturities, calls, and paydowns of investment securities, as well as increases in deposits and borrowings, were used to fund the loan originations during 2014.
49
Table of Contents
Investment Portfolio – The $56.2 million decrease from December 31, 2013 to December 31, 2014 in available for sale investment securities was comprised primarily of the decrease in mortgage-related securities between the dates. This decrease was related to the Corporation’s strategy of shortening the duration of the available for sale portfolio in anticipation of the acquisition of the CBHI portfolio, which will have a longer duration. For more information about the components of the Corporation’s available for sale investments, refer to Note 4 in the Notes to Consolidated Financial Statements. As of both December 31, 2014 and December 31, 2013, the Corporation’s investment securities held in trading accounts were comprised of a deferred compensation trust which is invested in marketable securities whose diversification is at the discretion of the deferred compensation plan participants.
The following table details the maturity and weighted average yield (3) of the available for sale investment portfolio (2) as of December 31, 2014:
| (dollars in thousands) | Maturing During 2015 |
Maturing From 2016 Through 2019 |
Maturing From 2020 Through 2024 |
Maturing After 2024 |
Total | |||||||||||||||
| U.S. Treasury securities: |
||||||||||||||||||||
| Amortized cost |
$ | — | $ | 102 | $ | — | $ | — | $ | 102 | ||||||||||
| Weighted average yield |
1.03 | % | 1.03 | % | ||||||||||||||||
| Obligations of the U.S. government and agencies: |
||||||||||||||||||||
| Amortized cost |
8,005 | 41,862 | 17,014 | 66,881 | ||||||||||||||||
| Weighted average yield |
0.50 | % | 0.97 | % | 1.45 | % | 1.03 | % | ||||||||||||
| State and political subdivisions(3): |
||||||||||||||||||||
| Amortized cost |
6,349 | 16,469 | 6,137 | — | 28,955 | |||||||||||||||
| Weighted average yield |
0.96 | % | 1.42 | % | 1.54 | % | 1.34 | % | ||||||||||||
| Mortgage-related securities(1): |
||||||||||||||||||||
| Amortized cost |
— | 1,745 | 34,611 | 77,760 | 114,116 | |||||||||||||||
| Weighted average yield |
2.54 | % | 2.37 | % | 2.24 | % | 2.29 | % | ||||||||||||
| Other investment securities: |
||||||||||||||||||||
| Amortized cost |
900 | 1,000 | — | — | 1,900 | |||||||||||||||
| Weighted average yield |
1.22 | % | 1.40 | % | 1.31 | % | ||||||||||||||
|
|
|
|
|
|
|
|
|
|
|
|||||||||||
| Total amortized cost |
$ | 15,254 | $ | 61,178 | $ | 57,762 | $ | 77,760 | $ | 211,954 | ||||||||||
|
|
|
|
|
|
|
|
|
|
|
|||||||||||
| Weighted average yield |
0.74 | % | 1.14 | % | 2.01 | % | 2.24 | % | 1.75 | % | ||||||||||
| (1) | Mortgage-related securities are included in the above table based on their contractual maturity. However, mortgage-related securities, by design, have scheduled monthly principal payments which are not reflected in this table. |
| (2) | Excluded from the above table is the Corporation’s investment in bond mutual funds with an amortized cost of $15.6 million, which have no stated maturity or constant stated yield. |
| (3) | Weighted average yields on tax-exempt obligations have not been computed on a tax-equivalent basis. |
50
Table of Contents
The following table details the amortized cost of the available for sale investment portfolio as of the dates indicated:
| Amortized Cost as of December 31, | ||||||||||||
| (dollars in thousands) | 2014 | 2013 | 2012 | |||||||||
| Obligations of the U.S. government and agencies |
$ | 66,881 | $ | 71,097 | $ | 73,183 | ||||||
| Obligations of the U.S. Treasury |
102 | 102 | — | |||||||||
| Obligations of state and political subdivisions |
28,955 | 37,140 | 30,244 | |||||||||
| Mortgage-backed securities |
79,498 | 119,044 | 128,537 | |||||||||
| Collateralized mortgage obligations |
34,618 | 44,463 | 62,116 | |||||||||
| Other investments |
17,499 | 15,281 | 17,667 | |||||||||
|
|
|
|
|
|
|
|||||||
| Total amortized cost |
$ | 227,553 | $ | 287,127 | $ | 311,747 | ||||||
|
|
|
|
|
|
|
|||||||
Portfolio Loans and Leases
The table below details the loan portfolio as of the dates indicated:
| December 31, | ||||||||||||||||||||
| (dollars in thousands) | 2014 | 2013 | 2012 | 2011 | 2010 | |||||||||||||||
| Commercial mortgage |
$ | 689,528 | $ | 625,341 | $ | 546,358 | $ | 419,130 | $ | 385,615 | ||||||||||
| Home equity lines & loans |
182,082 | 189,571 | 194,861 | 207,917 | 216,853 | |||||||||||||||
| Residential mortgage |
313,442 | 300,243 | 288,212 | 306,478 | 261,983 | |||||||||||||||
| Construction |
66,267 | 46,369 | 26,908 | 52,844 | 45,403 | |||||||||||||||
| Commercial & industrial |
335,645 | 328,459 | 291,620 | 267,204 | 239,266 | |||||||||||||||
| Consumer |
18,480 | 16,926 | 17,666 | 11,429 | 12,200 | |||||||||||||||
| Leases |
46,813 | 40,276 | 32,831 | 30,390 | 35,397 | |||||||||||||||
|
|
|
|
|
|
|
|
|
|
|
|||||||||||
| Total portfolio loans and leases |
1,652,257 | 1,547,185 | 1,398,456 | 1,295,392 | 1,196,717 | |||||||||||||||
| Loans held for sale |
3,882 | 1,350 | 3,412 | 1,588 | 4,838 | |||||||||||||||
|
|
|
|
|
|
|
|
|
|
|
|||||||||||
| Total |
$ | 1,656,139 | $ | 1,548,535 | $ | 1,401,868 | $ | 1,296,980 | $ | 1,201,555 | ||||||||||
|
|
|
|
|
|
|
|
|
|
|
|||||||||||
The following table summarizes the loan maturity distribution and interest rate sensitivity as of December 31, 2014. Excluded from the table are residential mortgage, home equity lines and loans and consumer loans:
| (dollars in thousands) | Maturing During 2015 |
Maturing From 2016 Through 2019 |
Maturing After 2019 |
Total | ||||||||||||
| Loan portfolio maturity: |
||||||||||||||||
| Commercial and industrial |
$ | 139,098 | $ | 108,316 | $ | 88,231 | $ | 335,645 | ||||||||
| Construction |
55,829 | 10,438 | — | 66,267 | ||||||||||||
| Commercial mortgage |
21,073 | 326,482 | 341,973 | 689,528 | ||||||||||||
| Leases |
3,417 | 43,354 | 42 | 46,813 | ||||||||||||
|
|
|
|
|
|
|
|
|
|||||||||
| Total |
$ | 219,417 | $ | 488,590 | $ | 430,246 | $ | 1,138,253 | ||||||||
|
|
|
|
|
|
|
|
|
|||||||||
| Interest sensitivity on the above loans: |
||||||||||||||||
| Loans with predetermined rates |
$ | 50,072 | $ | 434,388 | $ | 169,477 | $ | 653,937 | ||||||||
| Loans with adjustable or floating rates |
169,345 | 54,202 | 260,769 | 484,316 | ||||||||||||
|
|
|
|
|
|
|
|
|
|||||||||
| Total |
$ | 219,417 | $ | 488,590 | $ | 430,246 | $ | 1,138,253 | ||||||||
|
|
|
|
|
|
|
|
|
|||||||||
51
Table of Contents
The list below identifies certain key characteristics of the Corporation’s loan and lease portfolio. Refer to the loan and lease portfolio tables in Note 5 in the Notes to Consolidated Financial Statements and page 41 of this MD&A under the heading Portfolio Loans and Leases for further details.
| • | Portfolio Loans and Leases – The Corporation’s $1.65 billion loan and lease portfolio is predominantly based in the Corporation’s traditional market areas of Chester, Delaware and Montgomery counties in Pennsylvania, New Castle county in Delaware, and in the greater Philadelphia area, none of which has experienced the real estate price appreciation and subsequent decline that many other areas of the country have experienced over the last ten years. |
| • | Concentrations – The Corporation has a significant portion of its portfolio loans (excluding leases) in real estate-related loans. As of December 31, 2014, loans secured by real estate were $1.25 billion or 75.7% of the total loan portfolio of $1.65 billion. A predominant percentage of the Corporation’s real estate exposure, both commercial and residential, is within Pennsylvania. The Corporation is aware of this concentration and mitigates this risk to the extent possible in many ways, including the underwriting and assessment of the borrower’s capacity to repay, equity in the underlying real estate collateral and a review of a borrower’s global cash flows. The Corporation has recourse against a substantial portion of the loans in the real estate portfolio. |
| In addition to loans secured by real estate, commercial and industrial loans comprise 20.3% of the total loan portfolio as of December 31, 2014. |
| • | Construction – The construction portfolio of $66.3 million accounts for 4.0% of the total loan and lease portfolio at December 31, 2014, an increase of $19.9 million from December 31, 2013. The construction loan segment of the portfolio, which consists of residential site development loans, commercial construction loans and loans for construction of individual homes, had a delinquency rate on performing loans, as of both December 31, 2014 and 2013, of 0.00%. Nonperforming construction loans comprised 0.40% of the construction segment of the portfolio as of December 31, 2014, as compared to 1.79% as of December 31, 2013. |
| • | Residential Mortgages – Residential mortgage loans were $313.4 million as of December 31, 2014, an increase of $13.2 million from December 31, 2013. The portfolio increased as the Corporation originated more jumbo residential mortgage loans to high-net worth individuals, which were retained in the portfolio rather than being sold into the secondary market. The residential mortgage segment accounts for 19.0% of the total loan and lease portfolio as of December 31, 2014. The residential mortgage segment of the portfolio had a delinquency rate on performing loans, as of December 31, 2014, of 0.16%, as compared 0.27% as of December 31, 2013. Nonperforming residential mortgage loans comprised 1.82% of the residential mortgage segment of the portfolio as of December 31, 2014, as compared to 1.46% as of December 31, 2013. The Corporation believes it is well protected with its collateral position on this portfolio. |
| • | Commercial Mortgages – Commercial mortgages were $689.5 million as of December 31, 2014, an increase of $64.2 million from December 31, 2013. The Corporation has made a concerted effort, over several operating cycles, to attract strong commercial real estate entrepreneurs in its primary trade area. This effort has produced strong results. The commercial mortgage segment accounts for 41.7% of the total loan and lease portfolio as of December 31, 2014. The commercial mortgage segment of the portfolio had a delinquency rate on performing loans, as of December 31, 2014, of 0.18%, as compared 0.04% as of December 31, 2013. Nonperforming commercial mortgage loans comprised 0.10% of the commercial mortgage segment of the portfolio as of December 31, 2014, as compared to 0.08% as of December 31, 2013. The borrowers comprising this segment of the portfolio generally have strong, global cash flows, which have remained stable in this tough economic environment. The Corporation expects to continue to be able to attract quality borrowers in the commercial real estate space as other banks tend to retreat, presumably due to credit issues. |
| • | Commercial and Industrial – Commercial and industrial loans were $335.6 million as of December 31, 2014, an increase of $7.2 million from December 31, 2013. The commercial and |
52
Table of Contents
| industrial segment accounts for 20.3% of the total loan and lease portfolio as of December 31, 2014. The commercial and industrial segment of the portfolio had a delinquency rate on performing loans, as of December 31, 2014, of 0.12%, as compared 0.10% as of December 31, 2013. Nonperforming commercial and industrial loans comprised 0.71% of the commercial and industrial segment of the portfolio as of December 31, 2014, as compared to 1.08% as of December 31, 2013. The commercial and industrial segment of the portfolio consists of loans to privately held institutions, family businesses, non-profit institutions and private banking relationships. While certain of these loans are collateralized by real estate, others are collateralized by non-real estate business assets, including accounts receivable and inventory. |
| • | Home Equity Loans and Lines of Credit – Home equity loans and lines of credit were $182.1 million as of December 31, 2014, a decrease of $7.5 million from December 31, 2013. The low-rate residential mortgage loan environment was responsible for the decline in home equity products as many existing clients took the opportunity to consolidate floating rate home equity loans into first mortgages that were subsequently sold into the secondary market. The home equity loans and lines of credit segment accounts for 11.0% of the total loan and lease portfolio as of December 31, 2014. The home equity loans and lines of credit segment of the portfolio had a delinquency rate on performing loans, as of December 31, 2014, of 0.01%, as compared 0.11% as of December 31, 2013. Nonperforming home equity loans and lines of credit comprised 0.58% of the home equity loans and lines of credit segment of the portfolio as of December 31, 2014, as compared to 0.67% as of December 31, 2013. The Corporation originates the majority of its home equity loans and lines of credit through its branch network. |
| • | Consumer loans – Consumer loans were $18.5 million as of December 31, 2014, an increase of $1.6 million from December 31, 2013. The consumer loan segment accounted for 1.1% of the total loan and lease portfolio as of December 31, 2014. The consumer loan segment of the portfolio had a delinquency rate on performing loans, as of December 31, 2014, of 0.12%, as compared 0.04% as of December 31, 2013. There were no nonperforming consumer loans as of December 31, 2014, as compared to 0.04% of the consumer segment of the portfolio as of December 31, 2013. |
| • | Leasing – Leases totaled $46.8 million as of December 31, 2014, an increase of $6.5 million from December 31, 2013. The lease segment of the portfolio accounted for 2.8% of the total loan and lease portfolio as of December 31, 2014. The lease segment of the portfolio had a delinquency rate on performing leases, as of December 31, 2014, of 0.07%, as compared 0.30% as of December 31, 2013. Nonperforming leases comprised 0.04% of the leasing segment of the portfolio as of December 31, 2014, as compared to 0.06% as of December 31, 2013. |
Goodwill and Other Intangible Assets – Goodwill as of December 31, 2014 increased by $2.9 million from December 31, 2013 as a result of the acquisition of PCPB. In addition, the PCPB transaction added $5.8 million in other intangible assets. See Notes 2 and 3 in the Notes to Consolidated Financial Statements for additional details.
FHLB Stock – The Corporation’s investment in stock issued by the FHLB decreased by $131 thousand, from December 31, 2013 to December 31, 2014. The Corporation must purchase, or the FHLB must redeem, its stock based on the Corporation’s borrowings balance with the FHLB.
Mortgage Servicing Rights (“MSRs”) – MSRs increased $15 thousand to $4.8 million as of December 31, 2014 from the balance at December 31, 2013. This increase was the result of $547 thousand of MSRs recorded during the twelve months ended December 31, 2014, partially offset by amortization of $476 thousand and impairment of $56 thousand during the period.
53
Table of Contents
The following table details activity related to mortgage servicing rights for the periods indicated:
| For the Twelve Months Ended or as of December 31, |
||||||||||||
| (dollars in thousands) | 2014 | 2013 | 2012 | |||||||||
| Mortgage originations |
$ | 117,257 | $ | 197,787 | $ | 253,725 | ||||||
| Mortgage loans sold: |
||||||||||||
| Servicing retained |
$ | 54,859 | $ | 127,914 | $ | 201,352 | ||||||
| Servicing released |
783 | 1,067 | 3,461 | |||||||||
|
|
|
|
|
|
|
|||||||
| Total mortgage loans sold |
$ | 55,642 | $ | 128,981 | $ | 204,813 | ||||||
|
|
|
|
|
|
|
|||||||
| Percentage of originated mortgage loans sold |
47.5 | % | 65.2 | % | 80.7 | % | ||||||
| Servicing retained % |
98.6 | % | 99.2 | % | 98.3 | % | ||||||
| Servicing released % |
1.4 | % | 0.8 | % | 1.7 | % | ||||||
| Residential mortgage loans serviced for others |
$ | 590,660 | $ | 607,272 | $ | 591,989 | ||||||
| Mortgage servicing rights |
$ | 4,765 | $ | 4,750 | $ | 4,491 | ||||||
| Gain on sale of loans |
$ | 1,772 | $ | 4,117 | $ | 6,735 | ||||||
| Loans servicing and other fees |
$ | 1,755 | $ | 1,845 | $ | 1,776 | ||||||
| Amortization of MSRs |
$ | 476 | $ | 740 | $ | 966 | ||||||
| Impairment of MSRs |
$ | 56 | $ | 3 | $ | 163 | ||||||
| Gain on sale of loans as % of principal |
3.18 | % | 3.19 | % | 3.29 | % | ||||||
Liability Changes
Total liabilities as of December 31, 2014 increased $169.3 thousand, to $2.00 billion from December 31, 2013. The increase was related to a $96.7 million increase in deposits, a $54.5 million increase in FHLB advances, and a $12.9 million increase in short term borrowings. The cash inflows from these increases helped fund loan growth during 2014.
Deposits – Deposits of $1.69 billion, as of December 31, 2014, increased $96.7 million from December 31, 2013. The 6.1% increase was the result of a $62.6 million increase in wholesale deposits and a $56.5 million increase in core deposits. These increases were partially offset by a $22.4 million decrease in retail time deposits, as the Corporation continued its planned run-off of its higher-rate certificates of deposit. Non-interest-bearing deposits comprised 26.5% of deposits as of December 31, 2014, relatively unchanged from its December 31, 2013 level of 26.8%.
The following table details deposits as of the dates indicated:
| As of December 31, | ||||||||||||||||||||
| (dollars in thousands) | 2014 | 2013 | 2012 | 2011 | 2010 | |||||||||||||||
| Interest-bearing checking |
$ | 277,228 | $ | 266,787 | $ | 270,279 | $ | 233,562 | $ | 234,107 | ||||||||||
| Money market |
566,354 | 544,310 | 559,470 | 393,729 | 327,824 | |||||||||||||||
| Savings |
138,992 | 135,240 | 129,091 | 130,613 | 134,163 | |||||||||||||||
| Wholesale – non-maturity |
66,693 | 42,936 | 45,162 | 65,173 | 80,112 | |||||||||||||||
| Wholesale – time deposits |
73,458 | 34,640 | 12,421 | 23,550 | 37,201 | |||||||||||||||
| Time deposits |
118,400 | 140,794 | 218,586 | 209,333 | 245,669 | |||||||||||||||
|
|
|
|
|
|
|
|
|
|
|
|||||||||||
| Interest-bearing deposits |
$ | 1,241,125 | $ | 1,164,707 | $ | 1,235,009 | $ | 1,055,960 | $ | 1,059,076 | ||||||||||
|
|
|
|
|
|
|
|
|
|
|
|||||||||||
| Non-interest-bearing deposits |
446,903 | 426,640 | 399,673 | 326,409 | 282,356 | |||||||||||||||
|
|
|
|
|
|
|
|
|
|
|
|||||||||||
| Total deposits |
$ | 1,688,028 | $ | 1,591,347 | $ | 1,634,682 | $ | 1,382,369 | $ | 1,341,432 | ||||||||||
|
|
|
|
|
|
|
|
|
|
|
|||||||||||
54
Table of Contents
The following table summarizes the maturities of certificates of deposit of $100,000 or greater at December 31, 2014:
| (dollars in thousands) | Retail | Wholesale | ||||||
| Three months or less |
$ | 15,439 | $ | 3,130 | ||||
| Three to six months |
5,918 | 5,223 | ||||||
| Six to twelve months |
6,753 | 17,831 | ||||||
| Greater than twelve months |
15,973 | 46,123 | ||||||
|
|
|
|
|
|||||
| Total |
$ | 43,903 | $ | 72,307 | ||||
|
|
|
|
|
|||||
For more information regarding deposits, including average amount of deposits and average rate paid, refer to page 36 of this MD&A.
Borrowings – Short-term borrowings as of December 31, 2014, which include only repurchase agreements, increased $12.9 million, or 118.7%, from December 31, 2013. As of December 31, 2014, FHLB advances and other borrowings increased $54.5 million, or 26.5%, from December 31, 2013. See the Liquidity Section of this MD&A on page 56 for further details on the Corporation’s FHLB available borrowing capacity.
Discussion of Segments
The Corporation has two operating segments: Wealth Management and Banking. These segments are discussed below. Detailed segment information appears in Note 28 in the Notes to Consolidated Financial Statements.
Wealth Management Segment Activity
The Wealth Management segment reported a pre-tax segment profit (“PTSP”) for the twelve months ended December 31, 2014 of $15.4 million, a $2.3 million, or 17.5%, increase from the same period in 2013. The increase in PTSP was due to a $1.6 million increase in fees for wealth management services and a $1.2 million increase in insurance commissions. Prior to 2014, the Corporation’s insurance activity was reported under the Banking segment. With the October 2014 acquisition of PCPB, Bank’s insurance subsidiary has become the responsibility of the Wealth Management Division. The Wealth Management Division’s assets under management, administration, supervision and brokerage increased by $431.6 million to $7.7 billion, as of December 31, 2014.
The Wealth Management segment reported a pre-tax segment profit (“PTSP”) for the twelve months ended December 31, 2013 of $13.1 million, a $2.9 million, or 27.9%, increase from the same period in 2012. The increase in PTSP was primarily due to a $5.4 million, or 18.1%, increase in fees for wealth management services. The increase was partially the result of a full year’s impact of the $1.0 billion of wealth assets acquired in the May 2012 acquisition of DTC, along with the success of the Wealth Management division’s strategic initiatives and market appreciation, which increased wealth management assets under management, administration, supervision and brokerage by $605.1 million to $7.3 billion, as of December 31, 2013.
The following table shows the Corporation’s wealth management assets under management, administration, supervision and brokerage as of the dates indicated:
| As of December 31, | ||||||||||||
| (dollars in millions) | 2014 | 2013 | 2012 | |||||||||
| Total wealth assets under management, administration, supervision and brokerage |
$ | 7,699.9 | $ | 7,268.3 | $ | 6,663.2 | ||||||
55
Table of Contents
Banking Segment Activity
Banking segment data as presented in Note 28 in the Notes to Consolidated Financial Statements indicates a PTSP of $27.4 million in 2014, $23.9 million in 2013 and $21.9 million in 2012. See “Components of Net Income” on page 35 of this document for a discussion of the Banking Segment.
Capital and Regulatory Capital Ratios
Consolidated shareholders’ equity of the Corporation was $245.5 million, or 10.9% of total assets, as of December 31, 2014, as compared to $229.9 million, or 11.2% of total assets, as of December 31, 2013.
In April 2012, the Corporation filed a shelf registration statement (the “Shelf Registration Statement”) to replace its 2009 Shelf Registration Statement, which was set to expire in June 2012. This new Shelf Registration Statement allows the Corporation to raise additional capital through offers and sales of registered securities consisting of common stock, debt securities, warrants to purchase common stock, stock purchase contracts and units or units consisting of any combination of the foregoing securities. Using the prospectus in the Shelf Registration Statement, together with applicable prospectus supplements, the Corporation may sell, from time to time, in one or more offerings, such securities in a dollar amount up to $150,000,000, in the aggregate.
The Corporation has in place under its Shelf Registration Statement a Dividend Reinvestment and Stock Purchase Plan (the “Plan”), which was amended and restated on April 27, 2012 primarily to increase the number of shares which can be issued by the Corporation from 850,000 to 1,500,000 shares of registered common stock. The Plan allows for the grant of a request for waiver (“RFW”) above the Plan’s maximum investment of $120 thousand per account per year. A RFW is granted based on a variety of factors, including the Corporation’s current and projected capital needs, prevailing market prices of the Corporation’s common stock and general economic and market conditions.
The Plan is intended to allow both existing shareholders and new investors to easily and conveniently increase their investment in the Corporation without incurring many of the fees and commissions normally associated with brokerage transactions. For the twelve months ended December 31, 2014 and 2013, the Corporation issued 2,517 and 7,455 shares, respectively, and raised $72 thousand and $176 thousand, respectively, through the Plan.
Accumulated other comprehensive loss, as of December 31, 2014 was $11.7 million, an increase of $6.1 million from December 31, 2013. The primary cause of this increase was related to increased unrealized losses in the Corporation’s pension liability which was caused by decreases in the discount rate used to value the pension liability along with revised mortality tables. Partially offsetting this increase in unrealized loss was a $3.3 million market value improvement on the Corporation’s available for sale investment portfolio between the dates.
As detailed in Note 25-D in the Notes to Consolidated Financial Statements, the Corporation’s ratio of total capital to risk-weighted assets increased from 12.55% as of December 31, 2013 to 12.86% as of December 31, 2014. This increase was primarily related to the $17.6 million increase in retained earnings, along with a $5.0 million increase in common stock issuances between the dates. These increases were partially offset by increases in other comprehensive loss related to the Corporation’s pension plan liability.
The Corporation’s and Bank’s regulatory capital ratios and the minimum capital requirements to be considered “Well Capitalized” by banking regulators can be found in Note 25-D in the Notes to Consolidated Financial Statements. Both the Corporation and the Bank exceeded the required capital levels to be considered “Well Capitalized” by their respective regulators at the end of each period presented.
Liquidity
The Corporation has significant sources and availability of liquidity at December 31, 2014. The liquidity position is managed on a daily basis as part of the daily settlement function and on a monthly basis as part of the asset
56
Table of Contents
liability management process. The Corporation’s primary liquidity is maintained by managing its deposits along with the utilization of borrowings from the FHLB, purchased federal funds and utilization of other wholesale funding sources. Secondary sources of liquidity include the sale of investment securities and certain loans in the secondary market.
Other wholesale funding sources include certificates of deposit from brokers, generally available in blocks of $1.0 million or more. Funds obtained through these programs totaled $73.5 million as of December 31, 2014.
As of December 31, 2014, the maximum borrowing capacity with the FHLB was $883.0 million, with an unused borrowing availability of $608.2 million. Borrowing availability at the Federal Reserve was $71.9 million, and overnight Fed Funds lines, consisting of lines from six banks, totaled $64.0 million. On a monthly basis, the Corporation’s Asset Liability Committee reviews the Corporation’s liquidity needs. This information is reported to the Risk Management Committee of the Board of Directors on a quarterly basis.
As of December 31, 2014, the Corporation held $11.5 million of FHLB stock as required by the borrowing agreement between the FHLB and the Corporation.
The Corporation has an agreement with CDC to provide up to $5 million, plus interest, of money market deposits at an agreed upon rate currently at 0.45%. The Corporation had $5.2 million in balances as of December 31, 2014 under this program. The Corporation can request an increase in the agreement amount as it deems necessary. In addition, the Corporation has an agreement with IND to provide up to $40 million, plus interest, of money market and NOW funds at an agreed upon interest rate equal to the current Fed Funds rate plus 20 basis points. The Corporation had $34.8 million in balances as of December 31, 2014 under this program.
The Corporation’s available for sale investment portfolio of $229.6 million as of December 31, 2014 was approximately 10.2% of total assets. Some of these investments were in short-term, high-quality, liquid investments to earn more than the 25 basis points currently earned on Fed Funds. The Corporation’s policy is to maintain its investment portfolio at a minimum level of 10% of total assets. The portion of the investment portfolio that is not already pledged against borrowings from the FHLB or other funding sources, provides the Corporation with the ability to utilize the securities to borrow additional funds through the FHLB, Federal Reserve or through other repurchase agreements.
The Corporation continually evaluates its borrowing capacity and sources of liquidity. The Corporation believes that it has sufficient capacity to fund expected 2015 earning asset growth with wholesale sources, along with deposit growth from its expanded branch system.
Off Balance Sheet Risk
The Corporation becomes party to financial instruments in the normal course of business to meet the financing needs of its customers. These financial instruments include commitments to extend credit and standby letters of credit and create off-balance sheet risk.
Commitments to extend credit are agreements to lend to a customer as long as there is no violation of any condition established in the loan agreement.
Standby letters of credit are conditional commitments issued by the Bank to a customer for a third party. Such standby letters of credit are issued to support private borrowing arrangements. The credit risk involved in issuing standby letters of credit is similar to that involved in granting loan facilities to customers.
57
Table of Contents
The following chart presents the off-balance sheet commitments of the Corporation as of December 31, 2014, listed by dates of funding or payment:
| (dollars in millions) | Total | Within 1 Year |
2 - 3 Years |
4 - 5 Years |
After 5 Years |
|||||||||||||||
| Unfunded loan commitments |
$ | 479.0 | $ | 269.9 | $ | 70.0 | $ | 24.3 | $ | 114.8 | ||||||||||
| Standby letters of credit |
15.3 | 12.4 | 2.8 | 0.1 | — | |||||||||||||||
|
|
|
|
|
|
|
|
|
|
|
|||||||||||
| Total |
$ | 494.3 | $ | 282.3 | $ | 72.8 | $ | 24.4 | $ | 114.8 | ||||||||||
|
|
|
|
|
|
|
|
|
|
|
|||||||||||
Estimated fair values of the Corporation’s off-balance sheet instruments are based on fees and rates currently charged to enter into similar loan agreements, taking into account the remaining terms of the agreements and the counterparties’ credit standing. Collateral requirements for off-balance sheet items are generally based upon the same standards and policies as booked loans. Since fees and rates charged for off-balance sheet items are at market levels when set, there is no material difference between the stated amount and the estimated fair value of off-balance sheet instruments.
Contractual Cash Obligations of the Corporation as of December 31, 2014
| (dollars in millions) | Total | Within 1 Year |
2 - 3 Years |
4 - 5 Years |
After 5 Years |
|||||||||||||||
| Deposits without a stated maturity |
$ | 1,496.1 | $ | 1,496.1 | $ | — | $ | — | $ | — | ||||||||||
| Wholesale and retail certificates of deposit |
191.9 | 108.0 | 67.2 | 16.7 | — | |||||||||||||||
| Short-term borrowings |
23.8 | 23.8 | — | — | — | |||||||||||||||
| FHLB advances and other borrowings |
260.1 | 25.5 | 135.0 | 92.1 | 7.5 | |||||||||||||||
| Operating leases |
49.7 | 3.1 | 5.9 | 5.9 | 34.8 | |||||||||||||||
| Purchase obligations |
13.2 | 4.0 | 7.8 | 1.0 | 0.4 | |||||||||||||||
|
|
|
|
|
|
|
|
|
|
|
|||||||||||
| Total |
$ | 2,034.8 | $ | 1,660.5 | $ | 215.9 | $ | 115.7 | $ | 42.7 | ||||||||||
|
|
|
|
|
|
|
|
|
|
|
|||||||||||
Other Information
Effects of Inflation
Inflation has some impact on the Corporation’s operating costs. Unlike many industrial companies, however, substantially all of the Corporation’s assets and liabilities are monetary in nature. As a result, interest rates have a more significant impact on the Corporation’s performance than the general level of inflation. Over short periods of time, interest rates may not necessarily move in the same direction or in the same magnitude as prices of goods and services.
Effect of Government Monetary Policies
The earnings of the Corporation are and will be affected by domestic economic conditions and the monetary and fiscal policies of the United States government and its agencies. An important function of the Federal Reserve Board is to regulate the money supply and interest rates. Among the instruments used to implement those objectives are open market operations in United States government securities and changes in reserve requirements against member bank deposits. These instruments are used in varying combinations to influence overall growth and distribution of bank loans, investments, and deposits, and their use may also affect rates charged on loans or paid for deposits.
The Corporation is a member of the Federal Reserve System and, therefore, the policies and regulations of the Federal Reserve Board have a significant effect on its deposits, loans and investment growth, as well as the rate of interest earned and paid, and are expected to affect the Corporation’s operations in the future. The effect of such policies and regulations upon the future business and earnings of the Corporation cannot be predicted.
58
Table of Contents
| ITEM 7A. | QUANTATIVE AND QUALITATIVE DISCLOSURES ABOUT MARKET RISK |
The information required by this Item 7A is incorporated by reference to information appearing in the MD&A Section of this Annual Report on Form 10-K, more specifically in the sections entitled “Interest Rate Sensitivity,” “Summary of Interest Rate Simulation,” and “Gap Analysis.”
59
Table of Contents
| ITEM 8. | FINANCIAL STATEMENTS AND SUPPLEMENTARY DATA |
The following audited consolidated financial statements and related documents are set forth in this Annual Report on Form 10-K on the following pages:
| Page | ||||
| 61 | ||||
| 62 | ||||
| 63 | ||||
| 64 | ||||
| 65 | ||||
| 66 | ||||
| 67 | ||||
60
Table of Contents
Report of Independent Registered Public Accounting Firm
The Board of Directors and Shareholders
Bryn Mawr Bank Corporation:
We have audited the accompanying consolidated balance sheets of Bryn Mawr Bank Corporation and subsidiaries (the Corporation) as of December 31, 2014 and 2013, and the related consolidated statements of income, comprehensive income, cash flows, and changes in shareholders’ equity for each of the years in the three-year period ended December 31, 2014. These consolidated financial statements are the responsibility of the Corporation’s management. Our responsibility is to express an opinion on these consolidated financial statements based on our audits.
We conducted our audits in accordance with the standards of the Public Company Accounting Oversight Board (United States). Those standards require that we plan and perform the audit to obtain reasonable assurance about whether the financial statements are free of material misstatement. An audit includes examining, on a test basis, evidence supporting the amounts and disclosures in the financial statements. An audit also includes assessing the accounting principles used and significant estimates made by management, as well as evaluating the overall financial statement presentation. We believe that our audits provide a reasonable basis for our opinion.
In our opinion, the consolidated financial statements referred to above present fairly, in all material respects, the financial position of the Corporation as of December 31, 2014 and 2013, and the results of its operations and it cash flows for each of the years in the three-year period ended December 31, 2014, in conformity with U.S. generally accepted accounting principles.
We also have audited, in accordance with the standards of the Public Company Accounting Oversight Board (United States), the Corporation’s internal control over financial reporting as of December 31, 2014, based on criteria established in Internal Control – Integrated Framework (1992) issued by the Committee of Sponsoring Organizations of the Treadway Commission (COSO), and our report dated March 12, 2015 expressed an unqualified opinion on the effectiveness of the Company’s internal control over financial reporting.

Philadelphia, Pennsylvania
March 12, 2015
61
Table of Contents
| (dollars in thousands) | December 31, 2014 |
December 31, 2013 |
||||||
| Assets |
||||||||
| Cash and due from banks |
$ | 16,717 | $ | 13,453 | ||||
| Interest bearing deposits with banks |
202,552 | 67,618 | ||||||
|
|
|
|
|
|||||
| Cash and cash equivalents |
219,269 | 81,071 | ||||||
| Investment securities available for sale, at fair value (amortized cost of $227,553 and $287,127 as of December 31, 2014 and December 31, 2013 respectively) |
229,577 | 285,808 | ||||||
| Investment securities, trading |
3,896 | 3,437 | ||||||
| Loans held for sale |
3,882 | 1,350 | ||||||
| Portfolio loans and leases |
1,652,257 | 1,547,185 | ||||||
| Less: Allowance for loan and lease losses |
(14,586 | ) | (15,515 | ) | ||||
|
|
|
|
|
|||||
| Net portfolio loans and leases |
1,637,671 | 1,531,670 | ||||||
| Premises and equipment, net |
33,748 | 31,796 | ||||||
| Accrued interest receivable |
5,560 | 5,728 | ||||||
| Deferred income taxes |
7,209 | 8,690 | ||||||
| Mortgage servicing rights |
4,765 | 4,750 | ||||||
| Bank owned life insurance |
20,535 | 20,220 | ||||||
| Federal Home Loan Bank stock |
11,523 | 11,654 | ||||||
| Goodwill |
35,781 | 32,843 | ||||||
| Intangible assets |
22,521 | 19,365 | ||||||
| Other investments |
5,226 | 4,437 | ||||||
| Other assets |
5,343 | 18,846 | ||||||
|
|
|
|
|
|||||
| Total assets |
$ | 2,246,506 | $ | 2,061,665 | ||||
|
|
|
|
|
|||||
| Liabilities |
||||||||
| Deposits: |
||||||||
| Non-interest-bearing |
$ | 446,903 | $ | 426,640 | ||||
| Interest-bearing |
1,241,125 | 1,164,707 | ||||||
|
|
|
|
|
|||||
| Total deposits |
1,688,028 | 1,591,347 | ||||||
|
|
|
|
|
|||||
| Short-term borrowings |
23,824 | 10,891 | ||||||
| FHLB advances and other borrowings |
260,146 | 205,644 | ||||||
| Accrued interest payable |
1,040 | 841 | ||||||
| Other liabilities |
27,994 | 23,044 | ||||||
|
|
|
|
|
|||||
| Total liabilities |
2,001,032 | 1,831,767 | ||||||
|
|
|
|
|
|||||
| Shareholders’ equity |
||||||||
| Common stock, par value $1; authorized 100,000,000 shares; issued 16,742,135 and 16,596,869 shares as of December 31, 2014 and December 31, 2013, respectively, and outstanding of 13,769,336 and 13,650,354 as of December 31, 2014 and December 31, 2013, respectively |
16,742 | 16,597 | ||||||
| Paid-in capital in excess of par value |
100,486 | 95,673 | ||||||
| Less: Common stock in treasury at cost – 2,972,799 and 2,946,515 shares as of December 31, 2014 and December 31, 2013, respectively |
(31,642 | ) | (30,764 | ) | ||||
| Accumulated other comprehensive loss, net of tax benefit |
(11,704 | ) | (5,565 | ) | ||||
| Retained earnings |
171,592 | 153,957 | ||||||
|
|
|
|
|
|||||
| Total shareholders’ equity |
245,474 | 229,898 | ||||||
|
|
|
|
|
|||||
| Total liabilities and shareholders’ equity |
$ | 2,246,506 | $ | 2,061,665 | ||||
|
|
|
|
|
|||||
The accompanying notes are an integral part of the consolidated financial statements.
62
Table of Contents
Consolidated Statements of Income
| Twelve Months Ended December 31, | ||||||||||||
| (dollars in thousands, except per share data) | 2014 | 2013 | 2012 | |||||||||
| Interest income: |
||||||||||||
| Interest and fees on loans and leases |
$ | 78,541 | $ | 73,941 | $ | 68,891 | ||||||
| Interest on cash and cash equivalents |
193 | 158 | 127 | |||||||||
| Interest on investment securities: |
||||||||||||
| Taxable |
3,596 | 3,799 | 3,970 | |||||||||
| Non-taxable |
399 | 396 | 208 | |||||||||
| Dividends |
177 | 123 | 127 | |||||||||
|
|
|
|
|
|
|
|||||||
| Total interest income |
82,906 | 78,417 | 73,323 | |||||||||
|
|
|
|
|
|
|
|||||||
| Interest expense on: |
||||||||||||
| Deposits |
2,898 | 2,758 | 4,032 | |||||||||
| Short-term borrowings |
17 | 25 | 21 | |||||||||
| FHLB advances and other borrowings |
3,163 | 2,644 | 3,604 | |||||||||
| Subordinated debentures |
— | — | 931 | |||||||||
|
|
|
|
|
|
|
|||||||
| Total interest expense |
6,078 | 5,427 | 8,588 | |||||||||
| Net interest income |
76,828 | 72,990 | 64,735 | |||||||||
| Provision for loan and lease losses |
884 | 3,575 | 4,003 | |||||||||
|
|
|
|
|
|
|
|||||||
| Net interest income after provision for loan and lease losses |
75,944 | 69,415 | 60,732 | |||||||||
| Non-interest income: |
||||||||||||
| Fees for wealth management services |
36,774 | 35,184 | 29,798 | |||||||||
| Service charges on deposits |
2,578 | 2,445 | 2,477 | |||||||||
| Loan servicing and other fees |
1,755 | 1,845 | 1,776 | |||||||||
| Net gain on sale of residential mortgage loans |
1,772 | 4,117 | 6,735 | |||||||||
| Net gain (loss) on sale of investment securities available for sale |
471 | (8 | ) | 1,415 | ||||||||
| Net gain (loss) on sale of other real estate owned (“OREO”) |
175 | (300 | ) | (86 | ) | |||||||
| Bank owned life insurance (“BOLI”) income |
315 | 358 | 428 | |||||||||
| Insurance commissions |
1,210 | 651 | 444 | |||||||||
| Other operating income |
3,272 | 4,063 | 3,399 | |||||||||
|
|
|
|
|
|
|
|||||||
| Total non-interest income |
48,322 | 48,355 | 46,386 | |||||||||
| Non-interest expenses: |
||||||||||||
| Salaries and wages |
37,113 | 36,346 | 33,131 | |||||||||
| Employee benefits |
7,340 | 8,832 | 8,127 | |||||||||
| Net gain on curtailment of nonqualified pension plan |
— | (690 | ) | — | ||||||||
| Occupancy and bank premises |
7,305 | 6,862 | 5,874 | |||||||||
| Furniture, fixtures, and equipment |
4,508 | 3,977 | 3,727 | |||||||||
| Advertising |
1,504 | 1,526 | 1,309 | |||||||||
| Amortization of mortgage servicing rights |
476 | 740 | 966 | |||||||||
| Net impairment of mortgage servicing rights |
56 | 3 | 163 | |||||||||
| Amortization of other intangible assets |
2,659 | 2,633 | 2,411 | |||||||||
| FDIC insurance |
1,046 | 1,063 | 970 | |||||||||
| Due diligence and merger-related expenses |
2,373 | 1,885 | 2,629 | |||||||||
| Early extinguishment of debt – costs and premiums |
— | 347 | 526 | |||||||||
| Professional fees |
3,017 | 2,456 | 2,868 | |||||||||
| Pennsylvania bank shares tax |
1,256 | 942 | 1,079 | |||||||||
| Other operating expenses |
12,765 | 13,818 | 11,121 | |||||||||
|
|
|
|
|
|
|
|||||||
| Total non-interest expenses |
81,418 | 80,740 | 74,901 | |||||||||
| Income before income taxes |
42,848 | 37,030 | 32,217 | |||||||||
| Income tax expense |
15,005 | 12,586 | 11,070 | |||||||||
|
|
|
|
|
|
|
|||||||
| Net income |
$ | 27,843 | $ | 24,444 | $ | 21,147 | ||||||
|
|
|
|
|
|
|
|||||||
| Basic earnings per common share |
$ | 2.05 | $ | 1.84 | $ | 1.62 | ||||||
| Diluted earnings per common share |
$ | 2.01 | $ | 1.80 | $ | 1.60 | ||||||
| Dividends declared per share |
$ | 0.74 | $ | 0.69 | $ | 0.64 | ||||||
| Weighted-average basic shares outstanding |
13,566,239 | 13,311,215 | 13,090,110 | |||||||||
| Dilutive shares |
294,801 | 260,395 | 151,736 | |||||||||
|
|
|
|
|
|
|
|||||||
| Adjusted weighted-average diluted shares |
13,861,040 | 13,571,610 | 13,241,846 | |||||||||
|
|
|
|
|
|
|
|||||||
The accompanying notes are an integral part of the consolidated financial statements.
63
Table of Contents
Consolidated Statements of Comprehensive Income
| Twelve Months Ended December 31, |
||||||||||||
| (dollars in thousands) | 2014 | 2013 | 2012 | |||||||||
| Net income |
$ | 27,843 | $ | 24,444 | $ | 21,147 | ||||||
| Other comprehensive income (loss): |
||||||||||||
| Net change in unrealized (losses) gains on investment securities available for sale: |
||||||||||||
| Net unrealized gains (losses) arising during the period, net of tax expense (benefit) of $1,335, $(2,168) and $1,233, respectively |
1,867 | (4,026 | ) | 2,292 | ||||||||
| Less: reclassification adjustment for net (gains) losses on sales realized in net income, net of tax (expense) benefit of $(165), $3, and $(495), respectively |
(306 | ) | 5 | (920 | ) | |||||||
|
|
|
|
|
|
|
|||||||
| Unrealized investment gains (losses), net of tax expense (benefit) of $1,170, $(2,165) and $739, respectively |
2,173 | (4,021 | ) | 1,372 | ||||||||
| Net change in fair value of derivative used for cash flow hedge: |
||||||||||||
| Change in fair value of hedging instruments, net of tax (benefit) expense of $(413), $412 and $(13), respectively |
(768 | ) | 766 | (23 | ) | |||||||
| Net change in unfunded pension liability: |
||||||||||||
| Change in unfunded pension liability related to unrealized loss, prior service cost and transition obligation, net of tax (benefit) expense of $(4,063), $3,442 and $(33), respectively |
(7,544 | ) | 6,391 | (62 | ) | |||||||
| Change in unfunded pension liability related to curtailment, net of tax expense of $0, $741, and $0, respectively |
— | 1,377 | — | |||||||||
|
|
|
|
|
|
|
|||||||
| Total change in unfunded pension liability, net of tax (benefit) expense of $(4,063), $4,183 and $(33), respectively |
(7,544 | ) | 7,768 | (62 | ) | |||||||
|
|
|
|
|
|
|
|||||||
| Total other comprehensive (loss) income |
(6,139 | ) | 4,513 | 1,287 | ||||||||
| Total comprehensive income |
$ | 21,704 | $ | 28,957 | $ | 22,434 | ||||||
|
|
|
|
|
|
|
|||||||
The accompanying notes are an integral part of the consolidated financial statements.
64
Table of Contents
Consolidated Statements of Cash Flows
| Twelve Months Ended December 31, |
||||||||||||
| (dollars in thousands) | 2014 | 2013 | 2012 | |||||||||
| Operating activities: |
||||||||||||
| Net Income |
$ | 27,843 | $ | 24,444 | $ | 21,147 | ||||||
| Adjustments to reconcile net income to net cash provided by operating activities: |
||||||||||||
| Provision for loan and lease losses |
884 | 3,575 | 4,003 | |||||||||
| Depreciation of fixed assets and net amortization of investment premiums and discounts |
5,785 | 6,836 | 6,713 | |||||||||
| Net (gain) loss on sale of investment securities available for sale |
(471 | ) | 8 | (1,415 | ) | |||||||
| Net gain on sale of residential mortgages |
(1,772 | ) | (4,117 | ) | (6,735 | ) | ||||||
| Stock based compensation cost |
1,256 | 1,004 | 1,283 | |||||||||
| Amortization and net impairment of mortgage servicing rights |
532 | 743 | 1,129 | |||||||||
| Net accretion of fair value adjustments |
(2,757 | ) | (3,490 | ) | (1,892 | ) | ||||||
| Amortization of intangible assets |
2,659 | 2,633 | 2,411 | |||||||||
| Net (gain) loss on sale of OREO |
(175 | ) | 300 | 86 | ||||||||
| Net increase in cash surrender value of bank owned life insurance (“BOLI”) |
(315 | ) | (358 | ) | (428 | ) | ||||||
| Other, net |
2,822 | 1,253 | 297 | |||||||||
| Loans originated for resale |
(58,173 | ) | (126,920 | ) | (206,637 | ) | ||||||
| Proceeds from loans sold |
56,866 | 132,097 | 209,969 | |||||||||
| Provision (benefit) for deferred income taxes |
2,350 | 1,195 | (505 | ) | ||||||||
| Change in income taxes payable/receivable |
(23 | ) | 843 | 3,437 | ||||||||
| Change in accrued interest receivable |
168 | 227 | 355 | |||||||||
| Change in accrued interest payable |
199 | (392 | ) | (575 | ) | |||||||
|
|
|
|
|
|
|
|||||||
| Net cash provided by operating activities |
37,678 | 39,881 | 32,643 | |||||||||
|
|
|
|
|
|
|
|||||||
| Investing activities: |
||||||||||||
| Purchases of investment securities |
(45,199 | ) | (97,517 | ) | (223,019 | ) | ||||||
| Proceeds from maturity of investment securities and paydowns of mortgage-related securities |
40,801 | 62,643 | 48,576 | |||||||||
| Proceeds from sale of investment securities available for sale |
24,394 | 14,942 | 40,640 | |||||||||
| Proceeds from sale of other investments |
342 | — | — | |||||||||
| Net change in FHLB stock |
131 | (893 | ) | 827 | ||||||||
| Proceeds from calls of investment securities |
37,750 | 40,287 | 89,992 | |||||||||
| Net change in other investments |
(789 | ) | (91 | ) | (239 | ) | ||||||
| Net portfolio loan and lease originations |
(105,918 | ) | (148,102 | ) | (28,082 | ) | ||||||
| Purchases of premises and equipment |
(5,455 | ) | (3,571 | ) | (4,048 | ) | ||||||
| Acquisitions, net of cash acquired |
(4,125 | ) | — | (15,951 | ) | |||||||
| Capitalize costs to OREO |
— | (485 | ) | (61 | ) | |||||||
| Proceeds from sale of OREO |
1,646 | 1,089 | 567 | |||||||||
|
|
|
|
|
|
|
|||||||
| Net cash used in investing activities |
(56,422 | ) | (131,698 | ) | (90,798 | ) | ||||||
|
|
|
|
|
|
|
|||||||
| Financing activities: |
||||||||||||
| Change in deposits |
96,704 | (42,986 | ) | 182,368 | ||||||||
| Change in short-term borrowings |
12,933 | 1,488 | (3,460 | ) | ||||||||
| Dividends paid |
(10,189 | ) | (9,297 | ) | (8,529 | ) | ||||||
| Change in FHLB advances and other borrowings |
54,623 | 44,479 | 13,962 | |||||||||
| Repayment of subordinated debentures |
— | — | (22,500 | ) | ||||||||
| Payment of contingent consideration for business combinations |
— | (2,100 | ) | (1,050 | ) | |||||||
| Excess tax benefit from stock-based compensation |
831 | 708 | 112 | |||||||||
| Proceeds from sale of treasury stock from deferred compensation plans |
79 | 764 | 317 | |||||||||
| Net purchase of treasury stock |
(947 | ) | — | — | ||||||||
| Proceeds from issuance of common stock |
72 | 176 | 2,118 | |||||||||
| Proceeds from exercise of stock options |
2,836 | 3,970 | 1,363 | |||||||||
|
|
|
|
|
|
|
|||||||
| Net cash provided by (used in) financing activities |
156,942 | (2,798 | ) | 164,701 | ||||||||
|
|
|
|
|
|
|
|||||||
| Change in cash and cash equivalents |
138,198 | (94,615 | ) | 106,546 | ||||||||
| Cash and cash equivalents at beginning of period |
81,071 | 175,686 | 69,140 | |||||||||
|
|
|
|
|
|
|
|||||||
| Cash and cash equivalents at end of period |
$ | 219,269 | $ | 81,071 | $ | 175,686 | ||||||
|
|
|
|
|
|
|
|||||||
| Supplemental cash flow information: |
||||||||||||
| Cash paid during the year for: |
||||||||||||
| Income taxes |
$ | 11,831 | $ | 9,775 | $ | 8,092 | ||||||
| Interest |
5,879 | 5,819 | 8,947 | |||||||||
| Available for sale securities purchased, not settled |
$ | — | $ | — | $ | 255 | ||||||
| Change in other comprehensive loss |
(9,446 | ) | 6,943 | 1,980 | ||||||||
| Change in deferred tax due to change in comprehensive income |
(3,306 | ) | 2,430 | 693 | ||||||||
| Transfer of loans to other real estate owned |
1,763 | 853 | 949 | |||||||||
| Acquisition of noncash assets and liabilities: |
||||||||||||
| Assets acquired |
10,005 | — | 90,853 | |||||||||
| Liabilities assumed |
5,880 | — | 74,902 | |||||||||
The accompanying notes are an integral part of the consolidated financial statements.
65
Table of Contents
Consolidated Statements of Changes in Shareholders’ Equity
| For the Years Ended December 31, 2012, 2013 and 2014 | ||||||||||||||||||||||||||||
| (dollars in thousands, except per share information) |
Shares of Common Stock Issued |
Common Stock |
Paid-in Capital |
Treasury Stock |
Accumulated Other Comprehensive Loss |
Retained Earnings |
Total Shareholders’ Equity |
|||||||||||||||||||||
| Balance December 31, 2011 |
16,103,981 | 16,104 | 84,425 | (31,027 | ) | (11,365 | ) | 126,242 | 184,379 | |||||||||||||||||||
| Net income |
— | — | — | — | — | 21,147 | 21,147 | |||||||||||||||||||||
| Dividends declared, $0.64 per share |
— | — | — | — | — | (8,529 | ) | (8,529 | ) | |||||||||||||||||||
| Other comprehensive income, net of tax expense of $693 |
— | — | — | — | 1,287 | — | 1,287 | |||||||||||||||||||||
| Stock based compensation |
— | — | 1,283 | — | — | — | 1,283 | |||||||||||||||||||||
| Tax benefit from stock-based compensation |
— | — | 112 | — | — | — | 112 | |||||||||||||||||||||
| Retirement of treasury stock |
(4,249 | ) | (4 | ) | (40 | ) | 44 | — | — | — | ||||||||||||||||||
| Net sale of treasury stock from deferred compensation plans |
— | — | 79 | 238 | — | — | 317 | |||||||||||||||||||||
| Common stock issued: |
— | |||||||||||||||||||||||||||
| Dividend Reinvestment and Stock Purchase Plan |
108,918 | 109 | 2,009 | — | — | — | 2,118 | |||||||||||||||||||||
| Share-based awards and options exercises |
181,958 | 181 | 1,269 | — | — | — | 1,450 | |||||||||||||||||||||
|
|
|
|
|
|
|
|
|
|
|
|
|
|
|
|||||||||||||||
| Balance December 31, 2012 |
16,390,608 | 16,390 | 89,137 | (30,745 | ) | (10,078 | ) | 138,860 | 203,564 | |||||||||||||||||||
| Net income |
— | — | — | — | — | 24,444 | 24,444 | |||||||||||||||||||||
| Dividends declared, $0.69 per share |
— | — | — | — | — | (9,347 | ) | (9,347 | ) | |||||||||||||||||||
| Other comprehensive income, net of tax expense of $2,430 |
— | — | — | — | 4,513 | — | 4,513 | |||||||||||||||||||||
| Stock based compensation |
— | — | 1,004 | — | — | — | 1,004 | |||||||||||||||||||||
| Tax benefit from stock-based compensation |
— | — | 708 | — | — | — | 708 | |||||||||||||||||||||
| Retirement of treasury stock |
(4,517 | ) | (4 | ) | (41 | ) | 45 | — | — | — | ||||||||||||||||||
| Net sale of treasury stock from stock award and deferred compensation plans |
— | — | 828 | (64 | ) | — | — | 764 | ||||||||||||||||||||
| Common stock issued: |
||||||||||||||||||||||||||||
| Dividend Reinvestment and Stock Purchase Plan |
7,455 | 7 | 169 | — | — | — | 176 | |||||||||||||||||||||
| Share-based awards and options exercises |
203,323 | 204 | 3,868 | — | — | — | 4,072 | |||||||||||||||||||||
|
|
|
|
|
|
|
|
|
|
|
|
|
|
|
|||||||||||||||
| Balance December 31, 2013 |
16,596,869 | $ | 16,597 | $ | 95,673 | $ | (30,764 | ) | $ | (5,565 | ) | $ | 153,957 | $ | 229,898 | |||||||||||||
| Net income |
— | — | — | — | — | 27,843 | 27,843 | |||||||||||||||||||||
| Dividends declared, $0.74 per share |
— | — | — | — | — | (10,208 | ) | (10,208 | ) | |||||||||||||||||||
| Other comprehensive loss, net of tax benefit of $3,307 |
— | — | — | — | (6,139 | ) | — | (6,139 | ) | |||||||||||||||||||
| Stock based compensation |
— | — | 1,256 | — | — | — | 1,256 | |||||||||||||||||||||
| Tax benefit from stock-based compensation |
— | — | 831 | — | — | — | 831 | |||||||||||||||||||||
| Retirement of treasury stock |
(3,512 | ) | (3 | ) | (32 | ) | 35 | — | — | — | ||||||||||||||||||
| Net purchase of treasury stock from stock award and deferred compensation plans |
— | — | 45 | (913 | ) | — | — | (868 | ) | |||||||||||||||||||
| Issuance costs – S-4 filing |
— | — | (147 | ) | — | — | — | (147 | ) | |||||||||||||||||||
| Common stock issued: |
— | |||||||||||||||||||||||||||
| Dividend Reinvestment and Stock Purchase Plan |
2,517 | 2 | 70 | — | — | — | 72 | |||||||||||||||||||||
| Share-based awards and options exercises |
146,261 | 146 | 2,790 | — | — | — | 2,936 | |||||||||||||||||||||
|
|
|
|
|
|
|
|
|
|
|
|
|
|
|
|||||||||||||||
| Balance December 31, 2014 |
16,742,135 | $ | 16,742 | $ | 100,486 | $ | (31,642 | ) | $ | (11,704 | ) | $ | 171,592 | $ | 245,474 | |||||||||||||
|
|
|
|
|
|
|
|
|
|
|
|
|
|
|
|||||||||||||||
The accompanying notes are an integral part of the consolidated financial statements.
66
Table of Contents
Notes to Consolidated Financial Statements
Note 1 – Summary of Significant Accounting Policies
A. Nature of Business
The Bryn Mawr Trust Company (the “Bank”) received its Pennsylvania banking charter in 1889 and is a member of the Federal Reserve System. In 1986, Bryn Mawr Bank Corporation (the “Corporation”) was formed and on January 2, 1987, the Bank became a wholly-owned subsidiary of the Corporation. The Bank and Corporation are headquartered in Bryn Mawr, Pennsylvania, a western suburb of Philadelphia. The Corporation and its subsidiaries provide wealth management, community banking, residential mortgage lending, insurance and business banking services to its customers through 19 full service branches, seven retirement community offices, and five wealth offices located throughout Montgomery, Delaware, Chester and Dauphin counties in Pennsylvania and New Castle county in Delaware. In 2008, the Corporation opened the Bryn Mawr Trust Company of Delaware, a limited-purpose trust company in Greenville, Delaware, to further its long-term growth strategy, and diversify its asset base and client accounts. The common stock of the Corporation trades on the NASDAQ Stock Market (“NASDAQ”) under the symbol BMTC.
On October 1, 2014, the acquisition of Powers Craft Parker and Beard, Inc. (“PCPB”), an insurance brokerage headquartered in Rosemont, Pennsylvania, was completed. The addition will enable the Corporation to offer a full range of insurance products to both individual and business clients.
The Corporation operates in a highly competitive market area that includes local, national and regional banks as competitors along with savings banks, credit unions, insurance companies, trust companies, registered investment advisors and mutual fund families. The Corporation and its subsidiaries are regulated by many regulatory agencies including the Securities and Exchange Commission (“SEC”), Federal Deposit Insurance Corporation (“FDIC”), the Federal Reserve and the Pennsylvania Department of Banking.
B. Basis of Presentation
The accounting policies of the Corporation conform to U.S. generally accepted accounting principles (“GAAP”).
The Consolidated Financial Statements include the accounts of the Corporation and its wholly owned subsidiaries. The Corporation’s consolidated financial condition and results of operations consist almost entirely of the Bank’s financial condition and results of operations. All inter-company transactions and balances have been eliminated.
In preparing the Consolidated Financial Statements, the Corporation is required to make estimates and assumptions that affect the reported amounts of assets and liabilities, the disclosure of contingent assets and liabilities at the dates of the balance sheets, and the reported amounts of revenues and expenses during the reporting period. Actual results could differ from these estimates.
Although our current estimates contemplate current conditions and how we expect them to change in the future, it is reasonably possible that in 2015, actual conditions could be worse than anticipated in those estimates, which could materially affect our results of operations and financial condition. Amounts subject to significant estimates are items such as the allowance for loan and lease losses and lending related commitments, goodwill and intangible assets, pension and post-retirement obligations, the fair value of financial instruments and other-than-temporary impairments. Among other effects, such changes could result in future impairments of investment securities, goodwill and intangible assets and establishment of allowances for loan losses and lending-related commitments as well as increased pension and post-retirement expense.
C. Cash and Cash Equivalents
Cash and cash equivalents include cash and due from banks, interest-bearing deposits, federal funds sold and money market funds with other banks with original maturities of three months or less. Cash balances required to meet regulatory reserve requirements of the Federal Reserve Board amounted to $987 thousand and $367 thousand at December 31, 2014 and December 31, 2013, respectively.
67
Table of Contents
D. Investment Securities
Investment securities which are held for indefinite periods of time, which the Corporation intends to use as part of its asset/liability strategy, or which may be sold in response to changes in interest rates, changes in prepayment risk, increases in capital requirements, or other similar factors, are classified as available for sale and are carried at fair value. Net unrealized gains and losses for such securities, net of tax, are required to be recognized as a separate component of shareholders’ equity and excluded from determination of net income. Gains or losses on disposition are based on the net proceeds and cost of the securities sold, adjusted for the amortization of premiums and accretion of discounts, using the specific identification method.
The Corporation follows ASC 370-10-65-1 “Recognition and Presentation of Other-Than-Temporary Impairments” that provides guidance related to accounting for recognition of other-than-temporary impairment for debt securities and expands disclosure requirements for other-than-temporarily impaired debt and equity securities. Companies are required to record other-than-temporary impairment charges through earnings if they have the intent to sell, or will more likely than not be required to sell, an impaired debt security before a recovery of its amortized cost basis. In addition, companies are required to record other-than-temporary impairment charges through earnings for the amount of credit losses, regardless of the intent or requirement to sell. Credit loss is measured as the difference between the present value of an impaired debt security’s cash flows and its amortized cost basis. Non-credit-related write-downs to fair value must be recorded as decreases to accumulated other comprehensive income as long as the Corporation has no intent or it is more likely than not that the Corporation would not be required to sell an impaired security before a recovery of its amortized cost basis. The Corporation did not have any other-than-temporary impairments for 2014, 2013 or 2012.
Investment securities held in trading accounts consist solely of a deferred compensation trust account which is invested in listed mutual funds whose diversification is at the discretion of the deferred compensation plan participants. Investment securities held in trading accounts are reported at their fair value, with adjustments in fair value reported through income.
E. Loans Held for Sale
Mortgage loans originated and intended for sale in the secondary market are carried at the lower of cost or fair value in the aggregate. Net unrealized temporary losses, if any, are recognized through a valuation allowance by charges to income.
F. Portfolio Loans and Leases
The Corporation originates construction, commercial and industrial, commercial mortgage, residential mortgage, home equity and consumer loans to customers primarily in southeastern Pennsylvania as well as small-ticket equipment leases to customers nationwide. Although the Corporation has a diversified loan and lease portfolio, its debtors’ ability to honor their contracts is substantially dependent upon the real estate and general economic conditions of the region.
Loans and leases that the Corporation has the intention and ability to hold for the foreseeable future or until maturity or pay-off, generally are reported at their outstanding principal balance adjusted for charge-offs, the allowance for loan and lease losses and any deferred fees or costs on originated loans and leases. Interest income is accrued on the unpaid principal balance.
Loan and lease origination fees and loan and lease origination costs are deferred and recognized as an adjustment of the related yield using the interest method.
The accrual of interest on loans and leases is generally discontinued at the time the loan is 90 days delinquent unless the credit is well secured and in the process of collection. Loans and leases are placed on nonaccrual status
68
Table of Contents
or charged-off at an earlier date if collection of principal or interest is considered doubtful. All interest accrued, but not collected for loans that are placed on nonaccrual status or charged-off, is charged against interest income. All interest accrued, but not collected, on leases that are placed on nonaccrual status is not charged against interest until the lease is charged-off at 120 days delinquent. The interest received on these nonaccrual loans and leases is applied to reduce the carrying value of loans and leases. Loans and leases are returned to accrual status when all the principal and interest amounts contractually due are brought current, remain current for at least six months and future payments are reasonably assured. Once a loan returns to accrual status, any interest payments collected during the nonaccrual period which had been applied to the principal balance are reversed and recognized as interest income over the remaining term of the loan.
Loans acquired in mergers are recorded at their fair values. The difference between the recorded fair value and the principal value is accreted to interest income over the contractual lives of the loans in accordance with ASC 310-20. Certain acquired loans which were deemed to be credit impaired at acquisition are accounted for in accordance with ASC 310-30, as discussed below, in subsection H of this footnote.
G. Allowance for Loan and Lease Losses
The allowance for loan and lease losses (the “Allowance”) is established through a provision for loan and lease losses (the “Provision”) charged as an expense. The principal balances of loans and leases are charged against the Allowance when the Corporation believes that the principal is uncollectible. The Allowance is maintained at a level that the Corporation believes is sufficient to absorb estimated potential credit losses.
The Corporation’s determination of the adequacy of the Allowance is based on periodic evaluations of the loan and lease portfolio and other relevant factors. However, this evaluation is inherently subjective as it requires significant estimates by the Corporation. Consideration is given to a variety of factors in establishing these estimates. Various qualitative factors are considered, including specific terms and conditions of loans and leases, underwriting standards, delinquency statistics, industry concentration, overall exposure to a single customer, adequacy of collateral, the dependence on collateral, and results of internal loan review, including a borrower’s perceived financial and management strengths, the amounts and timing of the present value of future cash flows, and the access to additional funds. Also, quantitative factors in the form of historical charge-off history by portfolio segment are considered. In connection with these quantitative factors, management establishes what it deems to be an adequate look-back period for the charge-off history. In addition, management develops an estimate of a loss emergence period for each segment of the loan portfolio. The loss emergence period estimates the time between the occurrence of a loss event for a borrower and an actual charge-off of a loan.
As part of the process of calculating the Allowance to the different segments of the loan and lease portfolio, the Corporation considers certain credit quality indicators. For the commercial mortgage, construction and commercial and industrial loan segments, periodic reviews of the individual loans are performed by both in-house staff as well as external third-party loan review specialists. The result of these reviews is reflected in the risk grade assigned to each loan. In addition, the remaining segments of the loan and lease portfolio, which include residential mortgage, home equity lines and loans, consumer loans, and leases, are calculated portions of the Allowance based on their performance status.
The evaluation process also considers the impact of competition, current and expected economic conditions, national and international events, the regulatory and legislative environment and inherent risks in the loan and lease portfolio. All of these factors may be susceptible to significant change. To the extent actual outcomes differ from the Corporation’s estimates, an additional Provision may be required that might adversely affect the Corporation’s results of operations in future periods. In addition, various regulatory agencies, as an integral part of their examination processes, periodically review the adequacy of the Allowance. Such agencies may require the Corporation to record additions to the Allowance based on their judgment of information available to them at the time of their examination.
69
Table of Contents
H. Impaired Loans and Leases
A loan or lease is considered impaired when, based on current information, it is probable that the Corporation will be unable to collect the contractually scheduled payments of principal or interest. When assessing impairment, the Corporation considers various factors, which include payment status, realizable value of collateral and the probability of collecting scheduled principal and interest payments when due. Loans and leases that experience insignificant payment delays and payment shortfalls generally are not classified as impaired.
The Corporation determines the significance of payment delays and payment shortfalls on a case-by-case basis, taking into consideration all of the circumstances surrounding the loan and the borrower, including the length of the delay, the reasons for the delay, the borrower’s prior payment record, and the amount of the shortfall in relation to the principal and interest owed.
Impairment is measured by either the present value of expected future cash flows discounted at the loan’s contractual effective interest rate, the loan’s obtainable market price, or the fair value of the collateral if the loan is collateral dependent.
In addition to originating loans, the Corporation occasionally acquires loans through mergers or loan purchase transactions. Some of these acquired loans may exhibit deteriorated credit quality that has occurred since origination and the Corporation may not expect to collect all contractual payments. Accounting for these purchased credit-impaired loans is done in accordance with ASC 310-30. The loans are recorded at fair value, reflecting the present value of the amounts expected to be collected. Income recognition on these loans is based on a reasonable expectation about the timing and amount of cash flows to be collected. Acquired loans deemed impaired and considered collateral dependent, with the timing of the sale of loan collateral indeterminate, remain on nonaccrual status and have no accretable yield.
I. Troubled Debt Restructurings (“TDR”s)
A TDR occurs when a creditor, for economic or legal reasons related to a borrower’s financial difficulties, modifies the original terms of a loan or lease or grants a concession to the borrower that it would not otherwise have granted. A concession may include an extension of repayment terms, a reduction in the interest rate or the forgiveness of principal and/or accrued interest. If the debtor is experiencing financial difficulty and the creditor has granted a concession, the Corporation will make the necessary disclosures related to the TDR. In certain cases, a modification or concession may be made in an effort to retain a customer who is not experiencing financial difficulty. This type of modification is not considered a TDR.
J. Other Real Estate Owned (“OREO”)
OREO consists of assets that the Corporation has acquired through foreclosure, by accepting a deed in lieu of foreclosure, or by taking possession of assets that were used as loan collateral. The Corporation reports OREO on the balance sheet within other assets, at the lower of cost or fair value less cost to sell, adjusted periodically based on current appraisals. Costs relating to the development or improvement of assets, as well as the costs required to obtain legal title to the property, are capitalized, while costs related to holding the property are charged to expense as incurred.
K. Other Investments and Federal Home Loan Bank Stock
Other investments include Community Reinvestment Act (“CRA”) investments, and equity stocks without a readily determinable fair market value. The Corporation’s investments in equity stocks include those issued by the Federal Home Loan Bank of Pittsburgh (“FHLB”), the Federal Reserve Bank and Atlantic Central Bankers Bank. The Corporation is required to hold FHLB stock as a condition of its borrowing funds from the FHLB. As of December 31, 2014, the carrying value of the Corporation’s FHLB stock was $11.5 million. Ownership of FHLB stock is restricted and there is no market for these securities. For further information on the FHLB stock, see Note 10 – “Short-Term and Other Borrowings”.
70
Table of Contents
L. Premises and Equipment
Premises and equipment are stated at cost, less accumulated depreciation. Depreciation and predetermined rent are recorded using the straight-line method over the estimated useful lives of the assets. Leasehold improvements are amortized over the expected lease term or the estimated useful lives, whichever is shorter.
M. Pension and Postretirement Benefit Plans
The Corporation has one qualified defined-benefit pension plan, two non-qualified defined-benefit supplemental executive retirement plans and a postretirement benefit plan as discussed in Note 15 – “Pension and Postretirement Benefit Plans”. Net pension expense related to the defined-benefit consists of service cost, interest cost, return on plan assets, amortization of prior service cost, amortization of transition obligations and amortization of net actuarial gains and losses. The Corporation accrues pension costs as incurred.
N. Bank Owned Life Insurance (“BOLI”)
BOLI is recorded at its cash surrender value. Income from BOLI is tax-exempt and included as a component of non-interest income.
O. Derivative Financial Instruments
The Corporation recognizes all derivative financial instruments on its balance sheet at fair value. Derivatives that are not hedges must be adjusted to fair value through income. If a derivative has qualified as a hedge, depending on the nature of the hedge, changes in the fair value of the derivative are either offset against the change in fair value of the hedged assets, liabilities, or firm commitments through earnings, or recognized in other comprehensive income until the hedged item is recognized in earnings. The ineffective portion of a derivative’s change in fair value is recognized in earnings immediately. To determine fair value, the Corporation uses valuations obtained from a third party which utilizes a pricing model that incorporates assumptions about market conditions and risks that are current as of the reporting date. Management reviews, annually, the inputs utilized by its independent third-party valuation organization.
The Corporation may use interest-rate swap agreements to modify the interest rate characteristics from variable to fixed or fixed to variable in order to reduce the impact of interest rate changes on future net interest income. The Corporation accounts for its interest-rate swap contracts in cash flow hedging relationships by establishing and documenting the effectiveness of the instrument in offsetting the change in cash flows of assets or liabilities that are being hedged. To determine effectiveness, the Corporation performs an analysis to identify if changes in fair value or cash flow of the derivative correlate to the equivalent changes in the forecasted interest receipts related to a specified hedged item. Recorded amounts related to interest-rate swaps are included in other assets or liabilities. The change in fair value of the ineffective part of the instrument would need to be charged to the Statement of Income, potentially causing material fluctuations in reported earnings in the period of the change relative to comparable periods. In a fair value hedge, the fair values of the interest rate swap agreements and changes in the fair values of the hedged items are recorded in the Corporation’s consolidated balance sheets with the corresponding gain or loss being recognized in current earnings. The difference between changes in the fair values of interest rate swap agreements and the hedged items represents hedge ineffectiveness and is recorded in net interest income in the Statement of Income. The Corporation performs an assessment, both at the inception of the hedge and quarterly thereafter, to determine whether these derivatives are highly effective in offsetting changes in the value of the hedged items.
P. Accounting for Stock-Based Compensation
Stock-based compensation cost is measured at the grant date, based on the fair value of the award and is recognized as an expense over the vesting period.
71
Table of Contents
All share-based payments, including grants of stock options, restricted stock awards and performance-based stock awards, are recognized as compensation expense in the statement of income at their fair value. The fair value of stock option grants is determined using the Black-Scholes pricing model which considers the expected life of the options, the volatility of stock price, risk-free interest rate and annual dividend yield. The fair value of the restricted stock awards is based on their market value on the grant date, while the fair value of the performance-based stock awards is based on their grant-date market value in addition to the likelihood of attaining certain pre-determined performance goals utilizing the Monte Carlo Simulation model.
Q. Earnings per Common Share
Basic earnings per common share excludes dilution and is computed by dividing income available to common shareholders by the weighted-average common shares outstanding during the period. Diluted earnings per common share takes into account the potential dilution that would occur if in-the-money stock options were exercised and converted into common shares and restricted stock awards and performance-based stock awards were vested. Proceeds assumed to have been received on options exercises are assumed to be used to purchase shares of the Corporation’s common stock at the average market price during the period, as required by the treasury stock method of accounting. The effects of stock options are excluded from the computation of diluted earnings per share in periods in which the effect would be antidilutive. All weighted average shares, actual shares and per share information in the financial statements have been adjusted retroactively for the effect of stock dividends and splits.
R. Income Taxes
Income taxes are accounted for under the asset and liability method. Deferred tax assets and liabilities are recognized for the future tax consequences attributable to differences between the carrying amounts of existing assets and liabilities and their respective tax bases and operating loss and tax credit carry-forwards. Deferred tax assets and liabilities are measured using enacted tax rates expected to apply to taxable income in the years in which those temporary differences are expected to be recovered or settled. The effect on deferred tax assets and liabilities of a change in tax rates is recognized in income in the period that includes the enactment date.
The Corporation recognizes the benefit of a tax position only after determining that the Corporation would more-likely-than-not sustain the position following an examination. For tax positions meeting the more-likely-than-not threshold, the amount recognized in the financial statements is the largest benefit that has a greater than 50 percent likelihood of being realized upon settlement with the relevant tax authority. The Corporation applies these criteria to tax positions for which the statute of limitations remains open.
S. Revenue Recognition
With the exception of nonaccrual loans and leases, the Corporation recognizes all sources of income on the accrual method.
Additional information relating to Wealth Management fee revenue recognition follows:
The Corporation earns Wealth Management fee revenue from a variety of sources including fees from trust administration and other related fiduciary services, custody, investment management and advisory services, employee benefit account and IRA administration, estate settlement, tax service fees, shareholder service fees and brokerage. These fees are generally based on asset values and fluctuate with the market. Some revenue is not directly tied to asset value but is based on a flat fee for services provided. For many of our revenue sources, amounts are not received in the same accounting period in which they are earned. However, each source of Wealth Management fees is recorded on the accrual method of accounting.
The most significant portion of the Corporation’s Wealth Management fees is derived from trust administration and other related services, custody, investment management and advisory services, and employee benefit account
72
Table of Contents
and IRA administration. These fees are generally billed in arrears, based on the market value of assets at the end of the previous billing period. A smaller number of customers are billed in a similar manner, but on a quarterly or annual basis and some revenues are not based on market values.
The balance of the Corporation’s Wealth Management fees includes estate settlement fees and tax service fees, which are recorded when the related service is performed and asset management and brokerage fees on non-depository investment products, which are received one month in arrears, based on settled transactions, but are accrued in the month the settlement occurs.
Included in other assets on the balance sheet is a receivable for Wealth Management fees that have been earned but not yet collected.
Related to insurance revenue, for short-term duration contracts, premiums must be recognized as revenue on a proportional basis; that is, over the period of the contract for the insurance protection. Therefore, straight-line revenue recognition normally occurs.
While the preceding is the GAAP rule for short-term duration contracts, the SAP rule requires that premiums be subject to certain experience-type adjustments post-contract period. For instance, premium revenues in health insurance contracts would be adjusted to reflect experiential (exposure) under the actual contract. See, for example Statement of Statutory Accounting Principle (SSAP) No. 51, Life Contracts.
For long-term duration contracts, recognition of revenue occurs when premiums are due from the policyholder. It follows the Statement 60 definition of gross premium as the measure for revenue recognition, and the concept of “loading” (the difference between the gross and net premium) is ignored. So, for investment-type contracts, revenue is recognized even if no premium is paid by the policyholder, as in the case of universal life contracts. Revenue in such contracts represents the premiums assessed.
T. Mortgage Servicing
A portion of the residential mortgage loans originated by the Corporation is sold to a third party; however the Corporation often retains the servicing duties related to these loans. A fee, usually based on a percentage of the outstanding principal balance of the loan, is received in return for these services. Gains on the sale of these loans are based on the specific identification method.
An intangible asset, referred to as mortgage servicing rights (“MSR”s) is recognized when the loan servicing rights are retained upon sale of a loan. These MSRs amortize to non-interest expense in proportion to, and over the period of, the estimated future net servicing life of the underlying loans.
MSRs are evaluated quarterly for impairment based upon the fair value of the rights as compared to their amortized cost. Impairment is determined by stratifying the MSRs by predominant characteristics, such as interest rate and terms. Fair value is determined based upon discounted cash flows using market-based assumptions. Impairment is recognized on the income statement to the extent the fair value is less than the capitalized amount for the stratum. A valuation allowance is utilized to record temporary impairment in MSRs. Temporary impairment is defined as impairment that is not deemed permanent. Permanent impairment is recorded as a reduction of the MSR and is not reversed.
U. Statement of Cash Flows
The Corporation’s statement of cash flows details operating, investing and financing activities during the reported periods.
73
Table of Contents
V. Goodwill and Intangible Assets
The Corporation accounts for goodwill and other intangible assets in accordance with ASC 350, “Intangibles – Goodwill and Other.” The goodwill and intangible assets as of December 31, 2014, other than MSRs in Note 1-T above, are related to the acquisitions of Lau Associates, The Private Wealth Management Group of the Hershey Trust Company (“PWMG”), Davidson Trust Company (“DTC”) and PCPB, which are components of the Wealth Management segment, and First Keystone Financial, Inc. (“FKF”), and First Bank of Delaware (“FBD”), which are components of the Banking segment. The amount of goodwill initially recorded is based on the fair value of the acquired entity at the time of acquisition. Goodwill impairment tests are performed annually, or when events occur or circumstances change that would more likely than not reduce the fair value of the acquisition or investment. Goodwill impairment is tested on a reporting unit level. The Corporation currently has three reporting units: Banking, Wealth Management and Insurance. As of December 31, 2014, the Insurance reporting unit did not meet the quantitative thresholds for separate disclosure as a business segment and is therefore reported as a component of the Wealth Management segment, based on its internal reporting structure.
The Corporation’s impairment testing methodology is consistent with the methodology prescribed in ASC 350. Other intangible assets include a core deposit intangible, which was acquired in the FKF merger and the FBD transaction, customer relationships, trade name and non-competition agreements acquired in connection with the acquisitions of DTC, PWMG, Lau Associates and PCPB. The customer relationships, non-competition agreement and core deposit intangibles are amortized over the estimated useful lives of the assets. The trade name intangible has an indefinite life and is evaluated for impairment annually.
W. Reclassifications
Certain prior year amounts have been reclassified to conform to the current year’s presentation.
X. Recent Accounting Pronouncements
FASB ASU 2014-01, “Investments – Equity Method and Joint Ventures (Topic 323), Accounting for Investments in Qualified Affordable Housing Projects.”
Issued in January 2014, ASU 2014-01 provides guidance on accounting for investments by a reporting entity in flow-through limited liability entities that manage or invest in affordable housing projects that qualify for the low-income housing tax credit. The amendments in this update permit reporting entities to make an accounting policy election to account for their investments in qualified affordable housing projects using the proportional amortization method if certain conditions are met. Under the proportional amortization method, an entity amortizes the initial cost of the investment in proportion to the tax credits and other tax benefits received and recognizes the net investment performance in the income statement as a component of income tax expense (benefit). For those investments in qualified affordable housing projects not accounted for using the proportional amortization method, the investment should be accounted for as an equity method investment or a cost method investment in accordance with Subtopic 970-323. The amendments in this update should be applied retrospectively to all periods presented. A reporting entity that uses the effective yield method to account for its investments in qualified affordable housing projects before the date of adoption may continue to apply the effective yield method for those preexisting investments. The amendments in this update are effective for public business entities for annual periods and interim reporting periods within those annual periods, beginning after December 15, 2014. The Corporation has evaluated the effect of the adoption of this guidance and it is not expected to have an impact on the presentation of the Corporation’s consolidated financial statements.
FASB ASU 2014-04, “Receivables – Troubled Debt Restructurings by Creditors (Subtopic 310-40): Reclassification of Residential Real Estate Collateralized Consumer Mortgage Loans upon Foreclosure (a consensus of the FASB Emerging Issues Task Force).”
Issued in January 2014, ASU 2014-04 clarifies when an “in substance repossession or foreclosure” occurs, that is, when a creditor should be considered to have received physical possession of residential real estate property
74
Table of Contents
collateralizing a consumer mortgage loans, such that all or a portion of the loan should be derecognized and the real estate property recognized. ASU 2014-04 states that a creditor is considered to have received physical possession of residential real estate property collateralizing a consumer mortgage loan, upon either the creditor obtaining legal title to the residential real estate property upon completion of a foreclosure, or the borrower conveying all interest in the residential real estate property to the creditor to satisfy that loan through completion of a deed in lieu of foreclosure or through a similar legal agreement. The amendments of ASU 2014-04 also require interim and annual disclosure of both the amount of foreclosed residential real estate property held by the creditor and the recorded investment in consumer mortgage loans collateralized by residential real estate property that are in the process of foreclosure. The amendments of ASU 2014-04 are effective for interim and annual periods beginning after December 15, 2014, and may be applied using either a modified retrospective transition method or a prospective transition method as described in ASU 2014-04. The adoption of ASU 2014-04 will be a change in presentation only, for the newly required disclosures, and is not expected to have a significant impact to the Corporation’s consolidated financial statements.
FASB ASU 2014-09, “Revenue from Contracts with Customers”
Issued on May 28, 2014, ASU No. 2014-09 requires an entity to recognize the amount of revenue to which it expects to be entitled for the transfer of promised goods or services to customers. ASU 2014-09 will replace most existing revenue recognition guidance in U.S. GAAP when it becomes effective. The new standard is effective for the Corporation on January 1, 2017. Early application is not permitted. The standard permits the use of either the retrospective or cumulative effect transition method. The Corporation is evaluating the effect that ASU 2014-09 will have on its consolidated financial statements and related disclosures. The Corporation has not yet selected a transition method nor has it determined the effect of the standard on its ongoing financial reporting.
FASB ASU 2014-12, “Accounting for Share-Based Payments When the Terms of an Award Provide That a Performance Target Could Be Achieved after the Requisite Service Period”
Issued on June 19, 2014, ASU 2014-12 requires a reporting entity to treat a performance target that affects vesting and that could be achieved after the requisite service period as a performance condition. A reporting entity should apply FASB ASC Topic 718, Compensation – Stock Compensation, to awards with performance conditions that affect vesting. A performance target that affects vesting and could be achieved after completion of the service period should be treated as a performance condition under FASB ASC 718 and, as a result, should not be included in the estimation of the grant-date fair value of the award. An entity should recognize compensation cost for the award when it becomes probable that the performance target will be achieved. In the event that an entity determines that it is probable that a performance target will be achieved before the end of the service period, the compensation cost of the award should be recognized prospectively over the remaining service period. For all entities, ASU 2014-12 is effective for annual periods, and interim periods within those annual periods, beginning after December 15, 2015. Early adoption is permitted. ASU 2014-12 may be adopted either prospectively for share-based payment awards granted or modified on or after the effective date, or retrospectively, using a modified retrospective approach. The modified retrospective approach would apply to share-based payment awards outstanding as of the beginning of the earliest annual period presented in the financial statements on adoption, and to all new or modified awards thereafter. The Corporation is evaluating the impact of the adoption of this guidance. However, it is not expected to have a significant impact on its results of operations.
FASB ASU 2014-14, “Classification of Certain Government-Guaranteed Mortgage Loans upon Foreclosure (a consensus of the FASB Emerging Issues Task Force)”
Issued on August 14, 2014, ASU 2014-14 will require creditors to derecognize certain foreclosed government-guaranteed mortgage loans and to recognize a separate other receivable that is measured at the amount the creditor expects to recover from the guarantor, and to treat the guarantee and the receivable as a single unit of account. The new standard is effective for public business entities for annual periods, and interim periods within those annual periods, beginning after December 15, 2014. An entity can elect a prospective or a modified
75
Table of Contents
retrospective transition method, but must use the same transition method that it elected under FASB ASU No. 2014-04, Reclassification of Residential Real Estate Collateralized Consumer Mortgage Loans upon Foreclosure. Early adoption, including adoption in an interim period, is permitted if the entity already adopted ASU 2014-04. The Corporation is evaluating the impact of the adoption of this guidance. However, it is not expected to have a significant impact on its consolidated financial statements.
FASB ASU 2014-15, “Disclosure of Uncertainties about an Entity’s Ability to Continue as a Going Concern”
Issued on August 15, 2014, ASU 2014-15 describes how an entity should assess its ability to meet obligations and sets disclosure requirements for how this information should be disclosed in the financial statements. The standard provides accounting guidance that will be used with existing auditing standards. The new standard applies to all entities for the first annual period ending after December 15, 2016, and interim periods thereafter. The Corporation is evaluating the impact of the adoption of this guidance. However, it is not expected to have a significant impact on its consolidated financial statements.
Note 2 – Business Combinations
Powers Craft Parker and Beard, Inc.
The acquisition of PCPB, an insurance brokerage headquartered in Rosemont, Pennsylvania, was completed on October 1, 2014. The consideration paid by the Corporation was $7.0 million, of which $5.4 million was paid at closing and three contingent cash payments, not to exceed $542 thousand each, will be payable on each of September 30, 2015, September 30, 2016 and September 30, 2017, subject to the attainment of certain revenue targets during the related periods. The acquisition will enable the Corporation to offer a comprehensive line of insurance solutions to both individual and business clients.
In connection with the PCPB acquisition, the consideration paid and the fair value of identifiable assets acquired and liabilities assumed as of the date of acquisition are summarized in the following table:
| (dollars in thousands) | ||||
| Consideration paid: |
||||
| Cash paid at closing |
$ | 5,399 | ||
| Contingent payment liability |
1,625 | |||
|
|
|
|||
| Value of consideration |
7,024 | |||
| Assets acquired: |
||||
| Cash operating accounts |
1,274 | |||
| Other investments |
302 | |||
| Premises and equipment |
100 | |||
| Intangible assets – customer relationships |
3,280 | |||
| Intangible assets – non-competition agreements |
1,580 | |||
| Intangible assets – trade name |
955 | |||
| Other assets |
850 | |||
|
|
|
|||
| Total assets |
8,341 | |||
| Liabilities assumed: |
||||
| Deferred tax liability |
2,437 | |||
| Other liabilities |
1,818 | |||
|
|
|
|||
| Total liabilities |
4,255 | |||
| Net assets acquired |
4,086 | |||
|
|
|
|||
| Goodwill resulting from acquisition of PCPB |
$ | 2,938 | ||
|
|
|
|||
As of December 31, 2014, the Corporation finalized its fair value estimates related to the acquisition of PCPB.
76
Table of Contents
Note 3 – Goodwill & Other Intangible Assets
The Corporation completed an annual impairment test for goodwill and other intangibles during the fourth quarter of 2014. There was no goodwill impairment and no material impairment to identifiable intangible assets recorded during 2013 or 2014. There can be no assurance that future impairment assessments or tests will not result in a charge to earnings.
The Corporation’s goodwill and intangible assets related to the acquisitions of Lau Associates in July, 2008, FKF in July, 2010, PWMG in May, 2011, DTC in May, 2012, FBD in November, 2012 and PCPB in October, 2014, for the years ended December 31, 2014 and 2013 are as follows:
| (dollars in thousands) | Beginning Balance 12/31/13 |
Additions/ Adjustments |
Amortization | Ending Balance 12/31/14 |
Amortization Period | |||||||||||||
| Goodwill – Wealth reporting unit |
$ | 20,412 | $ | — | $ | — | $ | 20,412 | Indefinite | |||||||||
| Goodwill – Banking reporting unit |
12,431 | — | — | 12,431 | Indefinite | |||||||||||||
| Goodwill – Insurance reporting unit |
— | 2,938 | — | 2,938 | Indefinite | |||||||||||||
|
|
|
|
|
|
|
|
|
|||||||||||
| Total |
$ | 32,843 | $ | 2,938 | $ | — | $ | 35,781 | ||||||||||
| Core deposit intangible |
$ | 1,342 | $ | — | $ | (276 | ) | $ | 1,066 | 10 Years | ||||||||
| Customer relationships |
13,595 | 3,280 | (1,313 | ) | 15,562 | 10 to 20 Years | ||||||||||||
| Non-compete agreements |
3,218 | 1,580 | (1,070 | ) | 3,728 | 5 to 10 Years | ||||||||||||
| Trade name |
1,210 | 955 | — | 2,165 | Indefinite | |||||||||||||
|
|
|
|
|
|
|
|
|
|||||||||||
| Total |
$ | 19,365 | $ | 5,815 | $ | (2,659 | ) | $ | 22,521 | |||||||||
|
|
|
|
|
|
|
|
|
|||||||||||
| Grand total |
$ | 52,208 | $ | 8,753 | $ | (2,659 | ) | $ | 58,302 | |||||||||
|
|
|
|
|
|
|
|
|
|||||||||||
| (dollars in thousands) | Beginning Balance 12/31/12 |
Additions/ Adjustments |
Amortization | Ending Balance 12/31/13 |
Amortization Period | |||||||||||||
| Goodwill – Wealth segment |
$ | 20,466 | $ | (54 | ) | $ | — | $ | 20,412 | Indefinite | ||||||||
| Goodwill – Banking segment |
12,431 | — | — | 12,431 | Indefinite | |||||||||||||
|
|
|
|
|
|
|
|
|
|||||||||||
| Total |
$ | 32,897 | $ | (54 | ) | $ | — | $ | 32,843 | |||||||||
| Core deposit intangible |
$ | 1,654 | $ | — | $ | (312 | ) | $ | 1,342 | 10 Years | ||||||||
| Customer relationships |
14,890 | — | (1,295 | ) | 13,595 | 10 to 20 Years | ||||||||||||
| Non-compete agreements |
4,244 | — | (1,026 | ) | 3,218 | 5 to 5 1⁄2 Years | ||||||||||||
| Trade name |
1,210 | — | — | 1,210 | Indefinite | |||||||||||||
|
|
|
|
|
|
|
|
|
|||||||||||
| Total |
$ | 21,998 | $ | — | $ | (2,633 | ) | $ | 19,365 | |||||||||
|
|
|
|
|
|
|
|
|
|||||||||||
| Grand total |
$ | 54,895 | $ | (54 | ) | $ | (2,633 | ) | $ | 52,208 | ||||||||
|
|
|
|
|
|
|
|
|
|||||||||||
Note 4 – Investment Securities
The amortized cost and fair value of investments, which were classified as available for sale, are as follows:
As of December 31, 2014
| (dollars in thousands) | Amortized Cost |
Gross Unrealized Gains |
Gross Unrealized Losses |
Fair Value | ||||||||||||
| U.S. Treasury securities |
$ | 102 | $ | — | $ | (2 | ) | $ | 100 | |||||||
| Obligations of the U.S. government and agencies |
66,881 | 171 | (290 | ) | 66,762 | |||||||||||
| Obligations of state and political subdivisions |
28,955 | 137 | (47 | ) | 29,045 | |||||||||||
| Mortgage-backed securities |
79,498 | 1,914 | (30 | ) | 81,382 | |||||||||||
| Collateralized mortgage obligations |
34,618 | 299 | (120 | ) | 34,797 | |||||||||||
| Other investments |
17,499 | 173 | (181 | ) | 17,491 | |||||||||||
|
|
|
|
|
|
|
|
|
|||||||||
| Total |
$ | 227,553 | $ | 2,694 | $ | (670 | ) | $ | 229,577 | |||||||
|
|
|
|
|
|
|
|
|
|||||||||
77
Table of Contents
As of December 31, 2013
| (dollars in thousands) | Amortized Cost |
Gross Unrealized Gains |
Gross Unrealized Losses |
Fair Value | ||||||||||||
| U.S. Treasury securities |
$ | 102 | $ | — | $ | (3 | ) | $ | 99 | |||||||
| Obligations of the U.S. government and agencies |
71,097 | 149 | (1,678 | ) | 69,568 | |||||||||||
| Obligations of state and political subdivisions |
37,140 | 141 | (304 | ) | 36,977 | |||||||||||
| Mortgage-backed securities |
119,044 | 1,392 | (1,073 | ) | 119,363 | |||||||||||
| Collateralized mortgage obligations |
44,463 | 273 | (493 | ) | 44,243 | |||||||||||
| Other investments |
15,281 | 301 | (24 | ) | 15,558 | |||||||||||
|
|
|
|
|
|
|
|
|
|||||||||
| Total |
$ | 287,127 | $ | 2,256 | $ | (3,575 | ) | $ | 285,808 | |||||||
|
|
|
|
|
|
|
|
|
|||||||||
The following table shows the amount of securities that were in an unrealized loss position at December 31, 2014:
| Less than 12 Months |
12 Months or Longer |
Total | ||||||||||||||||||||||
| (dollars in thousands) | Fair Value |
Unrealized Losses |
Fair Value |
Unrealized Losses |
Fair Value |
Unrealized Losses |
||||||||||||||||||
| U.S. Treasury securities |
$ | — | $ | — | $ | 100 | $ | (2 | ) | $ | 100 | $ | (2 | ) | ||||||||||
| Obligations of the U.S. government and agencies |
16,822 | (28 | ) | 22,691 | (262 | ) | 39,513 | (290 | ) | |||||||||||||||
| Obligations of state and political subdivisions |
4,777 | (19 | ) | 4,060 | (28 | ) | 8,837 | (47 | ) | |||||||||||||||
| Mortgage-backed securities |
2,289 | (14 | ) | 3,814 | (16 | ) | 6,103 | (30 | ) | |||||||||||||||
| Collateralized mortgage obligations |
3,274 | (22 | ) | 9,507 | (98 | ) | 12,781 | (120 | ) | |||||||||||||||
| Other investments |
13,717 | (181 | ) | — | — | 13,717 | (181 | ) | ||||||||||||||||
|
|
|
|
|
|
|
|
|
|
|
|
|
|||||||||||||
| Total |
$ | 40,879 | $ | (264 | ) | $ | 40,172 | $ | (406 | ) | $ | 81,051 | $ | (670 | ) | |||||||||
|
|
|
|
|
|
|
|
|
|
|
|
|
|||||||||||||
The following table shows the amount of securities that were in an unrealized loss position at December 31, 2013:
| Less than 12 Months |
12 Months or Longer |
Total | ||||||||||||||||||||||
| (dollars in thousands) | Fair Value |
Unrealized Losses |
Fair Value |
Unrealized Losses |
Fair Value |
Unrealized Losses |
||||||||||||||||||
| U.S. Treasury securities |
$ | 99 | $ | (3 | ) | $ | — | $ | — | $ | 99 | $ | (3 | ) | ||||||||||
| Obligations of the U.S. government and agencies |
41,201 | (1,391 | ) | 5,774 | (287 | ) | 46,975 | (1,678 | ) | |||||||||||||||
| Obligations of state and political subdivisions |
13,020 | (233 | ) | 4,543 | (71 | ) | 17,563 | (304 | ) | |||||||||||||||
| Mortgage-backed securities |
55,672 | (972 | ) | 2,302 | (101 | ) | 57,974 | (1,073 | ) | |||||||||||||||
| Collateralized mortgage obligations |
26,395 | (493 | ) | — | — | 26,395 | (493 | ) | ||||||||||||||||
| Other investments |
1,494 | (24 | ) | — | — | 1,494 | (24 | ) | ||||||||||||||||
|
|
|
|
|
|
|
|
|
|
|
|
|
|||||||||||||
| Total |
$ | 137,881 | $ | (3,116 | ) | $ | 12,619 | $ | (459 | ) | $ | 150,500 | $ | (3,575 | ) | |||||||||
|
|
|
|
|
|
|
|
|
|
|
|
|
|||||||||||||
Management evaluates the Corporation’s investment securities that are in an unrealized loss position in order to determine if the decline in market value is other than temporary. The investment portfolio includes debt securities issued by U.S. government agencies, U.S. government-sponsored agencies, state and local municipalities and other issuers. All fixed income investment securities in the Corporation’s investment portfolio are rated as investment-grade or higher. Factors considered in the evaluation include the current economic climate, the length of time and the extent to which the fair value has been below cost, interest rates and the bond
78
Table of Contents
rating of each security. The unrealized losses presented in the tables above are temporary in nature and are primarily related to market interest rates rather than the underlying credit quality of the issuers. Management does not believe that these unrealized losses are other-than-temporary. The Corporation does not have the intent to sell these securities prior to their maturity or the recovery of their cost bases and believes that it is more likely, than not, that it will not have to sell these securities prior to their maturity or the recovery of their cost bases.
At December 31, 2014, securities having a fair value of $91.9 million were specifically pledged as collateral for public funds, trust deposits, the FRB discount window program, FHLB borrowings and other purposes. The FHLB has a blanket lien on non-pledged, mortgage-related loans and securities as part of the Corporation’s borrowing agreement with the FHLB.
The amortized cost and fair value of investment and mortgage-related securities as of December 31, 2014 and 2013, by contractual maturity, are shown below. Expected maturities will differ from contractual maturities as borrowers may have the right to call or prepay obligations with or without call or prepayment penalties.
| December 31, 2014 | ||||||||
| (dollars in thousands) | Amortized Cost |
Fair Value |
||||||
| Investment securities*: |
||||||||
| Due in one year or less |
$ | 15,254 | $ | 15,277 | ||||
| Due after one year through five years |
59,433 | 59,463 | ||||||
| Due after five years through ten years |
23,151 | 23,067 | ||||||
| Due after ten years |
— | — | ||||||
|
|
|
|
|
|||||
| Subtotal |
97,838 | 97,807 | ||||||
| Mortgage-related securities |
114,116 | 116,179 | ||||||
|
|
|
|
|
|||||
| Total |
$ | 211,954 | $ | 213,986 | ||||
|
|
|
|
|
|||||
| * | Included in the investment portfolio, but not in the table above, are mutual funds with a fair value, as of December 31, 2014, of $15.6 million, which have no stated maturity. |
| December 31, 2013 | ||||||||
| (dollars in thousands) | Amortized Cost |
Fair Value |
||||||
| Investment securities*: |
||||||||
| Due in one year or less |
$ | 7,859 | $ | 7,869 | ||||
| Due after one year through five years |
49,790 | 49,721 | ||||||
| Due after five years through ten years |
51,793 | 50,117 | ||||||
| Due after ten years |
797 | 824 | ||||||
|
|
|
|
|
|||||
| Subtotal |
110,239 | 108,531 | ||||||
| Mortgage-related securities |
163,507 | 163,606 | ||||||
|
|
|
|
|
|||||
| Total |
$ | 273,746 | $ | 272,137 | ||||
|
|
|
|
|
|||||
| * | Included in the investment portfolio, but not in the table above, are mutual funds with a fair value, as of December 31, 2013, of $13.7 million, which have no stated maturity. |
Proceeds from the sale of available for sale investment securities totaled $24.4 million, $14.9 million and $40.6 million for the twelve months ended December 31, 2014, 2013 and 2012, respectively. Net gain on sale of available for sale investment securities for the twelve months ended December 31, 2014 and 2012 totaled $471 thousand million and $1.4 million, respectively. Net loss on sale of available for sale investment securities for the twelve months ended December 31, 2013 totaled $8 thousand.
79
Table of Contents
As of December 31, 2014 and December 31, 2013, the Corporation’s investment securities held in trading accounts were comprised of a deferred compensation trust which is invested in marketable securities whose diversification is at the discretion of the deferred compensation plan participants.
Note 5 – Loans and Leases
A. Loans and leases outstanding are detailed by portfolio segment as follows:
| December 31, | ||||||||
| (dollars in thousands) | 2014 | 2013 | ||||||
| Loans held for sale |
$ | 3,882 | $ | 1,350 | ||||
|
|
|
|
|
|||||
| Real estate loans: |
||||||||
| Commercial mortgage |
$ | 689,528 | 625,341 | |||||
| Home equity lines and loans |
182,082 | 189,571 | ||||||
| Residential mortgage |
313,442 | 300,243 | ||||||
| Construction |
66,267 | 46,369 | ||||||
|
|
|
|
|
|||||
| Total real estate loans |
1,251,319 | 1,161,524 | ||||||
| Commercial and industrial |
335,645 | 328,459 | ||||||
| Consumer |
18,480 | 16,926 | ||||||
| Leases |
46,813 | 40,276 | ||||||
|
|
|
|
|
|||||
| Total portfolio loans and leases |
1,652,257 | 1,547,185 | ||||||
|
|
|
|
|
|||||
| Total loans and leases |
$ | 1,656,139 | $ | 1,548,535 | ||||
|
|
|
|
|
|||||
| Loans with predetermined rates |
$ | 927,009 | $ | 850,168 | ||||
| Loans with adjustable or floating rates |
729,130 | 698,367 | ||||||
|
|
|
|
|
|||||
| Total loans and leases |
$ | 1,656,139 | $ | 1,548,535 | ||||
|
|
|
|
|
|||||
| Net deferred loan origination costs included in the loan balances |
$ | 324 | $ | 222 | ||||
|
|
|
|
|
|||||
B. Leases outstanding at December 31 are detailed by components of the net investment as follows:
| December 31, | ||||||||
| (dollars in thousands) | 2014 | 2013 | ||||||
| Minimum lease payments receivable |
$ | 53,131 | $ | 45,866 | ||||
| Unearned lease income |
(8,546 | ) | (7,534 | ) | ||||
| Initial direct costs and deferred fees |
2,228 | 1,944 | ||||||
|
|
|
|
|
|||||
| Total |
$ | 46,813 | $ | 40,276 | ||||
|
|
|
|
|
|||||
80
Table of Contents
C. Non-Performing Loans and Leases*
| December 31, | ||||||||
| (dollars in thousands) | 2014 | 2013 | ||||||
| Nonaccrual loans and leases: |
||||||||
| Commercial mortgage |
$ | 668 | $ | 478 | ||||
| Home equity lines and loans |
1,061 | 1,262 | ||||||
| Residential mortgage |
5,693 | 4,377 | ||||||
| Construction |
263 | 830 | ||||||
| Commercial and industrial |
2,390 | 3,539 | ||||||
| Consumer |
— | 20 | ||||||
| Leases |
21 | 24 | ||||||
|
|
|
|
|
|||||
| Total |
10,096 | 10,530 | ||||||
|
|
|
|
|
|||||
| Loans and leases 90 days or more past due and still accruing: |
||||||||
| Construction |
— | — | ||||||
|
|
|
|
|
|||||
| Total non-performing loans and leases |
$ | 10,096 | $ | 10,530 | ||||
|
|
|
|
|
|||||
| * | Purchased credit-impaired loans, which have been recorded at fair value at the acquisition date and which are performing as expected are excluded from this table with the exception of $572 thousand and $238 thousand as of December 31, 2014 and 2013, respectively, of purchased credit-impaired loans, which became non-performing subsequent to their acquisition. |
D. Purchased Credit-Impaired Loans
The outstanding principal balance and related carrying amount of credit-impaired loans, for which the Corporation applies ASC 310-30 to account for the interest earned, as of the dates indicated, is as follows:
| December 31, | ||||||||
| (dollars in thousands) | 2014 | 2013 | ||||||
| Outstanding principal balance |
$ | 12,491 | $ | 14,293 | ||||
| Carrying amount(1) |
$ | 9,045 | $ | 9,880 | ||||
| (1) | Includes $105 thousand and $293 thousand of purchased credit-impaired loans as of December 31, 2014 and 2013, respectively, for which the Corporation could not estimate the timing or amount of expected cash flows to be collected at the acquisition date, and for which no accretable yield is recognized. Additionally, the table above includes $572 thousand and $238 thousand as of December 31, 2014 and 2013, respectively, of purchased credit-impaired loans that subsequently became non-performing, which are disclosed in Note 5C, above, and which also have no accretable yield. |
81
Table of Contents
The following table presents changes in the accretable discount on purchased credit-impaired loans, for which the Corporation applies ASC 310-30, for the twelve month periods ended December 31, 2013 and 2014:
| (dollars in thousands) | Accretable Discount |
|||
| Balance, December 31, 2012 |
$ | 8,025 | ||
| Accretion |
(1,893 | ) | ||
| Reclassification from nonaccretable difference |
1,198 | |||
| Additions/adjustments |
(257 | ) | ||
| Disposals |
(939 | ) | ||
|
|
|
|||
| Balance, December 31, 2013 |
6,134 | |||
| Accretion |
(1,579 | ) | ||
| Reclassification from nonaccretable difference |
934 | |||
| Additions/adjustments |
(130 | ) | ||
| Disposals |
(2 | ) | ||
|
|
|
|||
| Balance, December 31, 2014 |
$ | 5,357 | ||
|
|
|
|||
E. Age Analysis of Past Due Loans and Leases
The following tables present an aging of the Corporation’s loan and lease portfolio as of December 31, 2014 and 2013:
| Accruing Loans and Leases | ||||||||||||||||||||||||||||||||
| (dollars in thousands) | 30 – 59 Days Past Due |
60 – 89 Days Past Due |
Over 89 Days Past Due |
Total Past Due |
Current | Total Accruing Loans and Leases |
Nonaccrual Loans and Leases |
Total Loans and Leases |
||||||||||||||||||||||||
| As of December 31, 2014 |
||||||||||||||||||||||||||||||||
| Commercial mortgage |
$ | 71 | $ | 1,185 | $ | — | $ | 1,256 | $ | 687,604 | $ | 688,860 | $ | 668 | $ | 689,528 | ||||||||||||||||
| Home equity lines and loans |
26 | — | — | 26 | 180,995 | 181,021 | 1,061 | 182,082 | ||||||||||||||||||||||||
| Residential mortgage |
381 | 123 | — | 504 | 307,245 | 307,749 | 5,693 | 313,442 | ||||||||||||||||||||||||
| Construction |
— | — | — | — | 66,004 | 66,004 | 263 | 66,267 | ||||||||||||||||||||||||
| Commercial and industrial |
390 | — | — | 390 | 332,865 | 333,255 | 2,390 | 335,645 | ||||||||||||||||||||||||
| Consumer |
19 | 3 | — | 22 | 18,458 | 18,480 | — | 18,480 | ||||||||||||||||||||||||
| Leases |
18 | 17 | — | 35 | 46,757 | 46,792 | 21 | 46,813 | ||||||||||||||||||||||||
|
|
|
|
|
|
|
|
|
|
|
|
|
|
|
|
|
|||||||||||||||||
| $ | 905 | $ | 1,328 | $ | — | $ | 2,233 | $ | 1,639,928 | $ | 1,642,161 | $ | 10,096 | $ | 1,652,257 | |||||||||||||||||
|
|
|
|
|
|
|
|
|
|
|
|
|
|
|
|
|
|||||||||||||||||
| Accruing Loans and Leases | ||||||||||||||||||||||||||||||||
| (dollars in thousands) | 30 – 59 Days Past Due |
60 – 89 Days Past Due |
Over 89 Days Past Due |
Total Past Due |
Current | Total Accruing Loans and Leases |
Nonaccrual Loans and Leases |
Total Loans and Leases |
||||||||||||||||||||||||
| As of December 31, 2013 |
||||||||||||||||||||||||||||||||
| Commercial mortgage |
$ | 241 | $ | — | $ | — | $ | 241 | $ | 624,622 | $ | 624,863 | $ | 478 | $ | 625,341 | ||||||||||||||||
| Home equity lines and loans |
209 | — | — | 209 | 188,100 | 188,309 | 1,262 | 189,571 | ||||||||||||||||||||||||
| Residential mortgage |
773 | 35 | — | 808 | 295,058 | 295,866 | 4,377 | 300,243 | ||||||||||||||||||||||||
| Construction |
— | — | — | — | 45,539 | 45,539 | 830 | 46,369 | ||||||||||||||||||||||||
| Commercial and industrial |
334 | — | — | 334 | 324,586 | 324,920 | 3,539 | 328,459 | ||||||||||||||||||||||||
| Consumer |
2 | 4 | — | 6 | 16,900 | 16,906 | 20 | 16,926 | ||||||||||||||||||||||||
| Leases |
60 | 60 | — | 120 | 40,132 | 40,252 | 24 | 40,276 | ||||||||||||||||||||||||
|
|
|
|
|
|
|
|
|
|
|
|
|
|
|
|
|
|||||||||||||||||
| $ | 1,619 | $ | 99 | $ | — | $ | 1,718 | $ | 1,534,937 | $ | 1,536,655 | $ | 10,530 | $ | 1,547,185 | |||||||||||||||||
|
|
|
|
|
|
|
|
|
|
|
|
|
|
|
|
|
|||||||||||||||||
82
Table of Contents
F. Allowance for Loan and Lease Losses (the “Allowance”)
The following table details the roll-forward of the Corporation’s allowance for loan and lease losses, by portfolio segment, for the twelve months ended December 31, 2014:
| (dollars in thousands) | Commercial Mortgage |
Home Equity Lines and Loans |
Residential Mortgage |
Construction | Commercial and Industrial |
Consumer | Leases | Unallocated | Total | |||||||||||||||||||||||||||
| Balance, December 31, 2013 |
$ | 3,797 | $ | 2,204 | $ | 2,446 | $ | 845 | $ | 5,011 | $ | 259 | $ | 604 | $ | 349 | $ | 15,515 | ||||||||||||||||||
| Charge-offs |
(34 | ) | (736 | ) | (461 | ) | — | (415 | ) | (144 | ) | (410 | ) | — | (2,200 | ) | ||||||||||||||||||||
| Recoveries |
6 | 19 | 22 | 60 | 98 | 17 | 165 | — | 387 | |||||||||||||||||||||||||||
| Provision |
179 | 430 | (271 | ) | 462 | (161 | ) | 106 | 109 | 30 | 884 | |||||||||||||||||||||||||
|
|
|
|
|
|
|
|
|
|
|
|
|
|
|
|
|
|
|
|||||||||||||||||||
| Balance, December 31, 2014 |
$ | 3,948 | $ | 1,917 | $ | 1,736 | $ | 1,367 | $ | 4,533 | $ | 238 | $ | 468 | $ | 379 | $ | 14,586 | ||||||||||||||||||
|
|
|
|
|
|
|
|
|
|
|
|
|
|
|
|
|
|
|
|||||||||||||||||||
The following table details the roll-forward of the Corporation’s allowance for loan and lease losses, by portfolio segment, for the twelve months ended December 31, 2013:
| (dollars in thousands) | Commercial Mortgage |
Home Equity Lines and Loans |
Residential Mortgage |
Construction | Commercial and Industrial |
Consumer | Leases | Unallocated | Total | |||||||||||||||||||||||||||
| Balance, December 31, 2012 |
$ | 3,907 | $ | 1,857 | $ | 2,024 | $ | 1,019 | $ | 4,637 | $ | 189 | $ | 493 | $ | 299 | $ | 14,425 | ||||||||||||||||||
| Charge-offs |
(71 | ) | (513 | ) | (307 | ) | (737 | ) | (781 | ) | (194 | ) | (376 | ) | — | (2,979 | ) | |||||||||||||||||||
| Recoveries |
20 | 67 | 18 | 24 | 65 | 10 | 290 | — | 494 | |||||||||||||||||||||||||||
| Provision |
(59 | ) | 793 | 711 | 539 | 1,090 | 254 | 197 | 50 | 3,575 | ||||||||||||||||||||||||||
|
|
|
|
|
|
|
|
|
|
|
|
|
|
|
|
|
|
|
|||||||||||||||||||
| Balance, December 31, 2013 |
$ | 3,797 | $ | 2,204 | $ | 2,446 | $ | 845 | $ | 5,011 | $ | 259 | $ | 604 | $ | 349 | $ | 15,515 | ||||||||||||||||||
|
|
|
|
|
|
|
|
|
|
|
|
|
|
|
|
|
|
|
|||||||||||||||||||
The following table details the roll-forward of the Corporation’s allowance for loan and lease losses, by portfolio segment, for the twelve months ended December 31, 2012:
| (dollars in thousands) | Commercial Mortgage |
Home Equity Lines and Loans |
Residential Mortgage |
Construction | Commercial and Industrial |
Consumer | Leases | Unallocated | Total | |||||||||||||||||||||||||||
| Balance, December 31, 2011 |
$ | 3,165 | $ | 1,707 | $ | 1,592 | $ | 1,384 | $ | 3,816 | $ | 119 | $ | 532 | $ | 438 | $ | 12,753 | ||||||||||||||||||
| Charge-offs |
(234 | ) | (375 | ) | (209 | ) | (1,131 | ) | (458 | ) | (96 | ) | (364 | ) | — | (2,867 | ) | |||||||||||||||||||
| Recoveries |
4 | — | 75 | 15 | 143 | 7 | 292 | — | 536 | |||||||||||||||||||||||||||
| Provision |
972 | 525 | 566 | 751 | 1,136 | 159 | 33 | (139 | ) | 4,003 | ||||||||||||||||||||||||||
|
|
|
|
|
|
|
|
|
|
|
|
|
|
|
|
|
|
|
|||||||||||||||||||
| Balance, December 31, 2012 |
$ | 3,907 | $ | 1,857 | $ | 2,024 | $ | 1,019 | $ | 4,637 | $ | 189 | $ | 493 | $ | 299 | $ | 14,425 | ||||||||||||||||||
|
|
|
|
|
|
|
|
|
|
|
|
|
|
|
|
|
|
|
|||||||||||||||||||
83
Table of Contents
The following table details the allocation of the allowance for loan and lease losses by portfolio segment based on the methodology used to evaluate the loans and leases for impairment as of December 31, 2014 and 2013:
| (dollars in thousands) | Commercial Mortgage |
Home Equity Lines and Loans |
Residential Mortgage |
Construction | Commercial and Industrial |
Consumer | Leases | Unallocated | Total | |||||||||||||||||||||||||||
| As of December 31, 2014 |
||||||||||||||||||||||||||||||||||||
| Allowance on loans and leases: |
||||||||||||||||||||||||||||||||||||
| Individually evaluated for impairment |
$ | — | $ | 4 | $ | 184 | $ | — | $ | 448 | $ | 32 | $ | — | $ | — | $ | 668 | ||||||||||||||||||
| Collectively evaluated for impairment |
3,948 | 1,913 | 1,552 | 1,366 | 4,085 | 206 | 468 | 379 | 13,917 | |||||||||||||||||||||||||||
| Purchased credit-impaired* |
— | — | — | 1 | — | — | — | — | 1 | |||||||||||||||||||||||||||
|
|
|
|
|
|
|
|
|
|
|
|
|
|
|
|
|
|
|
|||||||||||||||||||
| Total |
$ | 3,948 | $ | 1,917 | $ | 1,736 | $ | 1,367 | $ | 4,533 | $ | 238 | $ | 468 | $ | 379 | $ | 14,586 | ||||||||||||||||||
|
|
|
|
|
|
|
|
|
|
|
|
|
|
|
|
|
|
|
|||||||||||||||||||
| As of December 31, 2013 |
||||||||||||||||||||||||||||||||||||
| Allowance on loans and leases: |
||||||||||||||||||||||||||||||||||||
| Individually evaluated for impairment |
$ | — | $ | 121 | $ | 814 | $ | — | $ | 532 | $ | 52 | $ | — | $ | — | $ | 1,519 | ||||||||||||||||||
| Collectively evaluated for impairment |
3,797 | 2,083 | 1,632 | 845 | 4,479 | 207 | 604 | 349 | 13,996 | |||||||||||||||||||||||||||
| Purchased credit-impaired* |
— | — | — | — | — | — | — | — | — | |||||||||||||||||||||||||||
|
|
|
|
|
|
|
|
|
|
|
|
|
|
|
|
|
|
|
|||||||||||||||||||
| Total |
$ | 3,797 | $ | 2,204 | $ | 2,446 | $ | 845 | $ | 5,011 | $ | 259 | $ | 604 | $ | 349 | $ | 15,515 | ||||||||||||||||||
|
|
|
|
|
|
|
|
|
|
|
|
|
|
|
|
|
|
|
|||||||||||||||||||
84
Table of Contents
The following table details the carrying value for loans and leases by portfolio segment based on the methodology used to evaluate the loans and leases for impairment as of December 31, 2014 and 2013:
| (dollars in thousands) | Commercial Mortgage |
Home Equity Lines and Loans |
Residential Mortgage |
Construction | Commercial and Industrial |
Consumer | Leases | Total | ||||||||||||||||||||||||
| As of December 31, 2014 |
||||||||||||||||||||||||||||||||
| Balance of loans and leases: |
||||||||||||||||||||||||||||||||
| Individually evaluated for impairment |
$ | 97 | $ | 1,155 | $ | 8,642 | $ | 264 | $ | 3,460 | $ | 31 | $ | — | $ | 13,649 | ||||||||||||||||
| Collectively evaluated for impairment |
680,820 | 180,912 | 304,773 | 65,942 | 331,854 | 18,449 | 46,813 | 1,629,563 | ||||||||||||||||||||||||
| Purchased credit-impaired* |
8,611 | 15 | 27 | 61 | 331 | — | — | 9,045 | ||||||||||||||||||||||||
|
|
|
|
|
|
|
|
|
|
|
|
|
|
|
|
|
|||||||||||||||||
| Total |
$ | 689,528 | $ | 182,082 | $ | 313,442 | $ | 66,267 | $ | 335,645 | $ | 18,480 | $ | 46,813 | $ | 1,652,257 | ||||||||||||||||
|
|
|
|
|
|
|
|
|
|
|
|
|
|
|
|
|
|||||||||||||||||
| As of December 31, 2013 |
||||||||||||||||||||||||||||||||
| Balance of loans and leases: |
||||||||||||||||||||||||||||||||
| Individually evaluated for impairment |
$ | 236 | $ | 1,428 | $ | 9,860 | $ | 1,172 | $ | 4,758 | $ | 52 | $ | — | $ | 17,506 | ||||||||||||||||
| Collectively evaluated for impairment |
616,077 | 188,128 | 290,345 | 44,715 | 323,384 | 16,874 | 40,276 | 1,519,799 | ||||||||||||||||||||||||
| Purchased credit-impaired* |
9,028 | 15 | 38 | 482 | 317 | — | — | 9,880 | ||||||||||||||||||||||||
|
|
|
|
|
|
|
|
|
|
|
|
|
|
|
|
|
|||||||||||||||||
| Total |
$ | 625,341 | $ | 189,571 | $ | 300,243 | $ | 46,369 | $ | 328,459 | $ | 16,926 | $ | 40,276 | $ | 1,547,185 | ||||||||||||||||
|
|
|
|
|
|
|
|
|
|
|
|
|
|
|
|
|
|||||||||||||||||
| * | Purchased credit-impaired loans are evaluated for impairment on an individual basis. |
As part of the process of calculating the allowance to the different segments of the loan and lease portfolio, Management considers certain credit quality indicators. For the commercial mortgage, construction and commercial and industrial loan segments, periodic reviews, at least quarterly, of the individual loans are performed by both in-house staff as well as external loan reviewers. The result of these reviews is reflected in the risk grade assigned to each loan. These internally assigned grades are as follows:
| • | Pass – Loans considered satisfactory with no indications of deterioration. |
| • | Special mention – Loans classified as special mention have a potential weakness that deserves management’s close attention. If left uncorrected, these potential weaknesses may result in deterioration of the repayment prospects for the loan or of the institution’s credit position at some future date. |
| • | Substandard – Loans classified as substandard are inadequately protected by the current net worth and payment capacity of the obligor or of the collateral pledged, if any. Substandard loans have a well-defined weakness or weaknesses that jeopardize the liquidation of the debt. They are characterized by the distinct possibility that the institution will sustain some loss if the deficiencies are not corrected. |
| • | Doubtful – Loans classified as doubtful have all the weaknesses inherent in those classified as substandard, with the added characteristic that the weaknesses make collection or liquidation in full, on the basis of currently existing facts, conditions, and values, highly questionable and improbable. |
In addition, the remaining segments of the loan and lease portfolio, which include residential mortgage, home equity lines and loans, consumer, and leases, are allocated portions of the allowance based on their performance status.
85
Table of Contents
The following tables detail the carrying value of loans and leases by portfolio segment based on the credit quality indicators used to allocate the allowance for loan and lease losses as of December 31, 2014 and 2013:
| Credit Risk Profile by Internally Assigned Grade | ||||||||||||||||||||||||||||||||
| Commercial Mortgage | Construction | Commercial and Industrial |
Total | |||||||||||||||||||||||||||||
| (dollars in thousands) | 2014 | 2013 | 2014 | 2013 | 2014 | 2013 | 2014 | 2013 | ||||||||||||||||||||||||
| As of December 31, |
||||||||||||||||||||||||||||||||
| Pass |
$ | 683,549 | $ | 620,227 | $ | 66,004 | $ | 43,812 | $ | 329,299 | $ | 320,211 | $ | 1,078,852 | $ | 984,250 | ||||||||||||||||
| Special Mention |
4,364 | 2,793 | — | — | 1,149 | 387 | 5,513 | 3,180 | ||||||||||||||||||||||||
| Substandard |
1,615 | 2,321 | 263 | 2,557 | 5,197 | 7,861 | 7,075 | 12,739 | ||||||||||||||||||||||||
|
|
|
|
|
|
|
|
|
|
|
|
|
|
|
|
|
|||||||||||||||||
| Total |
$ | 689,528 | $ | 625,341 | $ | 66,267 | $ | 46,369 | $ | 335,645 | $ | 328,459 | $ | 1,091,440 | $ | 1,000,169 | ||||||||||||||||
|
|
|
|
|
|
|
|
|
|
|
|
|
|
|
|
|
|||||||||||||||||
| Credit Risk Profile Based on Payment Activity | ||||||||||||||||||||||||||||||||||||||||
| Residential Mortgage | Home Equity Lines and Loans |
Consumer | Leases | Total | ||||||||||||||||||||||||||||||||||||
| (dollars in thousands) | 2014 | 2013 | 2014 | 2013 | 2014 | 2013 | 2014 | 2013 | 2014 | 2013 | ||||||||||||||||||||||||||||||
| As of December 31, |
||||||||||||||||||||||||||||||||||||||||
| Performing |
$ | 307,749 | $ | 295,866 | $ | 181,021 | $ | 188,309 | $ | 18,480 | $ | 16,906 | $ | 46,792 | $ | 40,252 | $ | 554,043 | $ | 541,333 | ||||||||||||||||||||
| Non-performing |
5,693 | 4,377 | 1,061 | 1,262 | — | 20 | 21 | 24 | 6,774 | 5,683 | ||||||||||||||||||||||||||||||
|
|
|
|
|
|
|
|
|
|
|
|
|
|
|
|
|
|
|
|
|
|||||||||||||||||||||
| Total |
$ | 313,442 | $ | 300,243 | $ | 182,082 | $ | 189,571 | $ | 18,480 | $ | 16,926 | $ | 46,813 | $ | 40,276 | $ | 560,817 | $ | 547,016 | ||||||||||||||||||||
|
|
|
|
|
|
|
|
|
|
|
|
|
|
|
|
|
|
|
|
|
|||||||||||||||||||||
G. Troubled Debt Restructurings (“TDRs”):
The restructuring of a loan is considered a “troubled debt restructuring” if both of the following conditions are met: (i) the borrower is experiencing financial difficulties, and (ii) the creditor has granted a concession. The most common concessions granted include one or more modifications to the terms of the debt, such as (a) a reduction in the interest rate for the remaining life of the debt, (b) an extension of the maturity date at an interest rate lower than the current market rate for new debt with similar risk, (c) a temporary period of interest-only payments, (d) a reduction in the contractual payment amount for either a short period or remaining term of the loan, or (e) for leases, a reduced lease payment. A less common concession granted is the forgiveness of a portion of the principal.
The determination of whether a borrower is experiencing financial difficulties takes into account not only the current financial condition of the borrower, but also the potential financial condition of the borrower, if a concession were not granted. The determination of whether a concession has been granted is subjective in nature. For example, simply extending the term of a loan at its original interest rate or even at a higher interest rate could be interpreted as a concession unless the borrower could readily obtain similar credit terms from a different lender.
The following table presents the balance of TDRs as of the indicated dates:
| (dollars in thousands) | December 31, 2014 |
December 31, 2013 |
||||||
| TDRs included in nonperforming loans and leases |
$ | 4,315 | $ | 1,699 | ||||
| TDRs in compliance with modified terms |
4,157 | 7,277 | ||||||
|
|
|
|
|
|||||
| Total TDRs |
$ | 8,472 | $ | 8,976 | ||||
|
|
|
|
|
|||||
86
Table of Contents
The following table presents information regarding loan and lease modifications granted during the twelve months ended December 31, 2014 that were categorized as TDRs:
| (dollars in thousands) | Number of Contracts | Pre-Modification Outstanding Recorded Investment |
Post-Modification Outstanding Recorded Investment |
|||||||||
| Residential |
7 | $ | 3,448 | $ | 3,461 | |||||||
| Commercial and industrial |
1 | 249 | 249 | |||||||||
| Home equity lines and loans |
1 | 69 | 69 | |||||||||
|
|
|
|
|
|
|
|||||||
| Total |
9 | $ | 3,766 | $ | 3,779 | |||||||
|
|
|
|
|
|
|
|||||||
The following table presents information regarding the types of loan and lease modifications made for the twelve months ended December 31, 2014:
| Number of Contracts | ||||||||||||||||||||||||
| Interest Rate Change |
Loan Term Extension |
Interest Rate Change and Term Extension |
Interest-Only Period |
Contractual Payment Reduction (Leases only) |
Forgiveness of Interest |
|||||||||||||||||||
| Residential |
— | 2 | 5 | — | — | — | ||||||||||||||||||
| Commercial and industrial |
— | — | 1 | — | — | — | ||||||||||||||||||
| Home equity lines and loans |
— | 1 | — | — | — | — | ||||||||||||||||||
|
|
|
|
|
|
|
|
|
|
|
|
|
|||||||||||||
| Total |
— | 3 | 6 | — | — | — | ||||||||||||||||||
|
|
|
|
|
|
|
|
|
|
|
|
|
|||||||||||||
The following table presents information regarding loan and lease modifications granted during the twelve months ended December 31, 2013 that were categorized as TDRs:
| (dollars in thousands) | Number of Contracts | Pre-Modification Outstanding Recorded Investment |
Post-Modification Outstanding Recorded Investment |
|||||||||
| Residential |
2 | $ | 674 | $ | 674 | |||||||
| Commercial and industrial |
2 | 930 | 930 | |||||||||
| Home equity lines and loans |
2 | 40 | 40 | |||||||||
| Consumer |
1 | 33 | 33 | |||||||||
| Leases |
3 | 33 | 33 | |||||||||
|
|
|
|
|
|
|
|||||||
| Total |
10 | $ | 1,710 | $ | 1,710 | |||||||
|
|
|
|
|
|
|
|||||||
The following table presents information regarding the types of loan and lease modifications made for the twelve months ended December 31, 2013:
| Number of Contracts | ||||||||||||||||||||||||
| Interest Rate Change |
Loan Term Extension |
Interest Rate Change and Term Extension |
Interest-Only Period |
Contractual Payment Reduction (Leases only) |
Forgiveness of Interest |
|||||||||||||||||||
| Residential |
— | — | 1 | — | — | 1 | ||||||||||||||||||
| Commercial and industrial |
— | — | — | 2 | — | — | ||||||||||||||||||
| Home equity lines and loans |
1 | — | — | 1 | — | — | ||||||||||||||||||
| Consumer |
1 | — | — | — | — | — | ||||||||||||||||||
| Leases |
— | — | — | — | 3 | — | ||||||||||||||||||
|
|
|
|
|
|
|
|
|
|
|
|
|
|||||||||||||
| Total |
2 | — | 1 | 3 | 3 | 1 | ||||||||||||||||||
|
|
|
|
|
|
|
|
|
|
|
|
|
|||||||||||||
During the twelve months ended December 31, 2014, there were no defaults of loans or leases that had been previously modified to TDRs.
87
Table of Contents
H. Impaired Loans
The following tables detail the recorded investment and principal balance of impaired loans by portfolio segment, their related allowance for loan and lease losses and interest income recognized for the twelve months ended December 31, 2014, 2013 and 2012 (purchased credit-impaired loans are not included in the tables):
| (dollars in thousands) | Recorded Investment** |
Principal Balance |
Related Allowance |
Average Principal Balance |
Interest Income Recognized |
Cash-Basis Interest Income Recognized |
||||||||||||||||||
| As of or for the Twelve Months Ended December 31, 2014 |
||||||||||||||||||||||||
| Impaired loans with related allowance: |
||||||||||||||||||||||||
| Home equity lines and loans |
$ | 111 | $ | 198 | $ | 4 | $ | 197 | $ | — | $ | — | ||||||||||||
| Residential mortgage |
3,273 | 3,260 | 184 | 3,289 | 112 | — | ||||||||||||||||||
| Commercial and industrial |
2,069 | 2,527 | 448 | 2,577 | 49 | — | ||||||||||||||||||
| Consumer |
31 | 32 | 32 | 32 | 1 | — | ||||||||||||||||||
|
|
|
|
|
|
|
|
|
|
|
|
|
|||||||||||||
| Total |
5,484 | 6,017 | 668 | 6,095 | 162 | — | ||||||||||||||||||
| Impaired loans* without related allowance: |
||||||||||||||||||||||||
| Commercial mortgage |
97 | 97 | — | 103 | 4 | — | ||||||||||||||||||
| Home equity lines and loans |
1,044 | 1,137 | — | 1,251 | 12 | — | ||||||||||||||||||
| Residential mortgage |
5,369 | 5,794 | — | 6,210 | 152 | — | ||||||||||||||||||
| Construction |
264 | 1,225 | — | 1,427 | — | — | ||||||||||||||||||
| Commercial and industrial |
1,391 | 1,403 | — | 1,430 | 11 | — | ||||||||||||||||||
|
|
|
|
|
|
|
|
|
|
|
|
|
|||||||||||||
| Total |
8,165 | 9,656 | — | 10,421 | 179 | — | ||||||||||||||||||
| — | ||||||||||||||||||||||||
|
|
|
|
|
|
|
|
|
|
|
|
|
|||||||||||||
| Grand total |
$ | 13,649 | $ | 15,673 | $ | 668 | $ | 16,516 | $ | 341 | $ | — | ||||||||||||
|
|
|
|
|
|
|
|
|
|
|
|
|
|||||||||||||
| * | The table above does not include the recorded investment of $32 thousand of impaired leases without a related allowance for loan and lease losses. |
| ** | Recorded investment equals principal balance less partial charge-offs and interest payments on non-performing loans that have been applied to principal. |
| (dollars in thousands) | Recorded Investment** |
Principal Balance |
Related Allowance |
Average Principal Balance |
Interest Income Recognized |
Cash-Basis Interest Income Recognized |
||||||||||||||||||
| As of or for the Twelve Months Ended December 31, 2013 |
||||||||||||||||||||||||
| Impaired loans with related allowance: |
||||||||||||||||||||||||
| Home equity lines and loans |
$ | 277 | $ | 279 | $ | 121 | $ | 308 | $ | 6 | $ | — | ||||||||||||
| Residential mortgage |
5,297 | 5,312 | 814 | 5,343 | 95 | — | ||||||||||||||||||
| Commercial and industrial |
2,985 | 3,100 | 532 | 3,210 | 82 | — | ||||||||||||||||||
| Consumer |
52 | 54 | 52 | 49 | 3 | — | ||||||||||||||||||
|
|
|
|
|
|
|
|
|
|
|
|
|
|||||||||||||
| Total |
8,611 | 8,745 | 1,519 | 8,910 | 186 | — | ||||||||||||||||||
| Impaired loans* without related allowance: |
||||||||||||||||||||||||
| Commercial mortgage |
236 | 237 | — | 283 | — | — | ||||||||||||||||||
| Home equity lines and loans |
1,151 | 1,159 | — | 1,252 | 6 | — | ||||||||||||||||||
| Residential mortgage |
4,563 | 4,911 | — | 5,177 | 123 | — | ||||||||||||||||||
| Construction |
1,172 | 2,134 | — | 3,452 | 27 | — | ||||||||||||||||||
| Commercial and industrial |
1,773 | 1,954 | — | 1,979 | 23 | — | ||||||||||||||||||
|
|
|
|
|
|
|
|
|
|
|
|
|
|||||||||||||
| Total |
8,895 | 10,395 | — | 12,143 | 179 | — | ||||||||||||||||||
| — | ||||||||||||||||||||||||
|
|
|
|
|
|
|
|
|
|
|
|
|
|||||||||||||
| Grand total |
$ | 17,506 | $ | 19,140 | $ | 1,519 | $ | 21,053 | $ | 365 | $ | — | ||||||||||||
|
|
|
|
|
|
|
|
|
|
|
|
|
|||||||||||||
88
Table of Contents
| * | The table above does not include the recorded investment of $63 thousand of impaired leases without a related allowance for loan and lease losses. |
| ** | Recorded investment equals principal balance less partial charge-offs and interest payments on non-performing loans that have been applied to principal. |
| (dollars in thousands) | Recorded Investment** |
Principal Balance |
Related Allowance |
Average Principal Balance |
Interest Income Recognized |
Cash-Basis Interest Income Recognized |
||||||||||||||||||
| As of or for the Twelve Months Ended December 31, 2012 |
||||||||||||||||||||||||
| Impaired loans with related allowance: |
||||||||||||||||||||||||
| Home equity lines and loans |
$ | 1,261 | $ | 1,321 | $ | 217 | $ | 1,327 | $ | 42 | $ | — | ||||||||||||
| Residential mortgage |
4,778 | 4,793 | 667 | 4,764 | 152 | — | ||||||||||||||||||
| Construction |
2,564 | 2,564 | 543 | 3,272 | — | — | ||||||||||||||||||
| Commercial and industrial |
3,357 | 3,383 | 919 | 3,402 | 49 | — | ||||||||||||||||||
| Consumer |
7 | 8 | 8 | 10 | — | — | ||||||||||||||||||
|
|
|
|
|
|
|
|
|
|
|
|
|
|||||||||||||
| Total |
11,967 | 12,069 | 2,354 | 12,775 | 243 | — | ||||||||||||||||||
| Impaired loans* without related allowance: |
||||||||||||||||||||||||
| Commercial mortgage |
541 | 574 | — | 581 | 14 | — | ||||||||||||||||||
| Home equity lines and loans |
2,142 | 2,223 | — | 2,478 | 22 | — | ||||||||||||||||||
| Residential mortgage |
4,433 | 4,741 | — | 4,735 | 154 | — | ||||||||||||||||||
| Construction |
2,067 | 2,317 | — | 3,461 | 58 | — | ||||||||||||||||||
| Commercial and industrial |
640 | 639 | — | 645 | 16 | — | ||||||||||||||||||
|
|
|
|
|
|
|
|
|
|
|
|
|
|||||||||||||
| Total |
9,823 | 10,494 | — | 11,900 | 264 | — | ||||||||||||||||||
| — | ||||||||||||||||||||||||
|
|
|
|
|
|
|
|
|
|
|
|
|
|||||||||||||
| Grand total |
$ | 21,790 | $ | 22,563 | $ | 2,354 | $ | 24,675 | $ | 507 | $ | — | ||||||||||||
|
|
|
|
|
|
|
|
|
|
|
|
|
|||||||||||||
| * | The table above does not include the recorded investment of $168 thousand of impaired leases without a related allowance for loan and lease losses. |
| ** | Recorded investment equals principal balance less partial charge-offs and interest payments on non-performing loans that have been applied to principal. |
Note 6 – Other Real Estate Owned
Other real estate owned consists of properties acquired as a result of foreclosures or deeds in-lieu-of foreclosure. Properties or other assets are classified as OREO and are reported at the lower of carrying value or fair value, less estimated costs to sell. Costs relating to the development or improvement of assets are capitalized, and costs relating to holding the property are charged to expense. As of December 31, 2014 the balance of OREO is comprised of four single-family residential properties.
The summary of the change in other real estate owned, which is included as a component of other assets on the Corporation’s Consolidated Balance Sheets, is as follows:
| December 31, | ||||||||
| (dollars in thousands) | 2014 | 2013 | ||||||
| Balance January 1 |
$ | 855 | $ | 906 | ||||
| Additions |
1,763 | 853 | ||||||
| Capitalized cost |
— | 485 | ||||||
| Sales |
(1,471 | ) | (1,389 | ) | ||||
|
|
|
|
|
|||||
| Balance December 31 |
$ | 1,147 | $ | 855 | ||||
|
|
|
|
|
|||||
89
Table of Contents
Note 7 – Premises and Equipment
A. A summary of premises and equipment is as follows:
| December 31, | ||||||||
| (dollars in thousands) | 2014 | 2013 | ||||||
| Land |
$ | 5,306 | $ | 5,306 | ||||
| Buildings |
23,997 | 23,557 | ||||||
| Furniture and equipment |
27,485 | 23,379 | ||||||
| Leasehold improvements |
15,217 | 14,979 | ||||||
| Construction in progress |
1,328 | 571 | ||||||
| Less: accumulated depreciation |
(39,585 | ) | (35,996 | ) | ||||
|
|
|
|
|
|||||
| Total |
$ | 33,748 | $ | 31,796 | ||||
|
|
|
|
|
|||||
Depreciation and amortization expense related to the assets detailed in the above table for the years ended December 31, 2014, 2013, and 2012 amounted to $3.6 million, $3.0 million, and $2.9 million, respectively.
B. Future minimum cash rent commitments under various operating leases as of December 31, 2014 are as follows:
| (dollars in thousands) | ||||
| 2015 |
$ | 3,106 | ||
| 2016 |
2,960 | |||
| 2017 |
2,981 | |||
| 2018 |
3,030 | |||
| 2019 |
2,839 | |||
| 2020 and thereafter |
34,794 | |||
|
|
|
|||
| Total |
$ | 49,710 | ||
|
|
|
|||
Rent expense on leased premises and equipment for the years ended December 31, 2014, 2013 and 2012 amounted to $3.3 million, $3.4 million, and $2.7 million, respectively.
Note 8 – Mortgage Servicing Rights (“MSR”s)
A. The following summarizes the Corporation’s activity related to MSRs for the years ended December 31:
| (dollars in thousands) | 2014 | 2013 | 2012 | |||||||||
| Balance, January 1 |
$ | 4,750 | $ | 4,491 | $ | 4,041 | ||||||
| Additions |
547 | 1,002 | 1,579 | |||||||||
| Amortization |
(476 | ) | (740 | ) | (966 | ) | ||||||
| Impairment |
(56 | ) | (3 | ) | (163 | ) | ||||||
|
|
|
|
|
|
|
|||||||
| Balance, December 31 |
$ | 4,765 | $ | 4,750 | $ | 4,491 | ||||||
|
|
|
|
|
|
|
|||||||
| Fair value |
$ | 5,456 | $ | 5,733 | $ | 4,638 | ||||||
|
|
|
|
|
|
|
|||||||
| Residential mortgage loans serviced for others |
$ | 590,660 | $ | 607,272 | $ | 591,989 | ||||||
|
|
|
|
|
|
|
|||||||
90
Table of Contents
B. The following summarizes the Corporation’s activity related to changes in the impairment valuation allowance of MSRs for the years ended December 31:
| (dollars in thousands) | 2014 | 2013 | 2012 | |||||||||
| Balance, January 1 |
$ | (1,548 | ) | $ | (1,545 | ) | $ | (1,382 | ) | |||
| Impairment |
(97 | ) | (126 | ) | (278 | ) | ||||||
| Recovery |
41 | 123 | 115 | |||||||||
|
|
|
|
|
|
|
|||||||
| Balance, December 31 |
$ | (1,604 | ) | $ | (1,548 | ) | $ | (1,545 | ) | |||
|
|
|
|
|
|
|
|||||||
C. Other MSR Information – At December 31, 2014, key economic assumptions and the sensitivity of the current fair value of MSRs to immediate 10 and 20 percent adverse changes in those assumptions are as follows:
| (dollars in thousands) | ||||
| Fair value amount of MSRs |
$ | 5,456 | ||
| Weighted average life (in years) |
6.3 | |||
| Prepayment speeds (constant prepayment rate)* |
10.5 | % | ||
| Impact on fair value: |
||||
| 10% adverse change |
$ | (201 | ) | |
| 20% adverse change |
$ | (390 | ) | |
| Discount rate |
10.5 | % | ||
| Impact on fair value: |
||||
| 10% adverse change |
$ | (213 | ) | |
| 20% adverse change |
$ | (411 | ) | |
| * | Represents the weighted average prepayment rate for the life of the MSR asset. |
At December 31, 2014, 2013 and 2012, the fair value of the MSRs was $5.5 million, $5.7 million, and $4.6 million, respectively. The fair value of the MSRs for these dates was determined using values obtained from a third party which utilizes a valuation model which calculates the present value of estimated future servicing income. The model incorporates assumptions that market participants use in estimating future net servicing income, including estimates of prepayment speeds and discount rates. Mortgage loan prepayment speed is the annual rate at which borrowers are forecasted to repay their mortgage loan principal and is based on historical experience. The discount rate is used to determine the present value of future net servicing income. Another key assumption in the model is the required rate of return the market would expect for an asset with similar risk. These assumptions can, and generally will, change quarterly valuations as market conditions and interest rates change. Management reviews, annually, the process utilized by its independent third-party valuation experts.
These assumptions and sensitivities are hypothetical and should be used with caution. As the figures indicate, changes in fair value based on a 10% variation in assumptions generally cannot be extrapolated because the relationship of the change in assumptions to the change in fair value may not be linear. Also, the effect of a variation in a particular assumption on the fair value of the MSRs is calculated without changing any other assumption. In reality, changes in one factor may result in changes in another, which could magnify or counteract the sensitivities.
91
Table of Contents
Note 9 – Deposits
A. The following table details the components of deposits:
| As of December 31, | ||||||||
| (dollars in thousands) | 2014 | 2013 | ||||||
| Savings |
$ | 138,992 | $ | 135,240 | ||||
| NOW accounts* |
278,609 | 266,787 | ||||||
| Market rate accounts* |
631,666 | 587,247 | ||||||
| Time deposits, less than $100 |
74,497 | 88,056 | ||||||
| Time deposits, $100 or more |
43,903 | 52,738 | ||||||
| Wholesale time deposits |
73,458 | 34,639 | ||||||
|
|
|
|
|
|||||
| Total interest-bearing deposits |
1,241,125 | 1,164,707 | ||||||
| Non-interest-bearing deposits |
446,903 | 426,640 | ||||||
|
|
|
|
|
|||||
| Total deposits |
$ | 1,688,028 | $ | 1,591,347 | ||||
|
|
|
|
|
|||||
| * | Includes wholesale deposits. |
The aggregate amount of deposit overdrafts included as loans as of December 31, 2014 and 2013 were $534 thousand and $795 thousand, respectively.
B. The following tables detail the maturities of retail time deposits:
| As of December 31, 2014 | ||||||||
| (dollars in thousands) | $100 or more |
Less than $100 |
||||||
| Maturing during: |
||||||||
| 2015 |
$ | 28,110 | $ | 52,499 | ||||
| 2016 |
10,459 | 10,964 | ||||||
| 2017 |
2,014 | 3,664 | ||||||
| 2018 |
1,601 | 3,594 | ||||||
| 2019 |
1,719 | 3,750 | ||||||
| 2020 and thereafter |
— | 26 | ||||||
|
|
|
|
|
|||||
| Total |
$ | 43,903 | $ | 74,497 | ||||
|
|
|
|
|
|||||
C. The following tables detail the maturities of wholesale time deposits:
| As of December 31, 2014 | ||||||||
| (dollars in thousands) | $100 or more |
Less than $100 |
||||||
| Maturing during: |
||||||||
| 2015 |
$ | 26,184 | $ | 1,151 | ||||
| 2016 |
4,988 | — | ||||||
| 2017 |
35,149 | — | ||||||
| 2018 |
5,986 | — | ||||||
|
|
|
|
|
|||||
| Total |
$ | 72,307 | $ | 1,151 | ||||
|
|
|
|
|
|||||
92
Table of Contents
Note 10 – Short-term and Other Borrowings
A. Short-term borrowings – As of December 31, 2014 and 2013, the Corporation had $23.8 million and $10.9 million of short-term (original maturity of one year or less) borrowings, respectively, which consisted solely of funds obtained from overnight repurchase agreements with commercial customers.
A summary of short-term borrowings is as follows:
| As of December 31, | ||||||||
| (dollars in thousands) | 2014 | 2013 | ||||||
| Overnight fed funds |
$ | — | $ | — | ||||
| Repurchase agreements |
23,824 | 10,891 | ||||||
|
|
|
|
|
|||||
| Total short-term borrowings |
$ | 23,824 | 10,891 | |||||
|
|
|
|
|
|||||
The following table sets forth information concerning short-term borrowings:
| As of or Twelve Months Ended December 31, |
||||||||
| (dollars in thousands) | 2014 | 2013 | ||||||
| Balance at period-end |
$ | 23,824 | $ | 10,891 | ||||
| Maximum amount outstanding at any month end |
28,017 | 75,588 | ||||||
| Average balance outstanding during the period |
15,602 | 16,457 | ||||||
| Weighted-average interest rate: |
||||||||
| As of the period-end |
0.10 | % | 0.10 | % | ||||
| Paid during the period |
0.11 | % | 0.15 | % | ||||
Average balances outstanding during the year represent daily average balances and average interest rates represent interest expense divided by the related average balance.
B. FHLB Advances and Other Borrowings:
As of December 31, 2014 and 2013, the Corporation had $260.1 million and $205.6 million, respectively, of other borrowings, consisting of advances from FHLB and a commercial term loan from a correspondent bank.
The following table presents the remaining periods until maturity of the FHLB advances and other borrowings:
| As of December 31, | ||||||||
| (dollars in thousands) | 2014 | 2013 | ||||||
| Within one year |
$ | 25,535 | $ | 3,917 | ||||
| Over one year through five years |
227,111 | 196,727 | ||||||
| Over five years through ten years |
7,500 | 5,000 | ||||||
|
|
|
|
|
|||||
| Total |
$ | 260,146 | $ | 205,644 | ||||
|
|
|
|
|
|||||
93
Table of Contents
The following table presents rate and maturity information on FHLB advances and other borrowings:
| Maturity Range* | Weighted Average Rate |
Coupon Rate | Balance at December 31, |
|||||||||||||||||||||||||
| Description |
From | To | From | To | 2014 | 2013 | ||||||||||||||||||||||
| Fixed amortizing |
04/09/15 | 04/09/15 | 3.57 | % | 3.57 | % | 3.57 | % | $ | 535 | $ | 2,102 | ||||||||||||||||
| Adjustable amortizing** |
N/A | N/A | 3.25 | % | 3.25 | % | 3.25 | % | — | 7,050 | ||||||||||||||||||
| Bullet maturity – fixed rate |
03/23/15 | 12/09/20 | 1.49 | % | 0.58 | % | 2.41 | % | 193,240 | 140,000 | ||||||||||||||||||
| Bullet maturity – variable rate |
06/25/15 | 11/28/17 | 0.40 | % | 0.25 | % | 0.54 | % | 45,000 | 35,000 | ||||||||||||||||||
| Convertible-fixed |
01/03/18 | 08/20/18 | 2.94 | % | 2.58 | % | 3.50 | % | 21,371 | 21,492 | ||||||||||||||||||
|
|
|
|
|
|||||||||||||||||||||||||
| Total |
$ | 260,146 | $ | 205,644 | ||||||||||||||||||||||||
|
|
|
|
|
|||||||||||||||||||||||||
| * | Maturity range refers to December 31, 2014 balances |
| ** | Loans from correspondent banks other than FHLB |
Included in the table above as of December 31, 2014 and 2013 are $21.4 million and $21.5 million, respectively, of FHLB advances whereby the FHLB has the option, at predetermined times, to convert the fixed interest rate to an adjustable interest rate indexed to the London Interbank Offered Rate (“LIBOR”). The Corporation has the option to prepay these advances, without penalty, if the FHLB elects to convert the interest rate to an adjustable rate. As of December 31, 2014, substantially all the FHLB advances with this convertible feature are subject to conversion in fiscal 2015. These advances are included in the periods in which they mature, rather than the period in which they are subject to conversion.
C. Other Information – In connection with its FHLB borrowings, the Corporation is required to hold the capital stock of the FHLB. The amount of capital stock held was $11.5 million at December 31, 2014, and $11.7 million at December 31, 2013. The carrying amount of the FHLB stock approximates its redemption value.
The level of required investment in FHLB stock is based on the balance of outstanding loans the Corporation has from the FHLB. Although FHLB stock is a financial instrument that represents an equity interest in the FHLB, it does not have a readily determinable fair value. FHLB stock is generally viewed as a long-term investment. Accordingly, when evaluating FHLB stock for impairment, its value should be determined based on the ultimate recoverability of the par value rather than by recognizing temporary declines in value.
The Corporation had a maximum borrowing capacity (“MBC”) with the FHLB of $883.0 million as of December 31, 2014 of which the unused capacity was $608.2 million at December 31, 2014. In addition there were $64.0 million in overnight federal funds line and $71.9 million of Federal Reserve Discount Window capacity.
Note 11 – Derivatives and Hedging Activities
In December, 2012, the Corporation entered into a forward-starting interest rate swap to hedge the cash flows of a $15 million floating-rate FHLB borrowing. The interest rate swap involves the exchange of the Corporation’s floating rate interest payments on the underlying principal amount. This swap was designated, and qualified, for cash-flow hedge accounting. The term of the swap begins November 30, 2015 and ends November 28, 2022. For derivative instruments that are designated and qualify as hedging instruments, the effective portion of gains or losses is reported as a component of other comprehensive income, and is subsequently reclassified into earnings as an adjustment to interest expense in the periods in which the hedged forecasted transaction affects earnings.
94
Table of Contents
The following table details the Corporation’s derivative positions as of the balance sheet dates indicated:
As of December 31, 2014:
| (dollars in thousands) | Trade Date | Effective Date |
Maturity Date | Receive (Variable) Index |
Current Projected Receive Rate |
Pay Fixed Swap Rate |
Fair Value of Asset (Liability) |
|||||||||||||||||||||
| Notional Amount |
||||||||||||||||||||||||||||
| $15,000 |
12/13/2012 | 11/30/2015 | 11/28/2022 | US 3-Month LIBOR | 2.335 | % | 2.376 | % | $ | (39 | ) | |||||||||||||||||
As of December 31, 2013:
| (dollars in thousands) | Trade Date | Effective Date |
Maturity Date | Receive (Variable) Index |
Current Projected Receive Rate |
Pay Fixed Swap Rate |
Fair Value of Asset (Liability) |
|||||||||||||||||||||
| Notional Amount |
||||||||||||||||||||||||||||
| $15,000 |
12/13/2012 | 11/30/2015 | 11/28/2022 | US 3-Month LIBOR | 3.597 | % | 2.376 | % | $ | 1,142 | ||||||||||||||||||
For the twelve month periods ended December 31, 2014, 2013 and 2012, there have been no reclassifications of the interest-rate swap’s fair value from other comprehensive income to earnings.
Note 12 – Disclosure about Fair Value of Financial Instruments
FASB ASC 825, “Disclosures about Fair Value of Financial Instruments” requires disclosure of the fair value information about financial instruments, whether or not recognized in the balance sheet, for which it is practicable to estimate such value. In cases where quoted market prices are not available, fair values are based on estimates using present value or other market value techniques. Those techniques are significantly affected by the assumptions used, including the discount rate and estimates of future cash flows. In that regard, the derived fair value estimates cannot be substantiated by comparison to independent markets and, in many cases, could not be realized in immediate settlement of the instrument. The aggregate fair value amounts presented below do not represent the underlying value of the Corporation.
The following methods and assumptions were used to estimate the fair value of each class of financial instruments for which it is practicable to estimate that value:
Cash and Cash Equivalents
The carrying amounts reported in the balance sheet for cash and cash equivalents approximate their fair values.
Investment Securities
Fair values for investment securities are generally determined by the Corporation including the use an independent third party based on market data, utilizing pricing models that vary by asset and incorporate available trade, bid and other market information. Management reviews, annually, the process utilized by its independent third-party valuation service provider. On a quarterly basis, Management tests the validity of the prices provided by the third party by selecting a representative sample of the portfolio and obtaining actual trade results, or if actual trade results are not available, competitive broker pricing.
Loans Held for Sale
The fair value of loans held for sale is based on pricing obtained from secondary markets.
Net Portfolio Loans and Leases
For variable rate loans that reprice frequently and which have no significant change in credit risk, estimated fair values are based on carrying values. Fair values of certain mortgage loans and consumer loans are estimated using discounted cash flow analyses, using interest rates currently being offered for loans with similar terms to
95
Table of Contents
borrowers of similar credit quality and is indicative of an entry price. The estimated fair value of nonperforming loans is based on discounted estimated cash flows as determined by the internal loan review of the Bank or the appraised market value of the underlying collateral, as determined by independent third party appraisers. This technique does not reflect an exit price.
Impaired Loans
The Corporation evaluates and values impaired loans at the time the loan is identified as impaired, and the fair values of such loans are estimated using Level 3 inputs in the fair value hierarchy. Each loan’s collateral has a unique appraisal and management’s discount of the value is based on the factors unique to each impaired loan. The significant unobservable input in determining the fair value is management’s subjective discount on appraisals of the collateral securing the loan, which range from 10%—50%. Collateral may consist of real estate and/or business assets including equipment, inventory and/or accounts receivable and the value of these assets is determined based on the appraisals by qualified licensed appraisers hired by the Corporation. Appraised and reported values may be discounted based on management’s historical knowledge, changes in market conditions from the time of valuation, estimated costs to sell, and/or management’s expertise and knowledge of the client and the client’s business.
Other Real Estate Owned
Other real estate owned consists of properties acquired as a result of foreclosures and deeds in-lieu-of foreclosure. Properties are classified as OREO and are reported at the lower of cost or fair value less cost to sell, and are classified as Level 3 in the fair value hierarchy.
Mortgage Servicing Rights
The fair value of the MSRs for these periods was determined using a proprietary third-party valuation model that calculates the present value of estimated future servicing income. The model incorporates assumptions that market participants use in estimating future net servicing income, including estimates of prepayment speeds and discount rates. Due to the proprietary nature of the valuation model used and the lack of observable inputs, the Corporation classifies the value of MSRs as using Level 3 inputs.
Other Assets
Due to their short-term nature, the carrying amounts of accrued interest receivable, income taxes receivable and other investments approximate fair value.
Deposits
The fair values disclosed for non-interest-bearing demand deposits, savings, NOW accounts, and market rate accounts are, by definition, equal to the amounts payable on demand at the reporting date (i.e., their carrying amounts). Fair values for certificates of deposit are estimated using a discounted cash flow calculation that applies interest rates currently being offered on certificates to a schedule of expected monthly maturities on the certificates of deposit. FASB Codification 825 defines the fair value of demand deposits as the amount payable on demand, as of the reporting date, and prohibits adjusting estimated fair value from any value derived from retaining those deposits for an expected future period of time.
Short-term borrowings
Due to their short-term nature, the carrying amount of short-term borrowings, which include overnight repurchase agreements approximate their fair value.
96
Table of Contents
FHLB Advances and Other Borrowings
The fair value of FHLB advances and other borrowings is established using a discounted cash flow calculation that applies interest rates currently being offered on mid-term and long term borrowings.
Other Liabilities
The carrying amounts of accrued interest payable and other accrued payables approximate fair value. The fair value of the interest-rate swap derivative is derived from quoted prices for similar instruments in active markets and is classified as using Level 2 inputs.
Off-Balance Sheet Instruments
The fair values of the Corporation’s commitments to extend credit, standby letters of credit and financial guarantees are not included in the table below as their carrying values generally approximate their fair values. These instruments generate fees that approximate those currently charged to originate similar commitments.
The carrying amount and fair value of the Corporation’s financial instruments are as follows:
| Fair Value Hierarchy Level* |
As of December 31, | |||||||||||||||||
| 2014 | 2013 | |||||||||||||||||
| (dollars in thousands) | Carrying Amount |
Fair Value | Carrying Amount |
Fair Value | ||||||||||||||
| Financial assets: |
||||||||||||||||||
| Cash and cash equivalents |
Level 1 | $ | 219,269 | $ | 219,269 | $ | 81,071 | $ | 81,071 | |||||||||
| Investment securities – available for sale |
See Note 13 | 229,577 | 229,577 | 285,808 | 285,808 | |||||||||||||
| Investment securities – trading |
See Note 13 | 3,896 | 3,896 | 3,437 | 3,437 | |||||||||||||
| Loans held for sale |
Level 2 | 3,882 | 3,882 | 1,350 | 1,350 | |||||||||||||
| Net portfolio loans and leases |
Level 3 | 1,637,671 | 1,666,052 | 1,531,670 | 1,534,631 | |||||||||||||
| Mortgage servicing rights |
Level 3 | 4,765 | 5,456 | 4,750 | 5,733 | |||||||||||||
| Other assets |
Level 3 | 22,309 | 22,309 | 21,819 | 21,819 | |||||||||||||
|
|
|
|
|
|
|
|
|
|||||||||||
| Total financial assets |
$ | 2,121,369 | $ | 2,150,441 | $ | 1,929,905 | $ | 1,933,849 | ||||||||||
|
|
|
|
|
|
|
|
|
|||||||||||
| Financial liabilities: |
||||||||||||||||||
| Deposits |
Level 2 | $ | 1,688,028 | $ | 1,687,409 | $ | 1,591,347 | $ | 1,591,215 | |||||||||
| Short-term borrowings |
Level 2 | 23,824 | 23,824 | 10,891 | 10,891 | |||||||||||||
| FHLB advances and other borrowings |
Level 2 | 260,146 | 259,826 | 205,644 | 205,149 | |||||||||||||
| Other liabilities |
Level 2 | 29,034 | 29,034 | 23,885 | 23,885 | |||||||||||||
|
|
|
|
|
|
|
|
|
|||||||||||
| Total financial liabilities |
$ | 2,001,032 | $ | 2,009,093 | $ | 1,831,767 | $ | 1,831,140 | ||||||||||
|
|
|
|
|
|
|
|
|
|||||||||||
| * | see Note 13 in the Notes to Consolidated Financial Statements for a description of hierarchy levels |
Note 13 – Fair Value Measurement
FASB ASC 820, “Fair Value Measurement” establishes a fair value hierarchy based on the nature of data inputs for fair value determinations, under which the Corporation is required to value each asset using assumptions that market participants would utilize to value that asset. When the Corporation uses its own assumptions it is required to disclose additional information about the assumptions used and the effect of the measurement on earnings or the net change in assets for the period.
The value of the Corporation’s available for sale investment securities, which include obligations of the U.S. government and its agencies, mortgage-backed securities issued by U.S. government- and U.S. government
97
Table of Contents
sponsored agencies, obligations of state and political subdivisions, corporate bonds, other debt securities, as well as bond mutual funds are determined by the Corporation, including the use of an independent third party. The Corporation performs tests to assess the validity of these third-party values. The third party’s evaluations are based on market data. They utilize pricing models that vary by asset and incorporate available trade, bid and other market information. For securities that do not trade on a daily basis, their pricing models apply available information such as benchmarking and matrix pricing. The market inputs normally sought in the evaluation of securities include benchmark yields, reported trades, broker/dealer quotes (only obtained from market makers or broker/dealers recognized as market participants), issuer spreads, two-sided markets, benchmark securities, bid, offers and reference data. For certain securities, additional inputs may be used or some market inputs may not be applicable. Inputs are prioritized differently on any given day based on market conditions.
U.S. Government agencies are evaluated and priced using multi-dimensional relational models and option adjusted spreads. State and municipal securities are evaluated on a series of matrices including reported trades and material event notices. Mortgage-backed securities are evaluated using matrix correlation to treasury or floating index benchmarks, prepayment speeds, monthly payment information and other benchmarks. Other available-for-sale investments are evaluated using a broker-quote based application, including quotes from issuers.
The value of the investment portfolio is determined using three broad levels of inputs:
Level 1 – Quoted prices in active markets for identical securities.
Level 2 – Quoted prices for similar instruments in active markets; quoted prices for identical or similar instruments in markets that are not active and model derived valuations whose inputs are observable or whose significant value drivers are observable.
Level 3 – Instruments whose significant value drivers are unobservable.
These levels are not necessarily an indication of the risks or liquidity associated with these investments. The following tables summarize the assets at December 31, 2014 and 2013 that are recognized on the Corporation’s balance sheet using fair value measurement determined based on the differing levels of input.
Fair value of assets measured on a recurring basis for the year ended December 31, 2014:
| (dollars in millions) | Total | Level 1 | Level 2 | Level 3 | ||||||||||||
| Investment securities (available for sale and trading): |
||||||||||||||||
| Obligations of U.S. government & agencies |
$ | 66.9 | $ | — | $ | 66.9 | $ | — | ||||||||
| Obligations of state & political subdivisions |
29.0 | — | 29.0 | — | ||||||||||||
| Mortgage-backed securities |
81.4 | — | 81.4 | — | ||||||||||||
| Collateralized mortgage obligations |
34.8 | — | 34.8 | — | ||||||||||||
| Mutual funds |
19.5 | 19.5 | — | — | ||||||||||||
| Other debt securities |
1.9 | — | 1.9 | — | ||||||||||||
|
|
|
|
|
|
|
|
|
|||||||||
| Total assets measured on a recurring basis at fair value |
$ | 233.5 | $ | 19.5 | $ | 214.0 | $ | — | ||||||||
|
|
|
|
|
|
|
|
|
|||||||||
Fair value of assets measured on a non-recurring basis at December 31, 2014:
| (dollars in millions) | Total | Level 1 | Level 2 | Level 3 | ||||||||||||
| Mortgage servicing rights |
$ | 5.5 | $ | — | $ | — | $ | 5.5 | ||||||||
| Impaired loans and leases |
13.0 | — | — | 13.0 | ||||||||||||
| OREO |
1.1 | — | — | 1.1 | ||||||||||||
|
|
|
|
|
|
|
|
|
|||||||||
| Total assets measured at fair value on a non-recurring basis |
$ | 19.6 | $ | — | $ | — | $ | 19.6 | ||||||||
|
|
|
|
|
|
|
|
|
|||||||||
98
Table of Contents
Fair value of assets measured on a recurring basis for the year ended December 31, 2013:
| (dollars in millions) | Total | Level 1 | Level 2 | Level 3 | ||||||||||||
| Investment securities (available for sale and trading): |
||||||||||||||||
| Obligations of U.S. government & agencies |
$ | 69.6 | $ | — | $ | 69.6 | $ | — | ||||||||
| Obligations of state & political subdivisions |
37.0 | — | 37.0 | — | ||||||||||||
| Mortgage-backed securities |
119.4 | — | 119.4 | — | ||||||||||||
| Collateralized mortgage obligations |
44.2 | — | 44.2 | — | ||||||||||||
| Mutual funds |
14.9 | 14.9 | — | — | ||||||||||||
| Other debt securities |
4.1 | — | 4.1 | — | ||||||||||||
|
|
|
|
|
|
|
|
|
|||||||||
| Total assets measured on a recurring basis at fair value |
$ | 289.2 | $ | 14.9 | $ | 274.3 | $ | — | ||||||||
|
|
|
|
|
|
|
|
|
|||||||||
Fair value of assets measured on a non-recurring basis at December 31, 2013:
| (dollars in millions) | Total | Level 1 | Level 2 | Level 3 | ||||||||||||
| Mortgage servicing rights |
$ | 5.7 | $ | — | $ | — | $ | 5.7 | ||||||||
| Impaired loans and leases |
16.1 | — | — | 16.1 | ||||||||||||
| OREO and other repossessed property |
0.9 | — | — | 0.9 | ||||||||||||
|
|
|
|
|
|
|
|
|
|||||||||
| Total assets measured at fair value on a non-recurring basis |
$ | 22.7 | $ | — | $ | — | $ | 22.7 | ||||||||
|
|
|
|
|
|
|
|
|
|||||||||
For the twelve months ended December 31, 2014, a net decrease of $434 thousand in the Allowance was recorded and for the twelve months ended December 31, 2013, a net increase of $975 thousand in the Allowance was recorded as a result of adjusting the carrying value and estimated fair value of the impaired loans in the above tables. As it relates to the fair values of assets measured on a recurring basis, there have been no transfers between levels during the twelve months ended December 31, 2014.
Note 14 – 401(K) Plan and Other Defined Contribution Plans
The Corporation has a qualified defined contribution plan (the “401(K) Plan”) for all eligible employees, under which the Corporation matches employee contributions up to a maximum of 3.0% of the employee’s base salary. The Corporation’s expenses for the 401(K) Plan were $846 thousand, $803 thousand and $747 thousand in 2014, 2013 and 2012, respectively.
In addition to the matching contribution above, the Corporation provides a discretionary, non-matching employer contribution to the 401(K) Plan. The Corporation’s expense for the non-matching discretionary contribution was $1.1 million, $1.0 million and $879 thousand, for the twelve months ended December 31, 2014, 2013 and 2012, respectively.
On June 28, 2013, the Corporation adopted the Bryn Mawr Bank Corporation Executive Deferred Compensation Plan (the “EDCP”), a non-qualified defined-contribution plan which was restricted to certain senior officers of the Corporation. The intended purpose of the EDCP is to provide deferred compensation to a select group of employees. The Corporation’s expense for the EDCP, for the twelve months ended December 31, 2014 and 2013 was $239 thousand and $221 thousand, respectively.
Note 15 – Pension and Postretirement Benefit Plans
A. General Overview – The Corporation has three defined-benefit pension plans comprised of a qualified defined benefit plan (the “QDBP”) which covers all employees over age 20 1/2 who meet certain service requirements, and two non-qualified defined-benefit supplemental executive retirement plans (“SERP I” and “SERP II”) which are restricted to certain senior officers of the Corporation.
99
Table of Contents
SERP I provides each participant with the equivalent pension benefit provided by the QDBP on any compensation and bonus deferrals that exceed the IRS limit applicable to the QDBP.
On February 12, 2008, the Corporation amended the QDBP and SERP I to freeze further increases in the defined benefit amounts to all participants, effective March 31, 2008.
On April 1, 2008, the Corporation added SERP II, a non-qualified defined benefit plan which was restricted to certain senior officers of the Corporation. Effective March 31, 2013, the Corporation curtailed SERP II, as further increases to the defined benefit amounts to over 20% of the participants were frozen.
The Corporation also has a postretirement benefit plan (“PRBP”) that covers certain retired employees and a group of current employees. The PRBP was closed to new participants in 1994. In 2007, the Corporation amended the PRBP to allow for settlement of obligations to certain current and retired employees. Certain retired participant obligations were settled in 2007 and current employee obligations were settled in 2008.
The following table provides information with respect to our QDBP, SERP, and PRBP, including benefit obligations and funded status, net periodic pension costs, plan assets, cash flows, amortization information and other accounting items.
B. Actuarial Assumptions used to determine benefit obligations as of December 31 of the years indicated:
| QDBP | SERP I and SERP II | PRBP | ||||||||||||||||||||||
| 2014 | 2013 | 2014 | 2013 | 2014 | 2013 | |||||||||||||||||||
| Discount rate |
3.70 | % | 4.60 | % | 3.70 | % | 4.60 | % | 3.70 | % | 4.60 | % | ||||||||||||
| Rate of increase for future compensation |
N/A | N/A | 3.50 | % | 3.50 | % | N/A | N/A | ||||||||||||||||
| Expected long-term rate of return on plan assets |
7.50 | % | 7.50 | % | N/A | N/A | N/A | N/A | ||||||||||||||||
C. Changes in Benefit Obligations and Plan Assets:
| QDBP | SERP I & SERP II | PRBP | ||||||||||||||||||||||
| (dollars in thousands) | 2014 | 2013 | 2014 | 2013 | 2014 | 2013 | ||||||||||||||||||
| Change in benefit obligations |
||||||||||||||||||||||||
| Benefit obligation at January 1 |
$ | 36,366 | $ | 40,825 | $ | 4,008 | $ | 6,693 | $ | 688 | $ | 842 | ||||||||||||
| Service cost |
— | — | 61 | 71 | — | — | ||||||||||||||||||
| Interest cost |
1,640 | 1,484 | 177 | 188 | 29 | 29 | ||||||||||||||||||
| Plan participants contribution |
— | — | — | — | 41 | 38 | ||||||||||||||||||
| Actuarial loss (gain)(1) |
8,629 | (4,145 | ) | 979 | 10 | (72 | ) | (65 | ) | |||||||||||||||
| Curtailments(2) |
— | — | — | (2,808 | ) | — | — | |||||||||||||||||
| Benefits paid |
(2,543 | ) | (1,798 | ) | (146 | ) | (146 | ) | (146 | ) | (156 | ) | ||||||||||||
|
|
|
|
|
|
|
|
|
|
|
|
|
|||||||||||||
| Benefit obligation at December 31 |
$ | 44,092 | $ | 36,366 | $ | 5,079 | $ | 4,008 | $ | 540 | $ | 688 | ||||||||||||
|
|
|
|
|
|
|
|
|
|
|
|
|
|||||||||||||
| Change in plan assets |
||||||||||||||||||||||||
| Fair value of plan assets at January 1 |
$ | 45,573 | $ | 40,666 | $ | — | $ | — | $ | — | $ | — | ||||||||||||
| Actual return on plan assets |
844 | 6,705 | — | — | — | — | ||||||||||||||||||
| Employer contribution |
— | — | 146 | 146 | 105 | 118 | ||||||||||||||||||
| Plan participants’ contribution |
— | — | — | — | 41 | 38 | ||||||||||||||||||
| Benefits paid |
(2,543 | ) | (1,798 | ) | (146 | ) | (146 | ) | (146 | ) | (156 | ) | ||||||||||||
|
|
|
|
|
|
|
|
|
|
|
|
|
|||||||||||||
| Fair value of plan assets at December 31 |
$ | 43,874 | $ | 45,573 | $ | — | $ | — | $ | — | $ | — | ||||||||||||
|
|
|
|
|
|
|
|
|
|
|
|
|
|||||||||||||
| Funded status at year end (plan assets less benefit obligations) |
$ | (218 | ) | $ | 9,207 | $ | (5,079 | ) | $ | (4,008 | ) | $ | (540 | ) | $ | (688 | ) | |||||||
|
|
|
|
|
|
|
|
|
|
|
|
|
|||||||||||||
100
Table of Contents
| (1) | the $12.8 million change in actuarial loss was related to discount rate decreases which resulted in increased benefit obligations, return on plan assets below the anticipated target level, and increased benefit obligations as a result of the introduction of new mortality tables used by the actuary. |
| (2) | for more information on the gain on curtailment, refer to section A of this note. |
| QDBP | SERP I & SERP II |
PRBP | ||||||||||||||||||||||
| For the Twelve Months Ended December 31, | ||||||||||||||||||||||||
| 2014 | 2013 | 2014 | 2013 | 2014 | 2013 | |||||||||||||||||||
| Amounts included in the consolidated balance sheet as other assets (liabilities) and accumulated other comprehensive income including the following: |
||||||||||||||||||||||||
| Prepaid benefit cost/(accrued liability) |
$ | 17,662 | $ | 16,346 | $ | (3,274 | ) | $ | (3,201 | ) | $ | (234 | ) | $ | (250 | ) | ||||||||
| Net actuarial loss |
(17,880 | ) | (7,139 | ) | (1,805 | ) | (790 | ) | (306 | ) | (438 | ) | ||||||||||||
| Prior service cost |
— | — | — | (17 | ) | — | — | |||||||||||||||||
| Unrecognized net initial obligation |
— | — | — | — | — | — | ||||||||||||||||||
|
|
|
|
|
|
|
|
|
|
|
|
|
|||||||||||||
| Net amount recognized |
$ | (218 | ) | $ | 9,207 | $ | (5,079 | ) | $ | (4,008 | ) | $ | (540 | ) | $ | (688 | ) | |||||||
|
|
|
|
|
|
|
|
|
|
|
|
|
|||||||||||||
D. The following tables provide the components of net periodic pension costs for the periods indicated:
| QDBP Net Periodic Pension Cost | For the Twelve Months Ended December 31, | |||||||||||
| (dollars in thousands) | 2014 | 2013 | 2012 | |||||||||
| Service cost |
$ | — | $ | — | $ | — | ||||||
| Interest cost |
1,640 | 1,484 | 1,576 | |||||||||
| Expected return on plan assets |
(3,348 | ) | (2,981 | ) | (2,804 | ) | ||||||
| Amortization of prior service cost |
— | — | — | |||||||||
| Recognition of net actuarial loss |
391 | 1,724 | 1,786 | |||||||||
| Curtailment |
— | — | — | |||||||||
|
|
|
|
|
|
|
|||||||
| Net periodic pension (benefit) cost |
$ | (1,317 | ) | $ | 227 | $ | 558 | |||||
|
|
|
|
|
|
|
|||||||
| SERP I and SERP II Periodic Pension Cost | For the Twelve Months Ended December 31, | |||||||||||
| (dollars in thousands) | 2014 | 2013 | 2012 | |||||||||
| Service cost |
$ | 61 | $ | 71 | $ | 243 | ||||||
| Interest cost |
177 | 188 | 243 | |||||||||
| Gain on curtailment |
— | (690 | ) | — | ||||||||
| Amortization of prior service cost |
14 | 31 | 82 | |||||||||
| Recognition of net actuarial loss |
(33 | ) | 78 | 86 | ||||||||
|
|
|
|
|
|
|
|||||||
| Net periodic pension cost (benefit) |
$ | 219 | $ | (322 | ) | $ | 654 | |||||
|
|
|
|
|
|
|
|||||||
| PRBP Net Periodic Pension Cost | For the Twelve Months Ended December 31, | |||||||||||
| (dollars in thousands) | 2014 | 2013 | 2012 | |||||||||
| Service cost |
$ | — | $ | — | $ | — | ||||||
| Interest cost |
29 | 29 | 36 | |||||||||
| Settlement |
— | — | — | |||||||||
| Amortization of transition obligation |
— | — | 26 | |||||||||
| Amortization of prior service cost |
— | — | — | |||||||||
| Recognition of net actuarial loss |
61 | 76 | 79 | |||||||||
|
|
|
|
|
|
|
|||||||
| Net periodic pension cost |
$ | 90 | $ | 105 | $ | 141 | ||||||
|
|
|
|
|
|
|
|||||||
101
Table of Contents
| For the Twelve Months Ended December 31, | ||||||||||||
| 2014 | 2013 | 2012 | ||||||||||
| Discount Rate Used in the Calculation of Periodic Pension Costs |
4.6 | % | 3.70 | % | 4.20 | % | ||||||
E. Plan Assets:
The information in this section pertains to the assets of the QDBP. The PRBP, SERP I and SERP II are unfunded plans and, as such, have no related plan assets.
The following table details the asset allocation and the QDBP’s policy asset allocation range as of the dates indicated:
| 2014 Plan Policy Asset Allocation Range |
2013 Plan Policy Asset Allocation Range |
Percentage of QDBP Plan Assets as of December 31, |
||||||||||||||
| 2014 | 2013 | |||||||||||||||
| Asset Category |
||||||||||||||||
| Equity securities(1)(2) |
50% to 65% | 50% to 65% | 70 | % | 63 | % | ||||||||||
| Fixed-income investments |
10% to 30% | 10% to 30% | 18 | % | 14 | % | ||||||||||
| Alternative investments |
0% to 30% | 0% to 30% | 4 | % | 20 | % | ||||||||||
| Cash reserves(2) |
1% to 5% | 1% to 5% | 8 | % | 3 | % | ||||||||||
|
|
|
|
|
|||||||||||||
| Total |
100 | % | 100 | % | ||||||||||||
|
|
|
|
|
|||||||||||||
| (1) | Includes Bryn Mawr Bank Corporation common stock in the amount of $986 thousand, or 2.3%, and $951 thousand, or 2.1%, at December 31, 2014 and 2013, respectively. |
| (2) | Asset categories that fall outside the asset allocation range prescribed by the plan policy are outside the range on a short-term basis and are often related to the timing of plan funding and subsequent investment. Reallocation is done regularly in order to adhere to the plan’s asset allocation policy |
The expected rate of return on plan assets in the QDBP was selected by the Corporation after consultation with its actuary, and is based in part on long term historical rates of return and various actuarial assumptions. The discount rate was also selected by the Corporation after consultation with its actuary, and is based in part upon the current yield of a portfolio of long term investment grade securities.
The investment strategy of the QDBP is to maintain the investment ranges listed above. The target ranges are to be periodically reviewed based on the prevailing market conditions. Any modification to the current investment strategy must be ratified by the Wealth Management Committee of the Corporation’s Board of Directors. The QDBP is allowed to retain approximately 2.5% of Bryn Mawr Bank Corporation common stock.
The Corporation’s overall investment strategy is to achieve a mix of approximately 60% investments for long-term growth and 40% for production of current income. The target allocations for the QDBP are 60% equity securities comprised of a number of mutual funds managed with differing objectives and styles. The plan also holds shares of the Corporation’s common stock. Fixed income obligations include corporate obligations, U.S. Treasury and Agency securities, along with fixed income mutual funds.
In addition, the QDBP invests in alternative investments whose definition is quite broad. Examples of strategies that may be deployed include: long/short, global macro, managed futures, event driven, tactical absolute return, master limited partnerships, REITs, etc. The allocation to alternative investments may be achieved through liquid strategies, such as separate accounts or mutual funds or through hedge funds. Hedge funds are carried at fair value as determined by the fund manager in good faith. In establishing the fair value of hedge funds, the fund manager takes into consideration information received from the investment administrators, including their financial statements and the fair value established by the fund manager of each respective investment.
102
Table of Contents
The following tables summarize the fair value of the assets of the QDBP as of the dates indicated. The fair values were determined by using three broad levels of inputs. See Note 13 for description of these input levels.
The fair value of the QDBP assets measured on a recurring basis as of December 31, 2014:
| (dollars in thousands) | Total | Level 1 | Level 2 | Level 3 | ||||||||||||
| Cash and cash equivalents |
$ | 3,590 | $ | 3,590 | $ | — | $ | — | ||||||||
| Alternative investments* |
2,747 | 850 | 1,897 | — | ||||||||||||
| Common stocks |
986 | 986 | — | — | ||||||||||||
| Equity mutual funds |
29,546 | 29,546 | — | — | ||||||||||||
| Bond mutual funds |
7,005 | 7,005 | — | — | ||||||||||||
|
|
|
|
|
|
|
|
|
|||||||||
| Total assets measured on a recurring basis at fair value |
$ | 43,874 | $ | 41,977 | $ | 1,897 | $ | — | ||||||||
|
|
|
|
|
|
|
|
|
|||||||||
| * | Alternative investments include exchange-traded products which are considered Level 1 and hedge fund investments which are considered Level 2. |
The fair value of the QDBP assets measured on a recurring basis as of December 31, 2013:
| (dollars in thousands) | Total | Level 1 | Level 2 | Level 3 | ||||||||||||
| Cash and cash equivalents |
$ | 1,218 | $ | 1,218 | $ | — | $ | — | ||||||||
| Alternative investments* |
9,196 | 5,747 | 3,449 | — | ||||||||||||
| Common stocks |
2,698 | 2,698 | — | — | ||||||||||||
| Equity mutual funds |
26,187 | 26,187 | — | — | ||||||||||||
| Bond mutual funds |
6,274 | 6,274 | — | — | ||||||||||||
|
|
|
|
|
|
|
|
|
|||||||||
| Total assets measured on a recurring basis at fair value |
$ | 45,573 | $ | 42,124 | $ | 3,449 | $ | — | ||||||||
|
|
|
|
|
|
|
|
|
|||||||||
F. Cash Flows
The following benefit payments, which reflect expected future services, are expected to be paid over the next ten years:
| (dollars in thousands) | QDBP | SERP I & SERP II | PRBP | |||||||||
| Fiscal year ending |
||||||||||||
| 2015 |
$ | 1,968 | $ | 261 | $ | 94 | ||||||
| 2016 |
$ | 1,998 | $ | 260 | $ | 83 | ||||||
| 2017 |
$ | 2,000 | $ | 258 | $ | 73 | ||||||
| 2018 |
$ | 2,060 | $ | 256 | $ | 64 | ||||||
| 2019 |
$ | 2,135 | $ | 254 | $ | 56 | ||||||
| 2020-2023 |
$ | 11,559 | $ | 1,482 | $ | 181 | ||||||
G. Other Pension and Post Retirement Benefit Information
In 2005, the Corporation placed a cap on the future annual benefit payable through the PRBP. This cap is equal to 120% of the 2005 annual benefit.
H. Expected Contribution to be Paid in the Next Fiscal Year
Based on the status of the Corporation’s QDBP at December 31, 2014, no minimum funding requirement is anticipated for 2015. The 2015 expected contribution for the SERP I and SERP II is $261 thousand.
103
Table of Contents
I. Actuarial Losses
As indicated in section C of this footnote, the Corporation’s pension plans had cumulative actuarial losses as of December 31, 2014 that will result in an increase in the Corporation’s future pension expense because such losses at each measurement date exceed 10% of the greater of the projected benefit obligation or the market-related value of the plan assets. In accordance with GAAP, net unrecognized gains or losses that exceed that threshold are required to be amortized over the expected service period of active employees, and are included as a component of net pension cost. Amortization of these net actuarial losses has the effect of increasing the Corporation’s pension costs as shown on the table in section D of this footnote.
Note 16 – Accumulated Other Comprehensive Loss
The following table details the components of accumulated other comprehensive (loss) income for the twelve months ended December 31, 2014, 2013 and 2012:
| (dollars in thousands) | Net Change in Unrealized Gains on Available-for- Sale Investment Securities |
Net Change in Fair Value of Derivative Used for Cash Flow Hedge |
Net Change in Unfunded Pension Liability |
Accumulated Other Comprehensive Loss |
||||||||||||
| Balance, December 31, 2011 |
$ | 1,792 | $ | — | $ | (13,157 | ) | $ | (11,365 | ) | ||||||
| Net change |
1,372 | (23 | ) | (62 | ) | 1,287 | ||||||||||
|
|
|
|
|
|
|
|
|
|||||||||
| Balance, December 31, 2012 |
$ | 3,164 | $ | (23 | ) | $ | (13,219 | ) | $ | (10,078 | ) | |||||
|
|
|
|
|
|
|
|
|
|||||||||
| Balance, December 31, 2012 |
$ | 3,164 | $ | (23 | ) | $ | (13,219 | ) | $ | (10,078 | ) | |||||
| Net change |
(4,021 | ) | 766 | 7,768 | 4,513 | |||||||||||
|
|
|
|
|
|
|
|
|
|||||||||
| Balance, December 31, 2013 |
$ | (857 | ) | $ | 743 | $ | (5,451 | ) | $ | (5,565 | ) | |||||
|
|
|
|
|
|
|
|
|
|||||||||
| Balance, December 31, 2013 |
$ | (857 | ) | $ | 743 | $ | (5,451 | ) | $ | (5,565 | ) | |||||
| Net change |
2,173 | (768 | ) | (7,544 | ) | (6,139 | ) | |||||||||
|
|
|
|
|
|
|
|
|
|||||||||
| Balance, December 31, 2014 |
$ | 1,316 | $ | (25 | ) | $ | (12,995 | ) | $ | (11,704 | ) | |||||
|
|
|
|
|
|
|
|
|
|||||||||
104
Table of Contents
The following tables detail the amounts reclassified from each component of accumulated other comprehensive loss for the twelve month periods ended December 31, 2014, 2013 and 2012:
| Description of Accumulated Other Comprehensive Loss Component |
Amount Reclassified from Accumulated Other Comprehensive Loss For The Twelve Months Ended December 31, |
Affected Income Statement Category | ||||||||||||
| 2014 | 2013 | 2012 | ||||||||||||
| Net unrealized gain on investment securities available for sale: |
||||||||||||||
| Realization of (gain) loss on sale of investment securities available for sale |
$ | 471 | $ | (8 | ) | $ | 1,415 | Net gain (loss) on sale of available for sale investment securities | ||||||
| (165 | ) | 3 | (495 | ) | Less: income tax benefit (expense) | |||||||||
|
|
|
|
|
|
|
|||||||||
| $ | 306 | $ | (5 | ) | $ | 920 | Net of income tax | |||||||
|
|
|
|
|
|
|
|||||||||
| Unfunded pension liability: |
||||||||||||||
| Amortization of net loss included in net periodic pension costs* |
$ | 419 | $ | 1,878 | $ | 1,951 | Employee benefits | |||||||
| Amortization of prior service cost included in net periodic pension costs* |
14 | 31 | 82 | Employee benefits | ||||||||||
| Amortization of transition obligation included in net periodic pension costs* |
— | — | 26 | Employee benefits | ||||||||||
| Gain on curtailment of SERP II |
— | (690 | ) | — | Net gain on curtailment of nonqualified pension plan | |||||||||
|
|
|
|
|
|
|
|||||||||
| 433 | 1,219 | 2,059 | Total expense before income tax benefit | |||||||||||
| 152 | 427 | 721 | Less: income tax benefit | |||||||||||
|
|
|
|
|
|
|
|||||||||
| $ | 281 | $ | 792 | $ | 1,338 | Net of income tax | ||||||||
|
|
|
|
|
|
|
|||||||||
| * | Accumulated other comprehensive loss components are included in the computation of net periodic pension cost. See Note 15 – Pension and Other Post-Retirement Benefit Plans. |
105
Table of Contents
Note 17 – Income Taxes
A. Components of Net Deferred Tax Asset:
| December 31, | ||||||||
| (dollars in thousands) | 2014 | 2013 | ||||||
| Deferred tax assets: |
||||||||
| Loan and lease loss reserve |
$ | 5,445 | $ | 6,124 | ||||
| Other reserves |
788 | 1,190 | ||||||
| Net operating loss carry-forward |
1,384 | 1,841 | ||||||
| Alternative minimum tax credits |
567 | 567 | ||||||
| Amortizing fair value adjustments |
— | 2,367 | ||||||
| Unrealized depreciation of derivative used for cash flow hedge |
14 | — | ||||||
| Unrealized depreciation of available for sale securities |
— | 462 | ||||||
| Defined benefit plans |
8,227 | 4,142 | ||||||
|
|
|
|
|
|||||
| Total deferred tax asset |
16,425 | 16,693 | ||||||
|
|
|
|
|
|||||
| Deferred tax liabilities: |
||||||||
| Other reserves |
363 | 219 | ||||||
| QDBP |
6,182 | 5,721 | ||||||
| Originated MSRs |
1,668 | 1,663 | ||||||
| Amortizing fair value adjustments |
294 | — | ||||||
| Unrealized appreciation of derivative used for cash flow hedge |
— | 400 | ||||||
| Unrealized appreciation of available for sale securities |
709 | — | ||||||
|
|
|
|
|
|||||
| Total deferred tax liability |
9,216 | 8,003 | ||||||
|
|
|
|
|
|||||
| Total net deferred tax asset |
$ | 7,209 | $ | 8,690 | ||||
|
|
|
|
|
|||||
Not included in the table above is a $51 thousand deferred tax asset for state taxes related to net operating losses of our leasing subsidiary as of December 31, 2014, for which we have recorded a 100% valuation allowance. In connection with the acquisition of PCPB, the Corporation recorded a $2.4 million deferred tax liability related to amortizable intangible assets.
B. The provision (benefit) for income taxes consists of the following:
| (dollars in thousands) | 2014 | 2013 | 2012 | |||||||||
| Current |
$ | 12,655 | $ | 11,391 | $ | 11,575 | ||||||
| Deferred |
2,350 | 1,195 | (505 | ) | ||||||||
|
|
|
|
|
|
|
|||||||
| Total |
$ | 15,005 | $ | 12,586 | $ | 11,070 | ||||||
|
|
|
|
|
|
|
|||||||
C. Applicable income taxes differed from the amount derived by applying the statutory federal tax rate to income as follows:
| (dollars in thousands) | 2014 | Tax Rate |
2013 | Tax Rate |
2012 | Tax Rate |
||||||||||||||||||
| Computed tax expense at statutory federal rate |
$ | 14,997 | 35.0 | % | $ | 12,960 | 35.0 | % | $ | 11,276 | 35.0 | % | ||||||||||||
| Tax-exempt income |
(401 | ) | (0.9 | ) | (414 | ) | (1.1 | ) | (382 | ) | (1.2 | ) | ||||||||||||
| State tax (net of federal tax benefit) |
215 | 0.5 | 218 | 0.6 | 107 | 0.3 | ||||||||||||||||||
| Non-deductible merger expense |
105 | 0.2 | — | — | 93 | 0.3 | ||||||||||||||||||
| Other, net |
89 | 0.2 | (178 | ) | (0.5 | ) | (24 | ) | (0.1 | ) | ||||||||||||||
|
|
|
|
|
|
|
|
|
|
|
|
|
|||||||||||||
| Total income tax expense |
$ | 15,005 | 35.0 | % | $ | 12,586 | 34.0 | % | $ | 11,070 | 34.3 | % | ||||||||||||
|
|
|
|
|
|
|
|
|
|
|
|
|
|||||||||||||
106
Table of Contents
D. Other Income Tax Information
In accordance with the provisions of ASC 740, “Accounting for Uncertainty in Income Taxes”, the Corporation recognizes the financial statement benefit of a tax position only after determining that the Corporation would more likely than not sustain the position following an examination. For tax positions meeting the more-likely-than-not threshold, the amount recognized in the financial statements is the largest benefit that has a greater than 50 percent likelihood of being realized upon settlement with the relevant tax authority. The Corporation applied these criteria to tax positions for which the statute of limitations remained open.
There were no reserves for uncertain tax positions recorded during the twelve months ended December 31, 2014, 2013 or 2012.
The Corporation is subject to income taxes in the U.S. federal jurisdiction, and in multiple state jurisdictions. The Corporation is no longer subject to U.S. federal income tax examination by tax authorities for the years before 2011.
The Corporation’s policy is to record interest and penalties on uncertain tax positions as income tax expense. No interest or penalties were accrued in 2014.
As of December 31, 2014, the Corporation has net operating loss carry-forwards for federal income tax purposes of $3.9 million, related to the FKF merger, which are available to offset future federal taxable income through 2030. In addition, the Corporation has alternative minimum tax credits of $567 thousand, which are available to reduce future federal regular income taxes over an indefinite period. The Corporation has determined that it is more likely than not that the results of future operations will generate sufficient taxable income to realize the deferred tax asset related to these amounts.
As a result of the July 1, 2010 merger with FKF, the Corporation succeeded to certain tax bad debt reserves that existed at FKF as of June 30, 2010. As of December 31, 2014, the Corporation had unrecognized deferred income taxes of $58 thousand with respect to these reserves. These reserves could be recognized as taxable income and create a current and/or deferred tax liability at the income tax rates then in effect if one of the following conditions occurs: (1) the Bank’s retained earnings represented by this reserve are used for distributions, in liquidation, or for any other purpose other than to absorb losses from bad debts; (2) the Bank fails to qualify as a bank, as provided by the Internal Revenue Code; or (3) there is a change in federal tax law.
Note 18 – Stock – Based Compensation
A. General Information
The Corporation permits the issuance of stock options, dividend equivalents, performance stock awards, stock appreciation rights and restricted stock awards to employees and directors of the Corporation under several plans. The performance awards and restricted awards may be in the form of stock awards or stock units. The only difference between a stock award and a stock unit is that for a stock award, shares of restricted stock are issued in the name of the grantee, whereas a stock unit constitutes a promise to issue shares of stock upon vesting. The accounting for awards and units is identical. The terms and conditions of awards under the plans are determined by the Corporation’s Compensation Committee.
Prior to April 25, 2007, all shares authorized for grant as stock-based compensation were limited to grants of stock options. On April 25, 2007, the shareholders approved the Corporation’s “2007 Long-Term Incentive Plan” (the “2007 LTIP”) under which a total of 428,996 shares of the Corporation’s common stock were made available for award grants. On April 28, 2010, the shareholders approved the Corporation’s “2010 Long Term Incentive Plan” (the “2010 LTIP”) under which a total of 445,002 shares of the Corporation’s common stock were made available for award grants.
107
Table of Contents
In addition to the shareholder-approved plans mentioned in the preceding paragraph, the Corporation periodically authorizes grants of stock-based compensation as inducement awards to new employees. This type of award does not require shareholder approval in accordance with Rule 5635(c)(4) of the Nasdaq listing rules.
The equity awards are authorized to be in the form of, among others, options to purchase the Corporation’s common stock, restricted stock awards or units (“RSAs” or “RSUs”) and performance stock awards or units (“PSAs” or “PSUs”).
RSAs and RSUs have a restriction based on the passage of time and may also have a restriction based on a non-market-related performance criteria. The fair value of the RSAs and RSUs is based on the closing price on the day preceding the date of the grant.
The PSAs and PSUs also have a restriction based on the passage of time, but also have a restriction based on performance criteria related to the Corporation’s total shareholder return relative to the performance of the community bank index for the respective period. The amount of PSAs or PSUs earned will not exceed 100% of the PSAs or PSUs awarded. The fair value of the PSAs and PSUs is calculated using the Monte Carlo Simulation method.
In connection with the July 2010 FKF merger, 21,133 fully vested options which had been granted to former FKF employees were assumed by the Corporation.
The following table summarizes the remaining shares authorized to be granted for options, RSAs and PSAs:
| Shares Authorized for Grant |
||||
| Balance, December 31, 2011 |
377,496 | |||
| Grants of RSAs |
(31,948 | ) | ||
| Grants of PSAs |
(73,217 | ) | ||
| Expiration of unexercised options |
15,638 | |||
| Forfeitures of PSAs |
4,812 | |||
|
|
|
|||
| Balance, December 31, 2012 |
292,781 | |||
| Grants of RSUs |
(6,665 | ) | ||
| Grants of PSUs |
(75,367 | ) | ||
| Expiration of unexercised options |
900 | |||
| Forfeitures of RSAs and RSUs |
3,681 | |||
| Forfeitures of PSAs and PSUs |
1,575 | |||
|
|
|
|||
| Balance, December 31, 2013 |
216,905 | |||
| Shares authorized for grant under non-shareholder approved plans |
47,368 | |||
| Grants of RSUs |
(16,456 | ) | ||
| Grants of PSUs |
(71,184 | ) | ||
| Expiration of unexercised options |
1,750 | |||
| Forfeitures of RSAs and RSUs |
2,560 | |||
| Forfeitures of PSAs and PSUs |
1,900 | |||
|
|
|
|||
| Balance, December 31, 2014 |
182,843 | |||
108
Table of Contents
B. Fair Value of Options Granted
The fair value of each option granted is estimated on the date of the grant using the Black-Scholes option pricing model with the following weighted-average assumptions used for grants issued during:
| 2014 |
2013 | 2012 | ||||||
| Expected dividend yield |
N/A | 2.6 | % | N/A | ||||
| Expected volatility of Corporation’s stock |
N/A | 24.0 | % | N/A | ||||
| Risk-free interest rate |
N/A | 3.7 | % | N/A | ||||
| Expected life in years |
N/A | 7.0 | N/A | |||||
| Weighted average fair value of options granted |
N/A | $ | 4.83 | N/A | ||||
The expected dividend yield is based on the company’s annual dividend amount as a percentage of the average stock price at the time of the grant. Expected life is equal to the mid-point of the average time to vest and the contractual term. Expected volatility of the Corporation’s stock is based on the historic volatility of the Corporation’s stock price. The risk-free interest rate is based on the zero-coupon U.S. Treasury interest rate ranging from one month to ten years and a period commensurate with the expected life of the option.
C. Other Stock Option Information – The following table provides information about options outstanding:
| For the Twelve Months Ended December 31, | ||||||||||||||||||||||||||||||||||||
| 2014 | 2013 | 2012 | ||||||||||||||||||||||||||||||||||
| Shares | Weighted Average Exercise Price |
Weighted Average Grant Date Fair Value |
Shares | Weighted Average Exercise Price |
Weighted Average Grant Date Fair Value |
Shares | Weighted Average Exercise Price |
Weighted Average Grant Date Fair Value |
||||||||||||||||||||||||||||
| Options outstanding, beginning of period |
591,086 | $ | 20.73 | $ | 4.70 | 783,476 | $ | 20.40 | $ | 4.62 | 876,470 | $ | 20.17 | $ | 4.49 | |||||||||||||||||||||
| Granted |
— | $ | — | $ | — | 12,225 | $ | 21.28 | $ | 4.83 | — | — | — | |||||||||||||||||||||||
| Forfeited |
— | $ | — | $ | — | (650 | ) | $ | 19.65 | $ | 4.62 | (5,755 | ) | $ | 20.56 | $ | 4.74 | |||||||||||||||||||
| Expired |
(1,750 | ) | $ | 22.31 | $ | 4.99 | (250 | ) | $ | 22.00 | $ | 4.90 | (9,883 | ) | $ | 21.93 | $ | 5.01 | ||||||||||||||||||
| Exercised |
(141,370 | ) | $ | 20.06 | $ | 4.51 | (203,715 | ) | $ | 19.49 | $ | 4.39 | (77,356 | ) | $ | 17.60 | $ | 3.69 | ||||||||||||||||||
|
|
|
|
|
|
|
|||||||||||||||||||||||||||||||
| Options outstanding, end of period |
447,966 | $ | 20.94 | $ | 4.75 | 591,086 | $ | 20.73 | $ | 4.70 | 783,476 | $ | 20.40 | $ | 4.62 | |||||||||||||||||||||
|
|
|
|
|
|
|
|||||||||||||||||||||||||||||||
The following table provides information related to options as of December 31, 2014:
| Options Outstanding | Options Exercisable | |||||||||||||||||||
| Range of Exercise Prices |
Options Outstanding |
Remaining Contractual Life |
Shares Exercisable |
Remaining Contractual Life |
Weighted Average Exercise Price* |
|||||||||||||||
| $10.36 to $18.59 |
128,427 | 4.25 yrs | 128,427 | 4.25 yrs | $ | 18.22 | ||||||||||||||
| $18.60 to $19.69 |
51,000 | 0.36 yrs | 51,000 | 0.36 yrs | $ | 18.91 | ||||||||||||||
| $19.70 to $21.48 |
78,900 | 0.95 yrs | 78,900 | 0.95 yrs | $ | 21.21 | ||||||||||||||
| $21.49 to $22.03 |
86,375 | 2.39 yrs | 86,375 | 2.39 yrs | $ | 21.99 | ||||||||||||||
| $22.04 to $23.97 |
2,500 | 1.72 yrs | 2,500 | 1.72 yrs | $ | 23.02 | ||||||||||||||
| $23.98 to $24.27 |
100,764 | 3.34 yrs | 100,764 | 3.34 yrs | $ | 24.27 | ||||||||||||||
|
|
|
|
|
|||||||||||||||||
| 447,966 | 2.65 yrs | 447,966 | 2.65 yrs | $ | 20.94 | |||||||||||||||
|
|
|
|
|
|||||||||||||||||
| * | price of exercisable options |
109
Table of Contents
The following table provides information about unvested options:
| For the Twelve Months Ended December 31, | ||||||||||||||||||||||||
| 2014 | 2013 | 2012 | ||||||||||||||||||||||
| Shares | Weighted Average Grant Date Fair Value |
Shares | Weighted Average Grant Date Fair Value |
Shares | Weighted Average Grant Date Fair Value |
|||||||||||||||||||
| Unvested options, beginning of period |
30,146 | $ | 4.42 | 80,756 | $ | 4.65 | 158,515 | $ | 4.73 | |||||||||||||||
| Granted |
— | — | 12,225 | $ | 4.83 | — | — | |||||||||||||||||
| Vested |
(30,146 | ) | $ | 4.42 | (62,185 | ) | $ | 4.80 | (72,004 | ) | $ | 4.82 | ||||||||||||
| Forfeited |
— | — | (650 | ) | $ | 4.62 | (5,755 | ) | $ | 4.74 | ||||||||||||||
|
|
|
|
|
|
|
|||||||||||||||||||
| Unvested options, end of period |
— | — | 30,146 | $ | 4.42 | 80,756 | $ | 4.65 | ||||||||||||||||
|
|
|
|
|
|
|
|||||||||||||||||||
Proceeds, related tax benefits realized from options exercised and intrinsic value of options exercised were as follows:
| For the Twelve Months Ended December 31, |
||||||||||||
| (dollars in thousands) | 2014 | 2013 | 2012 | |||||||||
| Proceeds from strike price of value of options exercised |
$ | 2,836 | $ | 3,970 | $ | 1,362 | ||||||
| Related tax benefit recognized |
378 | 376 | 100 | |||||||||
|
|
|
|
|
|
|
|||||||
| Proceeds of options exercised |
$ | 3,214 | $ | 4,346 | $ | 1,462 | ||||||
| Intrinsic value of options exercised |
$ | 1,288 | $ | 1,215 | $ | 269 | ||||||
|
|
|
|
|
|
|
|||||||
The following table provides information about options outstanding and exercisable options:
| As of December 31, | ||||||||||||||||||||||||
| 2014 | 2013 | 2012 | ||||||||||||||||||||||
| Options Outstanding |
Exercisable Options |
Options Outstanding |
Exercisable Options |
Options Outstanding |
Exercisable Options |
|||||||||||||||||||
| Number |
447,966 | 447,966 | 591,086 | 560,940 | 783,476 | 702,720 | ||||||||||||||||||
| Weighted average exercise price |
$ | 20.94 | $ | 20.94 | $ | 20.73 | $ | 20.87 | $ | 20.40 | $ | 20.46 | ||||||||||||
| Aggregate intrinsic value |
$ | 4,640,917 | $ | 4,640,917 | $ | 5,583,266 | $ | 5,224,227 | $ | 1,691,778 | $ | 1,455,766 | ||||||||||||
| Weighted average contractual term |
2.7 yrs | 2.7 yrs | 3.2 yrs | 3.1 yrs | 3.6 yrs | 3.3 yrs | ||||||||||||||||||
For the twelve months ended December 31, 2014, the Corporation recognized $64 thousand of expense related to stock options. As of December 31, 2014, all compensation expense related to stock options has been recognized.
D. Restricted Stock and Performance Stock Awards and Units
The Corporation has granted RSAs, RSUs, PSAs and PSUs under the 2007 LTIP and 2010 LTIP and in accordance with Rule 5635(c)(4) of the Nasdaq listing standards.
RSAs and RSUs
The compensation expense for the RSAs is measured based on the market price of the stock on the day prior to the grant date and is recognized on a straight line basis over the vesting period.
For the twelve months ended December 31, 2014, the Corporation recognized $335 thousand of expense related to the Corporation’s RSAs. As of December 31, 2014, there was $561 thousand of unrecognized compensation cost related to RSAs. This cost will be recognized over a weighted average period of 2.1 years.
110
Table of Contents
The following table details the RSAs for the twelve month periods ended December 31, 2014, 2013 and 2012:
| Twelve Months Ended December 31, 2014 |
Twelve Months Ended December 31, 2013 |
Twelve Months Ended December 31, 2012 |
||||||||||||||||||||||
| Number of Shares |
Weighted Average Grant Date Fair Value |
Number of Shares |
Weighted Average Grant Date Fair Value |
Number of Shares |
Weighted Average Grant Date Fair Value |
|||||||||||||||||||
| Beginning balance |
54,156 | $ | 19.36 | 60,287 | $ | 19.05 | 38,681 | $ | 18.06 | |||||||||||||||
| Granted |
16,456 | $ | 28.88 | 6,665 | $ | 22.50 | 31,948 | $ | 20.41 | |||||||||||||||
| Vested |
(21,771 | ) | $ | 18.21 | (9,115 | ) | $ | 19.20 | (10,342 | ) | $ | 19.34 | ||||||||||||
| Forfeited |
(2,560 | ) | $ | 21.48 | (3,681 | ) | $ | 20.38 | — | — | ||||||||||||||
|
|
|
|
|
|
|
|||||||||||||||||||
| Ending balance |
46,281 | $ | 23.17 | 54,156 | $ | 19.36 | 60,287 | $ | 19.05 | |||||||||||||||
|
|
|
|
|
|
|
|||||||||||||||||||
PSAs and PSUs
The compensation expense for PSAs and PSUs is measured based on their grant date fair value as calculated using the Monte Carlo Simulation and is recognized on a straight-line basis over the vesting period. Related to the 71,184 PSAs granted during the twelve months ended December 31, 2014, the Monte Carlo Simulation used various assumptions that include expected volatility of 26.65% a risk free rate of return of 0.86% and a correlation co-efficient of 0.7539.
The Corporation recognized $858 thousand of expense related to the PSAs for the twelve months ended December 31, 2014. As of December 31, 2014, there was $1.7 million of unrecognized compensation cost related to PSAs. This cost will be recognized over a weighted average period of 2.1 years.
The following table details the PSAs for the twelve month periods ending December 31, 2014, 2013 and 2012:
| Twelve Months Ended December 31, 2014 |
Twelve Months Ended December 31, 2013 |
Twelve Months Ended December 31, 2012 |
||||||||||||||||||||||
| Number of Shares |
Weighted Average Grant Date Fair Value |
Number of Shares |
Weighted Average Grant Date Fair Value |
Number of Shares |
Weighted Average Grant Date Fair Value |
|||||||||||||||||||
| Beginning balance |
204,980 | $ | 11.90 | 186,113 | $ | 10.62 | 117,708 | $ | 9.86 | |||||||||||||||
| Granted |
71,184 | $ | 15.05 | 75,367 | $ | 13.38 | 73,217 | $ | 11.80 | |||||||||||||||
| Vested |
(56,946 | ) | $ | 10.07 | (54,925 | ) | 9.64 | — | — | |||||||||||||||
| Forfeited |
(1,900 | ) | $ | 12.32 | (1,575 | ) | $ | 10.77 | (4,812 | ) | $ | 9.88 | ||||||||||||
|
|
|
|
|
|
|
|||||||||||||||||||
| Ending balance |
217,318 | $ | 13.41 | 204,980 | $ | 11.90 | 186,113 | $ | 10.62 | |||||||||||||||
|
|
|
|
|
|
|
|||||||||||||||||||
111
Table of Contents
Note 19 – Earnings per Share
The calculation of basic earnings per share and diluted earnings per share is presented below:
| (dollars in thousands, except per share data) | Year Ended December 31, | |||||||||||
| 2014 | 2013 | 2012 | ||||||||||
| Numerator – Net income available to common shareholders |
$ | 27,843 | $ | 24,444 | $ | 21,147 | ||||||
|
|
|
|
|
|
|
|||||||
| Denominator for basic earnings per share – Weighted average shares outstanding* |
13,566,239 | 13,311,215 | 13,090,110 | |||||||||
| Effect of dilutive potential common shares |
294,801 | 260,395 | 151,736 | |||||||||
|
|
|
|
|
|
|
|||||||
| Denominator for diluted earnings per share – Adjusted weighted average shares outstanding |
13,861,040 | 13,571,610 | 13,241,846 | |||||||||
|
|
|
|
|
|
|
|||||||
| Basic earnings per share |
$ | 2.05 | $ | 1.84 | $ | 1.62 | ||||||
| Diluted earnings per share |
$ | 2.01 | $ | 1.80 | $ | 1.60 | ||||||
| Antidilutive shares excluded from computation of average dilutive earnings per share |
— | — | 848,477 | |||||||||
|
|
|
|
|
|
|
|||||||
| * | excludes restricted stock |
All weighted average shares, actual shares and per share information in the financial statements have been adjusted retroactively for the effect of stock dividends and splits. See Note 1-Q – “Summary of Significant Accounting Policies: Earnings per Common Share” for a discussion on the calculation of earnings per share.
Note 20 – Other Operating Income
Components of other operating income for the indicated years ended December 31 include:
| (dollars in thousands) | 2014 | 2013 | 2012 | |||||||||
| Merchant interchange fees |
$ | 934 | $ | 814 | $ | 665 | ||||||
| Commissions and fees |
637 | 578 | 510 | |||||||||
| Safe deposit box rentals |
390 | 387 | 398 | |||||||||
| Other investment income |
756 | 348 | 349 | |||||||||
| Title insurance income |
— | 192 | 272 | |||||||||
| Rent income |
164 | 202 | 162 | |||||||||
| Miscellaneous other income |
391 | 1,542 | 1,043 | |||||||||
|
|
|
|
|
|
|
|||||||
| Other operating income |
$ | 3,272 | $ | 4,063 | $ | 3,399 | ||||||
|
|
|
|
|
|
|
|||||||
112
Table of Contents
Note 21 – Other Operating Expense
Components of other operating expense for the indicated years ended December 31 include:
| (dollars in thousands) | 2014 | 2013 | 2012 | |||||||||
| Information technology |
$ | 2,771 | $ | 2,876 | $ | 2,060 | ||||||
| Loan processing |
724 | 966 | 1,485 | |||||||||
| Other taxes |
51 | 65 | 85 | |||||||||
| Temporary help and recruiting |
1,171 | 1,624 | 1,031 | |||||||||
| Telephone and data lines |
1,331 | 1,378 | 652 | |||||||||
| Travel and entertainment |
725 | 630 | 567 | |||||||||
| Stationary and supplies |
445 | 508 | 516 | |||||||||
| Postage |
471 | 515 | 433 | |||||||||
| Director fees |
443 | 452 | 409 | |||||||||
| Outsourced services |
432 | 457 | 355 | |||||||||
| Portfolio maintenance |
389 | 366 | 266 | |||||||||
| Dues and subscriptions |
368 | 394 | 326 | |||||||||
| Contributions |
403 | 355 | 301 | |||||||||
| Insurance |
759 | 689 | 402 | |||||||||
| Deferred compensation expense |
266 | 906 | 271 | |||||||||
| Miscellaneous other expense |
2,016 | 1,637 | 1,962 | |||||||||
|
|
|
|
|
|
|
|||||||
| Other operating expense |
$ | 12,765 | $ | 13,818 | $ | 11,121 | ||||||
|
|
|
|
|
|
|
|||||||
Note 22 – Related Party Transactions
In the ordinary course of business, the Bank granted loans to principal officers, directors and their affiliates. Loan activity during 2014 and 2013 was as follows:
Following is a summary of these transactions:
| (dollars in thousands) | 2014 | 2013 | ||||||
| Balance, January 1 |
$ | 3,032 | $ | 2,884 | ||||
| Additions |
— | 200 | ||||||
| Amounts collected |
(158 | ) | (52 | ) | ||||
|
|
|
|
|
|||||
| Balance, December 31 |
$ | 2,874 | $ | 3,032 | ||||
|
|
|
|
|
|||||
Related party deposits amounted to $2.8 million and $2.0 million at December 31, 2014 and 2013, respectively.
Note 23 – Financial Instruments with Off-Balance Sheet Risk, Contingencies and Concentration of Credit Risk
Off-Balance Sheet Risk
The Corporation is a party to financial instruments with off-balance sheet risk in the normal course of business to meet the financing needs of its customers. These financial instruments include commitments to extend credit and standby letters of credit. Those instruments involve, to varying degrees, elements of credit risk in excess of the amount recognized in the consolidated statements of financial condition. The contractual amounts of those instruments reflect the extent of involvement the Corporation has in particular classes of financial instruments.
The Corporation’s exposure to credit loss in the event of nonperformance by the counterparty to the financial instrument of commitments to extend credit and standby letters of credit is represented by the contractual amount of those instruments. The Corporation uses the same credit policies in making commitments and conditional obligations as it does for on-balance sheet financial instruments.
113
Table of Contents
Commitments to extend credit, which include unused lines of credit and unfunded commitments to originate loans, are agreements to lend to a customer as long as there is no violation of any condition established in the agreement. Commitments generally have fixed expiration dates or other termination clauses and may require payment of a fee. Some of the commitments are expected to expire without being drawn upon, and the total commitment amounts do not necessarily represent future cash requirements. Total commitments to extend credit at December 31, 2014 were $463.7 million. The Corporation evaluates each customer’s creditworthiness on a case-by-case basis. The amount of collateral obtained, if deemed necessary by the Corporation upon extension of credit, is based on a credit evaluation of the counterparty. Collateral varies but may include accounts receivable, marketable securities, inventory, property, plant and equipment, residential real estate, and income-producing commercial properties.
Standby letters of credit are conditional commitments issued by the Bank to a customer for a third party. Such standby letters of credits are issued to support private borrowing arrangements. The credit risk involved in issuing standby letters of credit is similar to that involved in extending loan facilities to customers. The collateral varies, but may include accounts receivable, marketable securities, inventory, property, plant and equipment, and residential real estate for those commitments for which collateral is deemed necessary. The Corporation’s obligation under standby letters of credit as of December 31, 2014 was $15.3 million. There were no outstanding bankers’ acceptances as of December 31, 2014.
Contingencies
Legal Matters
In the ordinary course of business, the Corporation is subject to litigation, claims, and assessments that involve claims for monetary relief. Some of these are covered by insurance. Based upon information presently available to the Corporation and its counsel, it is the Corporation’s opinion that any legal and financial responsibility arising from such claims will not have a material, adverse effect on its results of operations, financial condition or capital.
Indemnifications
In general, the Corporation does not sell loans with recourse, except to the extent that it arises from standard loan-sale contract provisions. These provisions cover violations of representations and warranties and, under certain circumstances, first payment default by borrowers. These indemnifications may include the repurchase of loans by the Corporation, and are considered customary provisions in the secondary market for conforming mortgage loan sales. For the twelve months ended December 31, 2014, there were no make-whole requests presented to or settled by the Corporation. For the twelve months ended December 31, 2013, the Corporation settled two make-whole requests from the secondary market totaling $278 thousand. For the twelve months ended December 31, 2012, there were no make-whole requests presented to or settled by the Corporation. As of December 31, 2014, there are no pending make-whole requests.
Concentrations of Credit Risk
The Corporation has a material portion of its loans in real estate-related loans. A predominant percentage of the Corporation’s real estate exposure, both commercial and residential, is in the Corporation’s primary trade area which includes portions of Delaware, Chester, Montgomery and Philadelphia counties in Southeastern Pennsylvania. The Corporation is aware of this concentration and attempts to mitigate this risk to the extent possible in many ways, including the underwriting and assessment of borrower’s capacity to repay. See Note 5 – “Loans and Leases” for additional information.
As of December 31, 2014, the Corporation had no loans sold with recourse outstanding.
114
Table of Contents
Note 24 – Dividend Restrictions
The Bank is subject to the Pennsylvania Banking Code of 1965 (the “Code”), as amended, and is restricted in the amount of dividends that can be paid to its sole shareholder, the Corporation. The Code restricts the payment of dividends by the Bank to the amount of its net income during the current calendar year and the retained net income of the prior two calendar years, unless the dividend has been approved by the Board of Governors of the Federal Reserve System. The total retained net income for the years ended December 31, 2013 and 2014 was $32.4 million. Accordingly, the dividend payable by the Bank to the Corporation is limited to $32.4 million plus net income not yet earned in 2015. However, the amount of dividends paid by the Bank may not reduce capital levels below levels that would cause the Bank to be considered less than adequately capitalized as detailed in Note 25 – “Regulatory Capital Requirements”.
Note 25 – Regulatory Capital Requirements
A. General Regulatory Capital Information
Both the Corporation and the Bank are subject to various regulatory capital requirements, administered by the federal banking agencies. Failure to meet minimum capital requirements can initiate certain mandatory and possibly additional discretionary actions by regulators that, if taken, could have a direct material effect on the Corporation’s and the Bank’s financial statements. Under capital adequacy guidelines and the regulatory framework for prompt corrective action, the Corporation and the Bank must meet specific capital guidelines that involve quantitative measures of their assets, liabilities and certain off-balance-sheet items as calculated under regulatory accounting practices. The capital amounts and classifications are also subject to qualitative judgments by the regulators about components, risk weightings and other factors. Prompt corrective action provisions are not applicable to bank holding companies. Beginning in 2015, new regulatory capital reforms, known as Basel III, issued as part of the Dodd-Frank Act will begin to be phased in. For more information, refer to the “Other Information” section of Management’s Discussion and Analysis of Financial Condition and Results of Operations in this Annual Report on Form 10-K.
B. S-3 Shelf Registration Statement and Offerings Thereunder
In April 2012, the Corporation filed a shelf registration statement (the “Shelf Registration Statement”) to replace its 2009 Shelf Registration Statement, which was set to expire in June 2012. This new Shelf Registration Statement allows the Corporation to raise additional capital through offers and sales of registered securities consisting of common stock, debt securities, warrants to purchase common stock, stock purchase contracts and units or units consisting of any combination of the foregoing securities. Using the prospectus in the Shelf Registration Statement, together with applicable prospectus supplements, the Corporation may sell, from time to time, in one or more offerings, such securities in a dollar amount up to $150,000,000, in the aggregate.
The Corporation has in place under its Shelf Registration Statement a Dividend Reinvestment and Stock Purchase Plan (the “Plan”), which was amended and restated on April 27, 2012, primarily to increase the number of shares which can be issued by the Corporation from 850,000 to 1,500,000 shares of registered common stock. The Plan allows for the grant of a request for waiver (“RFW”) above the Plan’s maximum investment of $120 thousand per account per year. An RFW is granted based on a variety of factors, including the Corporation’s current and projected capital needs, prevailing market prices of the Corporation’s common stock and general economic and market conditions.
The Plan is intended to allow both existing shareholders and new investors to easily and conveniently increase their investment in the Corporation without incurring many of the fees and commissions normally associated with brokerage transactions. For the twelve months ended December 31, 2014, the Corporation issued 2,517 shares and raised $72 thousand through the Plan.
115
Table of Contents
C. Shares Issued in Mergers and Acquisitions
In connection with the acquisition of PWMG, the Corporation issued 322,101 common shares, valued at $6.7 million, to former shareholders of PWMG. These shares were registered on an S-3 registration statement filed by the Corporation in September 2011.
In connection with the merger with FKF, the Corporation issued 1,630,053 common shares, valued at $26.5 million, to former shareholders of FKF. These shares were registered on an S-4 registration statement filed by the Corporation in January 2010.
D. Regulatory Capital Ratios
As set forth in the following table, quantitative measures have been established to ensure capital adequacy ratios required of both the Corporation and the Bank. Both the Corporation’s and the Bank’s Tier II capital ratios are calculated by adding back a portion of the loan loss reserve to the Tier I capital. The Corporation believes that as of December 31, 2014 and 2013, the Corporation and the Bank had met all capital adequacy requirements to which they were subject. Federal banking regulators have defined specific capital categories, and categories range from a best of “well capitalized” to a worst of “critically under-capitalized.” Both the Corporation and the Bank were classified as “well capitalized” as of December 31, 2014 and 2013.
The Corporation’s and the Bank’s actual capital amounts and ratios as of December 31, 2014 and 2013 are presented in the following table:
| Actual | Minimum to be Well Capitalized |
|||||||||||||||
| (dollars in thousands) | Amount | Ratio | Amount | Ratio | ||||||||||||
| December 31, 2014 |
||||||||||||||||
| Total (Tier II) capital to risk weighted assets: |
||||||||||||||||
| Corporation |
$ | 217,371 | 12.86 | % | $ | 169,071 | 10 | % | ||||||||
| Bank |
$ | 207,680 | 12.32 | % | $ | 168,557 | 10 | % | ||||||||
| Tier I capital to risk weighted assets: |
||||||||||||||||
| Corporation |
$ | 202,734 | 11.99 | % | $ | 101,442 | 6 | % | ||||||||
| Bank |
$ | 193,043 | 11.45 | % | $ | 101,134 | 6 | % | ||||||||
| Tier I capital to average assets: |
||||||||||||||||
| Corporation |
$ | 202,734 | 9.54 | % | $ | 106,306 | 5 | % | ||||||||
| Bank |
$ | 193,043 | 9.09 | % | $ | 106,173 | 5 | % | ||||||||
| December 31, 2013 |
||||||||||||||||
| Total (Tier II) capital to risk weighted assets: |
||||||||||||||||
| Corporation |
$ | 200,667 | 12.55 | % | $ | 159,924 | 10 | % | ||||||||
| Bank |
$ | 197,463 | 12.38 | % | $ | 159,493 | 10 | % | ||||||||
| Tier I capital to risk weighted assets: |
||||||||||||||||
| Corporation |
$ | 185,022 | 11.57 | % | $ | 95,954 | 6 | % | ||||||||
| Bank |
$ | 181,818 | 11.40 | % | $ | 95,696 | 6 | % | ||||||||
| Tier I capital to average assets: |
||||||||||||||||
| Corporation |
$ | 185,022 | 9.29 | % | $ | 99,543 | 5 | % | ||||||||
| Bank |
$ | 181,818 | 9.14 | % | $ | 99,424 | 5 | % | ||||||||
116
Table of Contents
Note 26 – Selected Quarterly Financial Data (Unaudited)
| 2014 | ||||||||||||||||
| (dollars in thousands, except per share data) | 1st Quarter | 2nd Quarter | 3rd Quarter | 4th Quarter | ||||||||||||
| Interest income |
$ | 20,161 | $ | 20,941 | $ | 20,749 | $ | 21,055 | ||||||||
| Interest expense |
1,438 | 1,499 | 1,573 | 1,568 | ||||||||||||
|
|
|
|
|
|
|
|
|
|||||||||
| Net interest income |
18,723 | 19,442 | 19,176 | 19,487 | ||||||||||||
| Provision for loan and lease losses |
750 | (100 | ) | 550 | (316 | ) | ||||||||||
| Other income |
11,139 | 12,757 | 11,543 | 12,883 | ||||||||||||
| Other expense |
18,899 | 20,626 | 19,961 | 21,932 | ||||||||||||
|
|
|
|
|
|
|
|
|
|||||||||
| Income before income taxes |
10,213 | 11,673 | 10,208 | 10,754 | ||||||||||||
| Tax expense |
3,524 | 4,069 | 3,702 | 3,710 | ||||||||||||
|
|
|
|
|
|
|
|
|
|||||||||
| Net income |
$ | 6,689 | $ | 7,604 | $ | 6,506 | $ | 7,044 | ||||||||
|
|
|
|
|
|
|
|
|
|||||||||
| Basic earnings per common share* |
$ | 0.50 | $ | 0.56 | $ | 0.48 | $ | 0.52 | ||||||||
| Diluted earnings per common share* |
$ | 0.49 | $ | 0.55 | $ | 0.47 | $ | 0.51 | ||||||||
| Dividend declared |
$ | 0.18 | $ | 0.18 | $ | 0.19 | $ | 0.19 | ||||||||
| 2013 | ||||||||||||||||
| (dollars in thousands, except per share data) | 1st Quarter | 2nd Quarter | 3rd Quarter | 4th Quarter | ||||||||||||
| Interest income |
$ | 18,855 | $ | 19,217 | $ | 19,820 | $ | 20,525 | ||||||||
| Interest expense |
1,446 | 1,294 | 1,287 | 1,400 | ||||||||||||
|
|
|
|
|
|
|
|
|
|||||||||
| Net interest income |
17,409 | 17,923 | 18,533 | 19,125 | ||||||||||||
| Provision for loan and lease losses |
804 | 1,000 | 959 | 812 | ||||||||||||
| Other income |
11,790 | 12,943 | 11,387 | 12,235 | ||||||||||||
| Other expense |
20,235 | 20,524 | 19,323 | 20,658 | ||||||||||||
|
|
|
|
|
|
|
|
|
|||||||||
| Income before income taxes |
8,160 | 9,342 | 9,638 | 9,890 | ||||||||||||
| Tax expense |
2,840 | 3,090 | 3,237 | 3,419 | ||||||||||||
|
|
|
|
|
|
|
|
|
|||||||||
| Net income |
$ | 5,320 | $ | 6,252 | $ | 6,401 | $ | 6,471 | ||||||||
|
|
|
|
|
|
|
|
|
|||||||||
| Basic earnings per common share* |
$ | 0.40 | $ | 0.47 | $ | 0.48 | $ | 0.48 | ||||||||
| Diluted earnings per common share* |
$ | 0.40 | $ | 0.46 | $ | 0.47 | $ | 0.47 | ||||||||
| Dividend declared |
$ | 0.17 | $ | 0.17 | $ | 0.17 | $ | 0.18 | ||||||||
| * | Earnings per share is computed independently for each period shown. As a result, the sum of the quarters may not equal the total earnings per share for the year. |
Note 27 – Parent Company-Only Financial Statements
The condensed financial statements of the Corporation (parent company only) are presented below. These statements should be read in conjunction with the Notes to the Consolidated Financial Statements.
117
Table of Contents
A. Condensed Balance Sheets
| December 31, | ||||||||
| (dollars in thousands) | 2014 | 2013 | ||||||
| Assets: |
||||||||
| Cash |
$ | 5,269 | $ | 5,435 | ||||
| Investment securities |
420 | 401 | ||||||
| Investments in subsidiaries, as equity in net assets |
236,586 | 227,245 | ||||||
| Premises and equipment, net |
2,484 | 2,582 | ||||||
| Goodwill |
245 | 245 | ||||||
| Other assets |
1,791 | 2,164 | ||||||
|
|
|
|
|
|||||
| Total assets |
$ | 246,795 | $ | 238,072 | ||||
|
|
|
|
|
|||||
| Liabilities and shareholders’ equity: |
||||||||
| Borrowings |
$ | — | $ | 7,050 | ||||
| Other liabilities |
1,321 | 1,124 | ||||||
|
|
|
|
|
|||||
| Total liabilities |
$ | 1,321 | $ | 8,174 | ||||
|
|
|
|
|
|||||
| Common stock, par value $1, authorized 100,000,000 shares issued 16,742,135 shares and 16,596,869 shares as of December 31, 2014 and 2013, respectively, and outstanding 13,769,336 shares and 13,650,354 shares as of December 31, 2014 and 2013, respectively |
$ | 16,742 | $ | 16,597 | ||||
| Paid-in capital in excess of par value |
100,486 | 95,673 | ||||||
| Less common stock in treasury, at cost – 2,972,799 shares and 2,946,515 shares as of December 31, 2014 and 2013, respectively |
(31,642 | ) | (30,764 | ) | ||||
| Accumulated other comprehensive loss, net of deferred income taxes benefit |
(11,704 | ) | (5,565 | ) | ||||
| Retained earnings |
171,592 | 153,957 | ||||||
|
|
|
|
|
|||||
| Total shareholders’ equity |
$ | 245,474 | $ | 229,898 | ||||
|
|
|
|
|
|||||
| Total liabilities and shareholders’ equity |
$ | 246,795 | $ | 238,072 | ||||
|
|
|
|
|
|||||
B. Condensed Statements of Income
| Twelve Months Ended December 31, | ||||||||||||
| (dollars in thousands) | 2014 | 2013 | 2012 | |||||||||
| Dividends from subsidiaries |
$ | 12,160 | $ | 8,165 | $ | 13,075 | ||||||
| Interest and other income |
2,156 | 2,062 | 2,672 | |||||||||
|
|
|
|
|
|
|
|||||||
| Total operating income |
14,316 | 10,227 | 15,747 | |||||||||
| Expenses |
1,849 | 1,996 | 2,410 | |||||||||
|
|
|
|
|
|
|
|||||||
| Income before equity in undistributed income of subsidiaries |
12,467 | 8,231 | 13,337 | |||||||||
| Equity in undistributed income of subsidiaries |
15,480 | 16,236 | 7,761 | |||||||||
|
|
|
|
|
|
|
|||||||
| Income before income taxes |
27,947 | 24,467 | 21,098 | |||||||||
| Income tax expense (benefit) |
104 | 23 | (49 | ) | ||||||||
|
|
|
|
|
|
|
|||||||
| Net income |
$ | 27,843 | $ | 24,444 | $ | 21,147 | ||||||
|
|
|
|
|
|
|
|||||||
118
Table of Contents
C. Condensed Statements of Cash Flows
| Twelve Months Ended December 31, | ||||||||||||
| (dollars in thousands) | 2014 | 2013 | 2012 | |||||||||
| Operating activities: |
||||||||||||
| Net Income |
$ | 27,843 | $ | 24,444 | $ | 21,147 | ||||||
| Adjustments to reconcile net income to net cash provided by operating activities: |
||||||||||||
| Equity in undistributed income of subsidiaries |
(15,480 | ) | (16,236 | ) | (7,761 | ) | ||||||
| Depreciation and amortization |
98 | 98 | 98 | |||||||||
| Net gain on sale of available for sale securities |
— | — | — | |||||||||
| Stock-based compensation cost |
1,256 | 1,004 | 1,283 | |||||||||
| Net accretion of fair value adjustments |
— | — | — | |||||||||
| Other, net |
485 | (1,138 | ) | (239 | ) | |||||||
|
|
|
|
|
|
|
|||||||
| Net cash provided by operating activities |
14,202 | 8,172 | 14,528 | |||||||||
|
|
|
|
|
|
|
|||||||
| Investing Activities: |
||||||||||||
| Proceeds from sale of available for sale securities |
— | — | — | |||||||||
| Acquisitions, net of cash acquired |
— | — | (9,278 | ) | ||||||||
| Sale of subsidiary |
— | — | 10,500 | |||||||||
| Investment in subsidiaries |
— | — | (4,800 | ) | ||||||||
|
|
|
|
|
|
|
|||||||
| Net cash used by investing activities |
— | — | (3,578 | ) | ||||||||
|
|
|
|
|
|
|
|||||||
| Financing activities: |
||||||||||||
| Dividends paid |
(10,189 | ) | (9,297 | ) | (8,529 | ) | ||||||
| Change in other borrowings |
(7,050 | ) | (2,350 | ) | (4,291 | ) | ||||||
| Proceeds from sale of treasury stock |
79 | 1,317 | 317 | |||||||||
| Repurchase of treasury stock |
(947 | ) | (553 | ) | — | |||||||
| Proceeds from issuance of common stock |
72 | 176 | 2,118 | |||||||||
| Payment of contingent consideration for business combinations |
— | (2,100 | ) | (1,050 | ) | |||||||
| Excess tax benefit from stock-based compensation |
831 | 708 | 112 | |||||||||
| Proceeds from exercise of stock options |
2,836 | 3,970 | 1,363 | |||||||||
|
|
|
|
|
|
|
|||||||
| Net cash used by financing activities |
(14,368 | ) | (8,129 | ) | (9,960 | ) | ||||||
|
|
|
|
|
|
|
|||||||
| Change in cash and cash equivalents |
(166 | ) | 43 | 990 | ||||||||
| Cash and cash equivalents at beginning of year |
5,435 | 5,392 | 4,402 | |||||||||
|
|
|
|
|
|
|
|||||||
| Cash and cash equivalents at end of year |
$ | 5,269 | $ | 5,435 | $ | 5,392 | ||||||
|
|
|
|
|
|
|
|||||||
Note 28 – Segment Information
FASB Codification 280 – “Segment Reporting” identifies operating segments as components of an enterprise which are evaluated regularly by the Corporation’s Chief Operating Decision Maker, our Chief Executive Officer, in deciding how to allocate resources and assess performance. The Corporation has applied the aggregation criterion set forth in this codification to the results of its operations.
The Corporation’s Banking segment consists of commercial and retail banking. The Banking segment is evaluated as a single strategic unit which generates revenues from a variety of products and services. The Banking segment generates interest income from its lending (including leases) and investing activities and is dependent on the gathering of lower cost deposits from its branch network or borrowed funds from other sources for funding its loans, resulting in the generation of net interest income. The Banking segment also derives revenues from other sources including gains on the sale in available for sale investment securities, gains on the sale of residential mortgage loans, service charges on deposit accounts, cash sweep fees, overdraft fees, BOLI income and interchange revenue associated with its Visa Check Card offering.
119
Table of Contents
The Wealth Management segment has responsibility for a number of activities within the Corporation, including trust administration, other related fiduciary services, custody, investment management and advisory services, employee benefits and IRA administration, estate settlement, tax services and brokerage. Bryn Mawr Trust of Delaware and Lau Associates are included in the Wealth Management segment of the Corporation since they have similar economic characteristics, products and services to those of the Wealth Management Division of the Corporation. In addition, with the October 1, 2014 acquisition of PCPB, which was merged with the Corporation’s existing insurance subsidiary, Insurance Counsellors of Bryn Mawr (“ICBM”), and now operates under the Powers Craft Parker and Beard, Inc. name, the Wealth Management Division has assumed responsibility for all insurance services of the Corporation. Prior to the PCPB acquisition, ICBM was reported through the Banking segment. Any adjustments to prior year figures are immaterial and are not reflected in the table below.
The accounting policies of the Corporation are applied by segment in the following tables. The segments are presented on a pre-tax basis.
120
Table of Contents
The following table details the Corporation’s segments:
| As of or for the Twelve Months Ended December 31, | ||||||||||||||||||||||||||||||||||||
| 2014 | 2013 | 2012 | ||||||||||||||||||||||||||||||||||
| (dollars in thousands) | Banking | Wealth Management |
Consolidated | Banking | Wealth Management |
Consolidated | Banking | Wealth Management |
Consolidated | |||||||||||||||||||||||||||
| Net interest income |
$ | 76,825 | $ | 3 | $ | 76,828 | $ | 72,987 | $ | 3 | $ | 72,990 | $ | 64,731 | $ | 4 | $ | 64,735 | ||||||||||||||||||
| Less: loan loss provision |
884 | — | 884 | 3,575 | — | 3,575 | 4,003 | — | 4,003 | |||||||||||||||||||||||||||
|
|
|
|
|
|
|
|
|
|
|
|
|
|
|
|
|
|
|
|||||||||||||||||||
| Net interest income after loan loss provision |
75,941 | 3 | 75,944 | 69,412 | 3 | 69,415 | 60,728 | 4 | 60,732 | |||||||||||||||||||||||||||
|
|
|
|
|
|
|
|
|
|
|
|
|
|
|
|
|
|
|
|||||||||||||||||||
| Other income: |
||||||||||||||||||||||||||||||||||||
| Fees for wealth management services |
— | 36,774 | 36,774 | — | 35,184 | 35,184 | — | 29,798 | 29,798 | |||||||||||||||||||||||||||
| Service charges on deposit accounts |
2,578 | — | 2,578 | 2,445 | — | 2,445 | 2,477 | — | 2,477 | |||||||||||||||||||||||||||
| Loan servicing and other fees |
1,755 | — | 1,755 | 1,845 | — | 1,845 | 1,776 | — | 1,776 | |||||||||||||||||||||||||||
| Net gain on sale of loans |
1,772 | — | 1,772 | 4,117 | — | 4,117 | 6,735 | — | 6,735 | |||||||||||||||||||||||||||
| Net gain (loss) on sale of available for sale securities |
471 | — | 471 | (8 | ) | — | (8 | ) | 1,415 | — | 1,415 | |||||||||||||||||||||||||
| Net gain (loss) on sale of other real estate owned |
175 | — | 175 | (300 | ) | — | (300 | ) | (86 | ) | — | (86 | ) | |||||||||||||||||||||||
| BOLI income |
315 | — | 315 | 358 | — | 358 | 428 | — | 428 | |||||||||||||||||||||||||||
| Insurance commissions |
— | 1,210 | 1,210 | 651 | — | 651 | 444 | — | 444 | |||||||||||||||||||||||||||
| Other operating income |
3,104 | 168 | 3,272 | 3,895 | 168 | 4,063 | 3,293 | 106 | 3,399 | |||||||||||||||||||||||||||
|
|
|
|
|
|
|
|
|
|
|
|
|
|
|
|
|
|
|
|||||||||||||||||||
| Total other income |
10,170 | 38,152 | 48,322 | 13,003 | 35,352 | 48,355 | 16,482 | 29,904 | 46,386 | |||||||||||||||||||||||||||
| Other expenses: |
||||||||||||||||||||||||||||||||||||
| Salaries & wages |
24,612 | 12,501 | 37,113 | 24,210 | 12,136 | 36,346 | 22,248 | 10,883 | 33,131 | |||||||||||||||||||||||||||
| Employee benefits |
4,306 | 3,034 | 7,340 | 5,942 | 2,890 | 8,832 | 5,660 | 2,467 | 8,127 | |||||||||||||||||||||||||||
| Occupancy and bank premises |
5,753 | 1,552 | 7,305 | 5,357 | 1,505 | 6,862 | 4,619 | 1,255 | 5,874 | |||||||||||||||||||||||||||
| Amortization of other intangible assets |
276 | 2,383 | 2,659 | 312 | 2,321 | 2,633 | 294 | 2,117 | 2,411 | |||||||||||||||||||||||||||
| Professional fees |
2,923 | 94 | 3,017 | 2,246 | 210 | 2,456 | 2,665 | 203 | 2,868 | |||||||||||||||||||||||||||
| Other operating expenses |
20,457 | 3,527 | 23,984 | 20,080 | 3,531 | 23,611 | 19,290 | 3,200 | 22,490 | |||||||||||||||||||||||||||
|
|
|
|
|
|
|
|
|
|
|
|
|
|
|
|
|
|
|
|||||||||||||||||||
| Total other expenses |
58,327 | 23,091 | 81,418 | 58,147 | 22,593 | 80,740 | 54,776 | 20,125 | 74,901 | |||||||||||||||||||||||||||
|
|
|
|
|
|
|
|
|
|
|
|
|
|
|
|
|
|
|
|||||||||||||||||||
| Segment profit |
27,784 | 15,064 | 42,848 | 24,268 | 12,762 | 37,030 | 22,434 | 9,783 | 32,217 | |||||||||||||||||||||||||||
| Intersegment (revenues) expenses* |
(372 | ) | 372 | — | (372 | ) | 372 | — | (484 | ) | 484 | — | ||||||||||||||||||||||||
|
|
|
|
|
|
|
|
|
|
|
|
|
|
|
|
|
|
|
|||||||||||||||||||
| Pre-tax segment profit after eliminations |
$ | 27,412 | $ | 15,436 | $ | 42,848 | $ | 23,896 | $ | 13,134 | $ | 37,030 | $ | 21,950 | $ | 10,267 | $ | 32,217 | ||||||||||||||||||
|
|
|
|
|
|
|
|
|
|
|
|
|
|
|
|
|
|
|
|||||||||||||||||||
| % of segment pre-tax profit after eliminations |
64.0 | % | 36.0 | % | 100.0 | % | 64.5 | % | 35.5 | % | 100.0 | % | 68.1 | % | 31.9 | % | 100.0 | % | ||||||||||||||||||
|
|
|
|
|
|
|
|
|
|
|
|
|
|
|
|
|
|
|
|||||||||||||||||||
| Segment assets (dollars in millions) |
$ | 2,197.8 | $ | 48.7 | $ | 2,246.5 | $ | 2,020.7 | $ | 41.0 | $ | 2,061.7 | $ | 1,990.9 | $ | 45.0 | $ | 2,035.9 | ||||||||||||||||||
|
|
|
|
|
|
|
|
|
|
|
|
|
|
|
|
|
|
|
|||||||||||||||||||
| * | Intersegment revenues consist of rental payments, deposit interest and management fees. |
121
Table of Contents
Other segment information:
Wealth Management Segment Information
| (dollars in millions) | ||||||||
| December 31, 2014 |
December 31, 2013 |
|||||||
| Assets under management, administration, supervision and brokerage |
$ | 7,699.9 | $ | 7,268.3 | ||||
Note 29 – Subsequent Events
On January 1, 2015, the previously announced merger (the “Merger”) of Continental Bank Holdings, Inc. (“CBH”) with and into the Corporation, and the merger of Continental Bank with and into the Bank, as contemplated by the Agreement and Plan of Merger, by and between CBH and the Corporation, dated as of May 5, 2014 (as amended by the Amendment to Agreement and Plan of Merger, dated as of October 23, 2014, the “Agreement”), were completed. In accordance with the Agreement, the aggregate share consideration paid to CBH shareholders consisted of 3,878,383 shares of the Corporation’s common stock. Shareholders of CBH received 0.45 shares of Corporation common stock for each share of CBH common stock they owned as of the effective date of the Merger. In addition, $1,323,000 was paid to certain warrant holders to cash-out certain warrants.
In connection with the Merger, the consideration paid and the estimated fair value of identifiable assets acquired and liabilities assumed as of the date of the Merger are summarized in the following table:
| (dollars in thousands) | ||||
| Consideration paid: |
||||
| Common shares issued (3,878,304) |
$ | 121,391 | ||
| Cash in lieu of fractional shares |
2 | |||
| Cash-out of certain warrants |
1,323 | |||
| Fair value of options assumed |
2,343 | |||
|
|
|
|||
| Value of consideration |
125,059 | |||
| Assets acquired: |
||||
| Cash and due from banks |
17,985 | |||
| Investment securities available for sale |
181,838 | |||
| Loans |
427,332 | |||
| Premises and equipment |
10,877 | |||
| Deferred income taxes |
5,750 | |||
| Bank-owned life insurance |
12,054 | |||
| Core deposit intangible |
4,191 | |||
| Other assets |
18,042 | |||
|
|
|
|||
| Total assets |
678,069 | |||
| Liabilities assumed: |
||||
| Deposits |
481,674 | |||
| FHLB and other long-term borrowings |
19,726 | |||
| Short-term borrowings |
108,609 | |||
| Other liabilities |
4,556 | |||
|
|
|
|||
| Total liabilities |
614,565 | |||
| Net assets acquired |
63,504 | |||
|
|
|
|||
| Goodwill resulting from acquisition of CBH |
$ | 61,555 | ||
|
|
|
|||
The fair values of the assets acquired and liabilities assumed are preliminary estimates.
122
Table of Contents
Management’s Report on Internal Control Over Financial Reporting
The Corporation is responsible for the preparation, integrity, and fair presentation of the consolidated financial statements included in this Annual Report on Form 10-K. The consolidated financial statements and notes included in this Annual Report on Form 10-K have been prepared in conformity with United States generally accepted accounting principles and necessarily include some amounts that are based on Management’s best estimates and judgments.
The Corporation’s Management is responsible for establishing and maintaining effective internal control over financial reporting that is designed to produce reliable financial statements in conformity with United States generally accepted accounting principles. Internal control over financial reporting includes those policies and procedures that pertain to the maintenance of records that in reasonable detail accurately and fairly reflect the transactions and dispositions of the assets of the Corporation; provide reasonable assurance that the transactions are recorded as necessary to permit preparation of financial statements in accordance with generally accepted accounting principles; provide a reasonable assurance that receipts and expenditures of the Corporation are only being made in accordance with authorizations of Management and directors of the Corporation; and provide a reasonable assurance regarding prevention or timely detection of unauthorized acquisition, use, or disposition of the Corporation’s assets that could have a material effect on the financial statements. The system of internal control over financial reporting as it relates to the financial statements is evaluated for effectiveness by Management and tested for reliability through a program of internal audits. Actions are taken to correct potential deficiencies as they are noted.
Any system of internal control, no matter how well designed, has inherent limitations, including the possibility that a control can be circumvented or overridden and misstatements due to error or fraud may occur and not be detected. Also, because of changes in conditions, internal control effectiveness may vary over time. Accordingly, even an effective system of internal control will provide only reasonable assurance with respect to financial statement preparation.
The Corporation’s management is responsible for establishing and maintaining adequate internal control over financial reporting, as such term is defined in Exchange Act Rule 13a-15(f). Management, including the Corporation’s Chief Executive Officer and Chief Financial Officer, assessed the Corporation’s system of internal control over financial reporting as of December 31, 2014, in relation to the criteria for effective control over financial reporting as described in “Internal Control – Integrated Framework,” issued by the Committee of Sponsoring Organizations of the Treadway Commission. Based on this assessment, Management concludes that, as of December 31, 2014, the Corporation’s system of internal control over financial reporting is effective.
KPMG, LLP, which is the independent registered public accounting firm that audited the financial statements in this Annual Report on Form 10-K, has issued an attestation report on the Corporation’s internal control over financial reporting which can be found below.
123
Table of Contents
| ITEM 9. | CHANGE IN AND DISAGREEMENTS WITH ACCOUNTANTS ON ACCOUNTING AND FINANCIAL DISCLOSURE |
None.
| ITEM 9A. | CONTROLS AND PROCEDURES |
| • | Evaluation of Disclosure Controls and Procedures |
The Corporation carried out an evaluation, under the supervision and with the participation of the Corporation’s management, including the Corporation’s Chief Executive Officer, Francis J. Leto, and Chief Financial Officer, J. Duncan Smith, CPA, of the effectiveness of the Corporation’s disclosure controls and procedures (as such term is defined in Rules 13a-15(e) and 15d-15(e) under the Exchange Act) as of December 31, 2014 pursuant to Exchange Act Rule 13a-15. Based upon that evaluation, the Chief Executive Officer and Chief Financial Officer concluded that the Corporation’s disclosure controls and procedures as of December 31, 2014 are effective.
| • | Changes in Internal Control over Financial Reporting |
There were no changes in the Corporation’s internal control over financial reporting during the fourth quarter of 2014 that have materially affected, or are reasonably likely to materially affect, the Corporation’s internal control over financial reporting.
| • | Design and Evaluation of Internal Control Over Financial Reporting |
Pursuant to Section 404 of Sarbanes-Oxley, the following is a report of management’s assessment of the design and effectiveness of our internal controls for the fiscal year ended December 31, 2014, and a report from our independent registered public accounting firm attesting to the effectiveness of our internal controls:
Report of Independent Registered Public Accounting Firm
The Board of Directors and Stockholders
Bryn Mawr Bank Corporation:
We have audited Bryn Mawr Bank Corporation and subsidiaries (the “Corporation”) internal control over financial reporting as of December 31, 2014, based on criteria established in Internal Control – Integrated Framework (1992) issued by the Committee of Sponsoring Organizations of the Treadway Commission (COSO). The Corporation’s management is responsible for maintaining effective internal control over financial reporting and for its assessment of the effectiveness of internal control over financial reporting, included in the accompanying Management’s Report on Internal Control over Financial Reporting. Our responsibility is to express an opinion on the Company’s internal control over financial reporting based on our audit.
We conducted our audit in accordance with the standards of the Public Company Accounting Oversight Board (United States). Those standards require that we plan and perform the audit to obtain reasonable assurance about whether effective internal control over financial reporting was maintained in all material respects. Our audit included obtaining an understanding of internal control over financial reporting, assessing the risk that a material weakness exists, and testing and evaluating the design and operating effectiveness of internal control based on the assessed risk. Our audit also included performing such other procedures as we considered necessary in the circumstances. We believe that our audit provides a reasonable basis for our opinion.
124
Table of Contents
A company’s internal control over financial reporting is a process designed to provide reasonable assurance regarding the reliability of financial reporting and the preparation of financial statements for external purposes in accordance with generally accepted accounting principles. A company’s internal control over financial reporting includes those policies and procedures that (1) pertain to the maintenance of records that, in reasonable detail, accurately and fairly reflect the transactions and dispositions of the assets of the company; (2) provide reasonable assurance that transactions are recorded as necessary to permit preparation of financial statements in accordance with generally accepted accounting principles, and that receipts and expenditures of the company are being made only in accordance with authorizations of management and directors of the company; and (3) provide reasonable assurance regarding prevention or timely detection of unauthorized acquisition, use, or disposition of the company’s assets that could have a material effect on the financial statements.
Because of its inherent limitations, internal control over financial reporting may not prevent or detect misstatements. Also, projections of any evaluation of effectiveness to future periods are subject to the risk that controls may become inadequate because of changes in conditions, or that the degree of compliance with the policies or procedures may deteriorate.
In our opinion, the Corporation maintained, in all material respects, effective internal control over financial reporting as of December 31, 2014, based on criteria established in Internal Control – Integrated Framework (1992) issued by the Committee of Sponsoring Organizations of the Treadway Commission (COSO).
We also have audited, in accordance with the standards of the Public Company Accounting Oversight Board (United States), the consolidated balance sheets of the Corporation as of December 31, 2014 and 2013, and the related consolidated statements of income, comprehensive income, cash flows, and changes in shareholders’ equity for each of the years in the three-year period ended December 31, 2014, and our report dated March 12, 2015 expressed an unqualified opinion on those consolidated financial statements.
Philadelphia, Pennsylvania
March 12, 2015
| ITEM 9B. | OTHER INFORMATION |
None.
125
Table of Contents
PART III
| ITEM 10. | DIRECTORS, EXECUTIVE OFFICERS AND CORPORATE GOVERNANCE |
The information required for Item 10 is incorporated by reference to the sections titled “Our Board of Directors,” “Information About our Directors,” “Information About our Executive Officers,” “Corporate Governance,” “Audit Committee Report” and “Section 16(a) Beneficial Ownership Reporting Compliance” in the 2015 Proxy Statement.
| ITEM 11. | EXECUTIVE COMPENSATION |
The information required for Item 11 is incorporated by reference to section titled “Director Compensation,” “Compensation Discussion and Analysis,” “Executive Compensation,” “Compensation Committee Report” and “Compensation Committee Interlocks and Insider Participation” in the 2015 Proxy Statement.
| ITEM 12. | SECURITY OWNERSHIP OF CERTAIN BENEFICIAL OWNERS AND MANAGEMENT |
The information required for Item 12 is incorporated by reference to the section titled “Security Ownership of Certain Beneficial Owners and Management” and “Equity Compensation Plan Information” in the 2015 Proxy Statement.
| ITEM 13. | CERTAIN RELATIONSHIPS AND RELATED TRANSACTIONS |
The information required for Item 13 is incorporated by reference to sections titled “Transactions with Related Persons” and “Corporate Governance – Director Independence” in the 2015 Proxy Statement.
| ITEM 14. | PRINCIPAL ACCOUNTING FEES AND SERVICES |
The information required for Item 14 is incorporated by reference to the sections “Independent Registered Public Accounting Firm” and “Audit and Non-Audit Fees” in the 2015 Proxy Statement.
126
Table of Contents
PART IV
| ITEM 15. | EXHIBITS AND FINANCIAL STATEMENT SCHEDULES |
Item 15(a) (1 & 2) Financial Statements and Schedules
The financial statements listed in the accompanying index to financial statements are filed as part of this Annual Report.
| Page | ||||
| 61 | ||||
| 62 | ||||
| 63 | ||||
| 64 | ||||
| 65 | ||||
| 66 | ||||
| 67 | ||||
Item 15(a) (3) and (b) – Exhibits
| Exhibit No. |
Description and References | |
| 2.1 | Stock Purchase Agreement, dated as of February 18, 2011, by and between Bryn Mawr Bank Corporation and Hershey Trust Company, incorporated by reference to Exhibit 2.1 of the Corporation’s 8-K filed with SEC on February 18, 2011 | |
| 2.2 | Amendment to Stock Purchase Agreement, dated as of May 27, 2011, by and between Hershey Trust Company and Bryn Mawr Bank Corporation, incorporated by reference to Exhibit 2.2 of the Corporation’s 8-K filed with the SEC on May 27, 2011 | |
| 2.3 | Assignment and Assumption Agreement, dated as of May 27, 2011, by and between Hershey Trust Company and PWMG Bank Holding Company Trust, incorporated by reference to Exhibit 2.3 of the Corporation’s 8-K filed with the SEC on May 27, 2011 | |
| 2.4 | Stock Purchase Agreement, dated as of February 3, 2012, by and among Bryn Mawr Bank Corporation, Davidson Trust Company, Boston Private (PA) Corporation, Bruce K. Bauder, Ernest E. Cecilia, Joseph J. Costigan, William S. Covert, James M. Davidson, Steven R. Klammer, N. Ray Sague, Malcolm C. Wilson, Boston Private Financial Holdings, Inc., and Alvin A. Clay III, incorporated by reference to Exhibit 2.1 of the Corporation’s 8-K filed with the SEC on February 7, 2012 | |
| 2.5 | Purchase and Assumption Agreement, dated as of April 27, 2012, by and between The Bryn Mawr Trust Company and First Bank of Delaware, incorporated by reference to Exhibit 2.1 of the Corporation’s 8-K filed with the SEC on May 2, 2012 | |
| 2.6 | Amendment to Stock Purchase Agreement, dates as of May 15, 2012, by and among Bryn Mawr Bank Corporation, Davidson Trust Company, Boston Private (PA) Corporation, Bruce K. Bauder, Ernest E. Cecilia, Joseph J. Costigan, William S. Covert, James M. Davidson, Steven R. Klammer, N. Ray Sague, Malcolm C. Wilson, Boston Private Financial Holdings, Inc., and Alvin A. Clay III, incorporated by reference to Exhibit 2.1 of the Corporation’s 8-K filed with the SEC on May 18, 2012 | |
| 2.7 | Amendment to Purchase and Assumption Agreement, dated as of October 12, 2012, by and between The Bryn Mawr Trust Company and First Bank of Delaware, incorporated by reference to Exhibit 2.1 of the Corporation’s 8-K filed with the SEC on October 18, 2012 | |
| 2.8 | Amendment to Purchase and Assumption Agreement, dated as of November 14, 2012, by and between The Bryn Mawr Trust Company and First Bank of Delaware, incorporated by reference to Exhibit 2.1 of the Corporation’s 8-K filed with the SEC on November 19, 2012 | |
127
Table of Contents
| Exhibit No. |
Description and References | |
| 2.9 | Agreement and Plan of Merger, dated as of March 27, 2013, by and between Bryn Mawr Bank Corporation and MidCoast Community Bancorp, Inc., incorporated by reference to Exhibit 2.1 of the Corporation’s Form 8-K filed with the SEC on March 29, 2013 | |
| 2.10 | Agreement and Plan of Merger, dated as of May 5, 2014, by and between Bryn Mawr Bank Corporation and Continental Bank Holdings, Inc., incorporated by reference to Exhibit 2.1 to the Corporation’s Form 8-K filed with the SEC on May 5, 2014 | |
| 2.11 | Amendment to Agreement and Plan of Merger, dated as of October 23, 2014, between Bryn Mawr Bank Corporation and Continental Bank Holdings, Inc., incorporated by reference to Exhibit 2.1 to the Corporation’s Form 8-K filed with the SEC on October 23, 2014 | |
| 2.12 | Stock Purchase Agreement, dated as of August 21, 2014, by and among The Bryn Mawr Trust Company, Donald W. Parker, Edward F. Lee, and Powers Craft Parker & Beard, Inc., incorporated by reference to Exhibit 2.1 to the Corporation’s Form 10-Q filed with the SEC on November 7, 2014 | |
| 2.13 | Amendment to Stock Purchase Agreement, dated as of October 1, 2014, by and among The Bryn Mawr Trust Company, Donald W. Parker, Edward F. Lee, and Powers Craft Parker and Beard, Inc., incorporated by reference to Exhibit 2.1 to the Corporation’s Form 8-K filed with the SEC on October 3, 2014 | |
| 3.1 | Amended and Restated By-Laws, effective November 20, 2007, incorporated by reference to Exhibit 3.2 of the Corporation’s Form 8-K filed with the SEC on November 21, 2007 | |
| 3.2 | Amended and Restated Articles of Incorporation, effective November 21, 2007, incorporated by reference to Exhibit 3.1 of the Corporation’s Form 8-K filed with the SEC on November 21, 2007 | |
| 4.1 | Amended and Restated By-Laws, effective November 20, 2007, incorporated by reference to Exhibit 3.2 of the Corporation’s Form 8-K filed with the SEC on November 21, 2007 | |
| 4.2 | Amended and Restated Articles of Incorporation, effective November 21, 2007, incorporated by reference to Exhibit 3.1 of the Corporation’s Form 8-K filed with the SEC on November 21, 2007 | |
| 4.3 | Subordinated Note Purchase Agreement dated July 30, 2008, incorporated by reference to Exhibit 4.4 of the Corporation’s 10-Q filed with SEC on November 10, 2008 | |
| 4.4 | Subordinated Note Purchase Agreement dated August 28, 2008, incorporated by reference to Exhibit 4.5 of the Corporation’s 10-Q filed with the SEC on November 10, 2008 | |
| 4.5 | Subordinated Note Purchase Agreement dated April 20, 2009, incorporated by reference to Exhibit 4.6 of the Corporation’s 10-Q filed with the SEC on August 7, 2009 | |
| 4.6 | Shareholder Rights Agreement, dated as of November 16, 2012, between Bryn Mawr Bank Corporation and Computershare Shareowner Services LLC, as Rights Agent, incorporated by reference to Exhibit 4.1 of the Corporation’s 8-K filed with the SEC on November 16, 2012 | |
| 10.1* | Amended and Restated Supplemental Employee Retirement Plan of the Bryn Mawr Bank Corporation, effective January 1, 1999, incorporated by reference to Exhibit 10.1 of the Corporation’s Form 10-K filed with the SEC on March 13, 2008 | |
| 10.2** | Form of Restricted Stock Agreement for Employees (Service/Performance Based) Subject to the 2010 Long Term Incentive Plan, incorporated by reference to Exhibit 10.3 of the Corporation’s Form 10-K filed with the SEC on March 16, 2011 | |
| 10.3* | Amended and Restated Deferred Bonus Plan for Executives of Bryn Mawr Bank Corporation, effective January 1, 2008 incorporated by reference to Exhibit 10.4 of the Corporation’s Form 10-K filed with the SEC on March 16, 2009 | |
128
Table of Contents
| Exhibit No. |
Description and References | |
| 10.4* | Amended and Restated Deferred Payment Plan for Directors of Bryn Mawr Bank Corporation, effective January 1, 2008 incorporated by reference to Exhibit 10.5 of the Corporation’s Form 10-K filed with the SEC on March 16, 2009 | |
| 10.5* | Amended and Restated Deferred Payment Plan for Directors of Bryn Mawr Trust Company, effective January 1, 2008 incorporated by reference to Exhibit 10.6 of the Corporation’s Form 10-K filed with the SEC on March 16, 2009 | |
| 10.6* | Employment Letter Agreement, dated as of April 25, 2014, between the Corporation and Francis J. Leto, incorporated by reference to Exhibit 10.1 to the Corporation’s Form 8-K filed with the SEC on April 25, 2014 | |
| 10.7* | Amendment to 2012 Restricted Stock Agreement, dated August 20, 2014, between Bryn Mawr Bank Corporation and Fredrick C. Peters, II, incorporated by reference to Exhibit 10.1 to the Corporation’s Form 8-K filed with the SEC on August 21, 2014 | |
| 10.8* | Amendment to 2013 Restricted Stock Unit Agreement, dated August 20, 2014, between Bryn Mawr Bank Corporation and Fredrick C. Peters, II, incorporated by reference to Exhibit 10.2 to the Corporation’s Form 8-K filed with the SEC on August 21, 2014 | |
| 10.9** | Bryn Mawr Bank Corporation 2004 Stock Option Plan, incorporated by reference to Appendix A of the Corporation’s Proxy Statement dated March 10, 2004 filed with the SEC on March 8, 2004 | |
| 10.10* | Executive Change-of-Control Amended and Restated Severance Agreement, dated May 21, 2004, between the Bryn Mawr Trust Company and Alison E. Gers, incorporated by reference to Exhibit 10.M of the Corporation’s Form 10-K filed with the SEC on March 15, 2007 | |
| 10.11* | Executive Change-of-Control Amended and Restated Severance Agreement, dated May 21, 2004, between the Bryn Mawr Trust Company and Joseph G. Keefer, incorporated by reference to Exhibit 10.N of the Corporation’s Form 10-K filed with the SEC on March 15, 2007 | |
| 10.12* | Executive Severance and Change of Control Agreement, dated April 4, 2005, between the Bryn Mawr Trust Company and J. Duncan Smith, incorporated by reference to Exhibit 10.1 of the Corporation’s Form 8-K filed with the SEC on April 6, 2005 | |
| 10.13** | Form of Key Employee Non-Qualified Stock Option Agreement, incorporated by reference to Exhibit 10.3 of the Corporation’s Form 10-Q filed with the SEC on May 10, 2005 | |
| 10.14** | Form of Non-Qualified Stock Option Agreement for Non-Employee Directors, incorporated by reference to Exhibit 10.2 of the Corporation’s Form 10-Q filed with the SEC on May 10, 2005 | |
| 10.15** | Form of Restricted Stock Unit Agreement for Employees (Service/Performance Based) – Multi-Year Vesting, incorporated by reference to Exhibit 10.1 to the Corporation’s Form 8-K filed with the SEC on September 17, 2014 | |
| 10.16** | 2007 Long Term Incentive Plan, effective April 25, 2007, incorporated by reference to Exhibit 10.1 of the Corporation’s Form 10-Q filed with the SEC May 10, 2007 | |
| 10.17** | Bryn Mawr Bank Corporation Supplemental Employee Retirement Plan for Select Executives, executed December 8, 2008, incorporated by reference to Exhibit 10.20 of the Corporation’s Form 10-K filed with the SEC on March 16, 2009 | |
| 10.18 | Form of Director Letter Agreement, incorporated by reference to Exhibit 10.2 to the Corporation’s Form 10-Q filed with the SEC on August 8, 2014 | |
| 10.19* | Executive Change-of-Control Amended and Restated Severance Agreement, dated November 2, 2009, between the Bryn Mawr Trust Company and Francis J. Leto, incorporated by reference to Exhibit 10.1 of the Corporation’s 8-K filed with the SEC on November 6, 2009 | |
129
Table of Contents
| Exhibit No. |
Description and References | |
| 10.20** | Bryn Mawr Bank Corporation Amended and Restated Dividend Reinvestment and Stock Purchase Plan with Request for Waiver Program, effective April 27, 2012, incorporated by reference to the prospectus supplement filed with the SEC on April 27, 2012 pursuant to Rule 424(b)(2) of the Securities Act | |
| 10.21** | Bryn Mawr Bank Corporation 2010 Long-Term Incentive Plan, effective April 28, 2010, incorporated by reference to Exhibit 10.24 of the Corporation’s Form 10-Q filed with the SEC on May 10, 2010 | |
| 10.22* | Amended and Restated Transition, Consulting, Noncompetition and Retirement Agreement, dated November 25, 2008, by and among First Keystone Financial, Inc., First Keystone Bank and Donald S. Guthrie, as assumed by Bryn Mawr Bank Corporation and The Bryn Mawr Trust Company as of July 1, 2010, incorporated by reference to Exhibit 10.1 of the Corporation’s Form 8-K filed with the SEC on July 1, 2010 | |
| 10.23** | First Keystone Financial, Inc. Amended and Restated 1998 Stock Option Plan, as assumed by Bryn Mawr Bank Corporation, incorporated by reference to Exhibit 10.1 of the Corporation’s Post-Effective Amendment No. 1 to Form S-4 on Form S-3, filed with the SEC on July 9, 2010 | |
| 10.24* | Executive Change-of-Control Amended and Restated Severance Agreement, dated September 27, 2010, between the Bryn Mawr Trust Company and Geoffrey L. Halberstadt, incorporated by reference to Exhibit 10.29 of the Corporation’s Form 10-K filed with the SEC on March 16, 2011 | |
| 10.25** | Restricted Stock Agreement for Employees (Service/Performance Based) Subject to the 2010 Long Term Incentive Plan, dated as of January 10, 2011, for Francis J. Leto, incorporated by reference to Exhibit 10.30 of the Corporation’s Form 10-K filed with the SEC on March 16, 2011 | |
| 10.26 | Amendment No. 2 to Stock Purchase Agreement by and between PWMG Bank Holding Company Trust and Bryn Mawr Bank Corporation dated September 29, 2011, filed with the SEC on Form 8-K on October 4, 2011 | |
| 10.27** | Form of Restricted Stock Agreement for Employees (Service/Performance Based) Subject to the 2010 Long Term Incentive Plan, incorporated by reference to Exhibit 10.32 of the Corporation’s Form 10-Q filed with the SEC on November 9, 2011 | |
| 10.28** | Form of Restricted Stock Agreement for Directors (Service/Performance Based) Subject to the 2010 Long Term Incentive Plan, incorporated by reference to Exhibit 10.33 of the Corporation’s Form 10-Q filed with the SEC on November 9, 2011 | |
| 10.29* | Amendment No. 1 to Amended and Restated Deferred Bonus Plan for Executives of Bryn Mawr Bank Corporation, effective as of January 1, 2013, incorporated by reference to Exhibit 10.29 of the Corporation’s Form 10-K filed with the SEC on March 15, 2013 | |
| 10.30* | Amendment No. 2 to Amended and Restated Deferred Bonus Plan for Executives of Bryn Mawr Bank Corporation, effective as of January 1, 2013, incorporated by reference to Exhibit 10.30 of the Corporation’s Form 10-K filed with the SEC on March 15, 2013 | |
| 10.31* | Form of Letter Agreement entered into with certain executive officers of the Corporation in connection with the curtailment of benefits under the Bryn Mawr Bank Corporation Supplemental Employee Retirement Plan for Select Executives, executed December 8, 2008 (SERP II), incorporated by reference to Exhibit 10.1 of the Corporation’s Form 8-K filed with the SEC on April 4, 2013 | |
| 10.32* | Bryn Mawr Bank Corporation Executive Deferred Compensation Plan, effective January 1, 2013, incorporated by reference to Exhibit 10.32 of the Corporation’s Form 10-K filed with the SEC on March 14, 2014 | |
130
Table of Contents
| Exhibit No. |
Description and References | |
| 10.33* | Retention Bonus Agreement, dated as of June 10, 2013, by and between The Bryn Mawr Trust Company and Francis J. Leto, incorporated by reference to Exhibit 10.1 of the Corporation’s Form 8-K filed with the SEC on June 14, 2013 | |
| 10.34 | Mutual Termination Agreement, dated as of August 8, 2013, by and between Bryn Mawr Bank Corporation and MidCoast Community Bancorp, Inc., incorporated by reference to Exhibit 10.1 of the Corporation’s Form 8-K filed with the SEC on August 9, 2013 | |
| 10.35** | Form of Restricted Stock Unit Agreement for Employees (Service/Performance Based), incorporated by reference to Exhibit 10.4 to the Corporation’s Form 10-Q filed with the SEC on November 7, 2014 | |
| 10.36** | Form of Restricted Stock Unit Agreement for Directors (Service/Performance Based), incorporated by reference to Exhibit 10.5 to the Corporation’s Form 10-Q filed with the SEC on November 7, 2014 | |
| 10.37** | Form of Restricted Stock Unit Agreement – Inducement Grant, incorporated by reference to Exhibit 10.6 to the Corporation’s Form 10-Q filed with the SEC on November 7, 2014 | |
| 21.1 | List of Subsidiaries, filed herewith | |
| 23.1 | Consent of KPMG LLP, filed herewith | |
| 31.1 | Certification of the Chief Executive Officer Pursuant to Section 302 of the Sarbanes-Oxley Act of 2002, filed herewith | |
| 31.2 | Certification of the Chief Financial Officer Pursuant to Section 302 of the Sarbanes-Oxley Act of 2002, filed herewith | |
| 32.1 | Certification of Chief Executive Officer Pursuant to 18 U.S.C. Section 1350, as Adopted Pursuant to Section 906 of the Sarbanes-Oxley Act of 2002, filed herewith | |
| 32.2 | Certification of Chief Financial Officer Pursuant to 18 U.S.C. Section 1350, as Adopted Pursuant to Section 906 of the Sarbanes-Oxley Act of 2002, filed herewith | |
| 99.1 | Corporation’s Proxy Statement for 2015 Annual Meeting to be held on April 30, 2015, expected to be filed with the SEC on or about March 19, 2015, and incorporated herein by reference | |
| 101.INS XBRL | Instance Document, filed herewith | |
| 101.SCH XBRL | Taxonomy Extension Schema Document, filed herewith | |
| 101.CAL XBRL | Taxonomy Extension Calculation Linkbase Document, filed herewith | |
| 101.DEF XBRL | Taxonomy Extension Definition Linkbase Document, filed herewith | |
| 101.LAB XBRL | Taxonomy Extension Label Linkbase Document, filed herewith | |
| 101.PRE XBRL | Taxonomy Extension Presentation Linkbase Document, filed herewith | |
| * | Management contract or compensatory plan arrangement. |
| ** | Shareholder approved compensatory plan pursuant to which the Registrant’s Common Stock may be issued to employees of the Corporation. |
Item 15(c) – Not Applicable
131
Table of Contents
SIGNATURES
Pursuant to the requirements of section 13 or 15d of the Securities Exchange Act of 1934, the registrant has duly caused this report to be signed on its behalf by the undersigned, there unto duly authorized.
| Bryn Mawr Bank Corporation | ||
| By | /s/ J. Duncan Smith, | |
| J. Duncan Smith | ||
| Treasurer and Chief Financial Officer | ||
Date March 12, 2015
Pursuant to the requirements of the Securities Exchange Act of 1934, this report has been signed by the following persons on behalf of the Corporation and in the capacities and on the date indicated.
| NAME |
TITLE |
DATE | ||
| /s/ Britton H. Murdoch Britton H. Murdoch |
Chairman and Director | March 12, 2015 | ||
| /s/ Francis J. Leto Francis J. Leto |
President and Chief Executive Officer (Principal Executive Officer) and Director | March 12, 2015 | ||
| /s/ J. Duncan Smith J. Duncan Smith |
Treasurer and Chief Financial Officer (Principal Financial and Accounting Officer) | March 12, 2015 | ||
| /s/ Michael J. Clement Michael J. Clement |
Director | March 12, 2015 | ||
| /s/ Andrea F. Gilbert Andrea F. Gilbert |
Director | March 12, 2015 | ||
| /s/ Donald S. Guthrie Donald S. Guthrie |
Director | March 12, 2015 | ||
|
Wendell F. Holland |
Director | |||
| /s/ Scott M. Jenkins Scott M. Jenkins |
Director | March 12, 2015 | ||
| /s/ Jerry L. Johnson Jerry L. Johnson |
Director | March 12, 2015 | ||
| /s/ A. John May, III A. John May, III |
Director | March 12, 2015 | ||
| /s/ Lynn B. McKee Lynn B. McKee |
Director | March 12, 2015 | ||
| /s/ Frederick C. Peters II Frederick C. Peters |
Director | March 12, 2015 | ||
132
Table of Contents
EXHIBIT INDEX
| Exhibit No. |
Description and References | |
| 21.1 | List of Subsidiaries, filed herewith | |
| 23.1 | Consent of KPMG LLP, filed herewith | |
| 31.1 | Certification of the Chief Executive Officer Pursuant to Section 302 of the Sarbanes-Oxley Act of 2002, filed herewith | |
| 31.2 | Certification of the Chief Financial Officer Pursuant to Section 302 of the Sarbanes-Oxley Act of 2002, filed herewith | |
| 32.1 | Certification of Chief Executive Officer Pursuant to 18 U.S.C. Section 1350, as Adopted Pursuant to Section 906 of the Sarbanes-Oxley Act of 2002, filed herewith | |
| 32.2 | Certification of Chief Financial Officer Pursuant to 18 U.S.C. Section 1350, as Adopted Pursuant to Section 906 of the Sarbanes-Oxley Act of 2002, filed herewith | |
| 99.1 | Corporation’s Proxy Statement for 2015 Annual Meeting to be held on April 30, 2015, expected to be filed with the SEC on or about March 19, 2015, and incorporated herein by reference | |
| 101.INS XBRL | Instance Document, filed herewith | |
| 101.SCH XBRL | Taxonomy Extension Schema Document, filed herewith | |
| 101.CAL XBRL | Taxonomy Extension Calculation Linkbase Document, filed herewith | |
| 101.DEF XBRL | Taxonomy Extension Definition Linkbase Document, filed herewith | |
| 101.LAB XBRL | Taxonomy Extension Label Linkbase Document, filed herewith | |
| 101.PRE XBRL | Taxonomy Extension Presentation Linkbase Document, filed herewith | |
133