Attached files
| file | filename |
|---|---|
| 8-K - FORM 8-K - CU Bancorp | d887704d8k.htm |
Exhibit 99.1
|
|
CU Bancorp Investor Presentation as of December 31, 2014 … a better banking experience
|
|
Forward-Looking Statements This press release contains certain forward-looking information about CU Bancorp (the “Company”), 1st Enterprise Bank and the combined company after the close of the transaction that is intended to be covered by the safe harbor for “forward looking statements” provided by the Private Securities Litigation Reform Act of 1995. All statements other than statements of historical fact are forward-looking statements. Such statements involve inherent risks and uncertainties, many of which are difficult to predict and are generally beyond the control of the Company. Forward-looking statements speak only as of the date they are made and we assume no duty to update such statements. We caution readers that a number of important factors could cause actual results to differ materially from those expressed in, implied or projected by, such forward-looking statements. Risks and uncertainties include, but are not limited to: lower than expected revenues; credit quality deterioration or a reduction in real estate values could cause an increase in the allowance for credit losses and a reduction in net earnings; increased competitive pressure among depository institutions; the Company’s ability to complete future acquisitions, successfully integrate such acquired entities, or achieve expected beneficial synergies and/or operating efficiencies within expected time-frames or at all; the possibility that personnel changes will not proceed as planned; the cost of additional capital is more than expected; a change in the interest rate environment reduces net interest margins; asset/liability repricing risks and liquidity risks; legal matters could be filed against the Company and could take longer or cost more than expected to resolve or may be resolved adversely to the Company; general economic conditions, either nationally or in the market areas in which the Company does or anticipates doing business, are less favorable than expected; environmental conditions, including natural disasters and drought, may disrupt our business, impede our operations, negatively impact the values of collateral securing the Company’s loans and leases or impair the ability of our borrowers to support their debt obligations; the economic and regulatory effects of the continuing war on terrorism and other events of war, including the conflicts in the Middle East; legislative or regulatory requirements or changes adversely affecting the Company’s business; changes in the securities markets; regulatory approvals for any capital activities cannot be obtained on the terms expected or on the anticipated schedule; and, other risks that are described in CU Bancorp’s public filings with the U.S. Securities and Exchange Commission (the “SEC”). CU Bancorp assumes no obligation to update such forward-looking statements. For a more complete discussion of risks and uncertainties, investors and security holders are urged to read CU Bancorp’s annual report on Form 10-K, quarterly reports on Form 10-Q and other reports filed by CU Bancorp with the SEC. The documents filed by CU Bancorp with the SEC may be obtained at CU Bancorp’s website at www.cubancorp.com or at the SEC’s website at www.sec.gov. These documents may also be obtained free of charge from CU Bancorp by directing a request to: CU Bancorp c/o California United Bank, 15821 Ventura Boulevard, Suite 100, Encino, CA 91436. Attention: Investor Relations. Telephone 818-257-7700. 2
|
|
Investment Highlights 4 2014 Earnings Review 15 Appendix 22 3
|
|
Investment Highlights Premier community-based, business banking franchise serving attractive Southern California market Strong organic loan growth Attractive low-cost core deposit base Exceptional credit quality Growing visibility in the investment community Scarcity value of $2.3 billion “pure play” business bank in large and diverse greater Los Angeles market 4
|
|
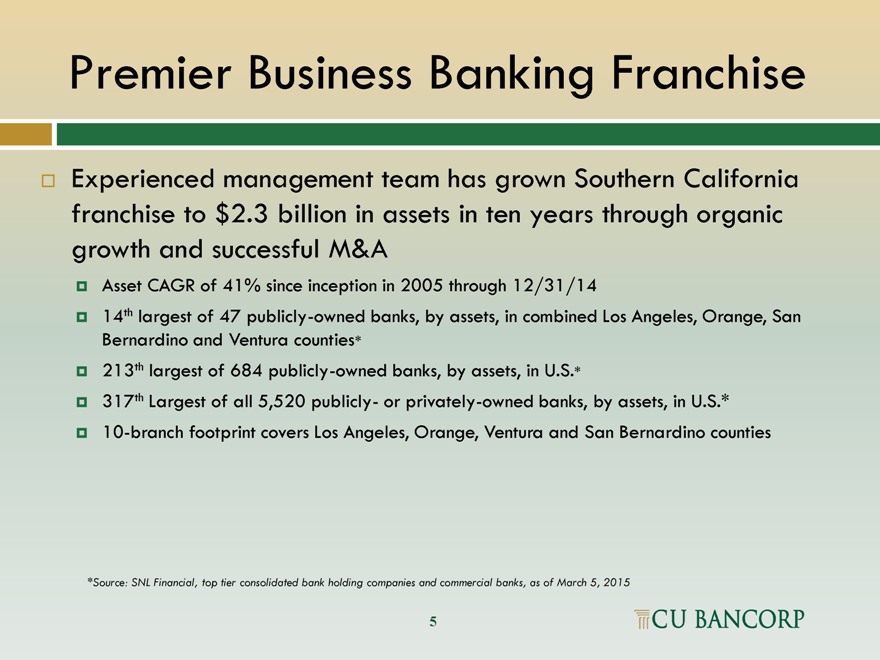
Premier Business Banking Franchise Experienced management team has grown Southern California franchise to $2.3 billion in assets in ten years through organic growth and successful M&A Asset CAGR of 41% since inception in 2005 through 12/31/14 14th largest of 47 publicly-owned banks, by assets, in combined Los Angeles, Orange, San Bernardino and Ventura counties* 213th largest of 684 publicly-owned banks, by assets, in U.S.* 317th Largest of all 5,520 publicly- or privately-owned banks, by assets, in U.S.* 10-branch footprint covers Los Angeles, Orange, Ventura and San Bernardino counties *Source: SNL Financial, top tier consolidated bank holding companies and commercial banks, as of March 5, 2015 5
|
|
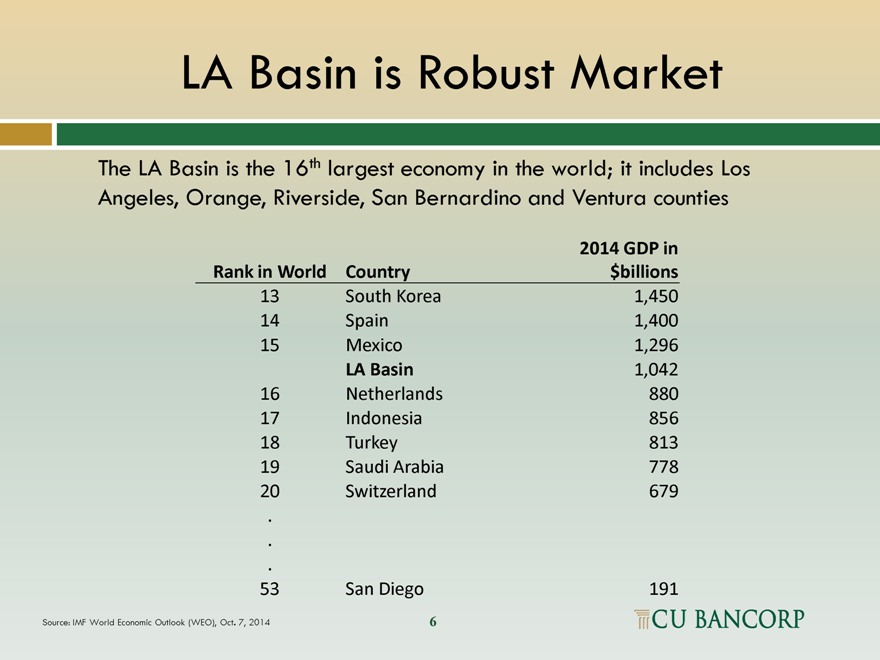
LA Basin is Robust Market The LA Basin is the 16th largest economy in the world; it includes Los Angeles, Orange, Riverside, San Bernardino and Ventura counties
2014 GDP in
Rank in World Country $billions
| 13 |
|
South Korea 1,450 |
| 14 |
|
Spain 1,400 |
| 15 |
|
Mexico 1,296 |
LA Basin 1,042
| 16 |
|
Netherlands 880 |
| 17 |
|
Indonesia 856 |
| 18 |
|
Turkey 813 |
| 19 |
|
Saudi Arabia 778 |
| 20 |
|
Switzerland 679 |
.
.
.
| 53 |
|
San Diego 191 |
Source: IMF World Economic Outlook (WEO), Oct. 7, 2014 6
|
|
High-Touch Relationship Management Team offers Solutions for Small- and Medium-Sized Businesses High-touch relationship management team offers personalized and responsive service focused on small- and medium-sized businesses in Los Angeles, Orange, Ventura and San Bernardino counties Los Angeles County is the largest manufacturing center in the U.S. and would be 9th largest state in U.S. L.A. County expected to add more than 150,000 jobs over the next two years; December 2014 unemployment rate of 7.5% projected to fall to 7.2% by end of 2015* Orange County would be 31st largest state in U.S. Orange County unemployment rate is 4.4% as of December 2014** Four-county area is home to more than 606,298 small- and middle-market businesses** (defined as employing 1 to 499 workers) *Source: Forecast by Beacon Economics, February 2014; actual unemployment rate from Bureau of Labor and Statistics (BLS) **Source: County data from Los Angeles Economic Development Corporation and California EDD, as of 9/30/2013; actual unemployment rate from BLS 7
|
|
Franchise Growth Strategies Organic Growth Offer expertise in C&I and commercial real estate lending to small and middle-market businesses Provide customers with sophisticated products and solutions Leverage relationship-based banking approach and superior service Continue recruiting “in market” talent from competitors Build on products and expertise acquired in strategic acquisitions, such as the SBA lending platform obtained with Premier Commercial Bank Growth by Merger/Acquisitions Strong management team experienced with successful, accretive acquisitions California Oaks State Bank (12/31/10) Premier Commercial Bank (7/31/12) 1st Enterprise Bank (11/30/14) 8
|
|
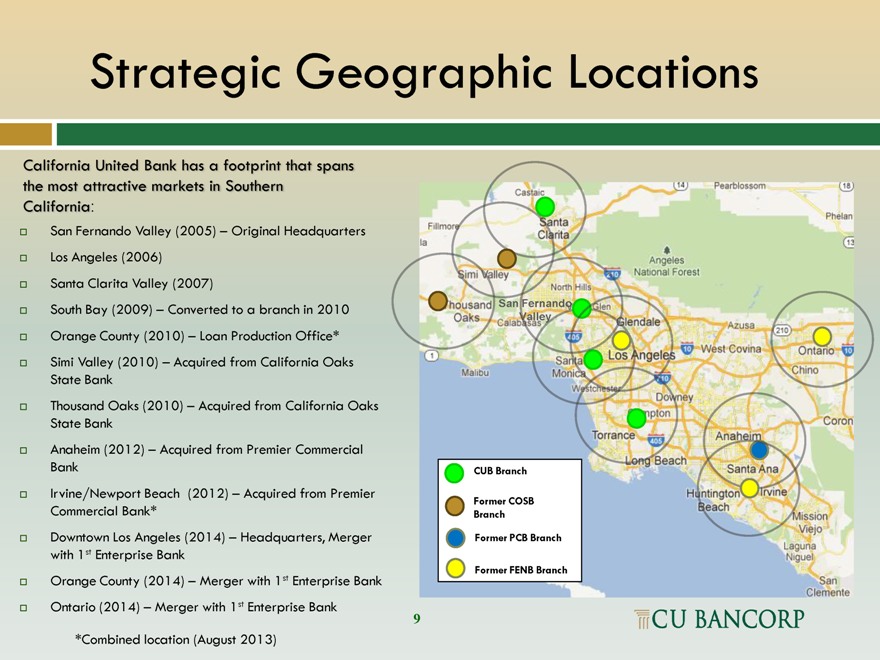
Strategic Geographic Locations California United Bank has a footprint that spans the most attractive markets in Southern California: San Fernando Valley (2005) – Original Headquarters Los Angeles (2006) Santa Clarita Valley (2007) South Bay (2009) – Converted to a branch in 2010 Orange County (2010) – Loan Production Office* Simi Valley (2010) – Acquired from California Oaks State Bank Thousand Oaks (2010) – Acquired from California Oaks State Bank Anaheim (2012) – Acquired from Premier Commercial Bank Irvine/Newport Beach (2012) – Acquired from Premier Commercial Bank* Downtown Los Angeles (2014) – Headquarters, Merger with 1st Enterprise Bank Orange County (2014) – Merger with 1st Enterprise Bank Ontario (2014) – Merger with 1st Enterprise Bank *Combined location (August 2013) 9
|
|
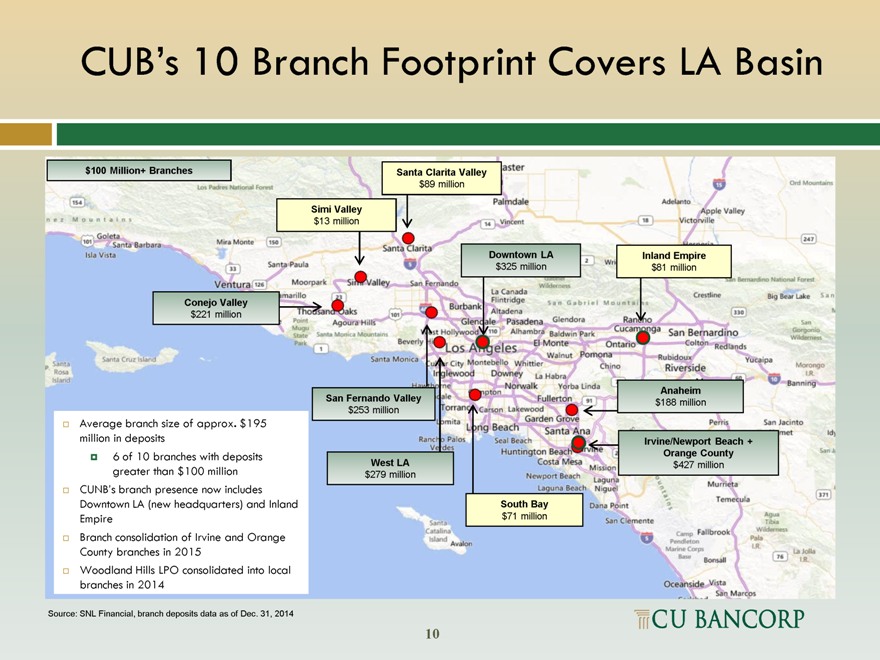
CUB’s 10 Branch Footprint Covers LA Basin Average branch size of approx. $195 million in deposits 6 of 10 branches with deposits greater than $100 million CUNB’s branch presence now includes Downtown LA (new headquarters) and Inland Empire Branch consolidation of Irvine and Orange County branches in 2015 Woodland Hills LPO consolidated into local branches in 2014 Source: SNL Financial, branch deposits data as of Dec. 31, 2014
$100 Million+ Branches Santa Clarita Valley
$89 million
Simi Valley
$13 million
Downtown LA Inland Empire
$325 million $81 million
Conejo Valley
$221 million
Anaheim
San Fernando Valley $188 million
$253 million
Irvine/Newport Beach + Orange County West LA $427 million $279 million South Bay $71 million 10
|
|
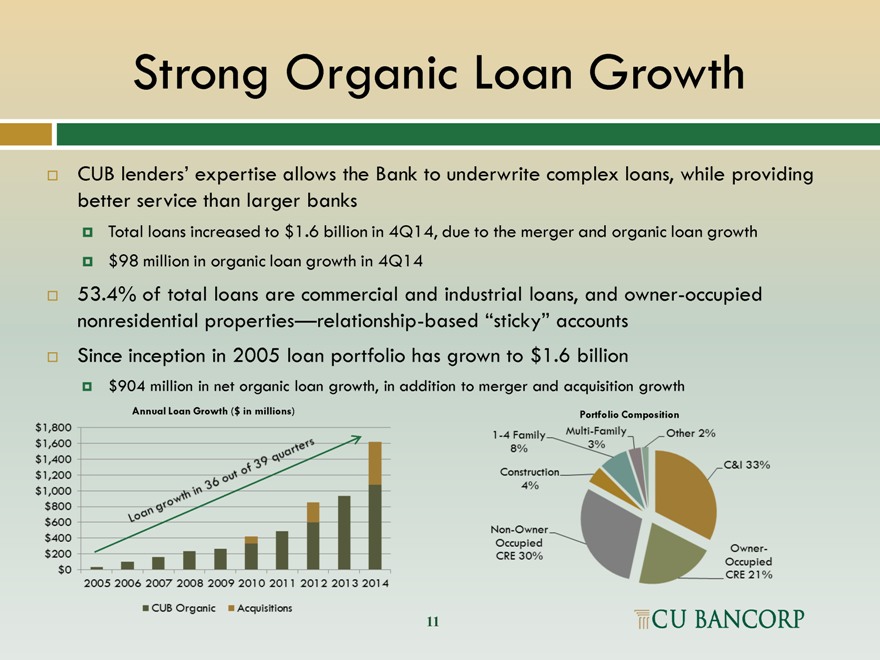
Strong Organic Loan Growth CUB lenders’ expertise allows the Bank to underwrite complex loans, while providing better service than larger banks Total loans increased to $1.6 billion in 4Q14, due to the merger and organic loan growth $98 million in organic loan growth in 4Q14 53.4% of total loans are commercial and industrial loans, and owner-occupied nonresidential properties—relationship-based “sticky” accounts Since inception in 2005 loan portfolio has grown to $1.6 billion $904 million in net organic loan growth, in addition to merger and acquisition growth Annual Loan Growth ($ in millions) Portfolio Composition 11
|
|
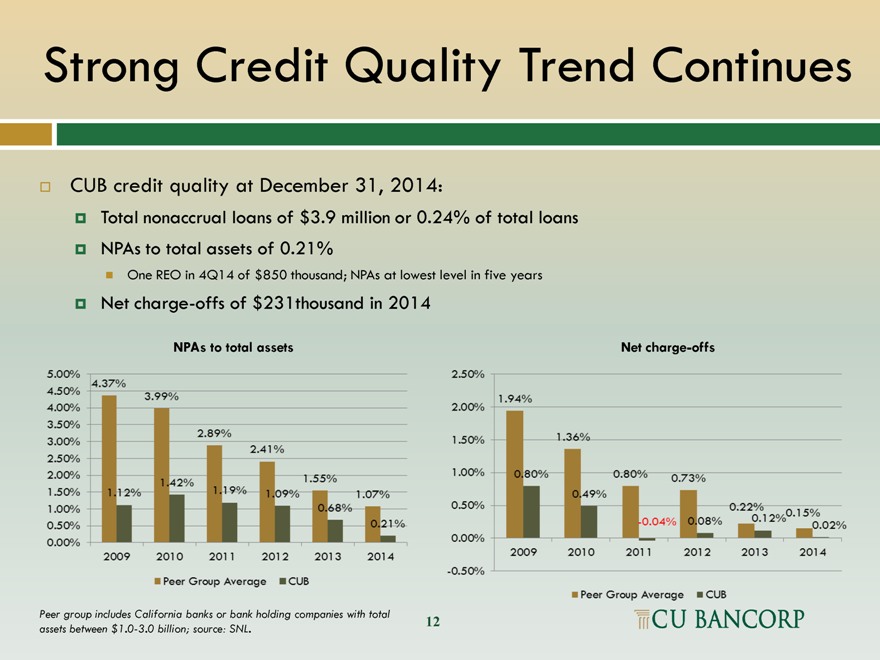
Strong Credit Quality Trend Continues CUB credit quality at December 31, 2014: Total nonaccrual loans of $3.9 million or 0.24% of total loans NPAs to total assets of 0.21% One REO in 4Q14 of $850 thousand; NPAs at lowest level in five years Net charge-offs of $231thousand in 2014 NPAs to total assets Net charge-offs Peer group includes California banks or bank holding companies with total assets between $1.0-3.0 billion; source: SNL. 12
|
|
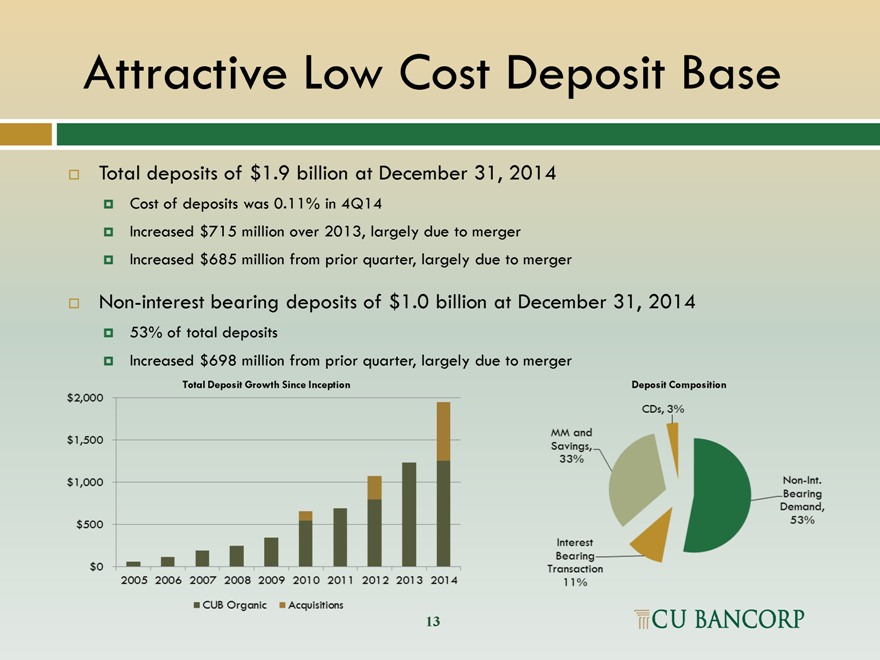
Attractive Low Cost Deposit BaseTotal deposits of $1.9 billion at December 31, 2014 Cost of deposits was 0.11% in 4Q14 Increased $715 million over 2013, largely due to merger Increased $685 million from prior quarter, largely due to merger Non-interest bearing deposits of $1.0 billion at December 31, 2014 53% of total deposits Increased $698 million from prior quarter, largely due to merger Total Deposit Growth Since Inception Deposit Composition 13
|
|
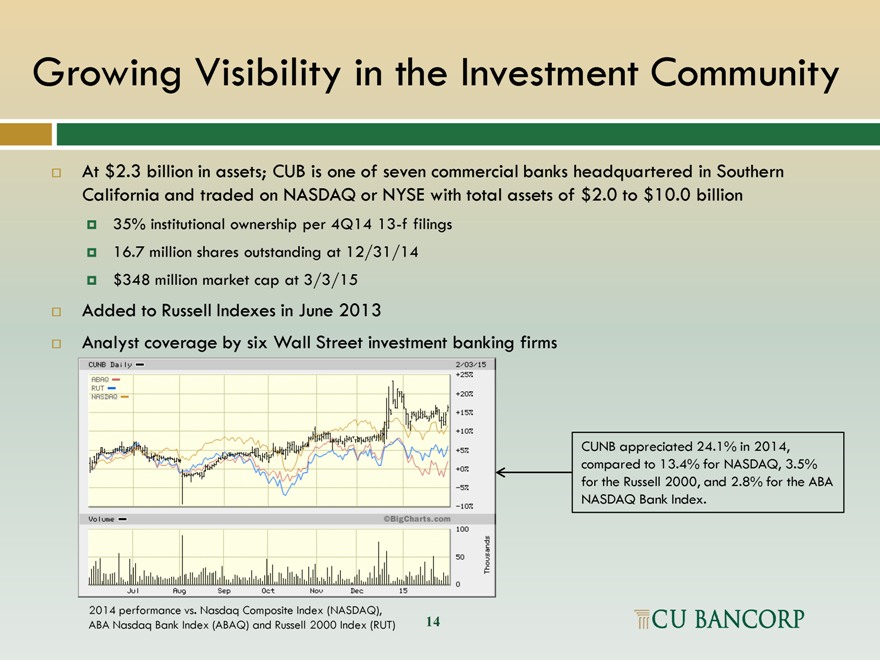
Growing Visibility in the Investment CommunityAt $2.3 billion in assets; CUB is one of seven commercial banks headquartered in Southern California and traded on NASDAQ or NYSE with total assets of $2.0 to $10.0 billion 35% institutional ownership per 4Q14 13-f filings 16.7 million shares outstanding at 12/31/14 $348 million market cap at 3/3/15 Added to Russell Indexes in June 2013 Analyst coverage by six Wall Street investment banking firms CUNB appreciated 24.1% in 2014, compared to 13.4% for NASDAQ, 3.5% for the Russell 2000, and 2.8% for the ABA NASDAQ Bank Index. 2014 performance vs. Nasdaq Composite Index (NASDAQ), ABA Nasdaq Bank Index (ABAQ) and Russell 2000 Index (RUT) 14
|
|
Earnings Review – 2014 15
|
|
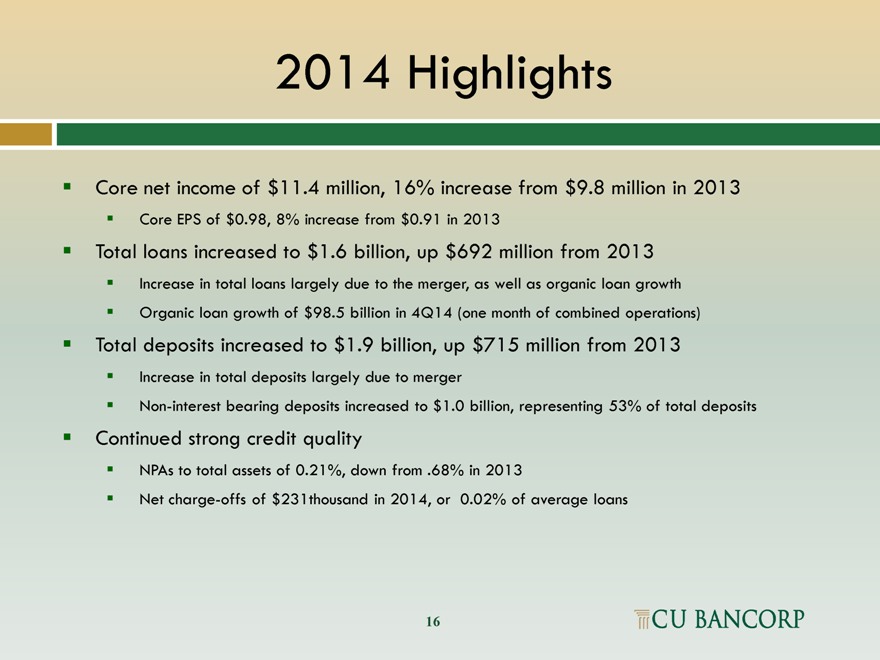
2014 Highlights Core net income of $11.4 million, 16% increase from $9.8 million in 2013 Core EPS of $0.98, 8% increase from $0.91 in 2013 Total loans increased to $1.6 billion, up $692 million from 2013 Increase in total loans largely due to the merger, as well as organic loan growth Organic loan growth of $98.5 billion in 4Q14 (one month of combined operations) Total deposits increased to $1.9 billion, up $715 million from 2013 Increase in total deposits largely due to merger Non-interest bearing deposits increased to $1.0 billion, representing 53% of total deposits Continued strong credit quality NPAs to total assets of 0.21%, down from .68% in 2013 Net charge-offs of $231thousand in 2014, or 0.02% of average loans 16
|
|
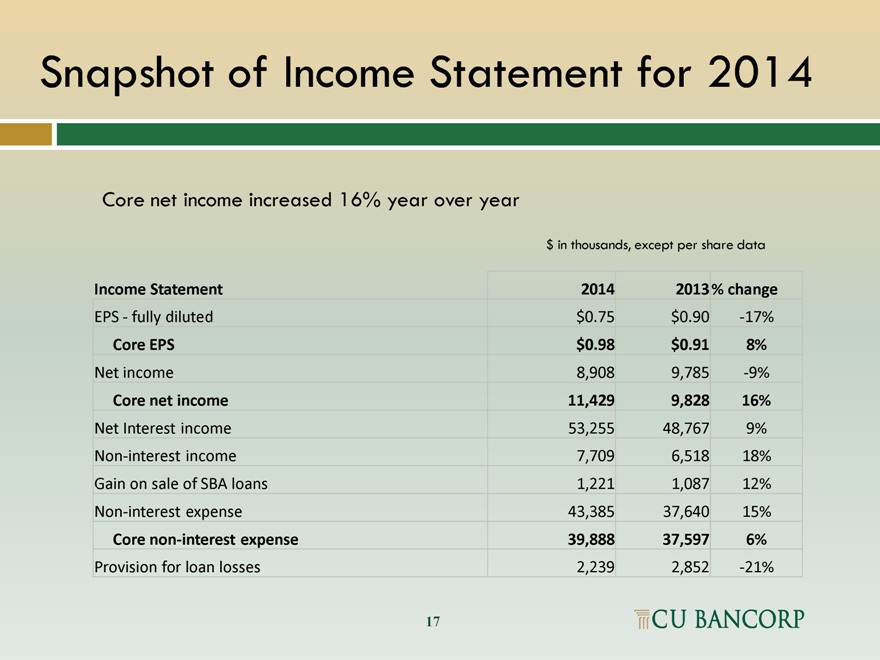
Snapshot of Income Statement for 2014 Core net income increased 16% year over year $ in thousands, except per share data
Income Statement 2014 2013% change
EPS—fully diluted $0.75 $0.90 -17%
Core EPS $0.98 $0.91 8%
Net income 8,908 9,785 -9%
Core net income 11,429 9,828 16%
Net Interest income 53,255 48,767 9%
Non-interest income 7,709 6,518 18%
Gain on sale of SBA loans 1,221 1,087 12%
Non-interest expense 43,385 37,640 15%
Core non-interest expense 39,888 37,597 6%
Provision for loan losses 2,239 2,852 -21%
17
|
|
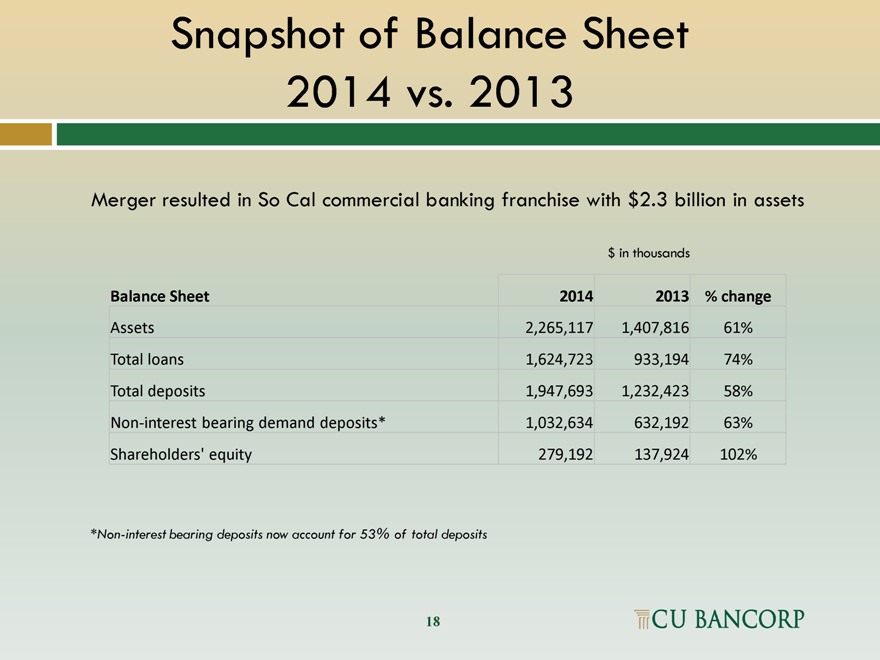
Snapshot of Balance Sheet 2014 vs. 2013 Merger resulted in So Cal commercial banking franchise with $2.3 billion in assets $ in thousands
Balance Sheet 2014 2013% change
Assets 2,265,117 1,407,816 61%
Total loans 1,624,723 933,194 74%
Total deposits 1,947,693 1,232,423 58%
Non-interest bearing demand deposits* 1,032,634 632,192 63%
Shareholders’ equity 279,192 137,924 102%
*Non-interest bearing deposits now account for 53% of total deposits 18
|
|
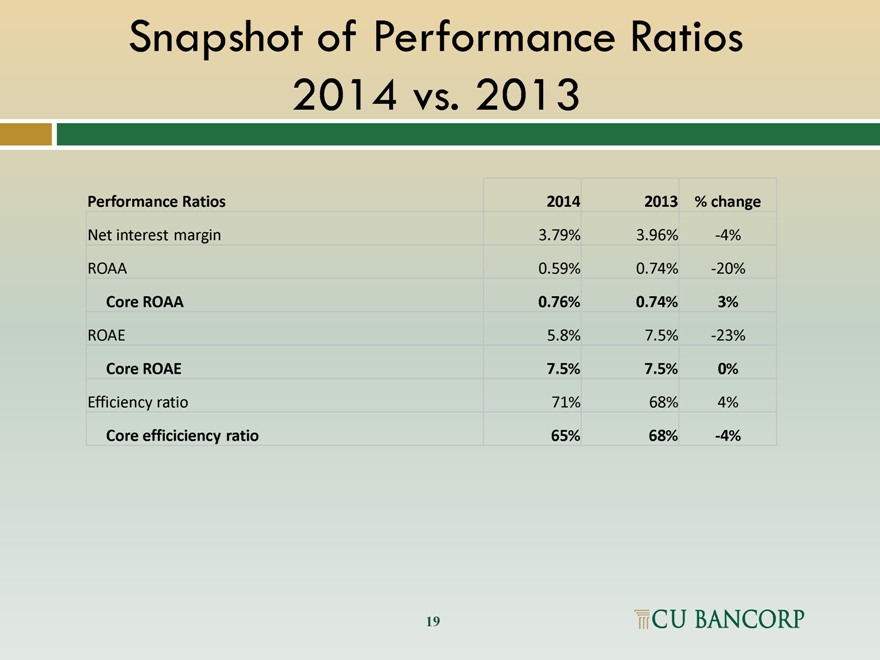
Snapshot of Performance Ratios 2014 vs. 2013
Performance Ratios 2014 2013% change
Net interest margin 3.79% 3.96% -4%
ROAA 0.59% 0.74% -20%
Core ROAA 0.76% 0.74% 3%
ROAE 5.8% 7.5% -23%
Core ROAE 7.5% 7.5% 0%
Efficiency ratio 71% 68% 4%
Core efficiciency ratio 65% 68% -4%
19
|
|
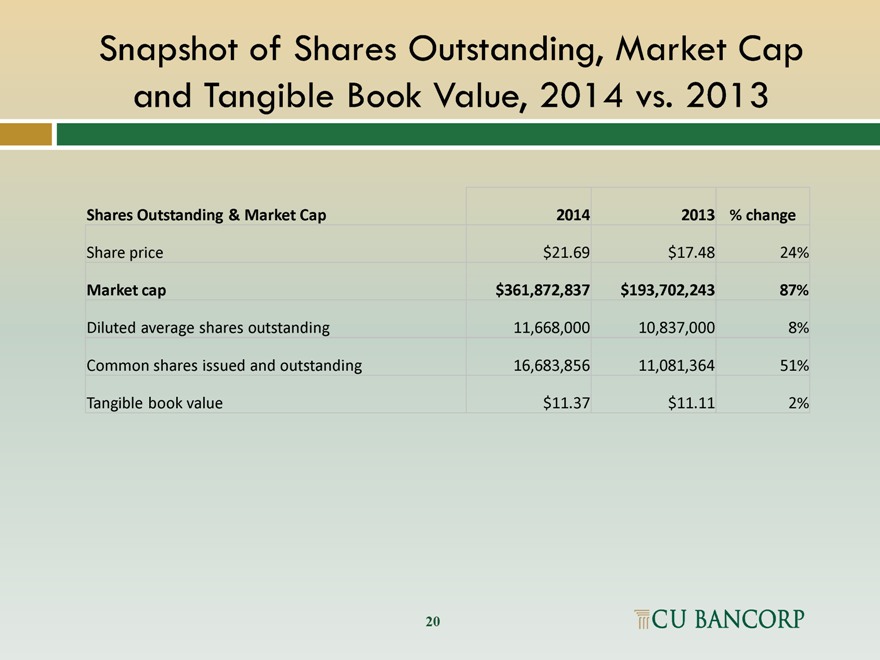
Snapshot of Shares Outstanding, Market Cap and Tangible Book Value, 2014 vs. 2013
Shares Outstanding & Market Cap 2014 2013% change
Share price $21.69 $17.48 24%
Market cap $361,872,837 $193,702,243 87%
Diluted average shares outstanding 11,668,000 10,837,000 8%
Common shares issued and outstanding 16,683,856 11,081,364 51%
Tangible book value $11.37 $11.11 2%
20
|
|
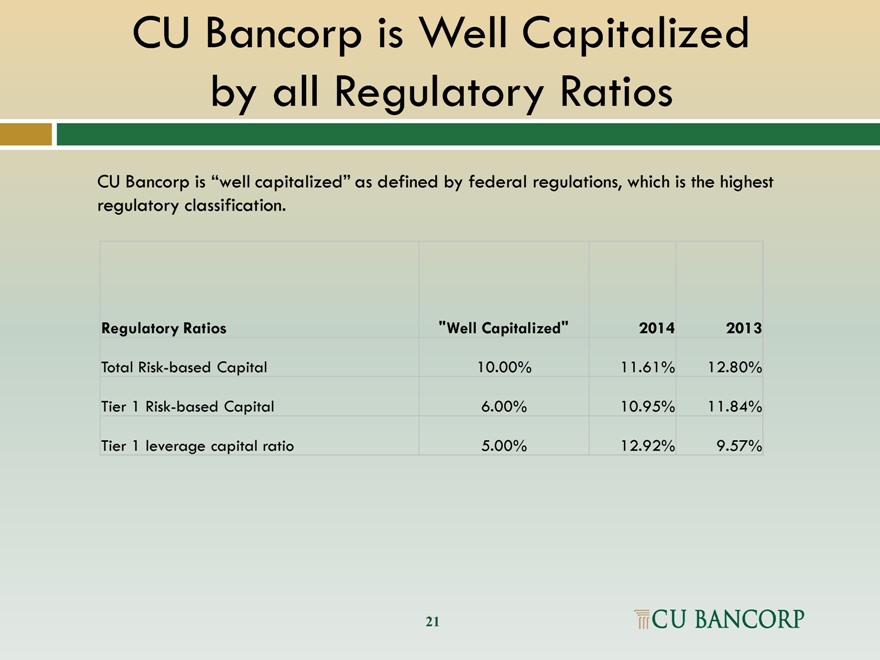
CU Bancorp is Well Capitalized by all Regulatory Ratios
CU Bancorp is “well capitalized” as defined by federal regulations, which is the highest
regulatory classification.
Regulatory Ratios “Well Capitalized” 2014 2013
Total Risk-based Capital 10.00% 11.61% 12.80% Tier 1 Risk-based Capital 6.00% 10.95% 11.84% Tier 1 leverage capital ratio 5.00% 12.92% 9.57%
21
|
|
Appendix
22
|
|
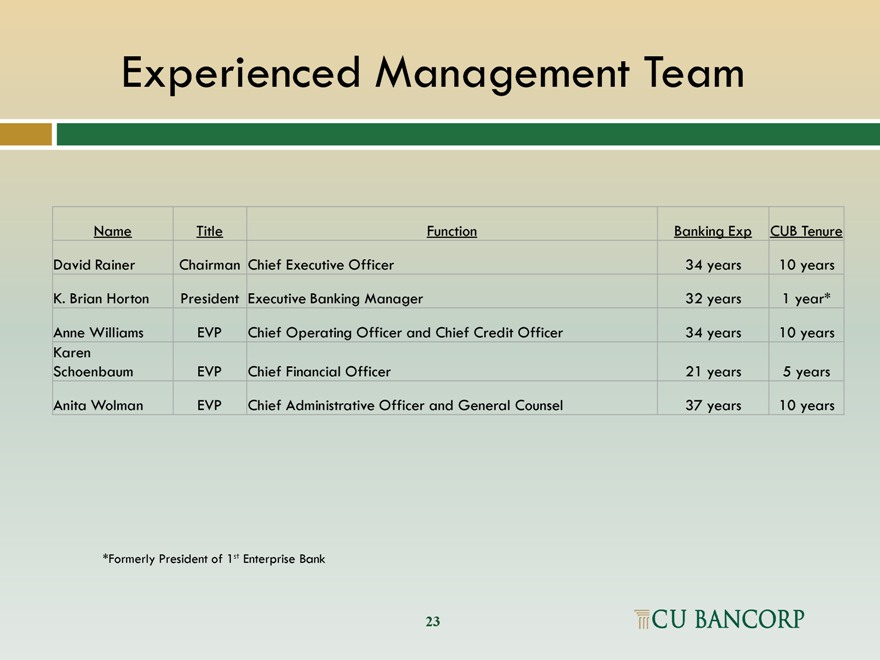
Experienced Management Team
Name Title Function Banking Exp CUB Tenure
David Rainer Chairman Chief Executive Officer 34 years 10 years
K. Brian Horton President Executive Banking Manager 32 years 1 year*
Anne Williams EVP Chief Operating Officer and Chief Credit Officer 34 years 10 years Karen Schoenbaum EVP Chief Financial Officer 21 years 5 years
Anita Wolman EVP Chief Administrative Officer and General Counsel 37 years 10 years
*Formerly President of 1st Enterprise Bank
23
|
|
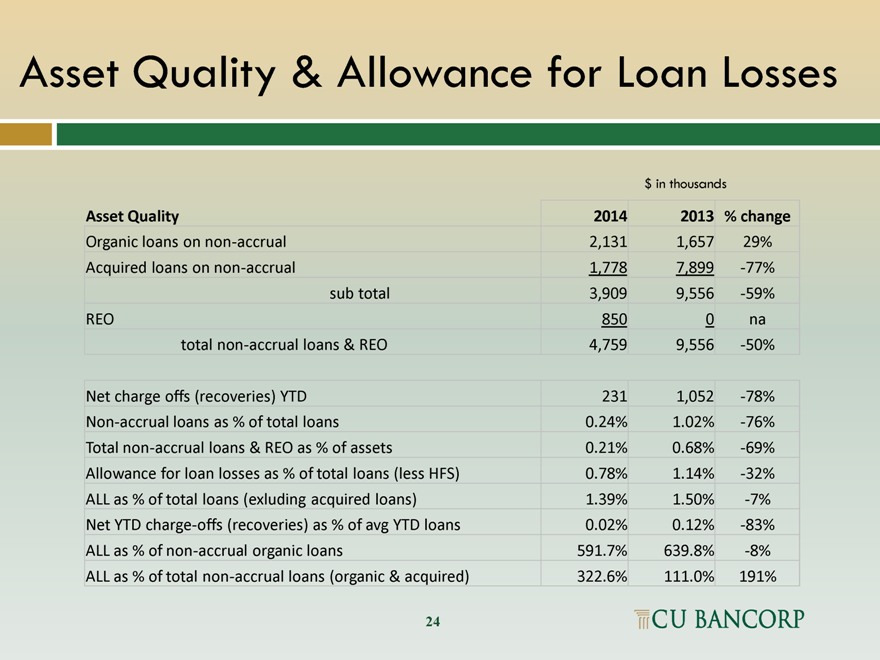
Asset Quality & Allowance for Loan Losses
$ in thousands
Asset Quality 2014 2013 % change
Organic loans on non-accrual 2,131 1,657 29% Acquired loans on non-accrual 1,778 7,899 -77% sub total 3,909 9,556 -59% REO 850 0 na total non-accrual loans & REO 4,759 9,556 -50%
Net charge offs (recoveries) YTD 231 1,052 -78% Non-accrual loans as % of total loans 0.24% 1.02% -76% Total non-accrual loans & REO as % of assets 0.21% 0.68% -69% Allowance for loan losses as % of total loans (less HFS) 0.78% 1.14% -32% ALL as % of total loans (exluding acquired loans) 1.39% 1.50% -7% Net YTD charge-offs (recoveries) as % of avg YTD loans 0.02% 0.12% -83% ALL as % of non-accrual organic loans 591.7% 639.8% -8% ALL as % of total non-accrual loans (organic & acquired) 322.6% 111.0% 191%
24
|
|
Reconciliation of Non-GAAP Measures
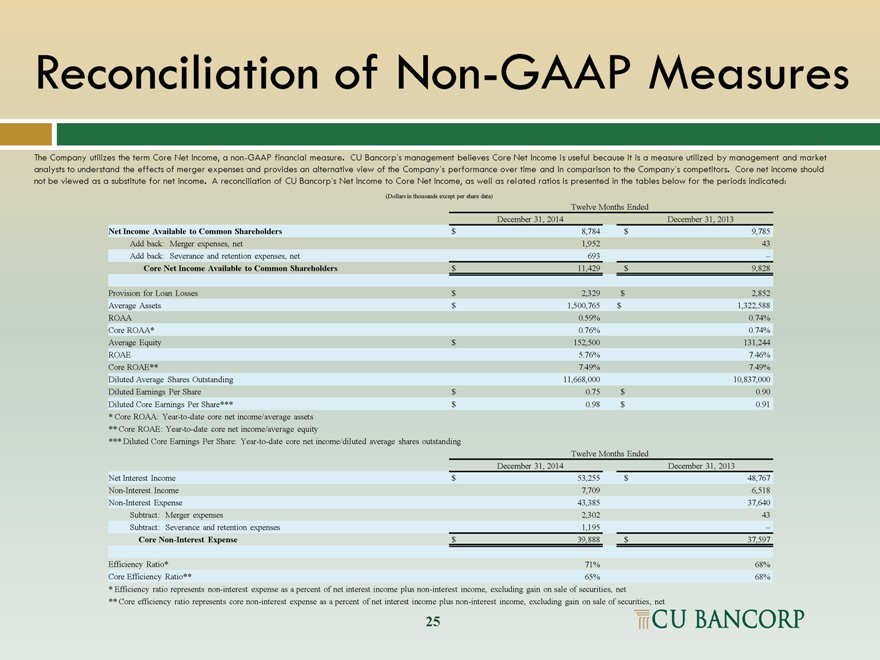
The Company utilizes the term Core Net Income, a non-GAAP financial measure. CU Bancorp“s management believes Core Net Income is useful because it is a measure utilized by management and market analysts to understand the effects of merger expenses and provides an alternative view of the Company“s performance over time and in comparison to the Company“s competitors. Core net income should not be viewed as a substitute for net income. A reconciliation of CU Bancorp“s Net Income to Core Net Income, as well as related ratios is presented in the tables below for the periods indicated:
(Dollars in thousands except per share data)
Twelve Months Ended
December 31, 2014 December 31, 2013
Net Income 9,785 Available to Common Shareholders $ 8,784 $
Add 43 back: Merger expenses, net 1,952 Add back: Severance and retention expenses, net 693 “
Core Net Income Available to Common Shareholders $ 11,429 $ 9,828
Provision for Loan Losses $ 2,329 $ 2,852 Average Assets $ 1,500,765 $ 1,322,588 ROAA 0.59% 0.74% Core ROAA* 0.76% 0.74% Average Equity $ 152,500 131,244 ROAE 5.76% 7.46% Core ROAE** 7.49% 7.49% Diluted Average Shares Outstanding 11,668,000 10,837,000 Diluted Earnings Per Share $ 0.75 $ 0.90 Diluted Core Earnings Per Share*** $ 0.98 $ 0.91
* Core ROAA: Year-to-date core net income/average assets
** Core ROAE: Year-to-date core net income/average equity
*** Diluted Core Earnings Per Share: Year-to-date core net income/diluted average shares outstanding
Twelve Months Ended
December 31, 2014 December 31, 2013
Net Interest Income $ 53,255 $ 48,767 Non-Interest Income 7,709 6,518 Non-Interest Expense 37,640 43,385 Subtract:43 Merger expenses 2,302 Subtract:” Severance and retention expenses 1,195
Core Non-Interest Expense $ 39,888 $ 37,597
Efficiency Ratio* 71% 68% Core Efficiency Ratio** 65% 68%
* Efficiency ratio represents non-interest expense as a percent of net interest income plus non-interest income, excluding gain on sale of securities, net
** Core efficiency ratio represents core non-interest expense as a percent of net interest income plus non-interest income, excluding gain on sale of securities, net
25
|
|
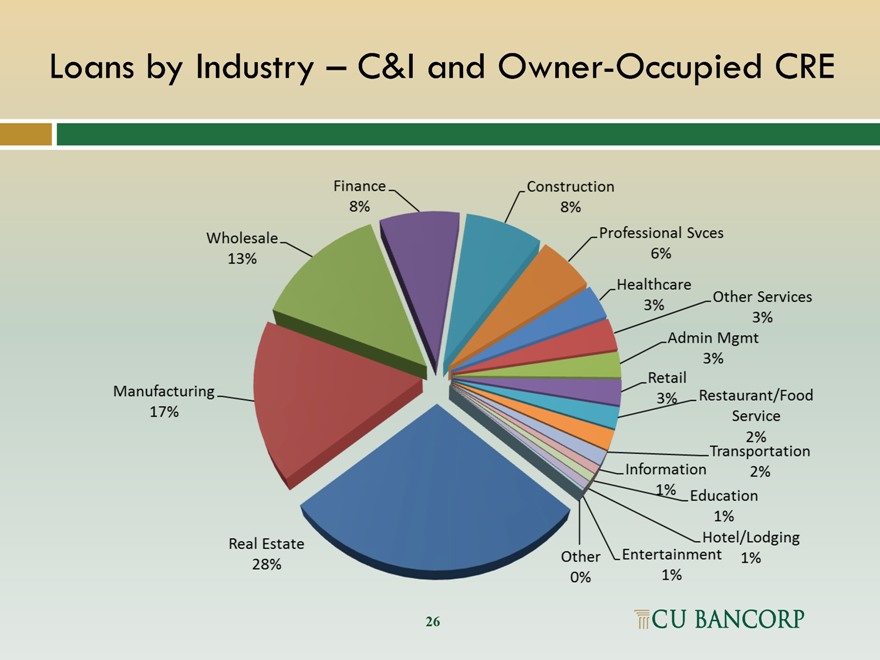
Loans by Industry “ C&I and Owner-Occupied CRE
26
|
|
Customer Profile
Our customer base reflects the diversity of industries in Southern California
¨ Significant percentage of customers involved in the manufacturing, distribution and services industries ¨ Typical customer has between $10 million and $60 million in annual sales (excluding SBA borrowers) ¨ Typical loan commitment ranges between $1 million and $5 million (excluding SBA loans) ¨ Majority of new customers come from larger banks ¨ Most new business generation results from warm leads provided by referral sources
27
|
|
Merger is a Great Fit of People and Culture
¨ Blending the best of two high performing organizations
¨ Complementary branch locations and customer-first cultures fit like a glove ¨ Brings together some of the top bankers and banking support staff in Southern California ¨ Larger organization provides increased opportunities for continued professional growth
28
|
|
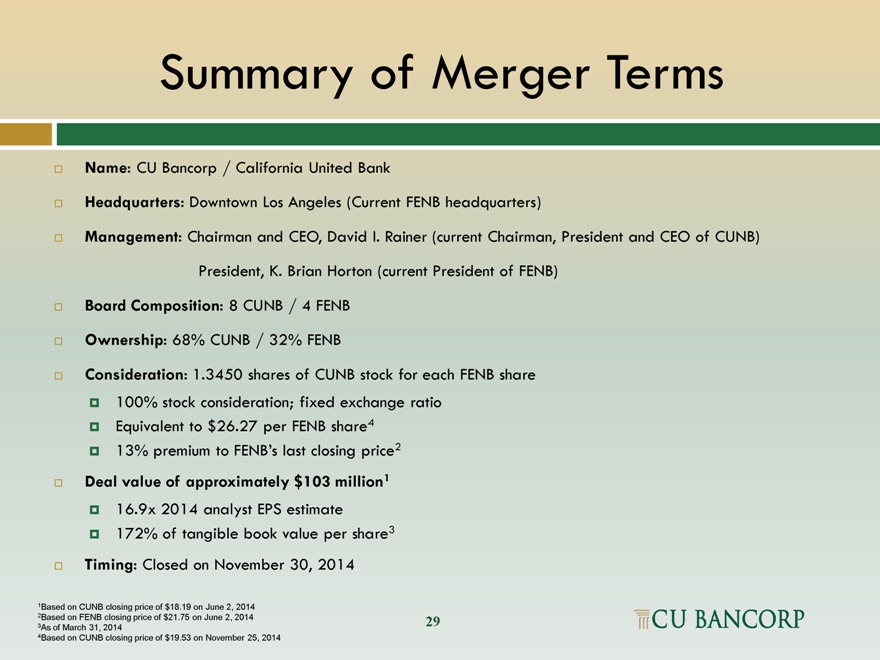
Summary of Merger Terms
¨ Name: CU Bancorp / California United Bank
¨ Headquarters: Downtown Los Angeles (Current FENB headquarters)
¨ Management: Chairman and CEO, David I. Rainer (current Chairman, President and CEO of CUNB)
President, K. Brian Horton (current President of FENB)
¨ Board Composition: 8 CUNB / 4 FENB
¨ Ownership: 68% CUNB / 32% FENB
¨ Consideration: 1.3450 shares of CUNB stock for each FENB share¤ 100% stock consideration; fixed exchange ratio Equivalent to $26.27 per FENB share4
2
13% premium to FENB“s last closing price
Deal value of approximately $103 million1
¨
16.9x 2014 analyst EPS estimate 172% of tangible book value per share3
¨ Timing: Closed on November 30, 2014
1Based on CUNB closing price of $18.19 on June 2, 2014
2Based on FENB closing price of $21.75 on June 2, 2014 29 3As of March 31, 2014 4Based on CUNB closing price of $19.53 on November 25, 2014
|
|
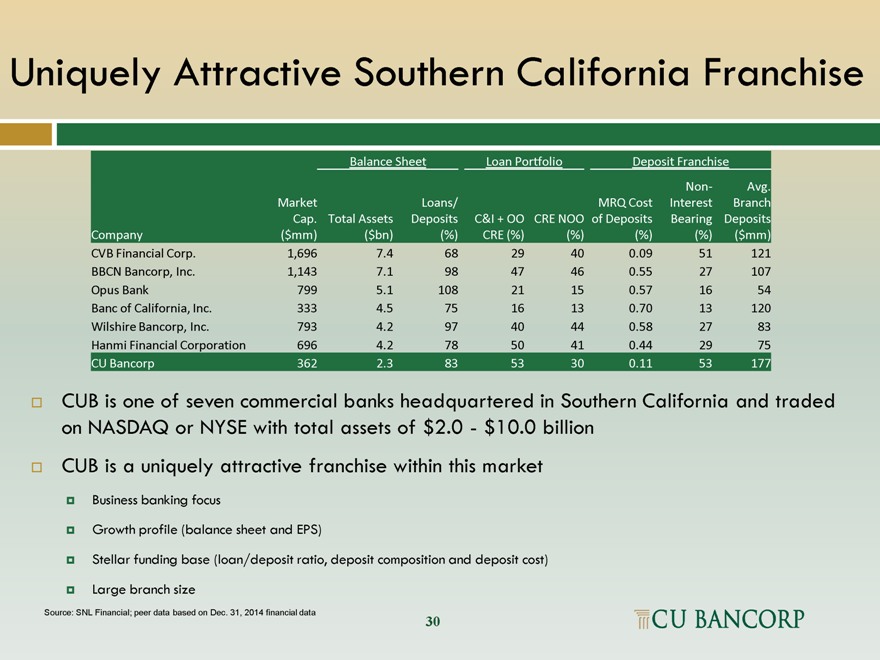
Uniquely Attractive Southern California Franchise
Balance Sheet Loan Portfolio Deposit Franchise
Non- Avg. Market Loans/ MRQ Cost Interest Branch Cap. Total Assets Deposits C&I + OO CRE NOO of Deposits Bearing Deposits Company ($mm) ($bn) (%) CRE (%) (%) (%) (%) ($mm) CVB Financial Corp. 1,696 7.4 68 29 40 0.09 51 121 BBCN Bancorp, Inc. 1,143 7.1 98 47 46 0.55 27 107 Opus Bank 799 5.1 108 21 15 0.57 16 54 Banc of California, Inc. 333 4.5 75 16 13 0.70 13 120 Wilshire Bancorp, Inc. 793 4.2 97 40 44 0.58 27 83 Hanmi Financial Corporation 696 4.2 78 50 41 0.44 29 75 CU Bancorp 362 2.3 83 53 30 0.11 53 177
¨ CUB is one of seven commercial banks headquartered in Southern California and traded on NASDAQ or NYSE with total assets of $2.0—$10.0 billion ¨ CUB is a uniquely attractive franchise within this market
Business banking focus
Growth profile (balance sheet and EPS)
Stellar funding base (loan/deposit ratio, deposit composition and deposit cost)
Large branch size
Source: SNL Financial; peer data based on Dec. 31, 2014 financial data
30
|
|
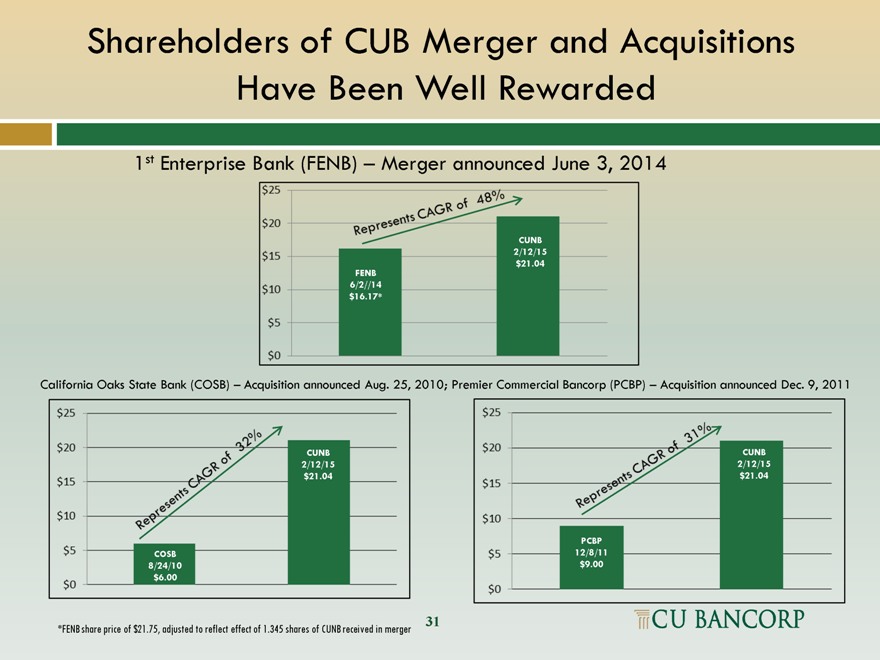
Shareholders of CUB Merger and Acquisitions Have Been Well Rewarded
1st Enterprise Bank (FENB) “ Merger announced June 3, 2014
CUNB 2/12/15 $21.04 FENB
6/2//14 $16.17*
California Oaks State Bank (COSB) “ Acquisition announced Aug. 25, 2010; Premier Commercial Bancorp (PCBP) “ Acquisition announced Dec. 9, 2011
CUNB CUNB 2/12/15 2/12/15 $21.04 $21.04
PCBP COSB 12/8/11 8/24/10 $9.00 $6.00
31
*FENB share price of $21.75, adjusted to reflect effect of 1.345 shares of CUNB received in merger