Attached files
| file | filename |
|---|---|
| EX-32.1 - EX-32.1 - CU Bancorp | d288036dex321.htm |
| EX-31.2 - EX-31.2 - CU Bancorp | d288036dex312.htm |
| EX-31.1 - EX-31.1 - CU Bancorp | d288036dex311.htm |
| EX-23.1 - EX-23.1 - CU Bancorp | d288036dex231.htm |
| EX-14.1 - EX-14.1 - CU Bancorp | d288036dex141.htm |
| EX-12.1 - EX-12.1 - CU Bancorp | d288036dex121.htm |
| EX-10.13 - EX-10.13 - CU Bancorp | d288036dex1013.htm |
| EX-10.9 - EX-10.9 - CU Bancorp | d288036dex109.htm |
| EX-10.4 - EX-10.4 - CU Bancorp | d288036dex104.htm |
Table of Contents
UNITED STATES
SECURITIES AND EXCHANGE COMMISSION
Washington, D.C. 20015
FORM 10-K
(Mark One)
| ☒ | ANNUAL REPORT PURSUANT TO SECTION 13 OR 15(d) OF THE SECURITIES EXCHANGE ACT OF 1934 |
For the fiscal year ended December 31, 2016
| ☐ | TRANSITION REPORT PURSUANT TO SECTION 13 OR 15(d) OF THE SECURITIES EXCHANGE ACT OF 1934 |
For the transition period from to
CU BANCORP
(Exact name of registrant as specified in its charter)
Commission File Number 001-35683
| California | 90-0779788 | |
| (State or other jurisdiction of incorporation or organization) |
(I.R.S. Employer Identification No.) | |
| 818 W. 7th Street, Suite 220 Los Angeles, California |
90017 | |
| (Address of principal executive offices) | (Zip Code) | |
(213) 430-7000
(Registrant’s telephone number, including area code)
Securities registered pursuant to Section 12(g) of the Act:
None
Securities registered pursuant to Section 12(b) of the Act:
Common Stock, no par value, The NASDAQ Stock Market, LLC
Indicate by check mark whether the registrant is a well-known seasoned issuer, as defined in Rule 405 of the Securities Act. Yes ☐ No ☒
Indicate by check mark whether the registrant is not required to file reports pursuant Section 13 or 15(d) of the Exchange act. Yes ☐ No ☒
Indicate by check mark whether the registrant (1) has filed all reports required to be filed by Section 13 or 15(d) of the Securities Exchange Act of 1934 during the preceding 12 months (or for such shorter period that the registrant was required to file such reports), and (2) has been subject to such filing requirements for the past 90 days. Yes ☒ No ☐
Indicate by check mark whether the registrant has submitted electronically and posted on its corporate Web site, if any, every Interactive Data File required to be submitted and posted pursuant to Rule 405 of Regulation S-T (§ 232.405 of this chapter) during the preceding 12 months (or for such shorter period that the registrant was required to submit and post such files). Yes ☒ No ☐
Indicate by check mark if disclosure of delinquent filers pursuant to Item 405 of Regulation S-K is not contained herein, and will not be contained, to the best of registrant’s knowledge, in definitive proxy or information statements incorporated by reference in Part III of this Form 10-K or any amendment to this Form 10-K. Yes ☐ No ☒
Indicate by check mark whether the registrant is a large accelerated filer, an accelerated filer, or a non-accelerated filer. See definition of “accelerated filer and large accelerated filer” in Rule 12b-2 of the Exchange Act. (Check one):
| Large accelerated filer | ☐ | Accelerated Filer | ☒ | |||
| Non Accelerated Filer | ☐ | Smaller Reporting Company | ☐ | |||
Indicate by check mark whether the registrant is a shell company (as defined in Rule 12b-2 of the Exchange Act). Yes ☐ No ☒
As of June 30, 2016, the last business day of the registrant’s most recently completed second fiscal quarter, the aggregate market value of the voting and non-voting common equity held by non-affiliates was approximately $367 million based upon the closing price of shares of the registrant’s Common Stock, no par value, as reported by The NASDAQ Stock Market, LLC.
The number of shares outstanding of the registrant’s common stock (no par value) at the close of business on March 6, 2017 was 17,807,122.
DOCUMENTS INCORPORATED BY REFERENCE
The information required to be disclosed pursuant to Part III of this report either shall be (i) deemed to be incorporated by reference from selected portions of CU Bancorp’s definitive proxy statement for the 2017 Annual Meeting of Shareholders, if such proxy statement is filed with the Securities and Exchange Commission pursuant to Regulation 14A not later than 120 days after the end of the Company’s most recently completed fiscal year, or (ii) included in an amendment to this report filed with the SEC on Form 10-K/A not later than the end of such 120 day period.
Table of Contents
TABLE OF CONTENTS
2
Table of Contents
Forward Looking Statements
In addition to the historical information, this Annual Report on Form 10-K includes forward-looking statements within the meaning of Section 27A of the Securities Act of 1933, as amended, (the “1933 Act”) and Section 21E of the Securities Exchange Act of 1934, as amended (the “1934 Act”). Those sections of the 1933 Act and 1934 Act provide a “safe harbor” for forward-looking statements to encourage companies to provide prospective information about their financial performance so long as they provide meaningful, cautionary statements identifying important factors that could cause actual results to differ significantly from projected results.
The Company’s forward-looking statements include descriptions of plans or objectives of management for future operations, products or services, and forecasts of its revenues, earnings or other measures of economic performance. Forward-looking statements can be identified by the fact that they do not relate strictly to historical or current facts. They often include the words “believe,” “expect,” “intend,” “estimate,” “anticipates,” “project,” “assume,” “plan,” “predict,” or words of similar meaning, or future or conditional verbs such as “will,” “would,” “should,” “could” or “may.”
We make forward-looking statements as set forth above and regarding projected sources of funds, availability of acquisition and growth opportunities, dividends, adequacy of our allowance for loan losses and provision for loan losses, our loan portfolio and subsequent charge-offs. Forward-looking statements involve substantial risks and uncertainties, many of which are difficult to predict and are generally beyond our control. There are many factors that could cause actual results to differ materially from those contemplated by these forward-looking statements. Risks and uncertainties that could cause our financial performance to differ materially from our goals, plans, expectations and projections expressed in forward-looking statements include those set forth in our filings with the SEC, Item 1A of this Annual Report on Form 10-K, and the following:
| • | Current and future economic and market conditions in the United States generally or in the communities we serve, including the effects of declines in property values, high unemployment rates and overall slowdowns in economic growth should these events occur. |
| • | The effects of trade, monetary and fiscal policies and laws. |
| • | Possible losses of businesses and population in the Los Angeles, Orange, Ventura, San Bernardino or Riverside Counties. |
| • | Loss of customer checking and money-market account deposits as customers pursue other higher-yield investments, particularly in a rising rate environment. |
| • | Possible changes in consumer and business spending and saving habits and the related effect on our ability to increase assets and to attract deposits. |
| • | Competitive market pricing factors. |
| • | Risks associated with concentrations including but not limited to concentrations in real estate related loans and concentrations in deposits. |
| • | Loss of significant customers. |
| • | Continued low interest rate environment or interest rate volatility. |
| • | Possible changes in the creditworthiness of customers and the possible impairment of the collectability of loans. |
| • | Changes in the speed of loan prepayments, loan origination and sale volumes, loan loss provisions, charge-offs or actual loan losses. |
| • | Compression of our net interest margin. |
| • | Stability of funding sources and continued availability of borrowings to the extent necessary. |
3
Table of Contents
| • | Changes in legal or regulatory requirements. |
| • | The inability of our risk management controls to prevent or detect all errors or fraudulent acts. |
| • | Inability of our framework to manage risks associated with our business, including but not limited to, operational risk, regulatory risk, cyber risk and credit risk, to mitigate all risk or loss to us. |
| • | Our ability to keep pace with technological changes, including our ability to identify and address cyber-security risks such as data security breaches, “denial of service” attacks, “hacking” and identity theft. |
| • | The effects of man-made and natural disasters, including, but not limited to, earthquakes, floods, droughts, brush fires, tornadoes and hurricanes. |
| • | The effect of labor and port strikes or slowdowns on customer businesses. |
| • | Risks of loss of funding of Small Business Administration or SBA loan programs, or changes in those programs. |
| • | Lack of take-out financing or problems with sales or lease-up with respect to our construction loans. |
| • | Our ability to recruit and retain key management and staff. |
| • | Risks associated with merger and acquisition integration. |
| • | Significant decline in the market value of the Company that could result in an impairment of goodwill. |
| • | Regulatory limits on the Bank’s ability to pay dividends to the Company. |
| • | New accounting pronouncements. |
| • | The impact of the federal and state laws and regulations on the Company’s business operations and competitiveness. |
| • | Our ability to comply with applicable capital and liquidity requirements (including the finalized Basel III capital standards), including our ability to generate capital internally or raise capital on favorable terms. |
| • | Increased regulation of the securities markets, including the securities of the Company, whether pursuant to the Sarbanes-Oxley Act of 2002, or otherwise. |
| • | The satisfaction of the Federal Deposit Insurance Corporation (“FDIC”) and the California Department of Business Oversight (“DBO”) with our compliance with the Consent Order (as defined herein). |
| • | The effects of any damage to our reputation resulting from developments related to any of the items identified above. |
For a more detailed discussion of some of the risk factors, see the section entitled “Risk Factors” below.
Forward-looking statements speak only as of the date they are made. The Company does not undertake to update forward-looking statements to reflect circumstances or events that occur after the date the forward-looking statements are made or to reflect the occurrence of unanticipated events and specifically disclaims any obligation to revise or update such forward looking statements for any reason, except as may be required by applicable law. You should consider any forward looking statements in light of this explanation, and we caution you about relying on forward-looking statements.
4
Table of Contents
General
CU Bancorp, headquartered in Downtown Los Angeles, California, is a bank holding company registered under the Bank Holding Company Act of 1956, as amended, and is also a bank holding company within the meaning of Section 1280 of the California Financial Code. Our principal business is to serve as the holding company for our bank subsidiary, California United Bank, which we refer to as “CUB” or the “Bank”. When we say “we,” “our” or the “Company,” we mean the Company on a consolidated basis with the Bank. When we refer to CU Bancorp or the “holding company,” we are referring to the parent company on a stand-alone basis. The shares of CU Bancorp are listed on the NASDAQ Capital Market under the trading symbol “CUNB”.
CU Bancorp was incorporated as a California corporation on November 16, 2011, and became the holding company for California United Bank on July 31, 2012 by acquiring all the voting stock of California United Bank. The creation of the bank holding company for the Bank was approved by the shareholders of the Bank on July 23, 2012.
California United Bank was incorporated on September 30, 2004, under the laws of the State of California and commenced operations on May 23, 2005. The Bank is authorized to engage in the general commercial banking business and its deposits are insured by the FDIC up to the applicable limits of the law. CUB is a California state-chartered banking corporation and is not a member of the Federal Reserve System.
At year-end 2016, the Company had consolidated total assets of $3.0 billion, total loan balances of $2.0 billion, and total deposits of $2.6 billion. Additional information regarding our business, as well as regarding our acquisitions, is included in the information set forth in Item 7, Management’s Discussion and Analysis of Financial Condition and Results of Operations (“MD&A”) and Note 2, Business Combinations, of the Notes to Consolidated Financial Statements, and is incorporated herein by reference.
The internet address of the Company’s website is www.cubancorp.com. The Company makes available free of charge through the Company’s website, the Company’s annual reports on Form 10-K, quarterly reports on Form 10-Q, current reports on Form 8-K and amendments to these reports. The Company makes these reports available on its website on the same day they appear on the Securities and Exchange Commission (“SEC”) website.
Banking Business
CU Bancorp’s principal business is to serve as the holding company for the Bank and for any other banking or banking related subsidiaries which the Company may establish in the future. We have not engaged in any other material activities to date.
The Bank is a full-service commercial bank offering a broad range of banking products and services designed for small and medium-sized businesses, non-profit organizations, business owners and entrepreneurs, and the professional community, including attorneys, certified public accountants, financial advisors and healthcare providers and investors. Our deposit products include demand, money market, and certificates of deposit. Our loan products include commercial, real estate construction, commercial real estate, SBA and personal loans. We also provide cash management services, online banking, commercial credit cards and other primarily business-oriented products.
The principal executive offices of the Bank and the Company are located at 818 W. 7th Street, Suite 220, Los Angeles, CA, 90017. In addition to the Los Angeles headquarters office of the Bank, the Bank has eight additional full-service branches in the Ventura/Los Angeles/ Orange County/San Bernardino metropolitan area; those branches are located in Encino, West Los Angeles, Valencia, Thousand Oaks, Gardena, Anaheim, Irvine/Newport Beach and Ontario.
5
Table of Contents
Recent Developments
On September 23, 2016, the “Bank entered into a Stipulation to the Issuance of a Consent Order with its bank regulatory agencies, the Federal Deposit Insurance Corporation (“FDIC”) and the California Department of Business Oversight (“CDBO”), consenting to the issuance of a consent order (the “Consent Order”) relating to weaknesses in the Bank’s Bank Secrecy Act and Anti-Money Laundering (collectively “BSA”) compliance program. In consenting to the issuance of the Consent Order, the Bank did not admit or deny any charges of unsafe or unsound banking practices related to the BSA compliance program.
Under the terms of the Consent Order the Bank and/or its Board of Directors is required to take certain actions which include, but are not limited to:
| • | Increasing Board supervision of the BSA compliance program; |
| • | Notification to the regulatory agencies prior to appointment of a new BSA Officer or the executive to whom the BSA Officer reports; |
| • | Formulation of a written action plan describing the actions to be taken to correct BSA/AML related deficiencies, a revised, written BSA/AML compliance program and review and enhancement of the Bank’s BSA risk assessment; |
| • | Performance of a review of BSA staffing needs; |
| • | Enhancement of internal controls to ensure full compliance with the BSA; |
| • | Establishment of an independent testing program for compliance with the BSA rules and regulations; and |
| • | Obtaining regulatory agency consent for expansionary activities such as new branches, offices, delivery channels, products and services. |
The Consent Order resulted in additional BSA compliance expenses for the Bank and the Company (See “Management’s Discussion and Analysis of Financial Condition and Results of Operations — Non-Interest Expense”). It may also have the effect of limiting or delaying the Bank’s and the Company’s ability to obtain regulatory approval for certain expansionary activities, should the Company wish to undertake these activities. The Consent Order does not otherwise impact the Bank’s business activities outside of BSA and does not require the Bank to pay any civil money penalty or require additional capital.
The Consent Order will remain in effect and be enforceable until it is modified, terminated, suspended or set aside by the FDIC and the CBDO. Management and the Board have expressed their full intention to comply with all parts of the Consent Order at the earliest possible date.
In July 2016, Robert Sjogren joined the Bank and Company as an Executive Vice President and its Chief Risk Officer, a newly created executive management position. As Chief Risk Officer, Mr. Sjogren is responsible for overseeing the Company’s risk management function and regulatory compliance, including relationships with key regulators. Mr. Sjogren was previously the Chief Operating Officer of Pacific Mercantile Bancorp and was its General Counsel prior to that.
Strategy
Our strategic objective is to be the premier community-based commercial bank in Southern California, with emphasis on the Greater Los Angeles/Orange/Ventura/San Bernardino and Riverside metropolitan and suburban business areas. The Bank’s value proposition is to provide a premier business banking experience through relationship banking, depth of expertise, resources and products. Our objective is to serve most segments of the business community and industries within our market area. We compete actively for deposits, and emphasize solicitation of core deposits, particularly noninterest-bearing deposits. In managing the top line of our business, we focus on making quality loans and gathering low-cost deposits to maximize our net interest margin and to support growth of a strong and stable loan portfolio.
6
Table of Contents
We maintain a strong community bank philosophy of focusing on and understanding the individualized banking needs of the businesses, professionals, entrepreneurs and other of our core constituents. We believe this focus allows us to be more responsive to our customers’ needs and provide a high level of personal service, which differentiates us from larger competitors. We combine this with experienced, in-market relationship banking officers who provide the full suite of available products to customers. These individuals and the Company’s marketing outreach are supplemented by the various Advisory Director Boards which are established in strategic regions of our market and which provide us with knowledge of the business environment in individual communities and access to local business leaders. We have also established a Director Emeritus Board to retain the expertise and marked acumen of former members of our Board of Directors and the Boards of Premier Commercial Bank and 1st Enterprise. We are also active in charities and non-profit organizations in our market, with a philosophy which emphasizes outstanding corporate citizenship.
We generate our revenue primarily from the interest received on the various loan products and investment securities and fees from providing deposit services and making loans. In sales of the guaranteed portion of SBA loans, we typically receive gains on sale which is also non-interest income. The Bank relies on a foundation of locally generated and relationship-based deposits to fund loans. Our Bank has a relatively low cost of funds compared to its peers due to a high percentage of noninterest-bearing and low cost deposits to total deposits. Other than as discussed herein with regard to ICS™ deposits, we do not currently utilize brokered deposits. Our operations, similar to other financial institutions with operations predominately focused in Southern California, are significantly influenced by economic conditions in Southern California, including the strength of the commercial real estate market, the fiscal and regulatory policies of the federal and state governments and the regulatory authorities that govern financial institutions. See “Supervision and Regulation” below.
We expect to continue to grow our business by building on our business strategy and increasing market share in our key Southern California markets. We believe the demographics and growth characteristics within the communities we serve provide us with significant long-term opportunities for internal or organic growth as well as significant franchise enhancement opportunities to leverage our core competencies when appropriate and achievable.
Products Offered
The Bank offers a full array of competitively priced commercial and personal loan and deposit products, as well as other services delivered directly or through strategic alliances with other service providers. The products offered are aimed at both business and individual customers in our target market.
Loan Products
We offer a diversified mix of business loans encompassing the following loan products: (i) commercial real estate loans; (ii) commercial and industrial loans; (iii) construction loans; and (iv) SBA loans. We also offer home equity lines of credit “HELOCS” to accommodate the needs of business owners and individual clients, as well as personal loans (both secured and unsecured) for that customer segment, and business credit cards to assist businesses with their short term working capital needs. We encourage relationship banking, and often obtain a substantial portion of each borrower’s banking business, including deposit accounts. Other than as set forth below, the Bank does not currently engage in consumer mortgage lending.
Commercial and Multi-Family Real Estate Loans. We originate and underwrite commercial property and multi-family loans principally within our service area. Typically, these loans are held in our loan portfolio and collateralized by the underlying property. The property financed must be supported by current independent third party appraisals at the date of origination (which are reviewed by other independent third parties) and other relevant information.
7
Table of Contents
Commercial and Industrial Loans. These loans comprise a significant portion of our loan portfolio and are made to businesses located in the Southern California region and surrounding communities. These loans are directly underwritten by us. These loans are made to finance operations, to provide working capital, or for specific purposes such as to finance the purchase of assets, equipment or inventory. Our commercial and industrial loans may be secured (other than by real estate) or unsecured. They may take the form of single payment, installment, equipment financing loans (secured by the underlying equipment) or lines of credit. These are generally based on the financial strength and integrity of the borrower and guarantor(s) and generally (with some exceptions) are collateralized by short term assets such as accounts receivable, inventory, equipment, real estate or a borrower’s other business assets. Commercial term loans are typically made to finance the acquisition of fixed assets, refinance short-term debt originally used to purchase fixed assets, or, in rare cases, to finance the purchase of businesses.
Construction, Miniperm Loans, Land Development and Other Land Loans. We originate and underwrite interim land and construction loans as well as miniperm loans, collateralized by first or junior deeds of trust on specific commercial properties which are principally in our primary market areas. Land loans are primarily for entitlements and infrastructure. We originate construction, renovation and conversion loans to businesses on commercial, residential and income producing properties. Our construction loans are generally limited to experienced developers who are known to our management. We impose a limit on the loan to value ratio on all real estate lending. The project financed must be supported by current independent third party appraisals (which are reviewed by other independent third parties), environmental reviews where appropriate and other relevant information. We review each loan request and renewal individually.
SBA Loans. SBA loans are made through programs designed by the federal government to assist the small business community in obtaining financing from financial institutions that are given government guarantees as an incentive to make the loans. The Bank has been designated as an SBA Preferred Lender. Our SBA loans fall into three categories, loans originated under the SBA’s 7a Program (“7a Loans”), loans originated under the SBA’s 504 Program (“504 Loans”) and SBA “Express” Loans. SBA 7a Loans are commercial business loans generally made for the purpose of purchasing real estate to be occupied by the business owner, providing working capital, and/or purchasing equipment or inventory. SBA 504 Loans are collateralized by commercial real estate and are generally made to business owners for the purpose of purchasing or improving real estate for their use and for equipment used in their business.
SBA lending is subject to federal legislation that can affect the availability and funding of the program. From time to time, this dependence on legislative funding causes limitations and uncertainties with regard to the continued funding of such programs, which could potentially have an adverse financial impact on our business.
Home Equity Lines of Credit “HELOCS”. We offer home equity lines of credit “HELOCS”, which are revolving lines of credit collateralized by senior or junior deeds of trust on residential real properties, the applicants for which are generally our individual clientele and the principals and executives of our business customers.
Personal Loans. We offer personal loans. Generally, these are unsecured, but they may be secured by collateral, including deposit accounts or marketable securities. The Bank does not currently originate first trust deed home mortgage loans or home improvement loans.
Business Credit Cards. We originate and underwrite business credit cards to assist businesses with meeting short term working capital needs. Our program allows business clients to provide credit cards to their employees to be used exclusively for business use purposes. The Bank does not currently underwrite consumer credit cards but does participate in an Associate Cardholder Program to provide credit cards to consumers.
8
Table of Contents
Deposit Products
As a full-service commercial bank, we focus deposit generation on relationship accounts, encompassing non-interest bearing demand, interest bearing demand, and money market. In order to facilitate generation of non-interest bearing demand deposits, we require, depending on the circumstances and the type of relationship, our borrowers to maintain deposit balances with us as a typical condition of granting loans. We also offer certificates of deposit and savings accounts. We service our attorney clients by offering Interest on Lawyers’ Trust Accounts, “IOLTA” in accordance with the requirements of the California State Bar. We market deposits by offering the convenience of third party “couriers” or, in appropriate cases armored vehicles, which contract with our customers, as well as a “remote deposit capture” product that allows deposits to be made via computer at the customer’s business location. We also offer customers “e-statements” that allows customers to receive statements electronically, which is more convenient and secure than receiving paper statements, in addition to reducing paper and being environmentally-friendly.
For customers requiring full FDIC insurance on certificates of deposit in excess of $250,000, we offer the ICS™ program, which is a product offered by Promontory Interfinancial Network, LLC and allows the Bank to accept non-interest bearing deposits in excess of the FDIC maximum from a depositor and place the deposits through the ICS™ network into other member banks in increments of less than the FDIC insured maximum in order to provide the depositor full FDIC insurance coverage. The Company does not have any CDARS® reciprocal deposits on its consolidated balance sheet because all of these deposits matured in 2016.These “reciprocal” ICS™ deposits are classified as “brokered” deposits in regulatory reports and are currently the only brokered deposits utilized by the Bank; the Bank considers these deposits to be “core” in nature.
Investment Products
We compete with other larger and multi-state institutions for deposits. We have traditionally offered sophisticated business customers requiring either higher yields or more security investment sweeps into multiple types of money market funds provided by Dreyfus Corporation, a wholly owned subsidiary of Bank of New York Mellon Corporation. All of the funds invest in short-term securities and seek high current income, the preservation of capital and the maintenance of liquidity and each fund favors stability over growth. As a condition to access these products, we require the customer to maintain a certain level of demand deposits. Furthermore, we have also entered into “repurchase agreements” with sophisticated business customers, many of whom act as fiduciaries and require additional security above FDIC deposit insurance. These are essentially borrowings by the Bank, secured by U.S. Government and Agency securities from its investment portfolio. These are disclosed on the Bank’s financial statements as “Securities Sold under Agreements to Repurchase.” We also offer a “repo sweep” product whereby the deposits of qualifying customers are “swept” into repurchase agreements on a daily basis.
Through a third party arrangement with a registered representative of National Planning Corporation, member FINRA/SIPC we offer customers, upon request, the ability to purchase mutual funds, securities, annuities and limited types of insurance. The Bank considers this an ancillary product to its commercial banking activities.
Electronic Banking
While personalized, service-oriented banking is the cornerstone of our business plan, we use technology and the Internet as a secondary means for servicing customers, to compete with larger banks and to provide a convenient platform for customers to review and transact business. We offer sophisticated electronic or “internet banking” opportunities that permit commercial customers to conduct much of their banking business remotely from their business premises. However, our customers will always have the opportunity to personally discuss specific banking needs with knowledgeable bank officers and staff who are directly accessible in the branches and offices as well as by telephone and email.
9
Table of Contents
The Bank offers multiple electronic banking options to its customers. It does not allow the origination of deposit accounts through online banking, nor does it accept loan applications through its online services. All of the Bank’s electronic banking services allow customers to review transactions and statements, review images of paid items, transfer funds between accounts at the Bank, place stop orders, pay bills and export to various business and personal software applications. CUB Online Commercial Banking also allows customers to initiate domestic wire transfers and ACH transactions, with the added security and functionality of assigning discrete access and levels of security to different employees of the client and division of functions to allow separation of duties, such as input and release.
Additionally, we offer Payee Positive Pay, an antifraud service that allows businesses to review all issued checks daily and provides them with the ability to pay or reject any item. ACH Positive Pay is also offered to allow customers to review non-matching ACH transactions efficiently on a daily basis.
We also offer our internet banking customers an additional third party product designed to assist in mitigating fraud risk to both the customer and the Bank in internet banking and other internet activities conducted by the customer, at no cost to the customer.
The Bank has its own “home page” address on the World Wide Web as an additional means of expanding our market and providing banking services through the Internet. Members of the public can also communicate with us through the website. Our website address is: www.californiaunitedbank.com or www.cunb.com.
Other Services
In addition to providing a full complement of lending and deposit products and related services, we provide our customers with many additional services, either directly or through other providers, including, but not limited to, commercial and stand-by letters of credit, domestic and international wire transfers, on site Automated Teller Machines (“ATM’s”) and Visa® Debit Cards and ATM cards. We also provide bank-by-mail services, courier services, armored transport, lock box, cash vault, cash management services, telephone banking, night depositories, commercial credit cards and international services (some of these through arrangements with third parties). Our customers may utilize ATM’s other than California United Bank’s ATM’s; we reimburse our customers for charges for utilization of other banks’ ATM’s up to a maximum of $20 per month.
Competition
The banking business in California, and in our market area, is highly competitive with respect to both loans and deposits and is dominated by a relatively small number of major financial institutions with many offices operating over a wide geographic area, including institutions based outside of California. The increasingly competitive environment faced by banks is a result primarily of changes in laws and regulations, changes in technology and product delivery systems, and the accelerating pace of consolidation among financial services providers. We also compete for loans and deposits with other commercial banks, as well as with finance companies, credit unions, securities and brokerage companies, money market funds and other non-financial institutions. Larger financial institutions offer certain services (such as trust services or wealth management) that we do not offer directly (but some of which we offer indirectly through correspondent institutions or other relationships). These institutions also have the ability to finance extensive advertising campaigns, and have the ability to allocate investment assets to regions of highest yield and demand. By virtue of their greater total capitalization, such institutions also have substantially higher lending limits1 than we have. Customers may also move deposits into the equity and bond markets which also compete with us as an investment alternative.
| 1 | Legal lending limits to each customer are limited to a percentage of a bank’s shareholders’ equity, allowance for loan losses, and capital notes and debentures; the exact percentage depends upon the nature of the loan transaction. |
10
Table of Contents
Our ability to compete is based primarily on the basis of relationship, customer service and responsiveness to customer needs. Our “preferred lender” status with the Small Business Administration allows us to approve SBA loans faster than many of our competitors. We distinguish ourselves with the availability and accessibility of our senior management to customers and prospects. In addition, our knowledge of our markets and industries assists us in locating, recruiting and retaining customers. Our ability to compete also depends on our ability to continue to attract and retain our senior management and experienced relationship managers.
Employees
As of December 31, 2016, we had 291 full-time employees. Our employees are not represented by any union or other collective bargaining agreement.
Financial and Statistical Disclosure
Certain of our statistical information are presented within “Item 6. Selected Financial Data,” “Item 7. Management’s Discussion and Analysis of Financial Condition and Results of Operations” and “Item 7A. Quantitative and Qualitative Disclosure About Market Risk.” This information should be read in conjunction with the consolidated financial statements contained in “Item 8. Financial Statements and Supplementary Data.”
Executive Officers of the Registrant
The names, ages as of December 31, 2016, recent business experience and positions or offices held by each of the executive officers of the Company are as follows:
| Name and Position Held |
Age | Recent Business Experience | ||||
| David I. Rainer, Chief Executive Officer and Chairman of the Board | 59 | Chief Executive Officer and Director of California United Bank since inception in 2005 and of CU Bancorp from inception in 2012. He became Chairman of the Board in June 2009. Mr. Rainer recently completed a second three year term as a member of the Board of Directors of the Federal Reserve Bank of San Francisco, Los Angeles Branch. | ||||
| K. Brian Horton, President and Director | 56 | President and Director of CU Bancorp and California United Bank since December 1, 2014. Prior to joining the Company, Mr. Horton was a Director and President of 1st Enterprise Bank (which was acquired by the Company on November 30, 2014). He was a co-founder of 1st Enterprise. | ||||
| Anne A. Williams, Executive Vice President, Chief Operating Officer, Chief Credit Officer and Director of California United Bank | 57 | Executive Vice President and Chief Credit Officer of California United Bank since 2005 and of CU Bancorp since 2012. Chief Operating Officer of California United Bank since 2008. Director of California United Bank since January 2009. | ||||
| Karen A. Schoenbaum, Executive Vice President and Chief Financial Officer | 54 | Executive Vice President and Chief Financial Officer of California United Bank since October 2009. Executive Vice President and Chief Financial Officer of CU Bancorp since 2012. | ||||
| Robert E. Sjogren, Executive Vice President, Chief Risk Officer | 51 | Executive Vice President and Chief Risk Officer of California United Bank and of CU Bancorp since July 2016. Previously Mr. Sjogren was the Chief Operating Officer of Pacific Mercantile Bank and before that served as its General Counsel. | ||||
| Anita Y. Wolman, Executive Vice President, Chief Administrative Officer, General Counsel and Corporate Secretary | |
65 |
|
Executive Vice President and General Counsel of California United Bank since January 2009 and of CU Bancorp since 2012. She has served as General Counsel of the Bank since its inception. | ||
11
Table of Contents
Supervision and Regulation
General
CU Bancorp and the Bank are subject to significant regulation and restrictions by federal and state laws and regulatory agencies. This regulation is intended primarily for the protection of depositors and the deposit insurance fund, and secondarily for the stability of the U.S. banking system. It is not intended for the benefit of shareholders of financial institutions. The following discussion of statutes and regulations is a summary and does not purport to be complete nor does it address all applicable statutes and regulations. This discussion is also qualified in its entirety by reference to the full text and to the implementation and enforcement of the statutes and regulations referred to in this discussion.
Our profitability, like most financial institutions, is primarily dependent on interest rate differentials (“spreads”). In general, the difference between the interest rates paid by the Bank on interest-bearing liabilities, such as deposits and other borrowings, and the interest rates received by the Bank on interest-earning assets, such as loans extended to customers and securities held in the investment portfolio, will comprise the major portion of our earnings. These rates are highly sensitive to many factors that are beyond our control, such as inflation, recession and unemployment, and the impact which future changes in domestic and foreign economic conditions might have on us cannot be predicted.
Our business is also influenced by the monetary and fiscal policies of the federal government and the policies of regulatory agencies, particularly the Board of Governors of the Federal Reserve System (the “Federal Reserve”). The Federal Reserve implements national monetary policies through its open-market operations in U.S. Government securities by adjusting the required level of reserves for depository institutions subject to its reserve requirements, and by varying the target federal funds and discount rates applicable to borrowings by depository institutions. The monetary policies of the Federal Reserve in these areas influence the growth of loans, investments, and deposits and also affect interest earned on interest-earning assets and paid on interest-bearing liabilities. The nature and impact of any future changes in monetary and fiscal policies on us cannot be predicted.
Initiatives may be proposed or introduced before Congress, the California Legislature, and other government bodies in the future that may further alter the structure, regulation, and competitive relationship among financial institutions and may subject us to increased supervision and disclosure, compliance costs and reporting requirements. In addition, the various bank regulatory agencies often adopt new rules and regulations and policies to implement and enforce existing legislation.
It cannot be predicted whether, or in what form, any such legislation or regulatory changes in policy may be enacted or the extent to which the business of the Bank would be affected thereby. In addition, the outcome of examinations, any litigation, or any investigations initiated by state or federal authorities may result in necessary changes in our operations and increased compliance costs.
Legislation and Regulatory Developments
Dodd Frank Wall Street Reform and Consumer Protection Act
The federal banking agencies continue to implement the remaining requirements in the Dodd-Frank Wall Street Reform and Consumer Protection Act (“Dodd-Frank Act”) as well as promulgating other regulations and guidelines intended to assure the financial strength and safety and soundness of banks and the stability of the U.S. banking system. Following on the implementation in 2014 and effectiveness in 2015 of new capital rules (“the New Capital Rules”) and the so called Volcker Rule restrictions on certain proprietary trading and investment activities, developments in 2016 which may impact the Bank included the implementation of an additional “capital conservation buffer” of 0.625% in 2016 for minimum risk-weighted asset ratios under the New Capital Rules. — See “Capital Adequacy Requirements” and “Management’s Discussion and Analysis of Financial Condition and Results of Operations — Capital Resources”.
12
Table of Contents
On February 3, 2017, President Donald Trump issued an executive order designed to reduce the perceived regulatory burdens of the Dodd-Frank Act. The executive order proclaims that the policy of President Trump’s administration will be to regulate the United States financial system in a manner consistent with a number of “principles” of regulation. President Trump’s order directs the Secretary of the Treasury to consult with the heads of the member agencies of the Financial Stability Oversight Council on the extent to which existing laws, treaties, regulations, guidance, reporting and recordkeeping requirements, and other government policies promote his administration’s regulatory principles and to identify what actions have been taken, and are currently being taken, to promote and support these principles.
In light of President Trump’s executive order, the Company cannot predict which provisions of the Dodd-Frank Act will be repealed, put into effect, delayed or enforced under the current Administration and, therefore, cannot predict the effect, if any, that the Dodd-Frank Act will have on the Company’s future operations and financial condition.
Capital Adequacy Requirements
Bank holding companies and banks are subject to similar regulatory capital requirements administered by state and federal banking agencies. The basic capital rule changes in the New Capital Rules adopted by the federal bank regulatory agencies were fully effective on January 1, 2015, but many elements are being phased in over multiple future years. The risk-based capital guidelines for bank holding companies and, additionally for banks, prompt corrective action regulations (See “Prompt Corrective Action Provisions”), require capital ratios that vary based on the perceived degree of risk associated with a banking organization’s operations for both transactions reported on the balance sheet as assets, such as loans, and those recorded as off-balance sheet items, such as commitments, letters of credit and recourse agreements. The risk-based capital ratio is determined by classifying assets and certain off-balance sheet financial instruments into weighted categories, with higher levels of capital being required for those categories perceived as representing greater risks and dividing its qualifying capital by its total risk-adjusted assets and off-balance sheet items. Capital amounts and classifications are also subject to qualitative judgments by regulators about components, risk weighting, and other factors. To the extent that the new rules are not fully phased in, the prior capital rules continue to apply.
The New Capital Rules revised the previous risk-based and leverage capital requirements for banking organizations to meet requirements of the Dodd-Frank Act and to implement the international Basel Committee on Banking Supervision Basel III agreements. Many of the requirements in the New Capital Rules and other regulations and rules are applicable only to larger or internationally active institutions and not to all banking organizations, including institutions currently with less than $10 billion or assets, which includes the Company and the Bank.
Under the risk-based capital guidelines in place prior to the effectiveness of the New Capital Rules, which trace back to the 1988 Basel I accord, there were three fundamental capital ratios: a total risk-based capital ratio, a Tier 1 risk-based capital ratio and a Tier 1 leverage ratio. To be deemed “well capitalized” a bank must have a total risk-based capital ratio, a Tier 1 risk-based capital ratio, a leverage ratio and a common equity Tier 1 capital ratio of at least ten percent, eight percent, five percent and six and a half percent, respectively.
The following table sets forth the regulatory capital guidelines and the actual capitalization levels for the Company and the Bank as of December 31, 2016:
| Well- Capitalized |
Basel III Minimum with Buffer |
CU Bancorp | California United Bank | |||||||||||||
| (greater than or equal to) | ||||||||||||||||
| Total Risk-Based Capital Ratio |
10.0 | % | 8.625 | % | 11.44 | % | 11.04 | % | ||||||||
| Tier 1 Risk-Based Capital Ratio |
8.0 | % | 6.625 | % | 10.68 | % | 10.28 | % | ||||||||
| Leverage Ratio |
5.0 | % | NA | 9.72 | % | 9.35 | % | |||||||||
| Common Equity Tier 1 Capital Ratio |
6.5 | % | 5.125 | % | 9.61 | % | 10.28 | % | ||||||||
13
Table of Contents
Pursuant to federal regulations, banks must maintain capital levels commensurate with the level of risk to which they are exposed, including the volume and severity of problem loans. Federal regulators may, however, set higher capital requirements when a bank’s particular circumstances warrant and have required many banks and bank holding companies subject to enforcement actions to maintain capital ratios in excess of the minimum ratios otherwise required to be deemed well capitalized, in which case institutions may no longer be deemed well capitalized and may therefore be subject to restrictions on taking brokered deposits. As of December 31, 2016, both the Bank’s and the Company’s leverage capital ratios exceeded regulatory minimums.
The following are the New Capital Rules which became applicable to the Company and the Bank beginning January 1, 2015:
| • | an increase in the minimum Tier 1 capital ratio from 4.00% to 6.00% of risk-weighted assets; |
| • | a new category and a required 4.50% of risk-weighted assets ratio is established for “common equity Tier 1” as a subset of Tier 1 capital limited to common equity; |
| • | a minimum non-risk-based leverage ratio is set at 4.00%; |
| • | changes in the permitted composition of Tier 1 capital to exclude trust preferred securities subject to certain grandfathering exceptions for organizations like the Company which were under $15 billion in assets as of December 31, 2009, mortgage servicing rights and certain deferred tax assets and include unrealized gains and losses on available for sale debt and equity securities unless the organization opts out of including such unrealized gains and losses, which election the Company made in 2016; |
| • | the risk-weights of certain assets for purposes of calculating the risk-based capital ratios are changed for high volatility commercial real estate acquisition, development and construction loans, certain past due non-residential mortgage loans and certain mortgage-backed and other securities exposures; and |
| • | an additional capital conservation buffer of 2.5% of risk weighted assets above the regulatory minimum capital ratios is being phased in until 2019 beginning at 0.625% of risk-weighted assets for 2016, 1.25% of risk-weighted assets for 2017, and 1.875% of risk-weighted assets for 2018, and must be met to avoid limitations on the ability of the Bank to pay dividends, repurchase shares or pay discretionary bonuses. |
Including the capital conservation buffer of 2.5%, the New Capital Rules would result in the following minimum ratios to be considered well capitalized when fully phased in: (i) a Tier 1 risk-based capital ratio of 8.5%, (ii) a common equity Tier 1 capital ratio of 7.0%, (iii) a total risk-based capital ratio of 10.5%, and (iv) a leverage ratio of 5.0%. At December 31, 2016, the respective capital ratios of the Company and the Bank exceeded the minimum percentage requirements to be deemed “well-capitalized” for regulatory purposes — See “Management’s Discussion and Analysis of Financial Condition and Results of Operations — Capital Resources.”
While the New Capital Rules sets higher regulatory capital standards for the Company and the Bank, bank regulators may also continue their past policies of expecting banks to maintain additional capital beyond the new minimum requirements. The need to maintain more and higher quality capital, and greater liquidity going forward than historically has been required, and generally increased regulatory scrutiny with respect to capital levels, could limit the Company’s business activities, including lending, and its ability to expand, either organically or through acquisitions. It could also result in the Company being required to take steps to increase its regulatory capital that may be dilutive to shareholders or limit its ability to pay dividends or otherwise return capital to shareholders, or sell or refrain from acquiring assets, the capital requirements for which are not justified by the assets’ underlying risks. Moreover, U.S. federal banking agencies have been taking into account expectations regarding the ability of banks to meet these new requirements, including under stressed conditions, in approving actions that represent uses of capital, such as dividend increases, share repurchases and acquisitions.
See “Management’s Discussion and Analysis — Capital Resources.”
14
Table of Contents
Management believes that as of December 31, 2016, the Company and the Bank would meet all requirements under the New Capital Rules applicable to them on a fully phased-in basis if such requirements were currently in effect.
Under Dodd Frank, trust preferred securities and cumulative perpetual preferred stock are excluded from Tier 1 capital, unless such securities were issued prior to May 19, 2010 by a bank holding company with less than $15 billion in assets. CU Bancorp assumed approximately $12.4 million of junior subordinated debt securities issued to various business trust subsidiaries of Premier Commercial Bancorp and funded through the issuance of approximately $12.0 million of floating rate capital trust preferred securities. These junior subordinated debt securities were issued prior to May 19, 2010. Because CU Bancorp has less than $15 billion in assets, the trust preferred securities that CU Bancorp assumed from Premier Commercial Bancorp will continue to be included in Tier 1 capital, subject to a limit of 25% of Tier 1 capital elements.
The 16,400 shares of 1st Enterprise Non-Cumulative Perpetual Preferred Stock, Series D that were converted into the right to receive 16,400 shares of the Company’s Non-Cumulative Perpetual Preferred Stock, Series A in the merger of 1st Enterprise Bank with and into the Bank will continue to constitute Tier 1 capital, because non-cumulative perpetual preferred stock remained classified as Tier 1 capital following the enactment of Dodd Frank.
Other Recent Regulatory Developments
In 2016, the federal banking agencies adopted other rules and released various regulatory guidance, including, but not limited to:
| (i) | the release by the Interagency Federal Financial Institutions Examinations Council (“FFIEC”) of a revised “Information Security” booklet, which is one of the eleven booklets which make up the FFIEC Information Technology Examination Handbook (IT Handbook). The revised “Information Security” booklet provides guidance to examiners and addresses factors necessary to assess the level of security risks to a financial institution’s information systems.. |
| (ii) | the release by the FFIEC of final revisions to the Uniform Interagency Consumer Compliance Rating System to reflect the regulatory, supervisory, technological, and market changes that occurred in the years since the system was established. The revisions are designed to more fully align the rating system with the FFIEC agencies’ current risk-based, tailored examination approaches. |
| (iii) | the effectiveness in October 2016 of a new Protections for Prepaid Account Customers rule promulgated by the Consumer Financial Protection Bureau (“CFPB”) requiring financial institutions to limit consumers’ losses when funds are stolen or cards are lost, to investigate and resolve errors, and to give customers free and easy access to account information. The CFPB also finalized new “Know Before You Owe” disclosures for prepaid accounts to give consumers clear, upfront information about fees and other key details. The Bank does not offer prepaid cards. |
| (iv.) | The CFPB and other regulatory agencies have issued final rules changing the reporting requirements for lenders under the HMDA. The new rules expand the range of transactions subject to these requirements to include most securitized residential mortgage loans and credit lines. The rules also increase the overall amount of data required to be collected and submitted, including additional data points about the applicable loans and expanded data about the borrowers. The Bank will be required to begin collecting the expanded data on January 1, 2018. |
Securities Registration and Listing
CU Bancorp’s common stock is registered with the Securities and Exchange Commission (“SEC”) under the Securities Exchange Act of 1934, as amended (the “Exchange Act”). As such, CU Bancorp is subject to the information, proxy solicitation, insider trading, corporate governance, and other disclosure requirements and
15
Table of Contents
restrictions of the Exchange Act, as well as the Securities Act of 1933 (the “Securities Act”), both administered by the SEC. We are required to file annual, quarterly and other current reports with the SEC. The SEC maintains an internet site, http://www.sec.gov, at which all forms accessed electronically may be accessed. Our SEC filings are also available on our website at www.cubancorp.com.
Our securities are listed on the NASDAQ Capital Market and trade under the symbol “CUNB”. As a company listed on the NASDAQ Capital Market, CU Bancorp is subject to NASDAQ standards for listed companies. CU Bancorp is also subject to the Sarbanes-Oxley Act of 2002, the Federal Deposit Insurance Corporation Improvement Act (“FDICIA”), provisions of the Dodd-Frank Act, and other federal and state laws and regulations which address, among other issues, requirements for executive certification of financial presentations, corporate governance requirements for board, audit and compensation committees and their members, as well as disclosure of controls and procedures and internal control over financial reporting, auditing and accounting, executive compensation, and enhanced and timely disclosure of corporate information. NASDAQ has also adopted corporate governance rules, which are intended to allow shareholders and investors to more easily and efficiently monitor the performance of companies and their directors.
Corporate Governance and the JOBS Act
Pursuant to the Sarbanes-Oxley Act, publicly-held companies such as the Company have significant requirements, particularly in the area of external audits, financial reporting and disclosure, conflicts of interest, and corporate governance. The Dodd-Frank Act has added new corporate governance and executive compensation requirements, including mandated resolutions for public company proxy statements such as an advisory vote on executive compensation (more frequently referred to as “say-on-pay” votes) or executive compensation payable in connection with a merger (more frequently referred to as “say-on-golden parachute” votes) and new stock exchange listing standards.
However, CU Bancorp is an “emerging growth company,” as defined in Section 2(a) of the Securities Act of 1933, as amended (the “Securities Act”), as modified by the Jumpstart Our Business Startups Act of 2012 ( the “JOBS Act”) and as a result, CU Bancorp is not yet subject to all of these regulations. CU Bancorp also will not be subject to certain requirements of Section 404 of the Sarbanes-Oxley Act, including the additional level of review of its internal control over financial reporting as may occur when outside auditors attest as to its internal control over financial reporting. The Bank is subject to an additional level of review of its internal controls over financial reporting under FDICIA.
Further, an emerging growth company may elect to delay adoption of new or revised accounting pronouncements applicable to public companies until such pronouncements are made applicable to private companies, but must make such election when the company is first required to file a registration statement. Such an election is irrevocable during the period a company is an emerging growth company. At inception, CU Bancorp elected to take advantage of the benefits of this extended transition period to comply with new or amended accounting pronouncements in the same manner as a private company, although prior to 2013 there were no such accounting pronouncements. During 2013, however, the Company “opted-in” to compliance with new or amended accounting pronouncements in the same fashion as other public companies. As a result, for the year ended December 31, 2016, the Company’s financial statements are comparable to companies which complied with such new or revised accounting standards when originally effective.
CU Bancorp may remain an emerging growth company until the earlier of: (i) the last day of the fiscal year in which it has total annual gross revenues of $1.0 billion or more; (ii) the last day of the fiscal year following the fifth anniversary of the date of the first sale of common equity securities pursuant to an effective registration statement under the Securities Act of 1933, which is fiscal year 2017; (iii) the date on which CU Bancorp has, during the previous three-year period, issued more than $1.0 billion in non-convertible debt; or (iv) the date on which CU Bancorp is deemed to be a “large accelerated filer” under Securities and Exchange Commission regulations (generally, at least $700 million of voting and non-voting equity held by non-affiliates).
16
Table of Contents
Dividends
It is the Federal Reserve’s policy that bank holding companies should generally pay dividends on common stock only out of income available over the past year, and only if prospective earnings retention is consistent with the organization’s expected future needs and financial condition. It is also the Federal Reserve’s policy that bank holding companies should not maintain dividend levels that undermine their ability to be a source of strength to its banking subsidiaries. The Federal Reserve has also discouraged payment ratios that are at maximum allowable levels unless both asset quality and capital are very strong.
The terms of our Subordinated Debentures also limit our ability to pay dividends on our common stock. If we are not current in our payment of dividends in our payment of interest on our Subordinated Debentures, we may not pay dividends on our common stock.
Quarterly dividends are paid to the U.S. Department of the Treasury pursuant to the terms of the CU Bancorp Preferred Stock. The payment of preferred dividends does not require approval from the Federal Reserve and other regulatory agencies.
California law additionally limits the Company’s ability to pay dividends. A corporation may make a distribution/dividend from retained earnings to the extent that the retained earnings exceed (a) the amount of the distribution plus (b) the amount, if any, of dividends in arrears on shares with preferential dividend rights. Alternatively, a corporation may make a distribution/dividend, if, immediately after the distribution, the value of its assets equals or exceeds the sum of (a) its total liabilities plus (b) the liquidation preference of any shares which have a preference upon dissolution over the rights of shareholders receiving the distribution/dividend.
The Bank is a legal entity that is separate and distinct from its holding company. The Company is dependent on the performance of the Bank for funds which may be received as dividends from the Bank for use in the operation of the Company and the ability of the Company to pay dividends to shareholders. Subject to the regulatory restrictions which currently further restrict the ability of the Bank to declare and pay dividends, future cash dividends by the Bank will depend upon management’s assessment of future capital requirements, contractual restrictions, and other factors. When effective, the new minimum capital rule may restrict dividends by the Bank, if the additional capital conservation buffer is not achieved.
The powers of the board of directors of the Bank to declare a cash dividend to the Company is subject to California law, which restricts the amount available for cash dividends to the lesser of a bank’s retained earnings or net income for its last three fiscal years (less any distributions to shareholders made during such period). Where the above test is not met, cash dividends may still be paid, with the prior approval of the DBO in an amount not exceeding the greatest of (1) retained earnings of the bank; (2) the net income of the bank for its last fiscal year; or (3) the net income of the bank for its current fiscal year.
Bank Holding Company Regulation
As a bank holding company, CU Bancorp is registered with and subject to regulation and periodic examination by the Federal Reserve under the Bank Holding Company Act of 1956, as amended, or the BHCA. We are also required to file with the Federal Reserve periodic reports of our operations and such additional information regarding the Company and its subsidiaries as the Federal Reserve may require. CU Bancorp is also a bank holding company within the meaning of Section 1280 of the California Financial Code and is subject to examination by, and may be required to file reports with, the DBO.
Federal Reserve policy historically has required bank holding companies to act as a source of financial strength to their bank subsidiaries and to commit capital and financial resources to support those subsidiaries in circumstances where it might not otherwise do so. Dodd-Frank codified this policy as a statutory requirement. Under this requirement, CU Bancorp is expected to commit resources to support the Bank, including at times
17
Table of Contents
when we may not be in a financial position to do so. Similarly, under the cross-guarantee provisions of the Federal Deposit Insurance Act, the FDIC can hold any FDIC-insured depository institution liable for any loss suffered or anticipated by the FDIC in connection with (i) the default of a commonly controlled FDIC-insured depository institution or (ii) any assistance provided by the FDIC to such a commonly controlled institution.
Pursuant to the BHCA, we are required to obtain the prior approval of the Federal Reserve before we acquire all or substantially all of the assets of any bank or ownership or control of voting shares of any bank if, after giving effect to such acquisition, we would own or control, directly or indirectly, more than 5 percent of such bank. In connection with such transactions, the Federal Reserve is required to consider certain competitive, management, financial, anti-money laundering compliance and other impacts.
Under the BHCA, we may not engage in any business other than managing or controlling banks or furnishing services to our subsidiaries that the Federal Reserve deems to be so closely related to banking as “to be a proper incident thereto.” We are also prohibited, with certain exceptions, from acquiring direct or indirect ownership or control of more than 5 percent of the voting shares of any company unless the company is engaged in banking activities or the Federal Reserve determines that the activity is so closely related to banking as to be a proper incident to banking. The Federal Reserve’s approval must be obtained before the shares of any such company can be acquired and, in certain cases, before any approved company can open new offices.
The BHCA and regulations of the Federal Reserve also impose certain constraints on the redemption or purchase by a bank holding company of its own shares of stock.
Banking subsidiaries of bank holding companies are also subject to certain restrictions imposed by federal and state law in dealing with their holding companies and other affiliates, specifically under Sections 23A and 23B of the Federal Reserve Act and Federal Reserve Regulation W (and similar state statutes). Subject to certain exceptions set forth in the Federal Reserve Act, a bank can make a loan or extend credit to an affiliate, purchase or invest in the securities of an affiliate, purchase assets from an affiliate, accept securities of an affiliate as collateral for a loan or extension of credit to any person or company, issue a guarantee or accept letters of credit on behalf of an affiliate only if the aggregate amount of the above transactions of such subsidiary does not exceed 10 percent of such subsidiary’s capital stock and surplus on an individual basis or 20 percent of such subsidiary’s capital stock and surplus on an aggregate basis. Such transactions must be on terms and conditions that are consistent with safe and sound banking practices and on terms no less favorable than those available from unaffiliated persons. A bank holding company banking subsidiary may not purchase a “low-quality asset,” as that term is defined in the Federal Reserve Act, from an affiliate. Such restrictions also prevent a holding company and its other affiliates from borrowing from a banking subsidiary of the holding company unless the loans are secured by collateral. Dodd-Frank significantly expands the coverage and scope of the limitations on affiliate transactions within a banking organization.
The Federal Reserve has cease and desist powers over parent bank holding companies and non-banking subsidiaries where the action of a parent bank holding company or its non-financial institutions represent an unsafe or unsound practice or violation of law. The Federal Reserve has the authority to regulate debt obligations, other than commercial paper, issued by bank holding companies by imposing interest ceilings and reserve requirements on such debt obligations.
In addition to these explicit limitations, the federal regulatory agencies have general authority to prohibit a banking subsidiary or bank holding company from engaging in an unsafe or unsound banking practice. Depending upon the circumstances, the agencies could take the position that paying a dividend would constitute an unsafe or unsound banking practice.
Subject to certain exceptions, the Bank Holding Company Act and the Change in Bank Control Act, together with the applicable regulations, require Federal Reserve approval (or, depending on the circumstances, no notice of disapproval) prior to any person or company acquiring “control” of a bank or bank holding company.
18
Table of Contents
As a bank holding company, we are required to obtain prior approval from the Federal Reserve before (i) acquiring all or substantially all of the assets of a bank or bank holding company, (ii) acquiring direct or indirect ownership or control of more than 5% of the outstanding voting stock of any bank or bank holding company (unless we own a majority of such bank’s voting shares), or (iii) merging or consolidating with any other bank or bank holding company. In determining whether to approve a proposed bank acquisition, federal bank regulators will consider, among other factors, the effect of the acquisition on competition, the public benefits expected to be received from the acquisition, the projected capital ratios and levels on a post-acquisition basis, and the acquiring institution’s record of addressing the credit needs of the communities it serves, including the needs of low and moderate income neighborhoods, consistent with the safe and sound operation of the bank, under the CRA. In its most recent examination of its CRA activities the Bank maintained its “Outstanding” rating.
Stock Redemptions and Repurchases
It is an essential principle of safety and soundness that a banking organization’s redemption and repurchases of regulatory capital instruments, including common stock, from investors be consistent with the organization’s current and prospective capital needs. In assessing such needs, the board of directors and management of a bank holding company should consider the Dividend Factors discussed previously under “Dividends”. The risk-based capital rules directs bank holding companies to consult with the Federal Reserve before redeeming any equity or other capital instrument included in Tier 1 or Tier 2 capital prior to stated maturity, if such redemption could have a material effect on the level or composition of the organization’s capital base. Bank holding companies experiencing financial weaknesses, or that are at significant risk of developing financial weaknesses, must consult with the appropriate Federal Reserve supervisory staff before redeeming or repurchasing common stock or other regulatory capital instruments for cash or other valuable consideration. Similarly, any bank holding company considering expansion, either through acquisitions or through new activities, also generally must consult with the appropriate Federal Reserve supervisory staff before redeeming or repurchasing common stock or other regulatory capital instruments for cash or other valuable consideration. In evaluating the appropriateness of a bank holding company’s proposed redemption or repurchase of capital instruments, the Federal Reserve will consider the potential losses that the holding company may suffer from the prospective need to increase reserves and write down assets from continued asset deterioration and the holding company’s ability to raise additional common stock and other Tier 1 capital to replace capital instruments that are redeemed or repurchased. A bank holding company must inform the Federal Reserve of a redemption or repurchase of common stock or perpetual preferred stock for cash or other value resulting in a net reduction of the bank holding company’s outstanding amount of common stock or perpetual preferred stock below the amount of such capital instrument outstanding at the beginning of the quarter in which the redemption or repurchase occurs. In addition, a bank holding company must advise the Federal Reserve sufficiently in advance of such redemptions and repurchases to provide reasonable opportunity for supervisory review and possible objection should the Federal Reserve determine a transaction raises safety and soundness concerns.
Regulation Y requires that a bank holding company that is not well capitalized or well managed, or that is subject to any unresolved supervisory issues, provide prior notice to the Federal Reserve for any repurchase or redemption of its equity securities for cash or other value that would reduce by 10% or more the holding company’s consolidated net worth aggregated over the preceding 12-month period.
Annual Reporting; Examinations
The holding company is required to file an annual report with the Federal Reserve, and such additional information as the Federal Reserve may require. The Federal Reserve may examine a bank holding company and any of its subsidiaries, and charge the company for the cost of such an examination.
19
Table of Contents
Imposition of Liability for Undercapitalized Subsidiaries
FDICIA requires bank regulators to take “prompt corrective action” to resolve problems associated with insured depository institutions. In the event an institution becomes “undercapitalized,” it must submit a capital restoration plan. The capital restoration plan will not be accepted by the regulators unless each company “having control of” the undercapitalized institution “guarantees” the subsidiary’s compliance with the capital restoration plan until it becomes “adequately capitalized.” For purposes of this statute, the holding company has control of the Bank. Under FDICIA, the aggregate liability of all companies controlling a particular institution is limited to the lesser of five percent of the depository institution’s total assets at the time it became undercapitalized or the amount necessary to bring the institution into compliance with applicable capital standards. FDICIA grants greater powers to bank regulators in situations where an institution becomes “significantly” or “critically” undercapitalized or fails to submit a capital restoration plan. For example, a bank holding company controlling such an institution can be required to obtain prior Federal Reserve approval of proposed distributions, or might be required to consent to a merger or to divest the troubled institution or other affiliates.
State Law Restrictions
As a California corporation, the holding company is subject to certain limitations and restrictions under applicable California corporate law. For example, state law restrictions in California include limitations and restrictions relating to indemnification of directors, distributions and dividends to shareholders (discussed above), transactions involving directors, officers or interested shareholders, maintenance of books, records, and minutes, and observance of certain corporate formalities.
Bank Regulation
The Bank, as a California state-chartered bank, is subject to primary supervision and examination by the DBO, as well as the FDIC. Under the Federal Deposit Insurance Act (“FDI Act”) and the California Financial Code, California state chartered commercial banks may generally engage in any activity permissible for national banks. Therefore, the Bank may form subsidiaries to engage in the many so-called “closely related to banking” or “nonbanking” activities commonly conducted by national banks in operating subsidiaries or subsidiaries of bank holding companies. Further, pursuant to amendments enacted by the GLB Act, California banks may conduct certain “financial” activities in a subsidiary to the same extent as may a national bank, provided the bank is and remains “well-capitalized,” “well-managed” and in satisfactory compliance with the CRA, which requires banks to help meet the credit needs of the communities in which they operate. The Bank currently has no financial subsidiaries.
Specific federal and state laws and regulations which are applicable to banks regulate, among other things, the scope of their business, their investments, their reserves against deposits, the timing of the availability of deposited funds, the nature and amount of and collateral for certain loans, borrowings, capital requirements, certain check-clearing activities, branching, and mergers and acquisitions.
California banks are also subject to various federal statutes and regulations including Federal Reserve Regulation O, Federal Reserve Act Sections 23A and 23B and Regulation W and similar state statutes, which restrict or limit loans or extensions of credit to “insiders,” including officers, directors and principal shareholders, and loans or extension of credit by banks to affiliates or purchases of assets from affiliates, including parent bank holding companies, except pursuant to certain exceptions and terms and conditions at least as favorable to those prevailing for comparable transactions with unaffiliated parties.
The Bank is a member of the Federal Home Loan Bank (“FHLB”) of San Francisco. Among other benefits, each FHLB serves as a reserve or central bank for its members within its assigned region and makes available loans or advances to its members. Each FHLB is financed primarily from the sale of consolidated obligations of the FHLB system. As an FHLB member, the Bank is required to own a certain amount of capital stock in the FHLB. At December 31, 2016, the Bank was in compliance with the FHLB’s stock ownership requirement and our investment in FHLB capital stock totaled $9.1 million.
20
Table of Contents
In addition to the foregoing, the following summary identifies some of the more significant laws, regulations, and policies that affect our operations; it is not intended to be a complete listing or description of all laws and regulations that apply to us and is qualified in its entirety by reference to the applicable laws and regulations.
Supervision and Enforcement Authority
The federal and California regulatory structure gives the bank regulatory agencies extensive discretion in connection with their supervisory and enforcement activities and examination policies, including policies with respect to the classification of assets and the establishment of adequate loan loss reserves for regulatory purposes. The regulatory agencies have adopted guidelines to assist in identifying and addressing potential safety and soundness concerns before an institution’s capital becomes impaired. The guidelines establish operational and managerial standards generally relating to: (1) internal controls, information systems, and internal audit systems; (2) loan documentation; (3) credit underwriting; (4) interest-rate exposure; (5) asset growth and asset quality; and (6) compensation, fees and benefits. Further, the regulatory agencies have adopted safety and soundness guidelines for asset quality and for evaluating and monitoring earnings to ensure that earnings are sufficient for the maintenance of adequate capital and reserves. If, as a result of an examination, the DBO or the FDIC should determine that the financial condition, capital resources, asset quality, earnings prospects, management, liquidity, or other aspects of the Bank’s operations are unsatisfactory or that the Bank or its management is violating or has violated any law or regulation, the DBO and the FDIC, and separately the FDIC, as insurer of the Bank’s deposits, have residual authority to:
| • | Require affirmative action to correct any conditions resulting from any violation or practice; |
| • | Direct an increase in capital and the maintenance of higher specific minimum capital ratios, which may preclude the Bank from being deemed well-capitalized and restrict its ability to accept certain brokered deposits; |
| • | Restrict the Bank’s growth geographically, by products and services, or by mergers and acquisitions; |
| • | Enter into informal or formal enforcement orders, including memoranda of understanding, written agreements and consent or cease and desist orders or prompt corrective action orders to take corrective action and cease unsafe and unsound practices; |
| • | Require prior approval of senior executive officer or director changes; remove officers and directors and assess civil monetary penalties; and |
| • | Terminate FDIC insurance, revoke the charter and/or take possession of and close and liquidate the Bank or appoint the FDIC as receiver. |
Prompt Corrective Action Authority
The Federal Deposit Insurance Act requires the federal bank regulatory agencies to take “prompt corrective action” with respect to a depository institution if that institution does not meet certain capital adequacy standards, including requiring the prompt submission of an acceptable capital restoration plan. Depending on the bank’s capital ratios, the agencies’ regulations define five categories in which an insured depository institution will be placed: well-capitalized, adequately capitalized, undercapitalized, significantly undercapitalized, and critically undercapitalized. At each successive lower capital category, an insured bank is subject to more restrictions, including restrictions on the bank’s activities, operational practices or the ability to pay dividends or executive bonuses. Based upon its capital levels, a bank that is classified as well-capitalized, adequately capitalized, or undercapitalized may be treated as though it were in the next lower capital category if the appropriate federal banking agency, after notice and opportunity for hearing, determines that an unsafe or unsound condition, or an unsafe or unsound practice, warrants such treatment.
21
Table of Contents
The prompt corrective action standards were also changed as the New Capital Rules ratios became effective. Under the new standards, in order to be considered well-capitalized, the bank will be required to meet the new common equity Tier 1 ratio of 6.5%, an increased Tier 1 ratio of 8% (increased from 6%), a total capital ratio of 10% (unchanged) and a leverage ratio of 5% (unchanged).
The federal banking agencies also may require banks and bank holding companies subject to enforcement actions to maintain capital ratios in excess of the minimum ratios otherwise required to be deemed well-capitalized, in which case institutions may no longer be deemed to be well-capitalized and may therefore be subject to certain restrictions such as taking brokered deposits.
The prompt corrective action standards were changed when the new capital rule ratios become effective as discussed under “Legislation and Regulatory Developments.”
Brokered Deposit Restrictions
Well-capitalized institutions are not subject to limitations on brokered deposits, while an adequately capitalized institution is able to accept, renew or roll over brokered deposits only with a waiver from the FDIC and subject to certain restrictions on the yield paid on such deposits. Undercapitalized institutions are generally not permitted to accept, renew, or roll over brokered deposits. CUB is eligible to accept brokered deposits but, except with regard to ICS™ products, does not utilize brokered deposits at this time and has no current intention of doing so in the near term.
Loans to One Borrower
With certain limited exceptions, the maximum amount that a California bank may lend to any borrower at any one time (including the obligations to the bank of certain related entities of the borrower) may not exceed 25 percent (and unsecured loans may not exceed 15 percent) of the bank’s shareholders’ equity, allowance for loan loss, and any capital notes and debentures of the bank. The Bank by policy has lower “house limits” that it generally will not exceed without the approval of the Chief Credit Officer and the Chief Executive Officer or the President and in limited circumstances (absence of approving officers) by the Chairman of the Board of Directors Loan Committee and the Chief Credit Officer or by the Chairman of the Board of Directors Loan Committee and the CEO or the President.
Extensions of Credit to Insiders and Transactions with Affiliates
The Federal Reserve Act and Federal Reserve Regulation O place limitations and conditions on loans or extensions of credit to a bank or bank holding company’s executive officers, directors and principal shareholders (i.e., in most cases, those persons who own, control or have power to vote more than 10 percent of any class of voting securities); any company controlled by any such executive officer, director or shareholder; or any political or campaign committee controlled by such executive officer, director or principal shareholder.
Such loans and leases must comply with loan-to-one-borrower limits; require prior full board approval when aggregate extensions of credit to the person exceed specified amounts; must be made on substantially the same terms (including interest rates and collateral) and follow credit-underwriting procedures no less stringent than those prevailing at the time for comparable transactions with non-insiders; must not involve more than the normal risk of repayment or present other unfavorable features; and in the aggregate must not exceed the bank’s unimpaired capital and unimpaired surplus. The California Financial Code and DBO regulations adopt and apply Regulation O to the Bank and provide additional limitations on loans to affiliates.
22
Table of Contents
Affiliate Transactions
The Bank also is subject to certain restrictions imposed by Federal Reserve Act Sections 23A and 23B, as amended by Dodd-Frank, and Federal Reserve Regulation W on any extensions of credit by the Bank to, or the issuance of a guarantee or letter of credit on behalf of, any affiliates or insiders, the purchase of, or investments in, stock or other securities thereof, the taking of such securities as collateral for loans, and the purchase of assets of any affiliates or insiders.
Additional restrictions on transactions with affiliates may be imposed on the Bank under the FDI Act’s prompt corrective action regulations and the supervisory authority of the federal and state banking agencies.
Deposit Insurance
The FDIC is an independent federal agency that insures deposits, up to prescribed statutory limits, of federally insured banks and savings institutions and safeguards the safety and soundness of the banking and savings industries. The FDIC insures our customer deposits through the Deposit Insurance Fund (the “DIF”) up to prescribed limits for each depositor. Pursuant to Dodd-Frank, the maximum deposit insurance amount has been permanently increased to $250,000 per depositor. As required by Dodd-Frank, the FDIC adopted a DIF restoration plan which became effective on January 1, 2011. Among other things, the plan: (1) raises the minimum designated reserve ratio, which the FDIC is required to set each year, to 1.35 percent and removes the upper limit on the designated reserve ratio and consequently on the size of the fund; (2) requires that the fund reserve ratio reach 1.35 percent by 2020; (3) eliminates the requirement that the FDIC provide dividends from the fund when the reserve ratio is between 1.35 percent and 1.5 percent; and (4) continues the FDIC’s authority to declare dividends when the reserve ratio at the end of a calendar year is at least 1.5 percent. The FDIC has set a long-term goal of getting its reserve ratio up to 2% of insured deposits by 2027.
In 2016 our FDIC insurance assessment was $1.5 million. The FDIC may terminate a depository institution’s deposit insurance upon a finding that the institution’s financial condition is unsafe or unsound or that the institution has engaged in unsafe or unsound practices that pose a risk to the DIF or that may prejudice the interest of the bank’s depositors. The termination of deposit insurance for a bank would also result in the revocation of the bank’s charter by the DBO.
Depositor Preference
The Federal Deposit Insurance Act provides that, in the event of the “liquidation or other resolution” of an insured depository institution, the claims of depositors of the institutions, including the claims of the FDIC as subrogee of insured depositors, and certain claims for administrative expenses of the FDIC as a receiver, will have priority over other general unsecured claims against the institution. If an insured depository institution fails, insured and uninsured depositors, along with the FDIC, will have priority in payment ahead of unsecured non-deposit creditors, with respect to any extensions of credit they have made to such insured depository institution.
Anti-Money Laundering and OFAC Regulation
A major focus of governmental policy on financial institutions in recent years has been aimed at combating money laundering and terrorist financing. The Bank Secrecy Act of 1970 (“BSA”) and subsequent laws and regulations require the Bank to take steps to prevent the use of the Bank or its systems from facilitating the flow of illegal or illicit money and to file suspicious activity reports.
An institution such as the Bank must provide anti-money laundering (“AML”) training to employees, designate an AML compliance officer and annually audit the AML program to assess its effectiveness. The federal regulatory agencies continue to issue regulations and new guidance with respect to the application and
23
Table of Contents
requirements of BSA and AML. The United States has imposed economic sanctions that affect transactions with designated foreign countries, nationals and others. Based on their administration by Treasury’s Office of Foreign Assets Control (“OFAC”), these are typically known as the “OFAC” rules. Failure of a financial institution to maintain and implement adequate BSA, AML and OFAC programs, or to comply with all of the relevant laws or regulations, could have serious legal and reputational consequences for the institution.
As discussed previously in “Recent Events” in 2016 the Bank entered into a Consent Order with the FDIC and the DBO requiring the Bank to take corrective actions and enhancements to address certain deficiencies within the BSA/AML compliance program. No criminal activity has been identified as a result of such deficiencies, and no financial penalty was levied. The Bank has already taken significant steps toward the improvement of its BSA/AML program including additional investment in employees, continued emphasis on education, training and the importance of compliance by all employees and the hiring of a highly experienced BSA/AML professional and a Chief Risk Officer to oversee these efforts. Management and the Board have expressed their full intention to comply with all parts of the Consent Order at the earliest possible date. The Bank expects risks in this area to continually evolve and regulatory expectations to escalate.
Community Reinvestment Act
Under the CRA, the Bank has a continuing and affirmative obligation consistent with safe and sound banking practices to help meet the credit needs of its entire community, including low and moderate income neighborhoods. CRA does not establish specific lending requirements or programs for financial institutions nor does it limit an institution’s discretion to develop the types of products and services that it believes are best suited to its particular community, consistent with CRA. CRA generally requires the federal banking agencies to evaluate the record of a financial institution in meeting the credit needs of its local communities and to take that record into account in its evaluation of certain applications by such institution, such as applications for charters, branches and other deposit facilities, relocations, mergers, consolidations and acquisitions or engage in certain activities pursuant to the GLB Act. The Bank currently falls under the “large bank” category for CRA purposes. An unsatisfactory rating may be the basis for denying an application. Based on its most recent examination report in 2016, the Bank maintained an overall CRA rating of “Outstanding,” the highest rating possible.
Consumer Compliance and Fair Lending Laws
The Bank is subject to a number of federal and state laws designed to protect borrowers and promote lending to various sectors of the economy and population. These laws include the USA PATRIOT Act of 2001, the Bank Secrecy Act, the Foreign Account Tax Compliance Act (effective 2013), the CRA, the Fair Debt Collection Practices Act, as amended by the Fair and Accurate Credit Transactions Act, the Equal Credit Opportunity Act, the Truth in Lending Act, the Fair Housing Act, the Home Mortgage Disclosure Act, the Real Estate Settlement Procedures Act, the National Flood Insurance Act, various state law counterparts, and the Consumer Financial Protection Act of 2010, which constitutes part of Dodd-Frank and is discussed in further detail below. The enforcement of Fair Lending laws has been an increasing area of focus for regulators. Fair Lending laws related to extensions of credit are included in The Equal Credit Opportunity Act and the Fair Housing Act, which prohibit discrimination in residential real estate and credit transactions based on race, color, national origin, sex, marital status, familial status, religion, age, physical ability, the fact that all or part of the applicant’s income derives from a public assistance program or the fact that the applicant has exercised any right under the Consumer Credit Protection Act.
In addition, federal law and certain state laws (including California) currently contain client privacy protection provisions. These provisions limit the ability of banks and other financial institutions to disclose non-public information about consumers to affiliated companies and non-affiliated third parties.
24
Table of Contents
Dodd-Frank provided for the creation of the CFPB as an independent entity within the Federal Reserve with broad rulemaking, supervisory and enforcement authority over consumer financial products and services, including deposit products, residential mortgages, home-equity loans and credit cards. The bureau’s functions include investigating consumer complaints, conducting market research, rulemaking, supervising and examining bank consumer transactions, and enforcing rules related to consumer financial products and services. CFPB regulations and guidance apply to all financial institutions and banks with $10 billion or more in assets are subject to examination by the CFPB. Banks with less than $10 billion in assets, including the Bank, will continue to be examined for compliance by their primary federal banking agency.
Customer Information Security
The Federal Reserve and other bank regulatory agencies have adopted guidelines for safeguarding confidential, personal customer information. These guidelines require each financial institution, under the supervision and ongoing oversight of its board of directors or an appropriate committee thereof, to create, implement and maintain a comprehensive written information security program designed to ensure the security and confidentiality of customer information, protect against any anticipated threats or hazard to the security or integrity of such information and protect against unauthorized access to or use of such information that could result in substantial harm or inconvenience to any customer. We have adopted a customer information security program designed to comply with such requirements.
Privacy
The Gramm-Leach-Bliley Act of 1999 and the California Financial Information Privacy Act require financial institutions to implement policies and procedures regarding the disclosure of nonpublic personal information about consumers to non-affiliated third parties. In general, the statutes require explanations to consumers on policies and procedures regarding the disclosure of such nonpublic personal information and, except as otherwise required by law, prohibit disclosing such information except as provided in the Bank’s policies and procedures. CUB has implemented privacy policies addressing these restrictions which are distributed regularly to all existing and new customers of the Bank.
Available Information
We maintain an Internet website for CU Bancorp at www.cubancorp.com and a website for CUB at www.californiaunitedbank.com. At www.cubancorp.com and via the “Investor Relations” link at the Bank’s website, our annual report on Form 10-K, quarterly reports on Form 10-Q, current reports on Form 8-K and amendments to such reports filed or furnished pursuant to Section 13(a) or 15(d) of the Exchange Act are available, free of charge, as soon as reasonably practicable after such forms are electronically filed with, or furnished to, the SEC. The public may read and copy any materials we file with the SEC at the SEC’s Public Reference Room, located at 100 F Street, NE, Washington, D.C. 20549. The public may obtain information on the operation of the Public Reference Room by calling the SEC at 1-800-SEC-0330. The SEC also maintains an Internet website at http://www.sec.gov that contains reports, proxy and information statements, and other information regarding issuers that file electronically with the SEC. You may obtain copies of the Company’s filings on the SEC site. These documents may also be obtained in print upon request by our shareholders to our Investor Relations Department.
We have adopted a written code of ethics that applies to all directors, officers and employees of the Company, including our principal executive officer and senior financial officers, in accordance with Section 406 of the Sarbanes-Oxley Act of 2002 and the rules of the Securities and Exchange Commission promulgated thereunder. The code of ethics, which we call our Principles of Business Conduct and Ethics, is available on our corporate website, www.cubancorp.com in the section entitled “Corporate Governance.” In the event that we make changes in, or provide waivers from, the provisions of this code of ethics that the SEC requires us to disclose, we intend to disclose these events on our corporate website in such section. In the Corporate
25
Table of Contents
Governance section of our corporate website, we have also posted the charters for our Audit and Risk Committee and our Compensation, Nominating and Corporate Governance Committee. In addition, information concerning purchases and sales of our equity securities by our executive officers and directors is posted on our website.
Our Investor Relations Department can be contacted at CU Bancorp, 818 W. 7th Street, Suite 220, Los Angeles, CA, 90017, Attention: Investor Relations, or by telephone at (213) 430-7000.
All website addresses given in this document are for information only and are not intended to be an active link or to incorporate any website information into this document.
In addition to the other information on the risks we face and our management of risk contained in this Annual Report on Form 10-K or in our other SEC filings, the following are significant risks which may affect us. Events or circumstances arising from one or more of these risks could adversely affect our business, financial condition, operating results and prospects and the value and price of our common stock could decline. The risks identified below are not intended to be a comprehensive list of all risks we face and additional risks that we may currently view as not material may also impair our business operations and results.
Readers and prospective investors in our securities should carefully consider the following risk factors as well as the other information contained or incorporated by reference in this report. This report is qualified in its entirety by these risk factors.
RISKS RELATED TO THE BANKING INDUSTRY
Difficult Economic and Market Conditions Have Adversely Affected Our Industry in the Past and May in the Future
Our financial performance generally, and the ability of borrowers to pay interest on and repay the principal of outstanding loans and the value of the collateral securing those loans, is highly dependent upon the business and economic conditions in the markets in which we operate and in the United States as a whole. Economic pressures on consumers and businesses may adversely affect our business, financial condition, results of operations and stock price. In particular, we may face the following risks in connection with these events:
| • | Our banking operations are concentrated primarily in southern California. Deterioration of economic conditions in Southern California could impair borrowers’ ability to service their loans, decrease the level and duration of deposits by customers, and erode the value of loan collateral. These conditions could increase the amount of our non-performing assets and have an adverse effect on our efforts to collect our non-performing loans or otherwise liquidate our non-performing assets (including other real estate owned) on terms favorable to us, if at all, and could also cause a decline in demand for our products and services, or a lack of growth or a decrease in deposits, any of which may cause us to incur losses, adversely affect our capital, and hurt our business. |
Disruptions in the Real Estate Market Could Materially and Adversely Affect Our Business
While overall the U.S. economy has experienced a prolonged low interest rate environment The Southern California real estate market has recovered from what had been a substantial decline and now appears to be at new highs. At December 31, 2016, 58% and 9% of our total gross loans were comprised of commercial real estate and construction loans, respectively. Of the commercial real estate loans, 42% was non-owner-occupied. Any new downturn in the real estate market could materially and adversely affect our business because a significant portion of our loans are secured by real estate. Our ability to recover on defaulted loans by selling the real estate collateral would then be diminished and we would be more likely to suffer losses on loans. Substantially all of our real property collateral is located in Southern California. If there is a decline in real estate
26
Table of Contents
values, especially in Southern California, the collateral for our loans would provide less security. Real estate values could be affected by, among other things, a decline in economic conditions, an increase in foreclosures, a decline in real property sale volumes, a significant increase in interest rates, increased levels of unemployment, drought, earthquakes, brush fires and other natural disasters particular to California. Furthermore, due to the recovery of the California real estate market, many of our customers have been selling real estate and generating deposits in the Bank; in the event of a commercial real estate downturn these could be withdrawn and reinvested in commercial real estate reducing the Bank’s overall deposits.
Additional Requirements Imposed by the Dodd-Frank Act and Related Regulation Could Adversely Affect Us
The Dodd-Frank Act imposed additional regulatory requirements including the following:
| • | the establishment of strengthened capital and liquidity requirements for banks and bank holding companies, including minimum leverage and risk-based capital requirements no less than the strictest requirements in effect for depository institutions as of the date of enactment; |
| • | the requirement by statute that bank holding companies serve as a source of financial strength for their depository institution subsidiaries; |
| • | enhanced regulation of financial markets, including the derivative and securitization markets, and the elimination of certain proprietary trading activities by banks; |
| • | additional corporate governance and executive compensation requirements; enhanced financial institution safety and soundness regulations, |
| • | revisions in FDIC insurance assessments; and |
| • | the creation of new regulatory bodies, such as the Bureau of Consumer Financial Protection and the Financial Services Oversight Counsel. |
Some of the provisions remain subject to final rulemaking and/or implementation. Accordingly, we cannot fully assess its impact on our operations and costs.
Current and future executive, legal and regulatory requirements, restrictions, and regulations, including those imposed under Dodd-Frank, may adversely impact our profitability and may have a material and adverse effect on our business, financial condition, and results of operations. We may also be required to invest significant management attention and resources to evaluate and make changes required by the legislation and related regulations and may make it more difficult for us to attract and retain qualified executive officers and employees.
Significant Changes in Banking Laws or Regulations and Federal Monetary Policy Could Materially Affect Our Business
The banking industry is subject to extensive federal and state regulation, and significant new laws and regulations or changes in, or repeals of, existing laws and regulations may cause results to differ materially. Also, federal monetary policy, particularly as implemented through the Federal Reserve System, significantly affects our credit conditions, primarily through open market operations in U.S. government securities, the discount rate for member bank borrowing, and bank reserve requirements. A material change in these conditions would affect our results. Federal and state regulatory agencies also frequently adopt changes to their regulations or change the manner in which existing regulations are applied. For further discussion of the regulation of financial services, see “Supervision and Regulation.”
We cannot predict the substance or impact of any change in regulation, whether by regulators or as a result of legislation, or in the way such statutory or regulatory requirements are interpreted or enforced. Compliance
27
Table of Contents
with such current and potential regulation and scrutiny may significantly increase our costs, impede the efficiency of our internal business practices, require us to increase our regulatory capital and limit our ability to pursue business opportunities in an efficient manner.
We are subject to extensive laws, regulations and supervision, and may become subject to future laws, regulations and supervision, if any, that may be enacted, which could limit or restrict our activities, may hamper our ability to increase our assets and earnings, and could adversely affect our profitability.
Bank Clients Could Move Their Money to Alternative Investments Causing Us to Lose a Lower Cost Source of Funding
Demand deposits can decrease when clients perceive alternative investments, as providing a better risk/return tradeoff. Technology and other changes have made it more convenient for bank customers to transfer funds into alternative investments or other deposit accounts offered by other out-of-area financial institutions or non-bank service providers. Additionally, if the economy continues to trend upward, customers may withdraw deposits to utilize them to fund business expansion or equity investment. Moreover, should interest rates rise this may impact the Bank’s ability to maintain its current percentage of non-interest bearing deposits. When clients move money out of bank demand deposits, particularly non-interest bearing deposits, we lose a relatively low cost source of funds, increasing our funding costs and reducing our net interest income.
Several rating agencies publish unsolicited ratings of the financial performance and relative financial health of many banks, including CUB, based on publicly available data. As these ratings are publicly available, a decline in the Bank’s ratings may result in deposit outflows or the inability of the Bank to raise deposits in the secondary market as broker-dealers and depositors may use such ratings in deciding where to deposit their funds.
Our Business Is Subject To Interest Rate Risk and Fluctuations in Interest Rates Could Reduce Our Net Interest Income and Adversely Affect Our Business.
A substantial portion of our income is derived from the differential, or “spread,” between the interest earned on loans, investment securities and other interest-earning assets, and the interest paid on deposits, borrowings and other interest-bearing liabilities. The interest rate risk inherent in our lending, investing, and deposit taking activities is a significant market risk to us and our business. Income associated with interest earning assets and costs associated with interest-bearing liabilities may not be affected uniformly by fluctuations in interest rates. The magnitude and duration of changes in interest rates, events over which we have no control, may have an adverse effect on net interest income. Prepayment and early withdrawal levels, which are also impacted by changes in interest rates, can significantly affect our assets and liabilities. Increases in interest rates may adversely affect the ability of our floating rate borrowers to meet their higher payment obligations, which could in turn lead to an increase in non-performing assets and net charge-offs.
Generally, the interest rates on our interest-earning assets and interest-bearing liabilities do not change at the same rate, to the same extent, or on the same basis. Even assets and liabilities with similar maturities or periods of re-pricing may react in different degrees to changes in market interest rates. Interest rates on certain types of assets and liabilities may fluctuate in advance of changes in general market interest rates, while interest rates on other types of assets and liabilities may lag behind changes in general market rates. Certain assets, such as adjustable rate loans, may have features such as floors that limit changes in interest rates on a short-term basis.
After a seven year stimulus campaign known as quantitative easing, in December 2015 the Federal Reserve decided to raise short-term interest rates for the first time since the 2008 financial crisis. An additional increase was implemented in December, 2016.
28
Table of Contents
We seek to minimize the adverse effects of changes in interest rates by structuring our asset-liability composition to obtain the maximum spread. We use interest rate sensitivity analysis and a simulation model to assist us in managing asset-liability composition. However, such management tools have inherent limitations that impair their effectiveness.
The Fiscal and Monetary Policies Of the Federal Government and Its Agencies Could Have a Material Adverse Effect On Our Earnings.
The Federal Reserve regulates the supply of money and credit in the U.S. Its policies determine in large part the cost of funds for lending and investing and the return earned on those loans and investments, both of which affect the net interest margin. They can also materially decrease the value of financial assets we hold. Federal Reserve policies can also adversely affect borrowers, potentially increasing the risk that they may fail to repay their loans, or could adversely create asset bubbles which result from prolonged periods of accommodative policy, and which in turn result in volatile markets and rapidly declining collateral values. Changes in Federal Reserve policies are beyond our control and difficult to predict.
Inflation and Deflation May Adversely Affect Our Financial Performance
The Consolidated Financial Statements and related financial data presented in this report have been prepared in accordance with accounting principles generally accepted in the United States. These principles require the measurement of financial position and operating results in terms of historical dollars, without considering changes in the relative purchasing power of money over time due to inflation or deflation. The primary impact of inflation on our operations is reflected in increased operating costs. Conversely, deflation will tend to erode collateral values and diminish loan quality. Virtually all of our assets and liabilities are monetary in nature. As a result, interest rates have a more significant impact on our performance than the general levels of inflation or deflation
The Company Has Liquidity Risk
Liquidity risk is the risk that the Company will have insufficient cash or access to cash to satisfy current and future financial obligations, including demands for loans and deposit withdrawals, funding operating costs, and for other corporate purposes. An inability to raise funds through deposits, borrowings, the sale of loans and other sources could have a material adverse effect on our liquidity. Our access to funding sources in amounts adequate to finance our activities could be impaired by factors that affect us specifically or the financial services industry in general. Factors that could detrimentally impact our access to liquidity sources include a decrease in the level of our business activity due to a market downturn or adverse regulatory action against us. Our ability to acquire deposits or borrow could also be impaired by factors that are not specific to us, such as a severe disruption of the financial markets or negative views and expectations about the prospects for the financial services industry as a whole. The Company mitigates liquidity risk by establishing and accessing lines of credit with various financial institutions and having back-up access to the brokered Certificate of Deposits “CD’s” markets (which it has not utilized other than on a testing basis). Results of operations could be affected if the Company were unable to satisfy current or future financial obligations. See Part II, Item 7, “Liquidity” for more information.
Severe Weather, Natural Disasters, Acts of War or Terrorism and Other External Events Could Significantly Impact the Company’s Business
Severe weather, floods, drought, fire, natural disasters such as earthquakes, or tsunamis, acts of war or terrorism and other adverse external events could have a significant impact on the Company’s ability to conduct business. Such events could affect the stability of the Bank’s deposit base, impair the ability of borrowers to repay outstanding loans, impair the value of collateral securing loans, cause significant property damage, result in loss of revenue and/or cause the Company to incur additional expenses. Although management has established disaster recovery policies and procedures, the occurrence of any such event in the future could have a material adverse effect on the Company’s business, which, in turn, could have a material adverse effect on the Company’s financial condition and results of operations.
29
Table of Contents
The Financial Condition of Other Financial Institutions Could Adversely Affect Us
Financial services institutions are interrelated as a result of trading, clearing, counterparty or other relationships. We have exposure to many different industries and counterparties, and we routinely execute transactions with counterparties in the financial industry, including brokers and dealers, commercial banks, investment banks, and other institutions. Many of these transactions expose us to credit risk in the event of default of our counterparty. In addition, our credit risk may be exacerbated when the collateral held by us cannot be realized upon or is liquidated at prices not sufficient to recover the full amount of the financial instrument exposure due to us. Any such losses could have a material adverse effect on our financial condition and results of operations.
We Currently Hold a Significant Amount of Bank-Owned Life Insurance.
At December 31, 2016, we held $51 million of bank-owned life insurance (BOLI) on current and former senior employees and executives, with a cash surrender value of $51 million, as compared with $50 million of BOLI, with a cash surrender value of $50 million, at December 31, 2015. The eventual repayment of the cash surrender value is subject to the ability of the various insurance companies to pay death benefits or to return the cash surrender value to us if needed for liquidity purposes. We continually monitor the financial strength of the various companies with whom we carry these policies. However, any one of these companies could experience a decline in financial strength, which could impair its ability to pay benefits or return our cash surrender value. If we need to liquidate these policies for liquidity purposes, we would be subject to taxation on the increase in cash surrender value and penalties for early termination, both of which would adversely impact earnings.
RISKS RELATED TO CREDIT
We May Suffer Losses in Our Loan Portfolio Despite Our Underwriting Practices
We mitigate the risks inherent in our loan portfolio by adhering to sound and proven underwriting practices, managed by experienced and knowledgeable credit professionals. These practices include analysis of a borrower’s prior credit history, financial statements, tax returns, and cash flow projections, valuations of collateral based on reports of independent appraisers and verifications of liquid assets. Although we believe that our underwriting criteria is appropriate for the various kinds of loans we make, we may incur losses on loans that meet our underwriting criteria, and these losses may exceed the amounts set aside as reserves in our allowance for loan loss.
The Repayment of Our Income Property Loans, Consisting of Commercial and Multi-family Real Estate Loans, May be Dependent on Factors Outside Our Control or the Control of Our Borrowers.
We originate commercial and multi-family real estate loans for individuals and businesses for various purposes, which are secured by commercial properties. Repayment of these loans is often dependent upon income generated, or expected to be generated, by the property securing the loan in amounts sufficient to cover operating expenses and debt service, which may be adversely affected by changes in the economy or local market conditions.
For example, if the cash flow from the borrower’s project is reduced as a result of the financial impairment of a lessee who cannot pay the rent, or as a result of leases not being obtained or renewed in a timely manner or at all, the borrower’s ability to repay the loan may be impaired. Commercial and multi-family real estate loans also expose us to greater credit risk than loans secured by residential real estate because the collateral securing these loans typically cannot be sold as easily as residential real estate. In addition, many of our commercial and multi-family real estate loans are not fully amortizing and contain large balloon payments upon maturity. Such balloon payments may require the borrower to either sell or refinance the underlying property in order to make the payment, which may increase the risk of default or non-payment.
30
Table of Contents
If we foreclose on a commercial or multi-family real estate loan, our holding period for the collateral may be longer than for residential mortgage loans because there are fewer potential purchasers of the collateral. Additionally, commercial and multi-family real estate loans generally have relatively large balances to single borrowers or groups of related borrowers. Accordingly, if we make any errors in judgment in the collectability of our commercial and multi-family real estate loans, any resulting charge-offs may be larger on a per loan basis. As of December 31, 2016, our commercial and multi-family real estate loans totaled $1.2 billion, or 58 percent of our total loans.
Repayment Of Our Commercial And Industrial Loans Is Often Dependent On The Cash Flows Of The Borrower, Which May Be Unpredictable, and The Collateral Securing These Loans May Not Be Sufficient To Repay the Loan In The Event Of Default
We make our commercial and industrial loans primarily based on the identified cash flow of the borrower and secondarily on the underlying collateral provided by the borrower. Collateral securing commercial and industrial loans are generally the working assets of a business that fluctuate in value, may depreciate over time, and could be difficult to appraise. For example, in the case of loans secured by accounts receivable, the availability of funds for the repayment of these loans may be substantially dependent on the ability of the borrower to collect the amounts due from its customers, and for loans secured by inventory, the sale or liquidation of the inventory may be dependent not only on the quality of the inventory but also on finding a willing buyer. As of December 31, 2016, our commercial and industrial loans totaled $503 million, or 25 percent of our total loans.
Supervisory Guidance on Commercial Real Estate Concentrations Could Restrict Our Activities and Impose Financial Requirements or Limits on the Conduct of Our Business
The Federal Regulatory Agencies have issued guidance on sound risk management practices for concentrations in commercial real estate lending intended to help ensure that institutions pursuing a significant commercial real estate lending strategy remain healthy and profitable while continuing to serve the credit needs of their communities. Recently there have been concerns about commercial real estate lending and underwriting expressed by the agencies along with historical concerns that rising commercial real estate loan concentrations may expose institutions to unanticipated earnings and capital volatility in the event of adverse changes in commercial real estate markets. Existing guidance reinforces and enhances existing regulations and guidelines for safe and sound real estate lending by providing supervisory criteria, including numerical indicators to assist in identifying institutions with potentially significant commercial real estate loan concentrations that may warrant greater supervisory scrutiny. The guidance does not limit banks’ commercial real estate lending, but rather guides institutions in developing risk management practices and levels of capital that are commensurate with the level and nature of their commercial real estate concentrations. Our lending and risk management practices will be taken into account in supervisory evaluation of capital adequacy. As of December 31, 2016, the Bank’s commercial real estate concentration, as defined by the regulatory supervisory guidance, exceeded the regulatory threshold of 300% of total risk based capital. The regulatory definition of a commercial real estate concentration excludes owner-occupied commercial real estate loans, but includes unsecured commercial and industrial loans for the purpose of real estate that are not secured by real estate. The Bank’s commercial real estate portfolio, as defined by regulatory guidance, is 47% of total loans at December 31, 2016, as compared to 42% at December 31, 2015. If our risk management practices with regard to this portion of our portfolio are found to be deficient, it could result in increased reserves and capital costs or a need to reduce this type of lending which could negatively impact earnings.
We Have a Concentration in Loans Secured by Commercial Real Estate Which Could Make Us Vulnerable to Changes in the Commercial Real Estate Market.
Our commercial real estate loan portfolio (including owner-occupied nonresidential properties, other nonresidential properties, construction, land development and other land, and multifamily residential properties)
31
Table of Contents
has increased from 62% at December 31, 2015 to 68% at December 31, 2016. While our risk management practices are designed to monitor these loans as well as the market conditions closely and analyze the impact of various stress scenarios on these loans, it is possible that an adverse change in the Southern California commercial real estate market could result in credit losses or the need to increase reserves or capital which could have a negative impact on the Company’s income, capital, prospects or reputation.
Our Allowance for Loan Loss May Not be Adequate to Cover Actual Losses
We maintain an allowance for loan loss on organic loans, which is a reserve established through a provision for loan losses charged to expense, that represents management’s best estimate of risk of losses within the existing portfolio of loans. The allowance, in the judgment of management, is necessary to reserve for possible loan losses and risks inherent in the loan portfolio. The level of the allowance reflects management’s continuing evaluation of industry concentrations; specific credit risks; limited loan loss experience; current loan portfolio quality; present economic, political and regulatory conditions and unidentified losses inherent in the current loan portfolio as well as levels utilized by peers. The determination of the appropriate level of the allowance for loan loss inherently involves a high degree of subjectivity and requires the Bank to make significant estimates of current credit risks and future trends, all of which may undergo material changes.
Deterioration in economic conditions affecting borrowers and collateral, new information regarding existing loans, identification of problem loans and other factors, both within and outside of the Company’s control, may require an increase in the allowance for loan loss. In addition, bank regulatory agencies periodically review the Bank’s allowance for loan loss and may require an increase in the provision for loan losses or the recognition of further loan charge-offs, based on judgments different than those of management. In addition, if charge-offs in future periods exceed the allowance for loan loss; the Bank will need additional provisions to increase the allowance for loan loss. Any increases in the allowance for loan loss will result in a decrease in net income and, possibly, capital, and may have a material adverse effect on the Company’s financial condition and results of operations. See the section captioned “Allowance for Loan Loss” in Item 7. Management’s Discussion and Analysis of Financial Condition and Results of Operations located elsewhere in this report for further discussion related to the Company’s process for determining the appropriate level of the allowance for loan loss.
In June 2016, the FASB issued Accounting Standards Update (“ASU”) 2016-13, Financial Instruments — Credit Losses (Topic 326), which introduces new guidance for the accounting for credit losses on instruments within its scope. The new guidance introduces an approach based on expected losses to estimate credit losses on certain types of financial instruments. It also modifies the impairment model for available-for-sale (AFS) debt securities and provides for a simplified accounting model for purchased financial assets with credit deterioration since their origination. Current expected credit losses (“CECL”) model, will apply to: (1) financial assets subject to credit losses and measured at amortized cost, and (2) certain off-balance sheet credit exposures. This includes loans, held-to-maturity debt securities, loan commitments, financial guarantees, and net investments in leases, as well as reinsurance and trade receivables. Upon initial recognition of the exposure, the CECL model requires an entity to estimate the credit losses expected over the life of an exposure (or pool or exposures). The estimate of expected credit losses (ECL) should consider historical information, current information, and reasonable and supportable forecasts, including estimates of prepayments. Financial instruments with similar risk characteristics should be grouped together when estimating ECL. ASU 2016-13 is effective for public entities for interim and annual periods beginning after December 15, 2019. Early application of the guidance will be permitted for all entities for fiscal years beginning after December 15, 2018, including interim periods within those fiscal years. Upon adoption, the Company expects the level of ECL will likely be higher, however, the Company is still in the early stages of developing an implementation plan and evaluating the magnitude of the increase and the impact of this ASU on its consolidated financial statements. This model could result in an adverse impact on the Company’s earnings, capital and other regulatory limits that are based on capital.
32
Table of Contents
Liabilities from Environmental Regulations Could Materially and Adversely Affect Our Business and Financial Condition
In the course of the Bank’s business, the Bank may foreclose and take title to real estate, and could be subject to environmental liabilities with respect to these properties. The Bank may be held liable to a governmental entity or to third parties for property damage, personal injury, investigation and clean-up costs incurred by these parties in connection with environmental contamination, or may be required to investigate or clear up hazardous or toxic substances, or chemical releases at a property. The costs associated with investigation or remediation activities could be substantial. In addition, as the owner or former owner of any contaminated site, the Bank may be subject to common law claims by third parties based on damages, and costs resulting from environmental contamination emanating from the property. If the Bank ever becomes subject to significant environmental liabilities, the Company’s business, financial condition, liquidity, and results of operations could be materially and adversely affected.
California’s Current Drought may Impact the Economy
At December 31, 2016, California continued to experience a severe drought in all areas of the State. This extended drought has produced chronic and significant shortages to municipal and industrial, environmental, agricultural, and wildlife refuge water supplies and led to historically low groundwater levels. This recent dry hydrology set many new Statewide records, including the driest five-year period of statewide precipitation (2012-2016). The exceptionally dry conditions in 2015 and 2016 resulted in low reservoir storages which created a challenge to deliver critical water supplies and provide adequate cold water for instream fisheries resources.
The cumulative effect of these sustained dry conditions is demonstrated in reduced natural runoff for streamflow, limited surface water storage in reservoirs, increased groundwater pumping, and significant effects to fish and wildlife populations.
While the early 2017 water year has seen above-average precipitation and snowpack, the ability to predict at this time whether 2017 will be wet or dry is limited. Recent wet weather, particularly throughout Northern California, has resulted in Governor Jerry Brown declaring a state of emergency in 50 counties across California. The latest National Weather Service Climate Prediction Center seasonal drought outlook, valid for January 19, 2017 through April 30, 2017, shows drought in south-west California remaining, but improving. Due to winter storms, the U.S. Drought Monitor has removed the designation of “exceptional drought” for California.
More than half of the state, however, is still experiencing moderate to extreme drought conditions, with the drought in parts of Ventura, Santa Barbara, Kern and Los Angeles counties more severe than in the rest of the state. Despite considerable improvements in reservoir and snowpack conditions, groundwater aquifers, forests, and endangered fish species may take several years to recover from drought impacts. While we do not have a portfolio of agricultural loans which would be most impacted by the drought, the effects of increased costs for water and municipal restrictions on the level of use could have an adverse effect on the operations of some of our client base, the extent of which is yet unknown, and it is possible that the overall economy of California may be negatively affected by the lingering impact of this drought and lack of water or the increased cost of the resource, which could have a negative impact on the Company’s results, loan quality and collateral.
RISK RELATED TO LEGISLATION AND REGULATION
Significant Changes in Banking Laws or Regulations and Federal Monetary Policy Could Materially Affect Our Business
The banking industry is subject to extensive federal and state regulations, and significant new laws or changes in, or repeals of, existing laws which may cause results to differ materially. Also, federal monetary policy, particularly as implemented through the Federal Reserve System, significantly affects our credit conditions, primarily through open market operations in U.S. government securities, the discount rate for
33
Table of Contents
member bank borrowing, and bank reserve requirements. A material change in these conditions would affect our results. Parts of our business are also subject to federal and state securities laws and regulations. Significant changes in these laws and regulations would also affect our business. For further discussion of the regulation of financial services, including a description of significant recently-enacted legislation and other regulatory initiatives taken in response to the recent financial crisis, see “Supervision and Regulation”.
New Capital and Liquidity Standards Adopted By The U.S. Banking Regulators Have Resulted In Banks and Bank Holding Companies Needing To Maintain More And Higher Quality Capital And Greater Liquidity Than Has Historically Been The Case.
New capital standards, both as a result of the Dodd-Frank Act and the new U.S. Basel III-based capital rules have had a significant effect on banks and bank holding companies. The New Capital Rules require bank holding companies and their bank subsidiaries to maintain substantially more capital, with a greater emphasis on common equity. For additional information, see “Capital Requirements” under Part I, Item 1 “Business.”
The need to maintain more and higher quality capital, as well as greater liquidity, going forward than historically has been required, and generally increased regulatory scrutiny with respect to capital levels, could limit the Company’s business activities, including lending, and its ability to expand, either organically or through acquisitions. It could also result in being required to take steps to increase its regulatory capital that may be dilutive to shareholders or limit its ability to pay dividends or otherwise return capital to shareholders, or sell or refrain from acquiring assets, the capital requirements for which are not justified by the assets’ underlying risks.
We Face a Risk Of Noncompliance and Enforcement Action With the Bank Secrecy Act and Other Anti-Money Laundering Statutes and Regulations
The Bank Secrecy Act of 1970, the USA PATRIOT Act of 2001, and other laws and regulations require financial institutions, among other duties, to institute and maintain an effective anti-money laundering program and file suspicious activity and currency transaction reports as appropriate. The Financial Crimes Enforcement Network, a bureau of the U.S. Department of the Treasury, is authorized to impose significant civil money penalties for violations of those requirements and engages in coordinated enforcement efforts with the individual federal banking regulators, as well as the U.S. Department of Justice, Drug Enforcement Administration, and U.S. Internal Revenue Service (“IRS”). We are also subject to increased scrutiny of compliance with the rules enforced by the Office of Foreign Assets Control. If our policies, procedures and systems are deemed deficient, we could be subject to liability, including fines and regulatory actions, which may include restrictions on our ability to pay dividends and the necessity to obtain regulatory approvals to proceed with certain aspects of our business plan, including any acquisition plans which could be identified. Failure to maintain and implement adequate programs to combat money laundering and terrorist financing could also have serious reputational consequences for us. Any of these results could materially and adversely affect our business, financial condition, results of operations and prospects.
The Company and the Bank are Operating Under Enhanced Regulatory Supervision that Could Materially and Adversely Affect Our Business
On September 23, 2016, the Bank entered into a Stipulation to the Issuance of a Consent Order with its bank regulatory agencies, the FDIC and the CDBO, agreeing to the issuance of a consent order (the “Consent Order”) relating to weaknesses in the Bank’s Bank Secrecy Act and Anti-Money Laundering (collectively “BSA”) compliance program.
Under the terms of the Consent Order the Bank and/or its Board of Directors is required to take certain actions which include, but are not limited to: a) Increasing Board supervision of the BSA compliance program; b) Notification to the regulatory agencies prior to appointment of a new BSA Officer or the executive to whom the BSA Officer reports; c) Formulation of a written action plan describing the actions to be taken to correct BSA/AML related deficiencies, a revised, written BSA/AML compliance program and review and enhancement of the
34
Table of Contents
Bank’s BSA risk assessment; d) Performance of a review of BSA staffing needs; e) Enhancement of internal controls to ensure full compliance with the BSA; f) Establishment of an independent testing program for compliance with the BSA rules and regulations; and g) Obtaining regulatory agency consent for expansionary activities such as new branches, offices, delivery channels, products and services.
The Consent Order is expected to result in additional BSA compliance expenses for the Bank and the Company. It may also have the effect of limiting or delaying the Bank’s and the Company’s ability to obtain regulatory approval for certain expansionary activities..
While the Bank has undertaken substantial activities to address these issues, should the FDIC or the DBO determine we have not complied with the Consent Order they could impose additional regulatory action(s), including civil money penalties against the Bank and its officers and directors or enforcement of the Consent Order through court proceedings, which could have a material and adverse effect on our business, reputation, results of operations, financial condition, cash flows and stock price.
Limits on Our Ability to Lend
The Bank’s legal lending limit as of December 31, 2016 was approximately $74 million for secured loans and $44 million for unsecured loans. While we believe we can accommodate the needs of substantially all of our target market, we compete with many financial institutions with larger lending limits.
Increases in Deposit Insurance Premiums and Special FDIC Assessments Will Negatively Impact Our Earnings.
We may pay higher FDIC premiums in the future. The Dodd-Frank Act increased the minimum FDIC deposit insurance reserve ratio from 1.15 percent to 1.35 percent. The FDIC has adopted a plan under which it will meet this ratio by December 31, 2018, nearly two years before the statutory deadline of September 30, 2020. The Dodd-Frank Act requires the FDIC to offset the effect of the increase in the minimum reserve ratio on institutions with assets less than $10.0 billion. In March 2016, the FDIC adopted a final rule which imposes on banks with at least $10 billion in assets a surcharge of 4.5 cents per $100 of their assessment base, after making certain adjustments. In addition to the minimum reserve ratio, the FDIC must set a designated reserve ratio. The FDIC has set a designated reserve ratio of 2.0, which exceeds the minimum reserve ratio.
As required by the Dodd-Frank Act, the FDIC has adopted final regulations under which insurance premiums are based on an institution’s total assets minus its Tier 1 capital, instead of its deposits. Although our FDIC insurance premiums were initially reduced by these regulations, the benefit from the reduction in the FDIC insurance premiums was dampened by an increase in the deposit premium costs resulting from the Consent Order.
BUSINESS STRATEGY RISK
We Compete Against Larger Banks and Other Institutions
We face substantial competition for deposits and loans in our market place. Competition for deposits primarily comes from other commercial banks, savings institutions, thrift and loan associations, money market and mutual funds and other investment alternatives. Competition for loans comes from other commercial banks, savings institutions, mortgage banking firms, thrift and loan associations and other financial intermediaries. Our larger competitors, by virtue of their larger capital resources, have substantially greater lending limits than we have. They also provide certain services for their customers, including trust, wealth management and international banking, which we only are able to offer indirectly through our correspondent relationships. In addition, they have greater resources and are able to offer longer maturities and on occasion, lower rates on fixed rate loans as well as more aggressive underwriting.
35
Table of Contents
We May Not Be Able to Complete Future Acquisitions.
We must generally satisfy a number of meaningful conditions before we can complete an acquisition of another bank or BHC, including federal and/or state regulatory approvals. In determining whether to approve a proposed bank or BHC acquisition, bank regulators will consider, among other factors, the effect of the acquisition on competition, financial condition and future prospects, including current and projected capital ratios and levels, the competence, experience and integrity of management and record of compliance with laws and regulations, the convenience and needs of the communities to be served, including the acquiring institution’s record of compliance under the CRA, the effectiveness of the acquiring institution in combating money laundering activities and protests from various stakeholders of both the Company and its acquisition partner. The Consent Order may limit the Company’s ability to obtain regulatory approval for such transactions.
There is Risk Related to Acquisitions
We have engaged in expansion through acquisitions and may consider acquisitions in the future, subject to regulatory approval. We cannot predict the frequency, size or timing of any future acquisitions, and we typically do not comment publicly on a possible acquisition until we have signed a definitive agreement. There can be no assurance that our future acquisitions, if any, will have the anticipated positive results.
There are risks associated with any such expansion. These risks include, among others, incorrectly assessing the asset quality of a bank acquired in a particular transaction, encountering greater than anticipated costs in integrating acquired businesses, facing resistance from customers or employees, being unable to profitably deploy assets acquired in the transaction or litigation resulting from circumstances occurring at the acquired entity prior to the date of acquisition or resulting from the acquisition. Our earnings, financial condition, and prospects after a merger or acquisition depend in part on our ability to successfully integrate the operations of the acquired company. We may be unable to integrate operations successfully or to achieve expected cost savings. Any cost savings which are realized may be offset by losses in revenues or other charges to earnings. To the extent we issue capital stock in connection with additional transactions, if any, these transactions and related stock issuances may have a dilutive effect on earnings per share and share ownership.
While our management is experienced in acquisition strategy and implementation, acquisitions involve inherent uncertainty and we cannot determine all potential events, facts and circumstances that could result in loss or give assurances that our investigation or mitigation efforts will be sufficient to protect against any such loss.
Although we have historically shown the ability to grow organically as well as through acquisition, our ability to grow may be limited if we cannot make acquisitions. We compete with other financial institutions with respect to proposed acquisitions.
Issuing Additional Shares Of Our Common Stock To Acquire Other Banks and Bank Holding Companies May Result In Dilution For Existing Shareholders and May Adversely Affect the Market Price Of Our Stock.
In connection with our growth strategy, we have issued, and may issue in the future, shares of our common stock to acquire additional banks or bank holding companies that may complement our organizational structure. Resales of substantial amounts of common stock in the public market and the potential of such sales could adversely affect the prevailing market price of our common stock and impair our ability to raise additional capital through the sale of equity securities. We usually must pay an acquisition premium above the fair market value of acquired assets for the acquisition of banks or bank holding companies. Paying this acquisition premium, in addition to the dilutive effect of issuing additional shares, may also adversely affect the prevailing market price of our common stock.
36
Table of Contents
Impairment of Goodwill or Amortizable Intangible Assets Associated With Acquisitions Would Result In a Charge to Earnings
Goodwill is initially recorded at fair value and is not amortized, but is reviewed at least annually or more frequently if events or changes in circumstances indicate that the carrying value may not be fully recoverable. If our estimates of goodwill fair value change, we may determine that impairment charges are necessary. Estimates of fair value are determined based on a complex model using cash flows and company comparisons. If management’s estimates of future cash flows are inaccurate, the fair value determined could be inaccurate and impairment may not be recognized in a timely manner.
Our Decisions Regarding the Fair Value of Assets Acquired Could Be Different Than Initially Estimated Which Could Materially and Adversely Affect Our Business, Financial Condition, Results of Operations, and Future Prospects
We acquired portfolios of loans in the 1st Enterprise, Premier Commercial Bancorp and California Oaks State Bank acquisitions. Although these loans were marked down to their estimated fair value pursuant to ASC 805 Business Combinations, there is no assurance that the acquired loans will not suffer further deterioration in value resulting in additional charge-offs. The fluctuations in national, regional and local economic conditions may increase the level of charge-offs in the loan portfolios that we acquired from 1st Enterprise, Premier Commercial Bancorp and California Oaks State Bank and correspondingly reduce our net income. These fluctuations are not predictable, cannot be controlled and may have a material adverse impact on our operations and financial condition, even if other favorable events occur.
We May Need to Raise Capital to Support Growth or Acquisition
While the Company’s and the Bank’s capital levels are currently in excess of that required to be considered “well-capitalized” by regulatory agencies, organic growth or a strategic opportunity may require the Company to raise additional capital and/or to maintain capital levels in excess of “well-capitalized”.
We Are Dependent on Key Personnel and the Loss of One or More of Those Key Personnel May Materially and Adversely Affect Our Prospects
Competition for qualified employees and personnel in the banking industry is intense and there are a limited number of qualified persons with knowledge of, and experience in, the California community banking industry. The process of recruiting personnel with the combination of skills and attributes required to carry out our strategies is often lengthy. Our success depends to a significant degree upon our ability to attract and retain qualified management, loan origination, finance, administrative, marketing, compliance and technical personnel and upon the continued contributions of our management and personnel. In particular, our success has been and continues to be highly dependent upon the abilities of key executives and certain other employees.
The Company Plans to Continue to Grow and there are Risks Associated with Growth
The Company intends to increase deposits and loans and may continue to review strategic opportunities which could, if implemented, expand its businesses and operations. Continued growth, including organic growth, may present operating and other problems that could adversely affect our business, financial condition and results of operations. Growth may place a strain on our administrative and operational, personnel and financial resources and increase demands on our systems and controls. Our ability to manage growth successfully will depend on its ability to attract qualified personnel and maintain cost controls and asset quality while attracting additional loans and deposits on favorable terms, as well as on factors beyond our control, such as economic conditions and interest rate trends. If we grow too quickly and are not able to attract qualified personnel, control costs and maintain asset quality, this continued rapid growth could materially adversely affect our financial performance.
37
Table of Contents
Our Deposit Portfolio Includes Significant Concentrations
As a business bank, we provide services to a number of customers whose deposit levels vary considerably and may also have a significant amount of seasonality. At December 31, 2016, 79 customers maintained balances (aggregating all related accounts, including multiple business entities and personal funds of business owners) in excess of $6 million. This amounted to $1.2 billion or approximately 48 percent of the Bank’s total customer deposit base. These deposits can and do fluctuate substantially and may include substantial complexity requiring ongoing monitoring and services. While the loss of any combination of these depositors could have a material impact on the Bank’s results, the Bank expects, in the ordinary course of business, that these deposits will fluctuate and believes it is capable of mitigating this risk, as well as the risk of losing one of these depositors, through additional liquidity, and business generation in the future. However, if a significant number of these customers leave the Bank it could have a material adverse impact on the Bank.
If We Cannot Attract Deposits and Quality Loans Our Growth May Be Inhibited
Our ability to increase our asset base depends in large part on our ability to attract additional deposits at favorable rates. We seek additional deposits by providing outstanding customer service and offering deposit products that are competitive with those offered by other financial institutions in our markets. In addition, our income depends in large part in attracting quality loan customers and loans in which to invest the deposits.
Additional BSA Related Expenses and Our Ability to Comply with the Consent Order May Inhibit Our Growth
Our ability to grow organically or through a strategic opportunity may be inhibited by BSA related expenses, or by the Consent Order. The Consent Order resulted in additional BSA compliance expenses for the Bank and the Company. It may also have the effect of limiting or delaying the Bank’s and the Company’s ability to obtain regulatory approval for certain expansionary activities, should the Company desire to engage in such activities.
SBA Lending is Subject to Government Funding Which can be Limited or Uncertain.
The Bank engages in SBA lending through programs designed by the federal government to assist the small business community in obtaining financing from financial institutions that are given government guarantees as an incentive to make the loans. SBA lending is subject to federal legislation that can affect the availability and funding of the program. From time to time, this dependence on legislative funding causes limitations and uncertainties with regard to the continued funding of such programs, which could potentially have an adverse financial impact on our business.
OPERATIONAL AND REPUTATIONAL RISK
We Have a Continuing Need to Adapt to Technological Changes
The banking industry is undergoing rapid technological changes with frequent introductions of new technology-driven products and services. The effective use of technology allows us to:
| • | serve our customers better; |
| • | increase our operating efficiency by reducing operating costs; |
| • | provide a wider range of products and services to our customers; and |
| • | attract new customers |
Our future success will partially depend upon our ability to successfully use technology to provide products and services that will satisfy our customers’ demands for convenience, as well as to create additional operating efficiencies while at the same time maintaining appropriate fraud and cyber-security controls. Our larger
38
Table of Contents
competitors already have existing infrastructures or substantially greater resources to invest in technological improvements. We generally arrange for such services through service bureau arrangements or other arrangements with third parties.
Our Controls and Procedures Could Fail or Be Circumvented
Management regularly reviews and updates our internal controls, disclosure controls, procedures and corporate governance policies and procedures. Any system of controls, however well designed and operated, is based in part on certain assumptions and can provide only reasonable, but not absolute, assurances of the effectiveness of these systems and controls, and that the objectives of these controls have been met. Any failure or circumvention of our controls and procedures, and any failure to comply with regulations related to controls and procedures could adversely affect our business, results of operations and financial condition.
The Occurrence of Fraudulent Activity, Breaches of Our Information Security or Cybersecurity-Related Incidents Could Have a Material Adverse Effect On Our Business, Financial Condition or Results of Operations.
As a financial institution, we are susceptible to fraudulent activity, information security breaches and cybersecurity-related incidents that may be committed against us or our clients, which may result in financial losses or increased costs to us or our clients, disclosure or misuse of our information or our client information, misappropriation of assets, privacy breaches against our clients, litigation, or damage to our reputation. Such fraudulent activity may take many forms, including check fraud, electronic fraud, wire fraud, phishing, social engineering and other dishonest acts. Information security breaches and cybersecurity-related incidents may include fraudulent or unauthorized access to systems used by us or our clients, denial or degradation of service attacks, and malware or other cyber-attacks. In recent periods, there continues to be a rise in electronic fraudulent activity, security breaches and cyber-attacks within the financial services industry, especially in the commercial banking sector due to cyber criminals targeting commercial bank accounts. Consistent with industry trends, we have also experienced an increase in attempted electronic fraudulent activity, as well as attempts at security breaches and cybersecurity-related incidents in recent periods. Moreover, in recent periods, several large corporations, including financial institutions and retail companies, have suffered major data breaches, in some cases exposing not only confidential and proprietary corporate information, but also sensitive financial and other personal information of their customers and employees and subjecting them to potential fraudulent activity. Some of our clients may have been affected by these breaches, which increase their risks of identity theft, credit card fraud and other fraudulent activity that could involve their accounts with us.
Information pertaining to us and our clients is maintained, and transactions are executed, on the networks and systems of us, our clients and certain of our third party partners, such as our online banking or reporting systems. The secure maintenance and transmission of confidential information, as well as execution of transactions over these systems, are essential to protect us and our clients against fraud and security breaches and to maintain our clients’ confidence. Breaches of information security also may occur, and in infrequent cases have occurred, through intentional or unintentional acts by those having access to our systems or our clients’ or counterparties’ confidential information, including employees. Furthermore, our cardholders use their debit and commercial credit cards to make purchases from third parties or through third party processing services. As such, we are subject to risk from data breaches of such third party’s information systems or their payment processors. Such a data security breach could compromise our account information. We may suffer losses associated with such fraudulent transactions , as well as for other costs related to data security breaches.
In addition, increases in criminal activity levels and sophistication, advances in computer capabilities, new discoveries, vulnerabilities in third-party technologies (including browsers and operating systems) or other developments could result in a compromise or breach of the technology, processes and controls that we use to prevent fraudulent transactions and to protect data about us, our clients and underlying transactions, as well as the technology used by our clients to access our systems. Although we have developed, and continue to invest in,
39
Table of Contents
systems and processes that are designed to detect and prevent security breaches and cyber-attacks and periodically test our security, our inability to anticipate, or failure to adequately mitigate, breaches of security could result in: losses to us or our clients; our loss of business and/or clients; damage to our reputation; the incurrence of additional expenses; disruption to our business; our inability to grow our online services or other businesses; additional regulatory scrutiny or penalties; or our exposure to civil litigation and possible financial liability — any of which could have a material adverse effect on our business, financial condition and results of operations.
More generally, publicized information concerning security and cyber-related problems could inhibit the use or growth of electronic or web-based applications or solutions as a means of conducting commercial transactions. Such publicity may also cause damage to our reputation as a financial institution. As a result, our business, financial condition or results of operations could be adversely affected.
We Could Be Liable For Breaches of Security In Our Online Banking Services. Fear of Security Breaches (including Cybersecurity breaches) Could Limit the Growth of Our Online Services
We offer various internet-based services to our clients, including online banking services. The secure transmission of confidential information over the Internet is essential to maintain our clients’ confidence in our online services. In certain cases, we are responsible for protecting customers’ proprietary information as well as their accounts with us. We have security measures and processes in place to defend against these cybersecurity risks but these cyber attacks are rapidly evolving (including computer viruses, malicious code, phishing or other information security breaches), and we may not be able to anticipate or prevent all such attacks, which could result in the unauthorized release, gathering, monitoring, misuse, loss or destruction of our or our customers’ confidential, proprietary and other information. Advances in computer capabilities, new discoveries or other developments could result in a compromise or breach of the technology we use to protect client transaction data. In addition, individuals, groups or sovereign countries may seek to intentionally disrupt our online banking services or compromise the confidentiality of customer information with criminal intent. Although we have developed systems and processes that are designed to recognize and assist in preventing security breaches (and periodically test our security), failure to protect against or mitigate breaches of security could adversely affect our ability to offer and grow our online services, constitute a breach of privacy or other laws, result in costly litigation and loss of customer relationships, negatively impact the Bank’s reputation, and could have an adverse effect on our business, results of operations and financial condition. We may not be insured against all types of losses as a result of breaches and insurance coverage may be inadequate to cover all losses resulting from breaches of security. We may also incur substantial increases in costs in an effort to minimize or mitigate cyber security risks and to respond to cyber incidents.
Our Operations Could be Disrupted
The potential for operational risk exposure exists throughout our organization. Integral to our performance is the continued efficacy of our technology and information systems, operational infrastructure and relationships with third parties and our colleagues in our day-to-day and ongoing operations. Failure by any or all of these resources subjects us to risks that may vary in size, scale and scope. This includes, but is not limited to, operational or systems failures, disruption of client operations and activities, ineffectiveness or exposure due to interruption in third party support as expected, as well as, the loss of key employees or failure on the part of key employees to perform properly.
Managing Reputational Risk Is Important To Attracting and Maintaining Customers, Investors, and Employees
Threats to our reputation can come from many sources, including adverse sentiment about financial institutions generally, unethical practices, employee misconduct, failure to deliver minimum standards of service or quality, compliance deficiencies, and questionable, illegal, or fraudulent activities of our customers. We have
40
Table of Contents
policies and procedures in place that seek to protect our reputation and promote ethical conduct, but these policies and procedures may not be fully effective. Negative publicity regarding our business, employees, or customers, with or without merit, may result in the loss of customers, investors, and employees, costly litigation, a decline in revenues and increased governmental regulation.
We Rely On Communications, Information, Operating and Financial Control Systems Technology from Third-Party Service Providers
We rely heavily on third-party service providers for much of our communications, information, operating and financial control systems technology, including customer relationship management, internet banking, website, general ledger, deposit, loan servicing and wire origination systems. Any failure or interruption or breach in security of these systems could result in failures or interruptions in our customer relationship management, internet banking, website, general ledger, deposit, loan servicing and/or wire origination systems. We cannot assure you that such failures or interruptions will not occur or, if they do occur, that they will be adequately addressed by us or the third parties on which we rely. The Company may not be insured against all types of losses as a result of third party failures and insurance coverage may be inadequate to cover all losses resulting from system failures or other disruptions. The occurrence of any failures or interruptions could have a material adverse effect on our business, financial condition, results of operations and cash flows. If any of our third-party service providers experience financial, operational or technological difficulties, or if there is any other disruption in our relationships with them, we may be required to locate alternative sources of such services, and we cannot assure you that we could negotiate terms that are as favorable to us, or could obtain services with similar functionality as found in our existing systems without the need to expend substantial resources, if at all. Any of these circumstances could have a material adverse effect on our business, financial condition, results of operations and cash flows.
Additionally, the bank regulatory agencies expect financial institutions to be responsible for all aspects of our vendors’ performance, including aspects which they delegate to third parties. Disruptions or failures in the physical infrastructure or operating systems that support our businesses and clients, or cyber attacks or security breaches of the networks, systems or devices that our clients use to access our products and services could result in client attrition, regulatory fines, penalties or intervention, reputational damage, reimbursement or other compensation costs, and/or additional compliance costs, any of which could materially adversely affect our results of operations or financial condition.
The Costs and Effects of Litigation, Investigations or Similar Matters, or Adverse Facts and Developments Related Thereto, Could Materially Affect Our Business, Operating Results and Financial Condition
We may be involved from time to time in a variety of litigation, investigations or similar matters arising out of our business. Our insurance may not cover all claims that may be asserted against it and indemnification rights to which we are entitled may not be honored, and any claims asserted against us, regardless of merit or eventual outcome, may harm our reputation. Should the ultimate judgments or settlements in any litigation or investigation significantly exceed our insurance coverage, they could have a material adverse effect on our business, financial condition and results of operations. In addition, premiums for insurance covering the financial and banking sectors are rising. We may not be able to obtain appropriate types or levels of insurance in the future, nor may we be able to obtain adequate replacement policies with acceptable terms or at historic rates, if at all.
We May Incur Fines, Penalties And Other Negative Consequences From Regulatory Violations, Which Are Possibly Even Inadvertent Or Unintentional Violations.
We maintain systems and procedures designed to ensure that we comply with applicable laws and regulations, but there can be no assurance that these will be effective. We may incur fines, penalties and other negative consequences from regulatory violations. We may suffer other negative consequences resulting from findings of noncompliance with laws and regulations, that may also damage our reputation, and this in turn might materially affect our business and results of operations.
41
Table of Contents
Further, some legal/regulatory frameworks provide for the imposition of fines or penalties for noncompliance even though the noncompliance was inadvertent or unintentional and even though there were in place at the time systems and procedures designed to ensure compliance.
We Are Subject to Losses Due to the Errors or Fraudulent Behavior of Employees or Third Parties.
We are exposed to many types of operational risk, including the risk of fraud by employees and outsiders, clerical record keeping errors and transactional errors. Our business is dependent on our employees as well as third-party service providers to process a large number of increasingly complex transactions. We could be materially adversely affected if one of our employees causes a significant operational breakdown or failure, either as a result of human error or where an individual purposefully sabotages or fraudulently manipulates our operations or systems. When we originate loans, we rely upon information supplied by loan applicants and third parties, including the financial and other information contained in the loan application package, property and collateral appraisals and valuations, and title information, if applicable, and employment and income documentation provided by third parties. If any of this information is misrepresented and such misrepresentation is not detected prior to loan funding, we generally bear the risk of loss associated with the misrepresentation. Any of these occurrences could result in a diminished ability of us to operate our business, potential liability to customers, reputational damage and regulatory intervention, which could negatively impact our business, financial condition and results of operations.
CU BANCORP RELATED RISKS
CU Bancorp is an Emerging Growth Company within the Meaning of the Securities Act. Certain Exemptions from Reporting Requirements that are Available to Emerging Growth Companies Could Make Its Common Stock Less Attractive to Investors.
The Company is an “emerging growth company,” as defined in Section 2(a) of the Securities Act of 1933, as amended (the “Securities Act”), as modified by the Jumpstart Our Business Startups Act of 2012 ( the “JOBS Act”). CU Bancorp is eligible to take advantage of certain exemptions from various reporting requirements that are applicable to other public companies that are not emerging growth companies, including, but not limited to, reduced disclosure about its executive compensation and omission of compensation discussion and analysis, and an exemption from the requirement of holding a non-binding advisory vote on executive compensation. While CU Bancorp is subject to the requirements of FDICIA, it is not subject to certain requirements of Section 404 of the Sarbanes-Oxley Act of 2002 (the “Sarbanes- Oxley Act”), including the additional level of review of its internal control over financial reporting as may occur when outside auditors attest as to its internal control over financial reporting. As a result, its shareholders may not have access to certain information they may deem important.
Statutory Restrictions and Restrictions by Our Regulators on Dividends and Other Distributions from the Bank May Adversely Impact Us by Limiting the Amount of Distributions CU Bancorp May Receive
The ability of the Bank to pay dividends to us is limited by various regulations and statutes and our ability to pay dividends on our outstanding stock is limited by various regulations and statutes, including California law.
Various statutory provisions restrict the amount of dividends that the Bank can pay to us without regulatory approval.
The Federal Reserve Board has previously issued Federal Reserve Supervision and Regulation Letter SR-09-4 that states that bank holding companies are expected to inform and consult with the Federal Reserve supervisory staff prior to taking any actions that could result in a diminished capital base, including any payment or increase in the rate of dividends. Further, if we are not current in our payment of interest on our Subordinated Debentures, we may not pay dividends on our common stock.
42
Table of Contents
If the Bank were to liquidate, the Bank’s creditors would be entitled to receive distributions from the assets of the Bank to satisfy their claims against the Bank before Bancorp, as a holder of the equity interest in the Bank, would be entitled to receive any of the assets of the Bank as a distribution or dividend.
The restrictions described above could have a negative effect on the value of our common stock. Moreover, holders of our common stock are entitled to receive dividends only when, as and if declared by our Board of Directors. We have never paid cash dividends on our common stock.
Our Series A Preferred Stock Diminishes the Cash Available To Our Common Shareholders.
On November 30, 2014, the Company entered into an Assignment and Assumption Agreement with the Secretary of the Treasury, pursuant to which the Company issued to the U.S. Treasury 16,400 shares of its Non-Cumulative Perpetual Preferred Stock, Series A, having a liquidation preference of $1,000 per share and the Company assumed the obligations of 1st Enterprise Bank in connection with its issuance of the same number and type of securities to the Treasury (which shares were retired in connection therewith). The issuance was pursuant to the Treasury’s SBLF program, a $30 billion fund established under the Small Business Jobs Act of 2010, which encourages lending to small businesses by providing capital to qualified community banks with assets of less than $10 billion.
The Series A Preferred Stock is entitled to receive non-cumulative dividends payable quarterly on each January 1, April 1, July 1 and October 1. The dividend rate was fixed at a 1% rate through February 2016.
Effective March 2016, the dividend rate became fixed at 9%. However, the dividend yield through November 30, 2018 approximates 7% as a result of business combination accounting. This increase in the Series A Preferred Stock annual dividend rate could have a material adverse effect on our liquidity and could also adversely affect our ability to pay dividends on our common shares.
Our Accounting Policies and Processes Are Critical To How We Report Our Financial Condition and Results Of Operations. They Require Management To Make Estimates About Matters That Are Uncertain.
Accounting policies and processes are fundamental to how we record and report our financial condition and results of operations. Some of these policies require use of estimates and assumptions that may affect the value of our assets or liabilities and financial results. Several of our accounting policies are critical because they require management to make difficult, subjective and complex judgments about matters that are inherently uncertain and because it is likely that materially different amounts would be reported under different conditions or using different assumptions. Pursuant to U.S. GAAP, we are required to make certain assumptions and estimates in preparing our financial statements, including in determining credit loss reserves, reserves related to litigation and the fair value of certain assets and liabilities, among other items. If assumptions or estimates underlying our financial statements are incorrect, we may experience material losses.
Management has identified certain accounting policies as being critical because they require management’s judgment to ascertain the valuations of assets, liabilities and contingencies. A variety of factors could affect the ultimate value that is obtained either when earning income, recognizing an expense, recovering an asset, valuing an asset or liability, or recognizing or reducing a liability. We have established policies and control procedures that are intended to ensure these critical accounting estimates and judgments are controlled and applied consistently. Because of the uncertainty surrounding our judgments and the estimates pertaining to these matters, we cannot guarantee that we will not be required to adjust accounting policies or restate prior period financial statements. See “Critical Accounting Policies” in the MD&A and Note 1, “Significant Accounting Policies,” to the Consolidated Financial Statements in this Form 10-K.
Our Disclosure Controls and Procedures May Not Prevent or Detect All Errors or Acts of Fraud.
Our disclosure controls and procedures are designed to provide reasonable assurance that information required to be disclosed by us in reports we file or submit under the Exchange Act is accurately accumulated and
43
Table of Contents
communicated to management, and recorded, processed, summarized, and reported within the time periods specified in the SEC’s rules and forms. We believe that any disclosure controls and procedures or internal controls and procedures, no matter how well conceived and operated, can provide only reasonable, not absolute, assurance that the objectives of the control system are met.
These inherent limitations include the realities that judgments in decision making can be faulty, that alternative reasoned judgments can be drawn, or that breakdowns can occur because of a simple error or mistake. Additionally, controls can be circumvented by the individual acts of some persons, by collusion of two or more people or by an unauthorized override of the controls. Accordingly, because of the inherent limitations in our control system, misstatements due to error or fraud may occur and not be detected, which could result in a material weakness in our internal controls over financial reporting and the restatement of previously filed financial statements.
RISKS RELATED TO OUR STOCK
The Price of Our Common Stock May Be Volatile or May Decline
The trading price of our common stock may fluctuate widely as a result of a number of factors, many of which are outside our control. In addition, the stock market is subject to fluctuations in the share prices and trading volumes that affect the market prices of the shares of many companies. These broad market fluctuations could positively or adversely affect the market price of our common stock and may not be predictable. Among the factors that could affect our stock price, certain of which are beyond our control, are:
| • | actual or anticipated quarterly fluctuations in our operating results and financial condition; |
| • | publication of research reports and recommendations by financial analysts; |
| • | failure to meet analysts’ revenue or earnings estimates; |
| • | speculation in the press or investment community; |
| • | strategic actions by us or our competitors, such as acquisitions or restructurings; |
| • | actions by institutional shareholders; |
| • | fluctuations in the stock price and operating results of our competitors; |
| • | general market conditions and, in particular, developments related to market conditions for the financial services industry; |
| • | political events, elections or changes in government or administration; |
| • | proposed or adopted regulatory changes or developments; |
| • | anticipated or pending investigations, proceedings or litigation that involve or affect us; |
| • | deletion from a well known index; or |
| • | domestic and international economic factors unrelated to our performance. |
The stock market and, in particular, the market for financial institution stocks, may experience significant volatility based on its history. As a result, the market price of our common stock may be volatile. In addition, the trading volume in our common stock may fluctuate more than usual and cause significant price variations to occur. The trading price of the shares of our common stock and the value of our other securities will depend on many factors, which may change from time to time, including, without limitation, our financial condition, performance, creditworthiness and prospects, future sales of our equity or equity related securities, and other factors identified above in “ Forward-Looking Statements.” A significant decline in our stock price could result in substantial losses for individual shareholders and could lead to costly and disruptive securities litigation.
44
Table of Contents
The Holders Of Our Preferred Stock and Trust Preferred Securities Have Rights That Are Senior To Those Of Our Holders Of Common Stock And That May Impact Our Ability To Pay Dividends On Our Common Stock.
At December 31, 2016, our subsidiary trusts had outstanding $12.4 million of trust preferred securities. These securities are effectively senior to shares of common stock due to the priority of the underlying junior subordinated debt. As a result, we must make payments on our trust preferred securities before any dividends can be paid on our common stock; moreover, in the event of our bankruptcy, dissolution, or liquidation, the obligations outstanding with respect to our trust preferred securities must be satisfied before any distributions can be made to our shareholders. While we have the right to defer dividends on the trust preferred securities for a period of up to five years, if any such election is made, no dividends may be paid to our common or preferred shareholders during that time.
On November 30, 2014, the Company issued and sold 16,400 shares of Series A Preferred Stock to the Treasury in connection with the acquisition of 1st Enterprise Bank and in replacement for similar securities previously issued to the Treasury by 1st Enterprise pursuant to the Treasury’s SBLF program. The Series A Preferred Stock is entitled to receive non-cumulative dividends payable quarterly. Such dividends are not cumulative, but the Company may only declare and pay dividends on its common stock if it has declared and paid dividends for the current dividend period on the Series A Preferred Stock.
There Are Also Various Regulatory Restrictions On The Ability Of California United Bank To Pay Dividends Or Make Other Payments To CU Bancorp. In Particular, Federal And State Banking Laws Regulate The Amount Of Dividends That May Be Paid By California United Bank Without Prior Approval.
The Dodd-Frank Act requires federal banking agencies to establish more stringent risk-based capital guidelines and leverage limits applicable to banks and bank holding companies. The final Basel III capital standards issued in 2013 by the FRB provide that distributions (including dividend payments and redemptions) on additional Tier 1 capital instruments may only be paid out of net income, retained earnings, or surplus related to other additional Tier 1 capital instruments. The final Basel III capital standards also introduce a new capital conservation buffer on top of the minimum risk-based capital ratios. Failure to maintain a capital conservation buffer above certain levels will result in restrictions on CU Bancorp’s ability to make dividend payments, redemptions or other capital distributions. These requirements, and any other new regulations or capital distribution constraints, could adversely affect the ability of California United Bank to pay dividends to CU Bancorp and, in turn, affect CU Bancorp’s ability to pay dividends on the CU Bancorp common stock and/or the CU Bancorp preferred stock.
The Federal Reserve Board may also, as a supervisory matter, otherwise limit CU Bancorp’s ability to pay dividends on the CU Bancorp common stock and/or the CU Bancorp preferred stock.
In addition, the CU Bancorp common stock and the CU Bancorp preferred stock may be fully subordinate to interests held by the U.S. government in the event of a receivership, insolvency, liquidation, or similar proceeding, including a proceeding under the “orderly liquidation authority” provisions of the Dodd-Frank Act.
CU Bancorp May Be Unable To, Or Choose Not To, Pay Dividends On Its Common Stock.
To date, CU Bancorp has not paid any cash dividends on its common stock. Payment of stock or cash dividends on its common stock in the future will depend on the following factors, among others:
| • | CU Bancorp may not have sufficient earnings since its primary source of income, the payment of dividends to it by California United Bank, is subject to federal and state laws that limit the ability of California United Bank to pay dividends; |
| • | Federal Reserve Board policy requires bank holding companies to pay cash dividends on common stock only out of net income available over the past year and only if prospective earnings retention is consistent with the organization’s expected future needs and financial condition; |
45
Table of Contents
| • | Before dividends may be paid on CU Bancorp’s common stock in any year, payments must be made on its subordinated debentures or the CU Bancorp preferred stock issued in connection with the merger with 1st Enterprise; |
| • | CU Bancorp’s board of directors may determine that, even though funds are available for dividend payments, retaining the funds for internal uses, such as expansion of its operations, is a better strategy; |
If CU Bancorp fails to pay dividends, capital appreciation, if any, of its common stock may be the sole opportunity for gains on an investment in its common stock. In addition, in the event California United Bank becomes unable to pay dividends to it, CU Bancorp may not be able to service its debt, pay its other obligations or pay dividends on its common stock. Accordingly, CU Bancorp’s inability to receive dividends from its bank subsidiary could also have a material adverse effect on its business, financial condition and results of operations and the value of CU Bancorp common stock. Further, the terms of the CU Bancorp preferred stock that was exchanged for 1st Enterprise preferred stock in the merger limit CU Bancorp’s ability to pay dividends on its common stock.
CU Bancorp’s Stock Trading Volume May Not Provide Adequate Liquidity for Investors.
Although shares of CU Bancorp’s common stock are listed for trading on The NASDAQ Capital Market, the average daily trading volume in the common stock varies and may be less than that of other larger financial services companies. A public trading market having the desired characteristics of depth, liquidity and orderliness depends on the presence in the marketplace of a sufficient number of willing buyers and sellers of the common stock at any given time. This presence depends on the individual decisions of investors and general economic and market conditions over which CU Bancorp has no control. Given the daily average trading volume of CU Bancorp’s common stock, significant sales of the common stock in a brief period of time, or the expectation of these sales, could cause a decline in the price of its common stock.
The principal executive offices of the Company are located in Los Angeles, California, and are leased by the Company. All of our branch locations are leased from unaffiliated parties.
We believe that our existing facilities are adequate for our present purposes. The Company leases all its facilities and believes that if necessary, it could secure suitable alternative facilities on similar terms without adversely affecting operations. For additional information on properties, see Note 7 to the Consolidated Financial Statements included in Item 8 of this Form 10-K.
The Company is not a defendant in any material pending legal proceedings and no such proceedings are known to be contemplated. No director, officer, affiliate, more than 5.0% shareholder of the Company or any associate of these persons is a party adverse to the Company or has a material interest adverse to the Company in any material legal proceeding. See Note 21 — Commitments and Contingencies to the Consolidated Financial Statements included in Item 8 of this 10-K.
ITEM 4 — MINE SAFETY DISCLOSURES
Not applicable
46
Table of Contents
ITEM 5 — MARKET FOR THE REGISTRANT’S COMMON EQUITY, RELATED STOCKHOLDER MATTERS AND ISSUER PURCHASES OF EQUITY SECURITIES
Common Stock
The Company’s shares of common stock trade on the NASDAQ Capital Market under the symbol “CUNB”. The Company’s common stock began trading on the NASDAQ exchange on October 10, 2012, prior to that date the stock traded on the OTCBB.
There are 75,000,000 shares of common stock authorized at no par value, of which 17,759,006 and 17,175,389 shares were issued and outstanding at December 31, 2016 and 2015, respectively.
Preferred Stock
The Company has 50,000,000 shares of serial preferred stock authorized. At December 31, 2016 and 2015, the Company has 16,400 shares of Series A, non-cumulative perpetual preferred stock authorized, issued and outstanding. Each Series A preferred stock has a liquidation preference of $1,000 per share.
Sales Price Information
The information in the following table indicates the highest and lowest sales prices and volume of trading for the Company’s common stock for the two year period starting January 1, 2015 through December 31, 2016 for each quarterly period, and is based upon information provided by NASDAQ. The information does not include transactions for which no public records are available. The bid and ask trading prices of the stock may be higher or lower than the prices reported below. These prices are based on the actual prices of stock transactions without retail mark-ups, mark-downs, commissions or adjustments.
| Period Ended |
High Price | Low Price | Approximate Number of Shares Traded |
|||||||||
| March 31, 2015 |
$ | 23.00 | $ | 20.06 | 1,562,718 | |||||||
| June 30, 2015 |
$ | 23.00 | $ | 18.52 | 2,229,554 | |||||||
| September 30, 2015 |
$ | 23.48 | $ | 20.59 | 1,501,514 | |||||||
| December 31, 2015 |
$ | 27.66 | $ | 21.82 | 2,112,266 | |||||||
| March 31, 2016 |
$ | 25.00 | $ | 20.69 | 1,968,399 | |||||||
| June 30, 2016 |
$ | 24.05 | $ | 20.35 | 2,923,703 | |||||||
| September 30, 2016 |
$ | 25.25 | $ | 22.25 | 1,708,758 | |||||||
| December 31, 2016 |
$ | 35.95 | $ | 22.35 | 3,322,407 | |||||||
According to information provided by NASDAQ, the most recent trade in our common stock prior to the date of finalizing this Form 10-K occurred on March 6, 2017 at a sales price of $38.10 per share. The high “bid” and low “asked” prices as of March 6, 2017 were $38.20 and $37.55, respectively.
Shareholders
As of March 6, 2017, the Company had 624 common shareholders of record, as listed with its transfer agent.
Dividends
In December 2016, the Board of Directors approved a quarterly dividend payment on the preferred stock in the amount of $369 thousand to the United States Department of the Treasury. To date, the Company has not paid any cash dividends on common stock.
47
Table of Contents
The applicable limitations on the payment of dividends are further discussed in Part II, Item 8, Financial Statements and Supplementary Data, Note 22, Regulatory Matters.
Common Stock Redemptions
In 2016, 2015 and 2014, the Company redeemed 52,591, 44,311 and 26,317 shares respectively, of employee restricted stock to pay the tax obligation of employees in connection with their restricted stock vesting. The total value of the employee tax obligation remitted by the Company was $1.4 million, $971 thousand and $471 thousand for the years ending December 31, 2016, 2015 and 2014, respectively. The Company purchased 17,242 shares of common stock at an average price per share of $31.10 during the 2016 fourth quarter.
The following table represents stock repurchases made by the Company during the fourth quarter of 2016:
| Purchase Dates: | Total
Number of Shares Purchased (1) |
Average Price Paid Per Share |
||||||
| October 1 – October 31, 2016 |
— | — | ||||||
| November 1 – November 30, 2016 |
— | — | ||||||
| December 1 – December 31, 2016 |
17,242 | $ | 31.10 | |||||
|
|
|
|
|
|||||
| Total |
17,242 | $ | 31.10 | |||||
|
|
|
|
|
|||||
| (1) | Shares repurchased pursuant to net settlement by employees, in satisfaction of income tax withholding obligations incurred through the vesting of Company restricted stock. We did not repurchase any shares as part of publicly announced plans or programs. |
Securities Authorized for Issuance Under Equity Compensation Plans
The following table provides information as of December 31, 2016 with respect to the shares of our common stock that may be issued under existing equity compensation plans. This table does not reflect the number of restricted shares of stock that have been issued under the Company’s equity compensation plans. The number of shares of common stock remaining available for future issuance under the equity compensation plans has been reduced by both stock option grants and restricted stock issued under the plans.
| Plan |
Number of securities to be issued upon exercise of outstanding options |
Weighted-average exercise price of outstanding options |
Number of securities remaining available for future issuance under equity compensation plans (excluding securities reflected in the second column) |
|||||||||
| Equity Compensation Plans Approved by Security Holders: |
||||||||||||
| 2007 Equity and Incentive Compensation Plan |
47,697 | $ | 12.69 | 441,571 | ||||||||
|
|
|
|
|
|
|
|||||||
| Total |
47,697 | $ | 12.69 | 441,571 | ||||||||
|
|
|
|
|
|
|
|||||||
Performance Graph
The following Performance Graph and related information shall not be deemed “soliciting material” or to be “filed” with the Securities and Exchange Commission, nor shall such information be incorporated by reference into any future filing under the Securities Act of 1933 or Securities Exchange Act of 1934, each as amended, except to the extent that the Company specifically incorporates it by reference into such filing. The following Performance Graph was prepared for the Company by SNL Financial.
48
Table of Contents
The following graph compares the yearly percentage change in CU Bancorp’s cumulative total shareholder return on common stock, the cumulative total return of the NASDAQ Composite and the SNL Bank and Thrift Index.
The graph assumes an initial investment value of $100 on December 31, 2011. Points on the graph represent the performance as of the last business day of each of the years indicated. The graph is not necessarily indicative of future price performance.
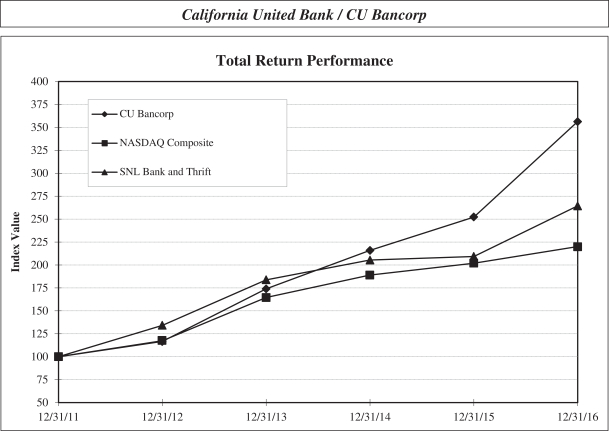
| Period Ending | ||||||||||||||||||||||||
| Index |
12/31/11 | 12/31/12 | 12/31/13 | 12/31/14 | 12/31/15 | 12/31/16 | ||||||||||||||||||
| CU Bancorp |
100.00 | 116.52 | 173.93 | 215.82 | 252.34 | 356.22 | ||||||||||||||||||
| NASDAQ Composite |
100.00 | 117.45 | 164.57 | 188.84 | 201.98 | 219.89 | ||||||||||||||||||
| SNL Bank and Thrift |
100.00 | 134.28 | 183.86 | 205.25 | 209.39 | 264.35 | ||||||||||||||||||
49
Table of Contents
ITEM 6 — SELECTED FINANCIAL DATA
The following table presents the Company’s selected financial and other data for the dates indicated (dollars in thousands except per share and other data). The consolidated balance sheet and statements of income data have been derived from the Company’s audited consolidated financial statements.
Certain of the information presented below under the captions “Selected Financial Ratios” and “Selected Asset Quality Ratios” is unaudited. The selected financial and other data is qualified in its entirety by, and should be read in conjunction with, “Item 7. Management’s Discussion and Analysis of Financial Condition and Results of Operations” and “Item 8. Financial Statements and Supplementary Data.”
| As of and for the Years ended December 31, | ||||||||||||||||||||
| 2016 | 2015 | 2014 | 2013 | 2012 | ||||||||||||||||
| Consolidated Statements of Income Data: |
||||||||||||||||||||
| Interest income |
$ | 101,252 | $ | 90,142 | $ | 55,177 | $ | 50,846 | $ | 37,496 | ||||||||||
| Interest expense |
3,146 | 2,723 | 1,922 | 2,079 | 1,797 | |||||||||||||||
|
|
|
|
|
|
|
|
|
|
|
|||||||||||
| Net interest income |
98,106 | 87,419 | 53,255 | 48,767 | 35,699 | |||||||||||||||
| Provision for loan losses |
3,264 | 5,080 | 2,239 | 2,852 | 1,768 | |||||||||||||||
|
|
|
|
|
|
|
|
|
|
|
|||||||||||
| Net interest income after provision for loan losses |
94,842 | 82,339 | 51,016 | 45,915 | 33,931 | |||||||||||||||
| Non-interest income |
12,012 | 11,730 | 7,709 | 6,518 | 3,961 | |||||||||||||||
| Non-interest expense |
(63,444 | ) | (59,965 | ) | (43,385 | ) | (37,640 | ) | (34,500 | ) | ||||||||||
|
|
|
|
|
|
|
|
|
|
|
|||||||||||
| Net income before provision for income tax expense |
43,410 | 34,104 | 15,340 | 14,793 | 3,392 | |||||||||||||||
| Provision for income tax expense |
15,953 | 12,868 | 6,432 | 5,008 | 1,665 | |||||||||||||||
|
|
|
|
|
|
|
|
|
|
|
|||||||||||
| Net Income |
$ | 27,457 | $ | 21,236 | $ | 8,908 | $ | 9,785 | $ | 1,727 | ||||||||||
|
|
|
|
|
|
|
|
|
|
|
|||||||||||
| Per Share and Other Data: |
||||||||||||||||||||
| Basic earnings per share |
$ | 1.52 | $ | 1.21 | $ | 0.77 | $ | 0.93 | $ | 0.21 | ||||||||||
| Diluted earnings per share |
1.50 | 1.18 | 0.75 | 0.90 | 0.21 | |||||||||||||||
| Book value per common share (1) |
18.09 | 16.87 | 15.78 | 12.45 | 11.68 | |||||||||||||||
| Tangible book value per common share (2) |
14.10 | 12.67 | 11.37 | 11.11 | 10.37 | |||||||||||||||
| Weighted average shares outstanding — Basic |
17,252,046 | 16,543,787 | 11,393,445 | 10,567,436 | 8,283,599 | |||||||||||||||
| Weighted average shares outstanding — Diluted |
17,550,864 | 16,983,221 | 11,667,733 | 10,836,861 | 8,410,749 | |||||||||||||||
| Consolidated Balance Sheet Data: |
||||||||||||||||||||
| Investment securities available-for-sale |
$ | 469,950 | $ | 315,785 | $ | 226,962 | $ | 106,488 | $ | 118,153 | ||||||||||
| Investment securities held-to-maturity |
42,027 | 42,036 | 47,147 | — | — | |||||||||||||||
| Loans, net |
2,030,852 | 1,817,481 | 1,612,113 | 922,591 | 846,082 | |||||||||||||||
| Total Assets |
2,994,760 | 2,634,642 | 2,265,117 | 1,407,816 | 1,249,637 | |||||||||||||||
| Deposits |
2,607,389 | 2,286,791 | 1,947,693 | 1,232,423 | 1,078,076 | |||||||||||||||
| Non-interest bearing demand deposits |
1,400,097 | 1,288,085 | 1,032,634 | 632,192 | 543,527 | |||||||||||||||
| Securities sold under agreements to repurchase |
18,816 | 14,360 | 9,411 | 11,141 | 22,857 | |||||||||||||||
| Shareholders’ equity |
338,185 | 306,807 | 279,192 | 137,924 | 125,623 | |||||||||||||||
| Selected Financial Ratios |
||||||||||||||||||||
| Return on Average Assets (3) |
0.92 | % | 0.80 | % | 0.59 | % | 0.74 | % | 0.16 | % | ||||||||||
| Return on Average Tangible Common Equity (4) |
11.07 | % | 9.86 | % | 6.50 | % | 8.34 | % | 1.73 | % | ||||||||||
| Equity to Assets Ratio (5) |
11.29 | % | 11.65 | % | 12.33 | % | 9.80 | % | 10.05 | % | ||||||||||
| Tangible Common Equity to Tangible Asset Ratio (6) |
8.56 | % | 8.49 | % | 8.66 | % | 8.84 | % | 9.03 | % | ||||||||||
| Loans to Deposits Ratio |
78.63 | % | 80.16 | % | 83.42 | % | 75.72 | % | 79.30 | % | ||||||||||
| Efficiency Ratio (7) |
58 | % | 61 | % | 71 | % | 68 | % | 87 | % | ||||||||||
| Net Interest Margin (8) |
3.71 | % | 3.83 | % | 3.79 | % | 3.96 | % | 3.63 | % | ||||||||||
| Selected Asset Quality Ratios |
||||||||||||||||||||
| Allowance for loan loss as a % of total loans |
0.94 | % | 0.86 | % | 0.78 | % | 1.14 | % | 1.03 | % | ||||||||||
| Allowance for loan loss as a % of total loans (excluding loans acquired in acquisitions) |
1.18 | % | 1.25 | % | 1.39 | % | 1.50 | % | 1.54 | % | ||||||||||
| Non Performing Assets to Total Assets |
0.04 | % | 0.09 | % | 0.21 | % | 0.68 | % | 1.09 | % | ||||||||||
| Net Charge-offs/(Recoveries) to Average Loans |
(0.02 | )% | 0.12 | % | 0.02 | % | 0.12 | % | 0.08 | % | ||||||||||
| Regulatory Capital Ratios (California United Bank) |
||||||||||||||||||||
| Total Risk-Based Capital Ratio |
11.0 | % | 11.2 | % | 11.2 | % | 12.0 | % | 11.6 | % | ||||||||||
| Tier 1 Risk-Based Capital Ratio |
10.3 | % | 10.5 | % | 10.6 | % | 11.0 | % | 10.7 | % | ||||||||||
| Common Equity Tier 1 Ratio |
10.3 | % | 10.5 | % | — | % | — | % | — | % | ||||||||||
| Tier 1 Leverage Ratio |
9.4 | % | 9.3 | % | 12.4 | % | 8.9 | % | 8.6 | % | ||||||||||
| Regulatory Capital Ratios (CU Bancorp Consolidated) |
|
|||||||||||||||||||
| Total Risk-Based Capital Ratio |
11.4 | % | 11.5 | % | 11.6 | % | 12.8 | % | 12.4 | % | ||||||||||
| Tier 1 Risk-Based Capital Ratio |
10.7 | % | 10.9 | % | 11.0 | % | 11.8 | % | 11.5 | % | ||||||||||
| Common Equity Tier 1 Ratio |
9.6 | % | 9.6 | % | — | % | — | % | — | % | ||||||||||
| Tier 1 Leverage Ratio |
9.7 | % | 9.7 | % | 12.9 | % | 9.6 | % | 9.1 | % | ||||||||||
50
Table of Contents
| (1) | Book value per common share is calculated by dividing shareholders’ equity by the total number of shares issued and outstanding. |
| (2) | Tangible book value per common share is calculated by dividing tangible shareholders’ equity (shareholders’ equity less preferred stock, goodwill and core deposit and leasehold right intangibles) by the total number of shares issued and outstanding. |
| (3) | Return on average assets is calculated by dividing the net income available to common shareholders by the daily average outstanding assets of the Company. |
| (4) | Return on average tangible common equity is calculated by dividing the Company’s net income available to common shareholders by the Company’s average tangible common equity (total average shareholders’ equity less average serial preferred stock, average goodwill, and average core deposit and leasehold right intangibles). |
| (5) | The equity to assets ratio was calculated by dividing the Company’s shareholders’ equity by the Company’s total assets. |
| (6) | The tangible common equity to assets ratio was calculated by dividing tangible shareholders’ equity by the Company’s total tangible assets (total assets less goodwill and core deposit and leasehold right intangibles). |
| (7) | The efficiency ratio represents non-interest expense as a percent of net interest income plus non-interest income, excluding gain on sale of securities, net. |
| (8) | The net interest margin represents net interest income as a percent of interest earning assets. |
51
Table of Contents
ITEM 7 — MANAGEMENT’S DISCUSSION AND ANALYSIS OF FINANCIAL CONDITION AND RESULTS OF OPERATIONS
Management’s discussion and analysis of financial condition and results of operations is intended to provide a better understanding of the significant changes in trends relating to the Company’s financial condition, results of operation, liquidity and interest rate sensitivity. This section should be read in conjunction with the disclosures regarding “Forward-Looking Statements” set forth in “Item I. Business — Forward-Looking Statements,” as well as the discussion set forth in “Item 8. Financial Statements and Supplementary Data,” including the notes to consolidated financial statements.
OVERVIEW
The year 2016 was another year of strong financial performance for the Company. The Company’s return on average tangible common equity increased to 11.07%, return on average assets increased to 0.92% and the efficiency ratio was 58%. This led to record net income in 2016 of $27 million and diluted earnings per share of $1.50, an increase of 29% and 27%, respectively, from 2015. Activities to enhance BSA Compliance and address the BSA Consent Order resulted in $1.7 million in non-recurring charges in 2016. The Company continued to focus on low-cost core deposits, which provide an important part of the value of its franchise. In 2016 the Company’s total deposits increased $321 million to $2.6 billion, and despite the prime rate increase in December of 2015 and 2016, the cost of deposits in the fourth quarter of 2016 remained within 0.01% of the year-ago quarter. Total assets have grown by $730 million in the two years since the merger of the Company and 1st Enterprise Bank, buttressing the Company’s commitment to organic growth. Compared to 2015, total loans grew $217 million or 12% to $2.1 billion — surpassing the $2 billion mark for the first time in the Company’s history. Furthermore, the Company experienced net recoveries and in 2016, the Company again demonstrated its ability to combine growth with discipline in credit underwriting; witnessed by the ratio of non-performing assets to total assets of 0.04% at December 31, 2016.
Full Year 2016 Highlights
| • | Net income in 2016 was $27 million, up 29% from the prior year |
| • | Return on average tangible common equity of 11.07%, up from 9.86% in the prior year |
| • | Efficiency ratio improved to 58%, from 61% in the prior year |
| • | Tangible book value per share increased $1.43 per share, or 11% to $14.10 from the prior year |
| • | Total assets increased $360 million to $3 billion, up 14% from the prior year |
| • | Total deposits increased to $2.6 billion, an increase of $321 million or 14% from prior year |
| • | Non-interest bearing demand deposits were 54% of total deposits at December 31, 2016 |
| • | Year-end 2016 average deposits per branch increased to $290 million |
| • | Total loans increased to $2 billion, an increase of $217 million or 12% from 2015 |
| • | Record net organic loan growth of $388 million in 2016 |
| • | Nonperforming assets to total assets at 0.04%, at December 31, 2016 |
| • | Continued status as well-capitalized, the highest regulatory category |
The Company’s increase in total assets over the last 10 years is due to the Company’s execution of its primary business model focusing on businesses, non-profits, entrepreneurs, professionals and investors, supplemented by the mergers with 1st Enterprise Bank (“1st Enterprise”) in November 2014, Premier Commercial Bancorp (“PC Bancorp”) in July of 2012 and California Oaks State Bank (“COSB”) in December of 2010. The Company is organized and operated as a single reporting segment, principally engaged in commercial business
52
Table of Contents
banking. At December 31, 2016, the Company conducted its lending and deposit operations through nine branch offices, located in the counties of Los Angeles, Ventura, Orange and San Bernardino in Southern California. The consolidated financial statements, as they appear in this document, represent the grouping of revenue and expense items as they are presented to executive management for use in strategically directing the Company’s operations. The Company’s growth in loans and deposit liabilities during 2016 was the direct result of the successful execution of its organic growth strategies, with an emphasis on maintaining strong ties to existing customer relationships, as well as developing new customer relationships. New customer relationships are developed from referrals from Board members, current customers, and the local communities the Company actively supports. In addition, the Company targets potential customers whose current bank may be unable to provide the same level of customer support that the customer has come to desire.
CRITICAL ACCOUNTING POLICIES AND ESTIMATES
The discussion and analysis of our financial condition and results of operations are based upon our financial statements, which have been prepared in accordance with U.S. generally accepted accounting principles (“GAAP”). The preparation of these financial statements requires management to make estimates and judgments that affect the reported amounts of assets and liabilities, revenues and expenses, and related disclosures of contingent assets and liabilities at the date of our financial statements. Actual results may differ from these estimates under different assumptions or conditions.
Various elements of our accounting policies, by their nature, are inherently subject to estimation techniques, valuation assumptions, and other subjective assessments. We have identified several accounting policies that, due to judgments, estimates, and assumptions inherent in those policies, are essential to an understanding of our consolidated financial statements. These policies relate to the accounting for business combinations, evaluation of goodwill for impairment, methodologies that determine our allowance for loan loss, the valuation of impaired loans, the classification and valuation of investment securities, accounting for derivatives financial instruments and hedging activities, and accounting for income taxes.
We believe that our most critical accounting policies upon which our financial condition depends, and which involve the most complex or subjective decisions or assessment, are as follows:
Business Combinations
The Company has a number of fair value adjustments recorded within the consolidated financial statements at December 31, 2016 that relate to the business combinations with COSB, PC Bancorp and 1st Enterprise on December 31, 2010, July 31, 2012 and November 30, 2014, respectively. These fair value adjustments includes goodwill, fair value adjustments on loans, core deposit intangible assets, other intangible assets, fair value adjustments to acquired lease obligations and fair value adjustments on derivatives. The assets and liabilities acquired through acquisitions have been accounted for at fair value as of the date of the acquisition. The goodwill that was recorded on the transactions represented the excess of the purchase price over the fair value of net assets acquired. Goodwill is not amortized and is reviewed for impairment on October 1st of each year. If certain events occur or circumstances change that result in the Company’s fair value declining below its book value, the Company would perform an impairment analysis at that time.
Allowance for Loan Loss
The allowance for loan loss (“Allowance”) is established by a provision for loan losses that is charged against income, increased by charges to expense and decreased by charge-offs (net of recoveries). Loan charge-offs are charged against the Allowance when management believes the collectability of loan principal becomes unlikely. Subsequent recoveries, if any, are credited to the Allowance.
53
Table of Contents
The Allowance is an amount that management believes will be adequate to absorb estimated charge-offs related to specifically identified loans, as well as probable loan charge-offs inherent in the balance of the loan portfolio, based on an evaluation of the collectability of existing loans and prior loss experience. Management carefully monitors changing economic conditions, the concentrations of loan categories and collateral, the financial condition of the borrowers, the history of the loan portfolio, as well as historical peer group loan loss data to determine the adequacy of the Allowance. The Allowance is based upon estimates, and actual charge-offs may vary from the estimates. No assurance can be given that adverse future economic conditions will not lead to delinquent loans, increases in the provision for loan losses and/or charge-offs. These evaluations are inherently subjective, as they require estimates that are susceptible to significant revisions as conditions change. In addition, regulatory agencies, as an integral part of their examination process, may require additions to the Allowance based on their judgment about information available at the time of their examinations. Management believes that the Allowance as of December 31, 2016 is adequate to absorb known and probable losses inherent in the loan portfolio.
The Allowance consists of specific and general components. The specific component relates to loans that are categorized as impaired. For loans that are categorized as impaired, a specific allowance is established when the realizable value of the impaired loan is lower than the recorded investment of that loan. The general component covers non-impaired loans and is based on the type of loan and historical charge-off experience adjusted for qualitative factors.
While the general allowance covers all non-impaired loans and is based on historical loss experience adjusted for the various qualitative factors as discussed in Note 6 — Loans, the change in the Allowance from one reporting period to the next may not directly correlate to the rate of change of nonperforming loans for the following reasons:
| • | A loan moving from the impaired performing status to an impaired non-performing status does not mandate an automatic increase in allowance. The individual loan is evaluated for a specific allowance requirement when the loan moves to the impaired status, not when the loan moves to non-performing status. In addition, the impaired loan is reevaluated at each subsequent reporting period. Impairment is measured based on the present value of the expected future cash flows discounted at the loan’s effective interest rate, except that as a practical expedient, the Company may measure impairment based on the loan’s observable market price or the fair value of the collateral if the loan is collateral dependent. |
| • | Not all impaired loans require a specific allowance. The payment performance of the borrower may require an impaired classification, but the collateral evaluation may support adequate collateral coverage. For a number of impaired loans in which borrower performance is in question, the collateral coverage may be sufficient. In those instances, a specific allowance is not assessed. |
Investment Securities
The Company currently classifies its investment securities under the available-for-sale and held-to-maturity classifications. Under the available-for-sale classification, securities can be sold in response to certain conditions, such as changes in interest rates, changes in the credit quality of the securities, when the credit quality of a security does not conform with current investment policy guidelines, fluctuations in deposit levels or loan demand or a need to restructure the portfolio to better match the maturity or interest rate characteristics of liabilities with assets. Securities classified as available-for-sale are accounted for at their current fair value rather than amortized cost. Unrealized gains or losses are excluded from net income and reported as a separate component of accumulated other comprehensive income (loss) included in shareholders’ equity. If the Company has the intent and the ability at the time of purchase to hold certain securities until maturity, they are classified as held-to-maturity and are stated at amortized cost.
54
Table of Contents
As of each reporting date, the Company evaluates the securities portfolio to determine if there has been an other-than-temporary impairment (“OTTI”) on each of the individual securities in the investment securities portfolio. If it is probable that the Company will be unable to collect all amounts due according to the contractual terms of a debt security not impaired at acquisition, an OTTI shall be considered to have occurred. Once an OTTI is considered to have occurred, the credit portion of the loss is required to be recognized in current earnings, while the non-credit portion of the loss is recorded as a separate component of shareholders’ equity.
In estimating whether an other-than-temporary impairment loss has occurred, management considers, among other things, (i) the length of time and the extent to which the fair value has been less than cost, (ii) the financial condition and near-term prospects of the issuer, (iii) the current liquidity and volatility of the market for each of the individual security categories, (iv) the current slope and shape of the Treasury yield curve, along with where the economy is in the current interest rate cycle, (v) the spread differential between the current spread and the long-term average spread for that security category, (vi) the projected cash flows from the specific security type, (vii) any financial guarantee and financial condition of the guarantor and (viii) the intent and ability of the Company to retain its investment in the issue for a period of time sufficient to allow for any anticipated recovery in fair value.
If it’s determined that an OTTI exists on a debt security, the Company then determines if (a) it intends to sell the security or (b) it is more likely than not that it will be required to sell the security before its anticipated recovery. If either of the conditions is met, the Company will recognize the amount of the OTTI in earnings equal to the difference between the security’s fair value and its adjusted cost basis. If neither of the conditions is met, the Company determines (a) the amount of the impairment related to credit loss and (b) the amount of the impairment due to all other factors. The difference between the present value of the cash flows expected to be collected and the amortized cost basis is the credit loss. The credit loss is the portion of the other-than-temporary impairment that is recognized in earnings and is a reduction to the cost basis of the security. The portion of total impairment related to all other factors is included in other comprehensive income. Significant judgment is required in this analysis that includes, but is not limited to assumptions regarding the collectability of principal and interest, future default rates, future prepayment speeds, the amount of current delinquencies that will result in defaults and the amount of eventual recoveries expected on the underlying collateral.
Realized gains and losses on sales of securities are recognized in earnings at the time of sale and are determined on a specific-identification basis. Purchase premiums and discounts are recognized in interest income using the interest method over the expected maturity term of the securities. For mortgage-backed securities, the amortization or accretion is based on estimated average lives of the securities. The lives of these securities can fluctuate based on the amount of prepayments received on the underlying collateral of the securities. The amount of prepayments varies from time to time based on the interest rate environment and the rate of turnover of mortgages. The Company’s investment in the common stock of Pacific Coast Bankers Bank (“PCBB”) and The Independent Banker’s Bank (“TIB”) is carried at cost, evaluated for impairment and is included in other assets on the accompanying consolidated balance sheets.
Derivative Financial Instruments and Hedging Activities
All derivative instruments (interest rate swap contracts) are recognized on the consolidated balance sheet at their current fair value. Every derivative instrument (including certain derivative instruments embedded in other contracts) is required to be recorded in the balance sheet as either an asset or liability measured at its fair value. ASC Topic 815 requires that changes in the derivative’s fair value be recognized currently in earnings unless specific hedge accounting criteria are met. Accounting for qualifying hedges allows a derivative’s gains and losses to offset related results on the hedged item in the income statement, and requires that a company must formally document, designate and assess the effectiveness of transactions that receive hedge accounting.
On the date a derivative contract is entered into by the Company, the Company will designate the derivative contract as either a fair value hedge (i.e. a hedge of the fair value of a recognized asset or liability), a cash flow
55
Table of Contents
hedge (i.e. a hedge of the variability of cash flows to be received or paid related to a recognized asset or liability), or a stand-alone derivative (i.e. and instrument with no hedging designation). For a derivative designated as a fair value hedge, the changes in the fair value of the derivative and of the hedged item attributable to the hedged risk are recognized in earnings. If the derivative is designated as a cash flow hedge, the effective portions of changes in the fair value of the derivative are recorded in other comprehensive income and are recognized in the income statement when the hedged item affects earnings. Changes in the fair value of derivatives that do not qualify for hedge accounting are reported currently in earnings, as other non-interest income. At inception and on an ongoing basis, the derivatives that are used in hedging transactions are assessed for effectiveness as to how effective they are in offsetting changes in fair values or cash flows of hedged items.
The Company will discontinue hedge accounting prospectively when it is determined that the derivative is no longer effective in offsetting change in the fair value of the hedged item, the derivative expires or is sold, is terminated, or management determines that designation of the derivative as a hedging instrument is no longer appropriate. When hedge accounting is discontinued, the Company will continue to carry the derivative on the balance sheet at its fair value (if applicable), but will no longer adjust the hedged asset or liability for changes in fair value. The adjustments of the carrying amount of the hedged asset or liability will be accounted for in the same manner as other components of the carrying amount of that asset or liability, and the adjustments are amortized to interest income over the remaining life of the hedged item upon the termination of hedge accounting.
Income Taxes
The Company provides for current federal and state income taxes payable and for deferred taxes that result from differences between financial accounting rules and tax laws governing the timing of recognition of various income and expense items. The Company recognizes deferred income tax assets and liabilities for the future tax effects of such temporary differences based on the difference between the financial statement and tax bases of the existing assets and liabilities using the statutory rate expected in the years in which the differences are expected to reverse. The effect on deferred taxes of any enacted change in tax rates is recognized in income in the period that includes the enactment date. A valuation allowance is established to the extent necessary to reduce the deferred tax asset to the level at which it is “more likely than not” that the tax assets or benefits will be realized. Realization of tax benefits for deductible temporary differences and loss carryforwards depends on having sufficient taxable income of an appropriate character within the carryback and carryforward period and that current tax law will allow for the realization of those tax benefits.
The Company is required to account for uncertainty associated with the tax positions it has taken or expects to be taken on past, current and future tax returns. Where there may be a degree of uncertainty as to the tax realization of an item, the Company may only record the tax effects (expense or benefits) from an uncertain tax position in the consolidated financial statements if, based on its merits, the position is more likely than not to be sustained on audit by the taxing authorities. The Company does not believe that it has any material uncertain tax positions taken to date that are not more likely than not to be realized. Interest and penalties related to uncertain tax positions are recorded as part of other operating expense.
Recent Accounting Pronouncements
See Note 1, Summary of Significant Accounting Policies in Item 8, Financial Statements and Supplementary Data.
56
Table of Contents
RESULTS OF OPERATIONS
Key Profitability Measures
The following table presents key profitability measures for the periods indicated and the dollar and percentage changes between the periods (dollars in thousands, except per share data):
| Years Ended December 31, | Increase / (Decrease) | |||||||||||||||
| 2016 | 2015 | $ | % | |||||||||||||
| Net Income Available to Common Shareholders |
$ | 26,240 | $ | 20,062 | $ | 6,178 | 30.8 | % | ||||||||
|
|
|
|
|
|
|
|||||||||||
| Earnings per share |
||||||||||||||||
| Basic |
$ | 1.52 | $ | 1.21 | $ | 0.31 | 25.6 | % | ||||||||
| Diluted |
$ | 1.50 | $ | 1.18 | $ | 0.32 | 27.1 | % | ||||||||
| Return on average assets (1) |
0.92 | % | 0.80 | % | 0.12 | % | 15.0 | % | ||||||||
| Return on average tangible common equity (2) |
11.07 | % | 9.86 | % | 1.21 | % | 12.3 | % | ||||||||
| Net interest margin (3) |
3.71 | % | 3.83 | % | (0.11) | % | (2.9) | % | ||||||||
| Efficiency ratio (4) |
57.75 | % | 61.48 | % | (3.73) | % | (6.07) | % | ||||||||
| Years Ended December 31, | Increase / (Decrease) | |||||||||||||||
| 2015 | 2014 | $ | % | |||||||||||||
| Net Income Available to Common Shareholders |
$ | 20,062 | $ | 8,784 | $ | 11,278 | 128.4 | % | ||||||||
|
|
|
|
|
|
|
|||||||||||
| Earnings per share |
||||||||||||||||
| Basic |
$ | 1.21 | $ | 0.77 | $ | 0.44 | 57.1 | % | ||||||||
| Diluted |
$ | 1.18 | $ | 0.75 | $ | 0.43 | 57.3 | % | ||||||||
| Return on average assets (1) |
0.80 | % | 0.59 | % | 0.21 | % | 35.6 | % | ||||||||
| Return on average tangible common equity (2) |
9.86 | % | 6.50 | % | 3.36 | % | 51.7 | % | ||||||||
| Net interest margin (3) |
3.83 | % | 3.79 | % | 0.04 | % | 1.1 | % | ||||||||
| Efficiency ratio (4) |
61.48 | % | 71.11 | % | (9.63) | % | (13.54) | % | ||||||||
| (1) | Return on average assets is calculated by dividing the net income available to common shareholders by the average assets for the period. |
| (2) | Return on average tangible common equity is calculated by dividing the Company’s net income available to common shareholders by the average tangible common equity for the period. See the tables below for return on average tangible common equity calculation and reconciliation to average shareholders’ equity. |
| (3) | The net interest margin represents net interest income as a percent of interest bearing assets |
| (4) | Efficiency ratio represents non-interest expense as a percent of net interest income plus non-interest income, excluding gain on sale of securities, net. |
57
Table of Contents
Non-GAAP Financial Measure — Average Tangible Common Equity (“TCE”) Calculation and Reconciliation to Total Average Shareholders’ Equity
The Company utilizes the term TCE, a non-GAAP financial measure. The Company’s management believes TCE is useful because it is a measure utilized by both regulators and market analysts in evaluating a consolidated bank holding company’s financial condition and capital strength. TCE represents common shareholders’ equity less goodwill and certain other intangible assets. Return on Average Tangible Common Equity represents year-to-date net income available to common shareholders as a percent of average tangible common equity. A calculation of the Company’s Return on Average Tangible Common Equity is provided in the table below for the periods indicated (dollars in thousands):
| Year Ended December 31, | ||||||||||||
| 2016 | 2015 | 2014 | ||||||||||
| Average Tangible Common Equity Calculation |
||||||||||||
| Total average shareholders’ equity |
$ | 325,737 | $ | 292,577 | $ | 152,500 | ||||||
| Less: Average serial preferred stock |
17,068 | 16,457 | 1,390 | |||||||||
| Less: Average goodwill |
64,603 | 64,014 | 13,659 | |||||||||
| Less: Average core deposit and leasehold right intangibles |
6,986 | 8,644 | 2,366 | |||||||||
|
|
|
|
|
|
|
|||||||
| Average Tangible Common Equity |
$ | 237,080 | $ | 203,462 | $ | 135,085 | ||||||
|
|
|
|
|
|
|
|||||||
| Net Income Available to Common Shareholders |
$ | 26,240 | $ | 20,062 | $ | 8,784 | ||||||
| Return on Average Tangible Common Equity |
11.07% | 9.86% | 6.50% | |||||||||
Operations Performance Summary
Year Ended December 31, 2016 Compared to Year Ended December 31, 2015
Net income available to common shareholders for the year ended December 31, 2016 was $26 million, or $1.50 per diluted share, compared to $20 million, or $1.18 per diluted share for the year ended December 31, 2015. The $6.2 million increase, or 30.8%, was primarily due to $13 million increase in net interest income after provision for loan losses, as a result of strong organic loan growth since the prior period, offset by a $3.5 million increase in non-interest expense and a $3.1 million increase in provision for income tax expense. Included in the increase of non-interest expense was $1.9 million of non-recurring expenses related to the BSA Consent Order and the closing of the Simi Valley administrative office during 2016. Salaries and employee benefits increased $2.3 million in 2016 as the number of active full time employees increased from 266 at December 31, 2015 to 288 at December 31, 2016. Further, there was no merger-related expenses in 2016, compared to $921 thousand in 2015. During the third quarter of 2016, the Company early adopted ASU 2016-09, Compensation — Stock Compensation (Topic 718): Improvements to Employee Share-Based Payment Accounting, effective January 1, 2016, which had a positive impact of $1.4 million to net income, as a reduction to provision for income tax expense for the year ended 2016.
Year Ended December 31, 2015 Compared to Year Ended December 31, 2014
Net income available to common shareholders for the year ended December 31, 2015 was $20 million, or $1.18 per diluted share, compared to $8.8 million, or $0.75 per diluted share for the year ended December 31, 2014. The $11 million increase, or 128.4%, was primarily due to $31 million increase in net interest income after provision for loan losses and a $4.0 million increase in non-interest income, offset by a $17 million increase in non-interest expense and a $6.4 million increase in provision for income tax expense. These increases were primarily related to the successful execution of the merger with 1st Enterprise at the end of November 2014 coupled with a strong net organic loan growth of $349 million in 2015. Salaries and employee benefits increased $10 million in 2015, due to a full year of larger employee base as a result of the merger. Occupancy expense also increased $1.7 million for the same period due to a full year of additional locations. Further, core deposit
58
Table of Contents
intangible amortization increased $1.3 million in 2015, mainly due to a full year of amortization of a $7.1 million core deposit intangible recognized from the 1st Enterprise merger. Provision for loan losses also increased $2.8 million, as a result of strong organic loan growth and net charge-offs of $2.0 million in 2015. Merger expenses were lower by $1.8 million compared to 2014. Each of these increases and or decreases is more fully described below.
Average Balances, Interest Income and Expense, Yields and Rates
Years Ended December 31, 2016 and 2015
The following table presents the Company’s average balance sheets, together with the total dollar amounts of interest income and interest expense and the weighted average interest yield/rate for the periods presented. All average balances are daily average balances (dollars in thousands).
| Years Ended December 31, | ||||||||||||||||||||||||
| 2016 | 2015 | |||||||||||||||||||||||
| Average Balance |
Interest Income/ Expense |
Average Yield/ Rate |
Average Balance |
Interest Income/ Expense |
Average Yield/ Rate |
|||||||||||||||||||
| Interest earning Assets: |
||||||||||||||||||||||||
| Loans (1) |
$ | 1,924,603 | $ | 93,589 | 4.86 | % | $ | 1,707,654 | $ | 84,537 | 4.95 | % | ||||||||||||
| Investment securities (2) |
400,733 | 5,793 | 1.45 | % | 287,436 | 4,518 | 1.57 | % | ||||||||||||||||
| Deposits in other financial institutions |
309,709 | 1,870 | 0.59 | % | 289,364 | 1,087 | 0.37 | % | ||||||||||||||||
|
|
|
|
|
|
|
|
|
|||||||||||||||||
| Total interest earning assets |
2,635,045 | 101,252 | 3.84 | % | 2,284,454 | 90,142 | 3.95 | % | ||||||||||||||||
|
|
|
|
|
|||||||||||||||||||||
| Non-interest earning assets |
210,356 | 210,736 | ||||||||||||||||||||||
|
|
|
|
|
|||||||||||||||||||||
| Total assets |
$ | 2,845,401 | $ | 2,495,190 | ||||||||||||||||||||
|
|
|
|
|
|||||||||||||||||||||
| Interest bearing Liabilities: |
||||||||||||||||||||||||
| Interest bearing transaction accounts |
$ | 290,104 | 416 | 0.14 | % | 258,444 | 413 | 0.16 | % | |||||||||||||||
| Money market and savings deposits |
767,826 | 2,051 | 0.27 | % | 690,065 | 1,652 | 0.24 | % | ||||||||||||||||
| Certificates of deposit |
46,945 | 139 | 0.30 | % | 61,275 | 190 | 0.31 | % | ||||||||||||||||
|
|
|
|
|
|
|
|
|
|||||||||||||||||
| Total interest bearing deposits |
1,104,875 | 2,606 | 0.24 | % | 1,009,784 | 2,255 | 0.22 | % | ||||||||||||||||
| Securities sold under agreements to repurchase |
22,739 | 53 | 0.23 | % | 13,966 | 30 | 0.21 | % | ||||||||||||||||
| Subordinated debentures |
9,795 | 487 | 4.89 | % | 9,637 | 438 | 4.48 | % | ||||||||||||||||
|
|
|
|
|
|
|
|
|
|||||||||||||||||
| Total borrowings |
32,534 | 540 | 1.66 | % | 23,603 | 468 | 1.98 | % | ||||||||||||||||
|
|
|
|
|
|
|
|
|
|||||||||||||||||
| Total interest bearing liabilities |
1,137,409 | 3,146 | 0.28 | % | 1,033,387 | 2,723 | 0.26 | % | ||||||||||||||||
|
|
|
|
|
|||||||||||||||||||||
| Non-interest bearing demand deposits |
1,364,164 | 1,151,075 | ||||||||||||||||||||||
|
|
|
|
|
|||||||||||||||||||||
| Total funding sources |
2,501,573 | 2,184,462 | ||||||||||||||||||||||
| Non-interest bearing liabilities |
18,091 | 18,151 | ||||||||||||||||||||||
| Shareholders’ equity |
325,737 | 292,577 | ||||||||||||||||||||||
|
|
|
|
|
|||||||||||||||||||||
| Total liabilities and shareholders’ equity |
$ | 2,845,401 | $ | 2,495,190 | ||||||||||||||||||||
|
|
|
|
|
|||||||||||||||||||||
| Excess of interest-earning assets over funding sources |
$ | 98,106 | $ | 87,419 | ||||||||||||||||||||
|
|
|
|
|
|||||||||||||||||||||
| Net interest margin (3) |
3.71 | % | 3.83 | % | ||||||||||||||||||||
| Core net interest margin (4) |
3.60 | % | 3.69 | % | ||||||||||||||||||||
| (1) | Average balances of loans are calculated net of deferred loan fees and fair value discounts, but would include non-accrual loans which have a zero yield. |
| (2) | Average balances of investment securities available-for-sale are presented on an amortized cost basis and thus do not include the unrealized market gain or loss on the securities. |
59
Table of Contents
| (3) | Net interest margin is computed by dividing net interest income by average total interest earning assets. |
| (4) | Core net interest margin is computed by dividing net interest income, excluding accelerated accretion of fair value discounts earned on early loan payoffs of acquired loans and interest recovered or reversed on non-accrual loans or other significant items based on management’s judgement, by average total interest-earning assets. See the reconciliation table for core net interest margin. |
Average Balances, Interest Income and Expense, Yields and Rates
Years Ended December 31, 2015 and 2014
The following table presents the Company’s average balance sheets, together with the total dollar amounts of interest income and interest expense and the weighted average interest yield/rate for the periods presented. All average balances are daily average balances (dollars in thousands).
| Years Ended December 31, | ||||||||||||||||||||||||
| 2015 | 2014 | |||||||||||||||||||||||
| Average Balance |
Interest Income/ Expense |
Average Yield/ Rate |
Average Balance |
Interest Income/ Expense |
Average Yield/ Rate |
|||||||||||||||||||
| Interest earning Assets: |
||||||||||||||||||||||||
| Loans (1) |
$ | 1,707,654 | $ | 84,537 | 4.95 | % | $ | 1,010,030 | $ | 51,882 | 5.14 | % | ||||||||||||
| Investment securities (2) |
287,436 | 4,518 | 1.57 | % | 129,841 | 2,369 | 1.82 | % | ||||||||||||||||
| Deposits in other financial institutions |
289,364 | 1,087 | 0.37 | % | 265,076 | 926 | 0.34 | % | ||||||||||||||||
|
|
|
|
|
|
|
|
|
|||||||||||||||||
| Total interest earning assets |
2,284,454 | 90,142 | 3.95 | % | 1,404,947 | 55,177 | 3.93 | % | ||||||||||||||||
|
|
|
|
|
|||||||||||||||||||||
| Non-interest earning assets |
210,736 | 95,818 | ||||||||||||||||||||||
|
|
|
|
|
|||||||||||||||||||||
| Total assets |
$ | 2,495,190 | $ | 1,500,765 | ||||||||||||||||||||
|
|
|
|
|
|||||||||||||||||||||
| Interest bearing Liabilities: |
||||||||||||||||||||||||
| Interest bearing transaction accounts |
$ | 258,444 | 413 | 0.16 | % | 153,327 | 278 | 0.18 | % | |||||||||||||||
| Money market and savings deposits |
690,065 | 1,652 | 0.24 | % | 390,185 | 963 | 0.25 | % | ||||||||||||||||
| Certificates of deposit |
61,275 | 190 | 0.31 | % | 61,048 | 216 | 0.35 | % | ||||||||||||||||
|
|
|
|
|
|
|
|
|
|||||||||||||||||
| Total interest bearing deposits |
1,009,784 | 2,255 | 0.22 | % | 604,560 | 1,457 | 0.24 | % | ||||||||||||||||
| Securities sold under agreements to repurchase |
13,966 | 30 | 0.21 | % | 13,579 | 34 | 0.25 | % | ||||||||||||||||
| Subordinated debentures |
9,637 | 438 | 4.48 | % | 9,556 | 431 | 4.45 | % | ||||||||||||||||
|
|
|
|
|
|
|
|
|
|||||||||||||||||
| Total borrowings |
23,603 | 468 | 1.98 | % | 23,135 | 465 | 2.01 | % | ||||||||||||||||
|
|
|
|
|
|
|
|
|
|||||||||||||||||
| Total interest bearing liabilities |
1,033,387 | 2,723 | 0.26 | % | 627,695 | 1,922 | 0.31 | % | ||||||||||||||||
|
|
|
|
|
|||||||||||||||||||||
| Non-interest bearing demand deposits |
1,151,075 | 704,437 | ||||||||||||||||||||||
|
|
|
|
|
|||||||||||||||||||||
| Total funding sources |
2,184,462 | 1,332,132 | ||||||||||||||||||||||
| Non-interest bearing liabilities |
18,151 | 16,133 | ||||||||||||||||||||||
| Shareholders’ equity |
292,577 | 152,500 | ||||||||||||||||||||||
|
|
|
|
|
|||||||||||||||||||||
| Total liabilities and shareholders’ equity |
$ | 2,495,190 | $ | 1,500,765 | ||||||||||||||||||||
|
|
|
|
|
|||||||||||||||||||||
| Excess of interest-earning assets over funding sources |
$ | 87,419 | $ | 53,255 | ||||||||||||||||||||
|
|
|
|
|
|||||||||||||||||||||
| Net interest margin (3) |
3.83 | % | 3.79 | % | ||||||||||||||||||||
| Core net interest margin (4) |
3.69 | % | 3.64 | % | ||||||||||||||||||||
| (1) | Average balances of loans are calculated net of deferred loan fees and fair value discounts, but would include non-accrual loans which have a zero yield. |
| (2) | Average balances of investment securities available-for-sale are presented on an amortized cost basis and thus do not include the unrealized market gain or loss on the securities. |
60
Table of Contents
| (3) | Net interest margin is computed by dividing net interest income by average total interest earning assets. |
| (4) | Core net interest margin is computed by dividing net interest income, excluding accelerated accretion of fair value discounts earned on early loan payoffs of acquired loans and interest recovered or reversed on non-accrual loans or other significant items based on management’s judgement, by average total interest-earning assets. See the reconciliation table for core net interest margin. |
Net Changes in Average Balances, Composition, Yields and Rates
Years Ended December 31, 2016 and 2015
The following table set forth the composition of average interest earning assets and average interest bearing liabilities by category and by the percentage of each category to the total for the periods indicated, including the change in average balance, composition, and yield/rate between these respective periods (dollars in thousands):
| Years Ended December 31, |
||||||||||||||||||||||||||||||||||
| 2016 |
2015 | Increase (Decrease) | ||||||||||||||||||||||||||||||||
| Average |
% of Total |
Average Yield/ Rate |
Average Balance |
% of Total |
Average Yield/ Rate |
Average Balance |
% of Total |
Average Yield/ Rate |
||||||||||||||||||||||||||
| Interest earning Assets: |
||||||||||||||||||||||||||||||||||
| Loans (1) |
$1,924,603 | 73.0 | % | 4.86 | % | $ | 1,707,654 | 74.7 | % | 4.95 | % | $ | 216,949 | (1.7 | )% | (0.09 | )% | |||||||||||||||||
| Investment securities (2) |
400,733 | 15.2 | % | 1.45 | % | 287,436 | 12.6 | % | 1.57 | % | 113,297 | 2.6 | % | (0.12 | )% | |||||||||||||||||||
| Deposits in other financial institutions |
309,709 | 11.8 | % | 0.59 | % | 289,364 | 12.7 | % | 0.37 | % | 20,345 | (0.9 | )% | 0.22 | % | |||||||||||||||||||
|
|
|
|
|
|
|
|
|
|
||||||||||||||||||||||||||
| Total interest earning assets |
$2,635,045 | 100.0 | % | 3.84 | % | $ | 2,284,454 | 100.0 | % | 3.95 | % | $ | 350,591 | — | % | (0.11 | )% | |||||||||||||||||
|
|
|
|
|
|
|
|
|
|
||||||||||||||||||||||||||
| Interest-Bearing Liabilities: |
||||||||||||||||||||||||||||||||||
| Non-interest bearing demand deposits |
$1,364,164 | 54.5 | % | — | $ | 1,151,075 | 52.7 | % | — | $ | 213,089 | 1.8 | % | — | ||||||||||||||||||||
| Interest bearing transaction accounts |
290,104 | 11.6 | % | 0.14 | % | 258,444 | 11.9 | % | 0.16 | % | 31,660 | (0.3 | )% | (0.02 | )% | |||||||||||||||||||
| Money market and savings deposits |
767,826 | 30.7 | % | 0.27 | % | 690,065 | 31.6 | % | 0.24 | % | 77,761 | (0.9 | )% | 0.03 | % | |||||||||||||||||||
| Certificates of deposit |
46,945 | 1.9 | % | 0.30 | % | 61,275 | 2.8 | % | 0.31 | % | (14,330 | ) | (0.9 | )% | (0.01 | )% | ||||||||||||||||||
|
|
|
|
|
|
|
|
|
|
|
|
||||||||||||||||||||||||
| Total deposits |
2,469,039 | 98.7 | % | 0.11 | % | 2,160,859 | 99.0 | % | 0.10 | % | 308,180 | (0.3 | )% | 0.01 | % | |||||||||||||||||||
| Securities sold under agreements to repurchase |
22,739 | 0.9 | % | 0.23 | % | 13,966 | 0.6 | % | 0.21 | % | 8,773 | 0.3 | % | 0.02 | % | |||||||||||||||||||
| Subordinated debentures |
9,795 | 0.4 | % | 4.89 | % | 9,637 | 0.4 | % | 4.48 | % | 158 | — | % | 0.41 | % | |||||||||||||||||||
|
|
|
|
|
|
|
|
|
|
||||||||||||||||||||||||||
| Total borrowings |
32,534 | 1.3 | % | 1.66 | % | 23,603 | 1.0 | % | 1.98 | % | 8,931 | 0.3 | % | (0.32 | )% | |||||||||||||||||||
|
|
|
|
|
|
|
|
|
|
||||||||||||||||||||||||||
| Total funding sources |
$2,501,573 | 100.0 | % | 0.13 | % | $ | 2,184,462 | 100.0 | % | 0.12 | % | $ | 317,111 | — | % | 0.01 | % | |||||||||||||||||
|
|
|
|
|
|
|
|
|
|
||||||||||||||||||||||||||
| Excess of interest earning assets over funding sources |
$133,472 | $ | 99,992 | $ | 33,480 | |||||||||||||||||||||||||||||
| Net interest margin (3) |
3.71 | % | 3.83 | % | (0.12 | )% | ||||||||||||||||||||||||||||
| Core net interest margin (4) |
3.60 | % | 3.69 | % | (0.09 | )% | ||||||||||||||||||||||||||||
| (1) | Average balances of loans are calculated net of deferred loan fees and fair value discounts, but would include non-accrual loans which have a zero yield. |
| (2) | Average balances of investment securities available-for-sale are presented on an amortized cost basis and thus do not include the unrealized market gain or loss on the securities. |
| (3) | Net interest margin is computed by dividing net interest income by average total interest earning assets. |
61
Table of Contents
| (4) | Core net interest margin is computed by dividing net interest income, excluding accelerated accretion of fair value discounts earned on early loan payoffs of acquired loans and interest recovered or reversed on non-accrual loans or other significant items based on management’s judgement, by average total interest-earning assets. See the reconciliation table for core net interest margin. |
Net Changes in Average Balances, Composition, Yields and Rates
Years Ended December 31, 2015 and 2014
The following table sets forth the composition of average interest earning assets and average interest bearing liabilities by category and by the percentage of each category to the total for the periods indicated, including the change in average balance, composition and yield/rate between these respective periods (dollars in thousands):
| Years Ended December 31, | ||||||||||||||||||||||||||||||||||||
| 2015 | 2014 | Increase (Decrease) | ||||||||||||||||||||||||||||||||||
| Average Balance |
% of Total |
Average Yield/ Rate |
Average Balance |
% of Total |
Average Yield/ Rate |
Average Balance |
% of Total |
Average Yield/ Rate |
||||||||||||||||||||||||||||
| Interest earning Assets: |
||||||||||||||||||||||||||||||||||||
| Loans (1) |
$ | 1,707,654 | 74.7 | % | 4.95 | % | $ | 1,010,030 | 71.9 | % | 5.14 | % | $ | 697,624 | 2.9 | % | (0.19 | )% | ||||||||||||||||||
| Investment securities (2) |
287,436 | 12.6 | % | 1.57 | % | 129,841 | 9.2 | % | 1.82 | % | 157,595 | 3.3 | % | (0.25 | )% | |||||||||||||||||||||
| Deposits in other financial institutions |
289,364 | 12.7 | % | 0.37 | % | 265,076 | 18.9 | % | 0.34 | % | 24,288 | (6.2 | )% | 0.03 | % | |||||||||||||||||||||
|
|
|
|
|
|
|
|
|
|
|
|||||||||||||||||||||||||||
| Total interest earning assets |
$ | 2,284,454 | 100.0 | % | 3.95 | % | $ | 1,404,947 | 100.0 | % | 3.93 | % | $ | 879,507 | — | % | 0.02 | % | ||||||||||||||||||
|
|
|
|
|
|
|
|
|
|
|
|||||||||||||||||||||||||||
| Interest-Bearing Liabilities: |
||||||||||||||||||||||||||||||||||||
| Non-interest bearing demand deposits |
$ | 1,151,075 | 52.7 | % | — | $ | 704,437 | 52.9 | % | — | $ | 446,638 | (0.2 | )% | — | |||||||||||||||||||||
| Interest bearing transaction accounts |
258,444 | 11.9 | % | 0.16 | % | 153,327 | 11.5 | % | 0.18 | % | 105,117 | 0.4 | % | (0.02 | )% | |||||||||||||||||||||
| Money market and savings deposits |
690,065 | 31.6 | % | 0.24 | % | 390,185 | 29.3 | % | 0.25 | % | 299,880 | 2.3 | % | (0.01 | )% | |||||||||||||||||||||
| Certificates of deposit |
61,275 | 2.8 | % | 0.31 | % | 61,048 | 4.6 | % | 0.35 | % | 227 | (1.8 | )% | (0.04 | )% | |||||||||||||||||||||
|
|
|
|
|
|
|
|
|
|
|
|
|
|||||||||||||||||||||||||
| Total deposits |
2,160,859 | 99.0 | % | 0.10 | % | 1,308,997 | 98.3 | % | 0.11 | % | 851,862 | 0.7 | % | (0.01 | )% | |||||||||||||||||||||
| Securities sold under agreements to repurchase |
13,966 | 0.6 | % | 0.21 | % | 13,579 | 1.0 | % | 0.25 | % | 387 | (0.4 | )% | (0.04 | )% | |||||||||||||||||||||
| Subordinated debentures |
9,637 | 0.4 | % | 4.48 | % | 9,556 | 0.7 | % | 4.45 | % | 81 | (0.3 | )% | 0.03 | % | |||||||||||||||||||||
|
|
|
|
|
|
|
|
|
|
|
|||||||||||||||||||||||||||
| Total borrowings |
23,603 | 1.0 | % | 1.98 | % | 23,135 | 1.7 | % | 2.01 | % | 468 | (0.7 | )% | (0.03 | )% | |||||||||||||||||||||
|
|
|
|
|
|
|
|
|
|
|
|||||||||||||||||||||||||||
| Total funding sources |
$ | 2,184,462 | 100.0 | % | 0.12 | % | $ | 1,332,132 | 100.0 | % | 0.14 | % | $ | 852,330 | — | % | (0.02 | )% | ||||||||||||||||||
|
|
|
|
|
|
|
|
|
|
|
|||||||||||||||||||||||||||
| Excess of interest earning assets over funding sources |
$ | 99,992 | $ | 72,815 | $ | 27,177 | ||||||||||||||||||||||||||||||
| Net interest margin (3) |
3.83 | % | 3.79 | % | 0.04 | % | ||||||||||||||||||||||||||||||
| Core net interest margin (4) |
3.69 | % | 3.64 | % | 0.05 | % | ||||||||||||||||||||||||||||||
| (1) | Average balances of loans are calculated net of deferred loan fees and fair value discounts, but would include non-accrual loans which have a zero yield. |
| (2) | Average balances of investment securities available-for-sale are presented on an amortized cost basis and thus do not include the unrealized market gain or loss on the securities. |
| (3) | Net interest margin is computed by dividing net interest income by average total interest earning assets. |
| (4) | Core net interest margin is computed by dividing net interest income, excluding accelerated accretion of fair value discounts earned on early loan payoffs of acquired loans and interest recovered or reversed on non-accrual loans or other significant items based on management’s judgement, by average total interest-earning assets. See the reconciliation table for core net interest margin. |
62
Table of Contents
Volume and Rate Variance Analysis of Net Interest Income
Years Ended December 31, 2016, 2015 and 2014
The following table presents the dollar amount of changes in interest income and interest expense due to changes in average balances of interest earning assets and interest bearing liabilities and changes in interest rates. For each category of interest earning assets and interest bearing liabilities, information is provided on changes attributable to: (i) changes in volume (i.e. changes in average balance multiplied by prior period rate) and (ii) changes in rate (i.e. changes in rate multiplied by prior period average balance). For purposes of this table, changes attributable to both rate and volume which cannot be segregated have been allocated proportionately based on the absolute dollar amounts of the changes due to volume and rate (dollars in thousands):
| December 31, 2016 vs. 2015 |
December 31, 2015 vs. 2014 |
|||||||||||||||||||||||
| Volume | Rate | Total | Volume | Rate | Total | |||||||||||||||||||
| Interest Income: |
||||||||||||||||||||||||
| Loans |
$ | 10,740 | $ | (1,688 | ) | $ | 9,052 | $ | 35,904 | $ | (3,249 | ) | $ | 32,655 | ||||||||||
| Investment securities |
1,781 | (506 | ) | 1,275 | 2,867 | (718 | ) | 2,149 | ||||||||||||||||
| Deposits in other financial institutions |
76 | 707 | 783 | 77 | 84 | 161 | ||||||||||||||||||
|
|
|
|
|
|
|
|
|
|
|
|
|
|||||||||||||
| Total interest income |
12,597 | (1,487 | ) | 11,110 | 38,848 | (3,883 | ) | 34,965 | ||||||||||||||||
|
|
|
|
|
|
|
|
|
|
|
|
|
|||||||||||||
| Interest Expense: |
||||||||||||||||||||||||
| Interest bearing transaction accounts |
51 | (48 | ) | 3 | 185 | (50 | ) | 135 | ||||||||||||||||
| Money market and savings deposits |
186 | 213 | 399 | 759 | (70 | ) | 689 | |||||||||||||||||
| Certificates of deposit |
(44 | ) | (7 | ) | (51 | ) | — | (26 | ) | (26 | ) | |||||||||||||
|
|
|
|
|
|
|
|
|
|
|
|
|
|||||||||||||
| Total deposits |
193 | 158 | 351 | 944 | (146 | ) | 798 | |||||||||||||||||
|
|
|
|
|
|
|
|
|
|
|
|
|
|||||||||||||
| Securities sold under agreements to repurchase |
19 | 4 | 23 | 1 | (5 | ) | (4 | ) | ||||||||||||||||
| Subordinated debentures |
8 | 41 | 49 | 4 | 3 | 7 | ||||||||||||||||||
|
|
|
|
|
|
|
|
|
|
|
|
|
|||||||||||||
| Total borrowings |
27 | 45 | 72 | 5 | (2 | ) | 3 | |||||||||||||||||
|
|
|
|
|
|
|
|
|
|
|
|
|
|||||||||||||
| Total interest expense |
220 | 203 | 423 | 949 | (148 | ) | 801 | |||||||||||||||||
|
|
|
|
|
|
|
|
|
|
|
|
|
|||||||||||||
| Net Interest Income |
$ | 12,377 | $ | (1,690 | ) | $ | 10,687 | $ | 37,899 | $ | (3,735 | ) | $ | 34,164 | ||||||||||
|
|
|
|
|
|
|
|
|
|
|
|
|
|||||||||||||
Non-GAAP Financial Measure - Reconciliation of Core Net Interest Income and Core Net Interest Margin to Net Interest Income and Net Interest Margin
The following table represents a reconciliation of GAAP net interest income and core net interest margin to net interest income and net interest margin used by the Company. The table presents the information for the periods indicated (dollars in thousands):
| Years Ended December 31, |
||||||||||||
| 2016 | 2015 | 2014 | ||||||||||
| Net Interest Income |
$ | 101,252 | $ | 90,142 | $ | 53,255 | ||||||
| Less: Interest recovered on non-accrual loans |
75 | 95 | 227 | |||||||||
| Accelerated accretion of fair value adjustments on early loan payoffs and other associated payoff benefits |
3,116 | 2,896 | 1,789 | |||||||||
|
|
|
|
|
|
|
|||||||
| Core Net Interest Income |
$ | 98,061 | $ | 87,151 | $ | 51,239 | ||||||
|
|
|
|
|
|
|
|||||||
| Net interest margin |
3.71 | % | 3.83 | % | 3.79 | % | ||||||
| Core net interest margin |
3.60 | % | 3.69 | % | 3.64 | % | ||||||
63
Table of Contents
Composition of Net Deferred Loan Fees and Net Fair Value Discounts
The following table reflects the composition of the net deferred loan fees and net fair value discounts at December 31, 2016 and 2015 (dollars in thousands):
| Years
Ended December 31, |
||||||||
| 2016 | 2015 | |||||||
| Accretable loan discount |
$ | 9,772 | $ | 14,856 | ||||
| Non-Accretable loan discount |
390 | 2,061 | ||||||
|
|
|
|
|
|||||
| Remaining loan discount on acquired loans |
10,162 | 16,917 | ||||||
| Net deferred loan fees on organic loans |
5,830 | 4,575 | ||||||
|
|
|
|
|
|||||
| Total |
$ | 15,992 | $ | 21,492 | ||||
|
|
|
|
|
|||||
Year Ended December 31, 2016 Compared to Year Ended December 31, 2015
The net interest margin decreased 12 basis points to 3.71% for the year ended December 31, 2016, compared to 3.83% for the year ended December 31, 2015. The decrease in net interest margin is mainly due to average loans being a lower percentage of average earning assets in 2016 than in 2015, as well as compression in average loan yields compared to prior year. However, net interest income grew by $10.7 million or 12% from prior year. The Company’s net interest income was positively impacted in both 2016 and 2015 by the recognition of fair value discount earned on early payoffs of acquired loans. In 2016, the Company recorded $2.2 million in discount earned on early payoffs of acquired loans and other associated payoff benefits aggregating to $920 thousand, with a positive impact on the net interest margin of 12 basis points. In 2015, the Company recorded $2.2 million in discount earned on early payoffs of acquired loans and other associated payoff benefits aggregating to $816 thousand, with a positive impact on the net interest margin of 14 basis points.
Year Ended December 31, 2015 Compared to Year Ended December 31, 2014
The net interest margin increased 4 basis points to 3.83% for the year ended December 31, 2015, compared to 3.79% for the year ended December 31, 2014. While the Company has continued to experience compression in the loan yields as new loans have been originated at lower interest rates than those loans that have been paid off in 2014 and 2015, growth in the average loans and a shift to more loans in the mix of interest earning assets, has helped support the slight increase in net interest margin. The Company’s net interest income was positively impacted in both 2015 and 2014 by the recognition of fair value discount earned on early payoffs of acquired loans. In 2015, the Company recorded $2.2 million in discount earned on early payoffs of acquired loans and other associated payoff benefits aggregating to $816 thousand, with a positive impact on the net interest margin of 14 basis points. In 2014 the Company recorded $1.8 million in discount earned on early loan payoffs of acquired loans and a $227 thousand recovery of interest income on an acquired loan that was on non-accrual status, with a positive impact on the net interest margin of 15 basis points.
Provision for Loan Losses
The Company maintains an Allowance to provide for probable losses inherent in the loan portfolio. Additions to the Allowance are made by charges to operating expense in the form of a provision for loan losses. Loan charge-offs are charged against the Allowance when management believes the collectability of the loan principal becomes remote. Subsequent recoveries, if any, are credited to the Allowance.
Provision for loan losses was $3.2 million, $5.1 million and $2.2 million for the year ended December 31, 2016, 2015 and 2014, respectively. The Company had $388 million, $349 million and $197 million of net organic loan growth for 2016, 2015 and 2014, respectively. The Company had net recoveries of $428 thousand in 2016, and net charge-offs of $2.0 million and $232 thousand in 2015 and 2014, respectively. See further discussion in Balance Sheet Analysis, Allowance for Loan Loss.
64
Table of Contents
Non-Interest Income
The following table lists the major components of the Company’s non-interest income (dollars in thousands):
| Years Ended December 31, |
Increase (Decrease) |
Years Ended December 31, |
Increase (Decrease) |
|||||||||||||||||||||||||||||
| 2016 | 2015 | $ | % | 2015 | 2014 | $ | % | |||||||||||||||||||||||||
| Gain (Loss) on sale of securities, net |
$ | 258 | $ | 112 | $ | 146 | 130.4 | % | $ | 112 | $ | (47 | ) | $ | 159 | 338.3 | % | |||||||||||||||
| Gain on sale of SBA loans, net |
1,359 | 1,797 | (438 | ) | (24.4 | )% | 1,797 | 1,221 | 576 | 47.2 | % | |||||||||||||||||||||
| Deposit account service charge income |
4,814 | 4,644 | 170 | 3.7 | % | 4,644 | 2,744 | 1,900 | 69.2 | % | ||||||||||||||||||||||
| Letters of credit income |
1,116 | 743 | 373 | 50.2 | % | 743 | 400 | 343 | 85.8 | % | ||||||||||||||||||||||
| Transaction referral income |
416 | 516 | (100 | ) | (19.4 | )% | 516 | 570 | (54 | ) | (9.5 | )% | ||||||||||||||||||||
| Interchange fees |
540 | 404 | 136 | 33.7 | % | 404 | 173 | 231 | 133.5 | % | ||||||||||||||||||||||
| Dividend income in equity securities |
1,164 | 1,324 | (160 | ) | (12.1 | )% | 1,324 | 446 | 878 | 196.9 | % | |||||||||||||||||||||
| BOLI Income |
1,303 | 1,295 | 8 | 0.6 | % | 1,295 | 660 | 635 | 96.2 | % | ||||||||||||||||||||||
| Other non-interest income |
1,042 | 895 | 147 | 16.4 | % | 895 | 1,542 | (647 | ) | (42.0 | )% | |||||||||||||||||||||
|
|
|
|
|
|
|
|
|
|
|
|
|
|
|
|
|
|||||||||||||||||
| Total Non-Interest Income |
$ | 12,012 | $ | 11,730 | $ | 282 | 2.4 | % | $ | 11,730 | $ | 7,709 | $ | 4,021 | 52.2 | % | ||||||||||||||||
|
|
|
|
|
|
|
|
|
|
|
|
|
|
|
|
|
|||||||||||||||||
Year Ended December 31, 2016 Compared to Year Ended December 31, 2015
Non-interest income increased modestly by $282 thousand or 2.4%. The decrease in the gain on sale of SBA loans was offset by a $170 thousand increase to deposit account service charge income and a $370 thousand increase of letters of credit income. The number of SBA loans the Company originated remained consistent over the last two years, although premiums have been down in second half of 2016, ranging from 106% to 115%, compared to 2015 premium range of 107% to 118%. Further, the decrease in gain on sale of SBA loans in the second half of 2016 is attributable to a decrease in SBA real estate lending, which had higher individual balances than SBA commercial and industrial lending. The increase in deposit account service charge income and letters of credit income are directionally consistent with the continued growth in the Company’s deposit and loan balances.
Year Ended December 31, 2015 Compared to Year Ended December 31, 2014
Non-interest income increased $4.0 million or 52% mainly due to a $576 thousand increase in gain on sale of SBA loans, a $1.9 million increase in deposit account service charge income, a $635 thousand increase in BOLI income and a $878 thousand increase in dividend income on equity securities. The increase in the gain on sale of SBA loan is driven by a higher volume of SBA loan sales in 2015 with a premium range of 107% to 118%. The increase in deposit account service charge income is almost entirely driven by the increase in DDA account analysis fees. The increase in dividend income is from the Federal Home Loan Bank of San Francisco due to a special dividend of $296 thousand received in the second quarter of 2015 and a consistent increase in the quarterly dividend rate throughout 2015.
65
Table of Contents
Non-Interest Expense
The following table lists the major components of the Company’s non-interest expense (dollars in thousands):
| Years Ended December 31, |
Increase (Decrease) |
Years Ended December 31, |
Increase (Decrease) |
|||||||||||||||||||||||||||||
| 2016 | 2015 | $ | % | 2015 | 2014 | $ | % | |||||||||||||||||||||||||
| Salaries and employee benefits |
$ | 37,285 | $ | 34,989 | $ | 2,296 | 6.6 | % | $ | 34,989 | $ | 24,820 | $ | 10,169 | 41.0 | % | ||||||||||||||||
| Stock based compensation expense |
3,567 | 2,966 | 601 | 20.3 | % | 2,966 | 1,699 | 1,267 | 74.6 | % | ||||||||||||||||||||||
| Occupancy |
6,039 | 5,792 | 247 | 4.3 | % | 5,792 | 4,112 | 1,680 | 40.9 | % | ||||||||||||||||||||||
| Data processing |
2,594 | 2,495 | 99 | 4.0 | % | 2,495 | 1,968 | 527 | 26.8 | % | ||||||||||||||||||||||
| Legal and professional |
3,782 | 2,411 | 1,371 | 56.9 | % | 2,411 | 2,006 | 405 | 20.2 | % | ||||||||||||||||||||||
| FDIC deposit assessment |
1,425 | 1,466 | (41 | ) | (2.8 | )% | 1,466 | 844 | 622 | 73.7 | % | |||||||||||||||||||||
| Merger expenses |
— | 498 | (498 | ) | (100.0 | )% | 498 | 2,302 | (1,804 | ) | (78.4 | )% | ||||||||||||||||||||
| OREO loss and expenses |
85 | 245 | (160 | ) | (65.3 | )% | 245 | 15 | 230 | 1,533.3 | % | |||||||||||||||||||||
| Office services expenses |
1,488 | 1,526 | (38 | ) | (2.5 | )% | 1,526 | 1,026 | 500 | 48.7 | % | |||||||||||||||||||||
| Core deposit intangible amortization |
1,280 | 1,680 | (400 | ) | (23.8 | )% | 1,680 | 391 | 1,289 | 329.7 | % | |||||||||||||||||||||
| Other operating expenses |
5,899 | 5,897 | 2 | — | % | 5,897 | 4,202 | 1,695 | 40.3 | % | ||||||||||||||||||||||
|
|
|
|
|
|
|
|
|
|
|
|
|
|
|
|
|
|||||||||||||||||
| Total non-interest expense |
$ | 63,444 | $ | 59,965 | $ | 3,479 | 5.8 | % | $ | 59,965 | $ | 43,385 | $ | 16,580 | 38.2 | % | ||||||||||||||||
|
|
|
|
|
|
|
|
|
|
|
|
|
|
|
|
|
|||||||||||||||||
Year Ended December 31, 2016 Compared to Year Ended December 31, 2015
Non-interest expense increased by $3.5 million, or 5.8% mainly due to a $2.3 million increase in salaries and employee benefits, a $601 thousand increase in stock based compensation, as the Company’s active full-time equivalent employees increased to 288 at December 31, 2016, compared to 266 at December 31, 2015. While the largest portion of this increase relates to BSA activities, other increases in full-time equivalent employees were made to support the high level of customer service CUB provides commensurate with its growth over the last two years. Additionally, the Company recorded $1.9 million in non-recurring expenses in 2016 related to the BSA Consent Order and the closing of an office. The Company originally estimated $2.0 million for one-time BSA costs; actual incurred in 2016 was $1.7 million. Some small amount of one-time costs is expected in the first quarter of 2017, but at this time the total is not expected to exceed the original estimate.
The following table shows the Company’s various non-recurring, non-interest expense of $1.7 million related to the BSA Consent Order, and $203 thousand in occupancy expense related to the closure of the Simi Valley administrative office in 2016 (dollars in thousands):
| Year Ended December 31, 2016 |
||||
| Nonrecurring Costs Associated with BSA and Office Closure |
||||
| Non-Interest Expense |
||||
| Salaries and employee benefits |
$ | 136 | ||
| Occupancy |
276 | |||
| Legal and professional |
1,210 | |||
| Other operating expenses |
304 | |||
|
|
|
|||
| Total Non-Interest Expense |
$ | 1,926 | ||
|
|
|
|||
66
Table of Contents
Further, the increases in the above expense categories related to nonrecurring costs are offset by a decrease in merger expenses and core deposit intangible amortization in the amounts of $498 thousand and $400 thousand, respectively.
Year Ended December 31, 2015 Compared to Year Ended December 31, 2014
Non-interest expense increased by $17 million, or 38.2% mainly due to a $10 million increase in salaries and employee benefits, a $1.3 million increase in stock based compensation expense, a $1.7 million increase in occupancy expenses, a $1.3 million increase in core deposit intangible amortization, and a $1.7 million increase in other operating expenses, offset by a decrease in merger expenses of $1.8 million. The increase in salaries and employee benefits was attributable to increase in salaries of $7.8 million and increase in bonus expense in the amount of $1.2 million. The number of active full time employees increased from 250 at December 31, 2014 to 266 at December 31, 2015. The increase in stock compensation expense in 2015 is due to approximately two-thirds of the total grants in 2014 were granted after 1st Enterprise merger, thus a full year of expense for these grants in 2015 compared to only a month or less of expense in 2014. Additionally, the fair value of the restricted stock grant increased in 2015 due to an increase in the Company’s stock price, from an average price of $19.73 in 2014 compared to $25.02 in 2015. Overall increase to total non-interest expense is primarily due to the acquisition of 1st Enterprise in the fourth quarter of 2014.
Income Taxes
The Company’s effective tax rate was 36.7%, 37.7% and 41.9% for the years ended December 31, 2016, 2015 and 2014, respectively. The effective tax rate is impacted by BOLI income, interest income from tax exempt securities and loans, investments in Qualified Affordable Housing Projects “LIHTC” that generate tax credits and benefits for the Company, and beginning in 2016, excess tax benefits from the exercise or vesting of share-based awards. In the third quarter of 2016, the Company elected the early adoption of ASU 2016-09, retroactively effective as of January 1, 2016. As a result of the application of this standard, excess tax benefits from exercise or vesting of share-based awards are now included as a reduction in provision for income tax expense in the period in which the exercise or vesting occurs. The variance between 2016 and 2015 is primarily related to the early adoption of ASU 2016-09. For the full year of 2016, the effective tax rate was 36.7% which benefitted from the exercising of 505,274 options during 2016, with a discrete tax benefit of $1.4 million; without the excess tax benefit, the effective tax rate would have been 40.1%. The actual tax rate may be volatile, dependent upon the volume of stock events and differential in stock price between grant and event. The higher effective tax rate in 2014 is primarily related to non-deductible merger cost as a result of the acquisition of 1st Enterprise. The Company operates in the Federal and California jurisdictions and the blended statutory tax rate for Federal and California income taxes is 42.05%.
FINANCIAL CONDITION
Balance Sheet Analysis
Total assets increased $360 million from $2.6 billion at December 31, 2015 to $3.0 billion at December 31, 2016 with an increase of $154 million in total investment securities and an increase of $217 million in loans, mainly driven by a $321 million increase in total deposits during the period. The increase in loans from the prior year was due to strong organic loan growth. Net organic loan growth during the period was $388 million, partially offset by $171 million in pay downs and pay offs in the acquired loan portfolios. Loan growth during the period was concentrated primarily in Owner-Occupied Nonresidential Property loans of $43 million, Other Nonresidential Property loans of $97 million, Construction Land Development and Other Land loans of $68 million and Multifamily Residential Property loans of $39 million. The increase in investment securities during 2016 was due to purchases made in the third and fourth quarter of 2016 in conjunction with the increase in yields seen in the later part of the year.
67
Table of Contents
Funding the asset growth for the Company in 2016 was the growth in deposits of $321 million and earnings of $26 million. Further, the deposit growth of $321 million is the result of a $112 million increase in non-interest bearing demand deposits, a $72 million increase in interest bearing transaction accounts and a $166 million increase in money market and savings deposits, offset by a decrease of $29 million in certificates of deposit. Non-interest bearing deposits represented 54%, and 56% of total deposits at December 31, 2016 and 2015, respectively.
Investment Securities
In order to maintain the Company’s goal of maintaining a high degree of both on-balance sheet and off-balance sheet liquidity, the Company maintains a portion of its investment securities in both readily saleable securities and/or securities that can be pledged as collateral for one or a combination of the Company’s credit facilities. The Company invests in U.S. Treasury Notes, U.S. Agency and U.S. Sponsored Agency issued AAA and AA rated investment-grade callable and non-callable bonds, mortgage-backed pass through securities, asset backed securities and collateralized mortgage obligation “CMO” securities and investment grade municipal securities.
The Company also maintains investable funds with other financial institutions in the form of overnight interest bearing money market accounts and short term maturity certificates of deposit with insured financial institutions. Throughout both 2016 and 2015, the Company has maintained a significant portion of its overnight liquidity directly with the Federal Reserve Bank. At December 31, 2016, the Company had $90 million on deposit with the Federal Reserve.
Securities owned by the Company may also be pledged in connection with the Company’s securities sold under agreements to repurchase program that is offered to the Company’s business deposit customers in which a minimum of 102% of the borrowings are collateralized by the fair market value of the investment securities. As of December 31, 2016 and 2015, the carrying value of securities pledged in connection with securities sold under agreements to repurchase was $48 million and $47 million, respectively. Securities with a market value of $17 million and $12 million were pledged to secure a certificate of deposit of $10 million with the State of California Treasurer’s office throughout 2016 and 2015. Securities with a market value of $78 million and $81 million were pledged to secure outstanding standby letters of credit confirmed/issued by a correspondent bank for the benefit of our customers in the amounts of $42 million and $45 million at December 31, 2016 and December 31, 2015, respectively. Securities with a market value of $716 thousand and $893 thousand were pledged to secure local agency deposits at December 31, 2016 and 2015, respectively. Securities with a market value of $26 million and $19 million were pledged to secure our Federal Reserve credit facility at December 31, 2016 and 2015, respectively. Securities with a market value of $16 million and $19 million were pledged in connection with its credit facility with the Federal Home Loan Bank “FHLB” at December 31, 2016 and 2015, respectively. Securities with a market value of $16 million were pledged in connection with bankruptcy accounts at December 31, 2016 and 2015. Securities with a market value of $2 million were pledged in connection with interest rate swaps acquired from the 1st Enterprise merger at December 31, 2016 and 2015.
68
Table of Contents
As of December 31, 2016 and 2015, the Company’s investment securities portfolio consisted of the following, by issuer (dollars in thousands):
Securities Portfolio at Fair Value, by Issuer
| December 31, 2016 |
December 31, 2015 |
|||||||
| Small Business Administration “SBA” |
$ | 122,850 | $ | 93,491 | ||||
| U.S. Treasury |
68,965 | 80,745 | ||||||
| Government National Mortgage Association “GNMA” |
46,270 | 58,765 | ||||||
| Corporate Bonds — Various Companies |
— | 4,023 | ||||||
| Federal National Mortgage Association “FNMA” |
132,282 | 57,759 | ||||||
| Municipals — Various State and Political Subdivisions |
41,602 | 43,001 | ||||||
| Federal Home Loan Bank “FHLB” |
5,982 | 1,014 | ||||||
| Federal Home Loan Mortgage Corporation “FHLMC” |
87,040 | 11,331 | ||||||
| Federal Deposit Insurance Corporation “FDIC” |
— | 348 | ||||||
| Sallie Mae “SLMA” |
6,896 | 7,647 | ||||||
|
|
|
|
|
|||||
| Total |
$ | 511,887 | $ | 358,124 | ||||
|
|
|
|
|
|||||
The Municipal Bonds in the above table were issued by one hundred and fourteen separate municipalities.
The securities issued by the U.S. Treasury of $69 million, SBA of $123 million and GNMA of $46 million, are fully guaranteed as to the timely payment of both principal and interest by the United States Government.
Composition of Securities Available-for-Sale and Held-to-Maturity, at Fair Value
| At December 31, | ||||||||||||||||||||||||
| (Dollars in thousands) | 2016 | 2015 | 2014 | |||||||||||||||||||||
| Available-for-Sale | Amount | Percent | Amount | Percent | Amount | Percent | ||||||||||||||||||
| U.S. Govt Agency and Sponsored Agency — Note Securities |
$ | 9,969 | 1.9 | % | $ | 1,014 | 0.3 | % | $ | 2,038 | 0.7 | % | ||||||||||||
| U.S. Treasury Note |
68,965 | 13.5 | % | 80,746 | 22.6 | % | 20,025 | 7.3 | % | |||||||||||||||
| U.S. Govt Agency — SBA Securities |
122,850 | 24.0 | % | 93,490 | 26.1 | % | 54,487 | 19.9 | % | |||||||||||||||
| U.S. Govt Agency — GNMA Mortgage-Backed Securities |
22,370 | 4.4 | % | 30,700 | 8.6 | % | 29,342 | 10.7 | % | |||||||||||||||
| U.S. Govt Sponsored Agency — CMO & Mortgage-Backed Securities |
238,900 | 46.7 | % | 97,154 | 27.1 | % | 107,228 | 39.12 | % | |||||||||||||||
| Corporate Securities |
— | — | % | 4,023 | 1.1 | % | 4,120 | 1.5 | % | |||||||||||||||
| Municipal Securities |
— | — | % | 1,011 | 0.3 | % | 1,050 | 0.4 | % | |||||||||||||||
| Asset Backed Securities |
6,896 | 1.3 | % | 7,647 | 2.1 | % | 8,672 | 3.2 | % | |||||||||||||||
| Held-to- Maturity |
||||||||||||||||||||||||
| Municipal Securities |
41,937 | 8.2 | % | 42,339 | 11.8 | % | 47,159 | 17.2 | % | |||||||||||||||
|
|
|
|
|
|
|
|
|
|
|
|
|
|||||||||||||
| Total |
$ | 511,887 | 100 | % | $ | 358,124 | 100.0 | % | $ | 274,121 | 100.0 | % | ||||||||||||
|
|
|
|
|
|
|
|
|
|
|
|
|
|||||||||||||
The amortized cost, estimated fair value and average yield of debt securities at December 31, 2016, are reflected in the table below. Maturity categories are determined as follows:
| • | U.S. Govt. Agency, U.S. Treasury Notes and U.S. Govt. Sponsored Agency — bonds and notes — maturity date |
69
Table of Contents
| • | U.S. Gov. Sponsored Agency CMO or Mortgage-Backed Securities, U.S. Govt. Agency GNMA Mortgage-Backed Securities, Asset Backed Securities and U.S. Govt. Agency SBA Securities, — estimated cash flow taking into account estimated pre-payment speeds |
| • | Investment grade Municipal securities — the earlier of the maturity date or the expected call date. |
Although U.S. Government Agency, U.S. Government Sponsored Agency mortgage-backed and CMO securities have contractual maturities through 2048, the expected maturity will differ from the contractual maturities because borrowers or issuers may have the right to prepay such obligations without penalties.
| (Dollars in thousands) | Maturing | |||||||||||||||||||||||||||||||||||||||||||
| Available-for-Sale | One year or less |
Weighted Average Yield |
After one year thru five years |
Weighted Average Yield |
After five years thru ten years |
Weighted Average Yield |
After ten years |
Weighted Average Yield |
Balance as
of December 31, 2016 |
Weighted Average Yield |
% to total |
|||||||||||||||||||||||||||||||||
| U.S. Government Agency Securities |
$ | — | — | % | $ | 9,969 | 1.00 | % | $ | — | — | % | $ | — | — | % | $ | 9,969 | 1.00 | % | 1.95 | |||||||||||||||||||||||
| U.S. Government SBA Securities |
18,320 | 1.27 | % | 45,623 | 1.64 | % | 45,238 | 2.03 | % | 13,669 | 2.07 | % | 122,850 | 1.78 | % | 24.00 | ||||||||||||||||||||||||||||
| U.S. Government GNMA Mortgage-Backed Securities |
6,088 | 0.94 | % | 10,199 | 1.23 | % | 3,374 | 1.64 | % | 2,709 | 2.88 | % | 22,370 | 1.41 | % | 4.37 | ||||||||||||||||||||||||||||
| U.S. Government Agency CMO & Mortgage-Backed Securities |
46,991 | 1.54 | % | 108,949 | 1.67 | % | 62,804 | 1.86 | % | 20,156 | 2.22 | % | 238,900 | 1.74 | % | 46.67 | ||||||||||||||||||||||||||||
| U.S. Treasury Note |
53,975 | 0.76 | % | 14,990 | 0.73 | % | — | — | % | — | — | 68,965 | 0.75 | % | 13.47 | |||||||||||||||||||||||||||||
| Asset Backed Securities |
— | — | % | 2,185 | 1.13 | % | 4,711 | 1.25 | % | — | — | 6,896 | 1.21 | % | 1.35 | |||||||||||||||||||||||||||||
| Held-to-Maturity | ||||||||||||||||||||||||||||||||||||||||||||
| Municipal Securities (1) |
3,711 | 1.42 | % | 35,254 | 1.63 | % | 2,972 | 2.71 | % | — | — | 41,937 | 1.69 | % | 8.19 | |||||||||||||||||||||||||||||
|
|
|
|
|
|
|
|
|
|
|
|
|
|||||||||||||||||||||||||||||||||
| Total |
$ | 129,085 | 1.14 | % | $ | 227,169 | 1.54 | % | $ | 119,099 | 1.91 | % | $ | 36,534 | 2.21 | % | $ | 511,887 | 1.57 | % | 100 | % | ||||||||||||||||||||||
|
|
|
|
|
|
|
|
|
|
|
|
|
|||||||||||||||||||||||||||||||||
| (1) | On a fully tax equivalent basis: One year or less, 2.26%; After one year thru five years, 2.60%; After five years thru ten years, 4.33%; After ten years, 0%; total municipal securities, 2.70%. |
Lending
The following table presents the composition of the loan portfolio at the dates indicated (dollars in thousands):
| December 31, | ||||||||||||||||||||
| 2016 | 2015 | 2014 | 2013 | 2012 | ||||||||||||||||
| Commercial and Industrial Loans: |
$ | 502,637 | $ | 537,368 | $ | 528,517 | $ | 299,473 | $ | 262,637 | ||||||||||
| Loans Secured by Real Estate: |
||||||||||||||||||||
| Owner-Occupied Nonresidential Properties |
451,322 | 407,979 | 339,309 | 197,605 | 181,844 | |||||||||||||||
| Other Nonresidential Properties |
630,163 | 533,168 | 481,517 | 271,818 | 246,450 | |||||||||||||||
| Construction, land development and other land |
194,059 | 125,832 | 72,223 | 47,074 | 48,528 | |||||||||||||||
| 1-4 Family Residential Properties |
127,164 | 114,525 | 121,985 | 65,711 | 62,037 | |||||||||||||||
| Multifamily Residential Properties |
109,858 | 71,179 | 52,813 | 33,780 | 31,610 | |||||||||||||||
|
|
|
|
|
|
|
|
|
|
|
|||||||||||
| Total Loans Secured by Real Estate |
1,512,566 | 1,252,683 | 1,067,847 | 615,988 | 570,469 | |||||||||||||||
|
|
|
|
|
|
|
|
|
|
|
|||||||||||
| Other Loans: |
35,023 | 43,112 | 28,359 | 17,733 | 21,779 | |||||||||||||||
|
|
|
|
|
|
|
|
|
|
|
|||||||||||
| Total Loans |
$ | 2,050,226 | $ | 1,833,163 | $ | 1,624,723 | $ | 933,194 | $ | 854,885 | ||||||||||
|
|
|
|
|
|
|
|
|
|
|
|||||||||||
70
Table of Contents
The following table is a breakout of the Company’s gross loans stratified by the industry concentration of the borrower by their respective NAICS code at the dates indicated (dollars in thousands):
| December 31, 2016 |
December 31, 2015 |
|||||||||||||||
| Amount | % of Total | Amount | % of Total | |||||||||||||
| Real Estate |
$ | 1,096,377 | 53 | % | $ | 857,021 | 47 | % | ||||||||
| Manufacturing |
180,217 | 9 | % | 174,773 | 10 | % | ||||||||||
| Construction |
140,270 | 7 | % | 161,618 | 9 | % | ||||||||||
| Hotel/Lodging |
120,760 | 6 | % | 105,741 | 6 | % | ||||||||||
| Wholesale |
117,444 | 6 | % | 134,093 | 7 | % | ||||||||||
| Finance |
83,061 | 4 | % | 87,734 | 5 | % | ||||||||||
| Professional Services |
58,766 | 3 | % | 60,952 | 3 | % | ||||||||||
| Other Services |
50,425 | 2 | % | 45,002 | 3 | % | ||||||||||
| Healthcare |
46,184 | 2 | % | 47,293 | 3 | % | ||||||||||
| Information |
32,014 | 2 | % | 20,171 | 1 | % | ||||||||||
| Retail |
28,938 | 1 | % | 38,928 | 2 | % | ||||||||||
| Restaurant/Food Service |
24,118 | 1 | % | 26,226 | 1 | % | ||||||||||
| Transportation |
19,857 | 1 | % | 22,237 | 1 | % | ||||||||||
| Administrative Services |
17,090 | 1 | % | 23,736 | 1 | % | ||||||||||
| Entertainment |
13,569 | 1 | % | 6,188 | 0 | % | ||||||||||
| Education |
10,370 | 1 | % | 9,244 | 1 | % | ||||||||||
| Management |
6,455 | — | % | 8,137 | — | % | ||||||||||
| Other |
4,311 | — | % | 4,069 | — | % | ||||||||||
|
|
|
|
|
|
|
|
|
|||||||||
| Total Loans |
$ | 2,050,226 | 100 | % | $ | 1,833,163 | 100 | % | ||||||||
|
|
|
|
|
|
|
|
|
|||||||||
The Company’s loan origination and lending activities continue to be focused primarily on direct contact with its borrowers through the Company’s relationship managers and/or executive officers. Total loans were $2.1 billion at December 31, 2016, an increase of $217 million or 12% from $1.8 billion at December 31, 2015. The Company had approximately $388 million of net organic loan growth which was partially offset by approximately $171 million in loan pay downs and pay offs from the acquired loan portfolios. The increase in total loans from the end of the prior year included a $43 million increase in the owner-occupied nonresidential properties portfolio, a $97 million increase in the other nonresidential real estate properties portfolio, a $68 million increase in the construction, land development and other land properties portfolio, a $13 million increase in the 1-4 family residential properties portfolio, and a $39 million increase in the multifamily residential properties portfolio, offset by a $35 million decrease in the commercial and industrial loan portfolio and an $8 million decrease in the other loans portfolio.
The Company’s loan customers are primarily based in the Southern California area with geographical distribution primarily in Los Angeles County, Orange County, Ventura County, Riverside County and San Bernardino County.
At least on a quarterly basis, management reviews a report of loan relationships with balances over $6.5 million which constitute 40% and 30% of the Company’s total loan portfolio as of December 31, 2016 and 2015, respectively. At December 31, 2016, there were five loan relationships with balances over $20 million, twenty-six loan relationships of more than $10 million and less than $20 million and forty-two loan relationships of more than $6.5 million and less than $10 million. Of the five largest loan relationships, four were real estate lending relationships and one was a commercial and industrial lending relationship. The largest lending relationship is $37 million in outstanding loans comprised of four notes, three of which are secured by commercial real estate within our branch footprint and have a guarantor as well. The relationship also maintains deposit operating accounts with the Bank. Compared to December 31, 2015, there were four loan relationships
71
Table of Contents
with balances over $20 million, eighteen loan relationships of more than $10 million and less than $20 million and twenty-seven loan relationships of more than $6.5 million and less than $10 million. Of the four largest loan relationships, three were real estate lending relationships and one was a commercial and industrial lending relationship. The growth in the relationships over $6.5 million and less than $10 million was primarily from existing customers whose businesses expanded in the year. The growth in relationships over $10 million and less than $20 million was from new customer relationships. Overall, the majority of new customer relationships by count in 2016 was commercial and industrial oriented. As of December 31, 2016 and 2015, the average outstanding loan principal balance was $967 thousand compared to $869 thousand.
The Company had 57 commercial banking relationship managers and 9 commercial real estate relationship managers at December 31, 2016, compared to 53 commercial banking relationship managers and 9 commercial real estate relationship managers at December 31, 2015. The loan portfolio is spread throughout the 9 branches and the Orange County LPO. No one office has more than 16% of the loan portfolio.
The Company provides commercial loans, including working capital and equipment financing, real estate loans, including residential and construction and consumer loans, generally to business principals, entrepreneurs and professionals. The Company currently does not offer residential mortgages to consumers other than home equity lines of credit. The Company’s lending has been originated primarily through direct contact with the borrowers by the Company’s relationship managers and/or executive officers. The Company’s credit approval process includes an examination of the collateral, cash flow and debt service coverage of the loan, as well as the financial condition and credit references of the borrower and guarantors, where applicable. The Company’s senior management is actively involved in its lending activities, collateral valuation and review process. The Company obtains independent third party appraisals of loans secured by real property as required by applicable federal law and regulations and a separate third party reviews those appraisals. There is also a loan committee comprised of senior management and outside directors that monitors the loan portfolio on at least a quarterly basis.
Management believes that it manages credit risk closely in its loan portfolio and uses a variety of policy and procedure guidelines and analytical tools to achieve its asset quality objectives.
The Company’s real estate construction loans are primarily short-term loans made to finance the construction of 1-4 single family and multifamily residential property. We make loans to finance the construction of single family residences to established developers and owner-occupiers that make up about 25% of the construction loan portfolio. Our construction lending is to relationships we know, doing projects the builder/developer has experience with, and the majority are with recourse and are rarely speculative in nature. In 2016, due to the improving state of the southern California economy and increased demand for new in-fill development projects, there existed enhanced opportunities for the Company to make good quality construction loans. The Company’s portfolio consisted predominantly of multifamily residential construction projects in Los Angeles County undertaken by customers that have long-term relationships with the Company. Construction quality and exposure is consistently monitored via quarterly reporting and the entire portfolio is Pass rated as of December 31, 2016. The construction, land development and other land loan portfolio remains a small percentage of the Company’s entire loan portfolio and the pace of 2016 growth is not expected to accelerate in 2017, except for growth driven by completion of construction projects underway. As of December 31, 2016, the construction portfolio was 9% of total loans with a composition of 79% for construction and 21% for land development. This compares to the construction loan portfolio at December 31, 2015 which was 7% of total loans, with a composition of 78% for construction and 22% for land development.
Our other real estate loans consist primarily of loans made based on the borrower’s cash flow, secured by deeds of trust on commercial and residential property to provide an additional source of repayment in the event of default. Maturities on these loans are generally up to ten years (on an amortization ranging from fifteen to twenty-five years with a balloon payment due at maturity). The interest rates on these commercial real estate loans are either fixed or floating, with many of the loans that have maturities greater than five years having
72
Table of Contents
re-pricing provisions that adjust the interest rate to market rates at stated times prior to maturity. As of December 31, 2016 and 2015, owner-occupied nonresidential properties and other nonresidential properties are composed of 18% office buildings, 53% commercial buildings, 12% retail centers, 16% hotel/resorts/other, and 1% leaseholds.
Our commercial and industrial loans are made for the purpose of providing working capital, financing for the purchase of equipment or for other business purposes. Such loans include loans with typical maturities of one year and “term loans” which are loans with maturities normally ranging from one to five years. In 2016, the Company experienced an overall decrease from 2015 in commercial and industrial loans outstanding; from $537 million at December 31, 2015, to $496 million at March 31, 2016, to $522 million at June 30, 2016, to $499 million at September 30, 2016 to $503 million at December 31, 2016. The Company’s commercial and industrial line of credit utilization was approximately 40% and 46% as of December 31, 2016 and 2015, respectively. Utilization of commercial and industrial lines of credit decreased from 46% to 40%, of which 2% was due to the increase in commitments and 4% was due to pay downs, reflecting the strong balance sheets of our borrowers. While commercial and industrial lending remains our business banking focus, loan growth came primarily through growth in our portfolio of loans secured by real estate, encompassing most types of this borrowing category. These are generally loans that have strong guarantors and moderate levels of loan to value. Furthermore, we have historically experienced a low level of charge-offs from real estate secured loans. Based on the industry concentration of the Company’s borrowers, the manufacturing sector continues to be the second largest of the overall loan portfolio, representing 9% and 10% of the total loan portfolio at December 31, 2016 and 2015, respectively. Despite the fact that Los Angeles remains as the largest manufacturing centers in the U.S., the overall industry headcount is shrinking in recent years partly due to increasing automation, but offshoring and improving productivity are also factors. Generally, the Bank has strong credit quality commercial and industrial customers who are not using leverage to expand, but are liquid, providing non-interest bearing deposit accounts.
Small Business Administration “SBA” loans are loans originated under the guidelines of the U. S. Small Business Administration lending programs. SBA-guaranteed loans may not be made to a small business if the borrower has access to other financing on reasonable terms. These loans are made to finance a small business and its need for working capital, accounts receivable financing, the purchase of equipment and inventory, or for the purchase of owner-occupied commercial real estate. The Company has a preferred lender status from the SBA to originate SBA loans.
For SBA guaranteed loans, a secondary market exists to purchase the guaranteed portion of these loans with the Company continuing to service the entire loan. The secondary market for guaranteed loans is comprised of investors seeking long term assets with yields that adapt to the prevailing interest rates. These investors are typically financial institutions, insurance companies, pension funds, and other investors that purchase this product. When a decision to sell the guaranteed portion of an SBA loan is made by the Company, bids are solicited from secondary market investors and the loan is normally sold to the highest bidder.
Other loans are primarily loans to non-depository financial institutions but also include personal loans that are generally made for the purpose of financing investments, various types of consumer goods and other personal purposes.
Outstanding unused loan commitments consist primarily of commercial, business credit cards, construction and home equity lines of credit which have not been fully disbursed, as well as some standby letters of credit which generally support lease or other direct obligations. Based upon our experience, the outstanding unused loan commitments are expected to decrease in line with increases in loan demand, subject to economic conditions. During 2016, the Company’s percentage of unused commercial loan commitments to total commercial loan commitments has increased from 54% at December 31, 2015 to 60% at December 31, 2016, reflecting the strength of the borrowers’ balance sheets. The Company had $918 million in outstanding unused loan commitments, and $85 million in outstanding standby letters of credit, with total off-balance sheet
73
Table of Contents
commitments totaling $1 billion at December 31, 2016. Comparatively, the Company had $722 million in outstanding unused loan commitments, and $84 million in outstanding standby and performance letters of credit, with total off-balance sheet commitments totaling $806 million at December 31, 2015. The year over year increase is consistent with the continuous growth of the Company’s loan portfolio and customer relationships as well as the decrease in commercial and industrial line utilization.
The Company does not have any concentrations in the loan portfolio except for the level of loans that are secured by real estate as presented in the tables above. Although the Bank’s real estate concentration at December 31, 2016 exceeds 300% of total risk based capital, the Company has maintained its relationship based approach to lending which has resulted in nominal charge-off experience in the real estate portfolio since the Company’s inception.
The following table sets forth the maturity distribution of the Company’s outstanding loans at December 31, 2016. In addition, the table shows the distribution of loans with current predetermined interest rates (loans that are either fixed rate or loans that are either at or below their floor rate) and those with variable (floating) interest rates. To price its variable rate loans, the Company currently utilizes the Wall Street Journal Prime Rate (51%), the U.S. Treasury Rate (35%), LIBOR (12%) and the remaining other indexes (1%). As of December 31, 2016, we had 16 loans with a recorded investment balance of $19 million with remaining maturities greater than twenty years. As of December 31, 2015, we had 89 loans with a recorded investment balance of $50 million with remaining maturities greater than twenty years.
| (Dollars in thousands) | Maturing | |||||||||||||||
| Within One Year | One to Five Years | After Five Years | Total | |||||||||||||
| As of December 31, 2016 |
||||||||||||||||
| Commercial and Industrial |
$ | 294,438 | $ | 173,841 | $ | 34,358 | $ | 502,637 | ||||||||
| Owner-Occupied Nonresidential Properties |
27,458 | 82,503 | 341,361 | 451,322 | ||||||||||||
| Other Nonresidential Properties |
18,877 | 126,893 | 484,393 | 630,163 | ||||||||||||
| Construction, Land Development and Other Land |
103,384 | 81,885 | 8,790 | 194,059 | ||||||||||||
| 1-4 Family Residential Properties |
28,168 | 30,815 | 68,181 | 127,164 | ||||||||||||
| Multifamily Residential Properties |
23,150 | 38,716 | 47,992 | 109,858 | ||||||||||||
| Other |
12,824 | 17,282 | 4,917 | 35,023 | ||||||||||||
|
|
|
|
|
|
|
|
|
|||||||||
| Total |
$ | 508,299 | $ | 551,935 | $ | 989,992 | $ | 2,050,226 | ||||||||
|
|
|
|
|
|
|
|
|
|||||||||
| Loans with pre-determined interest rates (1) |
$ | 91,943 | $ | 241,723 | $ | 202,797 | $ | 536,463 | ||||||||
| Loans with floating or adjustable interest rates |
416,356 | 310,212 | 787,195 | 1,513,763 | ||||||||||||
|
|
|
|
|
|
|
|
|
|||||||||
| Total Loans |
$ | 508,299 | $ | 551,935 | $ | 989,992 | $ | 2,050,226 | ||||||||
|
|
|
|
|
|
|
|
|
|||||||||
| (1) | Includes approximately $501 million of variable rate loans that are either at or below their floor. |
Impaired Loans, Non-Accrual Loans. At December 31, 2016, the Company had 12 loans on non-accrual totaling $1.1 million, or 0.05% of total loans. At December 31, 2015, the Company had 15 loans on non-accrual totaling $2.1 million, or 0.11% of total loans. Approximately 60% of the non-accrual loans balance is made up of 10 commercial and industrial loans totaling $675 thousand at December 31, 2016, compared to 50% consisting of 11 commercial and industrial loans totaling $1.0 million at December 31, 2015. The reduction in the non-accrual loans balance from 2015 is due to payoffs and charge-offs. At December 31, 2016 and 2015, all loans classified as impaired are on non-accrual status and all troubled debt restructured loans are impaired and on non-accrual status. Of the non-accrual loans, none individually exceeds $300 thousand. There were no non-performing assets or loans greater than 90 days past due and accruing interest as of December 31, 2016 or 2015.
74
Table of Contents
The following is a summary of our asset quality data and key ratios at the dates indicated (dollars in thousands):
| December 31, 2016 |
December 31, 2015 |
|||||||
| Loans originated by the Bank on non-accrual |
$ | — | $ | 89 | ||||
| Loans acquired through acquisition that are on non-accrual |
1,122 | 1,962 | ||||||
|
|
|
|
|
|||||
| Total non-accrual loans |
1,122 | 2,051 | ||||||
| Other Real Estate Owned |
— | 325 | ||||||
|
|
|
|
|
|||||
| Total non-performing assets |
$ | 1,122 | $ | 2,376 | ||||
|
|
|
|
|
|||||
| Net recoveries (charge-offs) year to date |
$ | 428 | $ | (2,009 | ) | |||
| Non-accrual loans to total loans |
0.05 | % | 0.11 | % | ||||
| Total non-performing assets to total assets |
0.04 | % | 0.09 | % | ||||
| Allowance for loan loss to total loans |
0.94 | % | 0.86 | % | ||||
| Allowance for loan loss to total loans accounted at historical cost, which excludes loans acquired by acquisition |
1.18 | % | 1.25 | % | ||||
| Net year to date recoveries (charge-offs) to average year to date loans |
0.02 | % | (0.12 | )% | ||||
| Allowance for loan loss to non-accrual loans accounted at historical cost, which excludes non-accrual loans acquired by acquisition and related allowance |
NA | 17583 | % | |||||
| Allowance for loan loss to total non-accrual loans |
1726 | % | 764 | % | ||||
The risk that borrowers will fail, or will be unable to repay their loans, is an inherent part of the banking business. The Company has established guidelines and practices to specifically identify loans that may become past due in the future, either as to interest and/or principal, for more than 90 days. Such loans are given special attention by our credit officers and additional efforts are made to get the borrowers to bring their loans current or to provide additional collateral to reduce the risk of potential losses on these loans. In addition, the Company may in the future renegotiate the payment terms of loans to permit the borrower to defer interest or principal payments in those instances where it appears that the borrower may be encountering temporary or short-term financial difficulties, and we believe that the future deferral would reduce the likelihood of an eventual loss on the loan. When we have reason to believe that continued payment of interest and principal on any loan is unlikely, the loan is placed on a non-accrual status. When a loan is placed on non-accrual status, accrual of interest on the loan is discontinued and any previously accrued but unpaid interest on the loan is reversed and, therefore, the loan ceases to be an earning asset for the Company. The Company has established practices and guidelines to increase its efforts to recover all amounts due that may become delinquent in the future, which may include the initiation of foreclosure proceedings against the collateral securing the loan.
The Company will consider any loan to be impaired when, based upon current information and events, it is probable that interest and principal will not be collected according to the contractual terms of the original loan agreement. In determining impairment, we evaluate, both performing and non-performing loans, which exhibit, among other characteristics, high loan-to-value ratios, low debt-coverage ratios, delinquent loan payments or other indications that the borrowers are experiencing increased financial difficulties. In general, payment delays of less than 90 days or payment shortfalls of less than 1% are deemed insignificant and, for that reason, would not necessarily result in the classification of such loans as impaired. The Company generally considers all non-accrual and troubled debt restructured loans to be impaired. At December 31, 2016 and 2015, all classified loans within the loan portfolio were evaluated for possible impairment, of which 7 loans for a total of $623 thousand (excludes purchased credit impaired loans of $1.7 million) were considered to be impaired at
75
Table of Contents
December 31, 2016 and 7 loans for a total of $1.2 million (excludes purchased credit impaired loans of $2.0 million) were considered to be impaired at December 31, 2015.
All loans that become identified as impaired are generally placed on a non-accrual status and are evaluated at that time and regularly thereafter to determine whether the carrying value of the loan should be written off or reserved for or partially written-down to its recoverable value (net realizable value), or whether the terms of the loan, including the collateral required to secure the loan, should be renegotiated with the borrower. Impaired loans will be charged-off or partially charged-off when the possibility of collecting the full balance of the loan becomes remote. Information regarding the Company’s allowance for loan loss is set forth below in this section of this report under the caption, “Allowance for Loan Loss.”
In addition, the Company has loans classified as substandard of $59 million and $40 million at December 31, 2016 and 2015, respectively. This balance includes impaired loans of $623 thousand and purchased credit impaired loans of $500 thousand at December 31, 2016, compared to impaired loans of $1.2 million and purchased credit impaired loans of $847 thousand at December 31, 2015. The largest substandard relationship are acquired loans ($9 million) primarily secured by the business assets of the Company in the restaurant industry. The other large substandard loans are manufacturers. These potential problem loans are loans that have a well-defined weakness based on objective evidence. For these potential problem loans, there is a possibility that the Company could incur some loss if the weakness is not properly corrected. At December 31, 2016 and 2015, management expects full repayment of principal and interest on all loans that are on accrual status.
Allowance for Loan Loss
The Company maintains an Allowance to provide for probable losses in the loan portfolio. Additions to the Allowance are made by charges to operating expense in the form of a provision for loan losses. Loan charge-offs are charged against the Allowance when management believes the collectability of the loan principal becomes remote. Subsequent recoveries, if any, are credited to the Allowance.
The Allowance is an amount that management believes is adequate to absorb estimated charge-offs related to specifically identified loans, as well as probable loan charge-offs inherent in the balance of the loan portfolio, based on an evaluation of the collectability of existing loans and prior charge-off experience and other external data.
The Allowance consists of specific and general components. The specific component relates to loans that are identified as impaired. The general component covers non-impaired loans and is based on the historical charge-off experience in various loan segments adjusted for qualitative factors.
A loan is identified as impaired when it is probable that interest and principal will not be collected according to the contractual terms of the original loan agreement. Generally these loans are rated substandard or worse. Most impaired loans are classified as nonaccrual. However, there are some loans that are termed impaired due to doubt regarding collectability according to contractual terms, but are both fully secured by collateral and are current in their interest and principal payments. Impaired loans are measured for reserve requirements based on the present value of expected future cash flows discounted at the loan’s effective interest rate, or at the loan’s observable market price, or the fair value of the collateral if the loan is collateral dependent. The amount of an impairment reserve, if any, and any subsequent increase in impairment is charged against the Allowance. Factors that contribute to a performing loan being classified as impaired include payment status, collateral value, probability of collecting scheduled payments, delinquent taxes and debts to other lenders that cannot be serviced out of existing cash flow.
A loan is classified as a troubled debt restructuring when a borrower is experiencing financial difficulties that leads to a restructuring of the loan, and the Company grants concessions to the borrower in the restructuring
76
Table of Contents
that it would not otherwise consider for new debt of similar risk. The loan terms which have been modified or restructured due to a borrower’s financial difficulty may include a reduction in the stated interest rate, an extension of the maturity at an interest rate below current market interest rates, a reduction in the face amount of the debt (principal forgiveness), a reduction in the accrued interest or payment amount, or re-aging, extensions, deferrals, and other actions intended to minimize potential losses.
The restructured loans may be categorized as “special mention” or “substandard” depending on the severity of the modification. Regardless, all modified loans that are classified as troubled debt restructurings are impaired and the impairment amount is determined at modification. Loans that were paid current at the time of modification may be upgraded in their classification after a sustained period of repayment performance, usually six months or longer.
Loans that are past due at the time of modification are categorized as “substandard” and placed on non-accrual status. Once there is a sustained period of repayment performance (usually six months or longer) and there is a reasonable assurance that the repayment of principal and interest will continue based on a current credit evaluation, those loans may be upgraded in their classification and placed on accrual status.
The Company has instituted loan policies designed to adequately evaluate and analyze the risk factors associated with our loan portfolio and to enable us to analyze such risk factors prior to granting new loans and to assess the sufficiency of the Allowance. We conduct a critical evaluation of the loan portfolio quarterly and have an external review of the loan portfolio conducted once to twice a year. The Allowance is based on the historical loan loss experience of the portfolio loan segments for the past 20 quarters, however the Bank also considers Uniform Bank Peer Group (“UBPR”) historical loss data to evaluate potential loss exposure for those loan segments where the Company had no meaningful historical loss experience. The Allowance also includes an assessment of the following qualitative factors: the results of any internal and external loan reviews and any regulatory examination, loan charge-off experience, estimated potential charge-off exposure on each classified loan, credit concentrations, changes in the value of collateral for collateral dependent loans, and any known impairment in the borrower’s ability to repay. The Company also evaluates environmental and other factors such as underwriting standards, staff experience, the nature and volume of loans and loan terms, business conditions, political and regulatory conditions, local and national economic trends. The quantitative portion of the Allowance is adjusted for qualitative factors to account for model imprecision and to incorporate the range of probable outcomes inherent in the estimates used for the Allowance.
Each quarter the Company reviews the Allowance and makes additional provisions to the Allowance as needed based on a review of the factors discussed above. The Allowance increased $3.7 million, to $19 million at December 31, 2016 from $16 million at December 31, 2015 due to a provision for loan losses of $3.3 million and net recoveries of $428 thousand. The allowance for loan loss as a percentage of total loans was 0.94% at December 31, 2016 and 0.86% at December 31, 2015. The Allowance as a percentage of loans (excluding loan balances and the related Allowance on loans acquired through acquisition) was 1.18% and 1.25% at December 31, 2016, and 2015, respectively. The decrease in the allowance ratio related to organic loans was directly attributable to gradual improvements in the economic conditions within the Company’s markets, as well as a continued low level of non-performing assets at December 31, 2016.
The Company’s management considered the following factors in evaluating the Allowance at December 31, 2016:
| • | For the year ended December 31, 2016, there were loan recoveries of $1.3 million and loan charge-offs of $895 thousand. The largest recovery was $800 thousand on a commercial loan. The largest charge-off was $508 thousand on a commercial loan. |
| • | There were twelve non-accrual loans totaling $1.1 million, none exceeds $300 thousand individually |
| • | The overall growth and composition of the loan portfolio |
77
Table of Contents
| • | Changes to the overall economic conditions within the markets in which the Company makes loans |
| • | Concentrations within the loan portfolio, as well as risk conditions within its commercial and industrial loan portfolio |
| • | The remaining fair value adjustments on loans acquired through acquisition with special attention to the fair value adjustments associated with the purchased credit impaired loans |
The Allowance and the reserve for unfunded loan commitments are significant estimates that can and do change based on management’s process in analyzing the loan portfolio and on management’s assumptions about specific borrowers and applicable economic and environmental conditions, among other factors. In considering all of the above factors, management believes that the Allowance and the reserve for unfunded loan commitments at December 31, 2016 are adequate. Although the Company maintains its Allowance and reserve for unfunded loan commitments at a level which it considers adequate to provide for probable charge-offs and losses, there can be no assurance that such charge-offs and losses will not exceed the estimated amounts, thereby adversely affecting future results of operations.
Loans acquired through acquisition are recorded at fair value at acquisition date without a carryover of the related Allowance. Loans acquired with deteriorated credit quality are loans that have evidence of credit deterioration since origination and it is probable at the date of acquisition that the Company will not collect principal and interest payments according to contractual terms. These loans are accounted for under ASC Subtopic 310-30 Receivables — Loans and Debt Securities Acquired with Deteriorated Credit Quality. Evidence of credit quality deterioration as of the acquisition date may include factors such as past due and non-accrual status. The difference between undiscounted contractually required payments at acquisition and the undiscounted cash flows expected to be collected at acquisition is referred to as the credit loss or non-accretable yield. Further, any excess of cash flows expected at acquisition over the estimated fair value is referred to as the accretable yield and is recognized into interest income over the remaining life of the loan when there is a reasonable expectation about the amount and timing of such cash flows. Subsequent decreases to the expected cash flows will result in a provision for loan losses.
The following is a summary of activity in the allowance for loan loss for the periods indicated (dollars in thousands):
| December 31, | ||||||||||||||||||||
| 2016 | 2015 | 2014 | 2013 | 2012 | ||||||||||||||||
| Allowance for loan loss at beginning of year |
$ | 15,682 | $ | 12,610 | $ | 10,603 | $ | 8,803 | $ | 7,495 | ||||||||||
| Provision for loan losses |
3,264 | 5,080 | 2,239 | 2,852 | 1,768 | |||||||||||||||
|
|
|
|
|
|
|
|
|
|
|
|||||||||||
| Net (charge-offs) recoveries: |
||||||||||||||||||||
| Loans charged-off: |
||||||||||||||||||||
| Commercial and Industrial |
(895 | ) | (2,218 | ) | (619 | ) | (1,704 | ) | (444 | ) | ||||||||||
| Construction, Land Development and Other Land |
— | — | — | — | — | |||||||||||||||
| Commercial and Other Real Estate |
— | (292 | ) | (73 | ) | (200 | ) | (233 | ) | |||||||||||
| Consumer and Other |
— | — | — | (8 | ) | (10 | ) | |||||||||||||
|
|
|
|
|
|
|
|
|
|
|
|||||||||||
| Total loans charged-off |
(895 | ) | (2,510 | ) | (692 | ) | (1,912 | ) | (687 | ) | ||||||||||
|
|
|
|
|
|
|
|
|
|
|
|||||||||||
| Recoveries: |
||||||||||||||||||||
| Commercial and Industrial |
1,318 | 497 | 354 | 70 | 76 | |||||||||||||||
| Construction, Land Development and Other Land |
— | — | — | 763 | — | |||||||||||||||
| Commercial and Other Real Estate |
5 | 5 | 106 | 12 | 139 | |||||||||||||||
| Other |
— | — | — | 15 | 12 | |||||||||||||||
|
|
|
|
|
|
|
|
|
|
|
|||||||||||
| Total recoveries |
1,323 | 502 | 460 | 860 | 227 | |||||||||||||||
|
|
|
|
|
|
|
|
|
|
|
|||||||||||
| Net (charge-offs) recoveries |
428 | (2,008 | ) | (232 | ) | (1,052 | ) | (460 | ) | |||||||||||
|
|
|
|
|
|
|
|
|
|
|
|||||||||||
| Allowance for loan loss at end of year |
$ | 19,374 | $ | 15,682 | $ | 12,610 | $ | 10,603 | $ | 8,803 | ||||||||||
|
|
|
|
|
|
|
|
|
|
|
|||||||||||
78
Table of Contents
As set forth in the following table, the Allowance is allocated among the different loan segments because there are differing levels of risk associated with each loan segment. However, the allowance for loan loss allocated to specific loan segments are not the total amounts available for future charge-offs that might occur within such segments because the total allowance for loan loss is applicable to the entire portfolio.
| (Dollars in thousands) | December 31, |
|||||||||||||||||||||||||||||||||||||
| 2016 |
2015 | 2014 | 2013 | 2012 | ||||||||||||||||||||||||||||||||||
| Allowance |
% of Loans to Total Loans |
Allowance for Loan Loss |
% of Loans to Total Loans |
Allowance for Loan Loss |
% of Loans to Total Loans |
Allowance for Loan Loss |
% of Loans to Total Loans |
Allowance for Loan Loss |
% of Loans to Total Loans |
|||||||||||||||||||||||||||||
| Commercial and Industrial |
$7,130 | 25 | % | $ | 5,924 | 29 | % | $ | 5,864 | 33 | % | $ | 5,534 | 32 | % | $ | 4,572 | 31 | % | |||||||||||||||||||
| Construction, Land Development and Other Land |
3,084 | 9 | 2,076 | 7 | 1,684 | 4 | 1,120 | 5 | 2,035 | 6 | ||||||||||||||||||||||||||||
| Commercial and Other Real Estate |
8,487 | 64 | 6,821 | 62 | 4,802 | 61 | 3,886 | 61 | 2,084 | 61 | ||||||||||||||||||||||||||||
| Consumer and Other |
673 | 2 | 861 | 2 | 260 | 2 | 63 | 2 | 112 | 2 | ||||||||||||||||||||||||||||
|
|
|
|
|
|
|
|
|
|
|
|
|
|
|
|
|
|
|
|
||||||||||||||||||||
| Total |
$19,374 | 100 | % | $ | 15,682 | 100 | % | $ | 12,610 | 100 | % | $ | 10,603 | 100 | % | $ | 8,803 | 100 | % | |||||||||||||||||||
|
|
|
|
|
|
|
|
|
|
|
|
|
|
|
|
|
|
|
|
||||||||||||||||||||
Deposits
Total deposits increased $321 million to $2.6 billion at December 31, 2016, primarily due to a $112 million increase in non-interest bearing demand deposits, a $72 million increase in interest bearing transaction accounts and a $166 million increase in money market and savings deposits, offset by a decrease of $29 million in certificates of deposit. The increases in these deposits are primarily related to strong organic deposit growth in 2016 which demonstrates the Company’s focus on its relationship-based, business-banking franchise model. Non-interest bearing deposits represented 54% and 56% of total deposits at December 31, 2016 and 2015, respectively.
At December 31, 2016, 79 customers maintained balances (aggregating all related accounts, including multiple business entities and personal funds of business principals) in excess of $6 million. The aggregate amount of such deposits amounted to $1.2 billion or approximately 48% of the Company’s total customer deposit base. At December 31, 2015, 117 customers maintained balances (aggregating all related accounts, including multiple business entities and personal funds of business principals) in excess of $4 million. The aggregate amount of such deposits amounted to $1.3 billion or approximately 56% of the Company’s total customer deposit base. The Asset/Liability Committee of the Bank monitors for deposit concentrations and considers strategies to de-risk if necessary.
79
Table of Contents
The following table is a breakout of the Company’s deposits stratified by the industry concentration of the depositor by their respective NAICS code at the dates indicated (dollars in thousands):
| December 31, 2016 |
December 31, 2015 |
|||||||||||||||
| Amount | % of Total | Amount | % of Total | |||||||||||||
| Real Estate |
$ | 676,114 | 26 | % | $ | 580,946 | 25 | % | ||||||||
| Finance |
526,816 | 20 | % | 480,414 | 21 | % | ||||||||||
| Construction |
335,405 | 13 | % | 277,481 | 12 | % | ||||||||||
| Manufacturing |
278,343 | 11 | % | 229,144 | 10 | % | ||||||||||
| Professional Services |
235,872 | 9 | % | 189,267 | 8 | % | ||||||||||
| Other Services |
152,528 | 6 | % | 106,505 | 5 | % | ||||||||||
| Wholesale |
123,488 | 5 | % | 129,522 | 6 | % | ||||||||||
| Health Care |
72,131 | 3 | % | 62,153 | 3 | % | ||||||||||
| Administrative Services |
43,629 | 2 | % | 49,217 | 2 | % | ||||||||||
| Hotel and Food Services |
39,003 | 1 | % | 34,506 | 2 | % | ||||||||||
| Information |
38,087 | 1 | % | 29,611 | 1 | % | ||||||||||
| Retail |
26,132 | 1 | % | 34,305 | 1 | % | ||||||||||
| Entertainment |
18,966 | 1 | % | 26,827 | 1 | % | ||||||||||
| Transportation |
17,357 | 1 | % | 21,756 | 1 | % | ||||||||||
| Other |
23,517 | 1 | % | 41,893 | 2 | % | ||||||||||
|
|
|
|
|
|
|
|
|
|||||||||
| Total Deposits |
$ | 2,607,389 | 100 | % | $ | 2,293,547 | 100 | % | ||||||||
|
|
|
|
|
|
|
|
|
|||||||||
The following table summarizes the distribution of total deposits by branch as of December 31, 2016 (dollars in thousands):
| December 31, 2016 |
% of Total |
|||||||
| Irvine |
$ | 586,847 | 23 | % | ||||
| West Los Angeles |
368,710 | 14 | % | |||||
| Los Angeles |
360,817 | 14 | % | |||||
| Encino |
313,725 | 12 | % | |||||
| Conejo Valley |
313,493 | 12 | % | |||||
| Anaheim |
252,027 | 10 | % | |||||
| South Bay |
163,249 | 6 | % | |||||
| Inland Empire |
139,203 | 5 | % | |||||
| Santa Clarita |
109,318 | 4 | % | |||||
|
|
|
|
|
|||||
| Total |
$ | 2,607,389 | 100 | % | ||||
|
|
|
|
|
|||||
The Company experienced growth in all deposit categories except for certificates of deposit during 2016. Non-interest bearing demand deposits increased by $112 million or 9% to $1.4 billion and represented 54% of total deposits at December 31, 2016, down from 56% at December 31, 2015. Average non-interest bearing demand deposits as a percentage of the Company’s average outstanding deposits were 55% and 53% for the years ended December 31, 2016 and 2015, respectively.
The Company’s interest bearing transaction accounts increased by $72 million, or 27% to $333 million as of December 31, 2016 compared to the prior year-end. The overall rate paid by the Company on its interest bearing transaction accounts averaged 0.14% in 2016 and 0.16% in 2015.
The Company’s money market and savings deposits increased by $166 million or 24%, to $845 million as of December 31, 2016 compared to the prior year-end. The overall rate paid by the Company on its money market and savings deposits averaged 0.27% in 2016 compared to 0.24% in 2015.
80
Table of Contents
The Company’s certificates of deposit decreased by $29 million, or 50% to $29 million as of December 31, 2016 compared to the prior year-end. At December 31, 2016, $28 million of total time deposits mature within one year. The overall rate paid by the Company on its certificates of deposit averaged 0.30% in 2016 compared to 0.31% in 2015. Over the past several years, the Company has effectively lowered the rate paid on its maturing certificate of deposits.
The Company’s business is not seasonal in nature and is not dependent upon funds from sources outside the United States. It is the Company’s strategy to rely on deposits from its customers rather than utilizing brokered deposits. Certain types of customers (such as fiduciaries and trustees) may require FDIC insurance coverage greater than what can be offered by one bank under applicable law. In these cases, the Company offers CDARS® (Certificate of Deposit Account Registry Service) that places certificates of deposit with participating institutions on a reciprocal basis, which means that the Company receives deposits in amounts and at rates equivalent to those its customers place with CDARS® participating banks. During 2016, these deposits matured and the Company is currently only offering CDARS® One-Way Sell CD products, which are non-reciprocal deposits and are not recorded on the Company’s consolidated balance sheet. The second program is the Insured Cash Sweep® “ICS®” deposit program which provides for the placement of reciprocal non-interest bearing demand deposits with participating institutions. These reciprocal deposits under the second program, while classified on reports to federal regulatory agencies as “brokered deposits” differ substantially from traditional brokered deposits because they are equivalent to deposits placed by the Company’s customers. These “reciprocal” transactions are facilitated by Promontory Interfinancial Network, LLC. CDARS® and ICS® reciprocal deposits are not considered brokered deposits for calculation of FDIC insurance premiums. At December 31, 2016 and 2015, these CDARS® and ICS® reciprocal deposits were the only brokered funds held by the Company. The Company has continued to use these programs for customers that must have full FDIC coverage on their deposit balances. CDARS® certificates of deposit balances were zero at December 31, 2016, as all these CD’s matured in 2016, and were $29 million at December 31, 2015. The Company began offering the ICS® program during 2013, and has a balance of $7.5 million and $ 9.3 million at December 31, 2016 and 2015, respectively. The Company does not engage in any advertising of its certificates of deposit products.
The following table summarizes the distribution of the average deposit balances and the average rates paid on deposits during the years ended December 31, 2016, 2015 and 2014 (dollars in thousands):
| Analysis of Average Deposits and Rates | ||||||||||||||||||||||||
| Years Ended December 31, | ||||||||||||||||||||||||
| 2016 | 2015 | 2014 | ||||||||||||||||||||||
| Amount | % Rate |
Amount | % Rate |
Amount | % Rate |
|||||||||||||||||||
| Non-interest bearing demand deposits |
$ | 1,364,164 | — | % | $ | 1,151,075 | — | % | $ | 704,437 | — | % | ||||||||||||
| Interest-bearing transaction deposits |
290,104 | 0.14 | % | 258,444 | 0.16 | % | 153,327 | 0.18 | % | |||||||||||||||
| Money market and savings deposits |
767,826 | 0.27 | % | 690,065 | 0.24 | % | 390,185 | 0.25 | % | |||||||||||||||
| Time deposits |
46,945 | 0.30 | % | 61,275 | 0.31 | % | 61,048 | 0.35 | % | |||||||||||||||
|
|
|
|
|
|
|
|||||||||||||||||||
| Total Deposits |
$ | 2,469,039 | 0.11 | % | $ | 2,160,859 | 0.10 | % | $ | 1,308,997 | 0.11 | % | ||||||||||||
|
|
|
|
|
|
|
|||||||||||||||||||
The Company only realized a small increase in its costs despite a 0.25% increase in the prime rate in December 2015.
Securities Sold Under Agreements to Repurchase
The Company has developed an overnight sweep program in order to accommodate several of our sophisticated business customers, many of whom act as fiduciaries, and thus require additional security in excess of FDIC insurance limits. Under this overnight sweep program, excess funds over a specified amount in the customers demand deposit account are automatically swept into securities sold under agreements to repurchase,
81
Table of Contents
(“repos”). For these business customers, the Company enters into certain transactions, the legal forms of which are sales of securities under agreements to repurchase at a later date at a set price. Repos are classified as secured borrowings and generally mature the next business day (“overnight repos”) but may extend the maturity up to 180 days (“term repos”) from the issue date. The Company’s repos at December 31, 2016 and 2015 have been concentrated in the overnight repo program. Under the overnight repo program, the Company’s business deposit customers have their excess deposit balances over an established limit automatically swept into this product on an overnight basis. The following business day, the repos mature and the matured fund balances are re-deposited back into the customer’s demand deposit account. At December 31, 2016, the Company had $19 million in the overnight repo program (repos maturing on January 3, 2017). The repo balances increased by $4.5 million, or 31%, to $19 million at December 31, 2016, from $14 million at December 31, 2015. The Company pledges certain investment securities as collateral for the Repo program. Securities with a fair market value of $48 million and $47 million were pledged to secure the repos at December 31, 2016 and 2015, respectively. The Company considers the funds maintained under the overnight repo program to be a stable and reliable source of funding for the Company. The Company does not advertise this product and generally limits it to businesses and other sophisticated customers.
Details regarding the Company’s repos are reflected in the table below (dollars in thousands):
| 2016 | 2015 | 2014 | ||||||||||||||||||||||||||||||||||
| Balances at Year- end |
Average Balance |
Weighted Average Rate |
Balances at Year- end |
Average Balance |
Weighted Average Rate |
Balances at Year- end |
Average Balance |
Weighted Average Rate |
||||||||||||||||||||||||||||
| Securities sold under agreements to repurchase |
$ | 18,816 | $ | 22,739 | 0.23 | % | $ | 14,360 | $ | 13,966 | 0.22 | % | $ | 9,411 | $ | 13,579 | 0.19 | % | ||||||||||||||||||
Capital Resources
The Company’s objective is to maintain a level of capital that will support sustained asset and loan growth, provide for anticipated credit risks, and ensure that regulatory guidelines and industry standards are met. The Company and the Bank are subject to certain minimum capital adequacy and minimum well capitalized category guidelines adopted by the FRB and the FDIC. These guidelines relate primarily to the Tier 1 leverage ratio, the Common Equity Tier 1 Ratio (“CET1”), the Tier 1 risk-based capital ratio, and the Total risk-based capital ratio.
On October 26, 2015, the Company filed a Form S-3 registration statement for offerings up to $100 million of certain types of securities. If drawn on, proceeds from the offering could be used for general corporate purposes. The registration statement represents capital resources available to the Company as the registration statement is deemed to be effective by the Securities Exchange Commission (SEC) and will be available for three years.
82
Table of Contents
At December 31, 2016, the respective capital ratios of the Company and the Bank exceeded the minimum percentage requirements to be deemed “well-capitalized” for Prompt Corrective Action (“PCA”) purpose and the Basel III minimum capital ratios with buffer (effective January 1, 2016) under the current capital guidelines. The following tables present the regulatory capital ratios requirements and the actual capitalization levels of the Company and the Bank as of the dates indicated (dollars in thousands):
CU Bancorp
| December 31, 2016 |
December 31, 2015 |
Well Capitalized |
Basel III Minimum with Buffer |
|||||||||||||
| Amount | Amount | (greater than or equal to) | ||||||||||||||
| Regulatory Capital Ratios: |
||||||||||||||||
| Tier 1 leverage ratio |
9.72 | % | 9.67 | % | 5.00 | % | NA | |||||||||
| Common Equity Tier 1 ratio |
9.61 | % | 9.61 | % | 6.5 | % | 5.125 | % | ||||||||
| Total Tier 1 risk-based capital ratio |
10.68 | % | 10.85 | % | 8.0 | % | 6.625 | % | ||||||||
| Total risk-based capital ratio |
11.44 | % | 11.54 | % | 10.0 | % | 8.625 | % | ||||||||
| Regulatory Capital Data: |
||||||||||||||||
| Common Equity Tier 1 |
$ | 257,105 | $ | 223,977 | ||||||||||||
| Total Tier 1 capital |
285,843 | 252,681 | ||||||||||||||
| Total risk-based capital |
306,103 | 268,971 | ||||||||||||||
| Average total assets* |
2,940,790 | 2,611,774 | ||||||||||||||
| Risk-weighted assets |
2,675,987 | 2,329,770 | ||||||||||||||
California United Bank:
| December 31, 2016 |
December 31, 2015 |
Well Capitalized |
Basel III Minimum with Buffer |
|||||||||||||
| Amount | Amount | (greater than or equal to) | ||||||||||||||
| Regulatory Capital Ratios: |
||||||||||||||||
| Tier 1 leverage ratio |
9.35 | % | 9.34 | % | 4.0 | % | NA | |||||||||
| Common Equity Tier 1 ratio |
10.28 | % | 10.47 | % | 4.5 | % | 5.125 | % | ||||||||
| Total Tier 1 risk-based capital ratio |
10.28 | % | 10.47 | % | 6.0 | % | 6.625 | % | ||||||||
| Total risk-based capital ratio |
11.04 | % | 11.17 | % | 8.0 | % | 8.625 | % | ||||||||
| Regulatory Capital Data: |
||||||||||||||||
| Common Equity Tier 1 |
$ | 275,151 | $ | 243,989 | ||||||||||||
| Tier 1 capital |
275,151 | 243,989 | ||||||||||||||
| Total risk-based capital |
295,411 | 260,279 | ||||||||||||||
| Average total assets * |
2,941,253 | 2,612,206 | ||||||||||||||
| Risk-weighted assets |
2,677,030 | 2,329,798 | ||||||||||||||
| * | Represents the average total assets for the leverage ratio |
In July 2013, the federal bank regulatory agencies adopted final regulations which revised their risk-based and leverage capital requirements for banking organizations to meet requirements of Dodd-Frank and to implement international agreements reached by the Basel Committee on Banking Supervision intended to improve both the quality and quantity of banking organizations’ capital (“Basel III”). Dodd-Frank required the Federal Reserve to apply consolidated capital requirements to depository institution holding companies that are no less stringent than those currently applied to depository institutions.
83
Table of Contents
The following are among the requirements that were phased-in beginning January 1, 2015 under the new capital rules:
| • | an increase in the minimum Tier 1 capital ratio from 4.00% to 6.00% of risk-weighted assets; |
| • | a new category and a required 4.50% of risk-weighted assets ratio is established for CET1 as a subset of Tier 1 capital limited to common equity; |
| • | a minimum non-risk-based leverage ratio is set at 4.00%; |
| • | changes in the permitted composition of Tier 1 capital to exclude trust preferred securities (however, trust preferred securities issued prior to May 19, 2010 by a bank holding company with less than $15 billion in assets, such as CU Bancorp, continues to be included in Tier 1 capital, subject to a limit of 25% of Tier 1 capital elements; see further discussion below), mortgage servicing rights and certain deferred tax assets and include unrealized gains and losses on available-for-sale debt and equity securities; |
| • | the risk-weights of certain assets for purposes of calculating the risk-based capital ratios are changed for high volatility commercial real estate acquisition, development and construction loans, certain past due non-residential mortgage loans and certain mortgage-backed and other securities exposures; |
| • | an additional “countercyclical capital buffer” is required for larger and more complex institutions; and |
| • | a new additional capital conservation buffer of 2.5% of risk weighted assets over the period from 2016 to 2019 must be met to avoid limitations on the ability of the Company and the Bank to pay dividends, repurchase shares or pay discretionary bonuses. |
Including the capital conservation buffer of 2.5%, the new final capital rule will result in the following minimum ratios: (i) a Tier 1 capital ratio of 8.5%, (ii) a common equity Tier 1 capital ratio of 7.0%, and (iii) a total capital ratio of 10.5%. The new capital conservation buffer requirement phase-in began in January 2016 at 0.625% of risk-weighted assets and will increase each year by 0.625% until fully implemented in January 2019. While the final capital rule sets higher regulatory capital standards for the Company and the Bank, bank regulators may also continue their past policies of expecting banks to maintain additional capital beyond the new minimum requirements. The implementation of the final capital rules or more stringent requirements to maintain higher levels of capital or to maintain higher levels of liquid assets could adversely impact the Company’s net income and return on equity, restrict the ability to pay dividends or executive bonuses and require the raising of additional capital.
Under Dodd Frank, trust preferred securities are excluded from Tier 1 capital, unless such securities were issued prior to May 19, 2010 by a bank holding company with less than $15 billion in assets. CU Bancorp assumed approximately $12.4 million of junior subordinated debt securities issued to various business trust subsidiaries of Premier Commercial Bancorp and funded through the issuance of approximately $12.0 million of floating rate capital trust preferred securities. These junior subordinated debt securities were issued prior to May 19, 2010. Because CU Bancorp has less than $15 billion in assets, the trust preferred securities that CU Bancorp assumed from Premier Commercial Bancorp continues to be included in Tier 1 capital, subject to a limit of 25% of Tier 1 capital elements.
The Company also currently includes in its Tier 1 capital an amount of Non-Cumulative Perpetual Preferred Stock, Series A issued under the SBLF program. The U.S. Department of the Treasury is the sole holder of all outstanding shares of CU Bancorp Preferred Stock. Under the Final Rule, the CU Bancorp Preferred Stock continues to be included in Tier 1 Risk-Based Capital because non-cumulative perpetual preferred stock remained classified as Tier 1 capital following the enactment of Dodd Frank.
84
Table of Contents
Consent Order
On September 23, 2016, California United Bank (the “Bank”), the wholly owned subsidiary of CU Bancorp (the “Company”) entered into a Stipulation to the Issuance of a Consent Order with its bank regulatory agencies, the Federal Deposit Insurance Corporation (“FDIC”) and the California Department of Business Oversight (“CDBO”), consenting to the issuance of a consent order (the “Consent Order”) relating to weaknesses in the Bank’s Bank Secrecy Act and Anti-Money Laundering (collectively “BSA”) compliance program. In consenting to the issuance of the Consent Order, the Bank did not admit or deny any charges of unsafe or unsound banking practices related to the BSA compliance program.
Under the terms of the Consent Order the Bank and/or its Board of Directors is required to take certain actions which include, but are not limited to: a) Increasing Board supervision of the BSA compliance program; b) Notification to the regulatory agencies prior to appointment of a new BSA Officer or the executive to whom the BSA Officer reports; c) Formulation of a written action plan describing the actions to be taken to correct BSA/AML related deficiencies, a revised, written BSA/AML compliance program and review and enhancement of the Bank’s BSA risk assessment; d) Performance of a review of BSA staffing needs; e) Enhancement of internal controls to ensure full compliance with the BSA; f) Establishment of an independent testing program for compliance with the BSA rules and regulations; and g) Obtaining regulatory agency consent for expansionary activities such as new branches, offices, delivery channels, products and services.
The Consent Order resulted in additional BSA compliance expenses for the Bank and the Company. It may also have the effect of limiting or delaying the Bank’s and the Company’s ability to obtain regulatory approval for certain expansionary activities, to the extent desired by the Company. The Consent Order does not otherwise impact the Bank’s business activities outside of BSA. The Consent Order does not require the Bank to pay any civil money penalty or require additional capital. The Consent Order will remain in effect and be enforceable until it is modified, terminated, suspended or set aside by the FDIC and the CBDO. Management and the Board have expressed their full intention to comply with all parts of the Consent Order at the earliest possible date.
Dividends
To date, the Company has not paid any cash dividends on its common stock. Payment of stock or cash dividends in the future will depend upon earnings, liquidity, financial condition and other factors deemed relevant by our Board of Directors. Notification to the FRB is required prior to declaring and paying a dividend to shareholders that exceeds earnings for the period for which the dividend is being paid. This notification requirement is included in regulatory guidance regarding safety and soundness surrounding capital and includes other non-financial measures such as asset quality, financial condition, capital adequacy, liquidity, future earnings projections, capital planning and credit concentrations. Should the FRB object to dividend payments, the Company would be precluded from declaring and paying dividends, until approval is received or the Company no longer needs to provide notice under applicable guidance.
California law also limits the Company’s ability to pay dividends. A corporation may make a distribution/dividend from retained earnings to the extent that the retained earnings exceed (a) the amount of the distribution plus (b) the amount if any, of dividends in arrears on shares with preferential dividend rights. Alternatively, a corporation may make a distribution/dividend, if, immediately after the distribution, the value of its assets equals or exceeds the sum of (a) its total liabilities plus (b) the liquidation preference of any shares which have a preference upon dissolution over the rights of shareholders receiving the distribution/dividend.
The Bank is subject to certain restrictions on the amount of dividends that may be declared without regulatory approval. Such dividends shall not exceed the lesser of the Bank’s retained earnings or net income for its last three fiscal years (less any distributions to the shareholder made during such period). In addition, the Bank may not pay dividends that would result in its capital being reduced below the minimum requirements for capital adequacy purposes.
85
Table of Contents
The Company completed the merger with 1st Enterprise on November 30, 2014. As part of the Merger Agreement, 16,400 shares of preferred stock issued by 1st Enterprise as part of the Small Business Lending Fund (SBLF) program of the United States Department of the Treasury was converted into 16,400 CU Bancorp preferred shares with substantially identical terms. CU Bancorp Preferred Stock has a liquidation preference amount of $1 thousand per share, designated as the Company’s Non-Cumulative Perpetual Preferred Stock, Series A. The U.S. Department of the Treasury is the sole holder of all outstanding shares of CU Bancorp Preferred Stock.
Dividends on the Company’s Series A Preferred Stock are payable quarterly in arrears if authorized and declared by the Company’s board of directors out of legally available funds, on a non-cumulative basis, on the $1 thousand per share liquidation preference amount. Dividends are payable on January 1, April 1, July 1 and October 1 of each year. The current coupon dividend rate was adjusted to 9% on March 1, 2016 through perpetuity. However, the dividend yield through November 30, 2018 approximates 7% as a result of business combination accounting. The Company may from time to time evaluate if a partial or full payment to redeem the Preferred Stock is appropriate in capital management. Dividends on the Series A Preferred Stock are non-cumulative. There is no sinking fund with respect to dividends on the Series A Preferred Stock. So long as the Company’s Series A Preferred Stock remains outstanding, the Company may declare and pay dividends on the common stock only if full dividends on all outstanding shares of Series A Preferred Stock for the most recently completed dividend period have been or are contemporaneously declared and paid.
As of December 31, 2016, both CU Bancorp “the holding company” and the Bank had positive retained earnings and positive net income that would allow either of them to declare and pay a dividend as of December 31, 2016. However, neither the holding company nor the Bank has plans to declare and pay a cash dividend on the common stock at the current time.
The Company has a program to repurchase a portion of an employee’s outstanding restricted stock upon the vesting of this restricted stock, but only in amounts necessary to cover the employee tax withholding obligations at the option of the restricted stockholder (employee). Beginning in July 2016, withheld taxes may be higher than the minimum tax rate as a result of the Company’s early adoption of ASU 2016-09. This program was designed to provide the Bank’s employees with the financial ability to cover their tax liability obligation associated with the vesting of their restricted stock at the date of vesting. These transactions under the State of California Corporations Code are defined as distributions to shareholders.
86
Table of Contents
Liquidity
The following table provides a summary of the Company’s primary and secondary liquidity levels at the dates indicated (dollars in thousands):
| December 31, 2016 |
December 31, 2015 |
|||||||
| Primary Liquidity- On Balance Sheet: |
||||||||
| Cash and due from banks |
$ | 41,281 | $ | 50,960 | ||||
| Interest-earning deposits in other financial institutions |
167,789 | 171,103 | ||||||
| Investment securities available-for-sale |
469,950 | 315,785 | ||||||
| Less: pledged investment securities |
(204,855 | ) | (197,251 | ) | ||||
|
|
|
|
|
|||||
| Total primary liquidity |
$ | 474,165 | $ | 340,597 | ||||
|
|
|
|
|
|||||
| Ratio of primary liquidity to total deposits |
18.19 | % | 14.9 | % | ||||
| Additional Liquidity Not Included In Primary Liquidity: |
||||||||
| Certificates of deposit in other financial institutions |
$ | 51,245 | $ | 56,860 | ||||
| Less: Certificate of deposits pledged |
(2,731 | ) | (2,731 | ) | ||||
|
|
|
|
|
|||||
| Total additional liquidity |
$ | 48,514 | $ | 54,129 | ||||
|
|
|
|
|
|||||
| Secondary Liquidity- Off-Balance Sheet: |
||||||||
| Available Borrowing Capacity: |
||||||||
| Total secured borrowing capacity with FHLB |
$ | 657,955 | $ | 544,132 | ||||
| Fed Funds borrowing lines |
72,000 | 72,000 | ||||||
| Secured credit line with the FRBSF |
25,489 | 18,708 | ||||||
|
|
|
|
|
|||||
| Total secondary liquidity |
$ | 755,444 | $ | 634,840 | ||||
|
|
|
|
|
|||||
As of December 31, 2016, the Company’s primary source of liquidity consisted of the balances reflected in the table above. The Company’s primary overnight liquidity consisted of cash and due from banks and interest-earning deposits in other financial institutions. The amount of funds maintained directly with the Federal Reserve included in interest-earning deposits in other financial institutions was $90 million and $102 million, at December 31, 2016 and December 31, 2015, respectively. The next source of liquidity is the Company’s collateralized borrowings and unsecured borrowing facilities. In addition, the Company has $51 million of certificates of deposits in other financial institutions where the weighted average maturity is approximately 6 months that could be utilized over time to supplement the liquidity needs of the Company.
The Company’s primary long term source of funding has come from the liability side of the balance sheet and has historically been through the growth in non-interest bearing and interest bearing core deposits from its customers. Additional sources of funds from the Company’s asset side of the balance sheet have included Federal Funds sold, interest-earning deposits with other financial institutions, balances maintained with the Federal Reserve Bank, certificates of deposit in other financial institutions and payments of principal and interest on loans and investment securities. While maturities and scheduled principal amortization on loans are a reasonably predictable source of funds, deposit flows and loan prepayments are greatly influenced by the level of interest rates, economic conditions and competition.
As an additional source of liquidity, the Company maintains credit facilities, “Fed Funds Borrowing Lines,” of $72 million and $72 million at December 31, 2016 and December 31, 2015, respectively, with its primary correspondent banks for the purchase of overnight Federal funds. The lines are subject to availability of funds and have restrictions as to the number of days and length used during a month. At December 31, 2016 and December 31, 2015, $5 million of these credit facilities required the pledging of investment securities collateral.
87
Table of Contents
The Company has established a secured credit facility with the FHLB of San Francisco which allows the Bank to borrow up to 25% of the Bank’s total assets, which equates to a credit line of approximately $723 million at December 31, 2016. The Company currently has no outstanding borrowings with the FHLB. As of December 31, 2016, the Company had $990 million of loan collateral pledged with the FHLB. This level of loan collateral would provide the Company with $658 million in borrowing capacity. Any amount of borrowings in excess of the $658 million would require the Company to pledge additional collateral. In addition, the Company must maintain a certain investment level in the common stock of the FHLB. The Company’s investment in the common stock of the FHLB is $9 million at December 31, 2016. This level of capital would allow the Company to borrow up to $340 million. Any advances from the FHLB in excess of the $340 million would require additional purchases of FHLB common stock. The Company had $16 million pledged with the FHLB at December 31, 2016.
The Company maintains a secured credit facility with the Federal Reserve Bank of San Francisco (“FRBSF”) which is collateralized by investment securities pledged with the FRB.
The Company maintains investments in certificates of deposit with other financial institutions, with various balances maturing monthly. The Company had balances of $51 million and $57 million at December 31, 2016 and December 31, 2015, respectively. At December 31, 2016, $2.7 million of the Company’s certificates of deposit with other financial institutions were pledged as collateral as credit support for the interest rate swap contracts and are not available as a source of liquidity.
At December 31, 2016 and December 31, 2015, the Company had no amount due from bank balances that was pledged as collateral as credit support for the interest rate swap contracts and is not available as a source of liquidity.
The Company’s commitments to extend credit (off-balance sheet liquidity risk) are agreements to lend funds to customers as long as there are no violations as established in the loan agreement. Many of the commitments are expected to expire without being drawn upon, and as such, the total commitment amounts do not necessarily represent future cash requirements. Financial instruments with off-balance sheet risk for the Company include both undisbursed loan commitments, as well as undisbursed letters of credit. The Company’s exposure to extend credit was $1 billion and $806 million at December 31, 2016 and December 31, 2015, respectively.
Holding Company Liquidity
The primary sources of liquidity for CU Bancorp (“the holding company”), on a stand-alone basis, include the ability to raise capital through the issuance of capital stock, issue subordinated debt, secure outside borrowings and receive dividend payments from the Bank. The payment of dividends from the Bank to the holding company is the primary source of liquidity. The ability of the holding company to obtain funds for the payment of dividends to our stockholders and for the payment of holding company expenses is largely dependent upon the Bank’s earnings and retained earnings. The Bank is subject to restrictions under certain federal and state laws and regulations which limit its ability to transfer funds to the holding company through cash dividends, intercompany loans and or advances.
Dividends paid by state banks, such as California United Bank, are regulated by the California Department of Business Oversight “DBO” under its general supervisory authority, as it relates to a bank’s capital requirements. A state bank may declare a dividend without the approval of the DBO as long as the total dividends declared in a calendar year do not exceed either the retained earnings or the total of net profits for three previous fiscal years less any dividends paid during such period. The Bank has never paid a dividend to the holding company.
CU Bancorp’s liquidity on a stand-alone basis was $9.7 million and $6.8 million, in cash on deposit at the Bank, at December 31, 2016 and December 31, 2015, respectively. Management believes this amount of cash is currently sufficient to fund the holding company’s cash flow needs over at least the next twelve to twenty-four months.
88
Table of Contents
Aggregate Contractual Obligations
The following table summarizes the aggregate contractual obligations as of December 31, 2016 (amounts in thousands):
| Maturity/Obligation by Period | ||||||||||||||||||||
| Total | Less than One Year |
One Year to Three Years |
Four Years to Five Years |
After Five Years |
||||||||||||||||
| Deposits |
$ | 2,607,389 | $ | 2,605,744 | $ | 1,645 | $ | — | $ | — | ||||||||||
| Securities sold under agreements to repurchase |
18,816 | 18,816 | — | — | — | |||||||||||||||
| Subordinated debentures |
12,372 | — | — | — | 12,372 | |||||||||||||||
| Operating leases |
14,486 | 3,322 | 7,046 | 3,300 | 818 | |||||||||||||||
|
|
|
|
|
|
|
|
|
|
|
|||||||||||
| Total |
$48,281 | $24,734 | $8,691 | $3,300 | $13,190 | |||||||||||||||
|
|
|
|
|
|
|
|
|
|
|
|||||||||||
For deposits, securities sold under agreements to repurchase and subordinated debentures, the dollar balances reflected in the table above are categorized by the maturity date of the obligation.
Deposits represent both non-interest bearing and interest bearing deposits. Non-interest bearing demand deposits include demand deposit accounts which represent 54% of the total deposit balances at December 31, 2016. Interest bearing deposits include interest bearing transaction accounts, money market and savings deposits and certificates of deposit.
Securities sold under agreements to repurchase “Repos” represent sales of securities under agreements to repurchase at a later date at a set price. While Repos have fixed maturity dates, the majority of the Company’s repos mature on an overnight “next business day” basis.
Subordinated debentures represent notes issued to capital trusts which were formed solely for the purpose of issuing trust preferred securities. These subordinated debentures were acquired as a part of the merger with PC Bancorp. The aggregate amount indicated above represents the full amount of the contractual obligation and does not include a purchase accounting fair value discount of $2.5 million. All of these securities are variable rate instruments. Each series has a maturity of 30 years from their approximate date of issue. All of these securities are currently callable at par with no prepayment penalties.
For operating leases, the dollar balances reflected in the table above are categorized by the due date of the lease payments. Operating leases represent the total minimum lease payments under non-cancelable operating leases.
ITEM 7A – QUANTITATIVE AND QUALITATIVE DISCLOSURES ABOUT MARKET RISK
Market risk arises primarily from credit risk, operational risk and interest rate risk inherent in our lending, investments, borrowings, and deposit taking activities. Risk management is an important part of the Company’s operations and a key element of its overall financial results. The FDIC, in recent years, has emphasized appropriate risk management, prompting banks to have adequate systems to identify, monitor and manage risks. The Company’s Board of Directors and committees meet on a regular basis to oversee operations. The Company’s business activities are monitored and various strategies to manage risk exposure are applied. The Board of Directors has adopted various policies and has empowered the committees with oversight responsibility concerning different aspects of our operations. The Company’s Audit and Risk Committee is responsible for overseeing internal auditing functions and for interfacing with independent outside auditors as well as compliance and related risk. The Company’s Board of Directors Loan Committee reviews large loans made by management, concentrations, portfolio and trend reports, minutes of management’s Problem Loan and Special
89
Table of Contents
Assets committee meetings and reviews with Audit and Risk Committee the external loan review reports on behalf of the Board of Directors. The Company’s management Asset/Liability Risk Committee establishes the Investment Policy, Liquidity Policy and the Asset/Liability Policy, reviews investments purchases, and monitors the investment portfolio, interest rate risk, and liquidity management. All committees regularly report to the Board of Directors.
Credit risk
Credit risk is defined as the risk to earnings or capital arising from an obligor’s failure to meet the terms of any contract or otherwise fail to perform as agreed. Credit risk is found in all activities where success depends on a counter party, issuer or borrower performance. Credit risk arises through the extension of loans, deposits in other financial institutions, certain investment securities, derivative instruments, other assets and off balance sheet commitments.
Credit risk in the loan and investment portfolio and correspondent bank accounts is addressed through defined limits in the Company’s policies. Policy limitations on industry concentrations and house lending limits on aggregate customer borrowings, as well as underwriting standards to ensure loan quality are designed to reduce loan credit risk. Executive Management, Board of Directors Loan Committees and the Board of Directors are provided with information to appropriately identify, measure, control and monitor the credit risk of the Company.
Credit risk in the investment securities area is addressed by the Company through a review of the Company’s securities by management on a quarterly basis. Credit risk within the securities portfolio is the risk that the Company will not be able to recover all of the principal value on its investment securities. This credit review process starts with the Company evaluating the securities portfolio to determine if there has been an other-than-temporary impairment on each of the individual securities in the investment securities portfolio. To determine if an other-than-temporary impairment exists on a debt security, the Company first determines if (a) it intends to sell the security or (b) it is more likely than not that it will be required to sell the security before its anticipated recovery. If either of the conditions is met, the Company will recognize an other-than-temporary impairment in earnings equal to the difference between the security’s fair value and its adjusted cost basis. If neither of the conditions is met, the Company determines (a) the amount of the impairment related to credit loss and (b) the amount of the impairment due to all other factors. The difference between the present value of the cash flows expected to be collected and the amortized cost basis is the credit loss. The credit loss is the portion of the other-than-temporary impairments that is recognized in earnings and is a reduction to the cost basis of the security. The portion of total impairment related to all other factors is included in accumulated other comprehensive income (loss). Significant judgment of management is required in this analysis that includes, but is not limited to assumptions regarding the collectability of principal and interest, future default rates, future prepayment speeds, the amount of current delinquencies that will result in defaults and the amount of eventual recoveries expected on these defaulted loans through the foreclosure process.
Implicit in lending activities is the risk that losses will occur and that the amount of such losses will vary over time. Consequently, we maintain an allowance for loan loss (“Allowance”) by charging a provision for loan losses to earnings. Loans determined to be losses are charged against the Allowance. Our Allowance is maintained at a level considered by us to be adequate to provide for estimated probable losses inherent in the existing portfolio.
Central to the first phase of our credit risk management is our loan risk rating system. The originating relationship officer assigns borrowers an initial risk rating, which is reviewed and confirmed or possibly changed by Credit Management, which is based primarily on a thorough analysis of each borrower’s financial capacity and the loan underwriting structure, in conjunction with industry and economic trends. Approvals are granted based upon the amount of acceptable inherent credit risk specific to the transaction and are reviewed for appropriateness by senior line and credit management personnel. Credits are monitored by line and credit
90
Table of Contents
management personnel for deterioration in payment performance or in a borrower’s financial condition, which would impact the ability of the borrower to perform under the contract. Risk ratings are adjusted as necessary.
The Company augments its credit review function by engaging an outside party to review its loans generally twice a year. In 2016, the Company had two loan reviews conducted during the year by an outside third party. The first loan review was based on loan data as of March 31, 2016 and conducted from April 18, 2016 through April 26, 2016, and the second review was based on loan data as of September 30, 2016 and conducted from October 3, 2016 through October 14, 2016. The final loan review reports were issued on June 13, 2016 and December 6, 2016, respectively. The purpose of the review is to assess internal loan risk ratings, the adequacy and accuracy of impairment amount on impaired loans, the adequacy and accuracy of cash flow analysis, compliance with the accrual of interest rules, compliance with applicable laws and regulations, compliance with board-approved policies and procedures, identify any weak underwriting practices and to determine if there is any overall deterioration in the credit quality of the portfolio and to assess the adequacy of the Allowance.
The second phase is conducted by evaluating or segmenting the remainder of the loan portfolio into groups or pools of loans with similar risk characteristics. In this second phase, groups of loans are reviewed to evaluate the historical loss experience, adjusted for qualitative factors in each category of loans, and then aggregated to determine a portfolio Allowance. Uniform Bank Peer Group loss experience is considered for those loan segments where the Company had no historical loss experience. The quantitative portion of the Allowance is adjusted for qualitative factors to account for model imprecision and to incorporate the range of probable outcomes inherent in the estimates used for the Allowance.
Although the Company has allocated a portion of the Allowance to specific loan categories, the adequacy of the Allowance must be considered in its entirety. See Lending and Allowance for Loan Losses section of Item 7, Management’s Discussion and Analysis on Financial Condition and Results of Operations for further discussion.
Interest Rate Risk
Interest rate risk is the exposure of a Company’s financial condition, both earnings and the market value of assets and liabilities, to adverse movements in interest rates. Interest rate risk results from differences in the maturity or timing of interest earning assets and interest bearing liabilities, changes in the slope of the yield curve over time, imperfect correlation in the adjustment of rates earned and paid on different instruments with otherwise similar characteristics (e.g. three-month Treasury bill versus three-month LIBOR) and from interest-rate-related options embedded in bank products (e.g. loan prepayments, floors and caps, callable investment securities, customers redeploying non-interest bearing to interest bearing deposits, etc.).
The potential impact of interest rate risk is significant because of the liquidity and capital adequacy consequences that reduced earnings or net operating losses caused by a reduction in net interest income could imply. We recognize and accept that interest rate risk is a routine part of bank operations and will from time to time impact our profits and capital position. The objective of interest rate risk management is to control exposure of net interest income to risks associated with interest rate movements in the market, to achieve consistent growth in net interest income and to profit from favorable market opportunities.
The careful planning of asset and liability maturities and the matching of interest rates to correspond with this maturity matching is an integral part of the active management of an institution’s net yield. To the extent maturities of assets and liabilities do not match in a changing interest rate environment, net yields may be affected. Even when interest earning assets are perfectly matched to interest-bearing liabilities from a repricing standpoint, risks remain in the form of prepayment of assets, and the possibility of timing lags between when the assets reprice and the liabilities reprice (the repricing between the assets and liabilities may not happen at exactly the same time), and the possibility that the assets may not reprice to the same extent that the liabilities reprice due to different pricing indices that the products are tied to. In our overall attempt to match assets and liabilities, we take into account rates and maturities to be offered in connection with our certificates of deposit and our fixed
91
Table of Contents
rate as well as variable rate loans. Because of our ratio of rate sensitive assets to rate sensitive liabilities, the Company will be positively affected by an increasing interest rate market.
Variable rate loans make up 73% of the loan portfolio. Of the total variable rate loans, 51% are tied to the Prime index with $703 million subject to repricing within 30 days of a 25 basis point increase in Prime rate. At December 31, 2016, 33% of variable rate loans are at their floor, and thus an increase in the underlying index may not necessarily result in an increase in the coupon until the loan index plus margin exceeds that floor. Furthermore, the Company has approximately $74 million in variable rate loans tied to prime, that are at or below their interest rate floor. The prime rate index would have to increase by more than 40 basis points on average before the loans would re-price. The remaining 49% of the variable rate loans are tied to other indexes with longer repricing frequencies such as the Treasury index and the LIBOR index. The increase in the LIBOR rate during 2016 has not had an effect on our loan yields as only 12% of our variable rate loans are tied to the LIBOR index. Other variable rate assets tied to Prime are the balances at the Federal Reserve Bank of $90 million and $106 million of SBA variable rate investment securities.
The Company had 14 pay-fixed, receive-variable interest rate contracts that were designed to convert fixed rate loans into variable rate loans, with remaining maturities extending out for up to six years These swaps were acquired as a result of the PC Bancorp acquisition. The majority (twelve of the fourteen interest rate swap contracts) is designated as accounting hedges and hedge accounting is applied. The total notional amount of the outstanding swaps contracts as of December 31, 2016 is $18 million. Additionally, at December 31, 2016, the Company had eleven interest rate swap agreements with customers and eleven offsetting interest-rate swaps with a counterparty bank that were acquired as a result of the merger with 1st Enterprise on November 30, 2014. The swap agreements are not designated as hedging instruments and hedge accounting is not applied. The purpose of entering into offsetting derivatives not designated as a hedging instrument is to provide the Company a variable-rate loan receivable and provide the customer the financial effects of a fixed-rate loan without creating significant volatility in the Company’s earnings. At December 31, 2016, the total notional amount of the Company’s swaps acquired from 1st Enterprise was $24 million with the loan customers, and the same notional amount on the offsetting swaps with the counterparty bank.
Since interest rate changes do not affect all categories of assets and liabilities equally or simultaneously, a cumulative gap analysis alone cannot be used to evaluate our interest rate sensitivity position. To supplement traditional gap analysis, we perform simulation modeling to estimate the potential effects of changing interest rates. The process allows us to explore the complex relationships within the gap over time and various interest rate environments.
The following table is a summary of the Company’s one-year GAP as of the dates indicated (dollars in thousands):
| December 31, | ||||||||||||
| 2016 | 2015 | Increase (Decrease) |
||||||||||
| Total interest-sensitive assets maturing or repricing within one year (“one-year assets”) |
$ | 1,472,725 | $ | 1,335,781 | $ | 136,944 | ||||||
| Total interest-sensitive liabilities maturing or repricing within one year (“one-year liabilities”) |
1,237,567 | 1,026,565 | 211,002 | |||||||||
|
|
|
|
|
|
|
|||||||
| One-year GAP |
$ | 235,158 | $ | 309,216 | $ | (74,058 | ) | |||||
|
|
|
|
|
|
|
|||||||
92
Table of Contents
The following tables present the Company’s GAP information as of the date indicated (dollars in thousands):
| Maturity or Repricing Data | ||||||||||||||||||||||||
| December 31, 2016 | Three Months or Less |
Over Three Through Twelve Months |
Over One Year Through Three Years |
Over Three Years |
Non-Interest Bearing |
Total | ||||||||||||||||||
| Interest-Sensitive Assets: |
||||||||||||||||||||||||
| Cash and due from banks |
$ | — | $ | — | $ | — | $ | — | $ | 41,281 | $ | 41,281 | ||||||||||||
| Interest earning deposits in other financial institutions |
167,789 | — | — | — | — | 167,789 | ||||||||||||||||||
| average yield |
0.66 | % | — | — | — | — | 0.66 | % | ||||||||||||||||
| Certificates of deposit in other financial institutions |
14,981 | 36,019 | 245 | — | — | 51,245 | ||||||||||||||||||
| average yield |
0.86 | % | 1.01 | % | 1.06 | % | — | — | 0.97 | % | ||||||||||||||
| Investment securities |
121,557 | 84,580 | 99,467 | 211,583 | — | 517,187 | ||||||||||||||||||
| average yield |
1.70 | % | 1.17 | % | 1.66 | % | 1.84 | % | — | 1.66 | % | |||||||||||||
| Loans, gross (1) |
863,588 | 184,212 | 348,227 | 669,259 | 1,122 | 2,066,408 | ||||||||||||||||||
| average yield (2) |
4.24 | % | 4.59 | % | 4.45 | % | 4.14 | % | — | 4.27 | % | |||||||||||||
|
|
|
|
|
|
|
|
|
|
|
|
|
|||||||||||||
| Total interest-sensitive assets |
$ | 1,167,915 | $ | 304,811 | $ | 447,939 | $ | 880,842 | $ | 42,403 | $ | 2,843,910 | ||||||||||||
|
|
|
|
|
|
|
|
|
|
|
|
|
|||||||||||||
| Interest-Sensitive Liabilities: |
||||||||||||||||||||||||
| Non-interest bearing demand deposits |
$ | — | $ | — | $ | — | $ | — | $ | 1,400,097 | $ | 1,400,097 | ||||||||||||
| Interest-bearing transaction accounts |
332,702 | — | — | — | — | 332,702 | ||||||||||||||||||
| average rate |
0.15 | % | — | — | — | — | 0.15 | % | ||||||||||||||||
| Money market and Savings deposits |
845,110 | — | — | — | — | 845,110 | ||||||||||||||||||
| average rate |
0.26 | % | — | — | — | — | 0.26 | % | ||||||||||||||||
| Certificates of deposit |
15,389 | 12,495 | 1,596 | — | — | 29,480 | ||||||||||||||||||
| average rate |
0.26 | % | 0.29 | % | 0.20 | % | — | — | 0.27 | % | ||||||||||||||
| Securities sold under agreements to repurchase |
18,816 | — | — | — | — | 18,816 | ||||||||||||||||||
| average rate |
0.25 | % | — | — | — | — | 0.25 | % | ||||||||||||||||
| Subordinated debentures |
12,372 | — | — | — | — | 12,372 | ||||||||||||||||||
| average rate (3) |
2.89 | % | — | — | — | — | 2.89 | % | ||||||||||||||||
| Swaps |
684 | — | — | — | — | 684 | ||||||||||||||||||
| average rate |
3.93 | % | — | — | — | — | 3.93 | % | ||||||||||||||||
| Total interest-sensitive liabilities |
$ | 1,225,073 | $ | 12,495 | $ | 1,596 | $ | — | $ | 1,400,097 | $ | 2,639,261 | ||||||||||||
|
|
|
|
|
|
|
|
|
|
|
|
|
|||||||||||||
| GAP |
$ | (57,158 | ) | $ | 386,452 | $ | 446,343 | $ | 880,842 | $ | (1,357,694 | ) | $ | 204,649 | ||||||||||
|
|
|
|||||||||||||||||||||||
| Cumulative GAP |
$ | (57,158 | ) | $ | 235,158 | $ | 681,501 | $ | 1,562,343 | $ | 204,649 | |||||||||||||
|
|
|
|
|
|
|
|
|
|
|
|||||||||||||||
| (1) | Variable rate loans at or below their floor are categorized based on their maturity date. |
| (2) | Excludes amortization of the net deferred loan fees and loan discount accretion. |
| (3) | Includes amortization of the fair value adjustments on these subordinated debentures. |
93
Table of Contents
We also utilize the results of a dynamic simulation model to quantify the estimated exposure of net interest income to sustained interest rate changes. The simulation model estimates the impact of changing interest rates on the interest income from all interest earning assets and the interest expense paid on all interest bearing liabilities reflected on the Company’s consolidated balance sheet. This sensitivity analysis is compared to policy limits, which specify a maximum tolerance level for net interest income exposure over a one-year horizon assuming no balance sheet growth, given a 100 and 400 basis point upward and 200 basis point downward shift in interest rates.
The following depicts the Company’s net interest income sensitivity analysis as of December 31, 2016:
| Simulated Rate Changes |
Estimated Net Interest Income
Sensitivity (dollars in thousands) |
|||||||
| + 400 basis points |
26.6 | % | $ | 25,621 | ||||
| + 100 basis points |
6.6 | % | $ | 6,347 | ||||
| - 200 basis points (1) |
(8.6 | )% | $ | (8,242 | ) | |||
| (1) | The simulated rate change under the -200 basis points reflected above actually reflects only a maximum negative 46 basis points or less decline in actual rates based on the targeted Fed Funds target rate by the government of 0.50% to 0.75%. The -200 simulation model reflects repricing of the Company’s earning assets of between 0% to 0.54% with little to no repricing of the liabilities at the current levels. |
The Company is currently asset sensitive. The estimated sensitivity does not necessarily represent our forecast and the results may not be indicative of actual changes to our net interest income. These estimates are based upon a number of assumptions including: the nature and timing of interest rate levels including yield curve shape, prepayments on loans and securities, pricing strategies on loans and deposits and replacement of asset and liability cash flows. The duration of the Company’s investment securities portfolio at December 31, 2016 is approximately 2.6 years. Management considers the current effective duration to be relatively low and future purchases may increase this measurement if doing so will provide increased earnings while keeping risk low. While the assumptions used are based on current economic and local market conditions, there is no assurance as to the predictive nature of these conditions including how customer preferences or competitor influences might change.
Because of our ratio of rate sensitive assets to rate sensitive liabilities, we tend to benefit from an increasing interest rate market and, conversely, suffer in a decreasing interest rate market. As such, the management of interest rates and inflation through national economic policy may have an impact on our earnings. Increases in interest rates may have a corresponding impact on the ability of borrowers to repay loans with us.
Inflation
The impact of inflation on a financial institution can differ significantly from that exerted on other companies. Banks, as financial intermediaries, have many assets and liabilities that may move in concert with inflation both as to interest rates and value. However, financial institutions are affected by inflation’s impact on non-interest expenses, such as salaries and occupancy expenses.
94
Table of Contents
ITEM 8 — FINANCIAL STATEMENTS AND SUPPLEMENTARY DATA
INDEX TO FINANCIAL STATEMENTS
AND FINANCIAL STATEMENT SCHEDULES
| Page | ||||
| 98 | ||||
| 99 | ||||
| 100 | ||||
| 101 | ||||
| 102 | ||||
| 103 | ||||
| 105 | ||||
ITEM 9 — CHANGES IN AND DISAGREEMENTS WITH ACCOUNTANTS ON ACCOUNTING AND FINANCIAL DISCLOSURE
None.
ITEM 9A — CONTROLS AND PROCEDURES
a) Evaluation of disclosure controls and procedures
The Company conducted an evaluation, under the supervision and with the participation of its management, including its Chief Executive Officer and Chief Financial Officer, of the effectiveness of the design and operation of the disclosure controls and procedures (as defined in Rules 13a-15(e) and 15d-15(e) of the Exchange Act) as of the year ended December 31, 2016. Based upon that evaluation, the Company’s Chief Executive Officer and Chief Financial Officer concluded that the Company’s disclosure controls and procedures are effective in ensuring that information required to be disclosed in reports filed or submitted under the Exchange Act (i) is recorded, processed, summarized and reported within the time periods specified in the SEC’s rules and forms, and; (ii) is accumulated and communicated to the Company’s management, including its Chief Executive Officer and Chief Financial Officer, to allow for management to make timely decisions regarding required disclosure as of December 31, 2016.
b) Changes in internal controls over financial reporting
During the fiscal quarter ending December 31, 2016, there were no changes to the Company’s internal controls over financial reporting (as defined in Rules 13a-15(f) and 15d-15(f) of the Exchange Act) which have materially affected, or are reasonably likely to materially affect, the Company’s internal control over financial reporting.
Management’s Report on Internal Control Over Financial Reporting
The Company’s management is responsible for establishing and maintaining adequate internal control over financial reporting, as defined in Rule 13a-15(f). The Company’s internal control system was designed to provide reasonable assurance to management and the board of directors regarding the effectiveness of its internal control processes over the preparation and fair presentation of published financial statements.
All internal control systems, no matter how well designed, have inherent limitations. Therefore, even those systems determined effective can provide only reasonable assurance with respect to financial statement preparation and presentation.
95
Table of Contents
The Company’s management assessed the effectiveness of its internal controls over financial reporting as of December 31, 2016 based on criteria established in Internal Control-Integrated Framework issued by the Committee of Sponsoring Organizations of the Treadway Commission (COSO) issued in 2013. Based on its assessment, the Company’s management believes that, as of December 31, 2016, the Company’s internal control over financial reporting is effective based on those criteria.
This annual report does not include an attestation report of the Company’s independent registered public accounting firm regarding internal control over financial reporting. Management’s report was not subject to attestation by the Company’s independent registered public accounting firm pursuant to the rules of the Securities and Exchange Commission that permit the Company to provide only management’s report in this annual report.
None.
| ITEM 10 | — DIRECTORS AND EXECUTIVE OFFICERS OF THE REGISTRANT |
Information regarding executive officers is included in Part I of this Form 10-K as permitted by General Instruction G(3).
The additional information required by this item will appear in the Company’s definitive proxy statement for the 2017 Annual Meeting of Stockholders (the “2017 Proxy Statement”), and such information either shall be (i) deemed to be incorporated herein by reference from that portion of the 2017 Proxy Statement, if filed with the SEC pursuant to Regulation 14A not later than 120 days after the end of the Company’s most recently completed fiscal year, or (ii) included in an amendment to this report filed with the SEC on Form 10-K/A not later than the end of such 120 day period.
ITEM 11 — EXECUTIVE COMPENSATION 15
The information required by this item will appear in the 2017 Proxy Statement, and such information either shall be (i) deemed to be incorporated herein by reference from the 2017 Proxy Statement, if filed with the SEC pursuant to Regulation 14A not later than 120 days after the end of the Company’s most recently completed fiscal year, or (ii) included in an amendment to this report filed with the SEC on Form 10-K/A not later than the end of such 120 day period.
ITEM 12 — SECURITY OWNERSHIP OF CERTAIN BENEFICIAL OWNERS AND MANAGEMENT RELATED STOCK HOLDERS MATTERS
See Item 14. below.
ITEM 13 — CERTAIN RELATIONSHIP AND RELATED TRANSACTIONS, AND DIRECTOR INDEPENDENCE
See Item 14. below
ITEM 14 — PRINCIPAL ACCOUNTANT FEES AND SERVICES
Pursuant to General Instruction G(3), the information required to be furnished by ITEMS 12, 13 and 14 of Part III will appear in the 2017 Proxy Statement, and such information either shall be (i) deemed to be
96
Table of Contents
incorporated herein by reference from the 2017 Proxy Statement, if filed with the SEC pursuant to Regulation 14A not later than 120 days after the end of the Company’s most recently completed fiscal year, or (ii) included in an amendment to this report filed with the SEC on Form 10-K/A not later than the end of such 120 day period.
Employee Code of Conduct
CU Bancorp has adopted a Code of Conduct (the CU Bancorp Principles of Business Conduct and Ethics) that applies to all employees, directors and officers, including the Company’s principal executive officer, principal financial and accounting officer. The Code of Conduct is also applicable to the Board of Directors and can also be located on the Company’s website by visiting www.cunb.com under Investor Relations. A copy of the Code of Conduct is available, without charge, upon written request to CU Bancorp, Human Resources, 15821 Ventura Blvd., Suite 100, Encino, CA 91436.
| ITEM 15 | — EXHIBITS AND FINANCIAL STATEMENT SCHEDULES |
| (a) | Documents Filed as Part of this Report |
Financial Statements
Reference is made to the Index to Financial Statements for a list of financial statements filed as part of this Report.
| ITEM 16 | — Form 10-K Summary |
None.
97
Table of Contents
Report of Independent Registered Public Accounting Firm
To the Board of Directors and Shareholders
CU Bancorp
We have audited the accompanying consolidated balance sheets of CU Bancorp and its subsidiaries (the Company) as of December 31, 2016 and 2015, and the related consolidated statements of income, comprehensive income, shareholders’ equity, and cash flows for each of the three years in the period ended December 31, 2016. These consolidated financial statements are the responsibility of the Company’s management. Our responsibility is to express an opinion on these consolidated financial statements based on our audits.
We conducted our audits in accordance with the standards of the Public Company Accounting Oversight Board (United States). Those standards require that we plan and perform the audit to obtain reasonable assurance about whether the financial statements are free of material misstatement. The Company is not required to have, nor were we engaged to perform, an audit of its internal control over financial reporting in accordance with the standards of the Public Company Accounting Oversight Board (United States). Our audits included consideration of internal control over financial reporting as a basis for designing audit procedures that are appropriate in the circumstances, but not for the purpose of expressing an opinion on the effectiveness of the Company’s internal control over financial reporting. Accordingly, we express no such opinion. An audit also includes examining, on a test basis, evidence supporting the amounts and disclosures in the financial statements, assessing the accounting principles used and significant estimates made by management, as well as evaluating the overall financial statement presentation. We believe that our audits provide a reasonable basis for our opinion.
In our opinion, the consolidated financial statements referred to above present fairly, in all material respects, the financial position of the Company as of December 31, 2016 and 2015, and the results of their operations and their cash flows for each of the three years in the period ended December 31, 2016, in conformity with U.S. generally accepted accounting principles.
/s/RSM US LLP
Los Angeles, California
March 15, 2017
98
Table of Contents
CU BANCORP
(Dollars in thousands, except share data)
| December 31, | ||||||||
| 2016 | 2015 | |||||||
| ASSETS |
||||||||
| Cash and due from banks |
$ | 41,281 | $ | 50,960 | ||||
| Interest earning deposits in other financial institutions |
167,789 | 171,103 | ||||||
|
|
|
|
|
|||||
| Total cash and cash equivalents |
209,070 | 222,063 | ||||||
| Certificates of deposit in other financial institutions |
51,245 | 56,860 | ||||||
| Investment securities available-for-sale, at fair value |
469,950 | 315,785 | ||||||
| Investment securities held-to-maturity, at amortized cost |
42,027 | 42,036 | ||||||
|
|
|
|
|
|||||
| Total investment securities |
511,977 | 357,821 | ||||||
| Loans |
2,050,226 | 1,833,163 | ||||||
| Allowance for loan loss |
(19,374 | ) | (15,682 | ) | ||||
|
|
|
|
|
|||||
| Net loans |
2,030,852 | 1,817,481 | ||||||
| Premises and equipment, net |
4,184 | 5,139 | ||||||
| Deferred tax assets, net |
17,181 | 17,033 | ||||||
| Other real estate owned, net |
— | 325 | ||||||
| Goodwill |
64,603 | 64,603 | ||||||
| Core deposit and leasehold right intangibles, net |
6,300 | 7,671 | ||||||
| Bank owned life insurance |
51,216 | 49,912 | ||||||
| Accrued interest receivable and other assets |
48,132 | 35,734 | ||||||
|
|
|
|
|
|||||
| Total Assets |
$ | 2,994,760 | $ | 2,634,642 | ||||
|
|
|
|
|
|||||
| LIABILITIES AND SHAREHOLDERS’ EQUITY |
||||||||
| LIABILITIES |
||||||||
| Non-interest bearing demand deposits |
$ | 1,400,097 | $ | 1,288,085 | ||||
| Interest bearing transaction accounts |
332,702 | 261,123 | ||||||
| Money market and savings deposits |
845,110 | 679,081 | ||||||
| Certificates of deposit |
29,480 | 58,502 | ||||||
|
|
|
|
|
|||||
| Total deposits |
2,607,389 | 2,286,791 | ||||||
| Securities sold under agreements to repurchase |
18,816 | 14,360 | ||||||
| Subordinated debentures, net |
9,856 | 9,697 | ||||||
| Accrued interest payable and other liabilities |
20,514 | 16,987 | ||||||
|
|
|
|
|
|||||
| Total Liabilities |
2,656,575 | 2,327,835 | ||||||
|
|
|
|
|
|||||
| Commitments and Contingencies (Note 7 and Note 21) |
||||||||
| SHAREHOLDERS’ EQUITY |
||||||||
| Serial Preferred Stock – authorized, 50,000,000 shares: |
16,955 | 16,995 | ||||||
| Common stock – authorized, 75,000,000 shares no par value, 17,759,006 and 17,175,389 shares issued and outstanding at December 31, 2016 and 2015, respectively |
235,873 | 230,688 | ||||||
| Additional paid-in capital |
25,213 | 23,017 | ||||||
| Retained earnings |
63,163 | 36,923 | ||||||
| Accumulated other comprehensive loss, net of tax |
(3,019 | ) | (816 | ) | ||||
|
|
|
|
|
|||||
| Total Shareholders’ Equity |
338,185 | 306,807 | ||||||
|
|
|
|
|
|||||
| Total Liabilities and Shareholders’ Equity |
$ | 2,994,760 | $ | 2,634,642 | ||||
|
|
|
|
|
|||||
The accompanying notes are an integral part of these consolidated financial statements.
99
Table of Contents
CU BANCORP
CONSOLIDATED STATEMENTS OF INCOME
(Dollars in thousands, except per share data)
| Years Ended December 31, |
||||||||||||
| 2016 | 2015 | 2014 | ||||||||||
| Interest Income |
||||||||||||
| Interest and fees on loans |
$ | 93,589 | $ | 84,537 | $ | 51,882 | ||||||
| Interest on investment securities |
5,793 | 4,518 | 2,369 | |||||||||
| Interest on interest bearing deposits in other financial institutions |
1,870 | 1,087 | 926 | |||||||||
|
|
|
|
|
|
|
|||||||
| Total Interest Income |
101,252 | 90,142 | 55,177 | |||||||||
|
|
|
|
|
|
|
|||||||
| Interest Expense |
||||||||||||
| Interest on interest bearing transaction accounts |
416 | 413 | 278 | |||||||||
| Interest on money market and savings deposits |
2,051 | 1,652 | 963 | |||||||||
| Interest on certificates of deposit |
139 | 190 | 216 | |||||||||
| Interest on securities sold under agreements to repurchase |
53 | 30 | 34 | |||||||||
| Interest on subordinated debentures |
487 | 438 | 431 | |||||||||
|
|
|
|
|
|
|
|||||||
| Total Interest Expense |
3,146 | 2,723 | 1,922 | |||||||||
|
|
|
|
|
|
|
|||||||
| Net Interest Income |
98,106 | 87,419 | 53,255 | |||||||||
| Provision for loan losses |
3,264 | 5,080 | 2,239 | |||||||||
|
|
|
|
|
|
|
|||||||
| Net Interest Income After Provision For Loan Losses |
94,842 | 82,339 | 51,016 | |||||||||
|
|
|
|
|
|
|
|||||||
| Non-Interest Income |
||||||||||||
| Gain (loss) on sale of securities, net |
258 | 112 | (47 | ) | ||||||||
| Gain on sale of SBA loans, net |
1,359 | 1,797 | 1,221 | |||||||||
| Deposit account service charge income |
4,814 | 4,644 | 2,744 | |||||||||
| Other non-interest income |
5,581 | 5,177 | 3,791 | |||||||||
|
|
|
|
|
|
|
|||||||
| Total Non-Interest Income |
12,012 | 11,730 | 7,709 | |||||||||
|
|
|
|
|
|
|
|||||||
| Non-Interest Expense |
||||||||||||
| Salaries and employee benefits (includes stock based compensation expense of $3,567, $2,966 and $1,699 for the years ended December 31, 2016, 2015 and 2014, respectively) |
40,852 | 37,955 | 26,519 | |||||||||
| Occupancy |
6,039 | 5,792 | 4,112 | |||||||||
| Data processing |
2,594 | 2,495 | 1,968 | |||||||||
| Legal and professional |
3,782 | 2,411 | 2,006 | |||||||||
| FDIC deposit assessment |
1,425 | 1,466 | 844 | |||||||||
| Merger expenses |
— | 498 | 2,302 | |||||||||
| OREO loss and expenses |
85 | 245 | 15 | |||||||||
| Office services expenses |
1,488 | 1,526 | 1,026 | |||||||||
| Other operating expenses |
7,179 | 7,577 | 4,593 | |||||||||
|
|
|
|
|
|
|
|||||||
| Total Non-Interest Expense |
63,444 | 59,965 | 43,385 | |||||||||
|
|
|
|
|
|
|
|||||||
| Net Income Before Provision for Income Tax Expense |
43,410 | 34,104 | 15,340 | |||||||||
| Provision for income tax expense |
15,953 | 12,868 | 6,432 | |||||||||
|
|
|
|
|
|
|
|||||||
| Net Income |
27,457 | 21,236 | 8,908 | |||||||||
| Preferred stock dividends and discount accretion or premium amortization |
1,217 | 1,174 | 124 | |||||||||
|
|
|
|
|
|
|
|||||||
| Net Income available to Common Shareholders |
$ | 26,240 | $ | 20,062 | $ | 8,784 | ||||||
|
|
|
|
|
|
|
|||||||
| Earnings Per Share |
||||||||||||
| Basic earnings per share |
$ | 1.52 | $ | 1.21 | $ | 0.77 | ||||||
| Diluted earnings per share |
$ | 1.50 | $ | 1.18 | $ | 0.75 | ||||||
The accompanying notes are an integral part of these consolidated financial statements.
100
Table of Contents
CU BANCORP
CONSOLIDATED STATEMENTS OF COMPREHENSIVE INCOME
(Dollars in thousands)
| Years
Ended December 31, |
||||||||||||
| 2016 | 2015 | 2014 | ||||||||||
| Net Income |
$ | 27,457 | $ | 21,236 | $ | 8,908 | ||||||
| Other Comprehensive Income (Loss), net of tax: |
||||||||||||
| Net change in unrealized gain (loss) on available-for-sale investment securities, net of tax |
(2,053 | ) | (941 | ) | 368 | |||||||
| Reclassification of (gain) loss on investment securities available-for-sale to net income, net of tax |
(150 | ) | (65 | ) | 27 | |||||||
|
|
|
|
|
|
|
|||||||
| Other Comprehensive Income (Loss) |
(2,203 | ) | (1,006 | ) | 395 | |||||||
|
|
|
|
|
|
|
|||||||
| Comprehensive Income |
$ | 25,254 | $ | 20,230 | $ | 9,303 | ||||||
|
|
|
|
|
|
|
|||||||
The accompanying notes are an integral part of these consolidated financial statements.
101
Table of Contents
CU BANCORP
CONSOLIDATED STATEMENTS OF SHAREHOLDERS’ EQUITY
Three Years Ended December 31, 2016
(Dollars in thousands)
| Serial Preferred Stock | Common Stock | |||||||||||||||||||||||||||||||
| Issued and Outstanding Shares |
Amount | Issued and Outstanding Shares |
Amount | Additional Paid-in Capital |
Retained Earnings |
Accumulated Other Comprehensive Income (Loss) |
Total Shareholders’ Equity |
|||||||||||||||||||||||||
| Balance at December 31, 2013 |
— | $ | — | 11,081,364 | $ | 121,675 | $ | 8,377 | $ | 8,077 | $ | (205 | ) | $ | 137,924 | |||||||||||||||||
|
|
|
|
|
|
|
|
|
|
|
|
|
|
|
|
|
|||||||||||||||||
| Net issuance of restricted stock |
— | 167,384 | — | — | — | — | — | |||||||||||||||||||||||||
| Exercise of stock options |
— | — | 221,016 | 2,029 | — | — | — | 2,029 | ||||||||||||||||||||||||
| Issuance of preferred stock for 1st Enterprise merger, net of fair value discount |
16,400 | 15,921 | — | — | — | — | — | 15,921 | ||||||||||||||||||||||||
| Issuance of common stock for 1st Enterprise merger, net of $27 of issuance costs |
— | — | 5,240,409 | 102,685 | — | — | — | 102,685 | ||||||||||||||||||||||||
| Issuance of replacement stock options for 1st Enterprise merger |
— | — | — | — | 9,561 | — | — | 9,561 | ||||||||||||||||||||||||
| Stock based compensation expense |
— | — | — | — | 1,699 | — | — | 1,699 | ||||||||||||||||||||||||
| Restricted stock repurchase |
— | — | (26,317 | ) | — | (471 | ) | — | — | (471 | ) | |||||||||||||||||||||
| Excess tax benefit – stock based compensation |
— | — | — | — | 582 | — | — | 582 | ||||||||||||||||||||||||
| Preferred stock dividends and discount accretion |
— | 83 | — | — | — | (124 | ) | — | (41 | ) | ||||||||||||||||||||||
| Net income |
— | — | — | — | — | 8,908 | — | 8,908 | ||||||||||||||||||||||||
| Other comprehensive income |
— | — | — | — | — | — | 395 | 395 | ||||||||||||||||||||||||
|
|
|
|
|
|
|
|
|
|
|
|
|
|
|
|
|
|||||||||||||||||
| Balance at December 31, 2014 |
16,400 | 16,004 | 16,683,856 | 226,389 | 19,748 | 16,861 | 190 | 279,192 | ||||||||||||||||||||||||
|
|
|
|
|
|
|
|
|
|
|
|
|
|
|
|
|
|||||||||||||||||
| Net issuance of restricted stock |
— | — | 81,825 | — | — | — | — | — | ||||||||||||||||||||||||
| Exercise of stock options |
— | — | 454,019 | 4,299 | — | — | — | 4,299 | ||||||||||||||||||||||||
| Stock based compensation expense |
— | — | — | — | 2,966 | — | — | 2,966 | ||||||||||||||||||||||||
| Restricted stock repurchase |
— | — | (44,311 | ) | — | (971 | ) | — | — | (971 | ) | |||||||||||||||||||||
| Excess tax benefit – stock based compensation |
— | — | — | — | 1,274 | — | — | 1,274 | ||||||||||||||||||||||||
| Preferred stock dividends and discount accretion |
— | 991 | — | — | — | (1,174 | ) | — | (183 | ) | ||||||||||||||||||||||
| Net income |
— | — | — | — | — | 21,236 | — | 21,236 | ||||||||||||||||||||||||
| Other comprehensive loss |
— | — | — | — | — | — | (1,006 | ) | (1,006 | ) | ||||||||||||||||||||||
|
|
|
|
|
|
|
|
|
|
|
|
|
|
|
|
|
|||||||||||||||||
| Balance at December 31, 2015 |
16,400 | 16,995 | 17,175,389 | 230,688 | 23,017 | 36,923 | (816 | ) | 306,807 | |||||||||||||||||||||||
|
|
|
|
|
|
|
|
|
|
|
|
|
|
|
|
|
|||||||||||||||||
| Net issuance of restricted stock |
— | — | 130,934 | — | — | — | — | — | ||||||||||||||||||||||||
| Exercise of stock options |
— | — | 505,274 | 5,185 | — | — | — | 5,185 | ||||||||||||||||||||||||
| Stock based compensation expense |
— | — | — | — | 3,567 | — | — | 3,567 | ||||||||||||||||||||||||
| Restricted stock repurchase |
— | — | (52,591 | ) | — | (1,371 | ) | — | — | (1,371 | ) | |||||||||||||||||||||
| Preferred stock dividends and net premium amortization |
— | (40 | ) | — | — | — | (1,217 | ) | — | (1,257 | ) | |||||||||||||||||||||
| Net income |
— | — | — | — | — | 27,457 | — | 27,457 | ||||||||||||||||||||||||
| Other comprehensive loss |
— | — | — | — | — | — | (2,203 | ) | (2,203 | ) | ||||||||||||||||||||||
|
|
|
|
|
|
|
|
|
|
|
|
|
|
|
|
|
|||||||||||||||||
| Balance at December 31, 2016 |
16,400 | $ | 16,955 | 17,759,006 | $ | 235,873 | $ | 25,213 | $ | 63,163 | $ | (3,019 | ) | $ | 338,185 | |||||||||||||||||
|
|
|
|
|
|
|
|
|
|
|
|
|
|
|
|
|
|||||||||||||||||
The accompanying notes are an integral part of these consolidated financial statements.
102
Table of Contents
CU BANCORP
CONSOLIDATED STATEMENTS OF CASH FLOWS
(Dollars in thousands)
| Years Ended December 31, | ||||||||||||
| 2016 | 2015 | 2014 | ||||||||||
| Cash flows from operating activities: |
||||||||||||
| Net income: |
$ | 27,457 | $ | 21,236 | $ | 8,908 | ||||||
| Adjustments to reconcile net income to net cash provided by operating activities: |
||||||||||||
| Provision for loan losses |
3,264 | 5,080 | 2,239 | |||||||||
| Provision for losses on unfunded loan commitments |
277 | 137 | 142 | |||||||||
| Stock based compensation expense |
3,567 | 2,966 | 1,699 | |||||||||
| Depreciation |
1,407 | 1,424 | 1,019 | |||||||||
| Net accretion of discounts/premiums for loans acquired and deferred loan fees/costs |
(8,886 | ) | (9,365 | ) | (5,360 | ) | ||||||
| Net amortization from investment securities |
4,550 | 3,305 | 1,677 | |||||||||
| Increase in bank owned life insurance |
(1,304 | ) | (1,180 | ) | (661 | ) | ||||||
| Amortization of core deposit intangibles |
1,280 | 1,680 | 391 | |||||||||
| Amortization of time deposit premium |
(2 | ) | (15 | ) | (42 | ) | ||||||
| Net (accretion) amortization of leasehold right intangible asset and liabilities |
(205 | ) | (21 | ) | 142 | |||||||
| Accretion of subordinated debenture discount |
159 | 159 | 159 | |||||||||
| Loss on disposal of fixed assets |
30 | 92 | 7 | |||||||||
| Valuation write-downs on OREO |
— | 133 | — | |||||||||
| Loss on sale of OREO |
14 | — | — | |||||||||
| Loss (gain) on sale of securities, net |
(258 | ) | (112 | ) | 47 | |||||||
| Gain on sale of SBA loans, net |
(1,359 | ) | (1,797 | ) | (1,221 | ) | ||||||
| Decrease in deferred tax assets |
1,450 | 675 | 732 | |||||||||
| Decrease (increase) in accrued interest receivable and other assets |
(12,398 | ) | 456 | 2,428 | ||||||||
| Increase (decrease) in accrued interest payable and other liabilities |
4,884 | (1,964 | ) | 2,041 | ||||||||
| Net excess in tax benefit on stock compensation |
— | (1,274 | ) | (582 | ) | |||||||
| Decrease in fair value of derivative swap liability |
(1,338 | ) | (251 | ) | (1,147 | ) | ||||||
|
|
|
|
|
|
|
|||||||
| Net cash provided by operating activities |
22,589 | 21,364 | 12,618 | |||||||||
|
|
|
|
|
|
|
|||||||
| Cash flows from investing activities: |
||||||||||||
| Cash and cash equivalents acquired in acquisition, net of cash paid |
— | — | 8,650 | |||||||||
| Purchases of investment securities |
(253,990 | ) | (134,688 | ) | (52,042 | ) | ||||||
| Proceeds from sales of investment securities |
6,919 | 5,737 | 25,156 | |||||||||
| Proceeds from repayment and maturities from investment securities |
84,821 | 40,310 | 23,080 | |||||||||
| Loans originated, net of principal payments |
(206,389 | ) | (200,739 | ) | (132,846 | ) | ||||||
| Purchases of premises and equipment |
(482 | ) | (1,278 | ) | (1,042 | ) | ||||||
| Proceeds from sale of OREO |
311 | 717 | — | |||||||||
| Net decrease (increase) in certificates of deposit in other financial institutions |
5,615 | 19,573 | (4,572 | ) | ||||||||
| Purchase of bank owned life insurance |
— | (10,000 | ) | — | ||||||||
|
|
|
|
|
|
|
|||||||
| Net cash used in investing activities |
(363,195 | ) | (280,368 | ) | (133,616 | ) | ||||||
|
|
|
|
|
|
|
|||||||
| Cash flows from financing activities: |
||||||||||||
| Net increase in non-interest bearing demand deposits |
112,012 | 255,451 | 67,591 | |||||||||
| Net increase in interest bearing transaction accounts |
71,579 | 54,579 | 8,033 | |||||||||
| Net increase (decrease) in money market and savings deposits |
166,029 | 35,406 | (55,236 | ) | ||||||||
| Net decrease in certificates of deposit |
(29,020 | ) | (6,323 | ) | (8,433 | ) | ||||||
| Net increase (decrease) in securities sold under agreements to repurchase |
4,456 | 4,949 | (1,730 | ) | ||||||||
| Net proceeds from stock options exercised |
5,185 | 4,299 | 2,029 | |||||||||
| Issuance costs of common stock for 1st Enterprise merger |
— | — | (27 | ) | ||||||||
| Restricted stock repurchase |
(1,371 | ) | (971 | ) | (471 | ) | ||||||
| Dividends paid on preferred stock |
(1,257 | ) | (183 | ) | (41 | ) | ||||||
| Net excess in tax benefit on stock compensation |
— | 1,274 | 582 | |||||||||
|
|
|
|
|
|
|
|||||||
| Net cash provided by financing activities |
327,613 | 348,481 | 12,297 | |||||||||
|
|
|
|
|
|
|
|||||||
| Net increase (decrease) in cash and cash equivalents |
(12,993 | ) | 89,477 | (108,701 | ) | |||||||
| Cash and cash equivalents, beginning of year |
222,063 | 132,586 | 241,287 | |||||||||
|
|
|
|
|
|
|
|||||||
| Cash and cash equivalents, end of year |
$ | 209,070 | $ | 222,063 | $ | 132,586 | ||||||
|
|
|
|
|
|
|
|||||||
103
Table of Contents
CU BANCORP
CONSOLIDATED STATEMENTS OF CASH FLOWS (Continued)
(Dollars in thousands)
| Years Ended December 31, | ||||||||||||
| 2016 | 2015 | 2014 | ||||||||||
| Supplemental disclosures of cash flow information: |
||||||||||||
| Cash paid during the year for interest |
$ | 3,333 | $ | 2,877 | $ | 1,801 | ||||||
| Net cash paid during the year for taxes |
$ | 12,632 | $ | 11,567 | $ | 3,725 | ||||||
| Supplemental disclosures of non-cash investing activities: |
||||||||||||
| Net change in unrealized gains (losses) on investment securities, net of tax |
$ | (2,053 | ) | $ | (941 | ) | $ | 368 | ||||
| Loans transferred to other real estate owned |
$ | — | $ | 325 | $ | 850 | ||||||
| Supplemental disclosures related to acquisitions: |
||||||||||||
| Assets acquired |
$ | — | $ | — | $ | 833,497 | ||||||
| Liabilities assumed |
$ | — | $ | — | $ | 705,214 | ||||||
| Issuance of 16,400 shares of preferred stock |
$ | — | $ | — | $ | 15,921 | ||||||
| Cash paid for fractional and dissenter shares and stock options |
$ | — | $ | — | $ | 89 | ||||||
The accompanying notes are an integral part of these consolidated financial statements
104
Table of Contents
CU BANCORP
NOTES TO CONSOLIDATED FINANCIAL STATEMENTS
December 31, 2016
Note 1 – Summary of Significant Accounting Policies
CU Bancorp (the “Company”) is a bank holding company whose operating subsidiary is California United Bank. As a bank holding company, CU Bancorp is subject to regulation of the Federal Reserve Board (“FRB”). The term “Company”, as used throughout this document, refers to the consolidated financial statements of CU Bancorp and California United Bank.
California United Bank (the “Bank”) is a full-service commercial business bank offering a broad range of banking products and services including: deposit services, lending and cash management to small and medium-sized businesses, to non-profit organizations, to business principals and entrepreneurs, to the professional community, including attorneys, certified public accountants, financial advisors, healthcare providers and investors. The Bank opened for business in 2005. Its headquarters office is located in Los Angeles, California. As a state chartered non-member bank, the Bank is subject to regulation by the California Department of Business Oversight (“DBO”) and the Federal Deposit Insurance Corporation (“FDIC”). The deposits of the Bank are insured by the FDIC to the maximum amount allowed by law.
Basis of Financial Statement Presentation
The consolidated financial statements include the accounts of the Company and the Bank. Significant intercompany items have been eliminated in consolidation. The accounting and reporting policies of the Company conform to U.S. generally accepted accounting principles (“GAAP”) and pursuant to the rules and regulations of the Securities and Exchange Commission.
CU Bancorp is the common shareholder of Premier Commercial Statutory Trust I, Premier Commercial Statutory Trust II and Premier Commercial Statutory Trust III. These trusts were established for the sole purpose of issuing trust preferred securities and do not meet the criteria for consolidation. For more detail, see Note 13 – Borrowings and Subordinated Debentures.
Use of Estimates in the Preparation of Consolidated Financial Statements
The preparation of consolidated financial statements in conformity with GAAP requires management to make estimates and assumptions that affect the reported amounts of assets and liabilities and the amounts of revenues and expenses during the reporting period. Actual results could differ from those estimates. In addition, these accounting principles require the disclosure of contingent assets and liabilities as of the date of the consolidated financial statements.
Estimates that are particularly susceptible to significant change relate to the determination of the allowance for loan loss and various assets and liabilities measured at fair value on a recurring and nonrecurring basis. While management uses the most current available information to recognize losses on loans, future additions to the allowance for loan loss may be necessary based on, among other factors, changes in local economic conditions.
Business Combinations
The Company has a number of fair value adjustments recorded within the consolidated financial statements at December 31, 2016 that relate to the business combinations with California Oaks State Bank “COSB”, Premier Commercial Bancorp “PC Bancorp” and 1st Enterprise Bank “1st Enterprise” on December 31, 2010, July 31, 2012 and November 30, 2014, respectively. These fair value adjustments includes goodwill, fair value adjustments on loans, core deposit intangible assets, other intangible assets, fair value adjustments to acquired
105
Table of Contents
lease obligations, fair value adjustments to certificates of deposit and fair value adjustments on derivatives. The assets and liabilities acquired through acquisitions have been accounted for at fair value as of the date of the acquisition. The goodwill that was recorded on the transactions represented the excess of the purchase price over the fair value of net assets acquired.
Business Segments
The Company is organized and operates as a single reporting segment, principally engaged in commercial business banking. The Company conducts its lending and deposit operations through nine full service branch offices located in Los Angeles, Orange, Ventura and San Bernardino counties.
Cash and Cash Equivalents
Within the Consolidated Statements of Cash Flows, cash and cash equivalents include cash, due from banks and interest earning deposits in other financial institutions. Cash flows from loans, deposits, securities sold under agreements to repurchase and certificates of deposit in other financial institutions are reported on a net basis.
Restricted Cash
Banking regulations require that all banks maintain a percentage of their deposits as reserves in cash or on deposit with the Federal Reserve Bank. Reserve balances of $16 million and $14 million were required by the Federal Reserve Bank of San Francisco as of December 31, 2016 and 2015, respectively. As of December 31, 2016, the Bank was in compliance with all known U.S. Federal Reserve Bank (“Federal Reserve”) reporting and reserve requirements. The Company’s restricted cash is included in interest earning deposits in other financial institutions on the accompanying consolidated balance sheets.
Interest Earning Deposits in Other Financial Institutions
Interest earning deposits in other financial institutions represent short term interest earning deposits, which include money market deposit accounts with other financial institutions, and interest earning deposits with the Federal Reserve. These deposits can generally provide the Company with immediate liquidity and generally can be liquidated the same day as is the case with the Federal Reserve within seven days on money market deposit accounts with other financial institutions.
Certificates of Deposit in Other Financial Institutions
The Company’s investments in certificates of deposit issued by other financial institutions are generally fully insured by the FDIC up to the applicable limit of $250 thousand and have an original maturity of up to 12 months. The current remaining maturities of the Company’s certificates of deposit in other financial institutions at December 31, 2016 range from 4 days to 12 months with a weighted average maturity of 6.2 months and a weighted average yield of 0.97%. At December 31, 2016 and 2015, the Company had $2.7 million of certificates of deposits pledged as collateral for its interest rate swap agreements with one counterparty bank.
Concentrations and Credit Risk in Other Financial Institutions
The Company maintains certain deposits in other financial institutions in amounts that exceed federal deposit insurance coverage. At December 31, 2016, the amount of deposits in other financial institutions that the Company did not maintain with either the Federal Reserve Bank or the Federal Home Loan Bank and were not covered by FDIC insurance was $38 million in non-interest bearing accounts, $70 million in interest bearing accounts, and $2.7 million in certificates of deposit in other financial institutions. Based on management’s evaluation of the credit risk of maintaining balances and transactions with these correspondent financial institutions, management does not believe that the Company is exposed to any significant credit risk on these balances.
106
Table of Contents
Investment Securities
The Company currently classifies its investment securities under the available-for-sale and held-to-maturity classifications. Under the available-for-sale classification, securities can be sold in response to certain conditions, such as changes in interest rates, changes in the credit quality of the securities, when the credit quality of a security does not conform with current investment policy guidelines, fluctuations in deposit levels or loan demand or a need to restructure the portfolio to better match the maturity or interest rate characteristics of liabilities with assets. Securities classified as available-for-sale are accounted for at their current fair value rather than amortized cost. Unrealized gains or losses are excluded from net income and reported as a separate component of accumulated other comprehensive income (loss) included in shareholders’ equity. If the Company has the intent and the ability at the time of purchase to hold certain securities until maturity, they are classified as held-to-maturity and are stated at amortized cost.
As of each reporting date, the Company evaluates the securities portfolio to determine if there has been an other-than-temporary impairment (“OTTI”) on each of the individual securities in the investment securities portfolio. If it is probable that the Company will be unable to collect all amounts due according to the contractual terms of a debt security not impaired at acquisition, an OTTI shall be considered to have occurred. Once an OTTI is considered to have occurred, the credit portion of the loss is required to be recognized in current earnings, while the non-credit portion of the loss is recorded as a separate component of shareholders’ equity.
In estimating whether an other-than-temporary impairment loss has occurred, management considers, among other things, (i) the length of time and the extent to which the fair value has been less than cost, (ii) the financial condition and near-term prospects of the issuer, (iii) the current liquidity and volatility of the market for each of the individual security categories, (iv) the current slope and shape of the Treasury yield curve, along with where the economy is in the current interest rate cycle, (v) the spread differential between the current spread and the long-term average spread for that security category, (vi) the projected cash flows from the specific security type, (vii) any financial guarantee and financial condition of the guarantor and (viii) the intent and ability of the Company to retain its investment in the issue for a period of time sufficient to allow for any anticipated recovery in fair value.
If it’s determined that an OTTI exists on a debt security, the Company then determines if (a) it intends to sell the security or (b) it is more likely than not that it will be required to sell the security before its anticipated recovery. If either of the conditions is met, the Company will recognize the amount of the OTTI in earnings equal to the difference between the security’s fair value and its adjusted cost basis. If neither of the conditions is met, the Company determines (a) the amount of the impairment related to credit loss and (b) the amount of the impairment due to all other factors. The difference between the present value of the cash flows expected to be collected and the amortized cost basis is the credit loss. The credit loss is the portion of the other-than-temporary impairment that is recognized in earnings and is a reduction to the cost basis of the security. The portion of total impairment related to all other factors is included in other comprehensive income. Significant judgment is required in this analysis that includes, but is not limited to assumptions regarding the collectability of principal and interest, future default rates, future prepayment speeds, the amount of current delinquencies that will result in defaults and the amount of eventual recoveries expected on the underlying collateral.
Realized gains and losses on sales of securities are recognized in earnings at the time of sale and are determined on a specific-identification basis. Purchase premiums and discounts are recognized in interest income using the interest method over the expected maturity term of the securities. For mortgage-backed securities, the amortization or accretion is based on estimated average lives of the securities. The lives of these securities can fluctuate based on the amount of prepayments received on the underlying collateral of the securities. The amount of prepayments varies from time to time based on the interest rate environment and the rate of turnover of mortgages. The Company’s investment in the common stock of Pacific Coast Bankers Bank (“PCBB”) and The Independent Banker’s Bank (“TIB”) is carried at cost, evaluated for impairment and is included in other assets on the accompanying consolidated balance sheets.
107
Table of Contents
Federal Home Loan Bank Stock
As a member of the Federal Home Loan Bank of San Francisco (“FHLB”), the Bank is required to maintain an investment in capital stock of the FHLB. The stock does not have a readily determinable fair value and as such is carried at cost and evaluated for impairment. The stock’s value is determined by the ultimate recoverability of the par value rather than by recognizing temporary declines. The determination of whether the par value will ultimately be recovered is influenced by criteria such as the following: (a) the significance of the changes in (increases or declines) in the net assets of the FHLB as compared to the capital stock amount and the length of time these changes (situation) has persisted, (b) commitments by the FHLB to make payments required by law or regulation and the level of such payments in relation to the operating performance, (c) the impact of legislative and regulatory changes on the customer base of the FHLB and (d) the liquidity position of the FHLB.
The Company’s investment in FHLB stock is included in other assets on the accompanying consolidated balance sheets.
Loans and Interest and Fees on Loans
The Company extends commercial, Small Business Administration, commercial real estate, construction and personal loans to business principals and entrepreneurs, to small and medium-sized businesses, to non-profit organizations, to the professional community, including attorneys, certified public accountants, financial advisors, healthcare providers, and to investors. Loans that the Company has the ability and intent to hold until maturity are stated at the their outstanding unpaid principal balances net of charge offs, net of deferred loan fees and costs on originated loans, net of unearned discounts and unamortized premiums on acquired loans, and further reduced by the valuation allowance for loan losses. Nonrefundable loan fees and direct costs associated with the origination of loans are deferred and recognized in interest income over the loan term using the level yield method. Further, discounts or premiums on acquired loans are accreted or amortized to interest income using the level yield method.
Interest on loans is accrued daily and credited to income based on the principal amount outstanding. Interest is calculated using the terms of the loan according to the contractual note agreements. A small number of commercial real estate loans have been identified and designated as hedged items by the Company. For a detailed discussion of the accounting related to the loans designated as hedged items, see Note 1 – Summary of Significant Accounting Policies under “Derivative Financial Instruments and Hedging Activity” and Note 14 – Derivative Financial Instruments.
Nonaccrual loans: For all loan types, when a borrower discontinues making payments as contractually required by the note, the Company must determine whether it is appropriate to continue to accrue interest. Generally, the Company places loans in a nonaccrual status and the accrual of interest on loans is discontinued when the loan has become delinquent by more than 90 days or when management determines that the full repayment of principal and collection of interest is unlikely. The Company may decide to continue to accrue interest on certain loans more than 90 days delinquent, if the loan is well secured by collateral and in the process of collection.
When a loan is placed on nonaccrual status or has been charged-off, all interest income that has been accrued but not yet collected is reversed against interest income. Subsequent payments received from the customer are applied to principal and no further interest income is recognized until the principal has been paid in full or until circumstances have changed such that payments are again consistently received as contractually required.
Impaired loans: A loan is identified as impaired when it is probable that interest and principal will not be collected according to the contractual terms of the original loan agreement. Generally, these loans are rated substandard or worse. Most impaired loans are classified as nonaccrual. However, there are some loans that are
108
Table of Contents
designated impaired due to doubt regarding collectability according to contractual terms, but are both fully secured by collateral and are current in their interest and principal payments. These impaired loans that are not classified as nonaccrual continue to pay as agreed. Impaired loans are measured for allowance requirements based on the present value of expected future cash flows discounted at the loan’s effective interest rate or, as a practical expedient, at the loan’s observable market price or the fair value of the collateral if the loan is collateral dependent. The amount of an impairment allowance, if any, and any subsequent changes are charged against the allowance for loan loss. Factors that contribute to a performing loan being classified as impaired include payment status, collateral value, probability of collecting scheduled payments, delinquent taxes, and debts to other lenders that cannot be serviced out of existing cash flow.
Troubled debt restructurings: A loan is classified as a troubled debt restructuring when a borrower experiences financial difficulties that lead to a restructuring of the loan, and the Company grants concessions to the borrower in the restructuring that it would not otherwise consider. The loan terms which have been modified or restructured due to a borrower’s financial difficulty may include a reduction in the stated interest rate, an extension of the maturity at an interest rate below current market interest rates, a reduction in the face amount of the debt (principal forgiveness), a reduction in the accrued interest, or re-aging, extensions, deferrals, renewals, rewrites and other actions intended to minimize potential losses.
Troubled debt restructurings are considered impaired loans and are evaluated for impairment, with the appropriate allowance for loan loss.
In determining whether a debtor is experiencing financial difficulties, the Company considers if the debtor is in payment default or would be in payment default in the foreseeable future without the modification, the debtor declared or is in the process of declaring bankruptcy, there is substantial doubt that the debtor will continue as a going concern, the debtor’s entity-specific projected cash flows will not be sufficient to service its debt, or the debtor cannot obtain funds from sources other than the existing creditors at a market rate for debt with similar risk characteristics.
In determining whether the Company would grant a concession, the Company assesses, if it does not expect to collect all amounts due, whether the current value of the collateral will satisfy the amounts owed, whether additional collateral or guarantees from the debtor will serve as adequate compensation for other terms of the restructuring, and whether the debtor otherwise has access to funds at a market rate for debt with similar risk characteristics. Typical concessions include reductions to the stated interest rate, payment extensions, principal forgiveness and other actions.
A loan that is modified at a market rate of interest will not be classified as a troubled debt restructuring in the calendar year subsequent to the restructuring if it is in compliance with the modified terms and the expectation exists for continued performance going forward. Payment performance prior and subsequent to the restructuring is taken into account in assessing whether it is likely that the borrower can meet the new terms. This may result in the loan being returned to accrual at the time of restructuring, however the Company generally requires a period of sustained repayment for at least six months for return to accrual status.
Purchased Credit Impaired Loans: Loans acquired through acquisition are recorded at fair value at acquisition date without a carryover of the related Allowance. Purchased Credit Impaired (“PCI”) loans are acquired loans with evidence of deterioration of credit quality since origination and it is probable, at the acquisition date, that the Company will not be able to collect all contractually required amounts. When the timing and/or amounts of expected cash flows on such loans are not reasonably estimable, no interest is accreted and the loan is reported as a non-accrual loan; otherwise, if the timing and amounts of expected cash flows for PCI loans are reasonably estimable, then interest is accreted and the loans are reported as accruing loans. The non-accretable difference represents the difference between the undiscounted contractual cash flows and the undiscounted expected cash flows, and also reflects the estimated credit losses in the acquired loan portfolio at the acquisition date and can fluctuate due to changes in expected cash flows during the life of the PCI loans. For
109
Table of Contents
non-PCI loans, loan fair value adjustments consist of an interest rate premium or discount on each individual loan and are amortized to loan interest income based on the effective yield method over the remaining life of the loans. Subsequent decreases to the expected cash flows for both PCI and non-PCI loans will result in a provision for loan losses.
Loans Held for Sale and Servicing Assets
Loans held for sale are loans originated by the Company and include the principal amount outstanding net of unearned income and the loans are carried at the lower of cost or fair value on an aggregate basis. A decline in the aggregate fair value of the loans below their aggregate carrying amount is recognized through a charge to earnings in the period of such decline. Unearned income on these loans is taken into earnings when they are sold. At December 31, 2016 and 2015, the Company had no loans classified as held for sale.
Gains or losses resulting from sales of loans are recognized at the date of settlement and are based on the difference between the cash received and the carrying value of the related loans less transaction costs. A transfer of financial assets in which control is surrendered is accounted for as a sale to the extent that consideration other than beneficial interests in the transferred assets is received in the exchange. Assets, liabilities, derivative financial instruments, or other retained interests issued or obtained through the sale of financial assets are measured at estimated fair value, if practicable.
The most common retained interest related to loan sales is a servicing asset. Servicing assets are amortized in proportion to and over the period of the estimated future net servicing income. The amortization of the servicing asset and the servicing income are included in non-interest income. The fair value of the servicing assets is estimated by discounting the future cash flows using market-based discount rates and prepayment speeds. The Company’s servicing asset is evaluated regularly for impairment. The servicing asset is stratified based on the original term to maturity and the year of origination of the underlying loans for purposes of measuring impairment. If the fair value of the servicing asset is less than the amortized carrying value, the asset is considered to be impaired and an impairment charge will be taken against earnings. The servicing asset is included in other assets on the consolidated balance sheets.
Allowance for Loan Loss
The allowance for loan loss (“Allowance”) is established by a provision for loan losses that is charged against income, increased by charges to expense and decreased by charge-offs (net of recoveries). Loan charge-offs are charged against the Allowance when management believes the collectability of loan principal becomes unlikely. Subsequent recoveries, if any, are credited to the Allowance.
The Allowance is an amount that management believes will be adequate to absorb estimated charge-offs related to specifically identified loans, as well as probable loan charge-offs inherent in the balance of the loan portfolio, based on an evaluation of the collectability of existing loans and prior loss experience. Management carefully monitors changing economic conditions, the concentrations of loan categories and collateral, the financial condition of the borrowers, the history of the loan portfolio, as well as historical peer group loan loss data to determine the adequacy of the Allowance. The Allowance is based upon estimates, and actual charge-offs may vary from the estimates. No assurance can be given that adverse future economic conditions will not lead to delinquent loans, increases in the provision for loan losses and/or charge-offs. These evaluations are inherently subjective, as they require estimates that are susceptible to significant revisions as conditions change. In addition, regulatory agencies, as an integral part of their examination process, may require additions to the Allowance based on their judgment about information available at the time of their examinations. Management believes that the Allowance as of December 31, 2016 is adequate to absorb known and probable losses inherent in the loan portfolio.
110
Table of Contents
The Allowance consists of specific and general components. The specific component relates to loans that are categorized as impaired. For loans that are categorized as impaired, a specific allowance is established when the realizable value of the impaired loan is lower than the recorded investment of that loan. The general component covers non-impaired loans and is based on the type of loan and historical charge-off experience adjusted for qualitative factors.
While the general allowance covers all non-impaired loans and is based on historical loss experience adjusted for the various qualitative factors as discussed in Note 6 — Loans, the change in the Allowance from one reporting period to the next may not directly correlate to the rate of change of nonperforming loans for the following reasons:
| • | A loan moving from the impaired performing status to an impaired non-performing status does not mandate an automatic increase in allowance. The individual loan is evaluated for a specific allowance requirement when the loan moves to the impaired status, not when the loan moves to non-performing status. In addition, the impaired loan is reevaluated at each subsequent reporting period. Impairment is measured based on the present value of the expected future cash flows discounted at the loan’s effective interest rate, except that as a practical expedient, the Company may measure impairment based on the loan’s observable market price or the fair value of the collateral if the loan is collateral dependent. |
| • | Not all impaired loans require a specific allowance. The payment performance of the borrower may require an impaired classification, but the collateral evaluation may support adequate collateral coverage. For a number of impaired loans in which borrower performance is in question, the collateral coverage may be sufficient. In those instances, neither a general allowance nor a specific allowance is assessed. |
Premises and Equipment
Premises and equipment are carried at cost less accumulated depreciation and amortization. Depreciation is computed using the straight-line method over the estimated useful lives, which range from three to seven years for furniture and fixtures. Leasehold improvements are amortized using the straight-line method over the estimated useful lives of the improvements or the remaining lease term, whichever is shorter. Expenditures for improvements or major repairs are capitalized and those for ordinary repairs and maintenance are charged to operations as incurred.
Other Real Estate Owned (“OREO”)
Real estate properties that are acquired through, or in lieu of, loan foreclosure are initially recorded at fair value, less estimated costs to sell, at the date of foreclosure, establishing a new cost basis. After foreclosure, valuations are periodically performed by management and the real estate is carried at the lower of the cost basis or fair value less estimated costs to sell. Gains and losses on the sale of OREOs and operating expenses of such assets are included in non-interest expense, and operating revenue of such assets is included in non-interest income.
Goodwill and Other Intangible Assets
Goodwill resulting from business combinations is generally determined as the excess of the fair value of the consideration transferred over the fair value of the identifiable net assets acquired and liabilities assumed as of the acquisition date. Goodwill and intangible assets acquired in a purchase business combination determined to have an indefinite useful life are not amortized, but tested for impairment at least annually, or more frequently if events and circumstances exist that indicate that an impairment test should be performed. The Company has selected October 1st as the date to perform its annual impairment test. Intangible assets with definite useful lives are amortized over their estimated useful lives. Goodwill is the only intangible asset with an indefinite life on the Company’s consolidated balance sheets. There was no impairment as of December 31, 2016 or 2015.
111
Table of Contents
Core deposit intangible assets arising from business combinations are amortized using an accelerated method over their estimated useful lives and are classified under core deposit and leasehold right intangibles on the Company’s consolidated balance sheets.
Leasehold right intangibles is the present value of the excess of market rate lease payments over the contractual lease payments of an acquired lease. The leasehold intangible asset is amortized to expense over the life of the lease and is classified under core deposit and leasehold right intangibles on the accompanying consolidated balance sheets.
Qualified Affordable Housing Project Investments
The Company has made investments in qualified affordable housing projects that are defined within the industry and here as investments in Low Income Housing Tax Credits (“LIHTC”). The investment in LIHTC provides the Company with tax credits and tax benefits which are designed to encourage investments in the construction and rehabilitation of low-income housing. The Company’s investments are made to limited partnerships that manage or invest in qualified affordable housing projects primarily to receive both tax credits and benefits in addition to CRA credits. The Company must meet certain conditions that a reporting entity must meet to be eligible to use a method other than the equity or cost method to account for qualified affordable housing project investments. If the conditions are met, the Company is permitted to amortize the initial cost of the investment in proportion to the amount of the tax credits and tax benefits received and recognize the net investment performance in the income statement as a component of income tax expense (benefit). The four conditions that must be met to utilize the proportional amortization method are: (a) it is probable that the tax credits allocable to the investor will be available, (b) the investor does not have the ability to exercise significant influence over the operating and financial policies of the limited partnership, and substantially all of the projected benefits are from tax credits and tax benefits, (c) the investor’s projected yield based solely on the cash flows from the tax credits and tax benefits is positive and (d) the investor is a limited partnership investor in the limited liability entity for both legal and tax purposes, and the investor is limited to its capital investment. The Company believes that all the above conditions are met to qualify for proportional amortization. In addition, the Company is required to evaluate its investments in LIHTC for impairment, when there are events or changes in circumstances indicating it is more likely than not that the carrying amount of the Company’s investment would not be realized either through the receipt of tax credits and tax benefits or through a sale. Management does not believe there is any impairment of its LIHTC investments at December 31, 2016. See Note 11 – Investments in Qualified Affordable Housing Projects for details on the Company’s investments in LIHTC’s.
Transfers of Financial Assets
Transfers of financial assets are accounted for as sales, when control over the assets has been surrendered. Control over transferred assets is deemed to be surrendered when (1) the assets have been isolated from the Company, (2) the transferee obtains the right (free of conditions that constrain it from taking advantage of that right) to pledge or exchange the transferred assets and (3) the Company does not maintain effective control over the transferred assets through an agreement to repurchase them before their maturity.
Derivative Financial Instruments and Hedging Activities
All derivative instruments (interest rate swap contracts) are recognized on the consolidated balance sheet at their current fair value. Every derivative instrument (including certain derivative instruments embedded in other contracts) is required to be recorded in the balance sheet as either an asset or liability measured at its fair value. ASC Topic 815 requires that changes in the derivative’s fair value be recognized currently in earnings unless specific hedge accounting criteria are met. Accounting for qualifying hedges allows a derivative’s gains and losses to offset related results on the hedged item in the income statement, and requires that a company must formally document, designate and assess the effectiveness of transactions that receive hedge accounting.
112
Table of Contents
On the date a derivative contract is entered into by the Company, the Company will designate the derivative contract as either a fair value hedge (i.e. a hedge of the fair value of a recognized asset or liability), a cash flow hedge (i.e. a hedge of the variability of cash flows to be received or paid related to a recognized asset or liability), or a stand-alone derivative (i.e. and instrument with no hedging designation). For a derivative designated as a fair value hedge, the changes in the fair value of the derivative and of the hedged item attributable to the hedged risk are recognized in earnings. If the derivative is designated as a cash flow hedge, the effective portions of changes in the fair value of the derivative are recorded in other comprehensive income and are recognized in the income statement when the hedged item affects earnings. Changes in the fair value of derivatives that do not qualify for hedge accounting are reported currently in earnings, as other non-interest income. At inception and on an ongoing basis, the derivatives that are used in hedging transactions are assessed for effectiveness as to how effective they are in offsetting changes in fair values or cash flows of hedged items.
The Company will discontinue hedge accounting prospectively when it is determined that the derivative is no longer effective in offsetting change in the fair value of the hedged item, the derivative expires or is sold, is terminated, or management determines that designation of the derivative as a hedging instrument is no longer appropriate. When hedge accounting is discontinued, the Company will continue to carry the derivative on the balance sheet at its fair value (if applicable), but will no longer adjust the hedged asset or liability for changes in fair value. The adjustments of the carrying amount of the hedged asset or liability will be accounted for in the same manner as other components of the carrying amount of that asset or liability, and the adjustments are amortized to interest income over the remaining life of the hedged item upon the termination of hedge accounting.
Income Taxes
The Company provides for current federal and state income taxes payable and for deferred taxes that result from differences between financial accounting rules and tax laws governing the timing of recognition of various income and expense items. The Company recognizes deferred income tax assets and liabilities for the future tax effects of such temporary differences based on the difference between the financial statement and tax bases of the existing assets and liabilities using the statutory rate expected in the years in which the differences are expected to reverse. The effect on deferred taxes of any enacted change in tax rates is recognized in income in the period that includes the enactment date. A valuation allowance is established to the extent necessary to reduce the deferred tax asset to the level at which it is “more likely than not” that the tax assets or benefits will be realized. Realization of tax benefits for deductible temporary differences and loss carryforwards depends on having sufficient taxable income of an appropriate character within the carryback and carryforward period and that current tax law will allow for the realization of those tax benefits.
The Company is required to account for uncertainty associated with the tax positions it has taken or expects to be taken on past, current and future tax returns. Where there may be a degree of uncertainty as to the tax realization of an item, the Company may only record the tax effects (expense or benefits) from an uncertain tax position in the consolidated financial statements if, based on its merits, the position is more likely than not to be sustained on audit by the taxing authorities. The Company does not believe that it has any material uncertain tax positions taken to date that are not more likely than not to be realized. Interest and penalties related to uncertain tax positions are recorded as part of other operating expense.
Earnings per Share (“EPS”)
Basic earnings per common share is computed by dividing net income available to common shareholders by the weighted-average number of common shares outstanding for the period. Diluted EPS includes the dilutive effect of potential common stock using the treasury stock method only if the effect on earnings per share is dilutive. See Note 4 – Computation of Earnings per Common Share.
113
Table of Contents
Recent Accounting Pronouncements
Accounting Standards Adopted in 2016
In March 2016, the FASB issued ASU 2016-09, Compensation – Stock Compensation (Topic 718): Improvements to Employee Share-Based Payment Accounting, to reduce the complexity of certain aspects of the accounting for employee share-based payment transactions. As a result of this ASU, changes applicable to all entities include: 1) The threshold to qualify for equity classification would permit withholding up to the maximum individual statutory tax rate in the applicable jurisdictions. Also, the ASU provides that cash paid by an employer when directly withholding shares for tax-withholding purposes would be classified as a financing activity on the statement of cash flows; 2) An entity would be allowed to make an entity-wide accounting policy election to either estimate the number of awards that are expected to vest or account for forfeitures when they occur; 3) All excess tax benefits and tax deficiencies would be recognized as income tax expense or benefit in the income statement. An entity also would recognize excess tax benefits regardless of whether the benefit reduces taxes payable in the current period. Further, excess tax benefits would not be separated from other income tax cash flows and thus would be classified along with other cash flows as an operating activity. ASU 2016-09 is effective for public entities for interim and annual periods beginning after December 15, 2016. In the third quarter of 2016, the Company elected the early adoption of this standard which requires the Company to reflect the adjustments resulting from the adoption effective January 1, 2016, the beginning of the annual period that includes the interim period of adoption. See Note 4 – Computation of Earnings Per Common Share, Note 16 – Stock Options and Restricted Stock and Note 19, Income Taxes for impacts of the adoption. None of the provisions under ASU 2016-09 resulted in a cumulative effect adjustment to retained earnings as of January 1, 2016, or retrospective application to prior years’ comparative consolidated financial statements.
Recent Accounting Standards Not Yet Effective
In May 2014, the FASB issued ASU 2014-09, Revenue from Contracts with Customers (Topic 606), which replaced almost all existing revenue recognition guidance in current U.S. GAAP. However, the effects of the new revenue recognition guidance on the financial statements of reporting entities in the financial institution industry will be somewhat limited because, for the most part, financial instruments and related contractual rights and obligations are excluded from its scope. As such, it is anticipated that interest income recognition and measurement, the largest source of revenue for the Company, will not be impacted by ASC 606. However, the recognition and measurement of certain non-interest income items such as gain on sale of other real estate owned and deposit-related fees, could be affected by ASC 606.
Under current U.S. GAAP, when full consideration is not expected and financing is required by the buyer to purchase the property, there are very prescriptive requirements in determining when foreclosed real estate property sold by an institution should be derecognized and a gain or loss be recognized. The new guidance that will be applied to these sales is more principles based. For example, as it pertains to the criteria for determining how a contract should be accounted for under the new guidance, judgment will need to be exercised in evaluating if: (a) a commitment on the buyer’s part exists, (b) collection is probable in circumstances where the initial investment is minimal and (c) the buyer has obtained control of the asset, including the significant risks and rewards of the ownership. If there is no commitment on the buyer’s part, collection is not probable or the buyer has not obtained control of the asset, then a gain cannot be recognized under the new guidance. The initial investment requirement for the buyer along with the various methods for profit recognition are no longer applicable when the new guidance goes into effect. The Company will revise its current policy on the recognition and measurement of gain on sale of other real estate owned to be consistent with the new guidance, but does not expect the new guidance to have a significant impact on the consolidated financial statements of the Company when adopted. Since the inception of the Company, the level of other real estate owned has been very low and in almost all cases, full consideration was received at the time of sale and financing by the Company was not provided.
114
Table of Contents
For deposit-related fees, considering the straightforward nature of the arrangements with the Company’s deposits customers, the Company does not expect the recognition and measurement outcomes of deposit-related fees to be significant differently under the new guidance compared to current U.S. GAAP.
ASU 2014-09 was to be effective for interim and annual periods beginning after December 15, 2016 and was to be applied on either a modified retrospective or full retrospective basis. In August 2015, the FASB issued ASU 2015-14 which defers the original effective date for all entities by one year. Public business entities should apply the guidance in ASU 2015-14 to annual reporting periods beginning after December 15, 2017, including interim reporting periods within that reporting period. Earlier application is permitted only as of annual reporting periods beginning after December 15, 2016, including interim reporting periods within that reporting period. The Company does not expect this ASU to have a material impact on the Company’s consolidated financial statements when adopted on January 1, 2018.
In January 2016, the FASB issued ASU 2016-01, Financial Instruments–Overall: Recognition and Measurement of Financial Assets and Financial Liabilities. Changes to the current GAAP model primarily affect the accounting for equity investments, financial liabilities under the fair value option, and the presentation and disclosure requirements for financial instruments. The most far-reaching ramification of this ASU is the elimination of the available-for-sale classification for equity securities and the requirement to carry most equity securities at fair value through net income. In addition, the FASB clarified guidance related to the valuation allowance assessment when recognizing deferred tax assets resulting from unrealized losses on available-for-sale debt securities. The accounting for other financial instruments, such as loans, investments in debt securities, and financial liabilities is largely unchanged. The classification and measurement guidance will be effective for public business entities in fiscal years beginning after December 15, 2017, including interim periods within those fiscal years. Entities can early adopt the provision to record fair value changes for financial liabilities under the fair value option resulting from instrument-specific credit risk in other comprehensive income. Early adoption of these provisions can be elected for all financial statements of fiscal years and interim periods that have not yet been issued or that have not yet been made available for issuance.
The Company does not have any equity securities in its available-for-sale portfolio, but only investments in the common stock of PCBB, TIB, and the FHLB, the Company’s correspondent banks. Under the current accounting policy, the Company’s investments in these common stock are carried at cost because a readily determinable fair value does not exist for these investments. Under ASU 2016-01, investment in FHLB is specifically excluded from the requirement that equity securities are to be measured at fair value with unrealized holding gains and losses reflected in net income. Furthermore, the ASU allows entities to make an irrevocable practicality exception whereby entities can make an election, on a security-by-security basis, to account for equity securities that do not have readily determinable fair value at cost, with adjustments to fair value when an observable price change occurs or impairment is identified. As such, the Company intends to continue to measure its investments in PCBB, TIB and FHLB common stock at cost upon adoption on January 1, 2018. The Company does not expect this ASU to have a material impact on the Company’s consolidated financial statements when adopted.
In February 2016, the FASB issued ASU 2016-02, Leases. The most significant change for lessees is the requirement under the new guidance to recognize right-of-use assets and lease liabilities for all leases not considered short-term leases. By definition, a short-term lease is one in which: (a) the lease term is 12 months or less and (b) there is not an option to purchase the underlying asset that the lessee is reasonably certain to exercise. For short-term leases, lessees may elect an accounting policy by class of underlying asset under which right-of-use assets and lease liabilities are not recognized and lease payments are generally recognized as expense over the lease term on a straight-line basis. Furthermore, this change will result in lessees recognizing right-of-use assets and lease liabilities for most leases currently accounted for as operating leases under the legacy lease accounting guidance. Examples of changes in the new guidance affecting both lessees and lessors include: (a) defining initial direct costs to only include those incremental costs that would not have been incurred if the lease had not been entered into, (b) requiring related party leases to be accounted for based on their legally
115
Table of Contents
enforceable terms and conditions, (c) eliminating the additional requirements that must be applied today to leases involving real estate and (d) revising the circumstances under which the transfer contract in a sale-leaseback transaction should be accounted for as the sale of an asset by the seller-lessee and the purchase of an asset by the buyer-lessor. In addition, both lessees and lessors are subject to new disclosure requirements. ASU 2016-02 is effective for public entities for interim and annual periods beginning after December 15, 2018.
As of December 31, 2016, the Company has 10 operating leases for 10 locations under contract with a term greater than 12 months with future lease payments totaling $11 million. At adoption date, January 1, 2019, the Company will recognize a lease liability for the present value of future lease commitments and a right of use asset. The recognized right of use asset relating to operating leases will consist of the present value of future lease commitments, unamortized initial direct costs, prepaid rent, and the related unamortized balance of lease incentives. The discount rate used to present value future lease payments will be the Company’s incremental borrowing rate at the time of adoption. The Company will take a modified retrospective transition approach with application in all comparative periods presented. The Company does not expect this ASU to have a material impact on the Company’s consolidated financial statements when adopted.
In June 2016, the FASB issued ASU 2016-13, Financial Instruments – Credit Losses (Topic 326), which introduces new guidance for the accounting for credit losses on instruments within its scope. The new guidance introduces an approach based on expected losses to estimate credit losses on certain types of financial instruments. It also modifies the impairment model for available-for-sale (AFS) debt securities and provides for a simplified accounting model for purchased financial assets with credit deterioration since their origination. Current expected credit losses (“CECL”) model, will apply to: (1) financial assets subject to credit losses and measured at amortized cost, and (2) certain off-balance sheet credit exposures. This includes loans, held-to-maturity debt securities, loan commitments, financial guarantees, and net investments in leases, as well as reinsurance and trade receivables. Upon initial recognition of the exposure, the CECL model requires an entity to estimate the credit losses expected over the life of an exposure (or pool of exposures). The estimate of expected credit losses (ECL) should consider historical information, current information, and reasonable and supportable forecasts, including estimates of prepayments. Financial instruments with similar risk characteristics should be grouped together when estimating ECL. ASU 2016-13 is effective for public entities for interim and annual periods beginning after December 15, 2019. Early application of the guidance will be permitted for all entities for fiscal years beginning after December 15, 2018, including interim periods within those fiscal years. Upon adoption, the Company expects the level of ECL will likely be higher, however, the Company is still in the early stages of developing an implementation plan and evaluating the magnitude of the increase and the impact of this ASU on its consolidated financial statements.
In August 2016, the FASB issued ASU 2016-15, Statement of Cash flows (Topic 230): Classification of Certain Cash Receipts and Cash Payments (a consensus of the FASB Emerging Issues Task Force), which addresses eight classification issues related to the statement of cash flows:
| • | Debt prepayment of debt extinguishment costs |
| • | Settlement of zero-coupon bonds |
| • | Contingent consideration payments made after a business combination |
| • | Proceeds from the settlement of insurance claims |
| • | Proceeds from the settlement of corporate-owned life insurance policies, including bank-owned life insurance policies |
| • | Distributions received from equity method investees |
| • | Beneficial interests in securitization transactions |
| • | Separately identifiable cash flows and application of the predominance principle |
116
Table of Contents
ASU 2016-15 is effective for public business entities for fiscal years beginning after December 15, 2017, and interim periods within those fiscal years. Early adoption is permitted, including adoption in an interim period. The Company is currently evaluating the impact of this ASU on its consolidated financial statements.
In November 2016, the FASB issued ASU 2016-18, Statement of Cash flows (Topic 230): Restricted Cash (a consensus of the FASB Emerging Issues Task Force). The new standard requires that the statement of cash flows explain the change during the period in the total of cash, cash equivalents, and amounts generally described as restricted cash or restricted cash equivalents. Entities will also be required to reconcile such total to amounts on the balance sheet and disclose the nature of the restrictions. ASU 2016-18 is effective for public business entities for financial statements issued for fiscal years beginning after December 15, 2017, and interim periods within those fiscal years. Early adoption is permitted, including adoption in an interim period. The Company is currently evaluating the impact of this ASU on its consolidated financial statements.
In January 2017, the FASB issued ASU 2017-01, Business Combinations (Topic 805): Clarifying the Definition of Business, which provides guidance on evaluating whether transactions should be accounted for as acquisitions or disposals of assets or businesses. The new standard clarifies that when substantially all of the fair value of gross assets acquired is concentrated in a single asset, or a group of similar assets, the asset acquired would not represent a business. The new ASU introduces this initial required screen, if met, eliminates the need for further assessment. For public business entities with a calendar year end, the standard is effective in 2018. Early adoption is permitted, including adoption in an interim period. The amendments can be applied to transactions occurring before the guidance was issued, as long as the applicable financial statements have not been issued. The Company does not expect the adoption of this ASU to have a material effect on its consolidated financial statements.
In January 2017, the FASB issued ASU 2017-04, Intangibles–Goodwill and Other {Topic 350): Simplifying the Test for Goodwill Impairment, which simplifies the accounting for goodwill impairment. ASU 2017-04 eliminates step two from the goodwill impairment test, which measures the amount of impairment loss, if any. Instead, an entity should recognize an impairment charge for the amount by which the carrying amount exceeds the reporting unit’s fair value. The loss recognized should not exceed the total amount of goodwill allocated to said reporting unit. For public business entities with a calendar year end, the standard is effective for annual and any interim impairment tests for periods beginning after December 15, 2019. The Company does not expect the adoption of this ASU to have a material effect on its consolidated financial statements.
Note 2 – Business Combinations
On November 30, 2014, the Company completed the merger with 1st Enterprise pursuant to the terms of the Agreement and Plan of Merger dated June 2, 2014, as amended (“Merger Agreement”). 1st Enterprise was merged with and into the Bank, with the Bank continuing as the surviving entity in the merger. Pursuant to the terms and conditions set forth in the Merger Agreement, each outstanding share of 1st Enterprise common stock (other than shares as to which the holder exercised dissenters’ rights) was converted into the right to receive 1.3450 of a share of CU Bancorp common stock, resulting in 5.2 million shares of CU Bancorp common stock issued. The fair value of the 5.2 million common stock issued as part of the consideration paid ($103 million) was determined based on the closing market price ($19.60) of CU Bancorp common stock on November 30, 2014. The 16,400 shares of 1st Enterprise Non-Cumulative Perpetual Preferred Stock, Series D were converted into the right to receive 16,400 shares of CU Bancorp’s Non-Cumulative Perpetual Preferred Stock, Series A (“CU Bancorp Preferred Stock”). The U.S. Department of the Treasury is the sole holder of all outstanding shares of CU Bancorp Preferred Stock. As part of the Merger Agreement, CU Bancorp adopted the 1st Enterprise 2006 Stock Incentive Plan, as amended, as its own equity plan and all stock options granted by 1st Enterprise thereunder are exercisable for CU Bancorp common stock on substantially the same terms but adjusted to reflect the exchange ratio set forth in the Merger Agreement. See Note 16 – Stock Options and Restricted Stock for more details. The merger was accounted for by the Company using the acquisition method of accounting. Accordingly, the assets and liabilities of 1st Enterprise were recorded at their respective fair values at acquisition date and represents management’s estimates based on available information as of the acquisition date.
117
Table of Contents
The following table presents (unaudited) pro forma information for the period indicated as though the 1st Enterprise merger had been completed as of January 1, 2013. The 2014 pro forma net income excludes historical non-recurring merger expenses net of taxes, totaling approximately $3.2 million for the Company and 1st Enterprise (dollars in thousands, except per share data).
| Proforma Year ended December 31, 2014 |
||||
| Net interest income after provision for loan losses |
$ | 77,140 | ||
| Net income |
$ | 17,218 | ||
|
|
|
|||
| Preferred stock dividends and discount accretion |
(1,234 | ) | ||
|
|
|
|||
| Net income available to common shareholders |
$ | 15,984 | ||
|
|
|
|||
| Diluted earnings per share |
$ | 0.94 | ||
The above proforma results are presented for illustrative purposes and are not intended to represent or be indicative of the actual results of operations of the merged companies that would have been achieved had the acquisition occurred at January 1, 2014 for 1st Enterprise nor are they intended to represent or be indicative of future results of operations. The proforma results do not include operating cost savings as a result of the acquisition. These proforma results require significant estimates and judgments particularly as it relates to valuation and accretion of income associated with acquired loans.
Note 3 – Computation of Book Value and Tangible Book Value per Common Share
Book value per common share was calculated by dividing total shareholders’ equity less preferred stock, by the number of common shares issued and outstanding. Tangible book value per common share was calculated by dividing tangible common equity, by the number of common shares issued and outstanding. The tables below present the computation of book value and tangible book value per common share as of the dates indicated (dollars in thousands, except share and per share data):
| December 31, | ||||||||
| 2016 | 2015 | |||||||
| Total Shareholders’ Equity |
$ | 338,185 | $ | 306,807 | ||||
| Less: Preferred stock |
16,955 | 16,995 | ||||||
| Less: Goodwill |
64,603 | 64,603 | ||||||
| Less: Core deposit and leasehold right intangibles |
6,300 | 7,671 | ||||||
|
|
|
|
|
|||||
| Tangible Shareholders’ Equity |
$ | 250,327 | $ | 217,538 | ||||
|
|
|
|
|
|||||
| Common shares issued and outstanding |
17,759,006 | 17,175,389 | ||||||
| Book value per common share |
$ | 18.09 | $ | 16.87 | ||||
|
|
|
|
|
|||||
| Tangible book value per common share |
$ | 14.10 | $ | 12.67 | ||||
|
|
|
|
|
|||||
Note 4 – Computation of Earnings per Common Share
On July 1, 2016, and effective January 1, 2016, the Company early adopted ASU 2016-09 which provides improvements to the accounting for employee share-based payments. In calculating potential common shares used to determine diluted earnings per share, U.S. GAAP requires the Company to use the treasury stock method. ASU 2016-09 requires that assumed proceeds under the treasury stock method be modified to exclude the amount of excess tax benefits that would have been recognized in additional paid-in capital.
118
Table of Contents
Basic and diluted earnings per common share were determined by dividing net income available to common shareholders by the applicable basic and diluted weighted average common shares outstanding. The following table shows weighted average basic common shares outstanding, potential dilutive shares related to stock options, unvested restricted stock, and weighted average diluted shares for the periods indicated (dollars in thousands, except share and per share data):
| Years Ended December 31, |
||||||||||||
| 2016 | 2015 | 2014 | ||||||||||
| Net Income |
$ | 27,457 | $ | 21,236 | $ | 8,908 | ||||||
| Less: Preferred stock dividends and discount accretion |
1,217 | 1,174 | 124 | |||||||||
|
|
|
|
|
|
|
|||||||
| Net Income available to common shareholders |
$ | 26,240 | $ | 20,062 | $ | 8,784 | ||||||
|
|
|
|
|
|
|
|||||||
| Weighted average basic common shares outstanding |
17,252,046 | 16,543,787 | 11,393,445 | |||||||||
| Dilutive effect of potential common share issuances from stock options and restricted stock |
298,819 | 439,434 | 274,288 | |||||||||
|
|
|
|
|
|
|
|||||||
| Weighted average diluted common shares outstanding |
17,550,865 | 16,983,221 | 11,667,733 | |||||||||
|
|
|
|
|
|
|
|||||||
| Income per common share |
||||||||||||
| Basic |
$ | 1.52 | $ | 1.21 | $ | 0.77 | ||||||
| Diluted |
$ | 1.50 | $ | 1.18 | $ | 0.75 | ||||||
|
|
|
|
|
|
|
|||||||
| Anti-dilutive shares not included in the calculation of diluted earnings per share |
1,189 | 32,811 | 79,000 | |||||||||
|
|
|
|
|
|
|
|||||||
Note 5 – Investment Securities
The investment securities portfolio has been classified into two categories: available-for-sale (“AFS”) and held-to-maturity (“HTM”).
The following tables present the amortized cost, gross unrealized gains and losses, and fair values of investment securities by major category as of the dates indicated (dollars in thousands):
| Gross Unrealized | ||||||||||||||||
| December 31, 2016 |
Amortized Cost |
Gains | Losses | Fair Value | ||||||||||||
| Available-for-sale investment securities: |
||||||||||||||||
| U.S. Govt Agency and Sponsored Agency – Note Securities |
$ | 10,000 | $ | — | $ | 31 | $ | 9,969 | ||||||||
| U.S. Govt Agency – SBA Securities |
123,224 | 365 | 739 | 122,850 | ||||||||||||
| U.S. Govt Agency – GNMA Mortgage-Backed Securities |
22,565 | 70 | 265 | 22,370 | ||||||||||||
| U.S. Govt Sponsored Agency – CMO & Mortgage-Backed Securities |
243,159 | 92 | 4,351 | 238,900 | ||||||||||||
| Asset Backed Securities |
7,111 | — | 215 | 6,896 | ||||||||||||
| U.S. Treasury Notes |
69,101 | 7 | 143 | 68,965 | ||||||||||||
|
|
|
|
|
|
|
|
|
|||||||||
| Total available-for-sale |
475,160 | 534 | 5,744 | 469,950 | ||||||||||||
| Held-to-maturity investment securities: |
||||||||||||||||
| Municipal Securities |
42,027 | 69 | 159 | 41,937 | ||||||||||||
|
|
|
|
|
|
|
|
|
|||||||||
| Total held-to-maturity |
42,027 | 69 | 159 | 41,937 | ||||||||||||
|
|
|
|
|
|
|
|
|
|||||||||
| Total investment securities |
$ | 517,187 | $ | 603 | $ | 5,903 | $ | 511,887 | ||||||||
|
|
|
|
|
|
|
|
|
|||||||||
119
Table of Contents
| Gross Unrealized | ||||||||||||||||
| December 31, 2015 |
Amortized Cost |
Gains | Losses | Fair Value | ||||||||||||
| Available-for-sale investment securities: |
||||||||||||||||
| U.S. Govt Agency and Sponsored Agency – Note Securities |
$ | 1,014 | $ | — | $ | — | $ | 1,014 | ||||||||
| U.S. Govt Agency – SBA Securities |
93,674 | 399 | 583 | 93,490 | ||||||||||||
| U.S. Govt Agency – GNMA Mortgage-Backed Securities |
30,916 | 202 | 418 | 30,700 | ||||||||||||
| U.S. Govt Sponsored Agency – CMO & Mortgage-Backed Securities |
97,693 | 250 | 789 | 97,154 | ||||||||||||
| Corporate Securities |
4,016 | 7 | — | 4,023 | ||||||||||||
| Municipal Securities |
1,010 | 1 | — | 1,011 | ||||||||||||
| Asset Backed Securities |
7,890 | — | 243 | 7,647 | ||||||||||||
| U.S. Treasury Notes |
80,981 | — | 235 | 80,746 | ||||||||||||
|
|
|
|
|
|
|
|
|
|||||||||
| Total available-for-sale |
317,194 | 859 | 2,268 | 315,785 | ||||||||||||
| Held-to-maturity investment securities: |
||||||||||||||||
| Municipal Securities |
42,036 | 335 | 32 | 42,339 | ||||||||||||
|
|
|
|
|
|
|
|
|
|||||||||
| Total held-to-maturity |
42,036 | 335 | 32 | 42,339 | ||||||||||||
|
|
|
|
|
|
|
|
|
|||||||||
| Total investment securities |
$ | 359,230 | $ | 1,194 | $ | 2,300 | $ | 358,124 | ||||||||
|
|
|
|
|
|
|
|
|
|||||||||
The Company’s investment securities portfolio at December 31, 2016, consists of U.S. Treasury Notes, U.S. Agency and U.S. Sponsored Agency issued AAA and AA rated investment-grade securities, asset backed securities, and municipal securities. At December 31, 2016 and December 31, 2015, securities with a market value of $205 million and $197 million, respectively, were pledged as collateral for securities sold under agreements to repurchase, public deposits, outstanding standby letters of credit, bankruptcy deposits, and other purposes as required by various statutes and agreements. See Note 9 – Borrowings and Subordinated Debentures.
The following tables present the gross unrealized losses and fair values of AFS and HTM investment securities that were in unrealized loss positions, summarized and classified according to the duration of the loss period as of the dates indicated (dollars in thousands).
| < 12
Continuous Months |
> 12 Continuous Months |
Total | ||||||||||||||||||||||
| December 31, 2016 | Fair Value |
Gross Unrealized Loss |
Fair Value |
Gross Unrealized Loss |
Fair Value |
Gross Unrealized Loss |
||||||||||||||||||
| Available-for-sale investment securities: |
||||||||||||||||||||||||
| U.S. Govt. Agency – SBA Securities |
$ | 54,302 | $ | 451 | $ | 39,322 | $ | 288 | $ | 93,624 | $ | 739 | ||||||||||||
| U.S. Govt. Agency – GNMA Mortgage-Backed Securities |
6,652 | 98 | 8,264 | 167 | 14,916 | 265 | ||||||||||||||||||
| U.S. Govt. Agency |
9,969 | 31 | — | 9,969 | 31 | |||||||||||||||||||
| U.S. Govt. Sponsored Agency CMO & Mortgage-Backed Securities |
215,138 | 4,172 | 10,879 | 179 | 226,017 | 4,351 | ||||||||||||||||||
| Asset Backed Securities |
— | — | 6,896 | 215 | 6,896 | 215 | ||||||||||||||||||
| U.S. Treasury Notes |
51,972 | 143 | — | — | 51,972 | 143 | ||||||||||||||||||
|
|
|
|
|
|
|
|
|
|
|
|
|
|||||||||||||
| Total available-for-sale |
$ | 338,033 | $ | 4,895 | $ | 65,361 | $ | 849 | $ | 403,394 | $ | 5,744 | ||||||||||||
|
|
|
|
|
|
|
|
|
|
|
|
|
|||||||||||||
| Held-to-maturity investment securities: |
||||||||||||||||||||||||
| Municipal Securities |
$ | 28,673 | $ | 158 | $ | 310 | $ | 1 | $ | 28,983 | $ | 159 | ||||||||||||
|
|
|
|
|
|
|
|
|
|
|
|
|
|||||||||||||
| Total held-to-maturity |
$ | 28,673 | $ | 158 | $ | 310 | $ | 1 | $ | 28,983 | $ | 159 | ||||||||||||
|
|
|
|
|
|
|
|
|
|
|
|
|
|||||||||||||
120
Table of Contents
| < 12
Continuous Months |
> 12 Continuous Months |
Total | ||||||||||||||||||||||
| December 31, 2015 | Fair Value |
Gross Unrealized Loss |
Fair Value |
Gross Unrealized Loss |
Fair Value |
Gross Unrealized Loss |
||||||||||||||||||
| Available-for-sale investment securities: |
||||||||||||||||||||||||
| U.S. Govt. Agency SBA Securities |
$ | 53,852 | $ | 428 | $ | 7,935 | $ | 154 | $ | 61,787 | $ | 582 | ||||||||||||
| U.S. Govt. Agency – GNMA Mortgage-Backed Securities |
5,417 | 47 | 14,296 | 371 | 19,713 | 418 | ||||||||||||||||||
| U.S. Govt. Sponsored Agency – CMO & Mortgage-Backed Securities |
67,475 | 564 | 10,024 | 225 | 77,499 | 789 | ||||||||||||||||||
| Asset Backed Securities |
2,928 | 54 | 4,719 | 190 | 7,647 | 244 | ||||||||||||||||||
| U.S Treasury Notes |
80,745 | 235 | — | — | 80,745 | 235 | ||||||||||||||||||
|
|
|
|
|
|
|
|
|
|
|
|
|
|||||||||||||
| Total available-for-sale |
$ | 210,417 | $ | 1,328 | $ | 36,974 | $ | 940 | $ | 247,391 | $ | 2,268 | ||||||||||||
|
|
|
|
|
|
|
|
|
|
|
|
|
|||||||||||||
| Held-to-maturity investment securities: |
||||||||||||||||||||||||
| Municipal Securities |
$ | 5,669 | $ | 16 | $ | 2,392 | $ | 16 | $ | 8,061 | $ | 32 | ||||||||||||
|
|
|
|
|
|
|
|
|
|
|
|
|
|||||||||||||
| Total held-to-maturity |
$ | 5,669 | $ | 16 | $ | 2,392 | $ | 16 | $ | 8,061 | $ | 32 | ||||||||||||
|
|
|
|
|
|
|
|
|
|
|
|
|
|||||||||||||
The unrealized losses in each of the above categories are associated with the general fluctuation of market interest rates and are not an indication of any deterioration in the credit quality of the security issuers. Further, the Company does not intend to sell these securities and is not more-likely-than-not to be required to sell the securities before the recovery of its amortized cost basis. Accordingly, the Company had no securities that were classified as other-than-temporary impaired at December 31, 2016 or 2015, and did not recognize any impairment charges in the consolidated statements of income.
The amortized cost, fair value and the weighted average yield of debt securities at December 31, 2016, are reflected in the table below (dollars in thousands). Maturity categories are determined as follows:
| • | U.S. Govt. Agency, U.S. Treasury Notes and U.S. Govt. Sponsored Agency bonds and notes – maturity date |
| • | U.S. Govt. Sponsored Agency CMO or Mortgage-Backed Securities, U.S. Govt. Agency GNMA Mortgage-Backed Securities, Asset Backed Securities and U.S. Gov. Agency SBA Securities – estimated cash flow taking into account estimated pre-payment speeds |
| • | Municipal Securities – the earlier of the maturity date or the expected call date. |
121
Table of Contents
Although, U.S. Government Agency and U.S. Government Sponsored Agency Mortgage-Backed and CMO securities have contractual maturities through 2048, the expected maturity will differ from the contractual maturities because borrowers or issuers may have the right to prepay such obligations without penalties.
| December 31, 2016 | ||||||||||||
| Maturities Schedule of Securities (Dollars in thousands) |
Amortized Cost |
Fair Value | Weighted Average Yield |
|||||||||
| Available-for-sale investment securities: |
||||||||||||
| Due through one year |
$ | 126,167 | $ | 125,375 | 1.13 | % | ||||||
| Due after one year through five years |
194,066 | 191,915 | 1.52 | % | ||||||||
| Due after five years through ten years |
117,858 | 116,127 | 1.89 | % | ||||||||
| Due after ten years |
37,069 | 36,533 | 2.21 | % | ||||||||
|
|
|
|
|
|
|
|||||||
| Total available-for-sale |
475,160 | 469,950 | 1.56 | % | ||||||||
| Held-to-maturity investment securities: |
||||||||||||
| Due through one year |
3,711 | 3,711 | 1.42 | % | ||||||||
| Due after one year through five years |
35,336 | 35,254 | 1.63 | % | ||||||||
| Due after five years through ten years |
2,980 | 2,972 | 2.71 | % | ||||||||
|
|
|
|
|
|
|
|||||||
| Total held-to-maturity |
42,027 | 41,937 | 1.69 | % | ||||||||
|
|
|
|
|
|
|
|||||||
| Total investment securities |
$ | 517,187 | $ | 511,887 | 1.57 | % | ||||||
|
|
|
|
|
|
|
|||||||
The weighted average yields in the above table are based on effective rates of book balances at the end of the year. Yields are derived by dividing interest income, adjusted for amortization of premiums and accretion of discounts, by total amortized cost.
During the years ended December 31, 2016, 2015 and 2014 the Company recognized net gains and (losses) on sales of investment securities in the amount of $258 thousand, $112 thousand and $(47) thousand, respectively. The Company had net proceeds from the sale of $6.9 million, $5.7 million and $25 million during the years ended December 31, 2016, 2015 and 2014, respectively.
Investment in Federal Home Loan Bank (FHLB) Common Stock
The Company’s investment in the common stock of the FHLB is carried at cost and was $9.1 million and $8.0 million as of December 31, 2016 and 2015, respectively. The investment in FHLB stock is included in accrued interest receivable and other assets in the consolidated balance sheets and is periodically evaluated for impairment. Based on the capital adequacy of the FHLB and its overall financial condition, no impairment losses have been recorded. See Note 13 – Borrowings and Subordinated Debentures for a detailed discussion regarding the Company’s borrowings and the requirements to purchase FHLB common stock.
The FHLB has declared and paid cash dividends in 2016, 2015 and 2014. The Company has received cash dividends from the FHLB of $1.1 million, $1.1 million, and $320 thousand for the years ending December 31, 2016, 2015, and 2014, respectively, and they are included in Other non-interest income of the accompanying consolidated statements of income.
The FHLB has been classified as one of the Company’s primary correspondent banks and is evaluated on a quarterly basis as part of the Company’s evaluation of its correspondent banking relationships under Federal Reserve Board Regulation F.
122
Table of Contents
Interest Income on Investment Securities
The following table presents the composition of interest income on investment securities for the periods indicated (dollars in thousands):
| Years ended December 31, | ||||||||||||
| 2016 | 2015 | 2014 | ||||||||||
| Taxable interest |
$ | 5,141 | $ | 3,773 | $ | 2,331 | ||||||
| Non-taxable interest |
652 | 745 | 38 | |||||||||
|
|
|
|
|
|
|
|||||||
| Total interest income on investment securities |
$ | 5,793 | $ | 4,518 | $ | 2,369 | ||||||
|
|
|
|
|
|
|
|||||||
Note 6 – Loans
The following table presents the composition of the loan portfolio as of the dates indicated (dollars in thousands):
| December 31, 2016 | ||||||||||||
| Principal | Net Unaccreted Discounts, Net Deferred Fees |
Total | ||||||||||
| Commercial and Industrial Loans: |
$ | 505,374 | $ | (2,737 | ) | $ | 502,637 | |||||
| Loans Secured by Real Estate: |
||||||||||||
| Owner-Occupied Nonresidential Properties |
455,120 | (3,798 | ) | 451,322 | ||||||||
| Other Nonresidential Properties |
635,856 | (5,693 | ) | 630,163 | ||||||||
| Construction, Land Development and Other Land |
195,215 | (1,156 | ) | 194,059 | ||||||||
| 1-4 Family Residential Properties |
129,261 | (2,097 | ) | 127,164 | ||||||||
| Multifamily Residential Properties |
110,336 | (478 | ) | 109,858 | ||||||||
|
|
|
|
|
|
|
|||||||
| Total Loans Secured by Real Estate |
1,525,788 | (13,222 | ) | 1,512,566 | ||||||||
|
|
|
|
|
|
|
|||||||
| Other Loans: |
35,246 | (223 | ) | 35,023 | ||||||||
|
|
|
|
|
|
|
|||||||
| Total Loans |
$ | 2,066,408 | $ | (16,182 | ) | $ | 2,050,226 | |||||
|
|
|
|
|
|
|
|||||||
| December 31, 2015 | ||||||||||||
| Principal | Net Unaccreted Discounts, Net Deferred Fees |
Total | ||||||||||
| Commercial and Industrial Loans: |
$ | 543,192 | $ | (5,824 | ) | $ | 537,368 | |||||
| Loans Secured by Real Estate: |
||||||||||||
| Owner-Occupied Nonresidential Properties |
412,772 | (4,793 | ) | 407,979 | ||||||||
| Other Nonresidential Properties |
539,260 | (6,092 | ) | 533,168 | ||||||||
| Construction, Land Development and Other Land |
126,626 | (794 | ) | 125,832 | ||||||||
| 1-4 Family Residential Properties |
117,400 | (2,875 | ) | 114,525 | ||||||||
| Multifamily Residential Properties |
72,222 | (1,043 | ) | 71,179 | ||||||||
|
|
|
|
|
|
|
|||||||
| Total Loans Secured by Real Estate |
1,268,280 | (15,597 | ) | 1,252,683 | ||||||||
|
|
|
|
|
|
|
|||||||
| Other Loans: |
43,218 | (106 | ) | 43,112 | ||||||||
|
|
|
|
|
|
|
|||||||
| Total Loans |
$ | 1,854,690 | $ | (21,527 | ) | $ | 1,833,163 | |||||
|
|
|
|
|
|
|
|||||||
Loans are made to commercial, non-profit organizations and consumers. Specific loan terms vary as to interest rate, repayment, and collateral requirements based on the type of loan requested and the credit worthiness of the prospective borrower. Credit risk tends to be geographically concentrated in Southern California where a majority of the Company’s loan customers are located.
123
Table of Contents
The Company’s extensions of credit are governed by its credit policies which are established to control the quality, structure and adherence to applicable laws. These policies are reviewed and approved by the Board of Directors on a regular basis.
Commercial and Industrial Loans: Commercial credit is extended primarily to small/middle market businesses, professional enterprises and their owners for business purposes. Typical loan types are working capital loans, loans for financing capital expenditures, asset acquisition loans and other business loans. Loans to closely held businesses will generally be guaranteed in full or in a meaningful amount by the businesses’ major owners. Commercial loans are made based primarily on the historical and projected cash flow of the borrower and secondarily on the underlying non-real estate collateral provided by the borrower. The cash flows of borrowers, however, may not behave as forecasted and collateral securing loans may fluctuate in value due to economic or individual performance factors. Minimum standards and underwriting guidelines have been established for all commercial loan types.
Commercial Real Estate Loans: The Company’s goal is to create and maintain a high quality portfolio of commercial real estate loans with customers who meet the quality and relationship profitability objectives of the Company. These loans include owner-occupied nonresidential properties and other nonresidential properties. Owner-occupied nonresidential property loans are subject to underwriting standards and processes similar to commercial and industrial loans. These loans are viewed primarily as cash flow loans and the repayment of these loans is largely dependent on the successful operation of the business. Other nonresidential property loans are also subject to strict underwriting standards and processes. For these loans the Company looks at the underlying cash flows from these properties, which include: the debt service coverage, the cash flow from the existing tenants in the property, the historical vacancy of the property, the financial strength of the tenants, and the type and duration of signed leases. Loan performance of commercial real estate loans may be adversely affected by factors impacting the general economy or conditions specific to the real estate market such as geographic location and/or property type.
Construction and Land Development Loans: The Company defines construction loans as loans where the loan proceeds are controlled by the Company and used for the improvement of real estate in which the Company holds a deed of trust. Land development loans are loans on vacant land that may be developed by the owner of the property sometime in the future. Due to the inherent risk in this type of loan, they are subject to other specific underwriting policy guidelines outlined in the Company’s credit policies and are monitored closely.
Residential Loans: The Company originates residential real estate loans as either home equity lines of credit or multifamily “apartment loans.” Home equity lines of credit (“HELOCs”) are made to individuals and to business principals with whom the Company maintains, in most cases, either a business lending or deposit relationship. The underwriting standards are typical of home equity products with loan to value and debt service considerations. Multifamily loans are underwritten based on the projected cash flows of the property with consideration of market conditions and values where the property is located.
Other Loans: The Company originates loans to individuals for personal expenditures and investments that the Company maintains in most cases either a deposit or business relationship with. Also included in this category are loans to non-depository financial institutions, non-profit organizations and consumers.
Acquired loans: Loans acquired in acquisitions are recorded at estimated fair value on their purchase date without a carryover of the related allowance for loan loss. Loans acquired with deteriorated credit quality are loans that have evidence of credit deterioration since origination and it is probable at the date of acquisition that the Company will not collect principal and interest payments according to the contractual terms of the original loan agreement. Evidence of credit quality deterioration as of the purchase date may include factors such as past due and non-accrual status. The difference between undiscounted contractually required payments at acquisition and the undiscounted cash flows expected to be collected at acquisition is referred to as the non-accretable yield. Further, any excess of cash flows expected at acquisition over the estimated fair value is referred to as the
124
Table of Contents
accretable yield and is recognized into interest income over the remaining life of the loan when there is a reasonable expectation about the amount and timing of such cash flows. Subsequent decreases to the expected cash flows will generally result in a provision for loan losses.
Restructured loans: Loans may be restructured in an effort to maximize collections. The Company may use various restructuring techniques, including, but not limited to, deferral of past due interest or principal, redeeming past due taxes, reduction of interest rates, extending maturities and modification of amortization schedules. The Company does not typically forgive principal balances or past due interest prior to pay-off or surrender of the property.
Concentrations
The Company makes commercial, construction, commercial real estate, and consumer home equity loans to customers primarily in Los Angeles, Riverside, Orange, San Bernardino and Ventura Counties. As an abundance of caution, the Company may require commercial real estate collateral on a loan classified as a commercial loan. At December 31, 2016, loans secured by real estate collateral accounted for approximately 74% of the loan portfolio. Of these loans, 96% are secured by first trust deed liens and 4% are secured by second trust deed liens. In addition, 30% are secured by owner-occupied non-residential properties. Loans secured by first trust deeds on commercial real estate generally have an initial loan to value ratio of not more than 75%, except for SBA guaranteed loans which may exceed this level. The Company’s policy for requiring collateral is to obtain collateral whenever it is available or desirable, depending upon the degree of risk in the proposed credit transaction. In addition, 20% of total loans have been secured by a UCC filing on the business property of the borrower. Approximately 5% of loans are unsecured. The Company’s loans are expected to be repaid from cash flows or from proceeds from the sale of selected assets of the borrowers.
A substantial portion of the Company’s customers’ ability to honor their contracts is dependent on the economy in the area. The Company’s goal is to continue to maintain a diversified loan portfolio which are well collateralized and supported by sufficient cash flows.
Small Business Administration Loans
As part of the acquisition of PC Bancorp, the Company acquired loans that were originated under the guidelines of the Small Business Administration (“SBA”) program. The total portfolio of the SBA contractual loan balances being serviced by the Company at December 31, 2016 was $104 million, of which $75 million has been sold. Of the $29 million remaining on the Company’s books at December 31, 2016, $24 million is not guaranteed and $5 million is guaranteed by the SBA.
In 2016, $14 million of SBA loans with contractual loan balances of $19 million were sold. Of the $4.8 million remaining on the Company’s books at December 31, 2016, $4.7 million is not guaranteed and $123 thousand is guaranteed.
Allowance for Loan Loss
The allowance for loan loss is established through a provision for loan losses charged to expense, which represents managements’ best estimate of probable losses that exist within the loan portfolio. The Allowance, in the judgment of management, is necessary to reserve for estimated loan losses and risks inherent in the loan portfolio. The Allowance consists of specific and general components. The specific component relates to loans that are categorized as impaired. For loans that are categorized as impaired, a specific allowance is established when the realizable value of the impaired loan is lower than the carrying value of that loan. Impairment is measured based on the present value of the expected future cash flows discounted at the loan’s effective interest rate, except that as a practical expedient, the Company may measure impairment based on the loan’s observable market price or the fair value of the collateral if the loan is collateral dependent. In addition, the impaired loan is reevaluated at each subsequent reporting period.
125
Table of Contents
The general component covers non-impaired loans and is based on the historical loan loss experience of the portfolio loan segments for the past 20 quarters, however the Company considers the Uniform Bank Peer Group (“UBPR”) historical loss data to evaluate potential loss exposure for those loan segments where the Company had no meaningful historical loss experience. The Allowance also includes an assessment of the following qualitative factors: the results of any internal and external loan reviews and any regulatory examination, loan charge-off experience, estimated potential charge-off exposure on each classified loan, credit concentrations, changes in the value of collateral for collateral dependent loans, and any known impairment in the borrower’s ability to repay. The Company also evaluates environmental and other factors such as underwriting standards, staff experience, the nature and volume of loans and loan terms, business conditions, political and regulatory conditions, local and national economic trends. The quantitative portion of the Allowance is adjusted for qualitative factors to account for model imprecision and to incorporate the range of probable outcomes inherent in the estimates used for the Allowance.
The Company conducts a critical evaluation of the credit quality of the loan portfolio and the adequacy of the Allowance on a quarterly basis. The level of the Allowance reflects management’s continuing evaluation of industry concentrations, specific credit risks, loan loss experience, current loan portfolio quality, present economic, political and regulatory conditions and unidentified losses inherent in the current loan portfolio. Portions of the Allowance may be allocated for specific credits; however, the entire allowance is available for any credit that, in management’s judgment, should be charged off. While management utilizes its best judgment and information available, the ultimate adequacy of the Allowance is dependent upon a variety of factors beyond the Company’s control, including among other things, the performance of the Company’s loan portfolio, the economy, changes in interest rates and the view of the regulatory authorities toward loan classifications.
The following is a summary of activity for the allowance for loan loss for the dates and periods indicated (dollars in thousands):
| December 31, | ||||||||||||
| 2016 | 2015 | 2014 | ||||||||||
| Allowance for loan loss at beginning of year |
$ | 15,682 | $ | 12,610 | $ | 10,603 | ||||||
| Provision for loan losses |
3,264 | 5,080 | 2,239 | |||||||||
| Net (charge-offs) recoveries: |
||||||||||||
| Charge-offs |
(895 | ) | (2,510 | ) | (692 | ) | ||||||
| Recoveries |
1,323 | 502 | 460 | |||||||||
|
|
|
|
|
|
|
|||||||
| Net (charge-offs) recoveries |
428 | (2,008 | ) | (232 | ) | |||||||
|
|
|
|
|
|
|
|||||||
| Allowance for loan loss at end of year |
$ | 19,374 | $ | 15,682 | $ | 12,610 | ||||||
|
|
|
|
|
|
|
|||||||
| Net (charge-offs) recoveries to average loans |
0.02 | % | (0.12 | )% | (0.02 | )% | ||||||
| Allowance for loan loss to total loans |
0.94 | % | 0.86 | % | 0.78 | % | ||||||
| Allowance for loan loss to total loans accounted for at historical cost, which excludes loans and the related allowance for loans acquired through acquisition |
1.18 | % | 1.25 | % | 1.39 | % | ||||||
126
Table of Contents
The following tables present, by portfolio segment, the changes in the allowance for loan loss and the recorded investment in loans as of the dates and for the periods indicated (dollars in thousands):
| Commercial and Industrial |
Construction, Land Development and Other Land |
Commercial and Other Real Estate |
Other | Total | ||||||||||||||||
| Year ended – December 31, 2016 |
||||||||||||||||||||
| Allowance for loan loss – Beginning balance |
$ | 5,924 | $ | 2,076 | $ | 6,821 | $ | 861 | $ | 15,682 | ||||||||||
| Provision for loan losses |
783 | 1,008 | 1,661 | (188 | ) | 3,264 | ||||||||||||||
| Net (charge-offs) recoveries: |
||||||||||||||||||||
| Charge-offs |
(895 | ) | — | — | — | (895 | ) | |||||||||||||
| Recoveries |
1,318 | — | 5 | — | 1,323 | |||||||||||||||
|
|
|
|
|
|
|
|
|
|
|
|||||||||||
| Total net recoveries |
423 | — | 5 | — | 428 | |||||||||||||||
|
|
|
|
|
|
|
|
|
|
|
|||||||||||
| Ending balance |
$ | 7,130 | $ | 3,084 | $ | 8,487 | $ | 673 | $ | 19,374 | ||||||||||
|
|
|
|
|
|
|
|
|
|
|
|||||||||||
| Commercial and Industrial |
Construction, Land Development and Other Land |
Commercial and Other Real Estate |
Other | Total | ||||||||||||||||
| Year ended – December 31, 2015 |
||||||||||||||||||||
| Allowance for loan loss – Beginning balance |
$ | 5,864 | $ | 1,684 | $ | 4,802 | $ | 260 | $ | 12,610 | ||||||||||
| Provision for loan losses |
1,781 | 392 | 2,306 | 601 | 5,080 | |||||||||||||||
| Net (charge-offs) recoveries: |
||||||||||||||||||||
| Charge-offs |
(2,218 | ) | — | (292 | ) | — | (2,510 | ) | ||||||||||||
| Recoveries |
497 | — | 5 | — | 502 | |||||||||||||||
|
|
|
|
|
|
|
|
|
|
|
|||||||||||
| Total net (charge-offs) |
(1,721 | ) | — | (287 | ) | — | (2,008 | ) | ||||||||||||
|
|
|
|
|
|
|
|
|
|
|
|||||||||||
| Ending balance |
$ | 5,924 | $ | 2,076 | $ | 6,821 | $ | 861 | $ | 15,682 | ||||||||||
|
|
|
|
|
|
|
|
|
|
|
|||||||||||
The following tables present both the allowance for loan loss and the associated loan balance classified by loan portfolio segment and by credit evaluation methodology (dollars in thousands):
| Commercial and Industrial |
Construction, Land Development and Other Land |
Commercial and Other Real Estate |
Other | Total | ||||||||||||||||
| December 31, 2016 |
||||||||||||||||||||
| Allowance for loan loss: |
||||||||||||||||||||
| Individually evaluated for impairment |
$ | — | $ | — | $ | — | $ | — | $ | — | ||||||||||
| Collectively evaluated for impairment |
7,130 | 3,084 | 8,487 | 673 | 19,374 | |||||||||||||||
| Purchased credit impaired (loans acquired with deteriorated credit quality) |
— | — | — | — | — | |||||||||||||||
|
|
|
|
|
|
|
|
|
|
|
|||||||||||
| Total Allowance for Loan Loss |
$ | 7,130 | $ | 3,084 | $ | 8,487 | $ | 673 | $ | 19,374 | ||||||||||
|
|
|
|
|
|
|
|
|
|
|
|||||||||||
| Loans receivable: |
||||||||||||||||||||
| Individually evaluated for impairment |
$ | 378 | $ | — | $ | 245 | $ | — | $ | 623 | ||||||||||
| Collectively evaluated for impairment |
501,960 | 194,059 | 1,316,849 | 35,023 | 2,047,891 | |||||||||||||||
| Purchased credit impaired (loans acquired with deteriorated credit quality) |
299 | — | 1,413 | — | 1,712 | |||||||||||||||
|
|
|
|
|
|
|
|
|
|
|
|||||||||||
| Total Loans Receivable |
$ | 502,637 | $ | 194,059 | $ | 1,318,507 | $ | 35,023 | $ | 2,050,226 | ||||||||||
|
|
|
|
|
|
|
|
|
|
|
|||||||||||
127
Table of Contents
| Commercial and Industrial |
Construction, Land Development and Other Land |
Commercial and Other Real Estate |
Other | Total | ||||||||||||||||
| December 31, 2015 |
||||||||||||||||||||
| Allowance for loan loss: |
||||||||||||||||||||
| Individually evaluated for impairment |
$ | — | $ | — | $ | — | $ | — | $ | — | ||||||||||
| Collectively evaluated for impairment |
5,924 | 2,076 | 6,821 | 861 | 15,682 | |||||||||||||||
| Purchased credit impaired (loans acquired with deteriorated credit quality) |
— | — | — | — | — | |||||||||||||||
|
|
|
|
|
|
|
|
|
|
|
|||||||||||
| Total Allowance for Loan Loss |
$ | 5,924 | $ | 2,076 | $ | 6,821 | $ | 861 | $ | 15,682 | ||||||||||
|
|
|
|
|
|
|
|
|
|
|
|||||||||||
| Loans receivable: |
||||||||||||||||||||
| Individually evaluated for impairment |
$ | 558 | $ | — | $ | 649 | $ | — | $ | 1,207 | ||||||||||
| Collectively evaluated for impairment |
536,333 | 125,832 | 1,124,667 | 43,112 | 1,829,944 | |||||||||||||||
| Purchased credit impaired (loans acquired with deteriorated credit quality) |
477 | — | 1,535 | — | 2,012 | |||||||||||||||
|
|
|
|
|
|
|
|
|
|
|
|||||||||||
| Total Loans Receivable |
$ | 537,368 | $ | 125,832 | $ | 1,126,851 | $ | 43,112 | $ | 1,833,163 | ||||||||||
|
|
|
|
|
|
|
|
|
|
|
|||||||||||
Credit Quality of Loans
The Company utilizes an internal loan classification system as a means of reporting problem and potential problem loans. Under the Company’s loan risk rating system, loans are classified as “Pass,” with problem and potential problem loans as “Special Mention,” “Substandard,” “Doubtful” and “Loss”. All loans are monitored and individual loan risk ratings are changed any time the situation warrants. In addition, management regularly reviews problem loans to determine whether any loan requires a classification change, in accordance with the Company’s policy and applicable regulations. The grading analysis estimates the capability of the borrower to repay the contractual obligations of the loan agreements as scheduled or at all. The internal loan classification risk grading system is based on experiences with similarly graded loans.
The Company’s internally assigned grades are as follows:
| • | Pass – loans which are protected by the current net worth and paying capacity of the obligor or by the value of the underlying collateral. There are several different levels of Pass rated credits, including “Watch” which is considered a transitory grade for pass rated loans that require greater monitoring. Loans not meeting the criteria of special mention, substandard, doubtful or loss that have been analyzed individually as part of the above described process are considered to be pass-rated loans. |
| • | Special Mention – loans where a potential weakness or risk exists, which could cause a more serious problem if not corrected. Special Mention loans do not currently expose the Company to sufficient risk to warrant classification as a Substandard, Doubtful or Loss classification, but possess weaknesses that deserve management’s close attention. |
| • | Substandard – loans that have a well-defined weakness based on objective evidence and can be characterized by the distinct possibility that the Company will sustain some loss if the deficiencies are not corrected. |
| • | Doubtful – loans classified as doubtful have all the weaknesses inherent in those classified as substandard with the added characteristic that the weaknesses present make collection or liquidation in full, on the basis of currently existing facts, conditions and values, highly questionable and improbable. |
| • | Loss – loans classified as a loss are considered uncollectible, or of such value that continuance as an asset is not warranted. |
128
Table of Contents
The following tables present the risk category of loans by class of loans based on the most recent internal loan classification as of the dates indicated (dollars in thousands):
| December 31, 2016 | Commercial and Industrial |
Construction, Land Development and Other Land |
Commercial and Other Real Estate |
Other | Total | |||||||||||||||
| Pass |
$ | 456,885 | $ | 194,059 | $ | 1,288,154 | $ | 32,128 | $ | 1,971,226 | ||||||||||
| Special Mention |
12,774 | — | 7,557 | — | 20,331 | |||||||||||||||
| Substandard |
32,978 | — | 22,796 | 2,895 | 58,669 | |||||||||||||||
| Doubtful |
— | — | — | — | — | |||||||||||||||
|
|
|
|
|
|
|
|
|
|
|
|||||||||||
| Total |
$ | 502,637 | $ | 194,059 | $ | 1,318,507 | $ | 35,023 | $ | 2,050,226 | ||||||||||
|
|
|
|
|
|
|
|
|
|
|
|||||||||||
| December 31, 2015 | Commercial and Industrial |
Construction, Land Development and Other Land |
Commercial and Other Real Estate |
Other | Total | |||||||||||||||
| Pass |
$ | 503,006 | $ | 125,832 | $ | 1,101,548 | $ | 40,132 | $ | 1,770,518 | ||||||||||
| Special Mention |
16,041 | — | 6,494 | 43 | 22,578 | |||||||||||||||
| Substandard |
18,321 | — | 18,809 | 2,937 | 40,067 | |||||||||||||||
| Doubtful |
— | — | — | — | — | |||||||||||||||
|
|
|
|
|
|
|
|
|
|
|
|||||||||||
| Total |
$ | 537,368 | $ | 125,832 | $ | 1,126,851 | $ | 43,112 | $ | 1,833,163 | ||||||||||
|
|
|
|
|
|
|
|
|
|
|
|||||||||||
Age Analysis of Past Due and Non-Accrual Loans
The following tables present an aging analysis of the recorded investment in past due and non-accrual loans as of the dates indicated (dollars in thousands):
| December 31, 2016 | 31-60 Days Past Due |
61-90 Days Past Due |
Greater than 90 Days Past Due and Accruing |
Total Past Due and Accruing |
Total Non- Accrual |
Current | Total Loans | |||||||||||||||||||||
| Commercial and Industrial |
$ | — | $ | — | $ | — | $ | — | $ | 675 | $ | 501,962 | $ | 502,637 | ||||||||||||||
| Construction, Land Development and Other Land |
— | — | — | — | — | 194,059 | 194,059 | |||||||||||||||||||||
| Commercial and Other Real Estate |
212 | — | — | 212 | 447 | 1,317,848 | 1,318,507 | |||||||||||||||||||||
| Other |
— | — | — | — | — | 35,023 | 35,023 | |||||||||||||||||||||
|
|
|
|
|
|
|
|
|
|
|
|
|
|
|
|||||||||||||||
| Total |
$ | 212 | $ | — | $ | — | $ | 212 | $ | 1,122 | $ | 2,048,892 | $ | 2,050,226 | ||||||||||||||
|
|
|
|
|
|
|
|
|
|
|
|
|
|
|
|||||||||||||||
| December 31, 2015 | 31-60 Days Past Due |
61-90 Days Past Due |
Greater than 90 Days Past Due and Accruing |
Total Past Due and Accruing |
Total Non- Accrual |
Current | Total Loans | |||||||||||||||||||||
| Commercial and Industrial |
$ | — | $ | — | $ | — | $ | — | $ | 1,032 | $ | 536,336 | $ | 537,368 | ||||||||||||||
| Construction, Land Development and Other Land |
— | — | — | — | — | 125,832 | 125,832 | |||||||||||||||||||||
| Commercial and Other Real Estate |
— | — | — | — | 1,019 | 1,125,832 | 1,126,851 | |||||||||||||||||||||
| Other |
— | — | — | — | — | 43,112 | 43,112 | |||||||||||||||||||||
|
|
|
|
|
|
|
|
|
|
|
|
|
|
|
|||||||||||||||
| Total |
$ | — | $ | — | $ | — | $ | — | $ | 2,051 | $ | 1,831,112 | $ | 1,833,163 | ||||||||||||||
|
|
|
|
|
|
|
|
|
|
|
|
|
|
|
|||||||||||||||
129
Table of Contents
Included in the non-accrual column above are purchased credit impaired loans of $499 thousand and $844 thousand as of December 31, 2016 and 2015, respectively. Included in the current column are purchased credit impaired loans that have been returned to accrual status of $1.2 million and $1.2 million as of December 31, 2016 and 2015, respectively.
Impaired Loans
Impaired loans are evaluated by comparing the present value of the expected future cash flows discounted at the loan’s effective interest rate, or if the loan is collateral dependent, the fair value of the collateral less costs to sell, with the recorded investment of a loan.
A valuation allowance is established for an impaired loan when the fair value of the loan is less than the recorded investment. In certain cases, portions of impaired loans are charged-off to the fair value instead of establishing a valuation allowance and are included, when applicable, in the table below as impaired loans “with no specific allowance recorded.” The valuation allowance disclosed below is included in the allowance for loan loss reported in the consolidated balance sheets as of December 31, 2016 and December 31, 2015.
The following tables present, by loan portfolio segment, the recorded investment and unpaid principal balances for impaired loans with the associated allowance amount, if applicable for the dates and periods indicated (dollars in thousands). These tables exclude purchased credit impaired loans (loans acquired in acquisitions with deteriorated credit quality) of $1.7 million and $2.0 million at December 31, 2016 and 2015, respectively.
Year ended December 31, 2016
| Recorded Investment |
Unpaid Principal Balance |
Related Allowance |
Average Recorded Investment |
Interest Income Recognized |
||||||||||||||||
| With no specific allowance recorded: |
||||||||||||||||||||
| Commercial and Industrial |
$ | 378 | $ | 1,383 | $ | — | $ | 401 | $ | — | ||||||||||
| Commercial and Other Real Estate |
245 | 282 | — | 252 | — | |||||||||||||||
| With an allowance recorded: |
||||||||||||||||||||
| Commercial and Industrial |
— | — | — | — | — | |||||||||||||||
| Commercial and Other Real Estate |
— | — | — | — | — | |||||||||||||||
| Total |
||||||||||||||||||||
| Commercial and Industrial |
378 | 1,383 | — | 401 | — | |||||||||||||||
| Commercial and Other Real Estate |
245 | 282 | — | 252 | — | |||||||||||||||
|
|
|
|
|
|
|
|
|
|
|
|||||||||||
| Total |
$ | 623 | $ | 1,665 | $ | — | $ | 653 | $ | — | ||||||||||
|
|
|
|
|
|
|
|
|
|
|
|||||||||||
Year ended December 31, 2015
| Recorded Investment |
Unpaid Principal Balance |
Related Allowance |
Average Recorded Investment |
Interest Income Recognized |
||||||||||||||||
| With no specific allowance recorded: |
||||||||||||||||||||
| Commercial and Industrial |
$ | 558 | $ | 1,027 | $ | — | $ | 672 | $ | — | ||||||||||
| Commercial and Other Real Estate |
649 | 692 | — | 70 | — | |||||||||||||||
| With an allowance recorded: |
||||||||||||||||||||
| Commercial and Industrial |
— | — | — | — | — | |||||||||||||||
| Commercial and Other Real Estate |
— | — | — | — | — | |||||||||||||||
| Total |
||||||||||||||||||||
| Commercial and Industrial |
558 | 1,027 | — | 672 | — | |||||||||||||||
| Commercial and Other Real Estate |
649 | 692 | — | 70 | — | |||||||||||||||
|
|
|
|
|
|
|
|
|
|
|
|||||||||||
| Total |
$ | 1,207 | $ | 1,719 | $ | — | $ | 742 | $ | — | ||||||||||
|
|
|
|
|
|
|
|
|
|
|
|||||||||||
130
Table of Contents
The following is a summary of additional information pertaining to impaired loans for the periods indicated (dollars in thousands):
| Year Ended December 31, | ||||||||||||
| 2016 | 2015 | 2014 | ||||||||||
| Average recorded investment in impaired loans |
$ | 653 | $ | 742 | $ | 4,991 | ||||||
| Interest foregone on impaired loans |
$ | 89 | $ | 265 | 421 | |||||||
| Cash collections applied to reduce principal balance |
$ | 351 | $ | 1,118 | 3,014 | |||||||
| Interest income recognized on cash collections |
$ | — | $ | — | $ | — | ||||||
Troubled Debt Restructuring
The Company’s loan portfolio contains certain loans that have been modified in a Troubled Debt Restructuring (“TDR”), where economic concessions have been granted to borrowers experiencing financial difficulties. Loans are restructured in an effort to maximize collections. Economic concessions can include: reductions to the stated interest rate, payment extensions, principal forgiveness or other actions.
The modification process includes evaluation of impairment based on the present value of expected future cash flows, discounted at the effective interest rate of the original loan agreement, except when the sole (remaining) source of repayment for the loan is the operation or liquidation of the loan collateral. In these cases, management uses the current fair value of the collateral, less selling costs, to evaluate the loan for impairment. If management determines that the value of the modified loan is less than the recorded investment in the loan (net of previous charge-offs and unamortized premium or discount) impairment is recognized through a specific allowance or a charge-off.
The following tables include the recorded investment and unpaid principal balances for troubled debt restructured loans at December 31, 2016, December 31, 2015 and December 31, 2014 (dollars in thousands). These tables include TDR loans that were purchased credit impaired (“PCI”). TDR loans that are non-PCI loans are included in Impaired Loans disclosures. As of December 31, 2016, there were two PCI loans that are considered to be TDR loans with a recorded investment of $105 thousand and unpaid principal balances of $273 thousand.
| Year ended December 31, 2016 | Recorded Investment |
Unpaid Principal Balance |
Interest Income Recognized |
|||||||||
| Commercial and Industrial |
$ | 408 | $ | 1,174 | $ | — | ||||||
|
|
|
|
|
|
|
|||||||
| Total |
$ | 408 | $ | 1,174 | $ | — | ||||||
|
|
|
|
|
|
|
|||||||
| Year ended December 31, 2015 | Recorded Investment |
Unpaid Principal Balance |
Interest Income Recognized |
|||||||||
| Commercial and Industrial |
$ | 627 | $ | 1,363 | $ | — | ||||||
|
|
|
|
|
|
|
|||||||
| Total |
$ | 627 | $ | 1,363 | $ | — | ||||||
|
|
|
|
|
|
|
|||||||
| Year ended December 31, 2014 | Recorded Investment |
Unpaid Principal Balance |
Interest Income Recognized |
|||||||||
| Commercial and Industrial |
$ | 530 | $ | 719 | $ | — | ||||||
| Commercial and Other Real Estate |
114 | 115 | — | |||||||||
|
|
|
|
|
|
|
|||||||
| Total |
$ | 644 | $ | 834 | $ | — | ||||||
|
|
|
|
|
|
|
|||||||
131
Table of Contents
The following tables show the pre- and post-modification recorded investment in TDR loans by loan segment that have occurred during the periods indicated (dollars in thousands):
| Year ended December 31, 2016 | Number of Loans |
Pre-Modification Recorded Investment |
Post- Modification Recorded Investment |
|||||||||
| Extended Maturity Date and Deferred Principal and Interest Payments: |
||||||||||||
| Commercial and Industrial |
1 | $ | 650 | $ | 73 | |||||||
|
|
|
|
|
|
|
|||||||
| Total |
1 | $ | 650 | $ | 73 | |||||||
|
|
|
|
|
|
|
|||||||
| Year ended December 31, 2015 | Number of Loans |
Pre-Modification Recorded Investment |
Post- Modification Recorded Investment |
|||||||||
| Reduced Interest Rate and Lengthened Amortization: |
||||||||||||
| Commercial and Industrial |
3 | $ | 1,335 | $ | 208 | |||||||
|
|
|
|
|
|
|
|||||||
| Total |
3 | $ | 1,335 | $ | 208 | |||||||
|
|
|
|
|
|
|
|||||||
| Year ended December 31, 2014 | Number of Loans |
Pre-Modification Recorded Investment |
Post- Modification Recorded Investment |
|||||||||
| Reduced Interest Rate and Lengthened Amortization: |
||||||||||||
| Commercial and Industrial |
1 | $ | 224 | $ | 224 | |||||||
| Commercial and Other Real Estate |
1 | 114 | 114 | |||||||||
|
|
|
|
|
|
|
|||||||
| Total |
2 | $ | 338 | $ | 338 | |||||||
|
|
|
|
|
|
|
|||||||
Loans are restructured in an effort to maximize collections. Impairment analyses are performed on the Company’s troubled debt restructured loans in conjunction with the normal allowance for loan loss process. The Company’s troubled debt restructured loans are analyzed to ensure adequate cash flow or collateral supports the outstanding loan balance.
There were no commitments to lend additional funds to borrowers whose terms have been modified in troubled debt restructurings at December 31, 2016 or 2015.
There have been no payment defaults in the year ended December 31, 2016 subsequent to modification on troubled debt restructured loans that have been modified within the last twelve months.
Loans Acquired Through Acquisition
The following table reflects the accretable net discount for loans acquired through acquisition, for the periods indicated (dollars in thousands):
| Year Ended December 31, | ||||||||
| 2016 | 2015 | |||||||
| Balance, beginning of year |
$ | 14,610 | $ | 21,402 | ||||
| Accretion, included in interest income |
(4,967 | ) | (6,274 | ) | ||||
| Additions, due to acquisition |
— | — | ||||||
| Reclassifications to non-accretable yield |
(32 | ) | (518 | ) | ||||
|
|
|
|
|
|||||
| Balance, end of year |
$ | 9,611 | $ | 14,610 | ||||
|
|
|
|
|
|||||
132
Table of Contents
The above table reflects the fair value adjustment on the loans acquired from mergers that will be amortized to loan interest income based on the effective yield method over the remaining life of the loans. These amounts do not include the fair value adjustments on the purchased credit impaired loans acquired from mergers.
Purchased Credit Impaired Loans
PCI loans are acquired loans with evidence of deterioration of credit quality since origination and it is probable at the acquisition date, that the Company will not be able to collect all contractually required amounts.
When the timing and/or amounts of expected cash flows on such loans are not reasonably estimable, no interest is accreted and the loan is reported as a non-accrual loan; otherwise, if the timing and amounts of expected cash flows for PCI loans are reasonably estimable, then interest is accreted and the loans are reported as accruing loans.
The non-accretable difference represents the difference between the undiscounted contractual cash flows and the undiscounted expected cash flows, and also reflects the estimated credit losses in the acquired loan portfolio at the acquisition date and can fluctuate due to changes in expected cash flows during the life of the PCI loans.
The following table reflects the outstanding balance and related carrying value of PCI loans as of the dates indicated (dollars in thousands):
| December 31, 2016 | December 31, 2015 | |||||||||||||||
| Unpaid Principal Balance |
Carrying Value |
Unpaid Principal Balance |
Carrying Value |
|||||||||||||
| Commercial and Industrial |
$ | 622 | $ | 299 | $ | 2,331 | $ | 477 | ||||||||
| Commercial and Other Real Estate |
1,997 | 1,413 | 2,250 | 1,535 | ||||||||||||
| Other |
— | — | 61 | — | ||||||||||||
|
|
|
|
|
|
|
|
|
|||||||||
| Total |
$ | 2,619 | $ | 1,712 | $ | 4,642 | $ | 2,012 | ||||||||
|
|
|
|
|
|
|
|
|
|||||||||
There is no related allowance for credit losses with the PCI loans as of December 31, 2016 and 2015 included in the tables above.
The following table reflects the activities in the accretable net discount for PCI loans for the period indicated (dollars in thousands):
| Year Ended December 31, 2016 |
Year Ended December 31, 2015 |
|||||||
| Balance, beginning of year |
$ | 246 | $ | 324 | ||||
| Accretion, included in interest income |
(85 | ) | (78 | ) | ||||
| Reclassifications from non-accretable yield |
— | — | ||||||
|
|
|
|
|
|||||
| Balance, end of year |
$ | 161 | $ | 246 | ||||
|
|
|
|
|
|||||
133
Table of Contents
Note 7 – Premises and Equipment and Lease Commitments
Premises and equipment are stated at cost less accumulated depreciation and amortization. The following major classifications of premises and equipment are summarized as follows as of the dates indicated (dollars in thousands):
| December 31, | ||||||||
| 2016 | 2015 | |||||||
| Furniture and equipment |
$ | 8,032 | $ | 8,345 | ||||
| Leasehold improvements |
7,382 | 7,260 | ||||||
|
|
|
|
|
|||||
| Total |
15,414 | 15,605 | ||||||
| Less: Accumulated depreciation and amortization |
(11,230 | ) | (10,466 | ) | ||||
|
|
|
|
|
|||||
| Total |
$ | 4,184 | $ | 5,139 | ||||
|
|
|
|
|
|||||
The following is a schedule of future minimum lease payments for operating leases for office and branch space based upon obligations at December 31, 2016 (dollars in thousands):
| Year |
Amount | |||
| 2017 |
$ | 3,322 | ||
| 2018 |
2,493 | |||
| 2019 |
2,345 | |||
| 2020 |
2,208 | |||
| 2021 |
1,903 | |||
| Thereafter |
2,215 | |||
|
|
|
|||
| Total |
$ | 14,486 | ||
|
|
|
|||
Total rental expense on facilities for the years ended December 31, 2016, 2015 and 2014 was $3.3 million, $3.1 million, and $2.2 million, respectively.
Note 8 – Goodwill, Core Deposit and Leasehold Right Intangibles
Goodwill
The following table presents changes in the carrying value of goodwill for the periods indicated (dollars in thousands):
| Year Ended December 31, |
||||||||
| 2016 | 2015 | |||||||
| Balance, beginning of year |
$ | 64,603 | $ | 63,950 | ||||
| Measurement-period adjustment |
— | 653 | ||||||
| Goodwill acquired during the year |
— | — | ||||||
| Impairment losses |
— | — | ||||||
|
|
|
|
|
|||||
| Balance, end of year |
$ | 64,603 | $ | 64,603 | ||||
|
|
|
|
|
|||||
| Accumulated impairment losses at end of year |
$ | — | $ | — | ||||
For the year ended December 31, 2015, the Company early adopted ASU 2015-16, Simplifying the Accounting for Measurement-Period Adjustment, which eliminates the requirement to retrospectively adjust the financial statements for measurement-period adjustments that occur in periods after a business combination is consummated. Measurement-period adjustments are calculated as if they were known at the acquisition date, but are recognized in the reporting period in which they are determined. Prior period information is not revised. In
134
Table of Contents
November 2015, the Company recorded a measurement-period adjustment and increased goodwill by $653 thousand due to an additional write-down of $1.1 million taken when the Company finalized the fair value estimate of a loan relationship acquired in the 1st Enterprise merger. The 1st Enterprise merger closed on November 30, 2014. There would not be a significant impact on the consolidated statements of income for the years ended December 31, 2014 and 2015, had such measurement-period adjustment been recognized at the acquisition date, as such loan relationship had been on non-accrual status since early 2015.
The Company’s goodwill was evaluated for impairment during the fourth quarter of 2016, with no impairment loss recognition considered necessary.
Core Deposit Intangibles (“CDI”)
The weighted average amortization period remaining for our core deposit intangibles is 5.2 years. The estimated aggregate amortization expense related to these intangible assets for each of the next five years is $1.1 million, $936 thousand, and $692 thousand, $628 thousand and $571 thousand. The Company’s core deposit intangibles were evaluated for impairment at December 31, 2016, taking into consideration the actual deposit runoff of acquired deposits to the level of deposit runoff expected at the date of merger. Based on the Company’s evaluation, no impairment has taken place on the core deposit intangibles. The following table presents the changes in the gross amounts of core deposit intangibles and the related accumulated amortization for the dates and periods indicated (dollars in thousands):
| Year Ended December 31, | ||||||||||||
| 2016 | 2015 | 2014 | ||||||||||
| Gross amount of CDI: |
||||||||||||
| Balance, beginning of year |
$ | 9,246 | $ | 9,246 | $ | 2,103 | ||||||
| Additions due to acquisitions |
— | — | 7,143 | |||||||||
|
|
|
|
|
|
|
|||||||
| Balance, end of year |
9,246 | 9,246 | 9,246 | |||||||||
|
|
|
|
|
|
|
|||||||
| Accumulated Amortization: |
||||||||||||
| Balance, beginning of year |
(2,736 | ) | (1,056 | ) | (665 | ) | ||||||
| Amortization |
(1,280 | ) | (1,680 | ) | (391 | ) | ||||||
|
|
|
|
|
|
|
|||||||
| Balance, end of year |
(4,016 | ) | (2,736 | ) | (1,056 | ) | ||||||
|
|
|
|
|
|
|
|||||||
| Net CDI, end of year |
$ | 5,230 | $ | 6,510 | $ | 8,190 | ||||||
|
|
|
|
|
|
|
|||||||
Leasehold Right Intangibles
Leasehold right intangible is the present value of the excess of market rate lease payments over the contractual lease payments of an acquired lease. The recorded value of the Company’s leasehold right intangibles at December 31, 2016 and 2015 was $1.1 million and $1.2 million, respectively.
The amortization of the leasehold right intangibles is recorded within the consolidated income statement under occupancy expense. The net amortization of the leasehold right intangible assets and liabilities resulted in income of $205 thousand, income of $62 thousand, and expense of $142 thousand for the years ended December 31, 2016, 2015 and 2014, respectively. During 2015, the Company recorded a $41 thousand adjustment to the fair value of a lease that was acquired in the 1st Enterprise merger due to a change in the sublease rate assumption since the acquisition date. The adjustment was an expense to merger cost.
Note 9 – Bank Owned Life Insurance
At December 31, 2016 and 2015 the Company had $51 million and $50 million, respectively of Bank-Owned Life Insurance (“BOLI”). The Company recorded non-interest income associated with the BOLI policies
135
Table of Contents
of $1.3 million, $1.3 million, and $660 thousand for the years ending December 31, 2016, 2015 and 2014, respectively. The increase in the Company’s balance to $51 million in 2016 was due to an increase of $1.3 million in the cash surrender value of the policies during 2016.
BOLI involves the purchasing of life insurance by the Company on a selected group of employees where the Company is the owner and beneficiary of the policies. BOLI is recorded as an asset at its cash surrender value. Increases in the cash surrender value of these policies, as well as a portion of the insurance proceeds received, are recorded in noninterest income and are not subject to income tax, as long as they are held for the life of the covered parties. At December 31, 2016, the $51 million was allocated between eight individual insurance companies, with balances ranging from approximately 1% to 37% of the Company’s outstanding BOLI balances. On an annual basis, the Company reviews the financial stability and ratings of all the individual insurance companies to ensure they are adequately capitalized, and that there is minimal risk to the BOLI assets.
Note 10 – Investment in California Organized Investment Network (“COIN”)
The Company has historically made investments with Community Development Financial Institutions (“CDFI”) as defined and recognized by the United States Department of Treasury and by the California Organized Investment Network (“COIN”) within the California Department of Insurance. These investments were certified by the California Department of Insurance and qualified for State of California income tax credits. The Company has previously utilized all the investments tax credits generated in the previous years. With regards to the Company’s previous investments with CDFI, if the Company were to redeem this deposit prior to its contractual and stated maturity date, the Company would lose the benefit of the tax credit taken in prior years. The investment, to qualify for this specific tax credit, must be for a minimum term of sixty months. In addition, the tax credit is required to be applied during the year in which the investments were made. These deposits are not insured by the FDIC, and are included in other assets on the consolidated balance sheet of the Company. The Company’s intentions are to hold these investments to their contractual maturity dates. These investments were also made to meet CRA investment goals. The Company’s investments in COIN were $1.4 million and $1.1 million at December 31, 2016 and 2015, respectively.
136
Table of Contents
Note 11 – Qualified Affordable Housing Project Investments
The following table presents the Company’s original investment in the LIHTC projects, the current recorded investment balance, and the unfunded liability balance of each investment at December 31, 2016, 2015 and 2014. In addition, the table reflects the tax credits and tax benefits recorded by the Company during 2016, 2015 and 2014, the amortization of the investment and the net impact to the Company’s income tax provision for 2016, 2015 and 2014. The Company’s recorded investment balance in the LIHTC projects and the related unfunded liability balance are included in other assets and other liabilities on the accompanying consolidated balance sheets, respectively. Also see Note 19 – Income Tax, for the impact of these investments on the Company’s effective tax rate (dollars in thousands):
| Qualified Affordable Housing Projects at December 31, 2016 |
Original Investment Value |
Current Recorded Investment |
Unfunded Liability Obligation |
Tax Credits and Benefits (1) |
Amortization of Investments (2) |
Net Income Tax Benefit |
||||||||||||||||||
| Enterprise Green Communities West II LP |
$ | 1,000 | $ | 513 | $ | 22 | $ | 131 | $ | 90 | $ | 41 | ||||||||||||
| Enterprise Housing Partners Calgreen II Fund LP |
2,050 | 1,214 | 165 | 218 | 212 | 6 | ||||||||||||||||||
| Enterprise Housing Partners XXIV LP |
2,000 | 1,513 | 391 | 212 | 167 | 45 | ||||||||||||||||||
|
|
|
|
|
|
|
|
|
|
|
|
|
|||||||||||||
| Total – Investments in Qualified Affordable Housing Projects |
$ | 5,050 | $ | 3,240 | $ | 578 | $ | 561 | $ | 469 | $ | 92 | ||||||||||||
|
|
|
|
|
|
|
|
|
|
|
|
|
|||||||||||||
| Qualified Affordable Housing Projects at December 31, 2015 |
Original Investment Value |
Current Recorded Investment |
Unfunded Liability Obligation |
Tax Credits and Benefits (1) |
Amortization of Investments (2) |
Net Income Tax Benefit |
||||||||||||||||||
| Enterprise Green Communities West II LP |
$ | 1,000 | $ | 604 | $ | 69 | $ | 136 | $ | 92 | $ | 44 | ||||||||||||
| Enterprise Housing Partners Calgreen II Fund LP |
2,050 | 1,426 | 165 | 198 | 164 | 34 | ||||||||||||||||||
| Enterprise Housing Partners XXIV LP |
2,000 | 1,680 | 806 | 209 | 180 | 29 | ||||||||||||||||||
|
|
|
|
|
|
|
|
|
|
|
|
|
|||||||||||||
| Total – Investments in Qualified Affordable Housing Projects |
$ | 5,050 | $ | 3,710 | $ | 1,040 | $ | 543 | $ | 436 | $ | 107 | ||||||||||||
|
|
|
|
|
|
|
|
|
|
|
|
|
|||||||||||||
| Qualified Affordable Housing Projects at December 31, 2014 |
Original Investment Value |
Current Recorded Investment |
Unfunded Liability Obligation |
Tax Credits and Benefits (1) |
Amortization of Investments (2) |
Net Income Tax Benefit |
||||||||||||||||||
| Enterprise Green Communities West II LP |
$ | 1,000 | $ | 704 | $ | 162 | $ | 127 | $ | 84 | $ | 43 | ||||||||||||
| Enterprise Housing Partners Calgreen II Fund LP |
2,050 | 1,588 | 635 | 229 | 174 | 55 | ||||||||||||||||||
| Enterprise Housing Partners XXIV LP |
2,000 | 1,849 | 1,685 | 160 | 112 | 48 | ||||||||||||||||||
|
|
|
|
|
|
|
|
|
|
|
|
|
|||||||||||||
| Total – Investments in Qualified Affordable Housing Projects |
$ | 5,050 | $ | 4,141 | $ | 2,482 | $ | 516 | $ | 370 | $ | 146 | ||||||||||||
|
|
|
|
|
|
|
|
|
|
|
|
|
|||||||||||||
| (1) | The amounts reflected in this column represent both the tax credits, as well as the tax benefits generated by the Qualified Affordable Housing Projects operating loss for the year. |
| (2) | This amount reduces the tax credits and benefits generated by the Qualified Affordable Housing Projects |
137
Table of Contents
The following table reflects the anticipated net income tax benefit that is expected to be recognized by the Company over the next five years (dollars in thousands):
| Qualified Affordable Housing Projects | Enterprise Green Communities West II LP |
Enterprise Housing Partners Calgreen II Fund LP |
Enterprise Housing Partners XXIV LP |
Total Net Income Tax Benefit |
||||||||||||
| Anticipated net income tax benefit less amortization of investments: |
||||||||||||||||
| 2017 |
$ | 43 | $ | 40 | $ | 38 | $ | 121 | ||||||||
| 2018 |
43 | 40 | 37 | 120 | ||||||||||||
| 2019 |
$ | 43 | $ | 40 | $ | 37 | $ | 120 | ||||||||
| 2020 |
40 | 40 | 37 | 117 | ||||||||||||
| 2021 and thereafter |
72 | 134 | 169 | 375 | ||||||||||||
|
|
|
|
|
|
|
|
|
|||||||||
| Total – anticipated net income tax benefit in Qualified Affordable Housing Projects |
$ | 241 | $ | 294 | $ | 318 | $ | 853 | ||||||||
|
|
|
|
|
|
|
|
|
|||||||||
Note 12 – Deposits
The Company had CDARS® and ICS® deposits that are classified as “brokered” deposits for regulatory purposes. At December 31, 2016, the Company no longer had any “reciprocal” CDARS® deposits, and therefore there were no CDARS® deposits classified as “brokered” deposits. These “reciprocal” CDARS® and ICS® deposits are the only brokered deposits utilized by the Company, and the Company considers these deposits to be “core” in nature.
At December 31, 2016, $28 million out of total time deposits of $29 million mature within one year.
At December 31, 2016 and 2015, the Company had certificates of deposit with balances $250 thousand or more of $19 million and $18 million, respectively.
The following table shows the maturity of the Company’s time deposits of $250 thousand or more at December 31, 2016 (dollars in thousands):
| Maturity of Time Deposits of $250,000 or More |
||||
| Three months or less |
$ | 12,359 | ||
| Over three through six months |
2,034 | |||
| Over six through twelve months |
4,757 | |||
| Over twelve months |
269 | |||
|
|
|
|||
| Total |
$ | 19,419 | ||
|
|
|
|||
ICS® Reciprocal Non-Interest Bearing Demand Deposits
During 2013 the Company began participating as a member of the Insured Cash Sweep® (“ICS®”) deposit program. Through ICS®, the Company may accept non-interest bearing deposits in excess of the FDIC insured maximum from a depositor and place the deposits through the ICS® network into other member banks in increments of less than the FDIC insured maximum in order to provide the depositor full FDIC insurance coverage. The Company receives an equal dollar amount of deposits from other ICS® member banks in exchange for the deposits the Company places into the ICS® network. These deposits are recorded on the Company’s balance sheet as ICS® reciprocal deposits. At December 31, 2016 and 2015, the ICS® reciprocal deposits totaled $7.5 million and $9.3 million, respectively.
138
Table of Contents
CDARS® Reciprocal Time Deposits
The Company participates and is a member of the Certificate of Deposit Account Registry Service (CDARS®) deposit product program. Through CDARS®, the Company may accept deposits in excess of the FDIC insured maximum from a depositor and place the deposits through a network to other CDARS® member banks in increments of less than the FDIC insured maximum to provide the depositor full FDIC insurance coverage. Where the Company receives an equal dollar amount of deposits from other CDARS® member banks in exchange for the deposits the Company places into the network, the Company records these as CDARS® reciprocal deposits. At December 31, 2016, the Company does not have any CDARS® reciprocal deposits on its consolidated balance sheet because all of these deposits matured during 2016. At December 31, 2015, the CDARS® reciprocal deposits totaled $29 million. Currently, the Company only offers the CDARS ® One-Way Sell product, which is not a liability to the Company and therefore is not recorded on the consolidated balance sheet.
Note 13 – Borrowings and Subordinated Debentures
Securities Sold Under Agreements to Repurchase
The Company enters into certain transactions, the legal form of which are sales of securities under agreements to repurchase (“Repos”) at a later date at a set price. Securities sold under agreements to repurchase generally mature within 1 day to 180 days from the issue date and are routinely renewed.
As discussed in Note 5 – Investment Securities, the Company has pledged certain investments as collateral for these agreements. Securities with a fair value of $48 million and $47 million were pledged to secure the Repos at December 31, 2016 and December 31, 2015, respectively.
The tables below describe the terms and maturity of the Company’s securities sold under agreements to repurchase as of the dates indicated (dollars in thousands):
| December 31, 2016 | ||||||||||||||||
| Date Issued |
Amount | Interest Rate | Original Term |
Maturity Date | ||||||||||||
| December 31, 2016 |
$ | 18,816 | 0.2% – 0.25% | 4 days | January 4, 2017 | |||||||||||
|
|
|
|||||||||||||||
| Total |
$ | 18,816 | 0.25% | |||||||||||||
|
|
|
|||||||||||||||
| December 31, 2015 | ||||||||||||||||
| Date Issued |
Amount | Interest Rate | Original Term |
Maturity Date | ||||||||||||
| December 31, 2015 |
$ | 14,360 | 0.08% – 0.25% | 4 days | January 4, 2016 | |||||||||||
|
|
|
|||||||||||||||
| Total |
$ | 14,360 | 0.19% | |||||||||||||
|
|
|
|||||||||||||||
The table below describes additional details regarding the Company’s securities sold under agreements to repurchase for the dates and periods indicated (dollars in thousands):
| Year Ended December 31, | ||||||||||||||||||||||||
| 2016 | 2015 | |||||||||||||||||||||||
| Balance | Average Balance |
Weighted Average Rate |
Balance | Average Balance |
Weighted Average Rate |
|||||||||||||||||||
| Securities sold under agreements to repurchase |
$ | 18,816 | $ | 22,739 | 0.23 | % | $ | 14,360 | $ | 13,966 | 0.22 | % | ||||||||||||
The maximum amount securities sold under agreements to repurchase outstanding at any month-end was $26 million and $17 million in 2016 and 2015, respectively.
139
Table of Contents
Federal Home Loan Bank Borrowings
The Company maintains a secured credit facility with the FHLB, allowing the Company to borrow on an overnight and term basis. The Company’s credit facility with the FHLB is $723 million, which represents approximately 25% of the Bank’s total assets, as reported by the Bank in its September 30, 2016 Federal Financial Institution Examination Council (FFIEC) Call Report. The Company had no outstanding advances (borrowings) with the FHLB as of December 31, 2016 or 2015, except for the annual testing of the borrowing lines.
As of December 31, 2016, the Company had $990 million of loan collateral pledged with the FHLB which provides $658 million in borrowing capacity. The Company has $16 million in investment securities pledged with the FHLB to further support this credit facility. In addition, the Company is required to purchase FHLB common stock to support its FHLB advances. At December 31, 2016 and 2015, the Company had $9.1 million and $8.0 million of FHLB common stock, respectively. The current value of the FHLB common stock of $9.1 million would support FHLB advances up to $340 million. To reach a total borrowing capacity of $674 million collateralized by the current level of pledged loans and securities would require additional purchases of FHLB stock. Further, pledging additional loans and/or securities will increase borrowing capacity up to 25% of the Bank’s total assets, however, additional FHLB stock would have to be purchased.
Interest on FHLB advances is generally paid monthly, quarterly or semi-annually depending on the terms of the advance, with principal and any accrued interest due at maturity.
The FHLB has historically repurchased a portion to all of its excess capital from each bank where the level of capital is in excess of that bank’s current average borrowings above a certain minimum. The FHLB’s program whereby the FHLB analyzes each member bank’s capital requirement and returns each bank’s excess capital above a certain minimum not needed for current borrowings. The FHLB did not repurchase any of the Company’s investment in FHLB capital stock during 2016 or 2015.
The FHLB has paid or declared dividends on its capital stock for all four quarters of the years ending December 31, 2016, 2015 and 2014.
Subordinated Debentures
The following table summarizes the terms of each issuance of subordinated debentures outstanding as of December 31, 2016 (dollars in thousands):
| Series |
Amount | Issuance Date |
Maturity Date |
Rate Index | Current Rate |
Next Reset Date |
||||||||||||||||||
| Trust I |
$ | 6,186 | 12/10/04 | 03/15/35 | 3 month LIBOR+2.05 | % | 3.01 | % | 03/15/17 | |||||||||||||||
| Trust II |
3,093 | 12/23/05 | 03/15/36 | 3 month LIBOR+1.75 | % | 2.71 | % | 03/15/17 | ||||||||||||||||
| Trust III |
3,093 | 06/30/06 | 09/15/36 | 3 month LIBOR+1.85 | % | 2.81 | % | 03/15/17 | ||||||||||||||||
|
|
|
|||||||||||||||||||||||
| Subtotal |
12,372 | |||||||||||||||||||||||
| Unamortized fair value adjustment |
2,516 | |||||||||||||||||||||||
|
|
|
|||||||||||||||||||||||
| Net |
$ | 9,856 | ||||||||||||||||||||||
|
|
|
|||||||||||||||||||||||
140
Table of Contents
The following table summarizes the terms of each issuance of subordinated debentures outstanding as of December 31, 2015:
| Series |
Amount | Issuance Date |
Maturity Date |
Rate Index | Current Rate |
Next Reset Date |
||||||||||||||||||
| Trust I |
$ | 6,186 | 12/10/04 | 03/15/35 | 3 month LIBOR+2.05 | % | 2.56 | % | 03/15/16 | |||||||||||||||
| Trust II |
3,093 | 12/23/05 | 03/15/36 | 3 month LIBOR+1.75 | % | 2.26 | % | 03/15/16 | ||||||||||||||||
| Trust III |
3,093 | 06/30/06 | 09/15/36 | 3 month LIBOR+1.85 | % | 2.36 | % | 03/15/16 | ||||||||||||||||
|
|
|
|||||||||||||||||||||||
| Subtotal |
12,372 | |||||||||||||||||||||||
| Unamortized fair value adjustment |
2,675 | |||||||||||||||||||||||
|
|
|
|||||||||||||||||||||||
| Net |
$ | 9,697 | ||||||||||||||||||||||
|
|
|
|||||||||||||||||||||||
The subordinated debentures were acquired as part of the PC Bancorp merger and were issued to trusts originally established by PC Bancorp, which in turn issued trust preferred securities. These subordinated debentures were issued in three separate series. Each issuance had a maturity of 30 years from their approximate date of issue. All three subordinated debentures are variable rate instruments that reprice quarterly based on the three month LIBOR plus a margin (see tables above). All three subordinated debentures had their interest rates reset in December 2016 at the current three month LIBOR plus their index, and will continue to reprice quarterly through their maturity date. All three subordinated debentures are currently callable at par with no prepayment penalties.
The original fair value adjustment related to the subordinated debentures was $3.3 million. The Company recorded $159 thousand, $159 thousand, and $159 thousand in amortization expense related to the fair value adjustment in 2016, 2015, and 2014, respectively. At December 31, 2016 the Company is estimating a remaining life of approximately 20 years on the subordinated debentures and is amortizing the fair value adjustment based on this estimated average remaining life. The Company is projecting annual amortization expense of approximately $159 thousand related to the fair value adjustment on the subordinated debentures.
Interest payments made by the Company on subordinated debentures are considered dividend payments under FRB regulations. Notification to the FRB is required prior to the Company declaring and paying a dividend during any period in which the Company’s quarterly net earnings are insufficient to fund the dividend amount. This notification requirement is included in regulatory guidance regarding safety and soundness surrounding capital and includes other non-financial measures such as asset quality, financial condition, capital adequacy, liquidity, future earnings projections, capital planning and credit concentrations. Should the FRB object to the dividend payments, the Company would be precluded from paying interest on the subordinated debentures after giving notice within 15 days before the payment date. Payments would not commence until approval is received or the Company no longer needs to provide notice under applicable guidance. The Company has the right, assuming no default has occurred, to defer payments of interest on the subordinated debentures at any time for a period not to exceed 20 consecutive quarters. The Company has not deferred any interest payments.
Note 14 – Derivative Financial Instruments
The Company is exposed to certain risks relating to its ongoing business operations and utilizes interest rate swap agreements (“swaps”) as part of its asset/liability management strategy to help manage its interest rate risk position. The Company has two counterparty banks.
Derivative Financial Instruments Acquired from 1st Enterprise
At December 31, 2016, the Company has eleven interest rate swap agreements with customers and eleven offsetting interest-rate swaps with a counterparty bank that were acquired as a result of the merger with 1st Enterprise on November 30, 2014. The swap agreements are not designated as hedging instruments. The purpose
141
Table of Contents
of entering into offsetting derivatives not designated as a hedging instrument is to provide the Company a variable-rate loan receivable and provide the customer the financial effects of a fixed-rate loan without creating significant interest rate risk in the Company’s earnings.
The structure of the swaps is as follows: The Company enters into a swap with its customers to allow them to convert variable rate loans to fixed rate loans, and at the same time, the Company enters into a swap with the counterparty bank to allow the Company to pass on the interest-rate risk associated with fixed rate loans. The net effect of the transaction allows the Company to receive interest on the loan from the customer at a variable rate based on LIBOR plus a spread. The changes in the fair value of the swaps primarily offset each other and therefore should not have a significant impact on the Company’s results of operations. Our interest rate swap derivatives acquired from 1st Enterprise are subject to a master netting arrangement with one counterparty bank. None of our derivative assets and liabilities are offset in the balance sheet.
The Company believes the risk of loss associated with counterparty borrowers relating to interest rate swaps is mitigated as the loans with swaps are underwritten to take into account potential additional exposure, although there can be no assurances in this regard since the performance of the swaps is subject to market and counterparty risk. At December 31, 2016 and 2015, the total notional amount of the Company’s swaps acquired from 1st Enterprise was $24 million and $28 million, respectively. The outstanding swaps have remaining maturities of up to 7 years as of December 31, 2016.
The following tables presents the fair values of the asset and liability of the Company’s derivative instruments acquired from 1st Enterprise as of the dates and periods indicated (dollars in thousands):
| Asset Derivatives | ||||||||
| December 31, 2016 |
December 31, 2015 |
|||||||
| Interest rate swap contracts fair value |
$523 | $881 | ||||||
|
|
|
|
|
|||||
| Balance sheet location |
|
Accrued Interest Receivable and Other Assets |
|
Accrued Interest Receivable and Other Assets |
||||
The following table presents the fair values of the liability of the Company’s derivative instruments acquired from 1st Enterprise as of the dates indicated (dollars in thousands):
| Liability Derivatives | ||||||||
| December 31, 2016 |
December 31, 2015 |
|||||||
| Interest rate swap contracts fair value |
$523 | $881 | ||||||
|
|
|
|
|
|||||
| Balance sheet location |
|
Accrued Interest Payable and Other Liabilities |
|
|
Accrued Interest Payable and Other Liabilities |
| ||
Derivative Financial Instruments Acquired from PC Bancorp
At December 31, 2016, the Company also has fourteen pay-fixed, receive-variable, interest rate contracts that are designed to convert fixed rate loans into variable rate loans. The Company acquired these interest rate swap contracts on July 31, 2012 as a result of the merger with PC Bancorp. Out of the fourteen interest rate swap contracts at December 31, 2016, twelve are designated as hedging instruments and hedge accounting is applied. All of the interest rate swap contracts acquired from PC Bancorp are with the same counterparty bank. The outstanding swaps have remaining maturities of up to 5 years as of December 31, 2016.
142
Table of Contents
The following table presents the notional amount and the fair values of the asset and liability of the Company’s derivative instruments acquired from PC Bancorp as of the dates indicated (dollars in thousands):
| Liability Derivatives | ||||||||
| December 31, 2016 |
December 31, 2015 |
|||||||
| Fair Value Hedges |
||||||||
| Total interest rate contracts notional amount |
$ | 17,642 | $ | 25,938 | ||||
|
|
|
|
|
|||||
| Derivatives not designated as hedging instruments: |
||||||||
| Interest rate swap contracts fair value |
$ | 95 | $ | 313 | ||||
| Derivatives designated as hedging instruments: |
||||||||
| Interest rate swap contracts fair value |
589 | 1,351 | ||||||
|
|
|
|
|
|||||
| Total interest rate contracts fair value |
$ | 684 | $ | 1,664 | ||||
|
|
|
|
|
|||||
| Balance sheet location |
|
Accrued Interest Payable and Other Liabilities |
|
|
Accrued Interest Payable and Other Liabilities |
| ||
The Effect of Derivative Instruments on the Consolidated Statements of Income
The following table summarizes the effect of derivative financial instruments on the consolidated statements of income for the periods indicated (dollars in thousands):
| Year
Ended December 31, |
||||||||||||
| 2016 | 2015 | 2014 | ||||||||||
| Derivatives not designated as hedging instruments: |
||||||||||||
| Interest rate swap contracts – loans |
||||||||||||
| Increase in fair value of interest rate swap contracts |
$ | 218 | $ | 206 | $ | 219 | ||||||
| Payments on interest rate swap contracts on loans |
(240 | ) | (263 | ) | (273 | ) | ||||||
|
|
|
|
|
|
|
|||||||
| Net decrease in other non-interest income |
$ | (22 | ) | $ | (57 | ) | $ | (54 | ) | |||
|
|
|
|
|
|
|
|||||||
| Derivatives designated as hedging instruments: |
||||||||||||
| Interest rate swap contracts – loans |
||||||||||||
| Increase in fair value of interest rate swap contracts |
$ | 762 | $ | 926 | $ | 927 | ||||||
| Increase (decrease) in fair value of hedged loans |
41 | 133 | 315 | |||||||||
| Payments on interest rate swap contracts on loans |
(821 | ) | (1,089 | ) | (1,256 | ) | ||||||
|
|
|
|
|
|
|
|||||||
| Net decrease in interest income on loans |
$ | (18 | ) | $ | (30 | ) | $ | (14 | ) | |||
|
|
|
|
|
|
|
|||||||
Under all of the Company’s interest rate swap contracts, the Company is required to pledge and maintain collateral for the credit support under these agreements. At December 31, 2016, the Company has pledged $1.8 million in investment securities and $2.7 million in certificates of deposit, for a total of $4.5 million, as collateral under the swap agreements.
Note 15 – Balance Sheet Offsetting
Assets and liabilities relating to certain financial instruments, including derivatives, and securities sold under repurchase agreements (“Repos”), may be eligible for offset in the consolidated balance sheets. The Company’s interest rate swap derivatives are subject to a master bilateral netting and offsetting arrangement under specific conditions as defined within a master agreement governing all interest rate swap contracts that the Company and the counterparty banks have entered into. In addition, the master agreement under which the interest rate contracts have been written require the pledging of assets by the Company based on certain risk thresholds. The Company has pledged a certificate of deposit and investment securities as collateral under the
143
Table of Contents
swap agreements. The pledged collateral under the swap agreements are reported in the Company’s consolidated balance sheets, unless the Company defaults under the master agreement. The Company currently does not net or offset the interest rate swap contracts in its consolidated balance sheets, as reflected within the table below.
The Company’s securities sold under repurchase agreements represent transactions the Company has entered into with several deposit customers. These transactions represent the sale of securities on an overnight or on a term basis to our deposit customers under an agreement to repurchase the securities from the customers the next business day or at maturity. There is an individual contract for each customer with only one transaction per customer. There is no master agreement that provides for the netting arrangement or the offsetting of these individual transactions or for the netting of collateral positions. The Company does not net or offset the Repos in its consolidated balance sheets as reflected within the table below.
The table below presents the Company’s financial instruments that may be eligible for offsetting which include securities sold under agreements to repurchase that have no enforceable master netting arrangement and derivative securities that could be offset in the consolidated financial statements due to an enforceable master netting arrangement (dollars in thousands):
| Gross Amounts Recognized in the Consolidated Balance Sheets |
Gross Amounts Offset in the Consolidated Balance Sheets |
Net Amounts of Assets Presented in the Consolidated Balance Sheets |
Gross Amounts Not Offset in the Consolidated Balance Sheets |
Net Amount (Collateral over liability balance required to be pledged) |
||||||||||||||||||||
| Financial Instruments |
Collateral Pledged |
|||||||||||||||||||||||
| December 31, 2016 |
||||||||||||||||||||||||
| Financial Assets: |
||||||||||||||||||||||||
| Interest rate swap contracts fair value (see Note 14 – Derivative Financial Instruments) |
$ | 523 | $ | — | $ | 523 | $ | 523 | $ | — | $ | — | ||||||||||||
|
|
|
|
|
|
|
|
|
|
|
|
|
|||||||||||||
| Total |
$ | 523 | $ | — | $ | 523 | $ | 523 | $ | — | $ | — | ||||||||||||
|
|
|
|
|
|
|
|
|
|
|
|
|
|||||||||||||
| Financial Liabilities: |
||||||||||||||||||||||||
| Interest rate swap contracts fair value (see Note 14 – Derivative Financial Instruments) |
$ | 1,207 | $ | — | $ | 1,207 | $ | 1,207 | $ | 4,555 | $ | 3,348 | ||||||||||||
| Securities sold under agreements to repurchase |
18,816 | — | 18,816 | 18,816 | 48,204 | 29,388 | ||||||||||||||||||
|
|
|
|
|
|
|
|
|
|
|
|
|
|||||||||||||
| Total |
$ | 20,023 | $ | — | $ | 20,023 | $ | 20,023 | $ | 52,759 | $ | 32,736 | ||||||||||||
|
|
|
|
|
|
|
|
|
|
|
|
|
|||||||||||||
144
Table of Contents
| Gross Amounts Recognized in the Consolidated Balance Sheets |
Gross Amounts Offset in the Consolidated Balance Sheets |
Net Amounts of Assets Presented in the Consolidated Balance Sheets |
Gross Amounts Not Offset in the Consolidated Balance Sheets |
Net Amount (Collateral over liability balance required to be pledged) |
||||||||||||||||||||
| Financial Instruments |
Collateral Pledged |
|||||||||||||||||||||||
| December 31, 2015 |
||||||||||||||||||||||||
| Financial Assets: |
||||||||||||||||||||||||
| Interest rate swap contracts fair value (see Note 14 – Derivative Financial Instruments) |
$ | 881 | $ | — | $ | 881 | $ | 881 | $ | — | $ | — | ||||||||||||
|
|
|
|
|
|
|
|
|
|
|
|
|
|||||||||||||
| Total |
$ | 881 | $ | — | $ | 881 | $ | 881 | $ | — | $ | — | ||||||||||||
|
|
|
|
|
|
|
|
|
|
|
|
|
|||||||||||||
| Financial Liabilities: |
||||||||||||||||||||||||
| Interest rate swap contracts fair value (see Note 14 – Derivative Financial Instruments) |
$ | 2,545 | $ | — | $ | 2,545 | $ | 2,545 | $ | 4,759 | $ | 2,214 | ||||||||||||
| Securities sold under agreements to repurchase |
14,360 | — | 14,360 | 14,360 | 46,596 | 32,236 | ||||||||||||||||||
|
|
|
|
|
|
|
|
|
|
|
|
|
|||||||||||||
| Total |
$ | 16,905 | $ | — | $ | 16,905 | $ | 16,905 | $ | 51,355 | $ | 34,450 | ||||||||||||
|
|
|
|
|
|
|
|
|
|
|
|
|
|||||||||||||
Note 16 – Stock Options and Restricted Stock
Equity Compensation Plans
The Company’s 2007 Equity and Incentive Plan (“Equity Plan”) was adopted by the Company in 2007 and replaced two prior equity compensation plans. The Equity Plan provides for significant flexibility in determining the types and terms of awards that may be made to participants. The Equity Plan was revised and approved by the Company’s shareholders in 2011 and adopted by the Company as part of the Bank holding company reorganization. This plan is designed to promote the interest of the Company in aiding the Company to attract and retain employees, officers and non-employee directors who are expected to contribute to the future success of the organization. The Equity Plan is intended to provide participants with incentives to maximize their efforts on behalf of the Company through stock-based awards that provide an opportunity for stock ownership. This plan provides the Company with a flexible equity incentive compensation program, which allows the Company to grant stock options, restricted stock, restricted stock award units and performance units. Certain options and share awards provide for accelerated vesting, if there is a change in control, as defined in the Equity Plan.
The Equity Plan was amended and restated in 2014 to (i) permit the grant of performance-based awards that are not subject to the deduction limitations of Section 162(m) of the Internal Revenue Code, including both equity compensation awards and cash bonus payments, (ii) prohibit the repricing of previously granted options; (iii) eliminate a provision of the Equity Plan that provides for an automatic annual increase in the shares of common stock available for awards under the Equity Plan; and (iv) extend the term of the plan to July 31, 2024.
Pursuant to the merger with 1st Enterprise as discussed in Note 2 above, CU Bancorp adopted the 1st Enterprise 2006 Stock Incentive Plan, as amended (“2006 Stock Incentive Plan”), as its own equity plan and all stock options granted by 1st Enterprise thereunder were fully vested and exercisable and were converted to CU Bancorp stock options on substantially the same terms but adjusted to reflect the exchange ratio set forth in the Merger Agreement and applicable Internal Revenue Code provisions and related regulations. No new equity
145
Table of Contents
awards will be granted under the 2006 Stock Incentive Plan. A total of 802,766 converted 1st Enterprise stock options were adopted into CU Bancorp stock options under the Equity Plan with a fair value of $9.6 million and an intrinsic value of $11 million at the merger date.
Under the Equity Plan, there are a total of 1,490,547 shares authorized. A total of 1,129,892 shares have been issued out of the plan, with 80,916 of these issued shares subsequently cancelled and returned back into the plan, leaving 441,571 available to be issued.
All non-qualified and incentive stock options granted under the current Equity Plan and the earlier 2005 equity compensation plans, have been issued with the exercise prices of the stock options equal to the fair market value of the underlying shares at the date of grant.
The Equity Plan and the original 2005 equity compensation plans provided for the issuance of non-qualified and incentive stock options. These plans provided that each option must have an exercise price not less than the fair market value of the stock at the date of grant and terms to expiration not to exceed ten years. All options granted under the plans require continuous service and have been issued with vesting increments of between 20% through 50% per year. All stock options issued under the original 2005 equity compensation plans that have not expired remain outstanding with no changes in their vesting, maturity date or rights.
At December 31, 2016, future compensation expense related to unvested restricted stock grants aggregated to the amounts reflected in the table below (dollars in thousands):
| Future Stock Based Compensation Expense |
Restricted Stock |
|||
| 2017 |
$ | 2,081 | ||
| 2018 |
762 | |||
| 2019 |
220 | |||
| 2020 |
43 | |||
| Thereafter |
— | |||
|
|
|
|||
| Total |
$ | 3,106 | ||
|
|
|
|||
At December 31, 2016, the weighted-average period over which the total compensation cost related to unvested restricted stock grants not yet recognized is 2.5 years. There was no future compensation expense related to stock options as of December 31, 2016. All stock options outstanding at December 31, 2016 are vested.
The estimated fair value of both incentive stock options and non-qualified stock options granted in prior years, have been calculated using the Black-Scholes option pricing model. There have been no incentive stock options and no non-qualified stock options issued in 2014, 2015 or 2016. The following is the listing of the input variables and the assumptions utilized by the Company for each parameter used in the Black-Scholes option pricing model in prior years:
Risk-free Rate – The risk-free rate for periods within the contractual life of the option have been based on the U.S. Treasury rate that matures on the expected assigned life of the option at the date of the grant.
Expected Life of Options – The expected life of options have either been calculated using a formula from the Securities and Exchange Commission “SEC” for companies that do not have sufficient historical data to calculate the expected life, or from the estimated life of options granted by the Company. The formula from the SEC calculation of expected life is specifically based on the following: the expected life of the option is equal to the average of the contractual life and the vesting period of each option.
Expected Volatility –Beginning in 2009, the expected volatility has been based on the historical volatility for the Company’s shares.
146
Table of Contents
Dividend Yield – The dividend yield has been based on historical experience and expected future changes on dividend payouts. The Company has not declared or paid dividends on its common stock in the past and does not expect to declare or pay dividends on its common stock within the foreseeable future.
Stock Options
There were no stock options granted by the Company in 2014, 2015 or 2016.
The following table summarizes the stock option activity under the plans for the year ended December 31, 2016:
| Shares | Weighted Average Exercise Price |
Weighted Average Remaining Contractual Term (in years) |
Aggregate Intrinsic Value (in thousands) |
|||||||||||||
| Outstanding stock options at December 31, 2015 |
557,471 | $ | 10.57 | 0.8 | $ | 8,248 | ||||||||||
| Granted |
— | |||||||||||||||
| Exercised |
(505,274 | ) | ||||||||||||||
| Forfeited |
— | |||||||||||||||
| Expired |
(4,500 | ) | ||||||||||||||
|
|
|
|||||||||||||||
| Outstanding stock options at December 31, 2016 |
47,697 | $ | 12.69 | 1.43 | $ | 1,102 | ||||||||||
|
|
|
|||||||||||||||
| Exercisable options at December 31, 2016 |
47,697 | $ | 12.69 | 1.43 | $ | 1,102 | ||||||||||
| Unvested options at December 31, 2016 |
— | |||||||||||||||
The total intrinsic value of options exercised during the years ended December 31, 2016, 2015, and 2014 was $6.8 million, $6.5 million, and $2.1 million, respectively.
Restricted Stock
The weighted-average grant-date fair value per share in the table below is calculated by taking the total aggregate cost of the restricted shares issued divided by the number of shares of restricted stock issued. The aggregate cost of the restricted stock was calculated by multiplying the number of shares granted at each of the grant dates by the closing stock price of the Company’s common stock on the date of the grant. The following table summarizes the restricted stock activity under the Equity Plan for the year ended December 31, 2016 (dollars in thousands):
| Number of Shares |
Weighted-Average Grant-Date Fair Value per Share |
|||||||
| Restricted Stock: |
||||||||
| Unvested, at December 31, 2015 |
311,458 | $ | 19.29 | |||||
| Granted |
142,309 | 23.80 | ||||||
| Vested |
(160,310 | ) | 18.93 | |||||
| Cancelled and forfeited |
(11,375 | ) | 20.88 | |||||
|
|
|
|||||||
| Unvested, at December 31, 2016 |
282,082 | $ | 21.98 | |||||
|
|
|
|
|
|||||
Restricted stock compensation expense was $3.6 million, $2.7 million, and $1.7 million for the period ended December 31, 2016, 2015, and 2014, respectively. Restricted stock awards reflected in the table above are valued at the closing stock price on the date of grant and are expensed to stock based compensation expense over the period for which the related service is performed. The weighted-average grant-date fair value per share for
147
Table of Contents
restricted stock granted for 2016, 2015, and 2014 was $23.80, $21.51, and $19.39, respectively. The total fair value of shares vested during the year for 2016, 2015, and 2014 is $4.3 million, $2.7 million, and $2.3 million, respectively. In 2015, the Company granted 40 thousand shares of Restricted Stock Unit (“RSU”) under the Equity Plan to one of its executive officers. Such grant is reflected in the table above. The shares of common stock underlying the 40 thousand shares of RSU will not be issued until the RSUs vest and are not included in the Company’s shares outstanding as of December 31, 2016. The RSUs are valued at the closing stock price on the date of grant and are expensed to stock based compensation expense over the period for which the related service is performed.
Excess Tax Benefits
On July 1, 2016, and effective January 1, 2016, the Company early adopted ASU 2016-09 which provides improvements to the accounting for employee share-based payments. As a result of this new standard, excess tax benefits from exercise or vesting of share-based awards are included as a reduction in provision for income tax expense in the period in which the exercise or vesting occurs. The following table presents excess tax benefits recognized, by award type (dollars in thousands):
| Year Ended December 31, 2016 | ||||||||
| Number of Awards Exercised or Vested |
Related Excess Tax Benefits |
|||||||
| Stock Options |
505,274 | $ | 914 | |||||
| Restricted Stock |
160,310 | 523 | ||||||
|
|
|
|
|
|||||
| Total |
665,584 | $ | 1,437 | |||||
|
|
|
|
|
|||||
Note 17 – Supplemental Executive Retirement Plan and Other Deferred Compensation Plans
The Company adopted a non-qualified supplemental executive retirement plan (“SERP”) for certain executives of the Company effective October 1, 2012. In addition, the Company acquired several SERP plans from the 2012 PC Bancorp acquisition. These SERP plans provide the designated executives with retirement benefits. Pre-retirement survivor benefits are provided for designated beneficiaries of participants who do not survive until retirement in an amount equal to the lump sum actuarial equivalent of the participant’s accrued benefit under the SERP. The SERP is considered an unfunded plan for tax and ERISA purposes. All obligations arising under the SERP are payable from the general assets of the Company. At December 31, 2016 and 2015, the SERP plan had accrued liabilities of $4.9 million and $3.3 million, respectively.
As a result of its acquisition of 1st Enterprise in 2014, the Company acquired a deferred compensation plan. This deferred compensation plan was established in which eligible employees can elect to defer a percentage of salary of bonuses to be paid after terminating employment with the Company. Payments can be made in lump sum or equal installments for as long as 10 years. A deferral account is established for each participant and the account will earn interest quarterly based on the Company’s established crediting rate. Participants are immediately 100% vested for the amount of their deferral account. For the years ended December 31, 2016, 2015 and 2014, the Company recognized deferred compensation expense of $1.0 million, $947 thousand and $705 thousand under this plan, respectively.
The Company acquired, as a result of its acquisition of PC Bancorp, a Supplemental Employee Salary Continuation Plan, a Deferred Director Fee Plan, and a Split Dollar Employee Insurance Plan for certain executive officers and one Director of PC Bancorp. At December 31, 2016, the accrued liability of the PC Bancorp Supplemental Employee Salary Plan was $1.0 million, and the accrued liability of the Deferred Director Fee Plan was $251 thousand, and the accrued liability of the Split Dollar Employee Insurance Plan was $1.2 million. At December 31, 2015, the accrued liability of the PC Bancorp Supplemental Employee Salary Plan was $1.1 million, and the accrued liability of the Deferred Director Fee Plan was $282 thousand, and the accrued
148
Table of Contents
liability of the Split Dollar Employee Insurance Plan was $1.2 million. The Company recorded a total of $69 thousand, $68 thousand, and $72 thousand of expense for all plans acquired from PC Bancorp for the years ended December 31, 2016, 2015 and 2014.
Note 18 – Defined Contribution Plan 401(k)
The Company has a 401(k) defined contribution plan for the benefit of its employees. The California United Bank 401(k) Profit Sharing Plan (the “401(k) Plan”) allows eligible employees to contribute a portion of their income to a trust for investment on a pre-tax basis until retirement. Participants are 100% vested in their own deferrals. The dollar amount an individual employee may contribute is subject to regulatory limits.
In 2014 and 2015, the Company matched $0.50 on the dollar for every dollar the employee contributed to the plan, up to a maximum of 3% of the employee’s eligible compensation subject to an IRS limitation. In 2016, the Company matched $0.50 on the dollar for every dollar the employee contributed to the plan, up to a maximum of 2.5% of the employee’s eligible compensation subject to an IRS limitation.
The Company’s expense relating to the contributions made to the 401(k) plan for the benefit of its employees was $548 thousand, $642 thousand and $418 thousand for the years ended December 31, 2016, 2015, and 2014, respectively.
Note 19 – Income Taxes
The Company provides for current federal and state income taxes payable and for deferred taxes that result from differences between financial accounting rules and tax laws governing the timing of recognition of various income and expense items. The Company recognizes deferred income tax assets and liabilities for the future tax effects of such temporary differences based on the difference between the financial statement and tax bases of the existing assets and liabilities using the statutory rate expected in the years in which the differences are expected to reverse. The effect on deferred taxes of any enacted change in tax rates is recognized in income in the period that includes the enactment date. The future realization of any of the Company’s deferred tax assets ultimately depends on the existence of sufficient taxable income of the appropriate character (for example, ordinary income or capital gain) within the carryback or carryforward periods available under the tax law. Based on historical and future expected taxable earnings and available tax strategies, the Company concluded that it is more likely than not that all the benefit of the deferred tax assets will be realized, with the exception of the deferred tax assets related to certain capital loss carryforward from separate reporting years that are subject to limitation.
The tax effects from an uncertain tax position are recognized in the financial statements only if, based on its merits, the position is more likely than not to be sustained on audit by the taxing authorities. The Company believes that there are no material uncertain tax positions at December 31, 2016, 2015, and 2014. Interest and penalties related to uncertain tax positions, if any, are recorded as part of other operating expense.
Income tax expense consists of the following (dollars in thousands):
| Year Ended December 31, | ||||||||||||
| 2016 | 2015 | 2014 | ||||||||||
| Current provision |
||||||||||||
| Federal |
$ | 10,921 | $ | 9,265 | $ | 4,517 | ||||||
| State |
3,653 | 2,923 | 1,183 | |||||||||
|
|
|
|
|
|
|
|||||||
| Total current provision |
14,574 | 12,188 | 5,700 | |||||||||
| Deferred provision |
||||||||||||
| Federal |
923 | 291 | 382 | |||||||||
| State |
456 | 389 | 350 | |||||||||
|
|
|
|
|
|
|
|||||||
| Total deferred provision |
1,379 | 680 | 732 | |||||||||
|
|
|
|
|
|
|
|||||||
| Total current and deferred provision |
$ | 15,953 | $ | 12,868 | $ | 6,432 | ||||||
|
|
|
|
|
|
|
|||||||
149
Table of Contents
The following is a summary of the components of the net deferred tax assets recognized in the consolidated balance sheets as of the dates indicated (dollars in thousands):
| December 31, | ||||||||
| 2016 | 2015 | |||||||
| Deferred Tax Assets |
||||||||
| Federal tax operating loss carryforward |
$ | 60 | $ | 64 | ||||
| State tax operating loss carryforward |
165 | 170 | ||||||
| Allowance for loan loss |
9,293 | 7,473 | ||||||
| Purchase accounting and loan fair value adjustments |
3,820 | 7,024 | ||||||
| Accruals and other liabilities |
929 | 958 | ||||||
| Stock compensation and deferred compensation costs |
4,618 | 5,732 | ||||||
| Net unrealized loss on securities available-for-sale |
2,190 | 593 | ||||||
| Start up, organizational and other costs |
244 | 332 | ||||||
|
|
|
|
|
|||||
| Total deferred tax assets |
21,319 | 22,346 | ||||||
|
|
|
|
|
|||||
| Deferred Tax Liabilities |
||||||||
| State tax liability |
(64 | ) | (441 | ) | ||||
| Unamortized fair value on subordinated debentures |
(1,153 | ) | (1,230 | ) | ||||
| Core deposit intangibles |
(2,397 | ) | (2,984 | ) | ||||
| Prepaid expense and other |
(518 | ) | (652 | ) | ||||
|
|
|
|
|
|||||
| Total deferred tax liabilities |
(4,132 | ) | (5,307 | ) | ||||
|
|
|
|
|
|||||
| Valuation allowance |
(6 | ) | (6 | ) | ||||
|
|
|
|
|
|||||
| Deferred tax assets, net |
$ | 17,181 | $ | 17,033 | ||||
|
|
|
|
|
|||||
The Company’s deferred tax assets and deferred tax liabilities include balances associated with the acquisition of 1st Enterprise in 2014, PC Bancorp in 2012 and COSB in 2010, which are non-taxable business combinations. These balances represent temporary differences for which deferred tax assets and liabilities are recognized because the financial statement carrying amounts of the acquired assets and assumed liabilities generally are their respective fair values at the date of the acquisition, whereas the tax basis equals the acquiree’s former tax basis (carryover tax basis).
In addition, the Company has a state tax capital loss carryforward acquired from the PC Bancorp acquisition of $54 thousand at December 31, 2016 and at December 31, 2015. The capital loss carryforward expired in 2016.
The Company has a $1.2 million state net operating loss carryforward at CU Bancorp that arose from CU Bancorp’s 2012 separately filed tax return. The ability to utilize this net operating loss is dependent upon allocation of sufficient consolidated income to CU Bancorp in the future based on a three-factor formula. In assessing the need for a valuation allowance against these losses, the Company carefully weighed both positive and negative evidence currently available. Based upon the evidence, the Company concluded it is more likely than not that these net operating losses will be realized before the expiration in 2032.
The Company also has a $172 thousand capital loss carryforward that was generated in 2014. The Company concluded it is more likely than not that this capital loss carryforward will be realized before the expiration in 2019.
The Company’s investments in Qualified Affordable Housing Projects generated low income housing tax credits and benefits net of investment amortization of $92 thousand and $107 thousand in 2016 and 2015, respectively. See Note 11- Investments in Qualified Affordable Housing Projects for a discussion on the investments.
150
Table of Contents
On July 1, 2016, and effective January 1, 2016, the Company early adopted ASU 2016-09 which provides improvements to the accounting for employee share-based payments. As a result of this new standard, excess tax benefits from exercise or vesting of share-based awards are included as a reduction in provision for income tax expense in the period in which the exercise or vesting occurs. See Note 16, Stock Options and Restricted Stock under “Excess Tax Benefits” for additional information.
The following table presents a reconciliation of the statutory income tax rate to the consolidated effective income tax rate for each of the periods indicated (dollars in thousands):
| For Years Ended December 31, | ||||||||||||||||||||||||
| 2016 | 2015 | 2014 | ||||||||||||||||||||||
| Amount | Percent | Amount | Percent | Amount | Percent | |||||||||||||||||||
| Federal income tax expense at statutory rate |
$ | 15,193 | 35.00 | % | $ | 11,937 | 35.00 | % | $ | 5,369 | 35.00 | % | ||||||||||||
| State franchise taxes, net of federal benefit, excluding LIHTC investments |
2,743 | 6.32 | 2,236 | 6.55 | 1,209 | 7.88 | ||||||||||||||||||
| Release of state valuation allowance on use of net operating loss |
— | — | (29 | ) | (0.09 | ) | (68 | ) | (0.44 | ) | ||||||||||||||
| Meals and entertainment, dues and other non-deductible items |
142 | 0.33 | 132 | 0.39 | 75 | 0.49 | ||||||||||||||||||
| Cash surrender life insurance |
(456 | ) | (1.05 | ) | (453 | ) | (1.33 | ) | (231 | ) | (1.51 | ) | ||||||||||||
| Stock compensation expense |
(68 | ) | (0.16 | ) | (100 | ) | (0.29 | ) | (53 | ) | (0.35 | ) | ||||||||||||
| Excess tax benefit from stock transactions |
(1,196 | ) | (2.75 | ) | — | — | — | — | ||||||||||||||||
| LIHTC investments |
(111 | ) | (0.25 | ) | (141 | ) | (0.41 | ) | (119 | ) | (0.77 | ) | ||||||||||||
| Merger costs |
— | — | — | — | 515 | 3.36 | ||||||||||||||||||
| Tax Exempt Income |
(290 | ) | (0.67 | ) | (314 | ) | (0.92 | ) | — | — | ||||||||||||||
| Other |
(4 | ) | (0.01 | ) | (400 | ) | (1.17 | ) | (265 | ) | (1.73 | ) | ||||||||||||
|
|
|
|
|
|
|
|
|
|
|
|
|
|||||||||||||
| $ | 15,953 | 36.76 | % | $ | 12,868 | 37.73 | % | $ | 6,432 | 41.93 | % | |||||||||||||
|
|
|
|
|
|
|
|
|
|
|
|
|
|||||||||||||
The Company’s federal income tax returns for the years ended December 31, 2013 through 2015 are open for examination by federal taxing authorities and the Company’s state income tax returns for the years ended December 2012 through 2015 are open for examination by state taxing authorities.
During 2016, the Company concluded an examination by the California Franchise Tax Board of the Enterprise Zone net interest deduction that the Company included in its California 2011 and 2012 tax returns. The California Franchise Tax Board has issued a closing letter with no material adjustments that impact the consolidated financial statements.
The Company has not been notified of any other pending tax examinations by taxing authorities.
Note 20 – Shareholders’ Equity
Common Stock
Holders of shares of the Company’s common stock are entitled to one vote for each share held of record on all matters voted upon by shareholders. Furthermore, the holders of the Company’s common stock have no preemptive rights to subscribe for new issue securities, and shares of the Company’s common stock are not subject to redemption, conversion, or sinking fund provisions.
With respect to the payment of dividends, after the preferential dividends upon all other classes and series of stock entitled thereto have been paid or declared and set apart for payment, then the holders of the Company’s common stock are entitled to such dividends as may be declared by the Company’s board of directors out of funds legally available under the laws of the State of California. Refer to Note 22—Regulatory Matters for further discussion on restrictions on dividends.
151
Table of Contents
Upon the Company’s liquidation or dissolution, the assets legally available for distribution to holders of the Company’s shares of common stock, after payment of all the Company’s obligations and payment of any liquidation preference of all other classes and series of stock entitled thereto, including the Company’s preferred stock, are distributable ratably among the holders of the Company’s common stock.
During 2016, the Company issued 505,274 shares of stock from the exercise of employee stock options for a total value of $5.2 million. The Company also issued 142,309 shares of restricted stock to the Company’s directors and employees, cancelled 11,375 shares of unvested restricted stock related to employee turnover and cancelled 52,591 shares of restricted stock that had a value of $1.4 million when employees elected to pay their tax obligation via the repurchase of the stock by the Company. The Equity Plan, as amended, allows employees to make an election to have a portion of their restricted stock that became vested during the year repurchased by the Company to provide funds to pay the employee’s tax obligation related to the vesting of the stock. See Note 16 – Stock Options and Restricted Stock under “Equity Compensation Plans” for a more detailed analysis related to the issuances of these shares.
Preferred Stock
As discussed in Note 2, Business Combinations, the Company completed the merger with 1st Enterprise on November 30, 2014. As part of the Merger Agreement, 16,400 shares of preferred stock issued by 1st Enterprise as part of the Small Business Lending Fund (SBLF) program of the United States Department of the Treasury was converted into 16,400 CU Bancorp shares with substantially identical terms. CU Bancorp Preferred Stock has a liquidation preference amount of $1 thousand per share, designated as the Company’s Non-Cumulative Perpetual Preferred Stock, Series A. The U.S. Department of the Treasury is the sole holder of all outstanding shares of CU Bancorp Preferred Stock. The CU Bancorp Preferred Stock had an estimated life of four years and the fair value was $16 million at the merger date, resulting in a net discount of $479 thousand. The life-to-date accretion on the net discount as of December 31, 2016 is $1.0 million.
Dividends on the Company’s Series A Preferred Stock are payable quarterly in arrears if authorized and declared by the Company’s board of directors out of legally available funds, on a non-cumulative basis, on the $1 thousand per share liquidation preference amount. Dividends are payable on January 1, April 1, July 1 and October 1 of each year. The current coupon dividend rate was adjusted to 9% on March 1, 2016 through perpetuity. However, the dividend yield through November 30, 2018 approximates 7% as a result of business combination accounting. Dividends on the Series A Preferred Stock are non-cumulative. There is no sinking fund with respect to dividends on the Series A Preferred Stock. So long as the Company’s Series A Preferred Stock remains outstanding, the Company may declare and pay dividends on the common stock only if full dividends on all outstanding shares of Series A Preferred Stock for the most recently completed dividend period have been or are contemporaneously declared and paid. In the event of any voluntary or involuntary liquidation, dissolution or winding up of the affairs of the Company, holders of the Series A Preferred Stock will be entitled to receive for each share of Series A Preferred Stock, out of the Company’s assets or proceeds available for distribution to the Company’s shareholders, subject to any rights of the Company’s creditors, before any distribution of assets or proceeds is made to or set aside for the holders of the common stock, payment of an amount equal to the sum of (i) the $1 thousand liquidation preference amount per share and (ii) the amount of any accrued and unpaid dividends on the Series A Preferred Stock. To the extent the assets or proceeds available for distribution to shareholders are not sufficient to fully pay the liquidation payments owing to the holders of the Series A Preferred Stock and the holders of any other class or series of the stock ranking equally with the Series A Preferred Stock, the holders of the Series A Preferred Stock and such the Company’s stock will share ratably in the distribution. Holders of the Series A Preferred Stock have no right to exchange or convert their shares into common stock or any other securities and do not have voting rights.
152
Table of Contents
Accumulated Other Comprehensive Income (Loss)
The following table presents the changes in accumulated other comprehensive income (loss) by component for the periods indicated (dollars in thousands):
| For the Year
Ended December 31, |
||||||||||||||||
| 2016 | 2015 | 2014 | Statement of Income Line Item for Reclassified Items |
|||||||||||||
| Beginning balance, net of tax |
$ | (816 | ) | $ | 190 | $ | (205 | ) | ||||||||
| Net unrealized gain (loss) arising during the period |
(3,543 | ) | (1,624 | ) | 628 | |||||||||||
| Related tax effect |
1,490 | 683 | (260 | ) | ||||||||||||
| Reclassification of (gain) loss on investment securities available-for-sale to net income |
(258 | ) | (112 | ) | 47 | |
Gain on sale of securities, net |
| ||||||||
| Related tax effect |
108 | 47 | (20 | ) | |
Provision for income tax expense |
| |||||||||
|
|
|
|
|
|
|
|||||||||||
| Other Comprehensive Income (Loss) |
(2,203 | ) | (1,006 | ) | 395 | |||||||||||
|
|
|
|
|
|
|
|||||||||||
| Ending balance |
$ | (3,019 | ) | $ | (816 | ) | $ | 190 | ||||||||
|
|
|
|
|
|
|
|||||||||||
Note 21 – Commitments and Contingencies
Financial Instruments with Off Balance Sheet Risk
In the normal course of business, the Company is a party to financial instruments with off-balance sheet risk. These financial instruments include commitments to extend credit. To varying degrees, these instruments involve elements of credit and interest rate risk in excess of the amount recognized in the balance sheet. The Company’s exposure to credit loss in the event of nonperformance by the other party to the financial instruments for commitments to extend credit is represented by the contractual amount of those instruments.
Commitments to extend credit are agreements to lend to a customer as long as there is no violation of any condition established in the contract. Commitments generally have fixed expiration dates or other termination clauses and may require payment of a fee. Some of the Company’s commitments are expected to expire without being drawn upon, with the total commitment amounts not necessarily representing future cash funding requirements. The Company evaluates each customer’s creditworthiness on a case-by-case basis. The amount of collateral obtained if deemed necessary by the Company upon extension of credit is based on management’s credit evaluation of the borrower. Collateral held varies, but may include accounts receivable, inventory, property, plant and equipment, income-producing commercial properties, residential properties and properties under construction.
Financial instruments with off balance sheet risk include commitments to extend credit of $1 billion and $806 million at December 31, 2016 and 2015, respectively. Included in the aforementioned commitments were standby letters of credit outstanding of $85 million and $73 million at December 31, 2016 and 2015, respectively. As of December 31, 2016 and 2015, the Company had established a reserve for estimated losses on unfunded loan commitments of $886 thousand and $608 thousand, respectively. These balances are included in other liabilities on the balance sheet.
Litigation
From time to time the Company is a party to claims and legal proceedings arising in the ordinary course of business. The Company accrues for any probable loss contingencies that are estimable and discloses any material
153
Table of Contents
losses. As of December 31, 2016, there were no legal proceedings against the Company the outcome of which are expected to have a material adverse impact on the Company’s financial position, results of operations or cash flows, as a whole.
Note 22 – Regulatory Matters
The Company (on a consolidated basis) and the Bank are subject to various regulatory capital requirements administered by federal and state banking agencies. Failure to meet minimum capital requirements can initiate certain mandatory and possibly discretionary actions by regulators that, if undertaken, could have a direct material effect on the Company’s financial statements. Under capital adequacy guidelines and the regulatory framework for prompt corrective action, the Company and the Bank must meet specific capital requirements that involve quantitative measures of the Company’s assets, liabilities, and certain off-balance sheet items as calculated under regulatory accounting practices. The Company’s capital amounts and classification are also subject to qualitative judgments by the regulators about components, risk weightings and other factors.
The Company currently includes in Tier 1 capital an amount of subordinated debentures equal to no more than 25% of the sum of all core capital elements, which is generally defined as shareholders’ equity less goodwill, core deposit intangibles and a portion of the SBA servicing assets. On July 2, 2013, the Board of Governors of the Federal Reserve System (“Federal Reserve”) approved a final rule (the “Final Rule”) that revises the current capital rules for U.S. banking organizations including the capital rules for the Company. The FDIC adopted the rule as an “interim final rule” on July 9, 2013. The Final Rule implements the regulatory capital reforms recommended by the Basel Committee. The Final Rule permanently grandfathers non-qualifying capital instruments, such as trust preferred securities and cumulative perpetual preferred stock issued before May 19, 2010, for inclusion in the Tier 1 Risk-based capital of banking organizations with total consolidated assets less than $15 billion as of December 31, 2009, such as the Company. As a result, the Company’s trust preferred securities will continue to be included in Tier 1 Risk-Based Capital. The Company also currently includes in its Tier 1 capital an amount of Non-Cumulative Perpetual Preferred Stock, Series A issued under the SBLF program. The U.S. Department of the Treasury is the sole holder of all outstanding shares of CU Bancorp Preferred Stock. Under the Final Rule, the CU Bancorp Preferred Stock will continue to be included in Tier 1 risk-based capital.
At December 31, 2016, the respective capital ratios of the Company and the Bank exceeded the minimum percentage requirements to be deemed “well-capitalized” for Prompt Corrective Action (“PCA”) purpose and the Basel III minimum capital ratios with buffer (effective January 1, 2016) under the current capital guidelines. The following tables present the regulatory capital ratios requirements and the actual capitalization levels of the Company and the Bank as of the dates indicated (dollars in thousands):
CU Bancorp
| December 31, 2016 |
December 31, 2015 |
Well Capitalized |
Basel III Minimum with Buffer |
|||||||||||||
| Amount | Amount | (greater than or equal to) | ||||||||||||||
| Regulatory Capital Ratios: |
||||||||||||||||
| Tier 1 leverage ratio |
9.72 | % | 9.67 | % | 5.0 | % | NA | |||||||||
| Common Equity Tier 1 ratio |
9.61 | % | 9.61 | % | 6.5 | % | 5.125 | % | ||||||||
| Total Tier 1 risk-based capital ratio |
10.68 | % | 10.85 | % | 8.0 | % | 6.625 | % | ||||||||
| Total risk-based capital ratio |
11.44 | % | 11.54 | % | 10.0 | % | 8.625 | % | ||||||||
| Regulatory Capital Data: |
||||||||||||||||
| Common Equity Tier 1 |
$ | 257,105 | $ | 223,977 | ||||||||||||
| Total Tier 1 capital |
285,843 | 252,681 | ||||||||||||||
| Total risk-based capital |
306,103 | 268,971 | ||||||||||||||
| Average total assets* |
2,940,790 | 2,611,774 | ||||||||||||||
| Risk-weighted assets |
2,675,987 | 2,329,770 | ||||||||||||||
154
Table of Contents
California United Bank:
| December 31, 2016 |
December 31, 2015 |
Well Capitalized |
Basel III Minimum with Buffer |
|||||||||||||
| Amount | Amount | (greater than or equal to) | ||||||||||||||
| Regulatory Capital Ratios: |
||||||||||||||||
| Tier 1 leverage ratio |
9.35 | % | 9.34 | % | 5.0 | % | NA | % | ||||||||
| Common Equity Tier 1 ratio |
10.28 | % | 10.47 | % | 6.5 | % | 5.125 | % | ||||||||
| Total Tier 1 risk-based capital ratio |
10.28 | % | 10.47 | % | 8.0 | % | 6.625 | % | ||||||||
| Total risk-based capital ratio |
11.04 | % | 11.17 | % | 10.0 | % | 8.625 | % | ||||||||
| Regulatory Capital Data: |
||||||||||||||||
| Common Equity Tier 1 |
$ | 275,151 | $ | 243,989 | ||||||||||||
| Tier 1 capital |
275,151 | 243,989 | ||||||||||||||
| Total risk-based capital |
295,411 | 260,279 | ||||||||||||||
| Average total assets * |
2,941,253 | 2,612,206 | ||||||||||||||
| Risk-weighted assets |
2,677,030 | 2,329,798 | ||||||||||||||
| * | Represents the average total assets for the leverage ratio |
Restrictions on Dividends
As discussed in Note 2, Business Combinations, the Company completed the merger with 1st Enterprise on November 30, 2014. As part of the Merger Agreement, 16,400 shares of preferred stock issued by 1st Enterprise as part of the SBLF program of the United States Department of Treasury was converted into substantially 16,400 identical shares with identical terms. In December 2016, the Board approved a quarterly dividend payment on the preferred shares of $369 thousand to the United States Department of the Treasury.
Payment of stock or cash dividends in the future will depend upon earnings, liquidity, financial condition and other factors deemed relevant by our Board of Directors. Notification to the FRB is required prior to declaring and paying a dividend to shareholders that exceeds earnings for the period for which the dividend is being paid. This notification requirement is included in regulatory guidance regarding safety and soundness surrounding capital and includes other non-financial measures such as asset quality, financial condition, capital adequacy, liquidity, future earnings projections, capital planning and credit concentrations. Should the FRB object to dividend payments, the Company would be precluded from declaring and paying dividends until approval is received or the Company no longer needs to provide notice under applicable guidance.
California law also limits the Company’s ability to pay dividends. A corporation may make a distribution/dividend from retained earnings to the extent that the retained earnings exceed (a) the amount of the distribution plus (b) the amount if any, of dividends in arrears on shares with preferential dividend rights. Alternatively, a corporation may make a distribution/dividend, if, immediately after the distribution, the value of its assets equals or exceeds the sum of (a) its total liabilities plus (b) the liquidation preference of any shares which have a preference upon dissolution over the rights of shareholders receiving the distribution/dividend.
The Bank is subject to certain restrictions on the amount of dividends that may be declared without regulatory approval. Such dividends shall not exceed the lesser of the Bank’s retained earnings or net income for its last three fiscal years less any distributions to shareholders made during such period. In addition, the Bank may not pay dividends that would result in its capital being reduced below the minimum requirements shown above for capital adequacy purposes.
155
Table of Contents
Consent Order
On September 23, 2016, California United Bank (the “Bank”), the wholly owned subsidiary of CU Bancorp (the “Company”) entered into a Stipulation to the Issuance of a Consent Order with its bank regulatory agencies, the Federal Deposit Insurance Corporation (“FDIC”) and the California Department of Business Oversight (“CDBO”), consenting to the issuance of a consent order (the “Consent Order”) relating to weaknesses in the Bank’s Bank Secrecy Act and Anti-Money Laundering (collectively “BSA”) compliance program. In consenting to the issuance of the Consent Order, the Bank did not admit or deny any charges of unsafe or unsound banking practices related to the BSA compliance program.
Under the terms of the Consent Order the Bank and/or its Board of Directors is required to take certain actions which include, but are not limited to: a) Increasing Board supervision of the BSA compliance program; b) Notification to the regulatory agencies prior to appointment of a new BSA Officer or the executive to whom the BSA Officer reports; c) Formulation of a written action plan describing the actions to be taken to correct BSA/AML related deficiencies, a revised, written BSA/AML compliance program and review and enhancement of the Bank’s BSA risk assessment; d) Performance of a review of BSA staffing needs; e) Enhancement of internal controls to ensure full compliance with the BSA; f) Establishment of an independent testing program for compliance with the BSA rules and regulations; and g) Obtaining regulatory agency consent for expansionary activities such as new branches, offices, delivery channels, products and services.
The Consent Order resulted in additional BSA compliance expenses for the Bank and the Company. It may also have the effect of limiting or delaying the Bank’s and the Company’s ability to obtain regulatory approval for certain expansionary activities, to the extent desired by the Company. The Consent Order does not otherwise impact the Bank’s business activities outside of BSA. The Consent Order does not require the Bank to pay any civil money penalty or require additional capital. The Consent Order will remain in effect and be enforceable until it is modified, terminated, suspended or set aside by the FDIC and the CBDO. Management and the Board have expressed their full intention to comply with all parts of the Consent Order at the earliest possible date.
Note 23 – Fair Value Measurements
Fair Value Hierarchy
Fair value is defined as the price that would be received to sell an asset or paid to transfer a liability in the principal or most advantageous market for an asset or liability in an orderly transaction between market participants at the measurement date. In accordance with ASC Topic 825, the Company groups its financial assets and financial liabilities measured at fair value in three levels, based on the markets in which the assets and liabilities are traded and the reliability of the assumptions used to determine fair value. These levels are as follows:
| • | Level 1 – Observable unadjusted quoted market prices in active markets for identical assets and liabilities that the reporting entity has the ability to access at the measurement date. |
| • | Level 2 – Significant other observable market based inputs, other than Level 1 prices such as quoted prices for similar assets or liabilities or unobservable inputs that are corroborated by market data. This includes quoted prices in markets that are not active, or other inputs that are observable or can be corroborated by observable market data, either directly or indirectly. This would include those financial instruments that are valued using models or other valuation methodologies where substantially all of the assumptions are observable in the marketplace, can be derived from observable market data or are supported by observable levels at which transactions are executed in the marketplace. |
| • | Level 3 – Significant unobservable inputs that reflect a reporting entity’s evaluation about the assumptions that market participants would use in pricing an asset or liability. Assets measured utilizing level 3 are for positions that are not traded in active markets or are subject to transfer |
156
Table of Contents
| restrictions, and or where valuations are adjusted to reflect illiquidity and or non-transferability. These assumptions are not corroborated by market data. This is comprised of financial instruments whose fair value is estimated based on internally developed models or methodologies utilizing significant inputs that are generally less readily observable from objective sources. Management uses a combination of reviews of the underlying financial statements, appraisals and management’s judgment regarding credit quality to determine the value of the financial asset or liability. |
A financial instrument’s level within the fair value hierarchy is based on the lowest level of input that is significant to the fair value measurement. Management maximizes the use of observable inputs and attempts to minimize the use of unobservable inputs when determining fair value measurements.
ASC Topic 825 requires disclosure of the fair value of financial assets and financial liabilities that are measured and reported at fair value on a recurring basis and on a non-recurring basis. Securities available-for-sale and interest rate swaps are recorded at fair value on a recurring basis. Additionally, certain assets are not measured at fair value on an ongoing basis, but are subject to fair value adjustments in certain circumstances, for example, when there is evidence of impairment. These include assets that are measured at the lower of cost or fair value, such as other real estate owned, SBA servicing asset and impaired loans that are collateral dependent.
The estimated fair value amounts have been determined by the Company using available market information and appropriate valuation methodologies. However, considerable judgment is required to develop the estimates of fair value. Accordingly, the estimates presented below are not necessarily indicative of the amounts the Company could have realized in a current market exchange as of December 31, 2016. The use of different market assumptions and/or estimation methodologies may have a material effect on the estimated fair value amounts.
Recurring Fair Value Measurements
The valuation methodologies for estimating the fair value of financial assets and financial liabilities measured and reported at fair value on a recurring basis are discussed below.
Investment Securities Available-for-Sale: The fair value of investment securities available-for-sale are primarily based on price indications provided by nationally recognized, independent pricing sources utilized by the Company’s bond accounting system provider, Vining Sparks. The fair value of investment securities may be determined by obtaining quoted prices for identical assets in active markets at measurement date (Level 1 financial assets). The Company’s investments in U.S. Treasury Notes are Level 1 financial assets. For the Company’s investments in U.S. Agency and U.S. Sponsored Agency issued debt securities (callable and non-callable notes), mortgage backed securities guaranteed by those agencies, collateralized mortgage obligations issued by those agencies and corporate bond securities, the fair value may be determined by obtaining quoted market prices for similar assets in active markets at measurement date (Level 2 financial assets), or if quoted market prices are not available, the pricing sources may determine fair value by matrix pricing. Matrix pricing is a mathematical technique widely used in the securities industry to value debt securities without relying exclusively on quoted prices for the specific securities but rather by relying on the securities’ relationship to other benchmark quoted securities which are observable market inputs (Level 2 financial assets). The pricing sources may also determine the fair value of certain debt securities by using an option adjusted spread model with observable inputs such as the treasury yield curve and other interest rate assumptions. Other observable inputs utilized in these alternative valuation techniques or models when quoted prices are not available include benchmark yields, reported trades, broker/dealer quotes, issuer spreads, benchmark securities, bids, offers and reference data. In cases where significant credit valuation adjustments are incorporated into the estimation of fair value, reported amounts are classified as Level 3 financial assets.
Interest Rate Swap Contracts: The fair value of the interest rate swap contracts are provided by an independent third party vendors that specializes in interest rate risk management and fair value analysis using a model that utilizes current market data to estimate cash flows of the interest rate swaps utilizing the future London Interbank
157
Table of Contents
Offered Rate (“LIBOR”) yield curve for accruing and the future Overnight Index Swap Rate (“OIS”) yield curve for discounting through the maturity date of the interest rate swap contract. The future LIBOR yield curve is the primary input in the valuation of the interest rate swap contracts. Both the LIBOR and OIS yield curves are readily observable in the marketplace. Accordingly, the interest rate swap contracts are classified within Level 2 of the fair value hierarchy.
The following table presents the financial assets and financial liabilities measured at fair value on a recurring basis as of the dates indicated, segregated by the level of the valuation inputs within the fair value hierarchy utilized to measure fair value (dollars in thousands):
| Fair Value |
Quoted Prices in Active Markets for Identical Assets (Level 1) |
Significant Other Observable Inputs (Level 2) |
Significant Unobservable Inputs (Level 3) |
|||||||||||||
| Financial Assets – December 31, 2016 |
||||||||||||||||
| Investment securities available-for-sale: |
||||||||||||||||
| U.S. Govt Agency and Sponsored Agency – Note Securities |
$ | 9,969 | $ | — | $ | 9,969 | — | |||||||||
| U.S. Govt Agency – SBA Securities |
122,850 | — | 122,850 | — | ||||||||||||
| U.S. Govt Agency – GNMA Mortgage-Backed Securities |
22,370 | — | 22,370 | — | ||||||||||||
| U.S. Govt Sponsored Agency – CMO & Mortgage-Backed Securities |
238,900 | — | 238,900 | — | ||||||||||||
| Asset Backed Securities |
6,896 | — | 6,896 | — | ||||||||||||
| U.S. Treasury Notes |
68,965 | 68,965 | — | — | ||||||||||||
| Interest Rate Swap Contracts |
523 | — | 523 | — | ||||||||||||
|
|
|
|
|
|
|
|
|
|||||||||
| $ | 470,473 | 68,965 | 401,508 | — | ||||||||||||
|
|
|
|
|
|
|
|
|
|||||||||
| Financial Liabilities – December 31, 2016 |
||||||||||||||||
| Interest Rate Swap Contracts |
$ | 1,207 | $ | — | $ | 1,207 | $ | — | ||||||||
| Financial Assets – December 31, 2015 |
||||||||||||||||
| Investment securities available-for-sale: |
||||||||||||||||
| U.S. Govt Agency and Sponsored Agency –Note Securities |
$ | 1,014 | $ | — | $ | 1,014 | — | |||||||||
| U.S. Govt Agency – SBA Securities |
93,490 | — | 93,490 | — | ||||||||||||
| U.S. Govt Agency – GNMA Mortgage-Backed Securities |
30,700 | — | 30,700 | — | ||||||||||||
| U.S. Govt Sponsored Agency – CMO & Mortgage-Backed Securities |
97,154 | — | 97,154 | — | ||||||||||||
| Corporate Securities |
4,023 | — | 4,023 | — | ||||||||||||
| Municipal Securities |
1,011 | — | 1,011 | — | ||||||||||||
| Asset Backed Securities |
7,647 | — | 7,647 | — | ||||||||||||
| U.S. Treasury Notes |
80,746 | 80,746 | — | — | ||||||||||||
| Interest Rate Swap Contracts |
881 | — | 881 | — | ||||||||||||
|
|
|
|
|
|
|
|
|
|||||||||
| $ | 316,666 | 80,746 | 235,920 | — | ||||||||||||
|
|
|
|
|
|
|
|
|
|||||||||
| Financial Liabilities – December 31, 2015 |
||||||||||||||||
| Interest Rate Swap Contracts |
$ | 2,545 | $ | — | $ | 2,545 | $ | — | ||||||||
At December 31, 2016 and 2015, the Company had no financial assets or liabilities that were measured at fair value on a recurring basis that required the use of significant unobservable inputs (Level 3). Furthermore, there were no transfers of assets either between Level 1 and Level 2 nor in or out of Level 3 of the fair value hierarchy for assets measured on a recurring basis for the periods ended December 31, 2016 and 2015.
158
Table of Contents
Nonrecurring Fair Value Measurements
The valuation methodologies for estimating the fair value of certain assets measured and reported at fair value on a nonrecurring basis are discussed below.
Other Real Estate Owned: The fair value of other real estate owned is generally based on real estate appraisals (unless more current market information is available) less estimated costs to sell. These appraisals may utilize a single valuation approach or a combination of approaches including comparable sales and the income approach. Adjustments are routinely made in the appraisal process by the appraisers to adjust for differences between the comparable sales and income data available. Such adjustments are typically significant. The inputs utilized in determining the fair value of other real estate owned are unobservable and accordingly, these financial assets are classified within Level 3 of the fair value hierarchy.
SBA Servicing Asset: The SBA servicing asset is amortized over the estimated life of the loans based on an effective yield approach. In addition, the Company’s servicing asset is evaluated regularly for impairment by discounting the estimated future cash flows using market-based discount rates and prepayment speeds. The discount rate was based on the current U.S. Treasury yield curve, plus a spread for marketplace risk associated with these assets. Prepayment speeds were determined based on the historical prepayments of the Company’s SBA loans. The prepayment speeds determine the timing of the cash flows. If the calculated present value of the servicing asset declines below the Company’s current carrying value, the servicing asset is written down to its present value. Based on the Company’s methodology in its valuation of the SBA servicing asset, the current carrying value is estimated to approximate the fair value. The inputs utilized in determining the fair value of SBA servicing asset are unobservable and accordingly, these financial assets are classified within Level 3 of the fair value hierarchy.
Impaired Loans: The fair value of impaired loans is determined based on an evaluation at the time the loan is originally identified as impaired, and periodically thereafter, at the lower of cost or fair value. Fair value on impaired loans is measured based on the value of the collateral securing these loans, less costs to sell, if the loan is collateral dependent, or based on the discounted cash flows for non-collateral dependent loans. Collateral on collateral dependent loans may be real estate and/or business assets including equipment, inventory and/or accounts receivable and is determined based on appraisals performed by qualified licensed appraisers hired by the Company. Appraised and reported values may be discounted based on management’s historical knowledge, changes in market conditions from the time of valuation, and/or management’s expertise and knowledge of the client and client’s business. Such discounts are typically significant and unobservable. For unsecured loans, the estimated future discounted cash flows of the business or borrower, are used in evaluating the fair value. Impaired loans are reviewed and evaluated on at least a quarterly basis for additional impairment and adjusted accordingly, based on the same factors identified above. The inputs utilized in determining the fair value of impaired loans are unobservable and accordingly, these financial assets are classified within Level 3 of the fair value hierarchy.
159
Table of Contents
The following table presents the balances of assets measured at fair value on a non-recurring basis by level within the fair value hierarchy as of the dates indicated (dollars in thousands):
| Net Carrying Amount |
Quoted Prices in Active Markets for Identical Assets (Level 1) |
Significant Other Observable Inputs (Level 2) |
Significant Unobservable Inputs (Level 3) |
|||||||||||||
| Financial Assets – December 31, 2016 |
||||||||||||||||
| Collateral dependent impaired loans with specific valuation allowance and/or partial charge-offs (non-purchased credit impaired loans) |
$ | 73 | $ | — | $ | — | $ | 73 | ||||||||
| SBA Servicing Asset |
940 | — | — | 940 | ||||||||||||
|
|
|
|
|
|
|
|
|
|||||||||
| Total |
$ | 1,013 | $ | — | $ | — | $ | 1,013 | ||||||||
|
|
|
|
|
|
|
|
|
|||||||||
| Net Carrying Amount |
Quoted Prices in Active Markets for Identical Assets (Level 1) |
Significant Other Observable Inputs (Level 2) |
Significant Unobservable Inputs (Level 3) |
|||||||||||||
| Financial Assets – December 31, 2015 |
||||||||||||||||
| Collateral dependent impaired loans with specific valuation allowance and/or partial charge-offs (non-purchased credit impaired loans) |
$ | — | $ | — | $ | — | $ | — | ||||||||
| SBA Servicing Asset |
1,147 | — | — | 1,147 | ||||||||||||
| Other real estate owned |
325 | — | — | 325 | ||||||||||||
|
|
|
|
|
|
|
|
|
|||||||||
| Total |
$ | 1,472 | $ | — | $ | — | $ | 1,472 | ||||||||
|
|
|
|
|
|
|
|
|
|||||||||
There were no transfers of assets either between Level 1 and Level 2 nor in or out of Level 3 of the fair value hierarchy for assets measured on a non-recurring basis for the periods ended December 31, 2016 and 2015.
The following table presents losses related to nonrecurring fair value measurements. The losses related to assets held on the balance sheet at each respective period end (dollars in thousands):
| For the Year Ended December 31, | ||||||||||||
| 2016 | 2015 | 2014 | ||||||||||
| Financial Assets |
||||||||||||
| Collateral dependent impaired loans with specific valuation allowance and/or partial charge-offs (non-purchased credit impaired loans) |
$ | 508 | $ | — | $ | 222 | ||||||
| SBA Servicing Asset |
— | — | — | |||||||||
| Other real estate owned |
— | 133 | — | |||||||||
|
|
|
|
|
|
|
|||||||
| Total |
$ | 508 | $ | 133 | $ | 222 | ||||||
|
|
|
|
|
|
|
|||||||
160
Table of Contents
The following table presents the significant unobservable inputs used in the fair value measurements for Level 3 assets measured at fair value on a non-recurring basis as of the dates indicated (dollars in thousands):
| Fair Value |
Valuation Methodology |
Unobservable Valuation Inputs |
Unobservable Valuation Input Values |
|||||||||||||
| Financial Assets – December 31, 2016 |
||||||||||||||||
| Collateral dependent impaired loans with specific valuation allowance and/or partial charge-off |
$ | 73 | |
Credit loss estimate of aged accounts receivable collateral |
|
|
Credit loss factors on aging of accounts receivable collateral |
|
20% | |||||||
| Discount Rates | 13% | |||||||||||||||
| SBA Servicing Asset |
940 | |
Discounted Cash Flow |
|
|
Estimated Average Remaining Life of SBA Portfolio |
|
39 months | ||||||||
|
|
|
|||||||||||||||
| Total |
$ | 1,013 | ||||||||||||||
|
|
|
|||||||||||||||
| Financial Assets – December 31, 2015 |
||||||||||||||||
| Discount Rates | 12% | |||||||||||||||
| SBA Servicing Asset |
1,147 | |
Discounted Cash Flow |
|
|
Estimated Average Remaining Life of SBA Portfolio |
|
61 months | ||||||||
| Other real estate owned |
325 | |
Broker opinion of value |
|
|
Sales approach Estimated
selling |
|
6% | ||||||||
|
|
|
|||||||||||||||
| Total |
$ | 1,472 | — | — | ||||||||||||
|
|
|
|||||||||||||||
Fair Value of Financial Instruments
The following are the valuation methodologies utilized for estimating the fair value of certain financial instruments presented in the tables below.
Cash and due from banks: The carrying amount is assumed to be the fair value because of the liquidity of these instruments.
Interest earning deposits in other financial institutions: The carrying amount is assumed to be the fair value given the short-term nature of these deposits.
Investment Securities Held-to-Maturity: The fair value of investment securities held-to-maturity are based on price indications provided by nationally recognized, independent pricing sources utilized by the Company’s bond accounting system provider, Vining Sparks. The Company’s held-to-maturity portfolio consists of municipal securities only. The fair value of the municipal securities are calculated using proprietary pricing models or matrices with inputs such as market information (MSRB reported trade data, bids, offers, new issue data) and benchmark curves (Treasury, Swap, Libor and AAA municipal yield curve). These inputs are observable and as such, municipal securities are classified within the Level 2 fair value hierarchy.
Loans: The fair value for loans is estimated by discounting the expected future cash flows using current interest rates at which similar loans would be made to borrowers with similar credit ratings for the same remaining maturities, adjusted for the allowance for loan loss. Loans are segregated by type such as commercial and industrial, commercial real estate, construction and other loans with similar credit characteristics and are further segmented into fixed and variable interest rate loan categories. Expected future cash flows are projected based on
161
Table of Contents
contractual cash flows, adjusted for estimated prepayments. The inputs utilized in determining the fair value of loans are unobservable and accordingly, these financial assets are classified within Level 3 of the fair value hierarchy.
Bank owned life insurance: The carrying amount of bank owned life insurance represents the total cash surrender value of each policy, which approximates fair value.
FHLB Stock: FHLB stock has no trading market, and is required as part of membership and is redeemable at par. FHLB is recorded at cost, which approximates fair value.
Non-Maturing Deposits: The fair values for non-maturing deposits (deposits with no contractual termination date), which include non-interest bearing demand deposits, interest bearing transaction accounts, money market deposits and savings accounts are equal to their carrying amounts, which represent the amounts payable on demand. Because the carrying value and fair value are by definition identical, and accordingly non-maturity deposits are classified within Level 1 of the fair value hierarchy, these balances are not listed in the following tables.
Maturing Deposits: The fair values of fixed maturity certificates of deposit (time deposits) are estimated using a discounted cash flow calculation that applies current market deposit interest rates to the Company’s current certificates of deposit interest rates for similar term certificates. The inputs utilized in determining the fair value of maturing deposits are observable and accordingly, these financial liabilities are classified within Level 2 of the fair value hierarchy.
Securities Sold under Agreements to Repurchase (“Repos”): The fair value of securities sold under agreements to repurchase is estimated based on the discounted value of future cash flows expected to be paid on the deposits. The carrying amounts of Repos with maturities of 90 days or less approximate their fair values. The fair value of Repos with maturities greater than 90 days is estimated based on the discounted value of the contractual future cash flows. The inputs utilized in determining the fair value of securities sold under agreements to repurchase are observable and accordingly, these financial liabilities are classified within Level 2 of the fair value hierarchy.
Subordinated Debentures: The fair value of the three variable rate subordinated debentures (“debentures”) is estimated using a discounted cash flow calculation that applies the three month LIBOR plus the margin index at December 31, 2016, to the cash flows from the debentures, based on the actual interest rate the debentures were accruing at December 31, 2016. Because all three of the debentures re-priced on December 15, 2016 based on the current three month LIBOR index rate plus the index margin at that date, and with relatively little to no change in the three month LIBOR index rate from the re-pricing date through December 31, 2016, the current face value of the debentures and their calculated fair value are approximately equal. The inputs utilized in determining the fair value of subordinated debentures are observable and accordingly, these financial liabilities are classified within Level 2 of the fair value hierarchy.
Fair Value of Commitments: Loan commitments that are priced on an index plus a margin to a market rate of interest are reported at the carrying value of the loan commitment. Loan commitments on which the committed fixed interest rate is less than the current market rate were insignificant at December 31, 2016 and 2015.
162
Table of Contents
The table below presents the carrying amounts and fair values of certain financial instruments based on their fair value hierarchy indicated (dollars in thousands):
| Fair Value Measurements | ||||||||||||||||||||
| Carrying Amount |
Estimated Fair Value |
Quoted Prices in Active Markets for Identical Assets (Level 1) |
Significant Other Observable Inputs (Level 2) |
Significant Unobservable Inputs (Level 3) |
||||||||||||||||
| December 31, 2016 |
||||||||||||||||||||
| Financial Assets |
||||||||||||||||||||
| Cash and due from banks |
$ | 41,281 | $ | 41,281 | $ | 41,281 | $ | — | $ | — | ||||||||||
| Interest earning deposits in other financial institutions |
167,789 | 167,789 | 167,789 | — | — | |||||||||||||||
| Investment securities held-to-maturity |
42,027 | 41,937 | — | 41,937 | — | |||||||||||||||
| Loans, net |
2,030,852 | 2,054,701 | — | — | 2,054,701 | |||||||||||||||
| Bank owned life insurance |
51,216 | 51,216 | — | — | 51,216 | |||||||||||||||
| FHLB Stock |
9,182 | 9,182 | — | — | 9,182 | |||||||||||||||
| Financial Liabilities |
||||||||||||||||||||
| Certificates of deposit |
29,480 | 29,480 | — | 29,480 | — | |||||||||||||||
| Securities sold under agreements to repurchase |
18,816 | 18,816 | — | 18,816 | — | |||||||||||||||
| Subordinated debentures |
9,856 | 12,372 | — | 12,372 | — | |||||||||||||||
| December 31, 2015 |
||||||||||||||||||||
| Financial Assets |
||||||||||||||||||||
| Cash and due from banks |
$ | 50,960 | $ | 50,960 | $ | 50,960 | $ | — | $ | — | ||||||||||
| Interest earning deposits in other financial institutions |
171,103 | 171,103 | 171,103 | — | — | |||||||||||||||
| Investment securities held-to-maturity |
42,036 | 42,339 | — | 42,339 | — | |||||||||||||||
| Loans, net |
1,817,481 | 1,851,220 | — | — | 1,851,220 | |||||||||||||||
| Bank owned life insurance |
49,912 | 49,912 | — | — | 49,912 | |||||||||||||||
| FHLB Stock |
8,014 | 8,014 | — | — | 8,014 | |||||||||||||||
| Financial Liabilities |
— | |||||||||||||||||||
| Certificates of deposit |
58,502 | 58,502 | — | 58,502 | — | |||||||||||||||
| Securities sold under agreements to repurchase |
14,360 | 14,360 | — | 14,360 | — | |||||||||||||||
| Subordinated debentures |
9,697 | 12,372 | — | 12,372 | — | |||||||||||||||
Note 24 – Reclassification
Certain amounts in the prior year’s consolidated financial statements and related disclosures were reclassified to conform to the current year presentation with no effect on previously reported net income or shareholders’ equity.
163
Table of Contents
Note 25 – Summary Quarterly Data (unaudited)
| 2016 Quarters Ended | 2015 Quarters Ended | |||||||||||||||||||||||||||||||
| (Dollars in thousands, except per share data) | Dec. 31 |
Sept. 30 |
June 30 |
Mar. 31 |
Dec. 31 |
Sept. 30 |
June 30 |
Mar. 31 |
||||||||||||||||||||||||
| Interest income |
$ | 26,151 | $ | 25,855 | $ | 24,997 | $ | 24,249 | $ | 23,807 | $ | 23,106 | $ | 21,941 | $ | 21,288 | ||||||||||||||||
| Interest expense |
820 | 807 | 748 | 771 | 705 | 704 | 668 | 646 | ||||||||||||||||||||||||
|
|
|
|
|
|
|
|
|
|
|
|
|
|
|
|
|
|||||||||||||||||
| Net interest income |
25,331 | 25,048 | 24,249 | 23,478 | 23,102 | 22,402 | 21,273 | 20,642 | ||||||||||||||||||||||||
| Provision for loan losses |
882 | 697 | 1,063 | 622 | 2,249 | 705 | 683 | 1,443 | ||||||||||||||||||||||||
|
|
|
|
|
|
|
|
|
|
|
|
|
|
|
|
|
|||||||||||||||||
| Net interest income after provision for loan losses |
24,449 | 24,351 | 23,186 | 22,856 | 20,853 | 21,697 | 20,590 | 19,199 | ||||||||||||||||||||||||
|
|
|
|
|
|
|
|
|
|
|
|
|
|
|
|
|
|||||||||||||||||
| Non-interest income |
3,159 | 3,058 | 2,975 | 2,820 | 3,039 | 2,988 | 3,095 | 2,608 | ||||||||||||||||||||||||
|
|
|
|
|
|
|
|
|
|
|
|
|
|
|
|
|
|||||||||||||||||
| Non-interest expense |
16,401 | 16,767 | 15,089 | 15,187 | 15,073 | 15,067 | 14,912 | 14,913 | ||||||||||||||||||||||||
|
|
|
|
|
|
|
|
|
|
|
|
|
|
|
|
|
|||||||||||||||||
| Net income before provision for income tax expense |
11,207 | 10,642 | 11,072 | 10,489 | 8,819 | 9,618 | 8,773 | 6,894 | ||||||||||||||||||||||||
| Provision for income tax expense |
4,037 | 4,059 | 3,952 | 3,905 | 3,312 | 3,355 | 3,506 | 2,695 | ||||||||||||||||||||||||
|
|
|
|
|
|
|
|
|
|
|
|
|
|
|
|
|
|||||||||||||||||
| Net Income |
$ | 7,170 | $ | 6,583 | $ | 7,120 | $ | 6,584 | $ | 5,507 | $ | 6,263 | $ | 5,267 | $ | 4,199 | ||||||||||||||||
|
|
|
|
|
|
|
|
|
|
|
|
|
|
|
|
|
|||||||||||||||||
| Preferred stock dividends and discount accretion or premium amortization |
$ | 303 | $ | 304 | $ | 307 | $ | 303 | $ | 297 | $ | 293 | $ | 312 | $ | 272 | ||||||||||||||||
|
|
|
|
|
|
|
|
|
|
|
|
|
|
|
|
|
|||||||||||||||||
| Net Income Available to Common Shareholders |
$ | 6,867 | $ | 6,279 | $ | 6,813 | $ | 6,281 | $ | 5,210 | $ | 5,970 | $ | 4,955 | $ | 3,927 | ||||||||||||||||
|
|
|
|
|
|
|
|
|
|
|
|
|
|
|
|
|
|||||||||||||||||
| Basic income per share |
$ | 0.39 | $ | 0.36 | $ | 0.40 | $ | 0.37 | $ | 0.31 | $ | 0.36 | $ | 0.30 | $ | 0.24 | ||||||||||||||||
|
|
|
|
|
|
|
|
|
|
|
|
|
|
|
|
|
|||||||||||||||||
| Diluted income per share |
$ | 0.39 | $ | 0.36 | $ | 0.39 | $ | 0.36 | $ | 0.30 | $ | 0.35 | $ | 0.29 | $ | 0.23 | ||||||||||||||||
|
|
|
|
|
|
|
|
|
|
|
|
|
|
|
|
|
|||||||||||||||||
164
Table of Contents
Note 26 – Condensed Financial Information of Parent Company
The following tables present the parent company only condensed balance sheets and the related statements of income and condensed statements of cash flows for the dates and periods indicated (dollars in thousands):
| Parent Company Only Condensed Balance Sheets |
December 31, | |||||||
| 2016 | 2015 | |||||||
| ASSETS |
||||||||
| Cash and due from banks |
$ | 9,715 | $ | 6,756 | ||||
| Loans |
148 | 882 | ||||||
| Investment in subsidiary |
339,683 | 310,263 | ||||||
| Accrued interest receivable and other assets |
463 | 4 | ||||||
|
|
|
|
|
|||||
| Total Assets |
$ | 350,009 | $ | 317,905 | ||||
|
|
|
|
|
|||||
| LIABILITIES |
||||||||
| Subordinated debentures |
$ | 9,856 | $ | 9,697 | ||||
| Accrued interest payable and other liabilities |
1,968 | 1,401 | ||||||
|
|
|
|
|
|||||
| Total Liabilities |
11,824 | 11,098 | ||||||
| SHAREHOLDERS’ EQUITY |
338,185 | 306,807 | ||||||
|
|
|
|
|
|||||
| Total Liabilities and Shareholders’ Equity |
$ | 350,009 | $ | 317,905 | ||||
|
|
|
|
|
|||||
| Parent Company Only Condensed Statements of Income |
Years Ended December 31, |
|||||||
| 2016 | 2015 | |||||||
| Interest Income |
$ | 59 | $ | 71 | ||||
|
|
|
|
|
|||||
| Interest Expense |
487 | 438 | ||||||
| Operating Expenses |
649 | 676 | ||||||
|
|
|
|
|
|||||
| Total Expenses |
1,136 | 1,114 | ||||||
|
|
|
|
|
|||||
| Loss Before Income Tax Benefit and Equity in Undistributed Earnings of Subsidiary |
(1,077 | ) | (1,043 | ) | ||||
| Income tax benefit |
478 | 466 | ||||||
| Loss Before Equity in Undistributed Earnings of Subsidiary |
(599 | ) | (577 | ) | ||||
|
|
|
|
|
|||||
| Equity in undistributed earnings of subsidiary |
28,056 | 21,813 | ||||||
|
|
|
|
|
|||||
| Net Income |
$ | 27,457 | $ | 21,236 | ||||
|
|
|
|
|
|||||
165
Table of Contents
| Parent Company Only Condensed Statements of Cash Flows |
Years Ended December 31, |
|||||||
| 2016 | 2015 | |||||||
| Cash flows from operating activities: |
||||||||
| Net income: |
$ | 27,457 | $ | 21,236 | ||||
| Adjustments to reconcile net income to net cash used in operating activities: |
||||||||
| Equity in undistributed earnings of subsidiary |
(28,056 | ) | (21,813 | ) | ||||
| Net accretion of discounts/premiums |
(10 | ) | (19 | ) | ||||
| Accretion of subordinated debenture discount |
159 | 159 | ||||||
| Increase in accrued interest receivable and other assets |
(536 | ) | (27 | ) | ||||
| Increase (decrease) in accrued interest payable and other liabilities |
644 | (84 | ) | |||||
|
|
|
|
|
|||||
| Net cash used in operating activities |
(342 | ) | (548 | ) | ||||
|
|
|
|
|
|||||
| Cash flows from investing activities: |
||||||||
| Capital contribution made to subsidiary |
— | (1,000 | ) | |||||
| Net decrease in loans |
744 | 547 | ||||||
|
|
|
|
|
|||||
| Net cash (used in) provided by investing activities |
744 | (453 | ) | |||||
|
|
|
|
|
|||||
| Cash flows from financing activities: |
||||||||
| Net proceeds from exercise of stock options |
5,185 | 4,299 | ||||||
| Restricted stock repurchase |
(1,371 | ) | (971 | ) | ||||
| Dividends paid on preferred stock |
(1,257 | ) | (183 | ) | ||||
|
|
|
|
|
|||||
| Net cash provided by financing activities |
2,557 | 3,145 | ||||||
|
|
|
|
|
|||||
| Net increase in cash |
2,959 | 2,144 | ||||||
| Cash, beginning of year |
6,756 | 4,612 | ||||||
|
|
|
|
|
|||||
| Cash, end of year |
$ | 9,715 | $ | 6,756 | ||||
|
|
|
|
|
|||||
| Supplemental disclosures of cash flow information: |
||||||||
| Cash paid during the period for interest |
$ | 328 | $ | 277 | ||||
|
|
|
|
|
|||||
Note 27 – Related Party Transactions
During 2016 and 2015, there were no existing transactions that are out of the ordinary course of business between CU Bancorp and its affiliates, including executive officers, directors, principal shareholders (beneficial owners of 5% or more of our Common Stock), or the immediate family or associates of any of the foregoing persons, or trust for the benefit of employees such as a 401(k) trust.
Some of CU Bancorp’s directors and executive officers, as well as the companies with which such directors and executive officers are associated, are customers of, and have had banking transactions with California United Bank in the ordinary course of business. All such transactions are on substantially the same terms, including interest and collateral as those prevailing for comparable transactions with others. At the present time, California United Bank has one lending relationship with its directors and officers or entities associated with any of its directors or officers. California United Bank also engages in deposit transactions with its executive officers and directors, and their immediate family or corporations of which the directors or officers may own a controlling interest, or also serve as directors or officers. These transactions are expected to take place on substantially the same terms, including interest, as those prevailing for comparable transactions with others.
166
Table of Contents
PART IV
ITEM 15 — EXHIBITS AND FINANCIAL STATEMENT SCHEDULES
(b) Index to Exhibits
| Exhibit |
Description | |
| 2.1 | Agreement and Plan of Merger by and Among CU Bancorp and California United Bank and 1st Enterprise Bank Dated as of June 2, 2014 1 | |
| 2.2 | Amendment No. 1 to Agreement and Plan of Merger 2 | |
| 2.3 | Amendment No. 2 to Agreement and Plan of Merger 3 | |
| 3.1 | Articles of Incorporation of CU Bancorp 4 | |
| 3.2 | Certificate of Determination of Non-Cumulative Perpetual Preferred Stock, Series A of CU Bancorp 5 | |
| 4.1 | Specimen form of Certificate for CU Bancorp Common Stock 6 | |
| 4.2 | Assignment & Assumption Agreement 7 | |
| 10.1* | 2014 CU Bancorp Executive Performance Incentive Plan Amendment # 1 — April 24, 2014 8 | |
| 10.2* | Separation and Consulting Agreement 9 | |
| 10.3* | CU Bancorp 2007 Equity and Incentive Plan as Amended and Restated July 31, 2014, as Amended as of December 29, 2015 10 | |
10.4*

|
CU Bancorp 2007 Equity and Incentive Plan as Amended and Restated July 31, 2014, as Amended as of December 15, 2016 | |
| 10.5* | 1st Enterprise Bank 2006 Stock Incentive Plan as Amended and Restated March 18, 2009 11 | |
| 10.6* | Amendment of the 1st Enterprise Bank 2006 Stock Incentive Plan, July 31, 2014 12 | |
| 10.7* | California United Bank 2005 Stock Option Plan 13 | |
| 10.8* | CU Bancorp 2012 Change in Control Severance Plan 14 | |
| 10.9*
|
Amendment to CU Bancorp 2012 Change in Control Severance Plan — December 15, 2016 | |
| 10.10* | Executive Salary Continuation Plan / Agreement and Schedule of Participants and Benefits 15 | |
| 10.11* | 2014 California United Bank Executive Performance Cash Incentive Plan 16 | |
| 10.12 | Form of Director / Officer Indemnification Agreement and Schedule of Agreements 17 | |
| 10.13*
|
Amendment to CU Bancorp 2012 Change in Control Severance Plan — March 14, 2017. | |
| 12.1
|
Ratio of Earnings to Fixed Charges | |
| 14.1
|
CU Bancorp Principles of Business Conduct & Ethics | |
| 14.2 | CU Bancorp Code of Ethics — Financial Officers 18 | |
| 21.1 | Subsidiaries of the Registrant 19 | |
| 23.1
|
Consent of Independent Registered Public Accounting Firm | |
| 24.1 | Power of Attorney (see signature page hereto) | |
| 31.1
|
Certification of Chief Executive Officer Pursuant to Section 302 of the Sarbanes Oxley Act of 2002 | |
| 31.2
|
Certification of Chief Financial Officer Pursuant to Section 302 of the Sarbanes Oxley Act of 2002 | |
| 32.1
|
Certification of CEO and CFO Pursuant to 18 U.S.C. Section 1350, as Adopted Pursuant to Section 906 of the Sarbanes Oxley Act of 2002 | |
| 101.INS
|
XBRL Instance Document | |
| 101.SCH
|
XBRL Taxonomy Extension Schema Document | |
| 101.CAL
|
XBRL Taxonomy Calculation Linkbase Document | |
| 101.DEF
101.LAB
|
XBRL Taxonomy Extension Definition Linkbase Document
XBRL Taxonomy Extension Label Linkbase Document | |
| 101.PRE
|
XBRL Taxonomy Presentation Linkbase Document | |
167
Table of Contents
| * | Refers to management contracts or compensatory plans or arrangements |
|
|
Attached hereto |
| 1 | Incorporated by reference from Exhibit 2.1 to CU Bancorp Registration Statement on Form S-4 as filed on August 20, 2014. |
| 2 | Incorporated by reference from Exhibit 2.1 to CU Bancorp Registration Statement on Form S-4 as filed on August 20, 2014. |
| 3 | Incorporated by reference from Exhibit 2.2 to CU Bancorp Current Report on Form 8-K filed November 17, 2014. |
| 4 | Incorporated by reference from Exhibit 3.1 to CU Bancorp Registration Statement on Form S-4 as filed on April 13, 2012. |
| 5 | Incorporated by reference from Exhibit 3.3 to CU Bancorp Current Report on Form 8-K filed November 24, 2014. |
| 6 | Incorporated by reference from Exhibit 4.1 to CU Bancorp Registration Statement on Form S-4 as filed on April 13, 2012. |
| 7 | Incorporated by reference from Exhibit 4.2 to CU Bancorp Annual Report on Form 10-K filed March 13, 2015. |
| 8 | Incorporated by reference from Exhibit 10.1 to CU Bancorp Quarterly Report on Form 10-Q for the Quarter Ended March 31, 2014. |
| 9 | Incorporated by reference from Exhibit 10.5 to CU Bancorp Registration Statement on Form S-4 as filed on August 20, 2014. |
| 10 | Incorporated by reference from Exhibit 10.4 to CU Bancorp Annual Report on Form 10-K filed March 14, 2016. |
| 11 | Incorporated by reference from Exhibit 10.5 to CU Bancorp Annual Report on Form 10-K filed March 13, 2015. |
| 12 | Incorporated by reference from Exhibit 10.6 to CU Bancorp Annual Report on Form 10-K filed March 13, 2015. |
| 13 | Incorporated by reference from Exhibit 10.1 to CU Bancorp Registration Statement on Form S-4 as filed on April 13, 2012. |
| 14 | Incorporated by reference from Exhibit 10.3 to CU Bancorp Quarterly Report on Form 10-Q for the Quarter Ended September 30, 2013. |
| 15 | Incorporated by reference from Exhibit 10.4 to CU Bancorp Annual Report on Form 10-K filed March 13, 2014. |
| 16 | Incorporated by reference from Exhibit 10.6 to CU Bancorp Annual Report on Form 10-K filed March 13, 2014. |
| 17 | Incorporated by reference from Exhibit 10.7 to CU Bancorp Annual Report on Form 10-K filed March 13, 2014. |
| 18 | Incorporated by reference from Exhibit 23.1 to CU Bancorp Annual Report on Form 10-K filed March 14, 2016. |
| 19 | Incorporated by reference from Exhibit 21.1 to CU Bancorp Registration Statement on Form S-4 as filed on August 20, 2014. |
168
Table of Contents
Pursuant to the requirements of Section 13 or 15(d) of the Securities Exchange Act of 1934, the registrant has duly caused this Report to be signed on its behalf by the undersigned, thereunto duly authorized.
| CU BANCORP | ||||
| Dated: March 15, 2017 |
/s/ DAVID I. RAINER | |||
| David I. Rainer | ||||
| Chief Executive Officer | ||||
| /s/ KAREN A. SCHOENBAUM | ||||
| Karen A. Schoenbaum | ||||
| Executive Vice President and Chief Financial Officer | ||||
POWERS OF ATTORNEY
KNOW ALL PERSONS BY THESE PRESENTS, that each person whose signature appears below constitutes and appoints Anita Y. Wolman, Karen A. Schoenbaum, and Anne Williams, and each of them severally, his or her true and lawful attorney-in-fact with power of substitution and resubstitution to sign in his or her name, place and stead, in any and all capacities, to do any and all things and execute any and all instruments that such attorney may deem necessary or advisable under the Securities Exchange Act of 1934 and any rules, regulations and requirements of the U.S. Securities and Exchange Commission in connection with this Annual Report on Form 10-K and any and all amendments hereto, as fully for all intents and purposes as he or she might or could do in person, and hereby ratifies and confirms all said attorneys-in-fact and agents, each acting alone, and his or her substitute or substitutes, may lawfully do or cause to be done by virtue hereof.
Pursuant to the requirements of the Securities Exchange Act of 1934, this Report has been signed below by the following persons on behalf of the registrant and in the capacities and on the dates indicated.
| Dated: March 15, 2017 |
/s/ ROBERTO E. BARRAGAN | |||||
| Roberto E. Barragan Director | ||||||
| Dated: March 15, 2017 |
/s/ CHARLES R. BEAUREGARD | |||||
| Charles R. Beauregard Director | ||||||
| Dated: March 15, 2017 |
/s/ KENNETH J. COSGROVE | |||||
| Kenneth J. Cosgrove Director | ||||||
| Dated: March 15, 2017 |
/s/ DAVID C. HOLMAN | |||||
| David C. Holman Director | ||||||
| Dated: March 15, 2017 |
/s/ K. BRIAN HORTON | |||||
| K. Brian Horton | ||||||
| Director and President | ||||||
| Dated: March 15, 2017 |
/s/ ERIC S. KENTOR | |||||
| Eric S. Kentor Director | ||||||
169
Table of Contents
| Dated: March 15, 2017 |
/s/ JEFFREY J. LEITZINGER, Ph.D. | |||||
| Jeffrey J. Leitzinger, Ph.D. Director | ||||||
| Dated: March 15, 2017 |
/s/ DAVID I. RAINER | |||||
| David I. Rainer | ||||||
| Chairman of the Board and Chief Executive Officer (Principal Executive Officer) | ||||||
| Dated: March 15, 2017 |
/s/ ROY A. SALTER | |||||
| Roy A. Salter Director | ||||||
| Dated: March 15, 2017 |
/s/ KAREN A. SCHOENBAUM | |||||
| Karen A. Schoenbaum Executive Vice President and Chief Financial Officer (Principal Financial Officer and Principal Accounting Officer) | ||||||
| Dated: March 15, 2017 |
/s/ DANIEL F. SELLECK | |||||
| Daniel F. Selleck Director | ||||||
| Dated: March 15, 2017 |
/s/ CHARLES H. SWEETMAN | |||||
| Charles H. Sweetman Director | ||||||
| Dated: March 15, 2017 |
/s/ KAVEH VARJAVAND | |||||
| Kaveh Varjavand Director | ||||||
170