Attached files
| file | filename |
|---|---|
| 8-K - 8-K - POTLATCHDELTIC CORP | a8-kinvesterpresentationma.htm |
Potlatch Corporation Michael J. Covey Chairman & Chief Executive Officer Jerald W. Richards Vice President & Chief Financial Officer March 2015 Investor Presentation
FORWARD-LOOKING STATEMENTS This presentation contains certain forward-looking statements within the meaning of the Private Litigation Reform Act of 1995 as amended, including without limitation, statements about future company performance, the company’s business model, annual production of lumber and plywood, direction of markets and the economy, forecast of U.S. housing starts, forecast U.S. lumber consumption, forecast U.S. lumber supply, ability to increase or decrease harvest volume to meet market conditions, expectation that incremental lumber production will come from the South; effect of increased manufacturing in the South on lumber prices, effect of increased sawlog prices on EBITDDA in the North and South regions, effect of increased lumber prices on EBITDDA, expected harvest level range over the next 15 years and beyond, forecast North American log and lumber exports to China, log, lumber and panel price trends, effect of mountain pine beetle and allowable cut on Canadian supply, forecast of inventory of available live and dead lodgepole pine in B.C., debt maturities, cash flows, management of timberlands to optimize values, real estate value opportunities, real estate business potential and land development potential, typical annual “same-store” sales, and similar matters. These forward-looking statements are based on current expectations, estimates, assumptions and projections that are subject to change, and actual results may differ materially from the forward-looking statements. Factors that could cause actual results to differ materially include, but are not limited to, changes in timberland values; changes in timber harvest levels on the company’s lands; changes in timber prices; changes in policy regarding governmental timber sales; changes in the United States and international economies; changes in U.S. job growth; changes in U.S. bank lending practices; changes in the level of domestic construction activity; changes in international tariffs, quotas and trade agreements involving wood products; changes in domestic and international demand for wood products; changes in production and production capacity in the forest products industry; competitive pricing pressures for the company’s products; unanticipated manufacturing disruptions; changes in general and industry-specific environmental laws and regulations; unforeseen environmental liabilities or expenditures; weather conditions; changes in fuel and energy costs; changes in raw material and other costs; the ability to satisfy complex rules in order to remain qualified as a REIT; changes in tax laws that could reduce the benefits associated with REIT status; and other risks and uncertainties described from time to time in the company’s public filings with the Securities and Exchange Commission. All forward- looking statements are made as of the date of this presentation, and the company does not undertake to update any forward-looking statements. NON-GAAP MEASURES This presentation presents non-U.S. GAAP financial information. A reconciliation of those numbers to U.S. GAAP is included in this presentation which is available on the company’s website at www.potlatchcorp.com. Forward-Looking Statements & Non-GAAP Measures March 2015 - Investor Presentation Slides 2
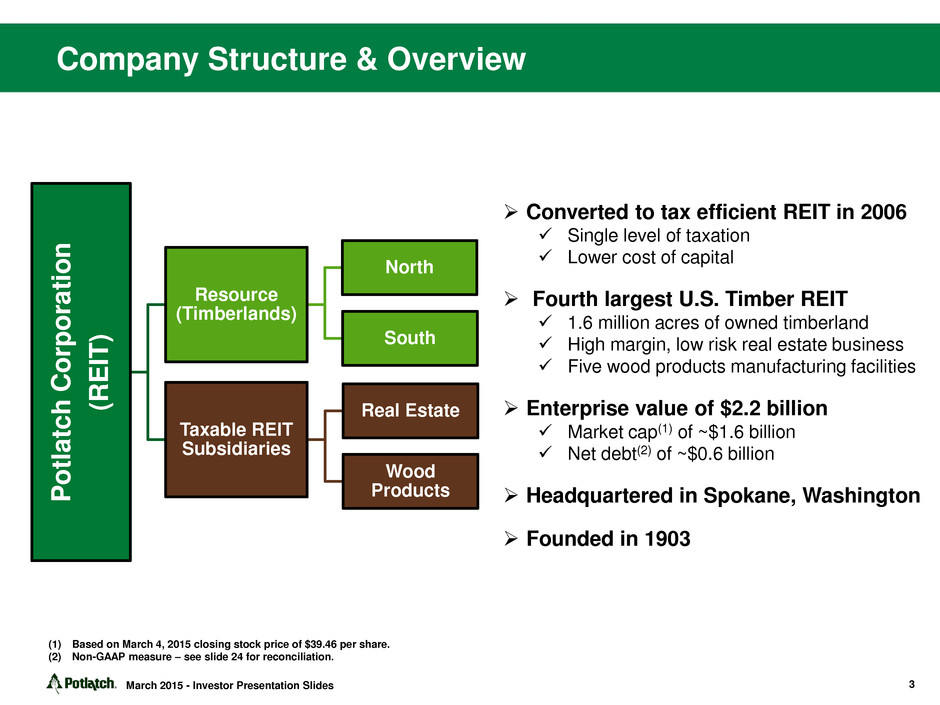
Company Structure & Overview P otlatch Corporati o n (R E IT ) Resource (Timberlands) North South Taxable REIT Subsidiaries Real Estate Wood Products Converted to tax efficient REIT in 2006 Single level of taxation Lower cost of capital Fourth largest U.S. Timber REIT 1.6 million acres of owned timberland High margin, low risk real estate business Five wood products manufacturing facilities Enterprise value of $2.2 billion Market cap(1) of ~$1.6 billion Net debt(2) of ~$0.6 billion Headquartered in Spokane, Washington Founded in 1903 (1) Based on March 4, 2015 closing stock price of $39.46 per share. (2) Non-GAAP measure – see slide 24 for reconciliation. 3 March 2015 - Investor Presentation Slides
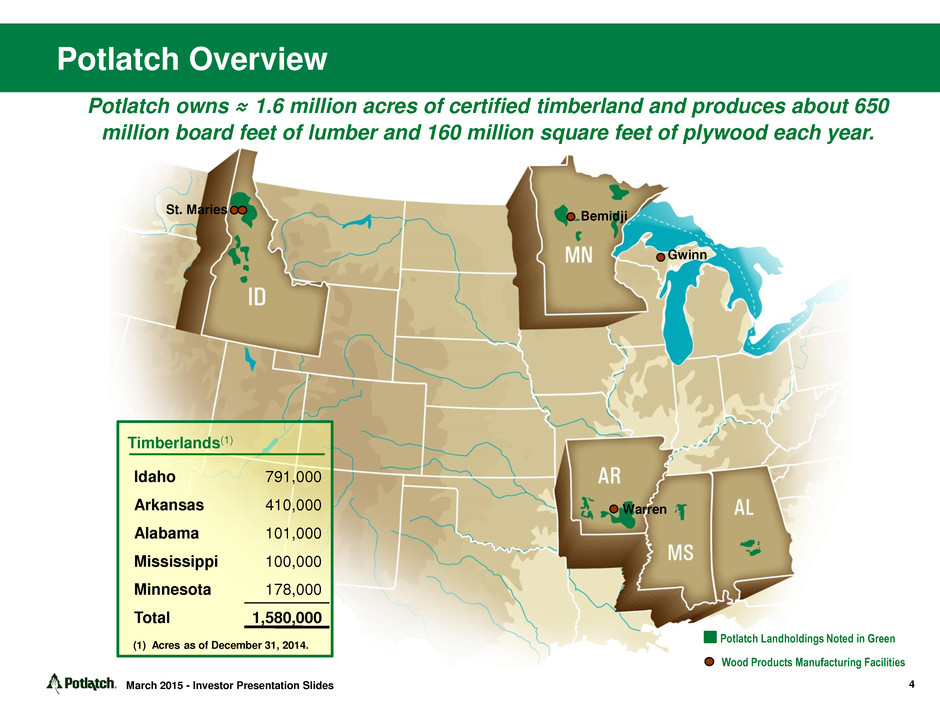
St. Maries Bemidji Gwinn Warren Potlatch Overview Potlatch owns ≈ 1.6 million acres of certified timberland and produces about 650 million board feet of lumber and 160 million square feet of plywood each year. 4 (1) Acres as of December 31, 2014. Idaho 791,000 Arkansas 410,000 Alabama 101,000 Mississippi 100,000 Minnesota 178,000 Total 1,580,000 Timberlands(1) Potlatch Landholdings Noted in Green Wood Products Manufacturing Facilities March 2015 - Investor Presentation Slides
Key Drivers Are Favorable U.S. housing starts are recovering which drives higher lumber demand Canada’s ability to participate in U.S. recovery is limited by effect of the pine beetle and reduction in allowable cut Incremental lumber production will come from the U.S. South North American exports to China tension the U.S. market Log and lumber prices are expected to increase March 2015 - Investor Presentation Slides 5
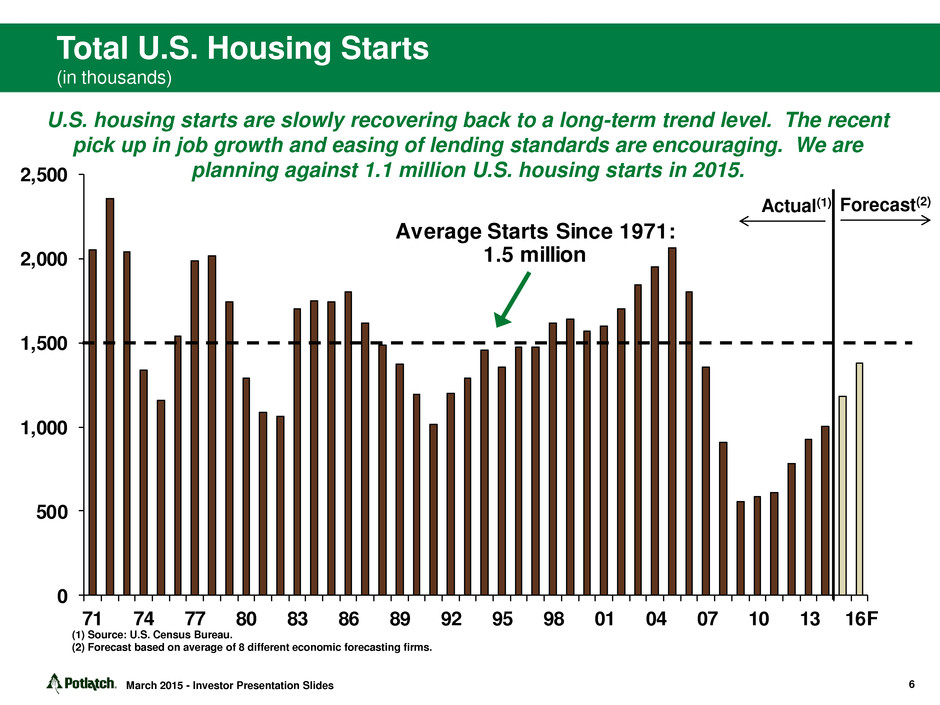
Total U.S. Housing Starts (in thousands) 0 500 1,000 1,500 2,000 2,500 71 74 77 80 83 86 89 92 95 98 01 04 07 10 13 16F Average Starts Since 1971: 1.5 million U.S. housing starts are slowly recovering back to a long-term trend level. The recent pick up in job growth and easing of lending standards are encouraging. We are planning against 1.1 million U.S. housing starts in 2015. (1) Source: U.S. Census Bureau. (2) Forecast based on average of 8 different economic forecasting firms. Forecast(2) Actual(1) 6 March 2015 - Investor Presentation Slides
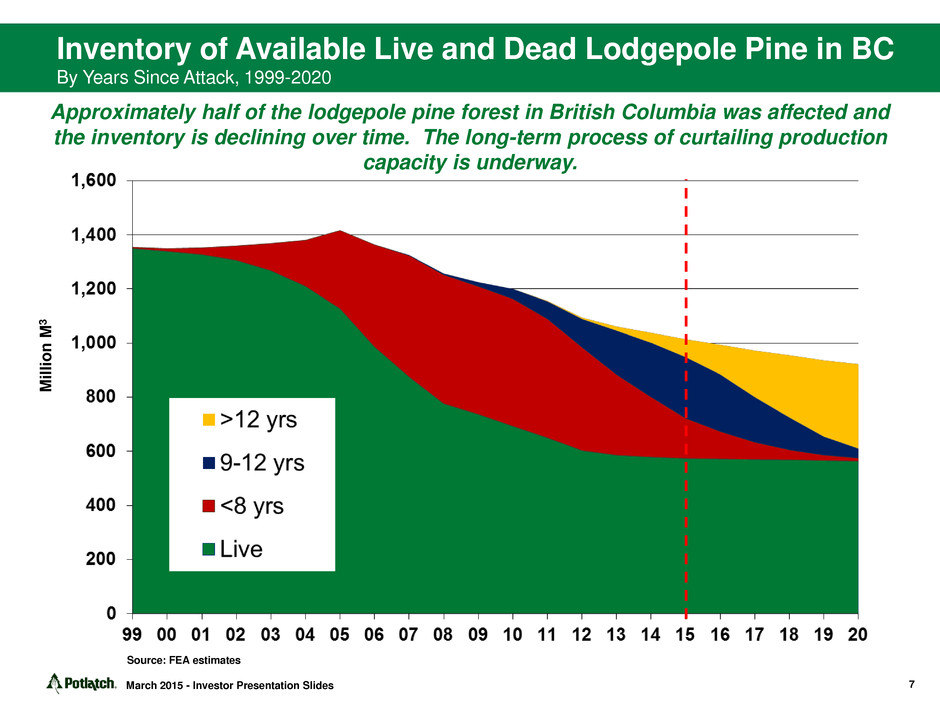
Approximately half of the lodgepole pine forest in British Columbia was affected and the inventory is declining over time. The long-term process of curtailing production capacity is underway. Inventory of Available Live and Dead Lodgepole Pine in BC By Years Since Attack, 1999-2020 7 M il li on M 3 Source: FEA estimates March 2015 - Investor Presentation Slides
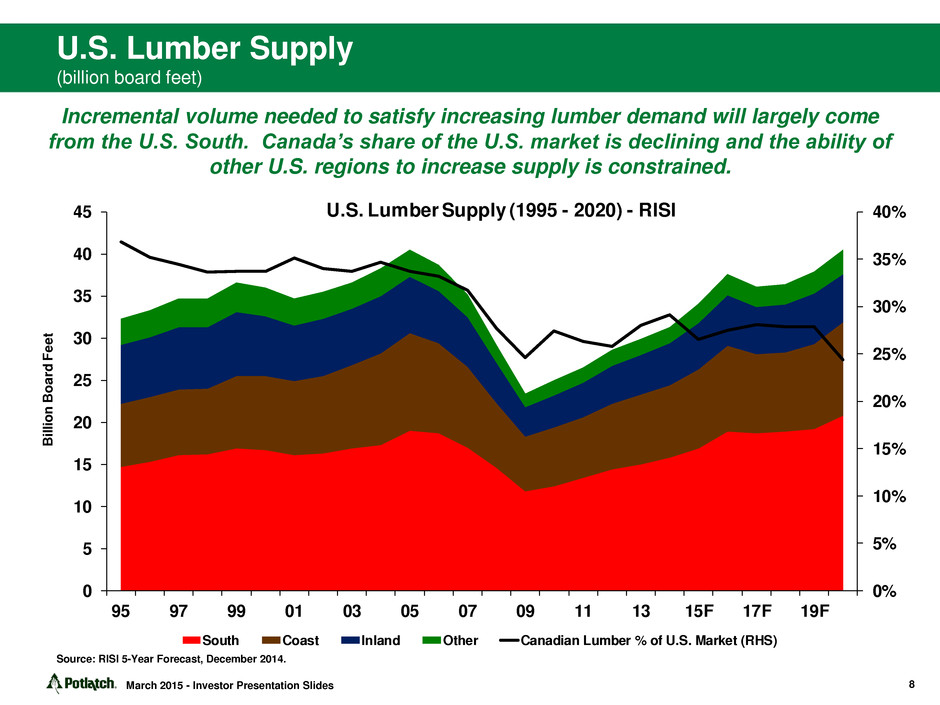
0% 5% 10% 15% 20% 25% 30% 35% 40% 0 5 10 15 20 25 30 35 40 45 95 97 99 01 03 05 07 09 11 13 15F 17F 19F Bi llio n B oa rd Fe et U.S. Lumber Supply (1995 - 2020) - RISI South Coast Inland Other Canadian Lumber % of U.S. Market (RHS) U.S. Lumber Supply (billion board feet) Incremental volume needed to satisfy increasing lumber demand will largely come from the U.S. South. Canada’s share of the U.S. market is declining and the ability of other U.S. regions to increase supply is constrained. 8 March 2015 - Investor Presentation Slides Source: RISI 5-Year Forecast, December 2014.
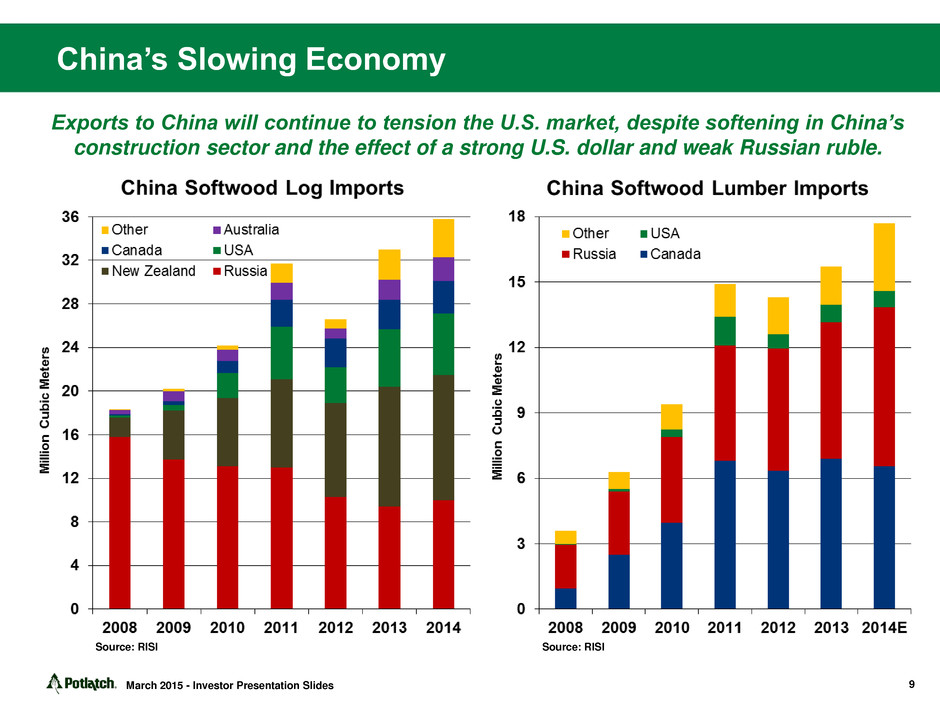
China’s Slowing Economy March 2015 - Investor Presentation Slides 9 Exports to China will continue to tension the U.S. market, despite softening in China’s construction sector and the effect of a strong U.S. dollar and weak Russian ruble. Source: RISI Source: RISI
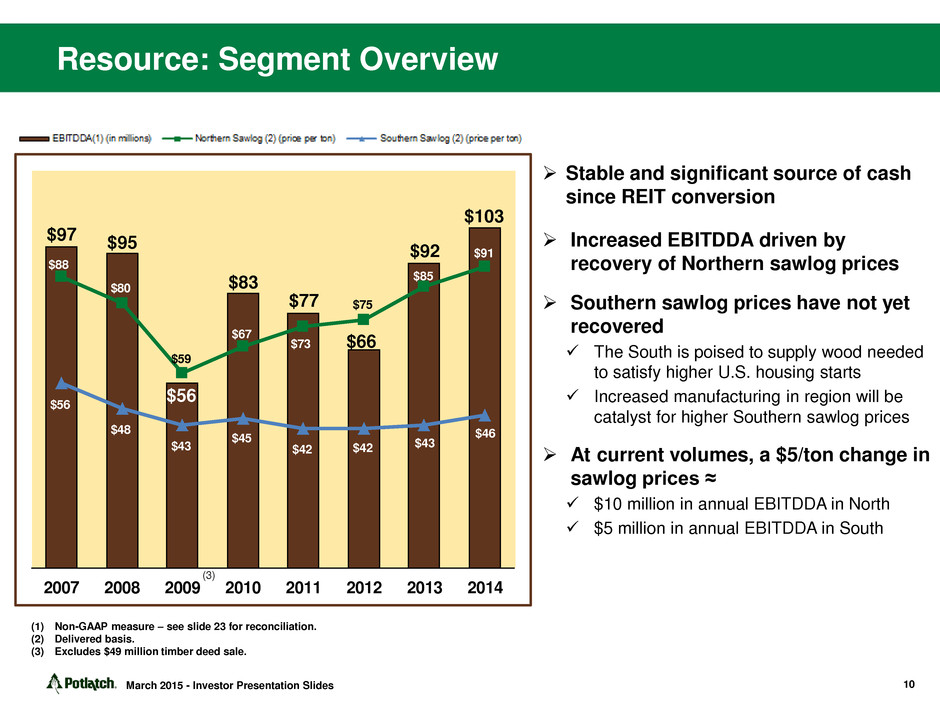
Resource: Segment Overview Stable and significant source of cash since REIT conversion Increased EBITDDA driven by recovery of Northern sawlog prices Southern sawlog prices have not yet recovered The South is poised to supply wood needed to satisfy higher U.S. housing starts Increased manufacturing in region will be catalyst for higher Southern sawlog prices At current volumes, a $5/ton change in sawlog prices ≈ $10 million in annual EBITDDA in North $5 million in annual EBITDDA in South (1) Non-GAAP measure – see slide 23 for reconciliation. (2) Delivered basis. (3) Excludes $49 million timber deed sale. 10 $97 $95 $56 $83 $77 $66 $92 $103 $88 $80 $59 $67 $73 $75 $85 $91 $56 $48 $43 $45 $42 $42 $43 $46 2007 2008 2009 2010 2011 2012 2013 2014 (3) March 2015 - Investor Presentation Slides
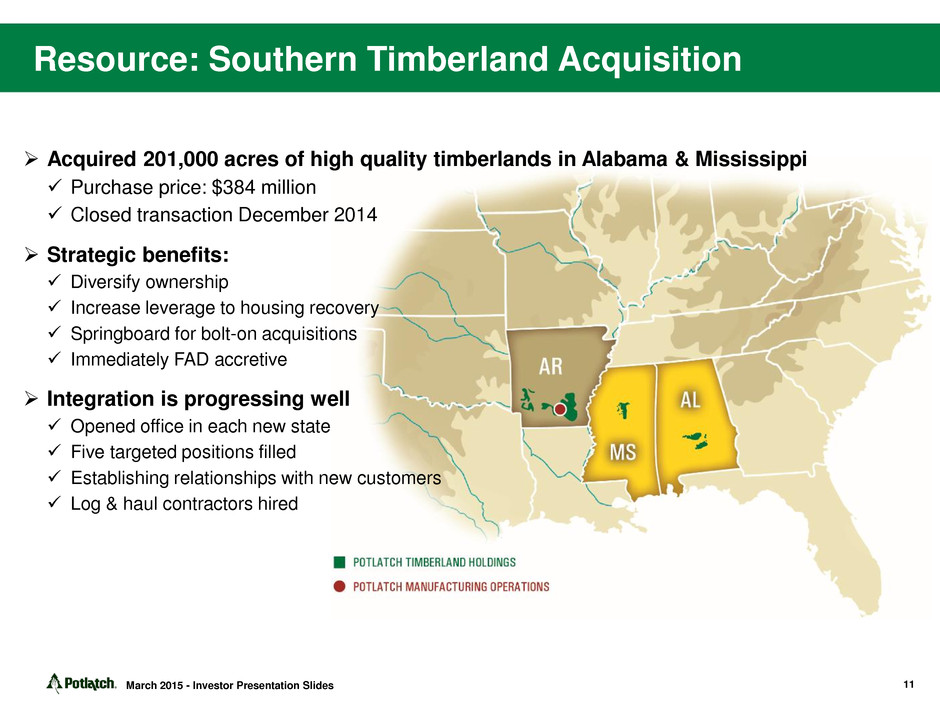
Resource: Southern Timberland Acquisition Acquired 201,000 acres of high quality timberlands in Alabama & Mississippi Purchase price: $384 million Closed transaction December 2014 Strategic benefits: Diversify ownership Increase leverage to housing recovery Springboard for bolt-on acquisitions Immediately FAD accretive Integration is progressing well Opened office in each new state Five targeted positions filled Establishing relationships with new customers Log & haul contractors hired March 2015 - Investor Presentation Slides 11
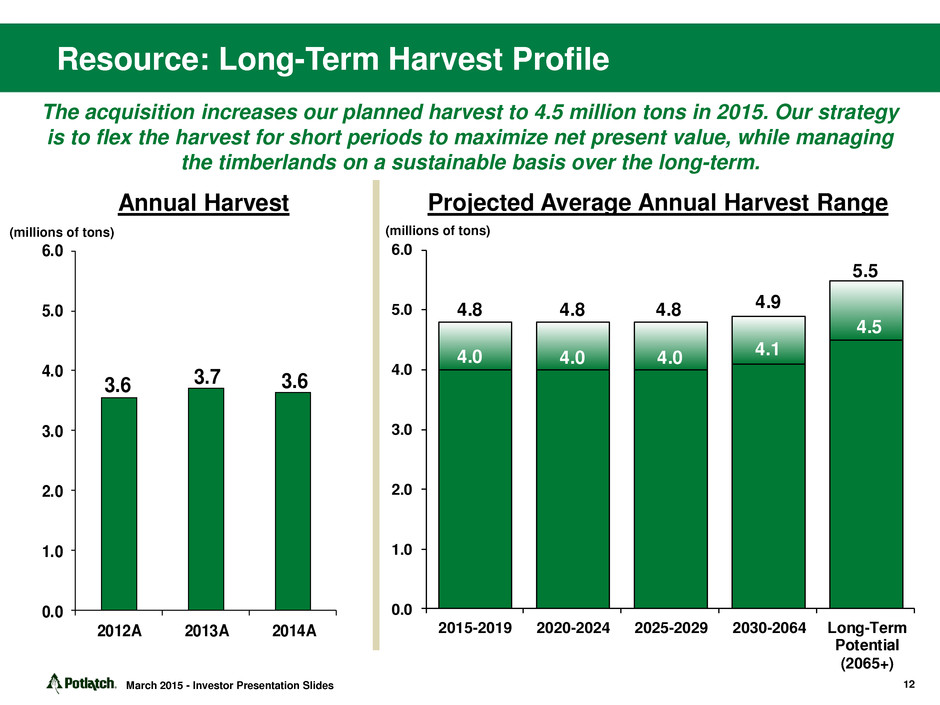
Resource: Long-Term Harvest Profile 3.6 3.7 3.6 0.0 1.0 2.0 3.0 4.0 5.0 6.0 2012A 2013A 2014A 4.0 4.0 4.0 4.1 4.5 4.8 4.8 4.8 4.9 5.5 0.0 1.0 2.0 3.0 4.0 5.0 6.0 2015-2019 2020-2024 2025-2029 2030-2064 Long-Term Potential (2065+) Annual Harvest Projected Average Annual Harvest Range (millions of tons) (millions of tons) 12 March 2015 - Investor Presentation Slides The acquisition increases our planned harvest to 4.5 million tons in 2015. Our strategy is to flex the harvest for short periods to maximize net present value, while managing the timberlands on a sustainable basis over the long-term.
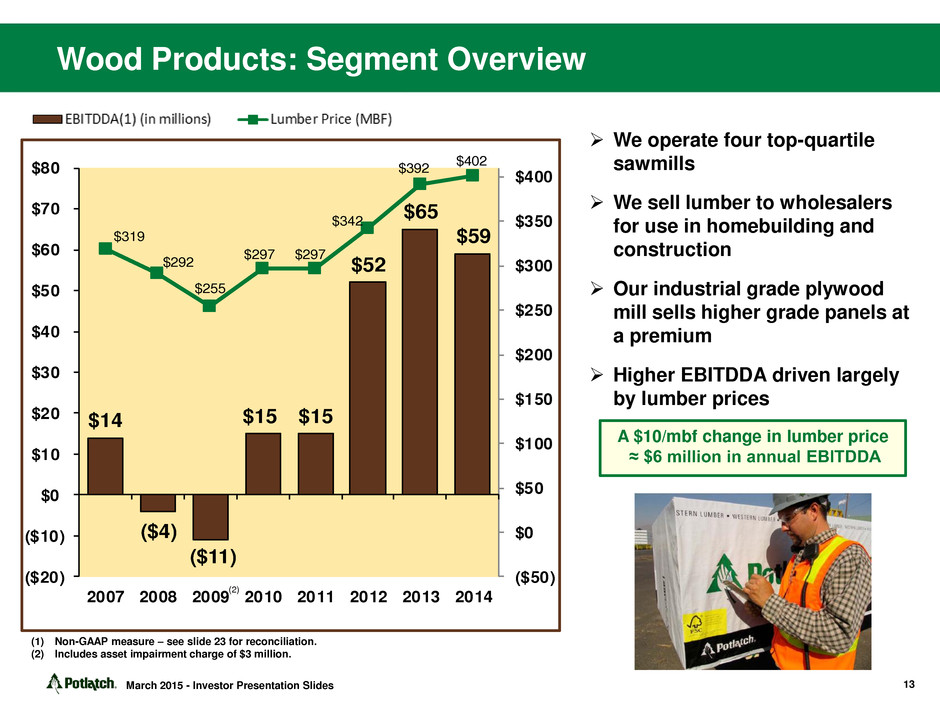
$14 ($4) ($11) $15 $15 $52 $65 $59$319 $292 $255 $297 $297 $342 $392 $402 ($50) $0 $50 $100 $150 $200 $250 $300 $350 $400 ($20) ($10) $0 $10 $20 $30 $40 $50 $60 $70 $80 2007 2008 2009 2010 2011 2012 2013 2014 Wood Products: Segment Overview We operate four top-quartile sawmills We sell lumber to wholesalers for use in homebuilding and construction Our industrial grade plywood mill sells higher grade panels at a premium Higher EBITDDA driven largely by lumber prices (1) Non-GAAP measure – see slide 23 for reconciliation. (2) Includes asset impairment charge of $3 million. (2) 13 A $10/mbf change in lumber price ≈ $6 million in annual EBITDDA March 2015 - Investor Presentation Slides
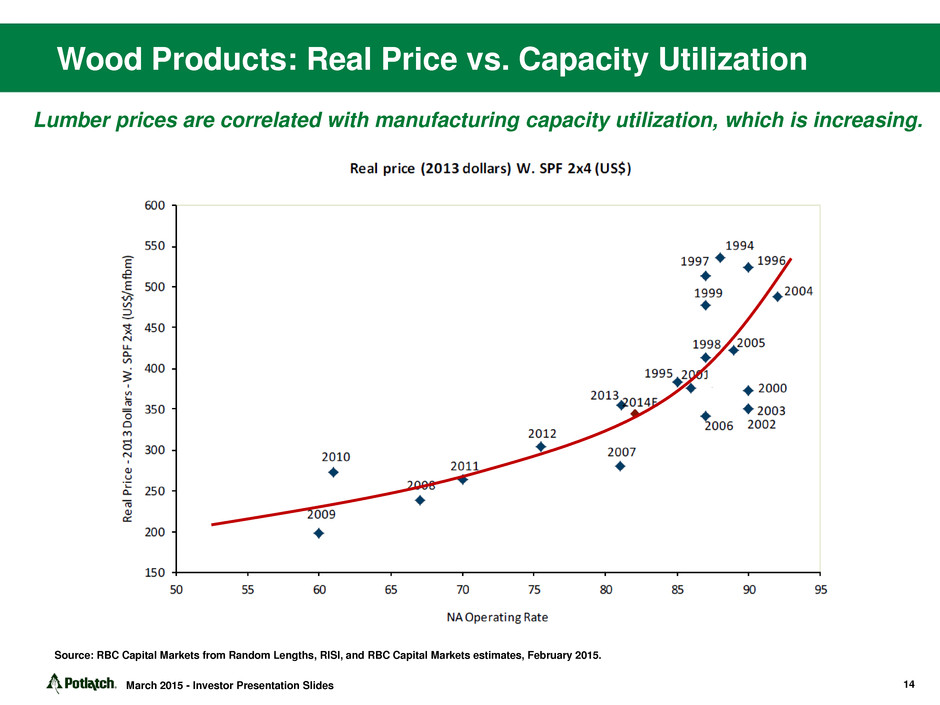
Wood Products: Real Price vs. Capacity Utilization 14 Lumber prices are correlated with manufacturing capacity utilization, which is increasing. Source: RBC Capital Markets from Random Lengths, RISI, and RBC Capital Markets estimates, February 2015. March 2015 - Investor Presentation Slides
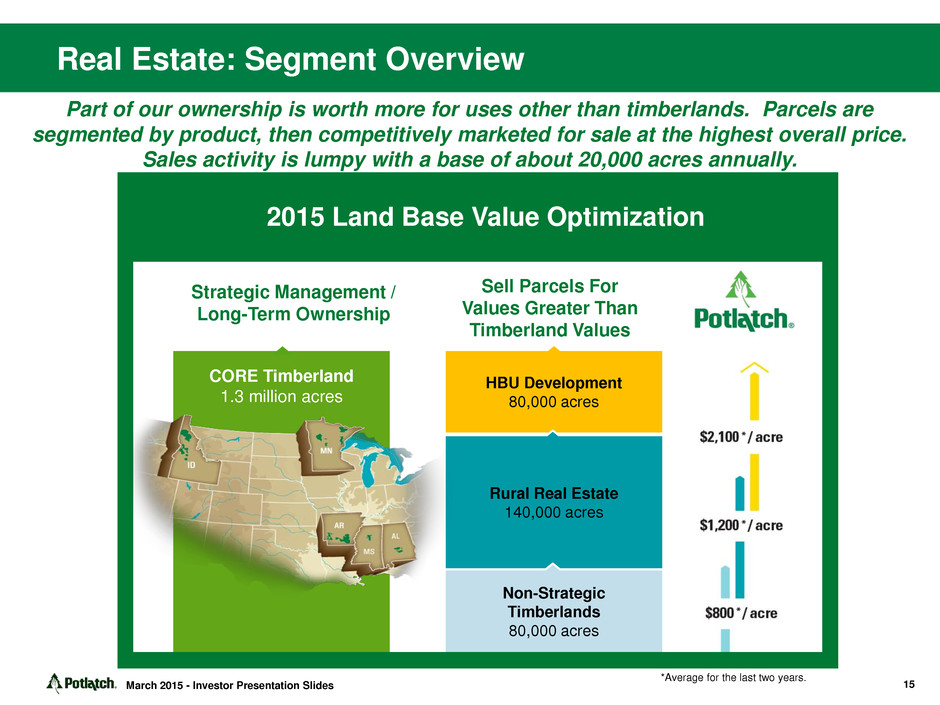
Real Estate: Segment Overview 15 Part of our ownership is worth more for uses other than timberlands. Parcels are segmented by product, then competitively marketed for sale at the highest overall price. Sales activity is lumpy with a base of about 20,000 acres annually. March 2015 - Investor Presentation Slides Strategic Management / Long-Term Ownership Sell Parcels For Values Greater Than Timberland Values CORE Timberland 1.3 million acres HBU Development 80,000 acres Rural Real Estate 140,000 acres Non-Strategic Timberlands 80,000 acres 2015 Land Base Value Optimization *Average for the last two years.
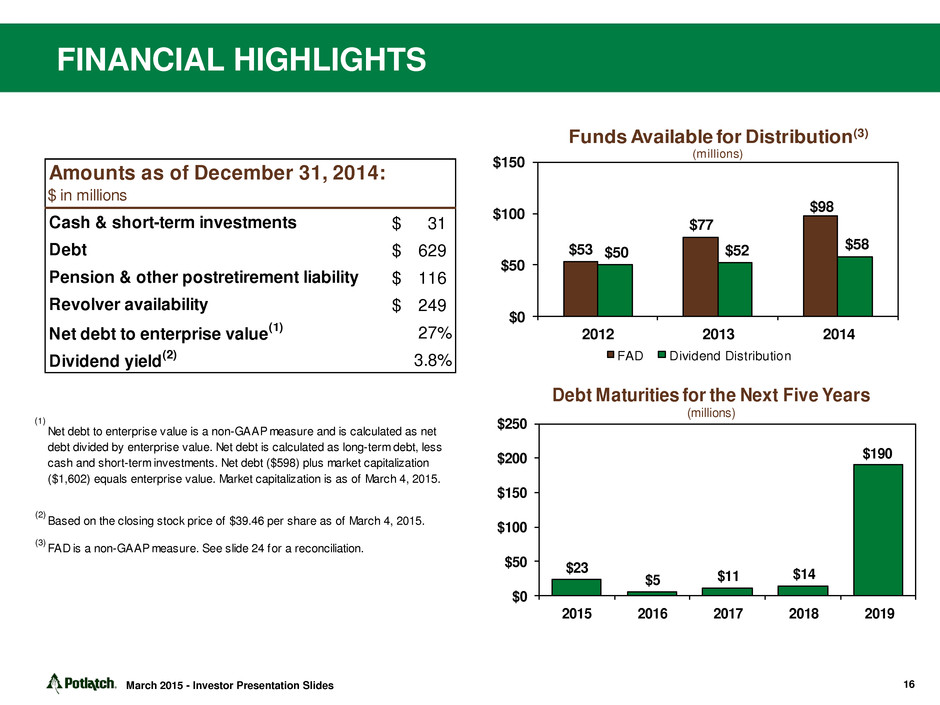
FINANCIAL HIGHLIGHTS 16 Amounts as of December 31, 2014: $ in millions Cash & short-term investments 31$ Debt 629$ Pension & other postretirement liability 116$ Revolver availability 249$ Net debt to enterprise value (1) 27% Dividend yield (2) 3.8% Net debt to enterprise value is a non-GAAP measure and is calculated as net debt divided by enterprise value. Net debt is calculated as long-term debt, less cash and short-term investments. Net debt ($598) plus market capitalization ($1,602) equals enterprise value. Market capitalization is as of March 4, 2015. Based on the closing stock price of $39.46 per share as of March 4, 2015. FAD is a non-GAAP measure. See slide 24 for a reconciliation. $23 $5 $11 $14 $190 0 $50 $100 $150 $200 $250 2015 2016 2017 2018 2019 Debt Maturities for the Next Five Years (millions)$53 $77 $98 $50 $52 $58 $0 $50 $100 $150 2012 2013 2014 Funds Available for Distribution(3) (millions) FAD Dividend Distribution (1) (2) (3) March 2015 - Investor Presentation Slides
Conclusion: Investment Takeaways High quality timberland portfolio Largest private landowner in Idaho Southern ownership poised to take advantage of sawlog price recovery Solid base provides ability to grow timberland ownership in attractive wood baskets Wood Products mills are first quartile based on margin benchmarks Real Estate segment has low risk, high margin attributes Attractive dividend yield currently at 3.8%(1) Long-term industry trends are very favorable U.S. housing starts on path to recovery North American exports to China tension the U.S. market Lower supply from Canada Potlatch is highly leveraged to the housing recovery (1) Based on March 4, 2015 closing stock price of $39.46 per share. 17 March 2015 - Investor Presentation Slides
Appendix
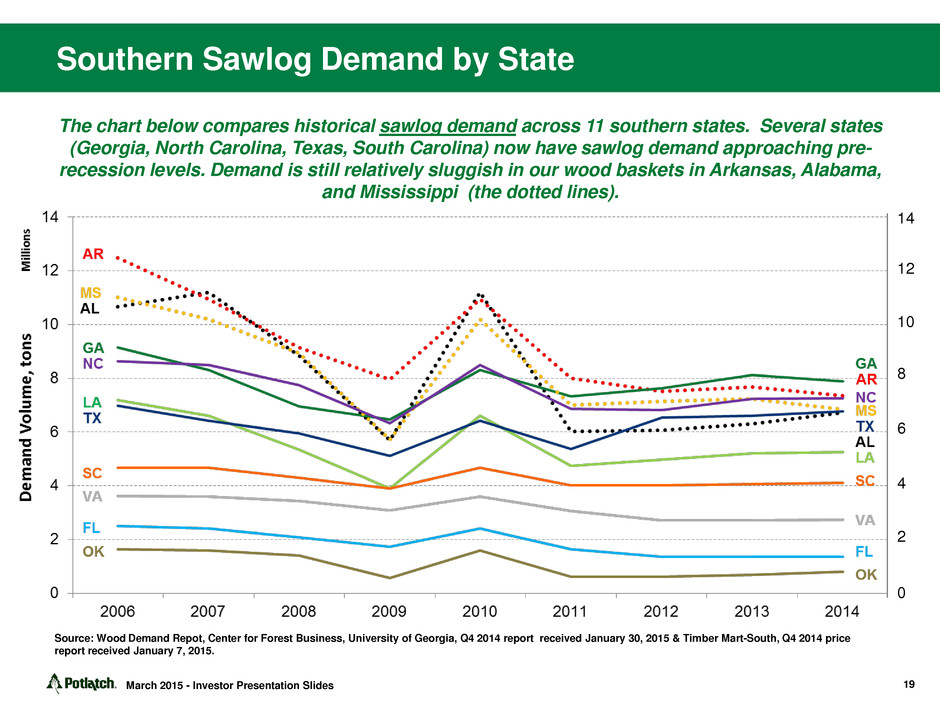
The chart below compares historical sawlog demand across 11 southern states. Several states (Georgia, North Carolina, Texas, South Carolina) now have sawlog demand approaching pre- recession levels. Demand is still relatively sluggish in our wood baskets in Arkansas, Alabama, and Mississippi (the dotted lines). Southern Sawlog Demand by State March 2015 - Investor Presentation Slides 19 14 12 10 8 6 4 2 0 Source: Wood Demand Repot, Center for Forest Business, University of Georgia, Q4 2014 report received January 30, 2015 & Timber Mart-South, Q4 2014 price report received January 7, 2015.
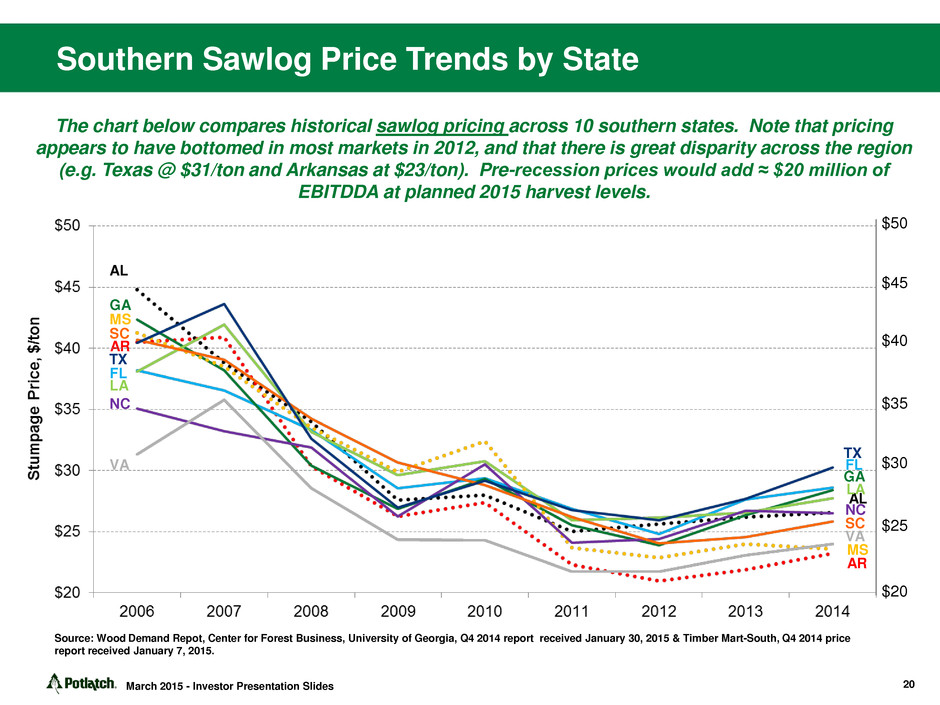
Southern Sawlog Price Trends by State AR MS GA AL FL LA NC AR SC MS TX VA GA AL SC FL LA TX VA NC $50 $45 $40 $35 $30 $25 $20 The chart below compares historical sawlog pricing across 10 southern states. Note that pricing appears to have bottomed in most markets in 2012, and that there is great disparity across the region (e.g. Texas @ $31/ton and Arkansas at $23/ton). Pre-recession prices would add ≈ $20 million of EBITDDA at planned 2015 harvest levels. March 2015 - Investor Presentation Slides 20 Source: Wood Demand Repot, Center for Forest Business, University of Georgia, Q4 2014 report received January 30, 2015 & Timber Mart-South, Q4 2014 price report received January 7, 2015.
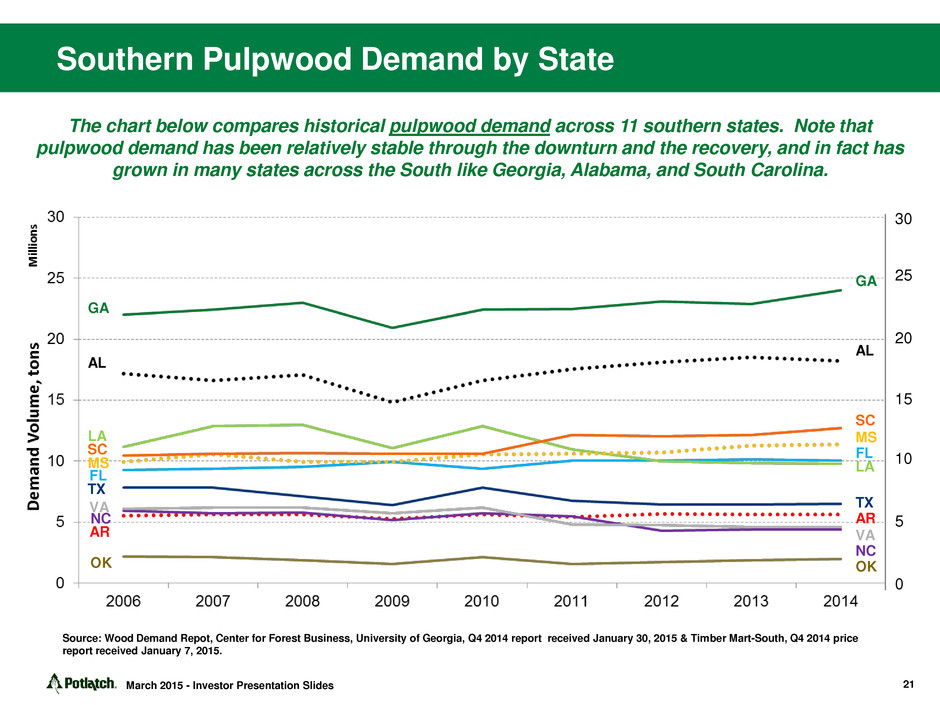
GA GA AL AL SC SC MS MS FL FL LA LA TX TX AR AR VA VA NC NC OK OK 30 25 20 15 10 5 0 The chart below compares historical pulpwood demand across 11 southern states. Note that pulpwood demand has been relatively stable through the downturn and the recovery, and in fact has grown in many states across the South like Georgia, Alabama, and South Carolina. Southern Pulpwood Demand by State 21 Source: Wood Demand Repot, Center for Forest Business, University of Georgia, Q4 2014 report received January 30, 2015 & Timber Mart-South, Q4 2014 price report received January 7, 2015. March 2015 - Investor Presentation Slides
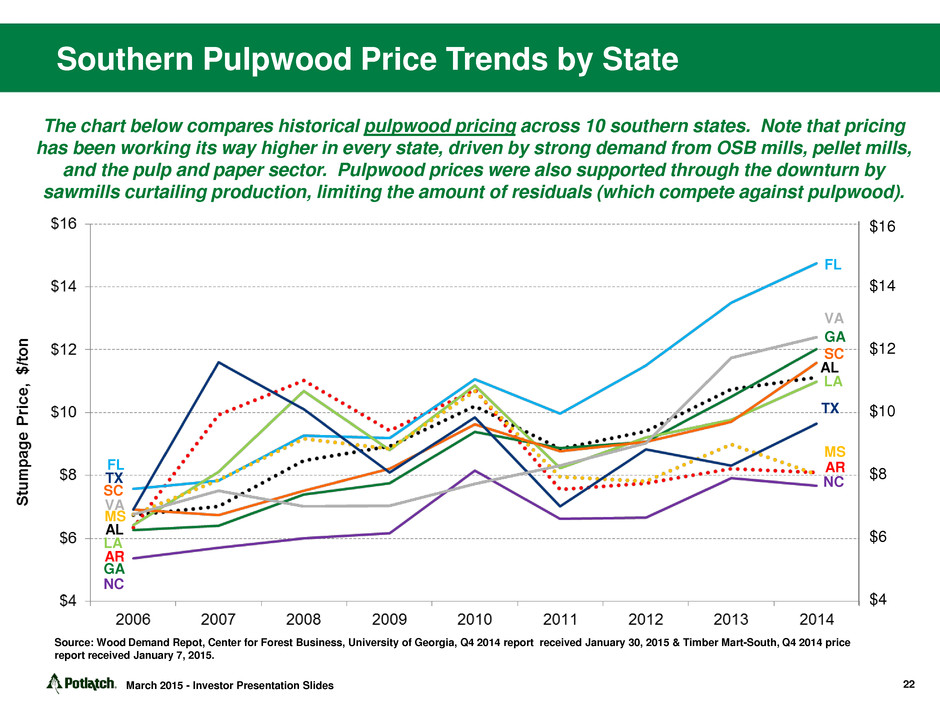
MS AL LA SC LA VA GA AL MS FL TX AR VA NC GA SC FL TX AR NC $16 $14 $12 $10 $8 $6 $4 The chart below compares historical pulpwood pricing across 10 southern states. Note that pricing has been working its way higher in every state, driven by strong demand from OSB mills, pellet mills, and the pulp and paper sector. Pulpwood prices were also supported through the downturn by sawmills curtailing production, limiting the amount of residuals (which compete against pulpwood). Southern Pulpwood Price Trends by State 22 Source: Wood Demand Repot, Center for Forest Business, University of Georgia, Q4 2014 report received January 30, 2015 & Timber Mart-South, Q4 2014 price report received January 7, 2015. March 2015 - Investor Presentation Slides
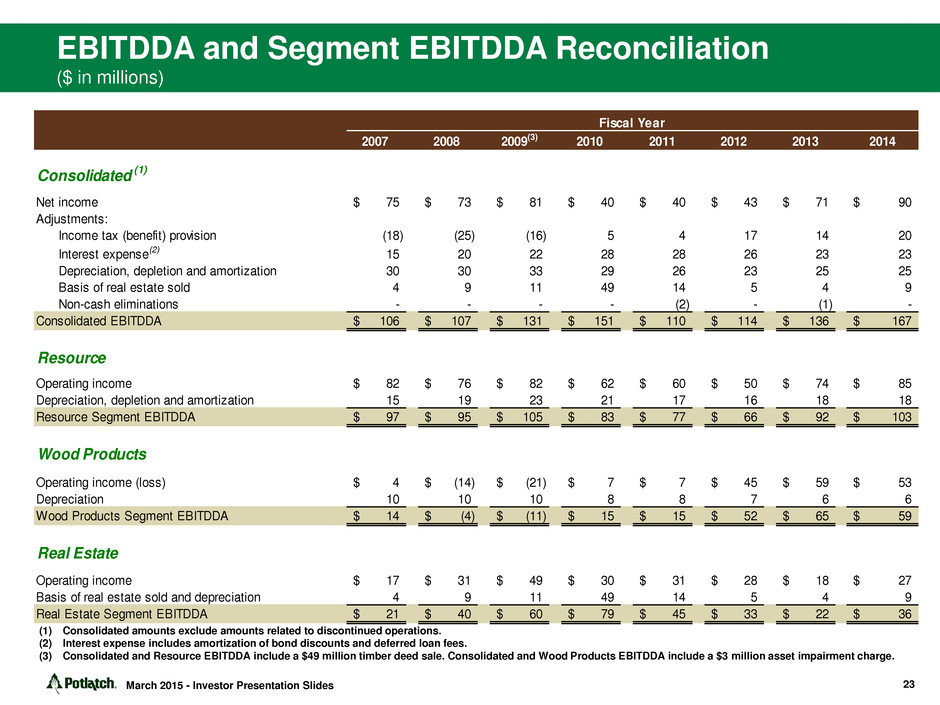
EBITDDA and Segment EBITDDA Reconciliation ($ in millions) 2007 2008 2009(3) 2010 2011 2012 2013 2014 Consolidated (1) Net income 75$ 73$ 81$ 40$ 40$ 43$ 71$ 90$ Adjustments: Income tax (benefit) provision (18) (25) (16) 5 4 17 14 20 Interest expense(2) 15 20 22 28 28 26 23 23 Depreciation, depletion and amortization 30 30 33 29 26 23 25 25 Basis of real estate sold 4 9 11 49 14 5 4 9 Non-cash eliminations - - - - (2) - (1) - Consolidated EBITDDA 106$ 107$ 131$ 151$ 110$ 114$ 136$ 167$ Resource Operating income 82$ 76$ 82$ 62$ 60$ 50$ 74$ 85$ Depreciation, depletion and amortization 15 19 23 21 17 16 18 18 Resource Segment EBITDDA 97$ 95$ 105$ 83$ 77$ 66$ 92$ 103$ Wood Products Operating income (loss) 4$ (14)$ (21)$ 7$ 7$ 45$ 59$ 53$ Depreciation 10 10 10 8 8 7 6 6 Wood Products Segment EBITDDA 14$ (4)$ (11)$ 15$ 15$ 52$ 65$ 59$ Real Estate Operating income 17$ 31$ 49$ 30$ 31$ 28$ 18$ 27$ Basis of real estate sold and depreciation 4 9 11 49 14 5 4 9 Real Estate Segment EBITDDA 21$ 40$ 60$ 79$ 45$ 33$ 22$ 36$ Fiscal Year (1) Consolidated amounts exclude amounts related to discontinued operations. (2) Interest expense includes amortization of bond discounts and deferred loan fees. (3) Consolidated and Resource EBITDDA include a $49 million timber deed sale. Consolidated and Wood Products EBITDDA include a $3 million asset impairment charge. 23 March 2015 - Investor Presentation Slides
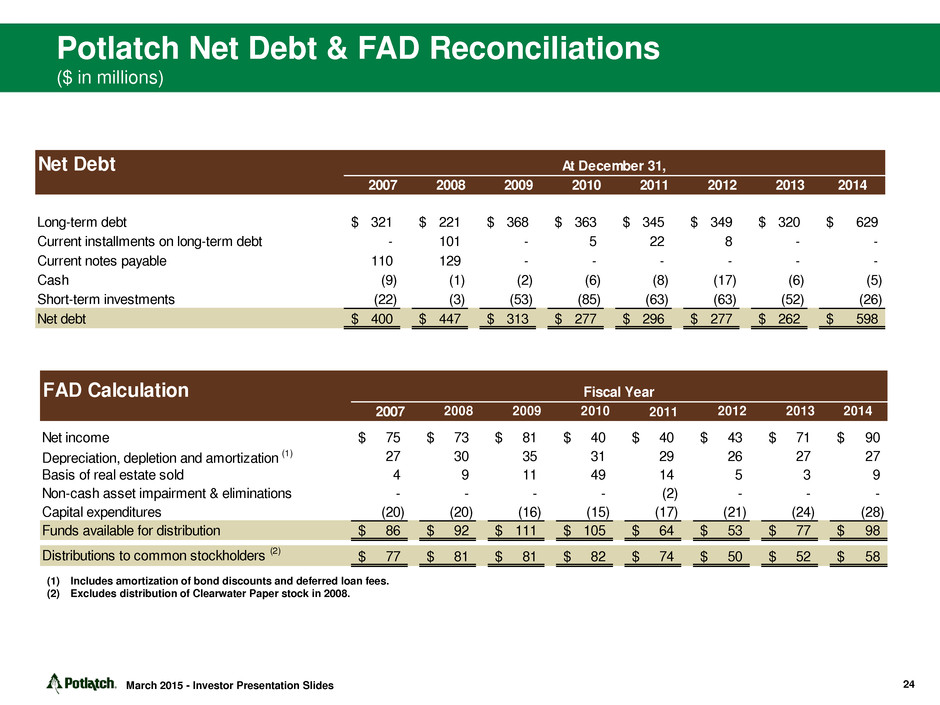
Potlatch Net Debt & FAD Reconciliations ($ in millions) Net Debt 2007 2008 2009 2010 2011 2012 2013 2014 Long-term debt 321$ 221$ 368$ 363$ 345$ 349$ 320$ 629$ Current installments on long-term debt - 101 - 5 22 8 - - Current notes payable 110 129 - - - - - - Cash (9) (1) (2) (6) (8) (17) (6) (5) Short-term investments (22) (3) (53) (85) (63) (63) (52) (26) Net debt 400$ 447$ 313$ 277$ 296$ 277$ 262$ 598$ At December 31, FAD Calculati n 2007 2008 2009 2010 2011 2012 2013 2014 Net income 75$ 73$ 81$ 40$ 40$ 43$ 71$ 90$ Dep eciatio , depletion and amortization (1) 7 30 35 31 29 26 27 27 Basis of real estate sold 4 9 1 49 14 5 3 9 Non-cash asset impairment & eliminations - - - - (2) - - - Capital expenditures (20) (20) (16) (15) (17) (21) (24) (28) Funds available for distribution 86$ 92$ 111$ 105$ 64$ 53$ 77$ 98$ Distributions to common stockholders (2) 77$ 81$ 81$ 82$ 74$ 50$ 52$ 58$ Fiscal Year (1) Includes amortization of bond discounts and deferred loan fees. (2) Excludes distribution of Clearwater Paper stock in 2008. 24 March 2015 - Investor Presentation Slides
Definitions of Non-GAAP Measures EBITDDA is a non-GAAP measure that management uses to evaluate the cash generating capacity of the company. EBITDDA, as we define it, is net income (loss) adjusted for net cash interest expense, provision (benefit) for income taxes, depreciation, depletion and amortization, basis of real estate sold and non-cash asset impairment and eliminations. Segment EBITDDA from continuing operations, as we define it, is segment operating income (loss) adjusted for depreciation, depletion, amortization and the basis of real estate sold. Funds Available for Distribution (FAD), as we define it, is net income (loss) adjusted for depreciation, depletion and amortization, basis of real estate sold, non-cash asset impairment and eliminations and capital expenditures. For purposes of this definition, capital expenditures exclude all expenditures relating to direct or indirect timberland purchases in excess of $5 million. 25 March 2015 - Investor Presentation Slides
