Attached files
| file | filename |
|---|---|
| 8-K - FORM 8-K - BANC OF CALIFORNIA, INC. | d888397d8k.htm |
 Sandler
O’Neill West Coast Financial Services Conference
Investor Presentation
March 11, 2015
Exhibit 99.1 |
| 1
1
Forward-looking Statements
When used in this presentation and in documents filed with or furnished to the Securities and
Exchange Commission (the “SEC”), or other public shareholder communications,
or in oral statements made with the approval of an authorized executive officer, the words or phrases “believe,” “will,” “should,” “will likely result,”
“are expected to,” “will continue,” “is anticipated,”
“estimate,” “project,” “plans,” or similar expressions are intended to identify “forward-looking statements” within
the meaning of the Private Securities Litigation Reform Act of 1995. You are cautioned not to
place undue reliance on any forward-looking statements, which speak only as of the
date made. These statements may relate to future financial performance, strategic plans or objectives, revenue, expense or earnings projections, or other
financial items of Banc of California Inc. and its affiliates (“BANC,” the
“Company,” “we,” “us” or “our”). By their nature, these statements are subject to numerous
uncertainties that could cause actual results to differ materially from those anticipated in
the statements.
Factors that could cause actual results to differ materially from the results anticipated or
projected include, but are not limited to, the following: (i) risks that the
Company’s recently completed acquisitions, including the acquisitions of branches from
Banco Popular, The Private Bank of California, CS Financial, Inc., and The Palisades
Group, may disrupt current plans and operations, the potential difficulties in customer and employee retention as a result of those transactions and the
amount of the costs, fees, expenses and charges related to those transactions; (ii) the credit
risks of lending activities, which may be affected by further deterioration in real
estate markets and the financial condition of borrowers, may lead to increased loan and lease delinquencies, losses and nonperforming assets in our loan portfolio,
and may result in our allowance for loan and lease losses not being adequate to cover actual
losses and require us to materially increase our loan and lease loss reserves; (iii)
the quality and composition of our securities and loan portfolios; (iv) changes in general economic conditions, either nationally or in our market areas; (v)
continuation of the historically low short-term interest rate environment, changes in the
levels of general interest rates, and the relative differences between short- and
long-term interest rates, deposit interest rates, our net interest margin and funding sources; (vi) fluctuations in the demand for loans and leases, the number of
unsold homes and other properties and fluctuations in commercial and residential real estate
values in our market area; (vii) results of examinations of us by regulatory
authorities and the possibility that any such regulatory authority may, among other things,
require us to increase our allowance for loan and lease losses, write-down asset
values, increase our capital levels, or affect our ability to borrow funds or maintain or increase deposits, which could adversely affect our liquidity and earnings;
(viii) legislative or regulatory changes that adversely affect our business, including changes
in regulatory capital or other rules; (ix) our ability to control operating costs and
expenses; (x) staffing fluctuations in response to product demand or the implementation of corporate strategies that affect our work force and potential associated
charges; (xi) errors in our estimates in determining fair value of certain of our assets,
which may result in significant declines in valuation; (xii) the network and computer
systems on which we depend could fail or experience a security breach; (xiii) our ability to attract and retain key members of our senior management team;
(xiv) costs and effects of litigation, including settlements and judgments; (xv) increased
competitive pressures among financial services companies; (xvi) changes in consumer
spending, borrowing and saving habits; (xvii) adverse changes in the securities markets; (xviii) earthquake, fire or other natural disasters affecting the
condition of real estate collateral; (xix) the availability of resources to address changes in
laws, rules or regulations or to respond to regulatory actions; (xx) inability of key
third-party providers to perform their obligations to us; (xxi) changes in accounting policies and practices, as may be adopted by the financial institution regulatory
agencies or the Financial Accounting Standards Board or their application to our business or
final audit adjustments, including additional guidance and interpretation on accounting
issues and details of the implementation of new accounting methods; (xxii) war or terrorist activities; and (xxiii) other economic, competitive,
governmental, regulatory, and technological factors affecting our operations, pricing,
products and services and the other risks described in this report and from time to
time in other documents that we file with or furnish to the SEC. You should not place undue reliance on forward-looking statements, and we undertake no obligation
to update any such statements to reflect circumstances or events that occur after the date on
which the forward-looking statement is made. |
 2
2
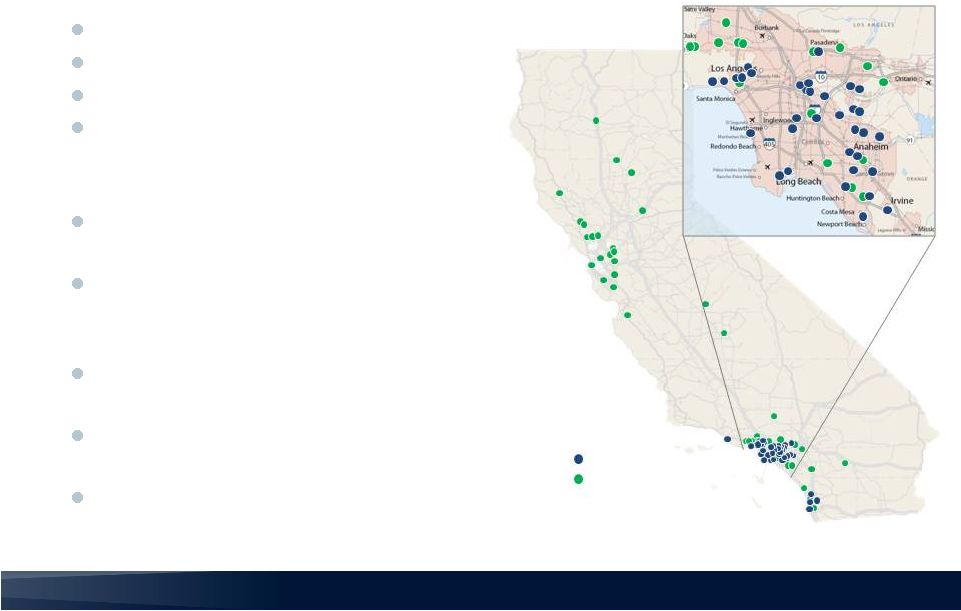
Company Overview
Largest bank based in Orange County, CA
Common Stock: BANC (NYSE)
Preferred Stock: BANC PRC (NYSE)
Senior Debt: BOCA (NYSE)
Franchise
$6 billion in assets and over $5 billion in
annual loan originations
100+ banking locations
(1)
, including 40
branches in Los Angeles, Orange and San
Diego counties
9th largest public independent California
bank; largest Orange County based bank
15
largest
deposit
franchise
in
Los
Angeles
MSA
(2)
Investment Advisor subsidiary with $4.6
billion in AUA
(3)
managing over 22,000
individual loans
1)
Including locations in California, Oregon, Arizona, Virginia, Indiana, Maryland, Colorado,
Idaho, and Nevada 2)
FDIC SOD Report. Data as of 6/30/14 (combined BANC and Banco Popular CA
branches). 3) Assets under advisement as measured by total UPB
(Data as of 12/31/14 unless noted)
Branches
Loan Offices
th |
 3
3
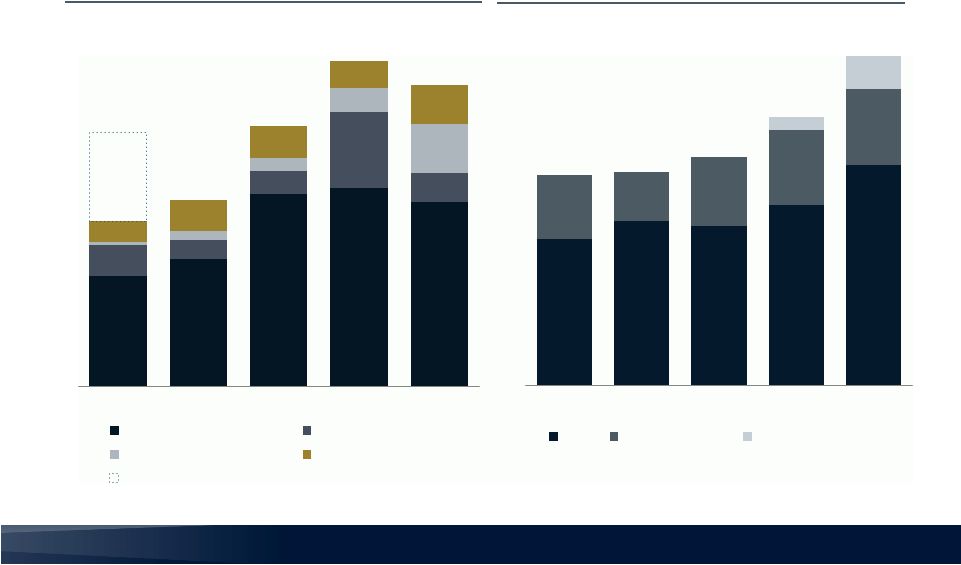
Banc of California has been successful in growing its asset base
both organically as
well as through opportunistic acquisitions since its recap in November 2010
Gateway Bancorp and Beach Business Bank, 2012
The Private Bank of California, CS Financial, and The Palisades Group, 2013
Renovation Ready and Popular Community Bank branches, 2014
All acquisitions successfully integrated into single technology platform
Consistent and disciplined asset growth since 2010
averaging approximately $1 billion annually
with
strong credit metrics
Building California’s Bank
Total Assets
($ in millions)
2010
2011
2012
2013
2014
$900
$900
$900
$800
$900
$900
$1,000
$1,100 $1,100
$1,700
$1,700
$2,100
$2,500
$3,700
$3,600
$4,000
$4,400
$4,500
$6,000
Q2
Q3
Q4
Q1
Q2
Q3
Q4
Q1
Q2
Q3
Q4
Q1
Q2
Q3
Q4
Q1
Q2
Q3
Q4 |
 4
4
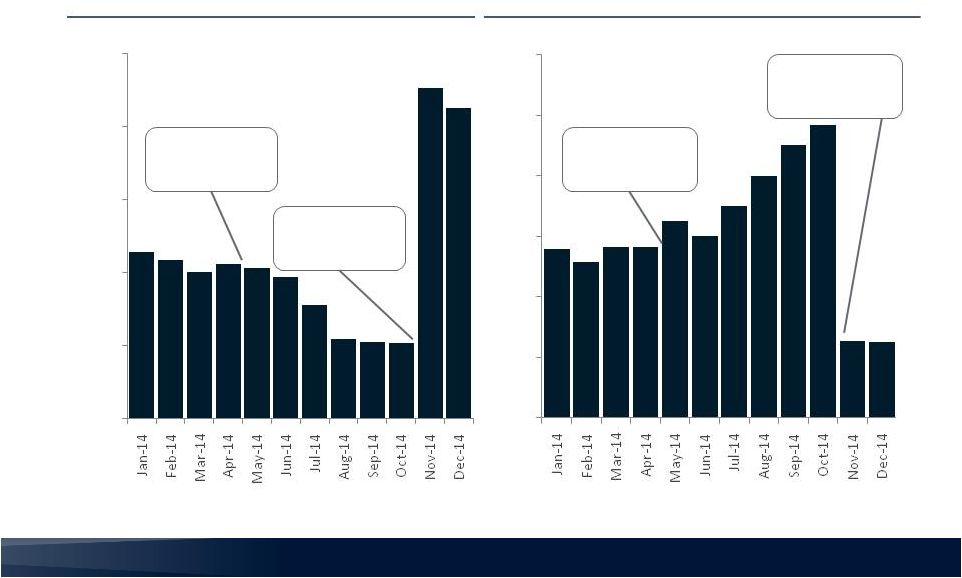
Operating Platform Built To Scale
FY 2014 All in Productivity
Annualized Salary Cost per Account
BPOP
Acquisition
Announced
BPOP
Acquisition
Closed
BPOP
Acquisition
Announced
BPOP
Acquisition
Closed
0
250
500
750
1,000
1,250
0
50
100
150
200
250
300 |
 5
5
i.
building the top full-service bank
serving California’s diverse private
businesses, entrepreneurs, and
homeowners,
and
ii.
investing in and growing
complementary businesses that
enhance shareholder value and serve
as a source of strength to the bank.
Banc of California
is committed to
Our Mission
5 |
 6
Private Business
C&I Lending, Lines of Credit, ABL Facilities,
Owner Occupied CRE, SBA Lending, Equipment Finance,
Specialties, Acquisition Financing,
ESOP Financing
Entrepreneurs and Family Offices
Lines of Credit, Investor CRE, Multi-Family, Acquisition
Financing, C&I Lending, SBLOC and IBLOC
Homeowners
Mortgages, Rehabilitation / Construction Lending,
HELOCs
Full-Service Lending Platform
6 |
 7
7
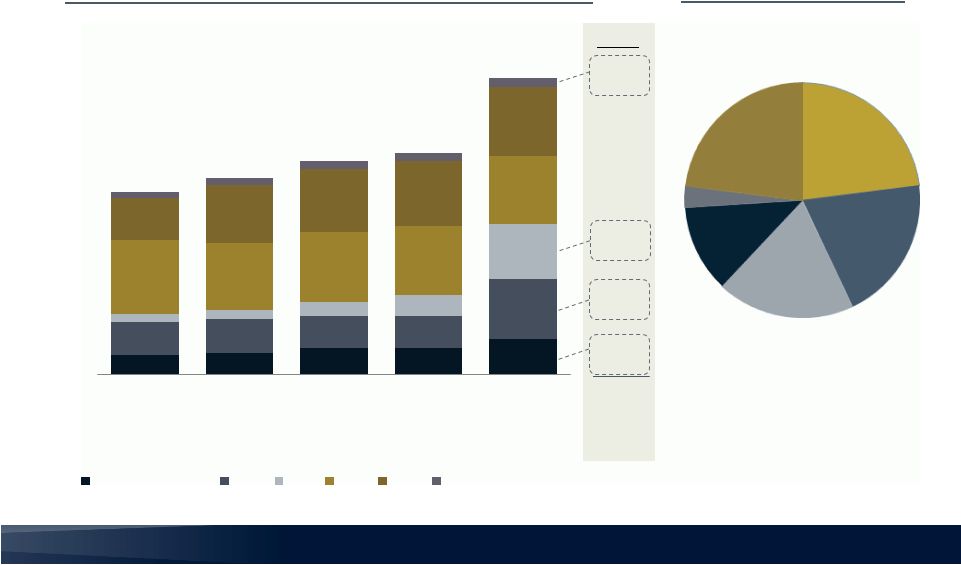
Loans Portfolio
* C&I includes C&I, SBA and Leasing; CRE includes CRE and Construction.
$5.1 billion
Average Loan Yield: 4.60%
Total Loans
Total Loans (HFS / HFI)
$480
$497
$54
$23
BPOP
4.60%
4.62%
4.75%
5.12%
5.18%
Average
Loan Yield:
$1,054
$347
$374
$455
$464
$613
$555
$586
$567
$548
$1,042
$142
$155
$234
$367
$956
$1,287
$1,159
$1,213
$1,191
$1,172
$717
$1,000
$1,096
$1,127
$1,187
$116
$123
$134
$142
$167
$3,163
$3,397
$3,698
$3,839
$5,136
4Q 2013
1Q 2014
2Q 2014
3Q 2014
4Q 2014
C&I/SBA/Leasing
CRE
MF
SFR
HFS
Other Consumer
SFR
23%
CRE
20%
MF
19%
C&I
12%
Other
3%
HFS
23%
($ in millions) |
 8
8
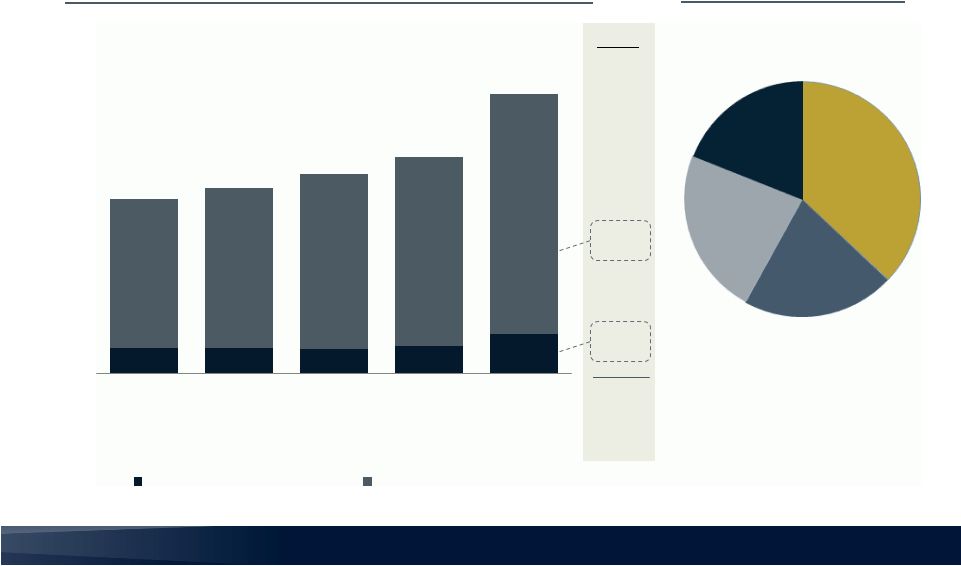
BPOP
Deposits Franchise
$2.9
$3.1
$3.3
$3.6
$4.7
Total Deposits
($ in billions)
0.60%
0.70%
0.74%
0.77%
0.77%
Cost of
Deposits:
Total Deposits
$.9
$.15
$4.7 billion
Cost of Deposits: 0.60%
$1.05
DDA/NOW
37%
Savings
21%
Money
Market
23%
Time
Deposits
19%
$0.43
$0.43
$0.41
$0.46
$0.66
$2.49
$2.68
$2.94
$3.17
$4.01
4Q 2013
1Q 2014
2Q 2014
3Q 2014
4Q 2014
Noninterest-bearing Deposits
Interest-bearing Deposits |
 9
9
Net Interest Income
Net Interest Income
($ in millions)
Cost of Deposits
Loan Yields
Consolidated Net Interest Margin*
* Includes debt interest expense at Holding Company
$33.3
$35.2
$35.6
$38.2
$46.3
4Q 2013
1Q 2014
2Q 2014
3Q 2014
4Q 2014
5.18%
5.12%
4.75%
4.62%
4.60%
4Q 2013
1Q 2014
2Q 2014
3Q 2014
4Q 2014
3.90%
4.00%
3.70%
3.58%
3.65%
4Q 2013
1Q 2014
2Q 2014
3Q 2014
4Q 2014
0.77%
0.77%
0.74%
0.70%
0.60%
4Q 2013
1Q 2014
2Q 2014
3Q 2014
4Q 2014 |
 10
10
Noninterest Income and Expenses
Noninterest Income
($ in millions)
Noninterest Expense
($ in millions)
$57.8
$60.5
$57.2
1
$67.6
$78.4
* Excludes $12.1 million in non-interest income from non-recurring branch sale
$15.0
$17.3
$26.1
$26.9
$25.0
$4.2
$2.6
$3.0
$10.3
$3.9
$0.4
$1.1
$1.8
$3.3
$6.7
$2.8
$4.2
$4.4
$3.6
$5.2
22.4*
$25.3
$35.4
$44.1
$40.9
4Q 2013
1Q 2014
2Q 2014
3Q 2014
4Q 2014
Mortgage Banking
Gain on Sale of Loans
Advisory Service Fees
All Other
Branch Sale*
$46.0
$49.1
$48.2
$52.0
$59.0
$11.3
$8.7
$12.3
$13.2
$13.5
$2.4
$5.9
4Q 2013
1Q 2014
2Q 2014
3Q 2014
4Q 2014
Base
Volume-Related
Acquisition/Non-core |
 11
11
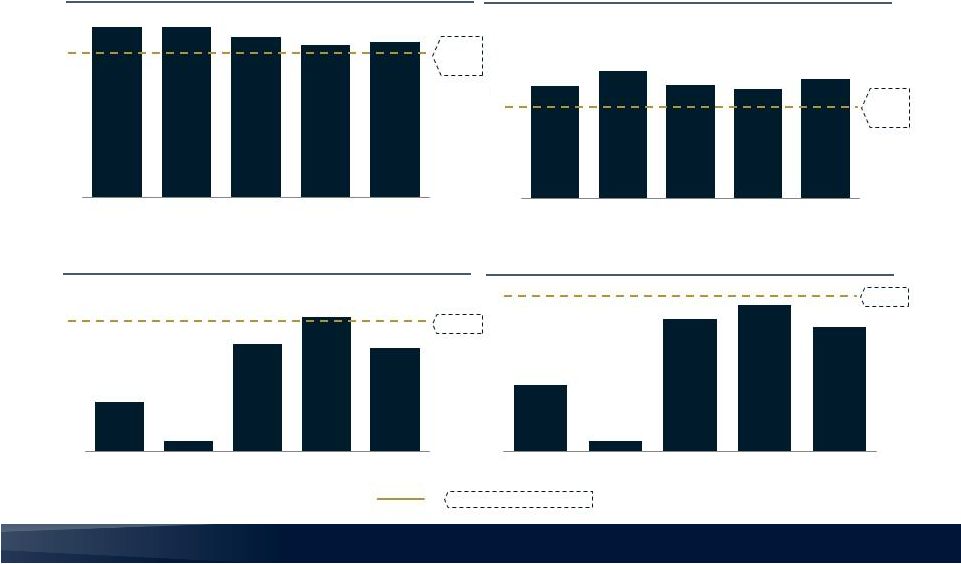
Financial Performance
1 Net Interest Margin shown for Banc of California, N.A. subsidiary. Excludes Holding Company
debt interest expense. Net Interest Margin
1
ROATCE
Efficiency Ratio
ROAA
YE 2015 Run Rate Targets
70 –
75%
3.75 –
4.00%
1.0%
15%
4.05%
4.19%
3.88%
3.78%
3.82%
4Q 2013
1Q 2014
2Q 2014
3Q 2014
4Q 2014
84%
96%
85%
82%
90%
4Q 2013
1Q 2014
2Q 2014
3Q 2014
4Q 2014
6.0%
0.9%
12.0%
13.2%
11.2%
4Q 2013
1Q 2014
2Q 2014
3Q 2014
4Q 2014
0.4%
0.1%
0.8%
1.0%
0.8%
4Q 2013
1Q 2014
2Q 2014
3Q 2014
4Q 2014 |
 12
12
12
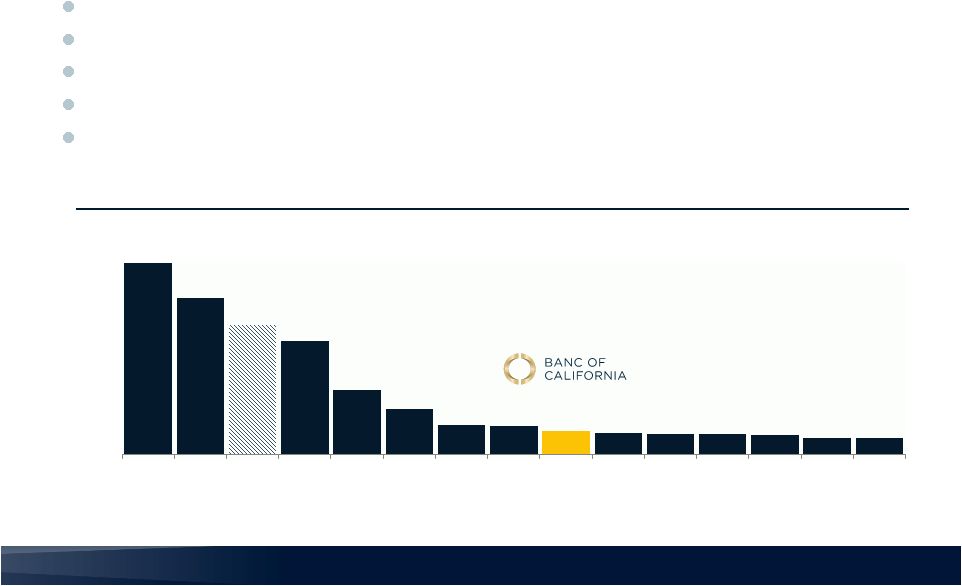
Top Public Independent Banks Headquartered in California by Assets
($ in billions)
BANC is the 9th largest public independent California bank
Proven ability to attract and grow low cost retail deposits
Proven ability to build a scalable and diverse commercial lending platform
Proven M&A capabilities
Compelling economic model with scalable platform
Source: SNL Financial. Financial data as 12/31/14.
A Top California Bank at an Attractive Entry Point
$48
$39
$33
$29
$16
$12
$7
$7
$6
$6
$5
$5
$5
$4
$4
$-
$10
$20
$30
$40
$50
FRC
SIVB
CYN
EWBC
PACW
CATY
CVBF
BBCN
BANC
FMBL
BOFI
OPB
WABC
HAFC
WIBC |