Attached files
| file | filename |
|---|---|
| 8-K - FORM 8-K - BANC OF CALIFORNIA, INC. | d885911d8k.htm |
| EX-99.1 - EX-99.1 - BANC OF CALIFORNIA, INC. | d885911dex991.htm |
 2014 Fourth
Quarter Earnings March 6, 2015
Investor Presentation
Exhibit 99.2 |
| 1
1
Forward-looking Statements
When used in this presentation and in documents filed with or furnished to the Securities and
Exchange Commission (the “SEC”), or other public shareholder communications,
or in oral statements made with the approval of an authorized executive officer, the words or phrases “believe,” “will,” “should,” “will likely
result,” “are expected to,” “will continue,” “is
anticipated,” “estimate,” “project,” “plans,” or similar expressions are intended to identify “forward-looking
statements” within the meaning of the Private Securities Litigation Reform Act of 1995.
You are cautioned not to place undue reliance on any forward-looking statements,
which speak only as of the date made. These statements may relate to future financial performance, strategic plans or objectives, revenue,
expense or earnings projections, or other financial items of Banc of California Inc. and its
affiliates (“BANC,” the “Company,” “we,” “us” or “our”). By their
nature, these statements are subject to numerous uncertainties that could cause actual results
to differ materially from those anticipated in the statements. Factors that could cause actual results to differ materially from the results anticipated or
projected include, but are not limited to, the following: (i) risks that the
Company’s recently completed acquisitions, including the acquisitions of branches from Banco Popular, The Private Bank of California, CS Financial, Inc.,
and The Palisades Group, may disrupt current plans and operations, the potential difficulties
in customer and employee retention as a result of those transactions and the amount of
the costs, fees, expenses and charges related to those transactions; (ii) the credit risks of lending activities, which may be
affected by further deterioration in real estate markets and the financial condition of
borrowers, may lead to increased loan and lease delinquencies, losses and nonperforming
assets in our loan portfolio, and may result in our allowance for loan and lease losses not being adequate to cover actual losses and
require us to materially increase our loan and lease loss reserves; (iii) the quality and
composition of our securities and loan portfolios; (iv) changes in general economic
conditions, either nationally or in our market areas; (v) continuation of the historically low short-term interest rate environment, changes in the
levels of general interest rates, and the relative differences between short- and
long-term interest rates, deposit interest rates, our net interest margin and
funding sources; (vi) fluctuations in the demand for loans and leases, the number of unsold
homes and other properties and fluctuations in commercial and residential real estate
values in our market area; (vii) results of examinations of us by regulatory authorities and the possibility that any such regulatory
authority may, among other things, require us to increase our allowance for loan and lease
losses, write-down asset values, increase our capital levels, or affect our ability
to borrow funds or maintain or increase deposits, which could adversely affect our liquidity and earnings; (viii) legislative or regulatory
changes that adversely affect our business, including changes in regulatory capital or other
rules; (ix) our ability to control operating costs and expenses; (x) staffing
fluctuations in response to product demand or the implementation of corporate strategies that affect our work force and potential associated charges;
(xi) errors in our estimates in determining fair value of certain of our assets, which may
result in significant declines in valuation; (xii) the network and computer systems on
which we depend could fail or experience a security breach; (xiii) our ability to attract and retain key members of our senior
management team; (xiv) costs and effects of litigation, including settlements and judgments;
(xv) increased competitive pressures among financial services companies; (xvi) changes
in consumer spending, borrowing and saving habits; (xvii) adverse changes in the securities markets; (xviii) earthquake, fire or other
natural disasters affecting the condition of real estate collateral; (xix) the availability of
resources to address changes in laws, rules or regulations or to respond to regulatory
actions; (xx) inability of key third-party providers to perform their obligations to us; (xxi) changes in accounting policies and practices, as
may be adopted by the financial institution regulatory agencies or the Financial Accounting
Standards Board or their application to our business or final audit adjustments,
including additional guidance and interpretation on accounting issues and details of the implementation of new accounting methods; (xxii) war
or terrorist activities; and (xxiii) other economic, competitive, governmental, regulatory,
and technological factors affecting our operations, pricing, products and services and
the other risks described in this report and from time to time in other documents that we file with or furnish to the SEC. You should not place
undue reliance on forward-looking statements, and we undertake no obligation to update any
such statements to reflect circumstances or events that occur after the date on which
the forward-looking statement is made. |
 2
2
Net Income
Net income available to common shareholders of $9.3 million, or $0.25 per diluted share
Return on average assets of 0.8% and return on average tangible common equity of 11.2%
2014 Fourth Quarter Accomplishments
Banco
Popular
Transaction
Completed the acquisition and conversion of the California footprint of Banco Popular with
$1.1 billion of loans and $1.1 billion of deposits
Transaction is immediately accretive to earnings
Approximately 97% of deposit balances retained as year-end 2014
Originations
& Loans
Originated
over
$1.3
billion
of
loans
during
the
fourth
quarter,
totaling
over
$5
billion
in
originations for the full year
Total assets of $6 billion as of year-end 2014 with loans over $5 billion
Dramatically
diversified
the
held
for
investment
loan
mix
to
66%
commercial
loans,
compared to 43% commercial loans as of year-end 2013
Capital
Raised $50 million of common stock through the direct private placement with Oaktree
and Patriot to support the Banco Popular transaction |
 3
3
Income Statement –
Quarterly
4Q 2014
3Q 2014
4Q 2013
Net Interest Income
$46.3
$38.2
$33.3
Noninterest Income
40.9
44.1
34.5
Total Revenue
87.2
82.3
67.8
Expenses
(78.4)
(67.6)
(57.2)
Pre-Tax, Pre-Provision Income
8.8
14.7
10.6
Provision
(4.2)
(2.8)
(1.8)
Pre-Tax Income
4.6
11.9
8.8
Tax Benefit (Expense)
5.5
(0.7)
(5.5)
Net Income
10.2
11.2
3.3
Preferred Dividends
(0.9)
(0.9)
(1.0)
Net Income Available to Common
$9.3
$10.3
$2.4
Diluted Earnings Per Share
$0.25
$0.30
$0.12
ROAA
0.8%
1.0%
0.4%
ROATCE
11.2%
13.2%
5.9%
Average shares outstanding for diluted EPS
calculation
(1)
35.4
32.7
19.6
($ in millions except per share data)
*
Figures may not foot due to rounding.
1 Average shares outstanding include potential TEU conversions to common shares (in
millions). |
 4
4
Income Statement –
Full Year
FY 2014
FY 2013
Net Interest Income
$155.3
$97.2
Noninterest Income
145.6
96.7
Total Revenue
300.9
194.0
Expenses
(264.2)
(178.7)
Pre-Tax, Pre-Provision Income
36.7
15.3
Provision
(11.0)
(8.0)
Pre-Tax Income
25.8
7.3
Tax Benefit (Expense)
4.5
(7.3)
Net Income
30.3
0.1
Preferred Dividends
(3.6)
(2.2)
Net Income Available to Common
$26.7
$(2.1)
Diluted Earnings Per Share
$0.91
$(0.14)
ROAA
0.7%
n/m
ROATCE
10.1%
n/m
($ in millions except per share data) |
 5
5
Net Interest Income and Net Interest Margin
Net
Interest
Income
($
in
millions)
Cost of Deposits
Loan Yields
Net Interest Margin
Popular acquisition contributed approximately $7
million to Q4 net interest income
Downward pressure on loan yields persists, partially
offset by acquired Popular assets
Consolidated net interest margin expanded due to
both Popular acquisition and deposit repricing
Both the addition of Popular and repricing of existing
deposits contributed to the favorable drop
0.77%
0.77%
0.74%
0.70%
0.60%
4Q 2013
1Q 2014
2Q 2014
3Q 2014
4Q 2014
5.18%
5.12%
4.75%
4.62%
4.60%
4Q 2013
1Q 2014
2Q 2014
3Q 2014
4Q 2014
3.90%
4.00%
3.70%
3.58%
3.65%
4Q 2013
1Q 2014
2Q 2014
3Q 2014
4Q 2014
$33.3
$35.2
$35.6
$38.2
$46.3
4Q 2013
1Q 2014
2Q 2014
3Q 2014
4Q 2014 |
 6
6
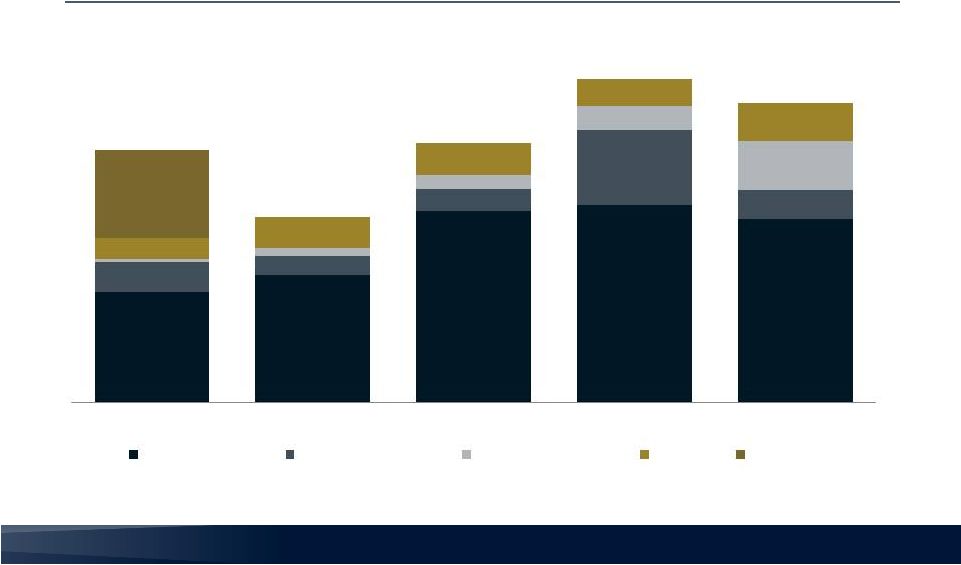
Noninterest Income
Noninterest Income
($ in millions)
$15.0
$17.3
$26.1
$26.9
$25.0
$4.2
$2.6
$3.0
$10.3
$3.9
$0.4
$1.1
$1.8
$3.3
$6.7
$2.8
$4.2
$4.4
$3.6
$5.2
$12.1
$34.5
$25.3
$35.4
$44.1
$40.9
4Q 2013
1Q 2014
2Q 2014
3Q 2014
4Q 2014
Mortgage Banking
Gain on Sale of Loans
Advisory Service Fees
All Other
Branch Sale |
 7
7
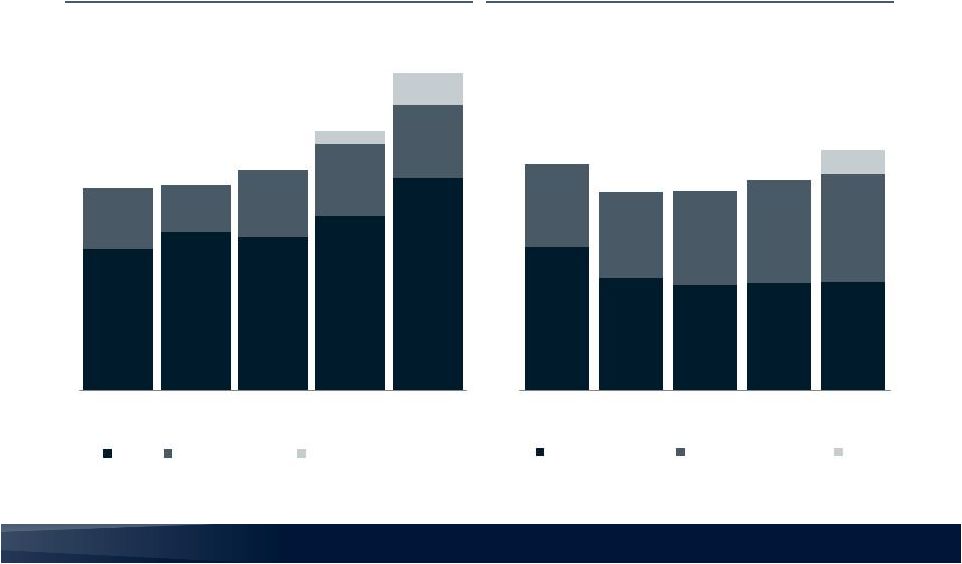
Noninterest Expense
($ in millions)
Number of Employees
(Headcount)
Noninterest Expenses
$57.8
$60.5
$57.2
1
$67.6
1 Includes mortgage-related commissions, bonus and loan-related
expenses. 2 Acquired employees from BPOP; retail branches,
business banking, commercial real estate, and operations. $78.4
2
$46.0
$49.1
$48.2
$52.0
$59.0
$11.3
$8.7
$12.3
$13.2
$13.5
$2.4
$5.9
4Q 2013
1Q 2014
2Q 2014
3Q 2014
4Q 2014
Base
Volume-Related
Acquisition/Non-core
878
690
647
658
662
506
527
573
634
664
4Q 2013
1Q 2014
2Q 2014
3Q 2014
4Q 2014
Banc Home Loans
Bank / TPG / HoldCo
BPOP
149
1,384
1,217
1,220
1,292
1,475 |
 8
8
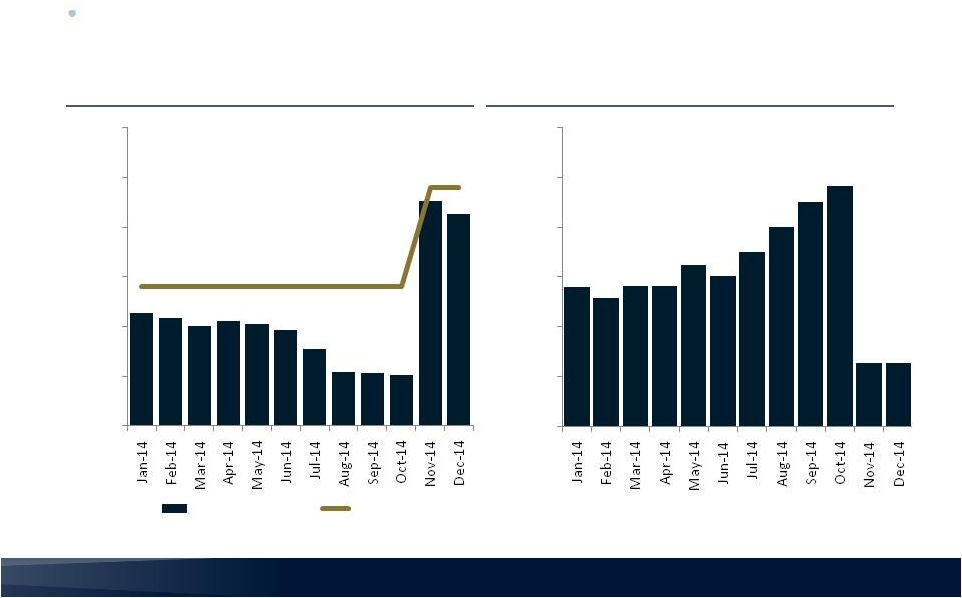
Efficiencies in Deposit Operations
FY 2014 All in Productivity
Annualized Salary Cost per Account
Popular
acquisition
added
scale
and
enhanced
productivity
within
deposit
operations
group
-
250
500
750
1,000
1,250
1,500
All In Productivity
Target
$
$50
$100
$150
$200
$250
$300
- |
 9
9
Balance Sheet
4Q 2014
3Q 2014
4Q 2013
Cash and All Deposits in Financial Institutions
$233
$187
$112
Securities
346
310
170
Loans Held for Sale
1,187
1,127
717
Loans Held for Investment
3,949
2,712
2,446
ALLL
(29)
(25)
(19)
All Other Assets
286
227
202
Total Assets
$5,972
$4,538
$3,628
Deposits
$4,672
$3,632
$2,919
FHLB Advances / Fed Funds Purchased
633
305
250
Notes Payable
94
96
82
All Other Liabilities
70
59
52
Total Liabilities
5,468
4,091
3,303
Equity
504
447
325
Total Liabilities and Equity
$5,972
$4,538
$3,628
($ in millions, period ending balances)
* Figures may not foot due to rounding. |
 10
10
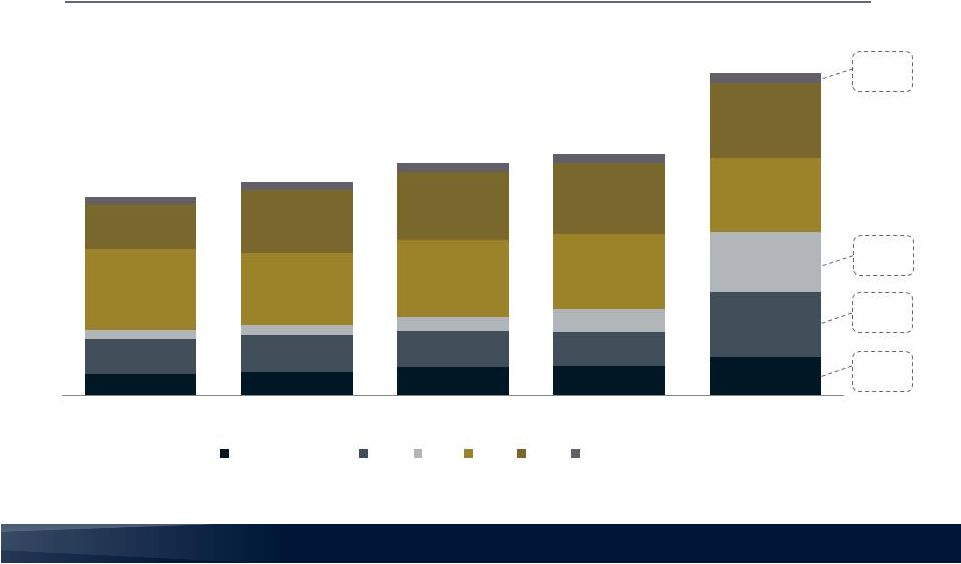
Loan Portfolio
* All Balances Period-End.
Total Loans (HFS/HFI)
($ in millions)
$480
BPOP
$497
BPOP
$54
BPOP
$23
BPOP
$347
$374
$455
$464
$613
$555
$586
$567
$548
$1,042
$142
$155
$234
$367
$956
$1,287
$1,159
$1,213
$1,191
$1,172
$717
$1,000
$1,096
$1,127
$1,187
$116
$123
$134
$142
$167
$3,163
$3,397
$3,698
$3,839
$5,136
4Q 2013
1Q 2014
2Q 2014
3Q 2014
4Q 2014
C&I/SBA/Leasing
CRE
MF
SFR
HFS
Other Consumer |
 11
11
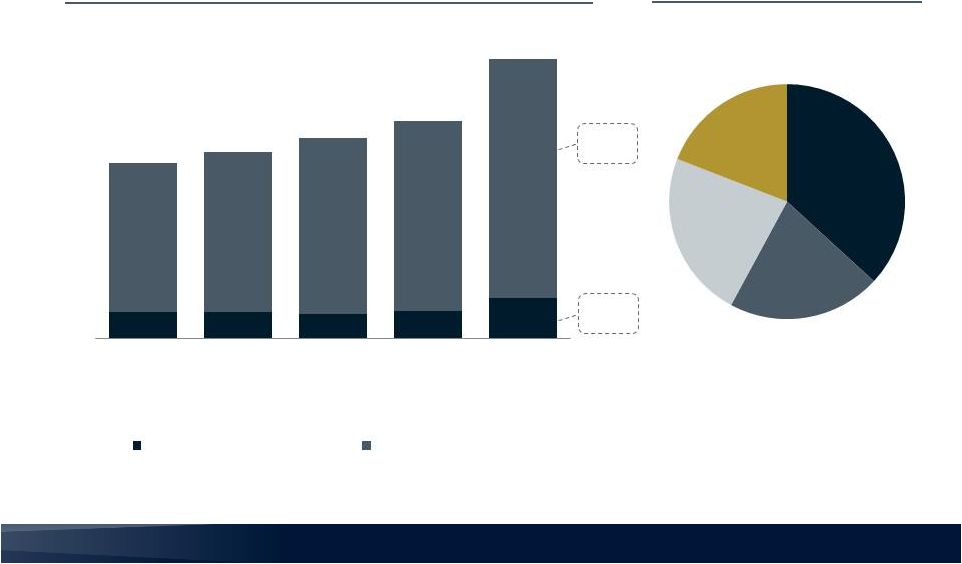
Deposit Portfolio
$2.9
$3.1
$3.3
$3.6
* All Balances December 31, 2014 Period-End.
$4.7
Total Deposits
($ in billions)
Deposit Mix
(12/31/14 period end balance)
0.60%
0.70%
0.74%
0.77%
0.77%
Cost of
Deposits:
$.15
BPOP
$.9
BPOP
DDA /
NOW
37%
Savings
21%
MMDA
23%
CDs
19%
$0.43
$0.43
$0.41
$0.46
$0.66
$2.49
$2.68
$2.94
$3.17
$4.01
4Q 2013
1Q 2014
2Q 2014
3Q 2014
4Q 2014
Noninterest-bearing Deposits
Interest-bearing Deposits |
 12
12
Capital Position
4Q 2013
1Q 2014
2Q 2014
3Q 2014
4Q 2014
Banc of California, Inc.
Tangible common equity to tangible assets
5.7%
5.1%
7.3%
7.2%
6.2%
Tier 1 leverage ratio
8.0%
7.6%
9.9%
9.3%
8.6%
Tangible book value per share
$10.06
$9.94
$11.45
$11.34
$10.54
Tangible book value per share, adjusted
1
$10.06
$9.94
$9.66
$9.89
$9.65
Banc of California, N.A.
Tier 1 leverage ratio
9.6%
9.4%
9.7%
9.8%
9.2%
Tier 1 risk based capital ratio
13.6%
13.5%
13.8%
14.8%
11.3%
Total risk based capital ratio
14.7%
14.5%
14.9%
15.8%
12.0%
1
Tangible equity per common stock and shares issuable under purchase contracts. Represents the
effect on TBV/share including conversion of TEUs to common shares
|
 13
13
4Q 2013
1Q 2014
2Q 2014
3Q 2014
4Q 2014
Total Loans (HFI + HFS)
$3.2 bln
$3.4 bln
$3.7 bln
$3.8 bln
$5.1 bln
Delinquent non-PCI loans to total non-PCI loans
2.43%
2.21%
2.69%
2.08%
1.55%
Non-performing Loans, excluding PCI loans
$31.6
$32.4
$41.6
$38.3
$38.4
NPLs / Loans (HFI)
1.29%
1.35%
1.60%
1.41%
0.97%
NPAs / Assets
0.87%
0.81%
0.96%
0.86%
0.65%
NPAs / Equity
9.7%
10.0%
9.6%
8.7%
7.7%
Net Charge Offs (recoveries)
$0.7
$(0.2)
$(0.3)
$0.2
n/m
Provision for Loan Losses
$1.8
$1.9
$2.1
$2.8
$4.2
ALLL ($)
$18.8
$20.0
$22.6
$25.3
$29.5
ALLL to Originated Loans
1.45%
1.43%
1.34%
1.33%
1.38%
ALLL & Discount / Loans
6.99%
6.32%
5.65%
4.45%
3.34%
ALLL / NPLs
59%
62%
54%
66%
77%
Asset Quality
($ in millions unless otherwise noted) |
 14
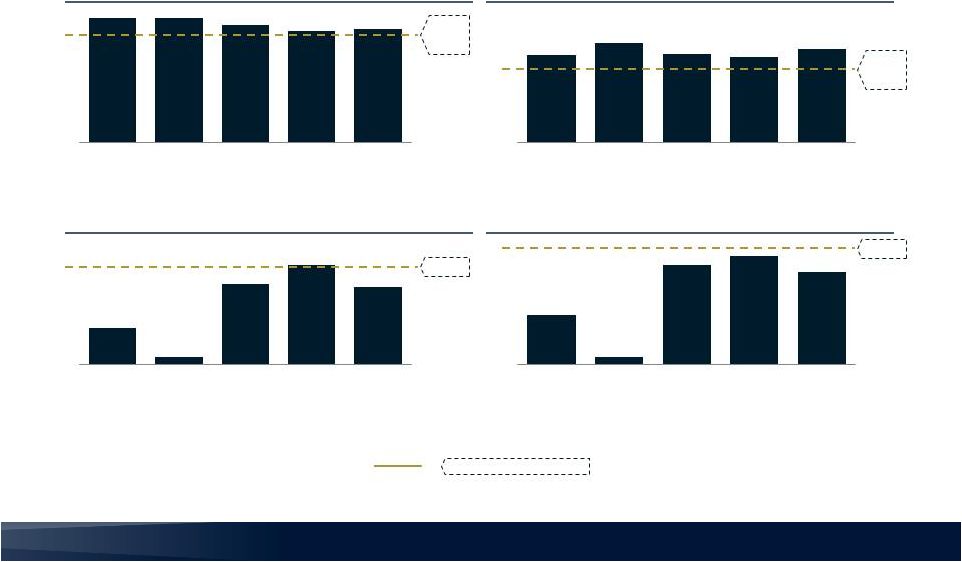
14
1%
3.75 –
4.00%
Financial Performance
15%
70 –
75%
1 Net Interest Margin shown for Banc of California, N.A. subsidiary. Excludes Holding Company
debt interest expense. Stated YE 2015 Targets
ROAA
ROATCE
Net Interest Margin
1
Efficiency Ratio
0.4%
0.1%
0.8%
1.0%
0.8%
4Q 2013
1Q 2014
2Q 2014
3Q 2014
4Q 2014
6.0%
0.9%
12.0%
13.2%
11.2%
4Q 2013
1Q 2014
2Q 2014
3Q 2014
4Q 2014
84%
96%
85%
82%
90%
4Q 2013
1Q 2014
2Q 2014
3Q 2014
4Q 2014
4.05%
4.19%
3.88%
3.78%
3.82%
4Q 2013
1Q 2014
2Q 2014
3Q 2014
4Q 2014 |