Attached files
| file | filename |
|---|---|
| 8-K - 8-K - ABERCROMBIE & FITCH CO /DE/ | q42014er8k.htm |
| EX-99.1 - EXHIBIT 99.1 - ABERCROMBIE & FITCH CO /DE/ | q42014earningsrelease.htm |
| EX-99.3 - EXHIBIT 99.3 - ABERCROMBIE & FITCH CO /DE/ | anftranscript20150304.htm |
| EX-99.2 - EXHIBIT 99.2 - ABERCROMBIE & FITCH CO /DE/ | q42014quarterlyhistory.htm |

INVESTOR PRESENTATION 2014 FOURTH QUARTER

SAFE HARBOR STATEMENT UNDER THE PRIVATE SECURITIES LITIGATION REFORM ACT OF 1995 A&F cautions that any forward-looking statements (as such term is defined in the Private Securities Litigation Reform Act of 1995) contained in this presentation or made by management or spokespeople of A&F involve risks and uncertainties and are subject to change based on various important factors, many of which may be beyond the Company's control. Words such as "estimate," "project," "plan," "believe," "expect," "anticipate," "intend," and similar expressions may identify forward-looking statements. Except as may be required by applicable law, we assume no obligation to publicly update or revise our forward-looking statements. The factors included in the disclosure under the heading "FORWARD-LOOKING STATEMENTS AND RISK FACTORS" in "ITEM 1A. RISK FACTORS" of A&F's Annual Report on Form 10-K for the fiscal year ended February 1, 2014, in some cases have affected and in the future could affect the Company's financial performance and could cause actual results for the 2015 Fiscal year and beyond to differ materially from those expressed or implied in any of the forward-looking statements included in this presentation or otherwise made by management. OTHER INFORMATION All dollar and share amounts are in 000’s unless otherwise stated. Sub-totals and totals may not foot due to rounding. 2

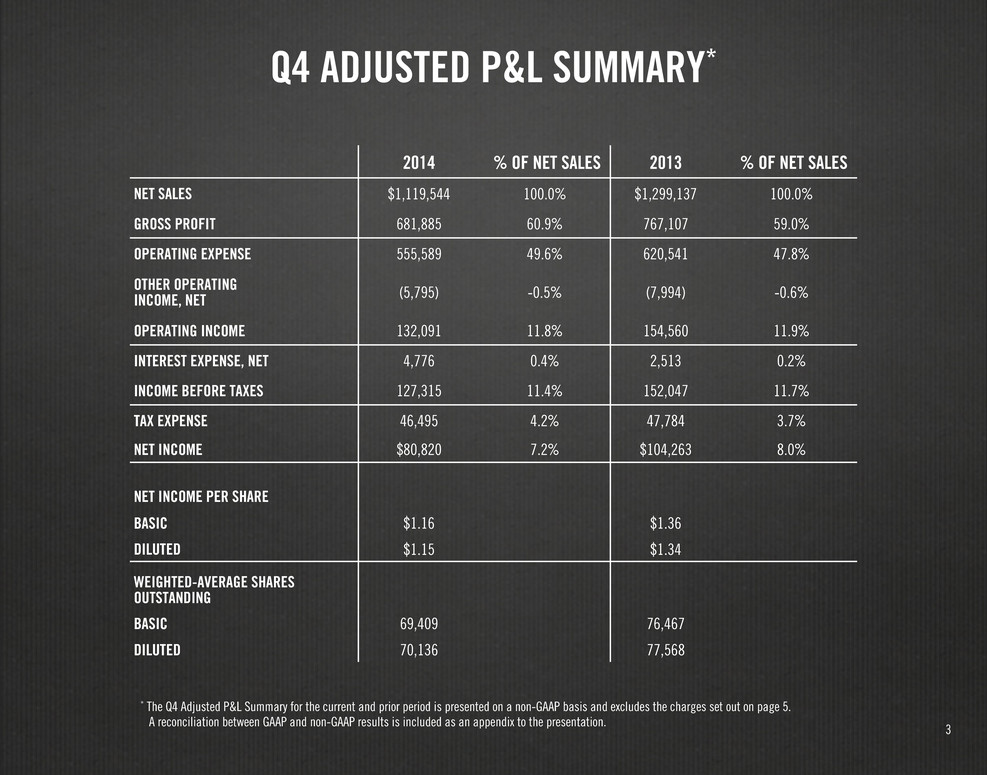
Q4 ADJUSTED P&L SUMMARY* * The Q4 Adjusted P&L Summary for the current and prior period is presented on a non-GAAP basis and excludes the charges set out on page 5. A reconciliation between GAAP and non-GAAP results is included as an appendix to the presentation. 2014 % OF NET SALES 2013 % OF NET SALES NET SALES $1,119,544 100.0% $1,299,137 100.0% GROSS PROFIT 681,885 60.9% 767,107 59.0% OPERATING EXPENSE 555,589 49.6% 620,541 47.8% OTHER OPERATING INCOME, NET (5,795) -0.5% (7,994) -0.6% OPERATING INCOME 132,091 11.8% 154,560 11.9% INTEREST EXPENSE, NET 4,776 0.4% 2,513 0.2% INCOME BEFORE TAXES 127,315 11.4% 152,047 11.7% TAX EXPENSE 46,495 4.2% 47,784 3.7% NET INCOME $80,820 7.2% $104,263 8.0% NET INCOME PER SHARE BASIC $1.16 $1.36 DILUTED $1.15 $1.34 WEIGHTED-AVERAGE SHARES OUTSTANDING BASIC 69,409 76,467 DILUTED 70,136 77,568 3

FULL YEAR ADJUSTED P&L SUMMARY* * The Full Year Adjusted P&L Summary for the current and prior period is presented on a non-GAAP basis and excludes the charges set out on page 5. A reconciliation between GAAP and non-GAAP results is included as an appendix to the presentation. 2014 % OF NET SALES 2013 % OF NET SALES NET SALES $3,744,030 100.0% $4,116,897 100.0% GROSS PROFIT 2,313,570 61.8% 2,575,435 62.6% OPERATING EXPENSE 2,137,116 57.1% 2,375,632 57.7% OTHER OPERATING INCOME, NET (15,239) -0.4% (23,074) -0.6% OPERATING INCOME 191,693 5.1% 222,877 5.4% INTEREST EXPENSE, NET 14,365 0.4% 7,546 0.2% INCOME BEFORE TAXES 177,328 4.7% 215,331 5.2% TAX EXPENSE 65,019 1.7% 64,712 1.6% NET INCOME $112,309 3.0% $150,619 3.7% NET INCOME PER SHARE BASIC $1.56 $1.95 DILUTED $1.54 $1.91 WEIGHTED-AVERAGE SHARES OUTSTANDING BASIC 71,785 77,157 DILUTED 72,937 78,666 4

EXCLUDED CHARGES (PRE-TAX) 2014 Q1 Q2 Q3 Q4 FULL YEAR ASSET IMPAIRMENT, LEASE TERMINATION AND STORE CLOSURE CHARGES — — $18,958 $31,641 $50,599 PROFIT IMPROVEMENT INITIATIVE AND CORPORATE GOVERANCE 9,964 1,964 1,310 718 13,956 GILLY HICKS RESTRUCTURING CHARGES 5,633 419 — 2,378 8,431 CEO TRANSITION COSTS — — — 5,188 5,188 TOTAL $15,597 $2,383 $20,268 $39,925 $78,174 2013 Q1 Q2 Q3 Q4 FULL YEAR ASSET IMPAIRMENT, LEASE TERMINATION AND STORE CLOSURE CHARGES — — $43,571 $3,144 $46,715 PROFIT IMPROVEMENT INITIATIVE AND CORPORATE GOVERANCE — 2,575 7,590 3,674 13,839 GILLY HICKS RESTRUCTURING CHARGES — — 44,708 36,792 81,500 TOTAL — $2,575 $95,869 $43,610 $142,054 5

* Comparable store sales are calculated on a constant currency basis and exclude Gilly Hicks. Sales mix includes store and DTC sales. COMPARABLE SALES* Q4 SALES MIX Q4 TOTAL COMPANY -10% GEOGRAPHIC: US -6% INTERNATIONAL -17% BRAND: ABERCROMBIE & FITCH -9% abercrombie kids -6% HOLLISTER CO. -11% INTERNATIONAL 31.8% U.S. 68.2% 6 YTD TOTAL COMPANY -8% GEOGRAPHIC: US -6% INTERNATIONAL -12% BRAND: ABERCROMBIE & FITCH -4% abercrombie kids -7% HOLLISTER CO. -10% YTD SALES MIX INTERNATIONAL 35.7% U.S. 64.3%

Q4 ADJUSTED OPERATING EXPENSE* * Q4 adjusted operating expense excludes the charges set out on page 5. A reconciliation between GAAP and non-GAAP results is included as an appendix to the presentation. (1) Includes rent, other landlord charges, utilities, depreciation and other occupancy expense. (2) Includes selling payroll, store management and support, other store expense, direct-to-consumer expense, and distribution center costs. (3) Rounded based on reported percentages. Q4 2014 % OF NET SALES Q4 2013 % OF NET SALES Δ bps (3) STORE OCCUPANCY (1) $185,012 16.5% $192,533 14.8% 170 ALL OTHER (2) 256,647 22.9% 312,582 24.1% (120) STORES AND DISTRIBUTION 441,659 39.4% 505,115 38.9% 50 MARKETING, GENERAL & ADMINISTRATIVE 113,930 10.2% 115,426 8.9% 130 TOTAL $555,589 49.6% $620,541 47.8% 180 7

Q4 ADJUSTED P&L ANALYSIS* * Q4 adjusted operating income excludes the charges set out on page 5. A reconciliation between GAAP and non-GAAP results is included as an appendix to the presentation. (1) Operating Income for U.S. Stores and International Stores is reported on an aggregate four-wall basis, and excludes pre-opening costs. Also includes third party sell-off of excess merchandise. (2) Store Pre-Opening Costs include pre-opening rent, payroll, travel and other expenses. (3) All Other includes Store Management & Support, DC and Other Expenses, net of Other Income. SALES 2014 OPERATING INCOME SALES 2013 OPERATING INCOME U.S. STORES (1) $554,475 $107,886 $646,105 $104,420 19.5% 16.2% INTERNATIONAL STORES (1) 263,962 73,250 337,700 92,300 27.8% 27.3% DIRECT TO CONSUMER 301,107 99,326 315,332 118,158 33.0% 37.5% MARKETING, GENERAL & ADMINISTRATIVE EXPENSES - (113,930) - (115,426) STORE PRE-OPENING COSTS (2) - (1,959) - (4,738) ALL OTHER, NET (3) - (32,482) - (40,154) TOTAL $1,119,544 $132,091 $1,299,137 $154,560 8

SHARE REPURCHASES FY 2014 FY 2013 SHARES REPURCHASED COST AVERAGE COST SHARES REPURCHASED COST AVERAGE COST FIRST QUARTER 3,825.7 $150,000 $39.21 349.7 $16,305 $46.63 SECOND QUARTER 1,459.4 $60,000 $41.11 2,033.0 $99,501 $48.94 THIRD QUARTER 2,039.0 $75,038 $36.80 — — — FOURTH QUARTER — — — — — — TOTAL 7,324.1 $285,038 $38.92 2,382.7 $115,806 $48.60 9

Q4 STORE OPENINGS BRAND CENTER CITY DATE Hollister Yas Mall Abu Dhabi, UAE 11/19/2014 A&F Gotemba Premium Outlet Shizuoka, Japan 11/22/2014 A&F Westgate Outlets Glendale, AZ 11/26/2014 Hollister Lalaport Koshein Hyogo, Japan 12/6/2014 A&F Kingston Collection Outlet Kingston, MA 12/6/2014 Hollister Taikoo Li Chengdu Chengdu, China 12/13/2014 Hollister Seattle Premium Outlets Tulalip, WA 12/13/2014 A&F The Avenues Kuwait City, Kuwait 12/23/2014 10

Q4 STORE COUNT ACTIVITY * Includes Asia, Australia and the Middle East. ALL BRANDS TOTAL U.S. CANADA EUROPE REST OF WORLD* START OF Q4 2014 1,000 834 18 122 26 OPENINGS 8 3 — — 5 CLOSINGS (39) (38) — (1) — END OF Q4 2014 969 799 18 121 31 A&F START OF Q4 2014 282 255 4 16 7 OPENINGS 4 2 — — 2 CLOSINGS (7) (7) — — — END OF Q4 2014 279 250 4 16 9 abercrombie kids START OF Q4 2014 133 127 2 4 — OPENINGS — — — — — CLOSINGS (11) (11) — — — END OF Q4 2014 122 116 2 4 — HOLLISTER CO. START OF Q4 2014 585 452 12 102 19 OPENINGS 4 1 — — 3 CLOSINGS (21) (20) — (1) — END OF Q4 2014 568 433 12 101 22 11

APPENDIX: RECONCILIATION OF Q4 2014 NON-GAAP FINANCIAL MEASURES GAAP EXCLUDED CHARGES (1) ADJUSTED NON-GAAP (2) STORES AND DISTRIBUTION EXPENSE $445,629 $3,970 $441,659 MARKETING, GENERAL AND ADMINISTRATIVE EXPENSE 119,225 5,295 113,930 RESTRUCTURING CHARGES 2,378 2,378 — ASSET IMPAIRMENT 28,282 28,282 — INCOME BEFORE TAXES 87,390 39,925 127,315 TAX EXPENSE 43,002 3,493 46,495 NET INCOME $44,388 $36,432 $80,820 NET INCOME PER DILUTED SHARE $0.63 $0.52 $1.15 (1) Excluded charges consist of pre-tax charges of $17.0 million related to the impairment of store assets whose carrying value exceeded fair value, primarily associated with 4 Abercrombie & Fitch stores, 4 abercrombie kids stores and 9 Hollister stores, $11.3 million related to the write down of a Company owned aircraft to estimated net sales value, $3.4 million related to lease termination and store closure charges, primarily associated with two Hollister stores in Australia, $5.2 million related to CEO transition costs, $2.4 million related to the restructuring of the Gilly Hicks brand, and $0.7 million related to the Company's profit improvement initiative and certain governance matters. (2) Non-GAAP financial measures should not be used as alternatives to GAAP net income and net income per diluted share and are also not intended to supersede or replace the Company's GAAP financial measures. The Company believes it is useful to investors to provide the non-GAAP financial measures to assess the Company's operating performance. THIRTEEN WEEKS ENDED JANUARY 31, 2015 (IN THOUSANDS, EXCEPT PER SHARE DATA) (UNAUDITED) 12

APPENDIX: RECONCILIATION OF FULL YEAR NON-GAAP FINANCIAL MEASURES (1) Excluded charges consist of pre-tax charges of $33.7 million related to the impairment of store assets whose carrying value exceeded fair value, primarily associated with 7 Abercrombie & Fitch stores, 27 abercrombie kids stores and 17 Hollister stores, $11.3 million related to the write down of a Company owned aircraft to estimated net sales value, $8.4 million related to the restructuring of the Gilly Hicks brand, $7.5 million related to legal, advisory and other costs associated with certain corporate governance matters, $6.5 million related to the Company's profit improvement initiative, $5.6 million related to lease termination and store closure charges, and $5.2 million related to CEO transition costs. (2) Non-GAAP financial measures should not be used as alternatives to GAAP net income and net income per diluted share and are also not intended to supersede or replace the Company's GAAP financial measures. The Company believes it is useful to investors to provide the non-GAAP financial measures to assess the Company's operating performance. FIFTY-TWO WEEKS ENDED JANUARY 31, 2015 (IN THOUSANDS, EXCEPT PER SHARE DATA) (UNAUDITED) GAAP EXCLUDED CHARGES (1) ADJUSTED NON-GAAP (2) STORES AND DISTRIBUTION EXPENSE $1,703,051 $8,335 $1,694,716 MARKETING, GENERAL AND ADMINISTRATIVE EXPENSE 458,820 16,420 442,400 RESTRUCTURING CHARGES 8,431 8,431 — ASSET IMPAIRMENT 44,988 44,988 — INCOME BEFORE TAXES 99,154 78,174 177,328 TAX EXPENSE 47,333 17,686 65,019 NET INCOME $51,821 $60,488 $112,309 NET INCOME PER DILUTED SHARE $0.71 $0.83 $1.54 13

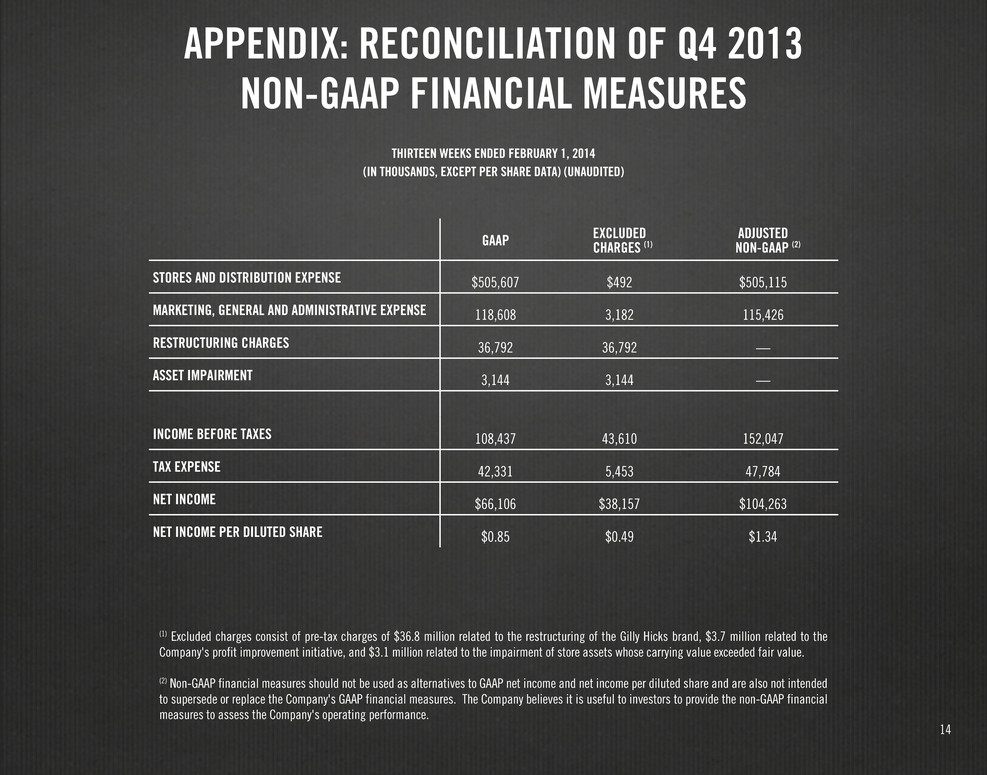
APPENDIX: RECONCILIATION OF Q4 2013 NON-GAAP FINANCIAL MEASURES (1) Excluded charges consist of pre-tax charges of $36.8 million related to the restructuring of the Gilly Hicks brand, $3.7 million related to the Company's profit improvement initiative, and $3.1 million related to the impairment of store assets whose carrying value exceeded fair value. (2) Non-GAAP financial measures should not be used as alternatives to GAAP net income and net income per diluted share and are also not intended to supersede or replace the Company's GAAP financial measures. The Company believes it is useful to investors to provide the non-GAAP financial measures to assess the Company's operating performance. THIRTEEN WEEKS ENDED FEBRUARY 1, 2014 (IN THOUSANDS, EXCEPT PER SHARE DATA) (UNAUDITED) GAAP EXCLUDED CHARGES (1) ADJUSTED NON-GAAP (2) STORES AND DISTRIBUTION EXPENSE $505,607 $492 $505,115 MARKETING, GENERAL AND ADMINISTRATIVE EXPENSE 118,608 3,182 115,426 RESTRUCTURING CHARGES 36,792 36,792 — ASSET IMPAIRMENT 3,144 3,144 — INCOME BEFORE TAXES 108,437 43,610 152,047 TAX EXPENSE 42,331 5,453 47,784 NET INCOME $66,106 $38,157 $104,263 NET INCOME PER DILUTED SHARE $0.85 $0.49 $1.34 14

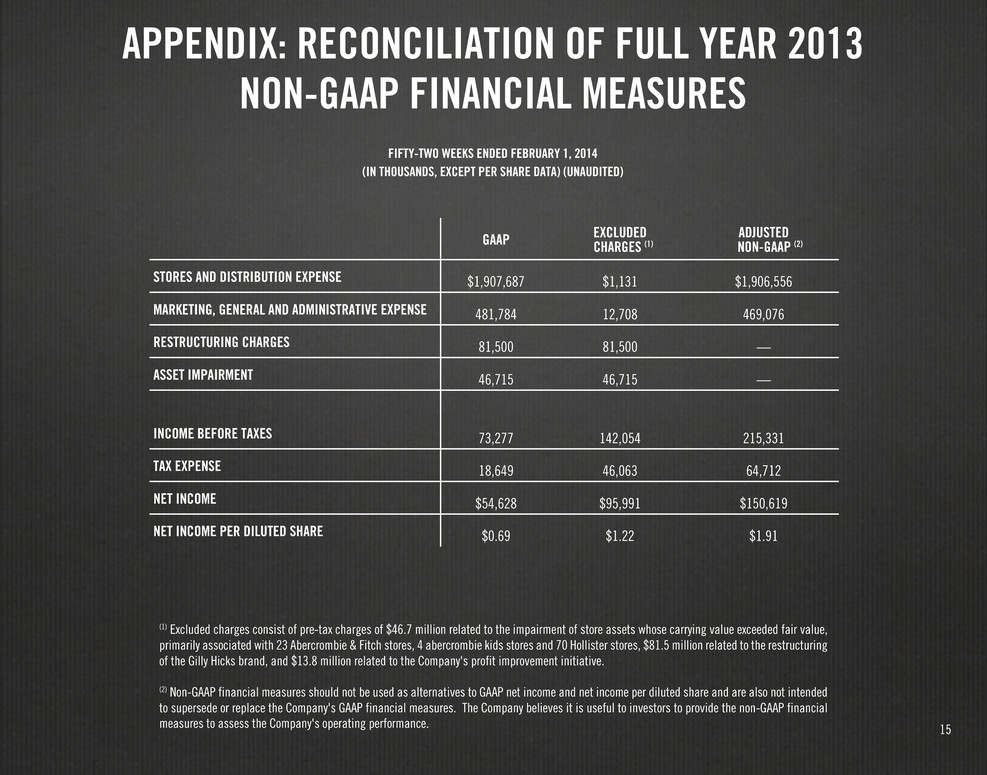
APPENDIX: RECONCILIATION OF FULL YEAR 2013 NON-GAAP FINANCIAL MEASURES (1) Excluded charges consist of pre-tax charges of $46.7 million related to the impairment of store assets whose carrying value exceeded fair value, primarily associated with 23 Abercrombie & Fitch stores, 4 abercrombie kids stores and 70 Hollister stores, $81.5 million related to the restructuring of the Gilly Hicks brand, and $13.8 million related to the Company's profit improvement initiative. (2) Non-GAAP financial measures should not be used as alternatives to GAAP net income and net income per diluted share and are also not intended to supersede or replace the Company's GAAP financial measures. The Company believes it is useful to investors to provide the non-GAAP financial measures to assess the Company's operating performance. FIFTY-TWO WEEKS ENDED FEBRUARY 1, 2014 (IN THOUSANDS, EXCEPT PER SHARE DATA) (UNAUDITED) GAAP EXCLUDED CHARGES (1) ADJUSTED NON-GAAP (2) STORES AND DISTRIBUTION EXPENSE $1,907,687 $1,131 $1,906,556 MARKETING, GENERAL AND ADMINISTRATIVE EXPENSE 481,784 12,708 469,076 RESTRUCTURING CHARGES 81,500 81,500 — ASSET IMPAIRMENT 46,715 46,715 — INCOME BEFORE TAXES 73,277 142,054 215,331 TAX EXPENSE 18,649 46,063 64,712 NET INCOME $54,628 $95,991 $150,619 NET INCOME PER DILUTED SHARE $0.69 $1.22 $1.91 15
