Attached files
| file | filename |
|---|---|
| EX-31.2 - CERTIFICATION - RTI SURGICAL, INC. | d833007dex312.htm |
| EX-31.1 - CERTIFICATION - RTI SURGICAL, INC. | d833007dex311.htm |
| EX-32.1 - CERTIFICATION - RTI SURGICAL, INC. | d833007dex321.htm |
| EX-23.1 - CONSENT - RTI SURGICAL, INC. | d833007dex231.htm |
| EX-10.19 - SECOND AMENDMENT TO THE SECOND AMENDED - RTI SURGICAL, INC. | d833007dex1019.htm |
| EXCEL - IDEA: XBRL DOCUMENT - RTI SURGICAL, INC. | Financial_Report.xls |
| EX-32.2 - CERTIFICATION - RTI SURGICAL, INC. | d833007dex322.htm |
Table of Contents
UNITED STATES
SECURITIES AND EXCHANGE COMMISSION
Washington, DC 20549
FORM 10-K
| x | ANNUAL REPORT PURSUANT TO SECTION 13 OR 15(D) OF THE SECURITIES EXCHANGE ACT OF 1934 |
For the fiscal year ended December 31, 2014
or
| ¨ | TRANSITION REPORT PURSUANT TO SECTION 13 OR 15(D) OF THE SECURITIES EXCHANGE ACT OF 1934 |
For the transition period from to .
Commission file number: 0-31271
RTI SURGICAL, INC.
(Exact Name of Registrant as Specified in Its Charter)
| Delaware | 59-3466543 | |
| (State or Other Jurisdiction of Incorporation or Organization) |
(I.R.S. Employer Identification No.) |
11621 Research Circle, Alachua, Florida 32615
(Address of Principal Executive Offices) (Zip Code)
(386) 418-8888
(Registrant’s telephone number, including area code)
Securities registered pursuant to Section 12(b) of the Act: Common Stock, par value $0.001
Indicate by check mark if the registrant is a well-known seasoned issuer, as defined in Rule 405 of the Securities Act. Yes ¨ No x
Indicate by check mark if the registrant is not required to file reports pursuant to Section 13 or Section 15(d) of the Act. Yes ¨ No x
Indicate by check mark whether the registrant: (1) has filed all reports required to be filed by Section 13 or 15(d) of the Securities Exchange Act of 1934 during the preceding 12 months (or for such shorter period that the registrant was required to file such reports), and (2) has been subject to such filing requirements for the past 90 days. Yes x No ¨
Indicate by check mark whether the registrant has submitted electronically and posted on its corporate Web site, if any, every Interactive Data File required to be submitted and posted pursuant to Rule 405 of Regulation S-T (§232.405 of this chapter) during the preceding 12 months (or for such shorter period that registrant was required to submit and post such files.) Yes x No ¨
Indicate by check mark if disclosure of delinquent filers pursuant to Item 405 of Regulation S-K is not contained herein, and will not be contained, to the best of registrant’s knowledge, in definitive proxy or information statements incorporated by reference in Part III of this Form 10-K or any amendment to this Form 10-K. x
Indicate by check mark whether the registrant is a large accelerated filer, an accelerated filer, a non-accelerated filer or a smaller reporting company. See definition of “accelerated filer”, “large accelerated filer” and “smaller reporting company” in Rule 12b-2 of the Exchange Act. (Check one):
| Large Accelerated Filer | ¨ | Accelerated Filer | x | |||
| Non-Accelerated Filer | ¨ | Smaller Reporting Company | ¨ | |||
Indicate by check mark whether the registrant is a shell company (as defined in Rule 12b-2 of the Exchange Act.): Yes ¨ No x
The aggregate market value of the Common Stock held by non-affiliates of the registrant, based upon the last sale price of the Common Stock reported on the Nasdaq Stock Market as of the last business day of the registrant’s most recently completed second fiscal quarter (June 30, 2014), was approximately $247.1 million.
The number of shares of Common Stock outstanding as of February 25, 2015 was 57,138,949.
DOCUMENTS INCORPORATED BY REFERENCE
As stated in Part III of this Annual Report on Form 10-K, portions of the registrant’s definitive proxy statement for the registrant’s 2015 Annual Meeting of Stockholders are incorporated by reference in Part III of this Annual Report on Form 10-K.
Table of Contents
RTI SURGICAL, INC.
FORM 10-K Annual Report
| Page | ||||||
| Part I |
||||||
| Item 1 |
1 | |||||
| 1 | ||||||
| 2 | ||||||
| 2 | ||||||
| 3 | ||||||
| 5 | ||||||
| 5 | ||||||
| 5 | ||||||
| 6 | ||||||
| 6 | ||||||
| 7 | ||||||
| 7 | ||||||
| 8 | ||||||
| 12 | ||||||
| 12 | ||||||
| 12 | ||||||
| Item 1A |
13 | |||||
| Item 1B |
23 | |||||
| Item 2 |
23 | |||||
| Item 3 |
24 | |||||
| Part II |
||||||
| Item 5 |
25 | |||||
| Item 6 |
27 | |||||
| Item 7 |
Management’s Discussion and Analysis of Financial Condition and Results of Operations |
28 | ||||
| Item 7A |
44 | |||||
| Item 8 |
44 | |||||
| Item 9 |
Changes in and Disagreements with Accountants on Accounting and Financial Disclosure |
44 | ||||
| Item 9A |
45 | |||||
| Item 9B |
45 | |||||
| Part III |
||||||
| Item 10 |
46 | |||||
| Item 11 |
46 | |||||
| Item 12 |
Security Ownership of Certain Beneficial Owners and Management and Related Stockholder Matters |
46 | ||||
| Item 13 |
Certain Relationships and Related Transactions, and Director Independence |
46 | ||||
| Item 14 |
46 | |||||
| Part IV |
||||||
| Item 15 |
47 | |||||
| 48 | ||||||
Table of Contents
PART I
This Annual Report on Form 10-K and the documents incorporated by reference contain forward-looking statements that have been made pursuant to the provisions of the Private Securities Litigation Reform Act of 1995. These forward-looking statements are based on current expectations, estimates and projections about our industry, our management’s beliefs and certain assumptions made by our management. Words such as “anticipates,” “expects,” “intends,” “plans,” “believes,” “seeks,” “estimates,” “requires” “hopes,” “may,” “assumes,” variations of such words and similar expressions are intended to identify such forward-looking statements. Do not unduly rely on forward-looking statements. These statements give our expectations about future performance, but are not guarantees of future performance and are subject to certain risks, uncertainties and assumptions that are difficult to predict; therefore, actual results may differ materially from those expressed or forecasted in any such forward-looking statements. Some of the matters described below in the “Risk Factors” section constitute cautionary statements which identify factors regarding these forward-looking statements, including certain risks and uncertainties that could cause actual results to vary materially from the future results indicated in these forward-looking statements. Other factors could also cause actual results to vary materially from the future results indicated in such forward-looking statements. Forward-looking statements speak only as of the date they are made, and unless required by law, we undertake no obligation to update publicly any forward-looking statements, whether as a result of new information, future events or otherwise.
| Item 1. | BUSINESS. |
We are a leader in the use of natural tissues, metals and synthetics to produce orthopedic and other surgical implants that repair and promote the natural healing of human bone and other human tissues and improve surgical outcomes. We process donated human musculoskeletal and other tissue, including bone, cartilage, tendon, ligament, fascia lata, pericardium, sclera and dermal tissue, and bovine and porcine animal tissue in producing allograft and xenograft implants utilizing proprietary BIOCLEANSE®, TUTOPLAST® and CANCELLE® SP sterilization processes and manufacture metal and synthetic implants for distribution to hospitals and surgeons. We process tissue at two facilities in Alachua, Florida and one facility in Neunkirchen, Germany, and manufacture metal and synthetic implants in Marquette, Michigan and Greenville, North Carolina. We distribute our implants and services in all 50 states and in over 45 countries worldwide.
We distribute human tissue, bovine and porcine animal tissue, metal and synthetic implants through various distribution channels. Our lines of business are comprised primarily of six categories: spine, sports medicine, ortho fixation, bone graft substitutes and general orthopedic (“BGS and general orthopedic”), surgical specialties and dental. The following table presents revenues from these six categories and other revenues and their respective percentages of our total revenues for the years ended December 31, 2014, 2013 and 2012:
| Year Ended December 31, | ||||||||||||||||||||||||
| 2014 | 2013 | 2012 | ||||||||||||||||||||||
| (In thousands) | ||||||||||||||||||||||||
| Revenues: |
||||||||||||||||||||||||
| Spine |
$ | 82,663 | 31.5 | % | $ | 57,334 | 28.9 | % | $ | 38,866 | 21.9 | % | ||||||||||||
| Sports medicine |
46,758 | 17.8 | % | 42,594 | 21.5 | % | 51,197 | 28.7 | % | |||||||||||||||
| Ortho fixation |
37,133 | 14.1 | % | 14,525 | 7.3 | % | — | — | ||||||||||||||||
| BGS and general orthopedic |
36,747 | 14.0 | % | 27,864 | 14.1 | % | 29,308 | 16.5 | % | |||||||||||||||
| Surgical specialties |
26,999 | 10.3 | % | 27,666 | 14.0 | % | 30,897 | 17.3 | % | |||||||||||||||
| Dental |
20,810 | 7.9 | % | 19,779 | 10.0 | % | 21,435 | 12.0 | % | |||||||||||||||
| Other revenues |
11,700 | 4.5 | % | 8,217 | 4.2 | % | 6,410 | 3.6 | % | |||||||||||||||
|
|
|
|
|
|
|
|
|
|
|
|
|
|||||||||||||
| Total revenues |
$ | 262,810 | 100.0 | % | $ | 197,979 | 100.0 | % | $ | 178,113 | 100.0 | % | ||||||||||||
|
|
|
|
|
|
|
|
|
|
|
|
|
|||||||||||||
| Domestic revenues |
$ | 238,936 | 90.9 | % | $ | 177,207 | 89.5 | % | $ | 156,803 | 88.0 | % | ||||||||||||
| International revenues |
23,874 | 9.1 | % | 20,772 | 10.5 | % | 21,310 | 12.0 | % | |||||||||||||||
|
|
|
|
|
|
|
|
|
|
|
|
|
|||||||||||||
| Total revenues |
$ | 262,810 | 100.0 | % | $ | 197,979 | 100.0 | % | $ | 178,113 | 100.0 | % | ||||||||||||
|
|
|
|
|
|
|
|
|
|
|
|
|
|||||||||||||
1
Table of Contents
For additional financial information concerning our operating performance, please refer to Management’s Discussion and Analysis of Financial Condition and Results of Operations in Part II, Item 7 of this report and our Consolidated Financial Statements in Part II, Item 8 of this report.
We were incorporated in 1997 in Florida as a wholly-owned subsidiary of the University of Florida Tissue Bank, (“UFTB”). We began operations on February 12, 1998 when UFTB contributed to us its allograft processing operations, related equipment and technologies, distribution arrangements, research and development activities and certain other assets. At the time of our initial public offering in August 2000, we reincorporated in the State of Delaware. In July 2013, we completed our acquisition of Pioneer Surgical Technology, Inc. (“Pioneer”) and in connection with the acquisition changed our name from RTI Biologics, Inc. to RTI Surgical, Inc. The results of Pioneer’s operations have been included in our consolidated financial statements since the date of acquisition. Our principal offices are located at 11621 Research Circle, Alachua, Florida, and our phone number is (386) 418-8888.
Defects in bone and other human tissue can be caused by a variety of sources including trauma, congenital defects, aging, revision of joint replacements, infectious disease, cancer and other similar conditions. The predominant method used to repair injured or defective tissue is surgical intervention, primarily through the use of surgical implants. When considering a surgical procedure for tissue repair, surgeons and patients have a number of treatment options including:
| • | metals and synthetics; |
| • | “xenograft” tissue from an animal source; |
| • | “autograft” tissue from the patient; and |
| • | “allograft” tissue from another human donor. |
Depending on the specific surgery, surgeons may elect to use any number of these treatment options. We offer a broad line of metal, synthetic, xenograft and allograft solutions to meet their needs.
Metals and Synthetics
The medical community has used metal and synthetic materials for implant procedures for many years. Metal and synthetic technologies are used to create both surgical implants as well as instruments used in surgical procedures. These implants are used in a variety of procedures in spine, cardiothoracic, trauma and other areas. Typical metals used include surgical stainless steel and titanium. These materials are chosen for their strength and durability. Synthetic implants provide alternative implant options for surgeons and also increase availability due to the variable supply of allograft. One common example of a synthetic material is polyetheretherkeytone (“PEEK”).
Xenograft Tissue
Xenograft tissue-based implants are common in many areas of medicine including cardiac and vascular procedures, soft tissue repair and wound care. Xenograft based implants are also used in the repair of bone defects in orthopedic surgery as carriers for demineralized bone matrix and bone morphogenic protein products. The production of xenograft implants involves recovering animal tissue, typically from cattle (bovine) or pigs (porcine), processing and sterilization, and then transplanting the xenograft implant into a human patient.
2
Table of Contents
Autograft and Allograft Tissue
Many surgeons use autograft and allograft tissue in their surgical procedures to take advantage of their natural characteristics. Autograft procedures involve a surgeon harvesting tissue from one part of a patient’s body for transplant to another part of the body. Allograft tissues are recovered from cadaveric donors, processed for certain intended uses and then transplanted by a surgeon into the patient’s body to make the needed repair.
Autograft and allograft bone implants are not only “osteoconductive,” meaning they provide a scaffold for new bone to attach itself to, but can be “osteoinductive” as well, meaning they stimulate the growth of new tissue.
A significant drawback to autograft procedures is that they require an additional surgery to recover the tissue from a second site in the patient’s body. Often in autograft procedures, the site where the patient’s tissue is harvested becomes painful and uncomfortable, and can take longer to heal than the primary surgical site. Additional complications can involve infection, nerve and arterial injury and joint instability. Moreover, a patient may not have sufficient quantities of quality autograft tissue for transplant procedures.
Our implants are used primarily in the following markets: spine, sports medicine, ortho fixation, BGS and general orthopedic, surgical specialties and dental. Our current implants range from allografts, xenografts, synthetics and metals that are precision machined for specific surgical applications to grafts conventionally processed for general surgical uses.
Spine
We design, manufacture, and distribute surgical implants and instruments used in the treatment of conditions affecting the spine and musculoskeletal system caused by degenerative conditions, deformities or traumatic injury of the spine. Our surgical implants include allograft and synthetic interbodies, bone graft substitutes, rods, pedicle screws and plates.
Our spine allografts are marketed domestically through our non-exclusive relationships with Aesculap Implant Systems, Inc. (“Aesculap”), Alphatec Spine, Inc. (“Alphatec”), Integra Life Sciences Corporation (“Integra”), Medtronic, plc. (“Medtronic”), Orthofix International NV (“Orthofix”), Stryker Spine a division of Stryker Corporation (“Stryker”), and Zimmer, Inc. (“Zimmer”). Our spine metals and synthetics are marketed through a network of independent distributors.
Sports Medicine
Many repetitive use and sports-related injuries can be addressed with allograft implants. The most prevalent surgeries in the knee include repairs to the anterior cruciate ligament (“ACL”), articular cartilage repair, and meniscus transplantation. The most prevalent surgeries in the shoulder include rotator cuff repair and articular cartilage repair. Our principal sports medicine allografts are tendons for ligament reconstruction, fresh osteochondral grafts for cartilage repair, and our meniscal allografts for advanced meniscus injuries. Many of our sports medicine tendon allografts utilize our patented pre-shaped technology, which greatly reduces preparation time in the operating room and are generally easier to implant as compared to non pre-shaped allografts. We also distribute Matrix HD human dermis implants for wound repair and soft tissue augmentation.
Our sports medicine implants such as our BioCleanse Meniscus, BioCleanse full tendon portfolio, fresh-stored osteochondral (“OC”) allograft portfolio, and our Matrix HD are marketed domestically through our direct biologics representatives and through our network of independent distributors and internationally through a network of independent distributors.
3
Table of Contents
Ortho fixation
Ortho fixation includes instruments and implants for trauma and cardio thoracic markets. Our trauma implants include devices used to stabilize damaged or broken bones. Our cardio thoracic implants include cable and plating systems used to close median sternotomies.
Our trauma implants are distributed through Zimmer and DePuy Synthes (“Synthes”), a Johnson & Johnson Inc. subsidiary. Our cardio thoracic implants are distributed through a direct distribution organization and a network of independent distributors.
BGS and general orthopedic
map3®. Our map3® cellular allogeneic bone graft is a natural and safe alternative to autograft that supports the body’s innate healing mechanisms and provides the scaffold and signals to support the bone healing process. The implant contains the three essential elements of bone formation, namely osteogenesis, osteoinduction and osteoconduction.
nanOss®. Our nanOss® advanced bone graft substitute is composed of nano-structured hydroxyapatite granules suspended in a porous gelatin-based foam matrix.
Allograft Paste. Surgeons principally use our allograft paste implants, which are composed of demineralized bone matrix (“DBM”) and in some cases a biologic gel carrier, in fracture treatment, bone and joint reconstruction and periodontal applications, such as ridge augmentation for dental implants.
Our allograft paste implants are marketed under Osteofil® by Medtronic, Puros® DBM by Zimmer and the Optefil™, Opteform®, Regenafil® and Regenaform® brands with Exactech, Inc. (“Exactech”) and we distribute directly the BioSet® DBM, BioReady™ DBM and BioAdapt® DBM families of paste implants through our direct representatives, a network of independent distributors and our international distribution network. Our DBM Boat implants are marketed under BIO DBM by Stryker.
Milled Allograft and Xenograft. Our bone graft substitutes business also includes certain types of blended and milled bone allografts and xenografts, such as our demineralized bone matrix, cortical cancellous chips and ground cancellous chips, used in total hip and knee replacements and for various traumatic injuries.
Conventional Allografts. Our conventional allograft business includes a wide variety of allograft categories including our intercalary grafts, such as our large structural grafts, which are used for cancer treatment procedures and hip and knee reconstruction. We also produce various types of fashioned bone, such as strips and shafts used for various orthopedic procedures.
Surgical Specialties
We process and distribute implants for surgical specialties, which include abdominal wall repair, plastic and reconstructive surgery, ophthalmology and urology.
The company distributes xenograft and allograft implants through our direct distribution organization: Fortiva porcine dermis, Tutopatch and Tutomesh bovine pericardium, and Cortiva human dermis. These implants are all processed through our validated Tutoplast tissue sterilization process, which has a proven track record of safety and performance. These implants are positioned to surgeons in various surgical specialties, including general, colon and rectal, trauma, bariatric, and plastic reconstructive surgery. We also distribute implants through distributors including; Integra for dural repair applications, Davol, Inc., a subsidiary of C. R. Bard, Inc. (“Davol”) for hernia repair and breast reconstruction, IOP, Inc. (“IOP”) for ophthalmology and Coloplast A/S of Denmark (“Coloplast”) for urology.
4
Table of Contents
Dental
We currently provide various implants including cancellous and cortical bone and human and bovine membranes primarily for dental procedures related to augmenting ridge restoration.
We distribute our dental implants exclusively through Zimmer.
The BioCleanse® Tissue Sterilization Process
We have developed and utilized in the United States the patented BioCleanse® tissue sterilization process, which is an automated, pharmaceutical grade chemical sterilization process for musculoskeletal bone and certain soft tissue. This process is fully validated to kill or inactivate all classes of conventional pathogens, viruses, microbes, bacteria and fungi. Our BioCleanse® process is able to remove greater than 99% of the blood, fats, lipids and other unwanted materials from the tissue we process. An important element of the BioCleanse® process is that while it removes unwanted materials embedded within the tissue, it maintains the tissue’s structural integrity and compression strength. Studies have shown that bone tissue sterilized with the BioCleanse® process maintains the same compression strength as untreated tissue.
The BioCleanse® process has been reviewed by the U.S. Food and Drug Administration (“FDA”) which concluded that BioCleanse® was a validated tissue sterilization process demonstrated to prevent contamination of tissue grafts. The significance of the review is that we are not aware of any other tissue sterilization process related to human tissue in our industry that has been reviewed or approved by the FDA. The FDA does not have a formal approval process in place for tissue related processing techniques.
The TUTOPLAST® Tissue Sterilization Process
The TUTOPLAST® tissue sterilization process utilizes solvent dehydration and chemical inactivation to remove blood, lipids and extraneous materials, and inactivate viruses and break down RNA and DNA into fragments not capable of replication and disease transmission while preserving the biological and mechanical properties.
We apply the TUTOPLAST® process to two types of preserved allografts: soft tissue, consisting of fascia lata, pericardium, dermis, sclera and cornea; and bone tissue, consisting of various configurations of cancellous and cortical bone material. Processed pericardium, fascia lata and dermis are collagenous tissue used to repair, replace or line native connective tissue primarily in dental, ophthalmology, urology, plastic and reconstructive surgeries. Dermis is also used in hernia repair and pelvic floor reconstruction. Sclera and cornea are used in ophthalmology procedures such as anterior and posterior segment patch grafting applications for glaucoma, retina and trauma surgery and oculoplastics, as well as contour wrapping of an orbital implant. Processed cortical and cancellous bone material is used in a wide variety of applications in spine, orthopedic and dental surgeries.
The CANCELLE® SP DBM Sterilization Process
DBM-based pastes and putties are sterilized through the CANCELLE® SP process, which is designed to preserve protein activity. In their final form, the DBM implants serve as bone void fillers in many applications, including spinal, general orthopedic, joint reconstruction and dental surgeries.
CANCELLE® SP is a proprietary process that sterilizes DBM pastes and putties while simultaneously allowing them to maintain their osteoinductive (“OI”) potential, which is verified by 100 percent lot testing after sterilization. The determination of OI potential is made by lot release animal studies or testing for certain protein markers. These tests are not necessarily predictive of human clinical results. Through a combination of oxidative treatments and acid or alcohol washes, debris is removed and pathogens are inactivated. Cleansing rinses remove residual chemicals, maintaining biocompatibility and preserving the utility of the graft. The CANCELLE® SP irradiation dose is delivered terminally for most pastes and putties to achieve device-level sterility (“SAL 10-6”).
5
Table of Contents
Tissue recovery is the actual removal of tissue from a donor after receiving appropriate consent. Consent is obtained by the tissue recovery group. We operate certain tissue recovery groups directly, and contract with other independent FDA registered tissue recovery groups which specialize in this activity. Tissue recovery personnel aseptically recover musculoskeletal tissue within 24 hours following a donor’s death, using surgical instruments and sterile techniques similar to those used in hospitals for routine surgery. Recovered tissue is placed on wet or dry ice and then transported by the donor recovery agency to the tissue processor or possibly a research institution.
Under U.S. law, human tissue cannot be sold. However, the law permits the recovery of reasonable payments for the provision of certain services, such as those involved in recovering, processing and storing tissue and related to the advancement of tissue processing technologies, all types of activities in which we are involved.
Donor recovery groups recover a variety of tissue types from donors including the fibula, femur, tibia, humerus, ilium, pericardium, fascia lata, dermis, bone marrow, sclera, tendons and ligaments. In addition to tissue received from recovery groups we control, we also receive donated tissue from independently registered tissue recovery organizations. To make an initial determination as to whether tissues may be appropriately recovered, these independent tissue recovery organizations are responsible for obtaining appropriate consents and conducting federally-mandated donor screening, such as a medical and social history interview with the next of kin. Upon receipt of the tissue, we conduct pre-processing donor screening to determine its medical suitability for transplantation. Pre-processing screening performed by us includes laboratory testing and a donor eligibility assessment. With respect to laboratory testing, we perform an extensive panel of serological and microbiological tests. These results are subject to stringent criteria in order to release the donor tissue to the processing stage.
We have relationships with tissue donor recovery agencies across the United States. We also have relationships outside the United States. We believe additional recovery group relationships would be available if needed and consequently that the loss of any one of our sources of donor tissue would not have a material impact on our operating results.
We continue to develop new xenograft tissue implants. Implants processed from xenograft tissue are regulated by the FDA as devices and require approval or licenses from the FDA prior to marketing in the United States. The sources of our bovine animal tissues are regulated closed herds. We believe the continued development of our xenograft implants will help us meet unmet demand for certain allografts and also allow us to develop new biological implants that cannot currently be made due to structural limitations of human tissue.
Our research and development (“R&D”) costs for the years ended December 31, 2014, 2013 and 2012 were $15.5 million, $15.2 million and $12.2 million, respectively. In 2014, we continued to increase our investment in our R&D efforts by funding new projects including research and development projects at our facilities in our US locations and in Neunkirchen, Germany.
We plan to continue to develop new implants and technologies within our current markets, and to develop additional technologies for other markets to address unmet clinical needs. We plan to do this by building on our core technology platforms: BIOCLEANSE®, TUTOPLAST®, CANCELLE® SP, precision machining, assembled grafts, tissue-mediated osteoinduction and our metal and synthetics design and production expertise. We operate a dedicated research team working on advanced technologies, and have embedded development/technical teams who work with the business/marketing teams focused on expanding the scope and scale of existing competencies such as tissue machining and sterilization, and metal and synthetics manufacturing to meet specific surgical needs. This approach has resulted in the development of core science platforms, a pipeline of concepts for development and marketing, and focused projects to meet immediate needs.
6
Table of Contents
In 2014, we launched 23 new implants in spine, sports medicine, BGS and general orthopedics and surgical specialties developed by our research and development teams.
Our business depends upon the significant know-how and proprietary technology we have developed. To protect this know-how and proprietary technology, we rely on a combination of trade secret laws, patents, licenses, trademarks and confidentiality agreements. The effect of these intellectual property rights is to define zones of exclusive use of the covered intellectual property. The duration of patent rights generally is 20 years from the date of filing of priority application, while trademarks, once registered, are essentially perpetual. Our trademarks and service marks provide us and our implants with a certain amount of brand recognition in our markets. However, we do not consider any single patent, trademark or service mark material to our business strategy, financial condition or results of operations. We have also entered into exclusive and non-exclusive licenses relating to a wide array of third-party technologies. In addition, we rely on our substantial body of know-how, including proprietary tissue recovery techniques and processes, research and development, tissue processing and quality assurance.
Our proprietary BIOCLEANSE®, TUTOPLAST® and CANCELLE® SP sterilization processes are covered by one or more U.S. and/or foreign patents, patent applications or trade secrets. Other U.S. and foreign holdings include patents, patent applications or trade secrets relating to or covering certain precision machined allograft intervertebral spacers and other spinal implants; matrix compositions including various bone graft substitutes; membrane tissue implants; and ligament, tendon or meniscus reconstruction and repair with certain precision shaped and/or assembled bone and soft tissue implants, synthetic bone graft substitutes; interbody fusion and motion implants; spinal and orthopedic plates; spinal rods, cables and screws and spinal fixation systems and related instrumentation.
The medical device industry is characterized by the existence of a large number of patents and frequent litigation based on allegations of patent infringement. As the number of entrants into our market increases, the risk of an infringement claim against us grows. While we attempt to ensure that our implants and methods do not infringe other parties’ patents and proprietary rights, our competitors may assert that our implants, and the methods we employ, are covered by patents held by them. In addition, our competitors may assert that future implants and methods we may employ infringe their patents. If third parties claim that we infringe upon their intellectual property rights, we may incur liabilities and costs and may have to redesign or discontinue selling the affected implant. Even if we were to prevail, any litigation could be costly and time-consuming and would divert the attention of our management and key personnel from our business operations. We have in the past been, and may in the future be, involved in litigation relating to our intellectual property.
Competition in the medical implant industry is intense and subject to rapid technological change and evolving industry requirements and standards. Companies within the industry compete on the basis of design of related instrumentation, efficacy of implants, relationships with the surgical community, depth of range of implants, scientific and clinical results and pricing.
Our principal competitors in the conventional allograft market include the Musculoskeletal Transplant Foundation (“MTF”), AlloSource Inc., LifeCell, Inc., a subsidiary of Acelity L.P. Inc. and LifeNet Health, Inc. (“LifeNet”). Among our competitors in precision machined allograft are MTF, LifeNet and AlloSource. Other companies who process and distribute allograft pastes include Medtronic, AlloSource, Integra, Wright Medical Inc. and MTF. Companies who process and distribute xenograft tissue include Baxter, Inc., LifeCell, Cook Surgical and Medtronic.
We consider our principal competitors in the metal and synthetic markets to include Alphatec, Globus Medical, Inc. (“Globus”), NuVasive, Inc. (“NuVasive”) and Orthofix.
7
Table of Contents
Government Regulation and Corporate Compliance
Government Regulation
Government regulation plays a significant role in the processing/manufacturing and distribution of allograft tissue implants and medical devices. We procure, where applicable, process/manufacture, and market our allograft tissue implants and medical devices worldwide. Although some standards of harmonization exist, each country in which we do business has its own specific regulatory requirements. These requirements are dynamic in nature and, as such, are continually changing. New regulations may be promulgated at any time and with limited notice. While we believe that we are in compliance with all existing pertinent international and domestic laws and regulations, there can be no assurance that changes in governmental administrations and regulations will not adversely affect our operations. Failure to comply with applicable requirements could result in fines, injunctions, civil penalties, recall or seizure of products, suspension of production, inability to market current products, criminal prosecution, and/or refusal of the government to authorize the marketing of new products.
In the United States, our allograft implants are regulated by the FDA under Title 21 of the Code of Federal Regulations (CFR), Parts 1270 and 1271, “Current Good Tissue Practice for Human Cell, Tissue, and Cellular and Tissue-Based Products” (“cGTP”). Xenograft tissues and allograft bone paste are regulated as medical devices and subject to FDA 21 CFR, Part 820 Current Good Manufacturing Practices for Medical Devices and related statutes from the FDA. In addition, our U.S. operation is subject to certain state and local regulations, as well as compliance to the standards of the tissue bank industry’s accrediting organization, the American Association of Tissue Banks, (“AATB”).
In Germany, allografts are classified as drugs and the German government regulates such implants in accordance with German Drug Law. On April 7, 2004, the European Commission issued a human tissue directive to regulate allografts within the European Union (“EU”). Our Neunkirchen facility is presently licensed by the German Health Authorities and in compliance with applicable international laws and regulations, allowing us to market our human and animal tissue implants globally.
The FDA and international regulatory bodies conduct periodic compliance inspections of both our U.S. and our German processing facilities. All operations are registered with the U.S. FDA Center for Devices and Radiological Health (“CDRH”) for device manufacturing locations and Center for Biologics Evaluation and Research (“CBER”) for human tissue recovery, processing and distribution locations and are certified to ISO 13485:2003. The Alachua facility is also accredited by the AATB and is licensed in the states of Florida, New York, California, Maryland, Delaware and Illinois. The Neunkirchen facility is registered with the German Health Authority (“BfArM”) as a pharmaceutical and medical device manufacturer and is subject to German drug law. We believe that worldwide regulation of allografts and xenografts is likely to intensify as the international regulatory community focuses on the growing demand for these implants and the attendant safety and efficacy issues of citizen recipients.
We currently market and distribute allografts that are subject to the FDA’s “Human Tissue Intended for Transplantation” and “Human Cells, Tissues, and Cellular and Tissue-Based Products” regulations. Under these regulations, we are required to perform donor screening and infectious disease testing and to document this screening and testing for each donor from whom we process tissue, and to process tissues in compliance with cGTP. The FDA has authority under the rules to inspect human tissue processing facilities, and to detain, recall, or destroy tissues for which appropriate documentation and evidence of compliance is not available. We are not required to obtain pre-market approval or clearance from the FDA for allografts that meet the regulation’s definition of “human tissue.”
The FDA may regulate certain allografts as medical devices, drugs, or biologics, which would require that we obtain approval or product licensure from the FDA. This would occur in those cases where the allograft is deemed to have been “more than minimally manipulated or indicated for non-homologous use.” In general, “homologous use” occurs when tissue is used for the same basic function that it fulfilled in the donor. The
8
Table of Contents
definitional criteria for making these determinations appear in the FDA’s rules. If the FDA decides that certain of our current or future allografts are more than minimally manipulated or indicated for non-homologous use, it would require licensure, approval or clearances of those allografts. Allografts requiring such approval are subject to pervasive and continuing regulation by the FDA. We would be required to list these allografts as a drug, as a medical device, or as a biologic, and to manufacture them in specifically registered or licensed facilities in accordance with FDA regulation “Current Good Manufacturing Practices.” We would also be subject to post-marketing surveillance and reporting requirements. In addition, our manufacturing facilities and processes would be subject to periodic inspection to assess compliance with Current Good Manufacturing Practices. Our labeling and promotional activities would be subject to scrutiny by the FDA and, in certain instances, by the Federal Trade Commission. The export of drugs, devices and biologics is also subject to more intensive regulation than is the case for human tissue implants.
Our research, development and clinical programs, as well as our manufacturing and marketing operations, are subject to extensive regulation in the United States and other countries. Most notably, all of our implants sold in the United States are subject to the federal Food, Drug, and Cosmetic Act and the Public Health Services Act as implemented and enforced by the FDA. The regulations that cover our implants and facilities vary widely based on implant type and classification both in the United States, and from country to country. The amount of time required to obtain approvals or clearances from regulatory authorities also differs from country to country.
Unless an exemption applies, each medical device that we wish to commercially distribute in the United States will be covered by either premarket notification (“510(k)”) clearance or approval of a premarket approval application (“PMA”) from the FDA. The FDA classifies medical devices into one of three classes. Devices deemed to pose lower risks are placed in either class I or II, which typically requires the manufacturer to submit to the FDA a premarket notification requesting permission to commercially distribute the device. This process is generally known as 510(k) clearance. Some low risk devices are exempted from this requirement. Devices deemed by the FDA to pose the greatest risks, such as life-sustaining, life-supporting or implantable devices, or devices deemed not substantially equivalent to a previously cleared 510(k) device, are placed in class III, requiring approval through the lengthy PMA process. Manufacturers of most class II medical devices are required to obtain 510(k) clearance prior to marketing their devices. To obtain 510(k) clearance, a company must submit a premarket notification demonstrating that the proposed device is “substantially equivalent” in intended use and in technological and performance characteristics to another legally marketed 510(k)-cleared “predicate device.” By regulation, the FDA is required to clear or deny a 510(k) premarket notification within 90 days of submission of the application. As a practical matter, clearance may take longer. The FDA may require further information, including clinical data, to make a determination regarding substantial equivalence. After a device receives 510(k) clearance, any modification that could significantly affect its safety or effectiveness, or that would constitute a major change in its intended use, requires a new 510(k) clearance or could require a PMA approval.
Class III medical devices are required to undergo the PMA approval process in which the manufacturer must establish the safety and effectiveness of the device to the FDA’s satisfaction. A PMA application must provide extensive preclinical and clinical trial data and also information about the device and its components regarding, among other things, device design, manufacturing and labeling. Also during the review period, an advisory panel of experts from outside the FDA may be convened to review and evaluate the application and provide recommendations to the FDA as to the approvability of the device. In addition, the FDA will typically conduct a preapproval inspection of the manufacturing facility to ensure compliance with quality system regulations. FDA reviews of PMA applications, generally can take between one and three years, or longer.
The medical devices that we develop, manufacture, distribute and market are subject to rigorous regulation by the FDA and numerous other federal, state and foreign governmental authorities. The process of obtaining FDA clearance and other regulatory approvals to develop and market a medical device, particularly from the FDA, can be costly and time-consuming, and there can be no assurance that such approvals will be granted on a timely basis, if at all. While we believe that we have obtained all necessary clearances and approvals for the manufacture and sale of our implants and that they are in material compliance with applicable FDA and other
9
Table of Contents
material regulatory requirements, there can be no assurance that we will be able to continue such compliance. After a device is placed on the market, numerous regulatory requirements continue to apply. Those regulatory requirements include: product listing and establishment registration; Quality System Regulation (“QSR”) which requires manufacturers, including third-party manufacturers, to follow stringent design, testing, control, documentation and other quality assurance procedures during all aspects of the manufacturing process; labeling regulations and FDA prohibitions against the promotion of products for uncleared, unapproved or off-label uses or indications; clearance of product modifications that could significantly affect safety or efficacy or that would constitute a major change in intended use of one of our cleared devices; approval of product modifications that affect the safety or effectiveness of one of our PMA approved devices; Medical Device Reporting regulations, which require that manufacturers report to FDA if their device may have caused or contributed to a death or serious injury, or has malfunctioned in a way that would likely cause or contribute to a death or serious injury if the malfunction of the device or a similar device were to recur; post-approval restrictions or conditions, including post-approval study commitments; post-market surveillance regulations, which apply when necessary to protect the public health or to provide additional safety and effectiveness data for the device; the FDA’s recall authority, whereby it can ask, or under certain conditions order, device manufacturers to recall from the market a product that is in violation of governing laws and regulations; regulations pertaining to voluntary recalls; and notices of corrections or removals.
We and certain of our suppliers also are subject to announced and unannounced inspections by the FDA to determine our compliance with FDA’s QSR and other regulations. If the FDA were to find that we or certain of our suppliers have failed to comply with applicable regulations, the agency could institute a wide variety of enforcement actions, ranging from a public warning letter to more severe sanctions such as: fines and civil penalties against us, our officers, our employees or our suppliers; unanticipated expenditures to address or defend such actions; delays in clearing or approving, or refusal to clear or approve, our products; withdrawal or suspension of approval of our products or those of our third-party suppliers by the FDA or other regulatory bodies; product recall or seizure; interruption of production; operating restrictions; injunctions; and criminal prosecution. Moreover, governmental authorities outside the United States have become increasingly stringent in their regulation of medical devices, and our products may become subject to more rigorous regulation by non-U.S. governmental authorities in the future. U.S. or non-U.S. government regulations may be imposed in the future that may have a material adverse effect on our business and operations. The European Commission (“EC”) has harmonized national regulations for the control of medical devices through European Medical Device Directives with which manufacturers must comply. Under these new regulations, manufacturing plants must have received CE certification from a “notified body” in order to be able to sell products within the member states of the European Union. Certification allows manufacturers to stamp the products of certified plants with a “CE” mark. Products covered by the EC regulations that do not bear the CE mark cannot be sold or distributed within the European Union. We have received certification for all currently existing manufacturing facilities and products.
Our products may be reimbursed by third-party payors, such as government programs, including Medicare, Medicaid, and Tricare or private insurance plans and healthcare networks. Third-party payors may deny reimbursement if they determine that a device provided to a patient or used in a procedure does not meet applicable payment criteria or if the policy holder’s healthcare insurance benefits are limited. Also, third-party payors are increasingly challenging the medical necessity and prices paid for our products and services.
Civil False Claims Act and the Health Insurance Portability and Accountability Act of 1996 (“HIPAA”) as well as numerous state laws regulate healthcare and insurance. These laws are enforced by the Office of Inspector General within the U.S. Department of Health and Human Services, the U.S. Department of Justice, and other federal, state and local agencies. Among other things, these laws and others generally: (1) prohibit the provision of anything of value in exchange for the referral of patients for, or the purchase, order, or recommendation of, any item or service reimbursed by a federal healthcare program, (including Medicare and Medicaid); (2) require that claims for payment submitted to federal healthcare programs be truthful; (3) prohibit the transmission of protected healthcare information to persons not authorized to receive that information; and (4) require the maintenance of certain government licenses and permits.
10
Table of Contents
In addition, U.S. federal and state laws protect the confidentiality of certain health information, in particular individually identifiable information such as medical records and restrict the use and disclosure of that protected information. At the federal level, the Department of Health and Human Services promulgated health information privacy and security rules under HIPAA. These rules protect health information by regulating its use and disclosure, including for research and other purposes. Failure of a HIPAA “covered entity” to comply with HIPAA regarding such “protected health information” could constitute a violation of federal law, subject to civil and criminal penalties. Covered entities include healthcare providers (including those that sell devices or equipment) that engage in particular electronic transactions, including the transmission of claims to health plans. Consequently, health information that we access, collect, analyze, and otherwise use and/or disclose includes protected health information that is subject to HIPAA. As noted above, many state laws also pertain to the confidentiality of health information. Such laws are not necessarily preempted by HIPAA, in particular those state laws that afford greater privacy protection to the individual than HIPAA. These state laws typically have their own penalty provisions, which could be applied in the event of an unlawful action affecting health information.
In the quarter ended September 30, 2014, we received a letter from the FDA regarding our map3® cellular allogeneic bone graft. The letter addresses some technical aspects of the processing of the map3® allograft, as well as language included on our website. We have submitted an initial response to the FDA letter, and have prepared a comprehensive package of data to address the FDA’s comments and provide clarifying information regarding the technical components of the implant processing. We believe that in both developing and processing of map3®, we have properly considered the relevant regulatory requirements. Additionally, we have removed the relevant information from the website pending thorough review and revisions as needed. We are committed to resolving the concerns raised by the FDA. However, it is not possible to predict the specific outcome or timing of a resolution at this time.
On October 23, 2012, we received a warning letter from the FDA related to environmental monitoring activities in certain areas of our processing facility in Alachua, Florida. In September 2013 the FDA performed a follow up close out inspection for the warning letter. The FDA accepted and recognized the corrective actions taken by us and we received a final close out letter on October 29, 2013 with no further findings or observations.
Corporate Compliance
On February 1, 2013, the Centers for Medicare & Medicaid Services (“CMS”) published a final rule which requires making information publicly available about payments or other transfers of value from certain manufacturers of drugs, devices, biologicals and medical supplies covered by Medicare, Medicaid, and the Children’s Health Insurance Program (“CHIP”), defined as applicable manufacturers, to physicians and teaching hospitals, which are defined as covered recipients. Called the “National Physician Payment Transparency Program: Open Payments,” this is one of many steps in the Affordable Care Act (“ACA”) designed to create greater transparency in health care markets.
The ACA specified that applicable manufacturers must report annually to the Secretary of Health and Human Services all payments or transfers of value (including gifts, consulting fees, research activities, speaking fees, meals, and travel) from applicable manufacturers to covered recipients. In addition to reporting on payments, applicable manufacturers, as well as applicable GPOs, must report ownership and investment interests held by physicians (or the immediate family members of physicians) in such entities. The ACA requires CMS to provide applicable manufacturers, applicable GPOs, covered recipients, and physician owners and investors at least 45 days to review, dispute and correct their reported information before posting it on a publicly available website.
We have a comprehensive compliance program. It is a fundamental policy of our company to conduct business in accordance with the highest ethical and legal standards. Our corporate compliance and ethics program is designed to promote legal compliance and ethical business practices throughout our domestic and international businesses.
11
Table of Contents
Our compliance program is designed to meet U.S. Sentencing Commission Guidelines for effective organizational compliance and ethics programs and to prevent and detect violations of applicable federal, state and local laws.
Key elements of our compliance program include:
| • | Organizational oversight by senior-level personnel responsible for the compliance functions within our company. |
| • | Written standards and procedures, including a Code of Business Conduct. |
| • | Methods for communicating compliance concerns, including anonymous reporting mechanisms. |
| • | Investigation and remediation measures to ensure prompt response to reported matters and timely corrective action. |
| • | Compliance education and training for employees and contracted business associates such as distributors. |
| • | Auditing and monitoring controls to promote compliance with applicable laws and assess program effectiveness. |
| • | Disciplinary guidelines to enforce compliance and address violations. |
| • | Screening of employees and contracted business associates. |
| • | Risk assessments to identify areas of regulatory compliance risk. |
Our allografts and xenografts, as well as the chemicals used in processing natural tissues and also in the manufacturing of metal and synthetic implants, are handled and disposed of in accordance with country-specific, federal, provincial, regional, state and/or local regulations, as applicable. We contract with independent, third parties to perform all gamma-terminal sterilization of our surgical implants. In view of the engagement of a third party to perform irradiation services, the requirements for compliance with radiation hazardous waste do not apply, and therefore we do not anticipate that having any material adverse effect upon our capital expenditures, results of operations or financial condition. However, we are responsible for assuring that the service is being performed in accordance with applicable regulations.
As of December 31, 2014, we had a total of 1,102 employees of which 187 were employed outside of the United States. Management believes its relations with its employees are good.
Our Internet address is www.rtix.com. Information included on our website is not incorporated by reference in our Form 10-K. We make available, free of charge, on or through the investor relations portion of our website, our annual reports on Form 10-K, quarterly reports on Form 10-Q and current reports on Form 8-K and amendments to such reports filed or furnished pursuant to Section 13(a) or 15(d) of the Securities Exchange Act of 1934, as amended (the “Exchange Act”), as soon as reasonably practicable after we file such material with, or furnish it to the Securities and Exchange Commission (“SEC”). These filings are also available on the SEC’s website at www.sec.gov. Also available on our website is our Code of Conduct, our Code of Ethics for Senior Financial Professionals, our California Compliance Program Declaration and the charters for our Audit Committee, Compensation Committee, Nominating and Governance Committee and Science and Technology Committee. Within the time period required by the SEC and Nasdaq, we will post any amendment to our Code of Ethics for our senior financial professionals and any waiver of our Code of Conduct applicable to our senior financial professionals, executive officers and directors.
12
Table of Contents
| Item 1A. | RISK FACTORS |
An investment in our common stock involves a high degree of risk. You should consider each of the risks and uncertainties described in this section and all of the other information in this document before deciding to invest in our common stock. Any of the risk factors we describe below could severely harm our business, financial condition and results of operations. The market price of our common stock could decline if any of these risks or uncertainties develops into actual events. You may lose all or part of the money you pay to buy our common stock.
We depend heavily upon sources of human tissue, and any failure to obtain tissue from these sources in a timely manner will interfere with our ability to process and distribute allografts.
The supply of human tissue has at times limited our growth, and may not be sufficient to meet our future needs. In addition, due to seasonal changes in mortality rates, some scarce tissues that we currently use for allografts are at times in particularly short supply. Other factors, some of which are unpredictable, such as negative publicity and regulatory actions in the industry in which we operate (and which may not involve us) also could unexpectedly reduce the available supply of tissue.
We rely on donor recovery groups for their human tissue supplies and we have relationships with tissue donor recovery agencies across the country. We also have relationships outside the United States. Donor recovery groups are part of relatively complex relationships. They provide support to donor families, are regulated by the FDA, and are often affiliated with hospitals, universities or organ procurement organizations. Our relationships with donor recovery groups, which are critical to our supply of tissue, could be affected by relationships recovery groups have with other organizations. Any negative impact arising from potential regulatory and disease transmission issues facing the industry, as well as the negative publicity that these issues could create, could adversely affect our ability to negotiate contracts with recovery groups.
We cannot be sure that the supply of human tissue will continue to be available at current levels or will be sufficient to meet our needs. If we are not able to obtain tissue from current sources sufficient to meet our needs, we may not be able to locate additional replacement sources of tissue on commercially reasonable terms, if at all. Any interruption of our business caused by the need to locate additional sources of tissue would significantly impact our revenues. We expect that our revenues from allografts would decline in proportion to any decline in tissue supply.
If we fail to maintain existing strategic relationships or are unable to identify distributors of our implants, revenues may decrease.
We currently derive a significant amount of our revenues through distributors such as Zimmer, Medtronic, Davol and Synthes. In addition, our spine distributors provide nearly all of the instrumentation, surgeon training, distribution assistance and marketing materials for the lines of spinal allografts they distribute.
Variations in the timing and volume of orders by our distributors, particularly those who distribute a significant amount of our implants, may have a material effect upon our revenues. If our relationships with distributors are terminated or reduced for any reason and we are unable to replace these relationships with other means of distribution, we would suffer a material decrease in revenues.
We may need, or decide it is otherwise advantageous to us, to obtain the assistance of additional distributors to market and distribute our new allografts and technologies, as well as to market and distribute our existing allografts and technologies, to new markets or geographical areas. We may not be able to find additional distributors who will agree to and successfully market and distribute our allografts and technologies on commercially reasonable terms, if at all. If we are unable to establish additional distribution relationships on favorable terms, our revenues may decline.
13
Table of Contents
Also, our financial results are dependent upon the sales and marketing efforts of our distributors. If our distributors are unsuccessful in adequately promoting, marketing and selling our products, our sales could significantly decrease.
If third-party payors fail to provide appropriate levels of reimbursement for the use of our implants, revenues could be adversely affected.
The impact of United States healthcare reform legislation on our business remains uncertain. In 2010 federal legislation to reform the United States healthcare system was enacted into law. The legislation is far-reaching and is intended to expand access to health insurance coverage, improve the quality and reduce the costs of healthcare over time. Its provisions have become effective at various dates, and will continue to do so, and there are many programs and requirements for which the details have not been determined. We expect the law will have a significant impact upon various aspects of our business operations. Among other things, the law imposes a 2.3 percent excise tax on Class I, II and III medical devices that applies to United States sales of a majority of our metal and synthetic medical device products. Other provisions of this legislation, including Medicare provisions aimed at improving quality and decreasing costs, comparative effectiveness research, an independent payment advisory board, and pilot programs to evaluate alternative payment methodologies, could meaningfully change the way healthcare is designed and delivered. Further, we cannot predict what other healthcare programs and regulations will be ultimately implemented at the federal or state level or the effect of any future legislation or regulation in the United States. However, any change that lowers reimbursements for our implants or reduces medical procedure volumes could adversely affect our business and results of operations.
If we fail to maintain the high processing standards that implants require or if we are unable to develop processing capacity as required, our commercial opportunity will be reduced or eliminated.
Implants require careful calibration and precise, high-quality processing. Achieving precision and quality control requires skill and diligence by our personnel. If we fail to achieve and maintain these high processing standards, including avoiding processing errors, and, depending on the nature of the complaint, design defects or component failures; we could be forced to recall, withdraw or suspend distribution of our implants; our implants and technologies could fail quality assurance and performance tests; production and deliveries of our implants could be delayed or cancelled and our processing costs could increase.
Further, to be successful, we will need to manage our human tissue processing capacity related to tissue recovery and demand for our allografts. It may be difficult for us to match our processing capacity to demand due to problems related to the amount of suitable tissue, quality control and assurance, tissue availability, adequacy of control policies and procedures and lack of skilled personnel. If we are unable to process and produce our implants on a timely basis, at acceptable quality and costs, and in sufficient quantities, or if we experience unanticipated technological problems or delays in processing, it may reduce revenues and increase our cost per allograft processed or both.
We operate in a highly regulated industry. An inability to meet current or future regulatory requirements in the U.S. or foreign jurisdictions, or any deficiencies with our manufacturing or quality systems and processes identified by regulatory agencies, could disrupt our business, subject us to regulatory action and costly litigation, damage our reputation for high quality production, cause a loss of confidence in the company and our implants and negatively impact our financial position and operating results.
The FDA and several states have statutory authority to regulate allograft processing, including our BioCleanse® and TUTOPLAST® processes, and allograft-based materials. We must register our facilities, whether located in the United States or elsewhere, with the FDA as well as regulators outside the U.S., and our implants must be made in a manner consistent with cGTP or similar standards in each jurisdiction in which we manufacture. In addition, the FDA and other agencies perform periodic audits to ensure that our facilities remain in compliance with all appropriate regulations, including primarily the quality system regulations and medical
14
Table of Contents
device reporting regulations. Following an inspection, an agency may issue a notice listing conditions that are believed to violate cGTP or other regulations (such as a FDA report on Form 483, Notice of Observations), or a warning letter for violations of “regulatory significance” that may result in enforcement action if not promptly and adequately corrected. For example, in June and July 2012, the FDA performed a cGTP inspection of our processing facility in Alachua, Florida to audit our compliance with cGTP requirements. The inspection was not related to a specific implant. At the conclusion of the audit, the FDA inspectors issued a Form FD483, primarily related to environmental monitoring activities in certain areas of our Alachua facility. We provided timely and detailed responses to the FD483, including commitments and timelines for the remediation of the conditions cited by the FDA. In October 2012, we received a warning letter related to some of the FD483 inspectional findings in which the FDA raised certain remaining questions and concerns. We responded to the issues cited in the warning letter and submitted information to the FDA to address its concerns. In October 2013, we received a final close out letter from the FDA to formally resolve their concerns. The warning letter did not restrict our ability to process or distribute implants, nor did it require the withdrawal of any implants from the marketplace. However, the FDA could identify other deficiencies in future inspections of our facilities or those of our suppliers.
Since 2009, the FDA has significantly increased its oversight of companies subject to its regulations, including medical device companies, by hiring new investigators and stepping up inspections of manufacturing facilities. In recent years, the FDA has also significantly increased the number of warning letters issued to companies. If the FDA were to conclude that we are not in compliance with applicable laws or regulations, or that any of our implants are ineffective or pose an unreasonable health risk, the FDA could ban such implants, detain or seize adulterated or misbranded implants, order a recall, repair, replacement, or refund of such implants, refuse to grant pending premarket approval applications or require certificates of foreign governments for exports and/or require us to notify health professionals and others that the implants present unreasonable risks of substantial harm to the public health. The FDA may also impose operating restrictions, enjoin and restrain certain violations of applicable law pertaining to medical devices and assess civil or criminal penalties against our officers, employees or us. The FDA may also recommend prosecution to the Department of Justice. Any adverse regulatory action, depending on its magnitude, may restrict us from effectively marketing and selling our implants. Any inability to meet current or future regulatory requirements in the United States or foreign jurisdictions, or any deficiencies with our manufacturing or quality systems and processes identified by regulatory agencies could disrupt our business, subject us to regulatory action and costly litigation, damage our reputation for high quality production, cause a loss of confidence in the company and our implants and negatively impact our financial position and operating results.
If any of our allografts fall under the FDA’s definitions of “more than minimally manipulated or indicated for non-homologous use,” we would be required to obtain medical device approval or clearance or biologics licenses, which could require clinical testing and could result in disapproval of our license applications and restricted distribution of any of our allografts which may become subject to pre-market approval. The FDA could require post-market testing and surveillance to monitor the effects of such allografts, could restrict the commercial applications of these allografts, and could conduct periodic inspections of our facilities and our suppliers. Delays encountered during the FDA approval process could shorten the patent protection period during which we have the exclusive right to commercialize such technologies or could allow others to come to market before us with similar technologies.
cGTP covers all stages of allograft processing, from procurement of tissue to distribution of final allografts. In addition, these regulations have a significant effect upon recovery agencies which supply us with tissue and have increased the cost of recovery activities. These increases have translated into increased costs for us, because we are expected to reimburse the recovery agencies based on their cost of recovery.
In addition to the FDA, several state agencies regulate tissue banking. Regulations issued by Florida, New York, California and Maryland are particularly relevant to our business. Most states do not currently have tissue banking regulations, but it is possible that others may make allegations against us or against donor recovery groups or tissue banks, including those with which we have relationships, about non-compliance with applicable
15
Table of Contents
FDA regulations or other relevant statutes and regulations. Allegations like these could cause regulators or other authorities to take investigative or other action, or could cause negative publicity for our business and the industry in which we operate.
Some of our implants contain tissue derived from animals, commonly referred to as xenografts. Xenograft implants are medical devices that are subject to pre-market approval or clearance by the FDA. We have received FDA clearance on several xenograft implants. However, we may not receive FDA approval or clearance to market new implants as we attempt to expand the quantity of xenograft implants available for distribution.
The allograft industry is subject to additional local, state, federal and international government regulations and any increased regulations of our activities could significantly increase the cost of doing business, thereby reducing profitability.
Some aspects of our business are subject to additional local, state, federal or international regulation. Changes in the laws or new interpretations of existing laws could negatively affect our business, revenues or prospects, and increase the costs associated with conducting our business. In particular, the procurement and transplantation of allograft tissue is subject to federal regulation under the National Organ Transplant Act (“NOTA”), a criminal statute that prohibits the purchase and sale of human organs, including bone and other tissue. NOTA permits the payment of reasonable fees associated with the transportation, processing, preservation, quality control and storage of human tissue. If NOTA were amended or interpreted in a way that made us unable to include some of these costs in the amounts we charge our customers, it could reduce our revenues and therefore negatively impact our business. It is possible that more restrictive interpretations or expansions of NOTA could be adopted which could require us to change one or more aspects of our business, at a substantial cost, in order to continue to comply with this statute.
A variety of additional local, state, federal and international government laws and regulations govern our business, including those relating to the storage, handling, generation, manufacture and disposal of medical wastes from the processing of tissue and collaborations with health care professionals. If we fail to conduct our business in compliance with these laws and regulations, we could be subject to significant liabilities for which our insurance may not be adequate. Moreover, such insurance may not always be available in the future on commercially reasonable terms, if at all. If our insurance proves to be inadequate to pay a damage award, we may not have sufficient funds to do so, which would harm our financial condition and liquidity.
Our success depends on the continued acceptance of our surgical implants and technologies by the medical community.
New allograft, xenograft, metal or synthetic implants, technologies or enhancements to our existing implants may never achieve broad market acceptance, which can be affected by numerous factors, including lack of clinical acceptance of implants and technologies; introduction of competitive treatment options which render implants and technologies too expensive or obsolete; lack of availability of third-party reimbursement; and difficulty training surgeons in the use of tissue implants and technologies.
Market acceptance will also depend on our ability to demonstrate that our existing and new implants and technologies are an attractive alternative to existing treatment options. Our ability to do so will depend on surgeons’ evaluations of the clinical safety, efficacy, ease of use, reliability and cost-effectiveness of these treatment options and technologies. For example, we believe that some in the medical community have lingering concerns over the risk of disease transmission through the use of allografts.
Furthermore, we believe that even if the medical community generally accepts our implants and technologies, acceptance and recommendations by influential surgeons will be important to their broad commercial success. If our implants and technologies are not broadly accepted in the marketplace, we may not remain competitive in the market.
16
Table of Contents
Rapid technological changes could result in reduced demand for our implants and products.
Technologies change rapidly in the industry in which we operate. For example, steady improvements have been made in synthetic human tissue substitutes which compete with our tissue implants. Unlike allografts, synthetic tissue technologies are not dependent on the availability of tissue. If one of our competitors successfully introduces synthetic technologies using recombinant technologies, which stimulate the growth of tissue surrounding an implant, it could result in a decline in demand for tissue implants. We may not be able to respond effectively to technological changes and emerging industry standards, or to successfully identify, develop or support new technologies or enhancements to existing implants in a timely and cost-effective manner, if at all. If we are unable to achieve the improvements in our implants necessary for their successful commercialization, the demand for our implants will suffer.
We face intense competition, which could result in reduced acceptance and demand for our implants and technologies.
The medical technology/biotechnology industry is intensely competitive. We compete with companies in the United States and internationally that engage in the development and production of medical technologies and processes including biotechnology, orthopedic, pharmaceutical, biomaterial and other companies; academic and scientific institutions; and public and private research organizations.
Many of our competitors have much greater financial, technical, research, marketing, distribution, service and other resources than ours. Moreover, our competitors may offer a broader array of tissue repair treatment products and technologies or may have greater name recognition in the marketplace. For example, we compete with a number of divisions of Johnson & Johnson, a company with significantly greater resources and brand recognition than ours. Our competitors, including several development stage companies, may develop or market technologies that are more effective or commercially attractive than our technologies, or that may render our technologies obsolete. For example, the development of a synthetic tissue implant that permits remodeling of bones could reduce the demand for allograft and xenograft-based implants and technologies.
If we do not manage the medical release of donor tissue into processing in an effective and efficient manner, it could adversely affect profitability.
Many factors affect the level and timing of donor medical releases, including the effectiveness of donor screening performed by donor recovery groups, the timely receipt, recording and review of required medical documentation, and employee loss and turnover in our medical records department. We can provide no assurance that releases will occur at levels which maximize our processing efficiency and minimize our cost per allograft processed.
Negative publicity concerning methods of human tissue recovery and screening of donor tissue in the industry in which we operate may reduce demand for our allografts and impact the supply of available donor tissue.
Media reports or other negative publicity concerning both methods of tissue recovery from donors and actual or potential disease transmission from donated tissue may limit widespread acceptance of our allografts, whether directed to allografts generally or our allografts specifically. Unfavorable reports of improper or illegal tissue recovery practices by any participant in the industry, both in the United States and internationally, as well as incidents of improperly processed tissue leading to transmission of disease, may broadly affect the rate of future tissue donation and market acceptance of allograft technologies.
Potential patients may not be able to distinguish our allografts, technologies and the tissue recovery and the processing procedures from those of our competitors or others engaged in tissue recovery. In addition, families of potential donors may become reluctant to agree to donate tissue to for-profit tissue processors.
17
Table of Contents
If our patents and the other means we use to protect our intellectual property prove to be inadequate, our competitors could exploit our intellectual property to compete more effectively against us.
The law of patents and trade secrets is constantly evolving and often involves complex legal and factual questions. The U.S. government may deny or significantly reduce the coverage we seek for our patent applications before or after a patent is issued. We cannot be sure that any particular patent for which we apply will be issued, that the scope of the patent protection will be comprehensive enough to provide adequate protection from competing technologies, that interference, derivation, reexamination, post-grant review or inter parties review proceedings regarding any of our patent applications will not be filed, or that we will achieve any other competitive advantage from a patent. In addition, it is possible that one or more of our patents will be held invalid or reduced in scope of claims if challenged or that others will claim rights in or ownership of our patents and other proprietary rights. If any of these events occur, our competitors may be able to use our intellectual property to compete more effectively against us.
Because patent applications remain secret until published (typically 18 months after first filing) and the publication of discoveries in the scientific or patent literature often lag behind actual discoveries, we cannot be certain that our patent application was the first application filed disclosing or potentially covering a particular invention. If another party’s rights to an invention are superior to ours, we may not be able to obtain a license to use that party’s invention on commercially reasonable terms, if at all. In addition, our competitors, many of which have greater resources than ours, could obtain patents that will prevent, limit or interfere with our ability to make use of our inventions either in the United States or in international markets. Further, the laws of some foreign countries do not always protect our intellectual property rights to the same extent as the laws of the United States. Litigation or regulatory proceedings in the United States or foreign countries also may be necessary to enforce our patent or other intellectual property rights or to determine the scope and validity of the proprietary rights of our competitors. These proceedings can be costly, result in development delays, and divert the attention of our management.
We rely upon unpatented proprietary techniques and processes in tissue recovery, research and development, tissue processing, manufacturing and quality assurance. It is possible that others will independently develop technology similar to our technology or otherwise gain access to or disclose our proprietary technologies. We may not be able to meaningfully protect our rights in these proprietary technologies, which would reduce our ability to compete.
Our success depends in part on our ability to operate without infringing on or misappropriating the proprietary rights of others, and if we are unable to do so we may be liable for damages.
We cannot be certain that U.S. or foreign patents or patent applications of other companies do not exist or will not be issued that would prevent us from commercializing our allografts, xenografts, surgical implants and other technologies. Third parties may sue us for infringing or misappropriating their patent or other intellectual property rights. Intellectual property litigation is costly. If we do not prevail in litigation, in addition to any damages we might have to pay, we could be required to cease the infringing activity or obtain a license requiring us to make royalty payments. It is possible that a required license may not be available to us on commercially acceptable terms, if at all. In addition, a required license may be non-exclusive, and therefore our competitors may have access to the same technology licensed to us. If we fail to obtain a required license or are unable to design around another company’s patent, we may be unable to make use of some of the affected technologies or distribute the affected allografts, xenografts or surgical implants, which would reduce our revenues.
The defense costs and settlements for patent infringement lawsuits are not covered by insurance. Patent infringement lawsuits can take years to settle. If we are not successful in our defenses or are not successful in obtaining dismissals of any such lawsuit, legal fees or settlement costs could have a material adverse effect on our results of operations and financial position.
18
Table of Contents
We or our competitors may be exposed to product or professional liability claims which could cause us to be liable for damages or cause investors to think we will be liable for similar claims in the future.
The development of allografts and technologies for human tissue repair and treatment entails an inherent risk of product or professional liability claims, and substantial product or professional liability claims may be asserted against us. We are party to a number of legal proceedings relating to professional liability. The prevailing view among the states throughout the United States is that providing allografts is a service and not the sale of a product. As such, allografts are not subject to product liability causes of action. However, the law of a particular state could change in response to legislative changes or by judicial interpretation in a state where such issue has either not been previously addressed or prior precedent is overturned or subject to different interpretations by a court of higher precedential authority. In addition, due to the international scope of our activities we are subject to international laws which may treat allografts as products in those jurisdictions.
The implantation of donated human tissue implants creates the potential for transmission of communicable diseases. Although we comply with federal, state and foreign regulations and guidelines intended to prevent communicable disease transmission, and our tissue suppliers are also required to comply with such regulations, there can be no assurances that: (i) our tissue suppliers will comply with such regulations intended to prevent communicable disease transmissions; (ii) even if such compliance is achieved, that our implants have not been or will not be associated with transmission of disease; or (iii) a patient otherwise infected with disease would not erroneously assert a claim that the use of our implants resulted in disease transmission.
We currently have $20 million of product and professional liability insurance to cover claims. This amount of insurance may not be adequate for potential claims if we are not successful in our defenses. Moreover, insurance covering our business may not always be available in the future on commercially reasonable terms, if at all. If our insurance proves to be inadequate to pay a damage award, we may not have sufficient funds to do so, which would harm our financial condition and liquidity. In addition, successful product liability claims made against one of our competitors could cause claims to be made against us or expose us to a perception that we are vulnerable to similar claims. Claims against us, regardless of their merit or potential outcome, may also hurt our ability to obtain surgeon acceptance of our allografts or to expand our business.
We are subject to federal, state and foreign laws and regulations, including fraud and abuse laws, as well as anti-bribery laws, and could face substantial penalties if we fail to fully comply with such regulations and laws.
Our relationship with foreign and domestic government entities and healthcare professionals, such as physicians, hospitals and those to whom and through whom we may market our implants and technologies, are subject to scrutiny under various federal, state and territorial laws in the United States and other jurisdictions in which we conduct business. These include, for example, anti-kickback laws, physician self-referral laws, false claims laws, criminal health care fraud laws, and anti-bribery laws (e.g., the United States Foreign Corrupt Practices Act). Violations of these laws are punishable by criminal and/or civil sanctions, including, in some instances, fines, imprisonment and, within the United States, exclusion from participation in government healthcare programs, including Medicare, Medicaid and Veterans Administration health programs. These laws are administered by, among others, the U.S. Department of Justice, the Office of Inspector General of the Department of Health and Human Services, state attorneys general, and their respective counterparts in the applicable foreign jurisdictions in which we conduct business. Many of these agencies have increased their enforcement activities with respect to medical device manufacturers in recent years.
If we are not successful in expanding our distribution activities into international markets, we will not be able to pursue one of our strategies for increasing revenues.
Our international distribution strategies vary by market, as well as within each country in which we operate. For example, we distribute only a portion of our line of allograft and xenograft implants within each country. Our
19
Table of Contents
international operations will be subject to a number of risks which may vary from the risks we face in the United States, including the need to obtain regulatory approvals in additional foreign countries before we can offer our implants and technologies for use; the potential burdens of complying with different foreign laws; longer distribution-to-collection cycles, as well as difficulty in collecting accounts receivable; dependence on local distributors; limited protection of intellectual property rights; fluctuations in the values of foreign currencies; and political and economic instability.
The outcome of litigation or arbitration in which we are involved is unpredictable and an adverse decision in any such matter could adversely impact our business, financial condition or results of operations.
We are from time to time subject to legal proceedings and claims that arise in the ordinary course of business. For example, we were named as a party, along with a number of other recovery and processor defendants, in lawsuits relating to the tissue recovery practices of Biomedical Tissue Service, Ltd. (“BTS”), an unaffiliated recovery agency. We settled the BTS cases in 2012 and 2013 for payments of $2.4 million and $3.0 million. Accordingly, we recorded a litigation settlement charge of $3 million in the second quarter of 2013.
In addition, Lanx, Inc., a subsidiary of Biomet, Inc. (“Lanx”), filed suit in the second quarter of 2013 against Pioneer in the U.S. District Court, District of Colorado, alleging that one of our medical devices infringed certain of Lanx’s U.S. intellectual property rights, and sought monetary damages and threatened injunctive relief. In the second quarter of 2014, the parties resolved the claim with no material financial impact to us or our operations. As part of the resolution of the claim, a settlement payment of $325,000 was made to Lanx from the indemnification escrow account.
An adverse resolution of lawsuits or arbitrations could adversely impact our business, financial condition or results of operations.
Any acquisitions we make may require the issuance of a significant amount of equity or debt securities and may not be scientifically or commercially successful.
As part of our business strategy, we may make certain acquisitions to obtain additional businesses, product and/or process technologies, capabilities and personnel. If we make one or more significant acquisitions in which the consideration includes securities, we may be required to issue a substantial amount of equity, debt, warrants, convertible instruments or other similar securities. Such an issuance could dilute your investment in our common stock or increase our interest expense and other expenses.
Further, acquisitions involve a number of operational risks, such as:
| • | difficulty and expense of assimilating the operations, technology and personnel of the acquired business; |
| • | our inability to retain the management, key personnel and other employees of the acquired business; |
| • | our inability to maintain the acquired company’s relationship with customers and key third parties, such as alliance partners; |
| • | exposure to legal claims for activities of the acquired business prior to the acquisition; |
| • | the potential need to implement financial and other systems and add management resources; |
| • | the potential for internal control deficiencies in the internal controls of the acquired operations; |
| • | potential inexperience in a business area that is either new to us or more significant to us than prior to the acquisition; |
| • | the diversion of our management’s attention from our core business; and |
| • | the potential impairment of goodwill and write-off of in-process research and development costs, adversely affecting our reported results of operations. |
20
Table of Contents
Any one of these risks could prevent an acquisition from being scientifically or commercially successful, which could have a material impact on our results of operations not only with respect to the operations of the acquired company but with respect to us on a consolidated basis.
Water Street may exercise significant influence over us, including through its ability to elect up to two members of our Board of Directors.
Holders of the Series A convertible preferred stock (“Preferred Stock”) are entitled to vote on an as-converted basis upon all matters upon which holders of our common stock have the right to vote. The shares of Preferred Stock owned by Water Street currently represent approximately 18% of the voting rights in respect of our share capital on an as-converted basis; accordingly, Water Street has the ability to significantly influence the outcome of any matter submitted for the vote of our stockholders. In addition, to the extent dividends are not paid in cash in any quarter for any reason, including any restriction on making such distributions under the terms of our credit agreement with TD Bank (as discussed below), the dividends which have accrued on each outstanding share of Preferred Stock during such three-month period shall be accumulated and shall be added to the liquidation value with respect to such share of Preferred Stock. For example, in the fourth quarter of 2013 and throughout 2014, we did not pay dividends on the Preferred Stock, consequently we have accrued $3.9 million in preferred dividends payable as of December 31, 2014. To the extent dividends continue to accrue on the Preferred Stock, Water Street’s voting rights in respect of our share capital on an as-converted basis will continue to increase.
Water Street may have interests that diverge from, or even conflict with, those of our other stockholders. In addition, our Amended and Restated Certificate of Incorporation and Investor Rights Agreement with Water Street provide that Water Street’s consent is required before we may take certain actions for so long as Water Street and its permitted transferees beneficially own in the aggregate at least 10% of our issued share capital.
In addition, our Amended and Restated Certificate of Incorporation and our Investor Rights Agreement with Water Street provide that Water Street has the right to designate and nominate, respectively, directors to our Board of Directors such that the percentage of our board members so designated or nominate is approximately equal to Water Street’s percentage equity ownership interest in the company. The maximum number of directors that Water Street is able to designate or nominate is two, with at least one of such directors to serve on each of our Board committees. If Water Street’s ownership of our share capital on an as-converted basis falls below 5% (calculated on a fully diluted basis, assuming conversion of the Preferred Stock at the then-existing conversion price), Water Street would have no further director designation or nomination rights under our Amended and Restated Certificate of Incorporation or the investor rights agreement.
In addition, the ownership position and the governance rights of Water Street could discourage a third party from proposing a change of control or other strategic transaction with us.
Our level of indebtedness that we incurred in connection with the acquisition of Pioneer could adversely affect our ability to raise additional capital to fund our operations, limit our ability to react to changes in the economy or our industry and prevent us from meeting our obligations under the agreements relating to our indebtedness.
In connection with the closing of the acquisition, we obtained from our lenders a 5-year, $80 million senior secured facility, which includes a $60 million term loan and a $20 million revolving credit facility. Additionally, we issued Preferred Stock to Water Street for $50 million in gross proceeds. The Preferred Stock accrues dividends at a rate of 6% per annum. Dividends are payable in cash on a quarterly basis for each outstanding share of Preferred Stock. To the extent dividends are not paid in cash in any quarter, the dividends which have accrued on each outstanding share of Preferred Stock during such three-month period shall be accumulated and shall be added to the liquidation value with respect to such share of Preferred Stock. In the fourth quarter of 2013
21
Table of Contents
and throughout 2014, we did not pay dividends on the Preferred Stock, consequently we have accrued $3.9 million in preferred dividends payable as of December 31, 2014, which has been added to the liquidation value with respect to the Preferred Stock.
Our ability to pay dividends and to make distributions may be limited or prohibited by the terms of our indebtedness or Preferred Stock.
We are, and may in the future become, party to agreements and instruments that restrict or prevent the payment of dividends on our capital stock. Under the terms of our credit agreement with TD Bank, we are restricted from paying dividends on our common stock without the prior written consent of the administrative agent. We are also restricted from paying dividends or making distributions on our common stock without the prior written consent of the holders of a majority of the Preferred Stock pursuant to the terms of the Certificate of Designation of Series A Convertible Preferred Stock, so long as any shares of the Preferred Stock remain outstanding. In addition, under the terms of our credit agreement with TD Bank, distributions to holders of our Preferred Stock are permitted only to the extent that we can satisfy certain financial covenant tests (based on the ratio of our total indebtedness to consolidated EBITDA) and meet other requirements. In the event that we fail to pay the accrued dividends payable on our Preferred Stock for any reason, including any restriction on making such distributions under the terms of our credit agreement with TD Bank, dividends payable will continue to accrue on such Preferred Stock.
Our credit agreement contains financial and operating restrictions that may limit our access to credit. If we fail to comply with financial or other covenants in our credit agreement, we may be required to repay indebtedness to our existing lenders, which may harm our liquidity.
Provisions in our credit agreement impose restrictions on our ability to, among other things:
| • | merge or consolidate; |
| • | make strategic acquisitions; |
| • | make dispositions of property; |
| • | create liens; |
| • | enter into transactions with affiliates; |
| • | become a guarantor; |
| • | pay dividends and make distributions (as described above); |
| • | incur more debt; and |
| • | make investments. |
Our credit agreement also contains financial covenants that require us to maintain compliance with specified financial ratios and maintain a specified amount of cash on hand.
We may not be able to comply with the financial covenants in the future. In the absence of a waiver from our lenders, any failure by us to comply with these covenants in the future may result in the declaration of an event of default, which could prevent us from borrowing under our credit agreement. In addition to preventing additional borrowings under our credit agreement, an event of default, if not cured or waived, may result in the acceleration of the maturity of indebtedness outstanding, if any, under the agreement, which would require us to pay all amounts outstanding. If an event of default occurs, we may not be able to cure it within any applicable cure period, if at all. If the maturity of our indebtedness is accelerated, we then may not have sufficient funds available for repayment or the ability to borrow or obtain sufficient funds to replace the accelerated indebtedness on terms acceptable to us, or at all. For example, in December 2013, we entered into an amendment to the credit
22
Table of Contents
agreement which, in part, modified certain financial covenants so that we could maintain compliance with the financial ratios. In October 2014, we entered into a second amendment to the second amended and restated loan agreement with TD Bank, N.A. and Regions Bank, which amended the loan agreement to remove certain financial covenants.
| Item 1B. | UNRESOLVED STAFF COMMENTS. |
None.
| Item 2. | PROPERTIES. |
UNITED STATES
Our headquarters and U.S natural tissue processing facilities are located in Alachua, Florida, near metropolitan Gainesville, including five buildings on approximately 23 acres of property that we own.
Processing, Manufacturing and Laboratory Facilities
In Alachua, Florida, we own a 65,000 square foot processing facility and lease a 23,000 square foot facility for the processing of natural tissues utilizing our BioCleanse® and TUTOPLAST® and CANCELLE® SP sterilization processes. In addition, we also own a 42,000 square foot logistics and technology center and lease and additional 3,600 square feet of laboratory space and lease 6,000 square feet of warehouse space.
In Marquette, Michigan, we own a 110,000 square foot facility for manufacturing metal and synthetic implants and instruments that also houses laboratory facilities.
In Greenville, North Carolina, we lease a 15,000 square foot facility for manufacturing synthetic implants.
Our processing and manufacturing facilities, meet the FDA’s Current Good Manufacturing Practices requirements and allows us to meet the requirements of an FDA approved medical device manufacturer.
Administrative and Distribution and Marketing Offices
In Alachua, Florida, we own three buildings totaling 86,000 square feet which house our corporate headquarters as well as administrative and distribution and marketing functions.
In Jacksonville, Florida, we lease 5,300 square feet for distribution and marketing functions.
In Austin, Texas, we lease 10,600 square feet for distribution, marketing and research and development functions.
GERMANY
Our facility in Neunkirchen consists of six buildings totaling approximately 58,000 square feet on approximately two acres of land, including 11,000 square feet of area for processing natural tissues utilizing the TUTOPLAST sterilization process.
FRANCE
Our facility in Metz consists of a small leased distribution office.
THE NETHERLANDS
Our facility in Houten consists of a small leased sales and distribution office.
23
Table of Contents
SINGAPORE
Our facility in Singapore consists of a small leased administrative and sales office.
We believe that we have sufficient space and facilities to meet our current and foreseeable future needs.
| Item 3. | LEGAL PROCEEDINGS. |
Information with respect to legal proceedings can be found in Note 22, Legal and Regulatory Actions, to the consolidated financial statements contained in Part II, Item 8 of this report and is hereby incorporated by reference herein.
24
Table of Contents
PART II
| Item 5. | MARKET FOR REGISTRANT’S COMMON EQUITY, RELATED STOCKHOLDER MATTERS AND ISSUER PURCHASES OF EQUITY SECURITIES |
Market Information and Holders
Our common stock is quoted on the Nasdaq Stock Market under the symbol “RTIX.” The following table sets forth the range of high and low sales prices for our common stock for each quarterly period in the last two fiscal years.
| 2013 |
High | Low | ||||||
| First Quarter |
$ | 4.95 | $ | 3.59 | ||||
| Second Quarter |
$ | 4.48 | $ | 3.64 | ||||
| Third Quarter |
$ | 4.28 | $ | 3.33 | ||||
| Fourth Quarter |
$ | 3.96 | $ | 2.79 | ||||
| 2014 |
High | Low | ||||||
| First Quarter |
$ | 4.46 | $ | 3.00 | ||||
| Second Quarter |
$ | 5.00 | $ | 3.61 | ||||
| Third Quarter |
$ | 5.58 | $ | 4.09 | ||||
| Fourth Quarter |
$ | 5.67 | $ | 3.50 | ||||
As of February 17, 2015, we had 337 stockholders of record of our common stock. The closing sale price of our common stock on February 17, 2015 was $5.23 per share.
25
Table of Contents
Stock Performance Graph
The Securities and Exchange Commission requires us to present a chart comparing the cumulative total stockholder return on our common stock with the cumulative total stockholder return of: (1) a broad equity market index and (2) a published industry or line-of-business index. We selected the Standard & Poor’s 500 Health Care Equipment Index based on our good faith determination that this index fairly represents the companies which compete in the same industry or line-of-business as we do. The chart below compares our common stock with the Nasdaq Composite Index and the Standard & Poor’s 500 Health Care Equipment Index and assumes an investment of $100.00 on December 31, 2009 in each of the common stock, the stocks comprising the Nasdaq Composite Index and the stocks comprising the Standard & Poor’s 500 Health Care Equipment Index.
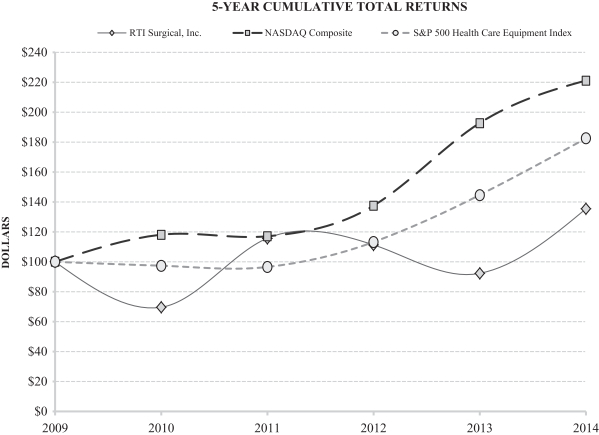
| Total Return Analysis |
12/09 | 12/10 | 12/11 | 12/12 | 12/13 | 12/14 | ||||||||||||||||||
| RTI Surgical, Inc. |
$ | 100.00 | $ | 69.53 | $ | 115.63 | $ | 111.20 | $ | 92.19 | $ | 135.42 | ||||||||||||
| NASDAQ Composite |
100.00 | 118.02 | 117.04 | 137.47 | 192.62 | 221.02 | ||||||||||||||||||
| S&P 500 Health Care Equipment Index |
100.00 | 97.29 | 96.51 | 113.18 | 144.52 | 182.49 | ||||||||||||||||||
Dividend Policy
We have never paid cash dividends to holders of our common stock. We do not expect to declare or pay any dividends on our common stock in the foreseeable future. Other than the possibility that we may pay dividends on our preferred stock, we intend to retain all earnings, if any, to invest in our operations. The payment of future dividends, if any, will depend upon our future earnings, if any, our capital requirements, financial condition, debt covenant terms, and other relevant factors. Under our current credit agreement with TD Bank, we are restricted from paying dividends on our common stock without the prior written consent of the administrative agent. In addition, pursuant to the terms of the Certificate of Designation of Series A Convertible Preferred Stock, so long as any shares of the Preferred Stock remain outstanding, we may not pay any dividend or make any distribution upon any junior securities (including the common stock) without the prior written consent of the holders of a majority of the Preferred Stock.
26
Table of Contents
| Item 6. | SELECTED FINANCIAL DATA. |
The statement of operations data set forth below for the years ended December 31, 2014, 2013 and 2012, and selected balance sheet data as of December 31, 2014 and 2013 have been derived from our audited consolidated financial statements and accompanying notes. The consolidated financial statements as of December 31, 2014 and 2013 and for the three years ended December 31, 2014 are included elsewhere in this Form 10-K. The selected consolidated financial data set forth below should be read along with “Item 7. Management’s Discussion and Analysis of Financial Condition and Results of Operations,” and our consolidated financial statements and accompanying notes included elsewhere in this document.
The statement of operations data set forth below for the years ended December 31, 2011 and 2010, and the balance sheet data set forth as of December 31, 2012, 2011 and 2010 have been derived from our audited consolidated financial statements and accompanying notes which are not included elsewhere in this Form 10-K.
| Year Ended December 31, | ||||||||||||||||||||
| 2014 | 2013 | 2012 | 2011 | 2010 | ||||||||||||||||
| (In thousands, except share and per share data) | ||||||||||||||||||||
| Statements of Operations Data: |
||||||||||||||||||||
| Revenues |
$ | 262,810 | $ | 197,979 | $ | 178,113 | $ | 169,316 | $ | 166,171 | ||||||||||
| Costs of processing and distribution |
129,013 | 117,874 | 92,896 | 92,102 | 90,168 | |||||||||||||||
|
|
|
|
|
|
|
|
|
|
|
|||||||||||
| Gross profit |
133,797 | 80,105 | 85,217 | 77,214 | 76,003 | |||||||||||||||
|
|
|
|
|
|
|
|
|
|
|
|||||||||||
| Expenses: |
||||||||||||||||||||
| Marketing, general and administrative |
107,653 | 81,635 | 58,376 | 55,576 | 59,232 | |||||||||||||||
| Research and development |
15,536 | 15,241 | 12,231 | 9,806 | 9,435 | |||||||||||||||
| Asset abandonments |
— | — | 20 | 61 | 30 | |||||||||||||||
| Goodwill impairment |
— | — | — | — | 134,681 | |||||||||||||||
| Litigation settlement |
185 | 3,000 | 2,350 | — | — | |||||||||||||||
| Restructuring charges |
— | 2,881 | — | — | — | |||||||||||||||
| Acquisition expenses |
— | 6,004 | — | — | — | |||||||||||||||
| Severance charges |
4,798 | — | — | — | — | |||||||||||||||
|
|
|
|
|
|
|
|
|
|
|
|||||||||||
| Total operating expenses |
128,172 | 108,761 | 72,977 | 65,443 | 203,378 | |||||||||||||||
|
|
|
|
|
|
|
|
|
|
|
|||||||||||
| Operating income (loss) |
5,625 | (28,656 | ) | 12,240 | 11,771 | (127,375 | ) | |||||||||||||
|
|
|
|
|
|
|
|
|
|
|
|||||||||||
| Other (expense) income: |
||||||||||||||||||||
| Interest expense |
(1,357 | ) | (542 | ) | — | (201 | ) | (537 | ) | |||||||||||
| Interest income |
9 | 23 | 185 | 193 | 114 | |||||||||||||||
| Foreign exchange (loss) gain |
(88 | ) | 251 | 19 | (159 | ) | 4 | |||||||||||||
|
|
|
|
|
|
|
|
|
|
|
|||||||||||
| Total other (expense) income—net |
(1,436 | ) | (268 | ) | 204 | (167 | ) | (419 | ) | |||||||||||
|
|
|
|
|
|
|
|
|
|
|
|||||||||||
| Income (loss) before income tax benefit (provision) |
4,189 | (28,924 | ) | 12,444 | 11,604 | (127,794 | ) | |||||||||||||
| Income tax (provision) benefit |
(1,493 | ) | 11,110 | (4,042 | ) | (3,226 | ) | (1,605 | ) | |||||||||||
|
|
|
|
|
|
|
|
|
|
|
|||||||||||
| Net income (loss) |
2,696 | (17,814 | ) | 8,402 | 8,378 | (129,399 | ) | |||||||||||||
|
|
|
|
|
|
|
|
|
|
|
|||||||||||
| Convertible preferred dividend |
(3,113 | ) | (1,375 | ) | — | — | — | |||||||||||||
|
|
|
|
|
|
|
|
|
|
|
|||||||||||
| Net (loss) income applicable to common shares |
$ | (417 | ) | $ | (19,189 | ) | $ | 8,402 | $ | 8,378 | $ | (129,399 | ) | |||||||
|
|
|
|
|
|
|
|
|
|
|
|||||||||||
| Net (loss) income per common share—basic |
$ | (0.01 | ) | $ | (0.34 | ) | $ | 0.15 | $ | 0.15 | $ | (2.36 | ) | |||||||
|
|
|
|
|
|
|
|
|
|
|
|||||||||||
| Net (loss) income per common share—diluted |
$ | (0.01 | ) | $ | (0.34 | ) | $ | 0.15 | $ | 0.15 | $ | (2.36 | ) | |||||||
|
|
|
|
|
|
|
|
|
|
|
|||||||||||
| Weighted average shares outstanding—basic |
56,735,924 | 56,258,624 | 55,861,957 | 55,150,886 | 54,729,608 | |||||||||||||||
|
|
|
|
|
|
|
|
|
|
|
|||||||||||
| Weighted average shares outstanding—diluted |
56,735,924 | 56,258,624 | 56,068,795 | 55,354,675 | 54,729,608 | |||||||||||||||
|
|
|
|
|
|
|
|
|
|
|
|||||||||||
27
Table of Contents
| As of December 31, | ||||||||||||||||||||
| 2014 | 2013 | 2012 | 2011 | 2010 | ||||||||||||||||
| Balance Sheet Data: |
||||||||||||||||||||
| Cash and cash equivalents |
$ | 15,703 | $ | 18,721 | $ | 49,696 | $ | 46,178 | $ | 28,212 | ||||||||||
| Working capital |
133,510 | 134,302 | 129,110 | 124,064 | 125,629 | |||||||||||||||
| Total assets |
378,135 | 369,854 | 241,409 | 230,027 | 225,758 | |||||||||||||||
| Long-term obligations—less current portion |
69,413 | 67,706 | 4 | 143 | 1,877 | |||||||||||||||
| Total stockholders’ equity |
167,835 | 168,053 | 183,992 | 172,419 | 161,936 | |||||||||||||||
| Item 7. | MANAGEMENT’S DISCUSSION AND ANALYSIS OF FINANCIAL CONDITION AND RESULTS OF OPERATIONS. |
You should read the following discussion of our financial condition and results of operations together with those financial statements and the notes to those statements included elsewhere in this filing. This discussion contains forward looking statements based on our current expectations, assumptions, estimates and projections about us and our industry. Our actual results could differ materially from those anticipated in these forward looking statements. We undertake no obligation to update publicly any forward looking statements for any reason, even if new information becomes available or other events occur in the future.
Executive Level Overview:
RTI Surgical, Inc. together with its subsidiaries, designs, develops, manufactures and distributes surgical implants for use in a variety of surgical procedures. We are a leader in providing natural tissue implants as well as metal and synthetic implants for the benefit of surgeons and patients worldwide. We process donated human musculoskeletal and other tissues including bone, cartilage, tendons, ligaments, fascia lata, pericardium, sclera, cornea and dermal tissues, as well as bovine and porcine animal tissues to produce allograft and xenograft implants. We process the majority of our natural tissue implants using our proprietary BIOCLEANSE®, TUTOPLAST® and CANCELLE® SP sterilization processes. In addition, we manufacture, market and distribute metal and synthetic implants for treatment of spinal and other orthopedic disorders. Our implants are used in the fields of spine, sports medicine, ortho fixation, bone graft substitutes and general orthopedic, surgical specialties and dental. We distribute our implants to hospitals and surgeons in the United States and internationally through a direct distribution organization, as well as through a network of independent distributors. We were founded in 1997 and are headquartered in Alachua, Florida.
Domestic distributions and services accounted for 91% of total revenues in 2014. Most of our implants are distributed directly to doctors, hospitals and other healthcare facilities through a direct distribution force and through various strategic relationships.
International distributions and services accounted for 9% of total revenues in 2014. Our implants are distributed in over 45 countries through a direct distribution force in Germany and through stocking distributors in the rest of the world outside of Germany and the United States.
Our business is generally not seasonal in nature; however, the number of orthopedic implant surgeries and elective procedures generally declines during the summer months.
Our principal goals are to honor the gift of donated tissue, donor families and patients while building our competitive strength in the marketplace to increase revenues, profitability and cash flow as we focus on improved operational efficiency, productivity and asset management. We are making investments in new implant and product development and our U.S. direct distribution network to promote growth in 2015 and beyond.
We continue to maintain our commitment to research and development and the introduction of new strategically targeted allograft, xenograft, metal and synthetic implants as well as focused clinical efforts to support their acceptance in the marketplace. In addition, we consider strategic acquisitions from time to time for new implants and technologies intended to augment our existing implant offerings.
28
Table of Contents
Mergers and Acquisitions
On July 16, 2013, we completed our acquisition of Pioneer. Under the terms of the merger agreement dated June 12, 2013, we acquired Pioneer for $126.3 million in cash. The transaction was funded through a combination of cash on hand, a new credit facility and a concurrent private placement of convertible preferred equity. We obtained from Toronto-Dominion Bank, N.A., TD Securities “USA” LLC (“TD Bank”) and Regions Bank, a 5-year, $80.0 million senior secured facility, which includes a $60.0 million term loan and a $20.0 million revolving credit facility, that matures on July 16, 2018 with a variable interest rate between 100 and 300 basis points in excess of the one month LIBOR rate. The $20.0 million revolving credit facility replaced our previous $15.0 million U.S. credit facility. Additionally, we received $50.0 million in gross proceeds from a private placement of convertible preferred equity to Water Street Healthcare Partners, a leading healthcare-focused private equity firm. The convertible preferred stock is convertible into shares of our common stock. The convertible preferred stock also accrues dividends at a rate of 6% per year.
On December 28, 2012, our controlled entity, RTIDS acquired certain assets related to the tissue procurement operations of a third party donor recovery agency. The transaction was accounted for using the purchase method of accounting in accordance with Accounting Standards Codification (“ASC”) 805.
Critical Accounting Policies
The preparation of our financial statements in accordance with accounting principles generally accepted in the United States (“U.S. GAAP”) often requires us to make estimates and judgments that affect reported amounts. These estimates and judgments are based on historical experience and assumptions that we believe to be reasonable under the circumstances. Assumptions and judgments based on historical experience may provide reported results which differ from actual results; however, these assumptions and judgments historically have not varied significantly from actual experience and we therefore do not expect them to vary significantly in the future.
The accounting policies which we believe are “critical,” or require the most use of estimates and judgment, relate to the following items presented in our financial statements: 1) Tissue Inventory Valuation; 2) Accounts Receivable Allowances; 3) Long-Lived Assets; 4) Intangible Assets and Goodwill; 5) Revenue Recognition; 6) Stock-Based Compensation Plans; and 7) Income Taxes.
Tissue Inventory Valuation. U.S. GAAP requires that inventory be stated at the lower of cost or market value. Due to various reasons, some tissue within our inventory will never become available for distribution. Therefore, we must make estimates of future distribution from existing inventory in order to write-off inventory which will not be distributed and which therefore has reduced or no market value.
Our management reviews available information regarding processing costs, inventory distribution rates, industry supply and demand, medical releases and processed tissue rejections, in order to determine write-offs of cost above market value. For a variety of reasons, we may from time to time be required to adjust our assumptions as processes change and as we gain better information. Although we continue to refine the information on which we base our estimates, we cannot be sure that our estimates are accurate indicators of future events. Accordingly, future adjustments may result from refining these estimates. Such adjustments may be significant.
Accounts Receivable Allowances. We maintain allowances for doubtful accounts based on our review and assessment of payment history and our estimate of the ability of each customer to make payments on amounts invoiced. If the financial condition of any of our customers were to deteriorate, additional allowances might be required. From time to time we must adjust our estimates. Changes in estimates of the collection risk related to accounts receivable can result in decreases and increases to current period net income.
Long-Lived Assets. We periodically evaluate the period of depreciation or amortization for long-lived assets to determine whether current circumstances warrant revised estimates of useful lives. We review our property,
29
Table of Contents
plant and equipment for impairment whenever events or changes in circumstances indicate the carrying value of an asset may not be recoverable. Recoverability is measured by a comparison of the carrying amount to the net undiscounted cash flows expected to be generated by the asset. An impairment loss would be recorded for the excess of net carrying value over the fair value of the asset impaired. The fair value is estimated based on expected discounted future cash flows. The results of impairment tests are subject to management’s estimates and assumptions of projected cash flows and operating results. Changes in assumptions or market conditions could result in a change in estimated future cash flows and the likelihood of materially different reported results. Past estimates by management of the fair values and useful lives of long-lived assets and investments have periodically been impacted by one-time events.
Intangible Assets and Goodwill. Financial Accounting Standards Board (“FASB”) ASC 350, Goodwill and Other Intangible Assets, requires companies to test goodwill for impairment on an annual basis at the reporting unit level (or an interim basis if an event occurs that might reduce the fair value of a reporting unit below its carrying value). We have one reporting unit and the annual impairment test is performed at each year-end unless indicators of impairment are present and require more frequent testing. FASB ASC 350 also requires that the carrying value of an identifiable intangible asset that has an indefinite life be determined by using a fair value based approach.
Intangible assets generally consist of patents, trademarks, procurement contracts, customer lists, non-compete agreements, distribution agreements and acquired exclusivity rights. Patents and trademarks are amortized on the straight-line method over the shorter of the remaining protection period or estimated useful lives of between 8 and 16 years. Procurement contracts, customer lists, acquired exclusivity rights, non-compete agreements and distribution agreements are amortized over estimated useful lives of between 5 to 25 years.
Goodwill is tested for impairment by comparing the fair value of the reporting unit to its carrying amount, including goodwill. In concluding as to fair value of the reporting unit for purposes of testing goodwill, an income approach and a market approach are utilized. The conclusion from these two approaches are weighted equally and then adjusted to incorporate a control premium or acquisition premium that reflects the additional amount a buyer is willing to pay for elements of control and for a premium that reflects the buyer’s perception of its ability to add value through synergies.
In general, the income approach employs a discounted cash flow model that considers: 1) assumptions that marketplace participants would use in their estimates of fair value, including the cash flow period, terminal values based on a terminal growth rate and the discount rate; 2) current period actual results, and 3) projected results for future periods that have been prepared and approved by our senior management. The forecasted cash flows do not include synergies that a marketplace participant would be expecting to achieve.
The market approach employs market multiples from guideline public companies operating in our industry. Estimates of fair value are derived by applying multiples based on revenue and earnings before interest, taxes, depreciation and amortization (“EBITDA”) adjusted for size and performance metrics relative to peer companies. A control premium was included in determining the fair value under this approach.
If the carrying amount of the reporting unit exceeds its calculated fair value, the second step of the goodwill impairment test is performed in accordance with FASB ASC 805 to measure the amount of the impairment loss, if any.
Both approaches used in the analysis have a degree of uncertainty. Potential events or changes in circumstances which could impact the key assumptions used in our goodwill impairment evaluation are as follows:
| • | Change in peer group or performance of peer group companies |
| • | Change in the company’s markets and estimates of future operating performance |
30
Table of Contents
| • | Change in the company’s estimated market cost of capital |
| • | Change in implied control premiums related to acquisitions in the medical device industry. |
The valuation of goodwill and intangible assets with indefinite useful lives requires management to use significant judgments and estimates including, but not limited to, projected future revenue and cash flows. Changes in assumptions or market conditions could result in a change in estimated future cash flows and the likelihood of materially different reported results.
If we overestimate the useful life of an asset, or overestimate the fair value of an asset, and at some time in the future we dispose of that asset for a lower amount than its carrying value, our historically reported total assets and net income would have been higher than they would have been during periods prior to our recognition of the loss on disposal of assets, and lower during the period when we recognize the loss.
The fair value of these long-term investments is dependent on their performance, as well as volatility inherent in the external markets for these investments. These determinations require complex calculations based on estimated future benefit and fair value. We have often made investments for which the expected future benefit has not been easily estimated. Examples of such investments include, but are not limited to, our acquisition of Pioneer and our acquisition of Tutogen Medical, Inc., a Delaware corporation (“TMI”), our investment in equipment; and our investment in obtaining patents. In assessing potential impairment for these investments, we consider these factors as well as forecasted financial performance. If forecasts are not met, impairment charges may be required.
Revenue Recognition. We recognize revenue upon shipping, or receipt by our customers of the processed tissue for implantation, depending on our distribution agreements with our customers or distributors. We recognize our other revenues when all appropriate contractual obligations have been satisfied.
We permit returns of tissue in accordance with the terms of contractual agreements with customers if the tissue is returned in a timely manner, in unopened packaging and from the normal channels of distribution. We provide allowances for returns based upon analysis of our historical patterns of returns, matched against the fees from which they originated. Historical returns have been within the amounts we reserved.
Stock-Based Compensation Plans. We account for our stock-based compensation plans in accordance with FASB ASC 718, Accounting for Stock Compensation. FASB ASC 718 requires the measurement and recognition of compensation expense for all stock-based awards made to employees and directors, including employee stock options and restricted stock. Under the provisions of FASB ASC 718, and U.S. Securities and Exchange Commission Staff Accounting Bulletin No. 107, stock-based compensation cost is measured at the grant date, based on the calculated fair value of the award, and is recognized as an expense on a straight-line basis over the requisite service period of the entire award (generally the vesting period of the award).
Income Taxes. We use the asset and liability method of accounting for income taxes. Deferred income taxes are recorded to reflect the tax consequences on future years for differences between the tax basis of assets and liabilities and their financial reporting amounts at each year-end based on enacted tax laws and statutory tax rates applicable to the periods in which the differences are expected to affect taxable income. Valuation allowances are established when necessary to reduce deferred tax assets to amounts which are more likely than not to be realized.
Off Balance-Sheet Arrangements
As of December 31, 2014, we had no off-balance-sheet arrangements, as defined in Item 303(a) (4) (ii) of Regulation S-K.
Regulatory Approvals in 2014
AMERICAS
| • | US 510(k) Clearance of Fortiva Porcine Dermis for Plastic and Reconstructive surgery |
31
Table of Contents
| • | US 510(k) Clearance of Nanoss, Nanoss Loaded and Nanoss Loaded Kit |
| • | US 510(k) Clearance of Streamline TL Spinal Fixation System |
| • | US 510(k) Clearance of CrossFuse II Coronal Taper, CrossFuse II Hyperlordotic |
| • | US 510(k) Clearance of Streamline OCT Occipito-Cervico-Thoracic System |
| • | US 510(k) Clearance of C-Plus IBF |
| • | US 510(k) Clearance of Nanoss 3D |
| • | US 510(k) Clearance of Tritium Sternal Cable Plate System |
| • | US 510(k) Clearance of Tutoplast Bovine Pericardium for Dura Substitute |
| • | Peru Approval of BioSet |
EUROPE
| • | Switzerland Registration of BioAdapt DBM Foam, BioReady DBM Putty and Putty with Chips, and Allograft Tendons |
| • | EU CE Mark of Fortiva Porcine Dermis – Germany, France, Greece, Italy, Lithuania, Netherlands, Poland, Portugal, Switzerland, Spain, Hungary Listings |
| • | EU line extensions to Streamline MIS, Streamline TL, Sternal Cable System, Fusion Instruments (MIS), and IBF/VBR System (C-Plus Webless, CrossFuse II Hyperlordotic, & CrossFuse II Coronal Taper |
| • | Ukraine Registration of Tutobone, Tutomesh Bovine Pericardium, Tutopatch Bovine Pericardium, and Fortiva Porcine Dermis |
| • | Serbia Registration of Tutobone, Tutomesh, Tutopatch (Re-Registration) |
| • | Serbia Re-Registration of BacJac |
| • | Serbia Re-registration for one product system for commercial partners |
| • | Greece License for Allograft Products |
| • | France Registration of Allograft Cancellous Products |
| • | France Listing of C-Plus, Bullet-Tip, Cross-Fuse, CrossFuse II, Clarity Retractor System, Streamline TL, Nanoss Cervical, Nanoss Bioactive, Slimfuse, BacFUse, Quantum, T-Plus, Streamline MIS, NuNec, BacJac, Sternal Cable System and PAC Plate |
AUSTRALIA
| • | Australia Approval of Tutoplast Pericardium |
| • | Australia and New Zealand Approval/Listing of Tritium Sternal Cable Plate System |
| • | New Zealand Listing on one product for a commercial partner |
MIDDLE EAST
| • | Saudi Arabia Registration of Tutomesh Bovine Pericardium and Tutopatch Bovine Pericardium |
| • | Israel Re-Registration of NuNec, BacJac, and Bullet-Tip |
ASIA
| • | Singapore License for BioSet and Allograft Tendons and Bone |
| • | China Approvals for Class I and Class II Fusion Instruments |
32
Table of Contents
| • | China Approval on two product systems for commercial partners |
| • | Korea Approval on one product for a commercial partner |
Certifications, Accreditations and Inspections in 2014
AMERICAS
| • | SGS ISO 13485 surveillance audit at the Alachua, Florida and Allendale New Jersey facilities |
| • | U.S. Food and Drug Administration (FDA) tissue bank inspection at the RTI Donor Services Madison, Wisconsin, El Paso Texas and Melbourne Florida facilities |
| • | U.S. Food and Drug Administration (FDA) tissue bank inspection for RTI operations in New Jersey facility (cell processing) (December-January 2014) |
| • | U.S. Food and Drug Administration (FDA) inspection at the Marquette Michigan facility |
| • | BSI ISO 13485 recertification audit at the Marquette, Michigan; Austin, Texas; and Greenville, North Carolina facilities |
| • | State of Florida inspection of the RTI Lab located in Alachua, FL |
EUROPE
| • | German authorities (PEI & ROF) inspection of Tutogen Medical facility located in Neunkirchen, Germany |
| • | German authorities (PEI & ROF) inspection at the Alachua Florida facility |
| • | LGA/TUV ISO 9001 & 13485 surveillance audit of Tutogen Medical facility located in Neunkirchen, Germany |
| • | BSI ISO 13485 initial certification audit at the Houten Netherlands facility |
All registrations, licensures, certifications and accreditations were renewed or continued for all locations.
Implant and Product Recalls
In 2014, we initiated one voluntary recall with the Center for Biologics Evaluation and Research (CBER) and three voluntary recalls with the Center for Devices and Radiological Health (CDRH) of the Food and Drug Administration (FDA).
| • | June 2014 – One recall was filed with the CDRH involving 5 Tritium® Sternal Plate System Screw device packages. The screws were recalled due to the product not being gamma irradiated even though they were labeled as such. This recall has been considered closed by RTI Surgical and the FDA since October of 2014. |
| • | August 2014 – Two recalls were filed with the CDRH. One involving two lots of Streamline® MIS Instruments and one involving 11 lots of Streamline CT Set Screws. Both of these were conducted in 2013 and 2012 respectively. Both of these recalls were considered closed by the FDA in October of 2014. |
| • | October 2014 – A total of 115 Tutoplast® Cancellous Chip allografts from a single donor were voluntarily recalled. The allografts were recalled due to a failure to follow line clearance to prevent the mix up of tissues during processing. The potential existed where cancellous bone from two donors could have been milled together during processing and distributed under one lot number. There was no risk identified through use of the tissue, since the tissue did undergo sterilization. This recall is pending verification at this time. |
33
Table of Contents
Results of Operations
The following tables set forth, in both dollars and as a percentage of revenues, the results of our operations for the years indicated:
| Year Ended December 31, | ||||||||||||||||||||||||
| 2014 | 2013 | 2012 | ||||||||||||||||||||||
| (Dollars in thousands) | ||||||||||||||||||||||||
| Statement of Operations Data: |
||||||||||||||||||||||||
| Revenues |
$ | 262,810 | 100.0 | % | $ | 197,979 | 100.0 | % | $ | 178,113 | 100.0 | % | ||||||||||||
| Costs of processing and distribution |
129,013 | 49.1 | 117,874 | 59.5 | 92,896 | 52.2 | ||||||||||||||||||
|
|
|
|
|
|
|
|
|
|
|
|
|
|||||||||||||
| Gross profit |
133,797 | 50.9 | 80,105 | 40.5 | 85,217 | 47.8 | ||||||||||||||||||
|
|
|
|
|
|
|
|
|
|
|
|
|
|||||||||||||
| Expenses: |
||||||||||||||||||||||||
| Marketing, general and administrative |
107,653 | 41.0 | 81,635 | 41.2 | 58,376 | 32.8 | ||||||||||||||||||
| Research and development |
15,536 | 5.9 | 15,241 | 7.7 | 12,231 | 6.9 | ||||||||||||||||||
| Asset abandonments |
— | — | — | — | 20 | 0.0 | ||||||||||||||||||
| Litigation settlement |
185 | 0.1 | 3,000 | 1.5 | 2,350 | 1.3 | ||||||||||||||||||
| Restructuring charges |
— | — | 2,881 | 1.5 | — | — | ||||||||||||||||||
| Acquisition expenses |
— | — | 6,004 | 3.0 | — | — | ||||||||||||||||||
| Severance charges |
4,798 | 1.8 | — | — | — | — | ||||||||||||||||||
|
|
|
|
|
|
|
|
|
|
|
|
|
|||||||||||||
| Total operating expenses |
128,172 | 48.8 | 108,761 | 54.9 | 72,977 | 41.0 | ||||||||||||||||||
|
|
|
|
|
|
|
|
|
|
|
|
|
|||||||||||||
| Operating income (loss) |
5,625 | 2.1 | (28,656 | ) | (14.4 | ) | 12,240 | 6.8 | ||||||||||||||||
|
|
|
|
|
|
|
|
|
|
|
|
|
|||||||||||||
| Other (expense) income: |
||||||||||||||||||||||||
| Interest expense |
(1,357 | ) | (0.5 | ) | (542 | ) | (0.3 | ) | — | — | ||||||||||||||
| Interest income |
9 | 0.0 | 23 | 0.0 | 185 | 0.1 | ||||||||||||||||||
| Foreign exchange (loss) gain |
(88 | ) | (0.0 | ) | 251 | 0.1 | 19 | 0.0 | ||||||||||||||||
|
|
|
|
|
|
|
|
|
|
|
|
|
|||||||||||||
| Total other (expense) income—net |
(1,436 | ) | (0.5 | ) | (268 | ) | (0.2 | ) | 204 | 0.1 | ||||||||||||||
|
|
|
|
|
|
|
|
|
|
|
|
|
|||||||||||||
| Income (loss) before income tax benefit (provision) |
4,189 | 1.6 | (28,924 | ) | (14.6 | ) | 12,444 | 6.9 | ||||||||||||||||
| Income tax (provision) benefit |
(1,493 | ) | (0.6 | ) | 11,110 | 5.6 | (4,042 | ) | (2.3 | ) | ||||||||||||||
|
|
|
|
|
|
|
|
|
|
|
|
|
|||||||||||||
| Net income (loss) |
2,696 | 1.0 | (17,814 | ) | (9.0 | ) | 8,402 | 4.6 | ||||||||||||||||
|
|
|
|
|
|
|
|
|
|
|
|
|
|||||||||||||
| Convertible preferred dividend |
(3,113 | ) | (1.2 | ) | (1,375 | ) | (0.7 | ) | — | — | ||||||||||||||
|
|
|
|
|
|
|
|
|
|
|
|
|
|||||||||||||
| Net (loss) income applicable to common shares |
$ | (417 | ) | (0.2%) | $ | (19,189 | ) | (9.7%) | $ | 8,402 | 4.6 | % | ||||||||||||
|
|
|
|
|
|
|
|
|
|
|
|
|
|||||||||||||
| Year Ended December 31, | Percent Change | |||||||||||||||||||
| 2014 | 2013 | 2012 | 2014/2013 | 2013/2012 | ||||||||||||||||
| Revenues: |
||||||||||||||||||||
| Spine |
$ | 82,663 | $ | 57,334 | $ | 38,866 | 44.2 | % | 47.5 | % | ||||||||||
| Sports medicine |
46,758 | 42,594 | 51,197 | 9.8 | % | -16.8 | % | |||||||||||||
| Ortho fixation |
37,133 | 14,525 | — | 155.6 | % | — | ||||||||||||||
| BGS and general orthopedic |
36,747 | 27,864 | 29,308 | 31.9 | % | -4.9 | % | |||||||||||||
| Surgical specialties |
26,999 | 27,666 | 30,897 | -2.4 | % | -10.5 | % | |||||||||||||
| Dental |
20,810 | 19,779 | 21,435 | 5.2 | % | -7.7 | % | |||||||||||||
| Other revenues |
11,700 | 8,217 | 6,410 | 42.4 | % | 28.2 | % | |||||||||||||
|
|
|
|
|
|
|
|
|
|
|
|||||||||||
| Total revenues |
$ | 262,810 | $ | 197,979 | $ | 178,113 | 32.7 | % | 11.2 | % | ||||||||||
|
|
|
|
|
|
|
|
|
|
|
|||||||||||
| Domestic revenues |
$ | 238,936 | $ | 177,207 | $ | 156,803 | 34.8 | % | 13.0 | % | ||||||||||
| International revenues |
23,874 | 20,772 | 21,310 | 14.9 | % | -2.5 | % | |||||||||||||
|
|
|
|
|
|
|
|
|
|
|
|||||||||||
| Total revenues |
$ | 262,810 | $ | 197,979 | $ | 178,113 | 32.7 | % | 11.2 | % | ||||||||||
|
|
|
|
|
|
|
|
|
|
|
|||||||||||
34
Table of Contents
2014 Compared to 2013
Revenues. Our total revenues increased $64.8 million, or 32.7%, to $262.8 million for the year ended December 31, 2014 compared to $198.0 million for the year ended December 31, 2013. Our year over year revenue comparisons are impacted as a result of the acquisition of Pioneer. Our prior year revenues include Pioneer related revenues for the stub period of July 16, 2013 to December 31, 2013, whereas our current year period includes a full year of Pioneer related revenues. In addition, a significant amount of our revenue is derived from large commercial stocking distributors, whose timing of orders can vary from year to year. These ordering patterns can result in significant unit volume variations year over year, which can result in significant variation in period over period comparisons.
Spine—Revenues from spinal implants increased $25.3 million, or 44.2%, to $82.7 million for the year ended December 31, 2014 compared to $57.3 million for the year ended December 31, 2013. Spine revenues increased primarily as a result of higher unit volumes of 59.9%, partially offset by lower average revenue per unit of 9.8%. The increase was primarily due to the recognition of a full year of current period Pioneer spine revenues as compared to the prior stub period.
Sports Medicine—Revenues from sports medicine allografts increased $4.2 million, or 9.8%, to $46.8 million for the year ended December 31, 2014 compared to $42.6 million for the year ended December 31, 2013. Sports medicine revenues increased primarily as a result of higher unit volumes of 9.9% and slightly lower average revenue per unit of 0.1%, primarily due to changes in distribution mix.
Ortho Fixation—Revenues from ortho fixation increased $22.6 million, or 155.6%, to $37.1 million for the year ended December 31, 2014 compared to $14.5 million for the year ended December 31, 2013. We did not offer ortho fixation implants prior to July 16, 2013.
Bone Graft Substitutes (BGS) and General Orthopedic—Revenues from BGS and general orthopedic allografts increased $8.9 million, or 31.9%, to $36.7 million for the year ended December 31, 2014 compared to $27.9 million for the year ended December 31, 2013. BGS and general orthopedic revenues increased primarily as a result of higher average revenue per unit of 35.7%, partially offset by lower unit volumes of 3.0%. This increase was primarily due to significant changes in distribution mix toward units with higher revenue per unit and new product launches, generally with higher revenue per unit.
Surgical Specialties—Revenues from surgical specialty allografts decreased $667,000, or 2.4%, to $27.0 million for the year ended December 31, 2014 compared to $27.7 million for the year ended December 31, 2013. Surgical specialties revenues decreased primarily as a result of lower average revenue per unit of 4.5%, primarily due to changes in distribution mix, partially offset by higher unit volumes of 2.1%.
Dental—Revenues from dental allografts increased $1.0 million, or 5.2%, to $20.8 million for the year ended December 31, 2014 compared to $19.8 million for the year ended December 31, 2013. Dental revenues increased primarily as a result of higher unit volumes of 4.9% and higher average revenue per unit of 0.3%, primarily due to changes in distribution mix.
Other Revenues—Revenues from other sources consisting of service processing, tissue recovery fees, biomedical laboratory fees, recognition of previously deferred revenues, shipping fees, distribution of reproductions of our allografts to distributors for demonstration purposes and restocking fees, increased $3.5 million, or 42.4%, to $11.7 million for the year ended December 31, 2014 compared to $8.2 million for the year ended December 31, 2013. The increase was primarily due to increased service processing fees and tissue recovery fees, offset by the acceleration of deferred revenue recognition of $1.7 million relating to Davol relinquishing their exclusive distribution rights in the hernia market in the first quarter of 2013.
35
Table of Contents
International Revenues—International revenues include distributions from our foreign affiliates as well as domestic export revenues. International revenues increased $3.1 million, or 14.9% to $23.9 million for the year ended December 31, 2014 compared to $20.8 million for the year ended December 31, 2013. On a constant currency basis, international revenues were comparable to the prior year.
Costs of Processing and Distribution. Costs of processing and distribution increased by $11.1 million, or 9.4%, to $129.0 million for the year ended December 31, 2014 from $117.9 million for the year ended December 31, 2013. This increase was primarily due to higher costs of processing and distribution arising from higher revenue levels as a result of the Pioneer acquisition.
Costs of processing and distribution decreased as a percentage of revenues from 59.5% for the year ended December 31, 2013 to 49.1% for the year ended December 31, 2014. The decrease was primarily due to purchase accounting step up adjustments to inventory of $16.4 million that were charged to costs of processing and distribution as inventory was sold during the year ended December 31, 2013 compared to $5.7 million for the year ended December 31, 2014. Excluding the purchase accounting step up, costs of processing and distribution decreased as a percentage of revenues due to improvement in product distribution mix. This decrease was partially offset primarily by the higher costs relating to the Pioneer acquisition and referenced in the above paragraph.
Marketing, General and Administrative Expenses. Marketing, general and administrative expenses increased by $26.0 million, or 31.9%, to $107.7 million for the year ended December 31, 2014 compared to $81.6 million for the year ended December 31, 2013. Marketing, general and administrative expenses decreased as a percentage of revenues from 41.2% for the year ended December 31, 2013 to 41.0% for the year ended December 31, 2014. The increase in expenses was primarily due to higher variable distribution costs and variable compensation. Our prior year marketing, general and administrative expenses include marketing related costs for new products acquired and general and administrative expenses in the Pioneer acquisition for the stub period of July 16, 2013 to December 31, 2013, whereas our current year period includes a full year of marketing related costs for new products acquired and general and administrative expenses in the Pioneer acquisition.
Research and Development Expenses. Research and development expenses increased by $295,000, or 1.9%, to $15.5 million for the year ended December 31, 2014 compared to $15.2 million for the year ended December 31, 2013. As a percentage of revenues, research and development expenses decreased from 7.7% for the year ended December 31, 2013 to 5.9% for the year ended December 31, 2014. The decrease was primarily due to cost reductions arising from the restructuring that followed the acquisition of Pioneer in the prior year.
Litigation Settlement. Litigation settlement related to the settlement of an international distributor dispute, which resulted in $185,000 of expenses for the year ended December 31, 2014 compared to $3.0 million for the year ended December 31, 2013.
Severance Charges. Severance charges related to the termination of former employees as a result of us flattening our organizational structure, which resulted in $4.8 million of expenses for the year ended December 31, 2014.
Net Other (Expense) Income. Net other expense was $1.4 million for the year ended December 31, 2014 compared to $268,000 for the year ended December 31, 2013. The increase in net other expense is primarily attributable to interest expense incurred on debt primarily due to the recognition of a full year of interest expense as compared to the prior year stub period and due to a change from a $251,000 foreign currency exchange transaction gain for the year ended December 31, 2013 compared to an $88,000 foreign currency exchange transaction loss for the year ended December 31, 2014 resulting from changes in the value of the U.S. dollar versus the Euro and the timing of payments on foreign currency liabilities.
Income Tax (Provision) Benefit. Income tax provision for the year ended December 31, 2014 was $1.5 million compared to an income tax benefit of $11.1 million for the year ended December 31, 2013. Our effective
36
Table of Contents
tax rate for the year ended December 31, 2014 and 2013 was 35.6% expense and 38.4% benefit respectively. For the year ended December 31, 2014, our comparative income tax rate was positively impacted due to the inclusion of the 2014 research tax credit. The positive impact from the research tax credit was partially offset by a valuation allowance charge recorded on a portion of foreign losses incurred during 2014.
Convertible Preferred Dividend. As a result of the acquisition of Pioneer and pursuant to the terms of the investment agreement with Water Street, we recorded a convertible preferred dividend of $3.1 million for the year ended December 31, 2014 compared to $1.4 million for the year ended December 31, 2013.
2013 Compared to 2012
Revenues. Our total revenues increased $19.9 million, or 11.2%, to $198.0 million for the year ended December 31, 2013 compared to $178.1 million for the year ended December 31, 2012. Our revenues increased as a result of the acquisition of Pioneer which closed on July 16, 2013 and includes Pioneer’s revenues for the period July 16, 2013 to December 31, 2013. Our revenues were negatively impacted for the year ended December 31, 2013 as a result of continued customer reaction to a U.S. FDA warning letter received in the fourth quarter of 2012.
Spine—Revenues from spinal implants increased $18.5 million, or 47.5%, to $57.3 million for the year ended December 31, 2013 compared to $38.9 million for the year ended December 31, 2012. Excluding Pioneer’s spine revenues of $15.7 million, spine revenues increased primarily as a result of higher unit volumes of 3.3% and higher average revenue per unit of 3.6%, primarily due to changes in distribution mix.
Sports Medicine—Revenues from sports medicine allografts decreased $8.6 million, or 16.8%, to $42.6 million for the year ended December 31, 2013 compared to $51.2 million for the year ended December 31, 2012. Sports medicine revenues decreased primarily as a result of lower unit volumes of 11.6% and lower average revenue per unit of 5.8%, primarily due to changes in distribution mix.
Ortho Fixation—We did not offer ortho fixation implants prior to the acquisition of Pioneer. Revenues from ortho fixation implants for the year ended December 31, 2013 were $14.5 million.
Bone Graft Substitutes (BGS) and General Orthopedic—Revenues from BGS and general orthopedic allografts decreased $1.4 million, or 4.9%, to $27.9 million for the year ended December 31, 2013 compared to $29.3 million for the year ended December 31, 2012. Excluding Pioneer’s BGS and general orthopedic revenues of $5.8 million, BGS and general orthopedic revenues decreased primarily as a result of lower unit volumes of 16.7% and lower average revenue per unit of 9.6%, primarily due to changes in distribution mix.
Surgical Specialties—Revenues from surgical specialty allografts decreased $3.2 million, or 10.5%, to $27.7 million for the year ended December 31, 2013 compared to $30.9 million for the year ended December 31, 2012. Surgical specialties revenues decreased primarily as a result of lower unit volumes of 11.9%, partially offset by higher average revenue per unit of 1.4%, primarily due to changes in distribution mix.
Dental—Revenues from dental allografts decreased $1.7 million, or 7.7%, to $19.8 million for the year ended December 31, 2013 compared to $21.4 million for the year ended December 31, 2012. Dental revenues decreased primarily as a result of lower unit volumes of 7.4% and lower average revenue per unit of 0.9%, primarily due to changes in distribution mix.
Other Revenues—Revenues from other sources consisting of tissue recovery fees, biomedical laboratory fees, recognition of previously deferred revenues, shipping fees, distribution of reproductions of our allografts to distributors for demonstration purposes and restocking fees, increased $1.8 million, or 28.2%, to $8.2 million for the year ended December 31, 2013 compared to $6.4 million for the year ended December 31, 2012. The increase was primarily due to the acceleration of deferred revenue recognition of $1.7 million relating to Davol relinquishing their exclusive distribution rights in the hernia market in the first quarter of 2013.
37
Table of Contents
International Revenues—International revenues include distributions from our foreign affiliates as well as domestic export revenues. International revenues decreased $538,000, or 2.5% to $20.8 million for the year ended December 31, 2013 compared to $21.3 million for the year ended December 31, 2012. International revenues include Pioneer’s revenues of $3.1 million. On a constant currency basis, international revenues decreased $1.1 million, or 5.3%.
Costs of Processing and Distribution. Costs of processing and distribution increased by $25.0 million, or 26.9%, to $117.9 million for the year ended December 31, 2013 from $92.9 million for the year ended December 31, 2012.
Costs of processing and distribution increased as a percentage of revenues from 52.2% for the year ended December 31, 2012 to 59.5% for the year ended December 31, 2013. The increase was primarily the result of the acquisition of Pioneer and includes costs of processing and distribution from Pioneer with no comparable costs in the prior year period, and preliminary purchase accounting step up adjustments to inventory of $16.4 million charged to costs of processing and distribution as inventory was sold.
Marketing, General and Administrative Expenses. Marketing, general and administrative expenses increased by $23.3 million, or 39.8%, to $81.6 million for the year ended December 31, 2013 compared to $58.4 million for the year ended December 31, 2012. Marketing, general and administrative expenses increased as a percentage of revenues from 32.8% for the year ended December 31, 2012 to 41.2% for the year ended December 31, 2013. The increase in expenses was primarily due to the acquisition of Pioneer. As a result of the acquisition of Pioneer, marketing, general and administrative includes amortization of intangibles of $1.8 million and acquisition related costs of $1.1 million.
Research and Development Expenses. Research and development expenses increased by $3.0 million, or 24.6%, to $15.2 million for the year ended December 31, 2013 compared to $12.2 million for the year ended December 31, 2012. As a percentage of revenues, research and development expenses increased from 6.9% for the year ended December 31, 2012 to 7.7% for the year ended December 31, 2013. The increase in expenses was primarily due to the acquisition of Pioneer.
Asset Abandonments. There were no asset abandonments for the year ended December 31, 2013 compared to $20,000 for the year ended December 31, 2012.
Litigation Settlement. We were named as a party, along with a number of other recovery and processor defendants, in lawsuits relating to the misconduct of BTS, and BTS’s owner, the late Michael Mastromarino, as well as several funeral homes and their owners with which BTS conducted its affairs. In the second quarter of 2012, an agreement was reached to settle 29 of the lawsuits for which we recorded a litigation settlement charge of $2.4 million. In 2013, an agreement was reached to settle the remaining lawsuits and we recorded a litigation settlement charge of $3.0 million in the second quarter of 2013.
Restructuring Charges. We instituted a restructuring plan primarily related to the termination of certain employees and a location closure as a result of the integration activities following the acquisition of Pioneer, which resulted in $2.9 million of expenses for the year ended December 31, 2013.
Acquisition Expenses. Acquisition expenses related to acquisition of Pioneer were $6.0 million for the year ended December 31, 2013.
Net Other (Expense) Income. Net other expense was $268,000 for the year ended December 31, 2013 compared to net other income of $204,000 for the year ended December 31, 2012. The increase in net other expense is primarily attributable to interest expense incurred on long term debt incurred in conjunction with the acquisition of Pioneer in 2013.
38
Table of Contents
Income Tax Benefit (Provision). Income tax benefit for the year ended December 31, 2013 was $11.1 million compared to an income tax provision of $4.0 million for the year ended December 31, 2012. Our effective tax rate for the year ended December 31, 2013 and 2012 was 38.4% and 32.5% respectively. On January 2, 2013, the American Taxpayer Relief Act of 2012 (“ATRA”) was signed into law. The ATRA retroactively extended the research tax credit to the beginning of 2012 through 2013. Under ASC 740, Accounting for Income Taxes, the effects of the tax legislation are recognized upon enactment. Our effective tax rate for the period ended December 31, 2013 as compared to 2012 was negatively impacted by the non-deductibility of certain acquisition related costs associated with the Pioneer acquisition, offset by the entire 2012 and 2013 research tax credits being recognized in 2013 with no comparable credits being recognized in the prior year.
Convertible Preferred Dividend. As a result of the acquisition of Pioneer and pursuant to the terms of the investment agreement with Water Street, we recorded a convertible preferred dividend of $1.4 million for the year ended December 31, 2013.
Non-GAAP Financial Measures
We utilize certain financial measures that are not calculated based on Generally Accepted Accounting Principles, or GAAP. Certain of these financial measures are considered “non-GAAP” financial measures within the meaning of Item 10 of Regulation S-K promulgated by the SEC. We believe that non-GAAP financial measures reflect an additional way of viewing aspects of our operations that, when viewed with the GAAP results, provide a more complete understanding of our results of operations and the factors and trends affecting our business. These non-GAAP financial measures are also used by our management to evaluate financial results and to plan and forecast future periods. However, non-GAAP financial measures should be considered as a supplement to, and not as a substitute for, or superior to, the corresponding measures calculated in accordance with GAAP. Non-GAAP financial measures used by us may differ from the non-GAAP measures used by other companies, including our competitors.
To supplement our consolidated financial statements presented on a GAAP basis, we disclose certain non-GAAP financial measures that exclude certain amounts, including non-GAAP net (loss) income applicable to common shares. These non-GAAP financial measures are not in accordance with, or an alternative for, generally accepted accounting principles in the United States. Reconciliations of each of these non-GAAP financial measures to the corresponding GAAP measures are included in the reconciliation below:
| Year Ended December 31, | ||||||||||||
| 2014 | 2013 | 2012 | ||||||||||
| (In thousands) | ||||||||||||
| Net (loss) income applicable to common shares, as reported |
$ | (417 | ) | $ | (19,189 | ) | $ | 8,402 | ||||
| Inventory purchase price adjustment, net of tax effect |
3,467 | 9,949 | — | |||||||||
| Litigation settlement charges, net of tax effect |
133 | 1,822 | 1,444 | |||||||||
| Restructuring charges, net of tax effect |
— | 1,750 | — | |||||||||
| Acquisition expenses, net of tax effect |
— | 4,923 | — | |||||||||
| Integration expenses, net of tax effect |
— | 671 | — | |||||||||
| Severance charges, net of tax effect |
3,007 | — | — | |||||||||
|
|
|
|
|
|
|
|||||||
| Net income (loss) applicable to common shares, adjusted |
$ | 6,190 | $ | (74 | ) | $ | 9,846 | |||||
|
|
|
|
|
|
|
|||||||
The following are explanations of the adjustments that management excluded as part of the non-GAAP measures for the years ended December 31, 2014 and 2013 as well as the reasons for excluding the individual item:
2014 Inventory purchase price adjustment—This adjustment represents the purchase price effects of acquired Pioneer inventory that was sold in 2014 and which has been included in costs of processing and
39
Table of Contents
distribution. Management removes the amount of these costs from our operating results to assist in assessing our operating performance in the year-to-date period and to supplement a comparison to our past operating performance.
2014 Litigation settlement charge—This adjustment represents a charge and relates to a litigation settlement of an international distributor dispute in 2014. Management removes the amount of these costs from our operating results to assist in assessing our operating performance in the year-to-date period and to supplement a comparison to our past operating performance.
2014 Severance charges—This adjustment represents charges relating to the termination of former employees. Management removes the amount of these costs from our operating results to assist in assessing our operating performance in the year-to-date period and to supplement a comparison to our past operating performance.
2013 Inventory purchase price adjustment—This adjustment represents the purchase price effects of acquired Pioneer inventory that was sold from the date of acquisition through December 31, 2013 and which has been included in costs of processing and distribution. Management removes the amount of these costs from our operating results to assist in assessing our operating performance in the year-to-date period and to supplement a comparison to our past operating performance.
2013 Litigation settlement charge—This adjustment represents a charge and relates to a litigation settlement of certain BTS related lawsuits. Management removes the amount of the litigation settlement charge from our operating results to assist in assessing our operating performance in the year-to-date period and to supplement a comparison to our past operating performance.
2013 Restructuring charges—This adjustment represents a charge and relates to the severance of certain employees and an office closure as a result of the integration activities following the acquisition of Pioneer. Management removes the amount of these costs from our operating results to assist in assessing our operating performance in the year-to-date period and to supplement a comparison to our past operating performance.
2013 Acquisition expenses—This adjustment represents a charge and relates to certain costs associated with the acquisition of Pioneer. Management removes the amount of these costs from our operating results to assist in assessing our operating performance in the year-to-date period and to supplement a comparison to our past operating performance.
2013 Integration expenses—This adjustment represents a charge and relates to certain expenses associated with the integration of Pioneer. Management removes the amount of these costs from our operating results to assist in assessing our operating performance in the year-to-date period and to supplement a comparison to our past operating performance.
Liquidity and Capital Resources
Our working capital at December 31, 2014 of $133.5 million was comparable to our working capital of $134.3 million at December 31, 2013.
At December 31, 2014, we had 54 days of revenues outstanding in trade accounts receivable, an increase of 6 days compared to December 31, 2013. The increase was due to lower cash receipts from customers than shipments and corresponding billings to customers during 2014.
At December 31, 2014, we had 329 days of inventory on hand, an increase of 49 days compared to December 31, 2013. The increase was primarily as a result of the acquisition of the Pioneer inventory and certain purchase price adjustments applied to the acquired Pioneer inventory being expensed to cost of processing and
40
Table of Contents
distribution, and planned increases in inventories to support new product launches and future growth. Excluding the purchase price adjustments applied to the acquired Pioneer inventory, inventory days increased 15 days. We believe that our inventory levels will be adequate to support our on-going operations for the next twelve months.
We had $15.7 million of cash and cash equivalents at December 31, 2014. At December 31, 2014, our foreign subsidiaries held $640,000 in cash which is not available for use in the U.S. without incurring U.S. taxes. U.S. income taxes have not been provided on the undistributed earnings of our foreign subsidiaries. We intend to indefinitely reinvest the earnings of our foreign subsidiaries. We do not believe that our policy of indefinitely reinvesting undistributed earnings outside the U.S. will have a material adverse effect on the business as a whole.
Our short- and long term obligations at December 31, 2014 increased $6.8 million to $75.9 million from $69.1 million at December 31, 2013. The increase in short and long term obligations was primarily due to funding capital expenditures associated with the construction of our new logistics and technology building. At December 31, 2014, we have $5.6 million of borrowing capacity available under our revolving credit facilities.
As of December 31, 2014, we believe that our working capital, together with our borrowing ability under our revolving credit facilities, will be adequate to fund our on-going operations for the next twelve months.
On July 16, 2013, we completed our acquisition of Pioneer. Under the terms of the merger agreement dated June 12, 2013, we acquired Pioneer for $126.3 million in cash. The transaction was funded through a combination of cash on hand, a new credit facility and a concurrent private placement of convertible preferred equity as summarized below:
| (In thousands) |
||||
| Cash proceeds from term loan |
$ | 60,000 | ||
| Net cash proceeds from preferred share issuance |
48,710 | |||
| Cash from RTI Surgical |
17,597 | |||
|
|
|
|||
| Total purchase price |
$ | 126,307 | ||
|
|
|
|||
The Preferred Stock accrues dividends at a rate of 6% per annum or $3.0 million payable in cash on a quarterly basis for each outstanding share of Preferred Stock. The payments of the dividends are subject to certain bank covenant restrictions. To the extent dividends are not paid in cash in any quarter, the dividends which have accrued on each outstanding share of Preferred Stock during such three-month period shall be accumulated and shall remain accumulated dividends with respect to such share of Preferred Stock until paid in cash or converted to common stock. We accrued $3.1 million and $1.4 million in preferred dividends payable for the year ended December 31, 2014 and 2013, respectively, and paid the third quarter dividend of $625,000 in October 2013.
Certain Commitments.
On October 12, 2013, we entered into a distribution agreement with Medtronic, pursuant to which Medtronic will distribute certain allograft implants for use in spinal, general orthopedic and trauma surgery. Under the terms of this distribution agreement, Medtronic will be a non-exclusive distributor except for certain specified implants for which Medtronic will be the exclusive distributor. Medtronic will maintain its exclusivity with respect to these specified implants unless the cumulative fees received by us from Medtronic in respect of these specified implants decline by a certain amount during any trailing 12-month period. The initial term of this distribution agreement will continue through December 31, 2017, unless earlier terminated in accordance with the agreement. This initial term will automatically renew for successive five-year periods, unless either party provides written notice of its intent not to renew at least one year prior to the expiration of the initial term or the applicable renewal period. This distribution agreement superseded and replaced our prior distribution agreement with Medtronic which would have expired in accordance with its terms in June 2014.
41
Table of Contents
On September 10, 2010, we entered into an Exclusive License Agreement with Athersys, Inc. (“Athersys”), pursuant to which Athersys will provide us access to its Multipotent Adult Progenitor Cell (“MAPC”) technologies to develop and commercialize MAPC technology-based biologic implants for certain orthopedic applications. In consideration for the Exclusive License, we agreed to pay Athersys the following: 1) a non-refundable $3.0 million license fee, payable in three time-based $1.0 million installments, the last of which was paid in the first quarter of 2011; 2) payment of $2.0 million contingent upon successful achievement of certain development milestones which we paid in 2012; and 3) up to $32.5 million contingent upon achievement of certain cumulative revenue milestones in future years. In addition, we pay Athersys royalties from the distribution of implants under a tiered royalty structure based on achievement of certain cumulative revenue milestones. The term of this license agreement is the longer of five years, or the remaining life of any patent or trade secret. These acquired licensing rights are being amortized to expense on a straight-line basis over the expected life of the asset.
On September 3, 2010, we entered into an exclusive distribution agreement with Zimmer Dental Inc. (“Zimmer Dental”), a subsidiary of Zimmer, with an effective date of September 30, 2010. The Agreement has an initial term of ten years. Under the terms of this distribution agreement, we agreed to supply sterilized allograft and xenograft implants at an agreed upon transfer price, and Zimmer Dental has agreed to be the exclusive distributor of the implants for dental and oral applications worldwide (except the Ukraine), subject to certain Company obligations under an existing distribution agreement with a third party with respect to certain implants for the dental market. In consideration for Zimmer Dental’s exclusive distribution rights, Zimmer Dental agreed to the following: 1) payment to us of $13.0 million within ten days of the effective date (the “Upfront Payment”); 2) annual exclusivity fees (“Annual Exclusivity Fees”) paid annually for the term of the contract to be paid at the beginning of each calendar year; and, 3) escalating annual purchase minimums to maintain exclusivity. Upon occurrence of an event that materially and adversely affects Zimmer Dental’s ability to distribute the implants, Zimmer Dental may be entitled to certain refund rights with respect to the Upfront Payment and the then current Annual Exclusivity Fee, where such refund would be in an amount limited by a formula specified in this agreement that is based substantially on the number of days from the occurrence of such event to the date that it is cured by us to the satisfaction of Zimmer Dental. The Upfront Payment, the Annual Exclusivity Fees and the fees associated with distributions of processed tissue are considered to be a single unit of accounting. Accordingly, the Upfront Payment and the Annual Exclusivity Fees are deferred as received and are being recognized as other revenues over the term of this distribution agreement based on the expected contractual escalating annual purchase minimums relative to the total contractual minimum purchase requirements in this distribution agreement. Additionally, we considered the potential impact of this distribution agreement’s contractual refund provisions and does not expect these provisions to impact future expected revenue related to this distribution agreement.
On July 13, 2009, we and Davol amended their previous distribution agreement with TMI for human dermis implants. Under the amended agreement; 1) Davol paid us $8.0 million in non-refundable fees for exclusive distribution rights for the distribution to the breast reconstruction market until July 13, 2019; 2) the exclusive worldwide distribution agreement related to the hernia market was extended to July 13, 2019; and 3) Davol agreed to pay us certain additional exclusive distribution rights fees contingent upon the achievement of certain revenue milestones by Davol during the duration of the contract. In the fourth quarter of 2010, Davol paid the first revenue milestone payment of $3.5 million. The non-refundable fees and the fees associated with distributions of processed tissue are considered to be a single unit of accounting. Accordingly, the $8.0 million and $3.5 million exclusivity payments have been deferred and are being recognized as other revenues on a straight-line basis over the initial term of the amended contract of ten years, and the remaining term of the amended contract, respectively. The straight-line method approximates the expected pattern of implant distribution based on the distribution agreement’s contractual annual minimum purchase requirements. Davol did not achieve certain revenue growth milestones which resulted in Davol relinquishing its exclusive distribution rights in the hernia market effective January 1, 2013 and the breast reconstruction market effective January 1, 2015.
42
Table of Contents
Our debt obligations and availability of credit as of December 31, 2014 are as follows:
| Outstanding Balance |
Available Credit |
|||||||
| (In thousands) | ||||||||
| Term loan |
$ | 59,375 | $ | — | ||||
| Credit facilities |
16,435 | 5,631 | ||||||
| Capital leases |
82 | — | ||||||
|
|
|
|
|
|||||
| Total |
$ | 75,892 | $ | 5,631 | ||||
|
|
|
|
|
|||||
On July 16, 2013, we obtained from TD Bank and Regions Bank, a 5-year, $80.0 million senior secured facility, which includes a $60.0 million term loan and a $20.0 million revolving credit facility, that matures on July 16, 2018.
On December 30, 2013, we entered into an amendment to the credit agreement in order to, among other things, clarify our rights to make certain distributions with respect to the Preferred Stock, modify the interest rate payable with respect to borrowings, and modify certain financial covenants. The credit agreement has a variable interest rate between 100 and 300 basis points in excess of the one month LIBOR rate. At December 31, 2014, the interest rate for the term loan and revolving credit facility was 2.42%. The facility is secured by substantially all our assets and guaranteed by our domestic subsidiaries, other than RTIDS. The $20.0 million revolving credit facility replaced our previous $15.0 million U.S. credit facility. The term loan facility includes an interest only period of September 30, 2013 through December 31, 2014 with a final balloon principal payment at the end of the loan agreement. The new credit agreement also contains various restrictive covenants which limit, among other things, indebtedness and liens, payments of dividends, require a minimum cash balance on hand of $10.0 million, and require certain financial covenant ratios.
On October 15, 2014, we entered into a second amendment to the second amended and restated loan agreement with TD Bank, N.A. and Regions Bank, which amended the loan agreement to remove certain financial covenants.
In addition to the credit facility with TD Bank and Regions Bank, we have three credit facilities with German banks as of December 31, 2014. The total available credit on our four revolving credit facilities at December 31, 2014 was $5.6 million. As of December 31, 2014, there was $15.2 million outstanding on the revolving credit facility with TD Bank and Regions Bank.
Under the terms of the revolving credit facilities with three German banks, we may borrow up to 1.7 million Euro, or approximately $2.1 million, for working capital needs. The 1.0 million Euro revolving credit facility is secured by a mortgage on our German facility. The 500,000 Euro revolving credit facility is secured by accounts receivable of our German subsidiary. The 200,000 Euro revolving credit facility is unsecured. The current interest rates for these lines of credit vary from 2.59% to 8.50%. As of December 31, 2014, there was $1.2 million outstanding on the revolving credit facilities with German banks.
We were in compliance with the financial covenants related to our term loan and credit facilities as of December 31, 2014.
We have capital leases with interest rates ranging from 1.49% to 2.85% and maturity dates through 2017.
43
Table of Contents
The following table provides a summary of our debt obligations, operating lease obligations and other significant obligations as of December 31, 2014.
| Contractual Obligations Due by Period | ||||||||||||||||||||||||
| Total | 2015 | 2016 | 2017 | 2018 | 2019 | |||||||||||||||||||
| (In thousands) | ||||||||||||||||||||||||
| Short and long-term obligations |
$ | 75,892 | $ | 6,479 | $ | 4,532 | $ | 5,256 | $ | 59,625 | $ | — | ||||||||||||
| Operating leases |
4,174 | 2,080 | 1,311 | 589 | 127 | 67 | ||||||||||||||||||
| Other significant obligations (1) |
8,035 | 8,035 | — | — | — | — | ||||||||||||||||||
|
|
|
|
|
|
|
|
|
|
|
|
|
|||||||||||||
| Total |
$ | 88,101 | $ | 16,594 | $ | 5,843 | $ | 5,845 | $ | 59,752 | $ | 67 | ||||||||||||
|
|
|
|
|
|
|
|
|
|
|
|
|
|||||||||||||
| (1) | These amounts consist of contractual obligations for capital expenditures and open purchase orders. |
Impact of Inflation
Inflation generally affects us by increasing our cost of labor, equipment and processing tools and supplies. We do not believe that the relatively low rates of inflation experienced in the United States since the time we began operations have had any material effect on our business.
| Item 7A. | QUANTITATIVE AND QUALITATIVE DISCLOSURES ABOUT MARKET RISK. |
We are subject to market risk from exposure to changes in interest rates based upon our financing, investing and cash management activities. We do not expect changes in interest rates to have a material adverse effect on our income or our cash flows in 2015. However, we cannot assure that interest rates will not significantly change in the future.
In the United States and Germany, we are exposed to interest rate risk. Changes in interest rates affect interest income earned on cash and cash equivalents and interest expense on revolving credit arrangements. We have not entered into derivative transactions related to cash and cash equivalents or debt. Our borrowings under our term loan and credit facilities expose us to market risk related to changes in interest rates. As of December 31, 2014, our outstanding floating rate indebtedness totaled $75.9 million. The primary base interest rate is LIBOR. Assuming the outstanding balance on our floating rate indebtedness remains constant over a year, a 100 basis point increase in the interest rate would decrease net income and cash flow by approximately $0.5 million. Other outstanding debt consists of fixed rate instruments, including capital leases. Accordingly, we are subject to changes in interest rates. Based on December 31, 2014 outstanding intercompany balances, a 1% change in interest rates would have had a de-minimis impact on our results of operations.
The value of the U.S. dollar compared to the Euro affects our financial results. Changes in exchange rates may positively or negatively affect revenues, gross margins, operating expenses and net income. The international operation currently transacts business primarily in the Euro. Assets and liabilities of foreign subsidiaries are translated at the period end exchange rate while revenues and expenses are translated at the average exchange rate for the period. Intercompany transactions are translated from the Euro to the U.S. dollar. Based on December 31, 2014 outstanding intercompany balances, a 1% change in currency rates would have had a de-minimis impact on our results of operations.
| Item 8. | FINANCIAL STATEMENTS AND SUPPLEMENTARY DATA. |
Our consolidated financial statements and supplementary data required in this item are set forth at the pages indicated in Item 15(a)(1).
| Item 9. | CHANGES IN AND DISAGREEMENTS WITH ACCOUNTANTS ON ACCOUNTING AND FINANCIAL DISCLOSURE. |
Not applicable.
44
Table of Contents
| Item 9A. | CONTROLS AND PROCEDURES. |
Attached as exhibits to this Form 10-K are certifications of our Chief Executive Officer and Chief Financial Officer, which are required in accordance with Rule 13a-15 of the Exchange Act. This “Controls and Procedures” section includes information concerning the controls and controls evaluation referred to in the certifications.
As of the end of the period covered by this report, an evaluation was performed on the effectiveness of the design and operation of our disclosure controls and procedures under the supervision and with the participation of our management, including our Chief Executive Officer and Chief Financial Officer. Disclosure controls and procedures include controls and other procedures that are designed to ensure that information required to be disclosed by the Company in the reports that it files or submits under the Exchange Act is recorded, processed, summarized and reported, within the time periods specified in the Commission’s rules and forms, and accumulated and communicated to the Company’s management, including its principal executive and principal financial officers, or persons performing similar functions, as appropriate to allow timely decisions regarding required disclosure. Based upon that evaluation, our Chief Executive Officer and Chief Financial Officer concluded that the design and operation of our disclosure controls and procedures were effective as of the end of the period covered by this report.
Changes in Internal Controls
There have been no changes in the Company’s internal control over financial reporting during the Company’s last fiscal quarter that materially affected, or are reasonably likely to materially affect the Company’s internal control over financial reporting.
Management’s Report on Effectiveness of Internal Controls
The management of RTI Surgical, Inc. and subsidiaries (the “Company”) is responsible for establishing and maintaining adequate internal control over financial reporting (as defined in Securities Exchange Act Rules 13a-15(f) and 15d-15(f)). The Company’s internal control system was designed to provide reasonable assurance to the Company’s management and board of directors regarding the preparation and fair presentation of published financial statements.
All internal control systems, no matter how well designed, have inherent limitations. Therefore, even those systems determined to be effective can provide only reasonable assurance with respect to financial statement preparation and presentation.
The Company’s management assessed the effectiveness of the Company’s internal control over financial reporting as of December 31, 2014. In making this assessment, it used the criteria set forth by the Committee of Sponsoring Organizations of the Treadway Commission (“COSO”) in Internal Control—Integrated Framework (2013). Based on this assessment, management believes that, as of December 31, 2014, the Company’s internal control over financial reporting is effective based on those criteria.
The Company’s independent registered public accounting firm has issued a report on the Company’s internal control over financial reporting. This report appears on page 49.
| Item 9B. | OTHER INFORMATION. |
None.
45
Table of Contents
PART III
| Item 10. | DIRECTORS, EXECUTIVE OFFICERS AND CORPORATE GOVERNANCE. |
The information set forth under the caption “Directors and Executive Officers” in our definitive proxy statement for 2015 Annual Meeting of Stockholders to be filed within 120 days after December 31, 2014 is incorporated by reference. Information relating to our Code of Ethics that applies to our senior financial professionals is available on our website http://www.rtix.com/investors/corporate-governance. Any amendments to, or waiver of, any provision of the Code of Ethics will be posted on our website.
| Item 11. | EXECUTIVE COMPENSATION. |
The information set forth under the caption “Executive Compensation” in our definitive proxy statement for our 2015 Annual Meeting of Stockholders to be filed within 120 days after December 31, 2014 is incorporated by reference.
| Item 12. | SECURITY OWNERSHIP OF CERTAIN BENEFICIAL OWNERS AND MANAGEMENT AND RELATED STOCKHOLDER MATTERS. |
The information set forth under the captions “Beneficial Ownership of Common Stock by Certain Stockholders and Management” and “Securities Authorized For Issuance Under Equity Compensation Plans” in our definitive proxy statement for our 2015 Annual Meeting of Stockholders to be filed within 120 days after December 31, 2014 is incorporated by reference.
| Item 13. | CERTAIN RELATIONSHIPS AND RELATED TRANSACTIONS, AND DIRECTOR INDEPENDENCE. |
The information set forth under the caption “Certain Relationships and Related Transactions, and Director Independence” in our definitive proxy statement for our 2015 Annual Meeting of Stockholders to be filed within 120 days after December 31, 2014 is incorporated by reference.
| Item 14. | PRINCIPAL ACCOUNTING FEES AND SERVICES. |
The information set forth under the caption “Audit Matters” in our definitive proxy statement for our 2015 Annual Meeting of Stockholders to be filed within 120 days after December 31, 2014 is incorporated by reference.
46
Table of Contents
PART IV
| Item 15. | EXHIBITS AND FINANCIAL STATEMENT SCHEDULES. |
| (a) | (1) Financial Statements: |
See “Index to Consolidated Financial Statements and Financial Statement Schedule” on page 48, the Independent Registered Public Accounting Firm’s Report on page 49 and the Consolidated Financial Statements on pages 50 to 53, all of which are incorporated herein by reference.
| (2) | Financial Statement Schedule: |
The following Financial Statement Schedule is filed as part of this Report:
Schedule II, Valuation and Qualifying Accounts for the years ended December 31, 2014, 2013 and 2012 is included in the Consolidated Financial Statements of RTI Surgical, Inc. on page 78. All other financial statement schedules are omitted because they are inapplicable, not required or the information is indicated elsewhere in the consolidated financial statements or the notes thereto.
| (3) | Exhibits: |
The information required by this item is set forth on the exhibit index that follows the signature page of this report.
47
Table of Contents
INDEX TO CONSOLIDATED FINANCIAL STATEMENTS
AND FINANCIAL STATEMENT SCHEDULE
| Page | ||||
| Consolidated Financial Statements of RTI Surgical, Inc. and Subsidiaries | ||||
| 49 | ||||
| 50 | ||||
| Consolidated Statements of Comprehensive (Loss) Income—Years Ended December 31, 2014, 2013 and 2012 |
51 | |||
| Consolidated Statements of Stockholders’ Equity—Years Ended December 31, 2014, 2013 and 2012 |
52 | |||
| Consolidated Statements of Cash Flows—Years Ended December 31, 2014, 2013 and 2012 |
53 | |||
| Notes to Consolidated Financial Statements—Years Ended December 31, 2014, 2013 and 2012 |
54–77 | |||
| 78 | ||||
48
Table of Contents
REPORT OF INDEPENDENT REGISTERED PUBLIC ACCOUNTING FIRM
To the Board of Directors and Stockholders of
RTI Surgical, Inc.
Alachua, Florida
We have audited the accompanying consolidated balance sheets of RTI Surgical, Inc. and subsidiaries (the “Company”) as of December 31, 2014 and 2013, and the related consolidated statements of comprehensive (loss) income, stockholders’ equity, and cash flows for each of the three years in the period ended December 31, 2014. Our audits also included the financial statement schedule listed in Item 15(a)(2). We also have audited the Company’s internal control over financial reporting as of December 31, 2014, based on criteria established in Internal Control — Integrated Framework (2013) issued by the Committee of Sponsoring Organizations of the Treadway Commission. The Company’s management is responsible for these financial statements and the financial statement schedule, for maintaining effective internal control over financial reporting, and for its assessment of the effectiveness of internal control over financial reporting, included in the accompanying Management’s Report on Effectiveness of Internal Controls. Our responsibility is to express an opinion on these financial statements and the financial statement schedule and an opinion on the Company’s internal control over financial reporting based on our audits.
We conducted our audits in accordance with the standards of the Public Company Accounting Oversight Board (United States). Those standards require that we plan and perform the audit to obtain reasonable assurance about whether the financial statements are free of material misstatement and whether effective internal control over financial reporting was maintained in all material respects. Our audits of the financial statements included examining, on a test basis, evidence supporting the amounts and disclosures in the financial statements, assessing the accounting principles used and significant estimates made by management, and evaluating the overall financial statement presentation. Our audit of internal control over financial reporting included obtaining an understanding of internal control over financial reporting, assessing the risk that a material weakness exists, testing and evaluating the design and operating effectiveness of internal control based on the assessed risk. Our audits also included performing such other procedures as we considered necessary in the circumstances. We believe that our audits provide a reasonable basis for our opinions.
A company’s internal control over financial reporting is a process designed by, or under the supervision of, the company’s principal executive and principal financial officers, or persons performing similar functions, and effected by the company’s board of directors, management, and other personnel to provide reasonable assurance regarding the reliability of financial reporting and the preparation of financial statements for external purposes in accordance with generally accepted accounting principles. A company’s internal control over financial reporting includes those policies and procedures that (1) pertain to the maintenance of records that, in reasonable detail, accurately and fairly reflect the transactions and dispositions of the assets of the company; (2) provide reasonable assurance that transactions are recorded as necessary to permit preparation of financial statements in accordance with generally accepted accounting principles and that receipts and expenditures of the company are being made only in accordance with authorizations of management and directors of the company; and (3) provide reasonable assurance regarding prevention or timely detection of unauthorized acquisition, use, or disposition of the company’s assets that could have a material effect on the financial statements.
Because of the inherent limitations of internal control over financial reporting, including the possibility of collusion or improper management override of controls, material misstatements due to error or fraud may not be prevented or detected on a timely basis. Also, projections of any evaluation of the effectiveness of the internal control over financial reporting to future periods are subject to the risk that the controls may become inadequate because of changes in conditions, or that the degree of compliance with the policies or procedures may deteriorate.
In our opinion, the consolidated financial statements referred to above present fairly, in all material respects, the financial position of RTI Surgical, Inc. and subsidiaries as of December 31, 2014 and 2013, and the results of their operations and their cash flows for each of the three years in the period ended December 31, 2014, in conformity with accounting principles generally accepted in the United States of America. Also, in our opinion, such financial statement schedule, when considered in relation to the basic consolidated financial statements taken as a whole, presents fairly, in all material respects, the information set forth therein. Also, in our opinion, the Company maintained, in all material respects, effective internal control over financial reporting as of December 31, 2014, based on the criteria established in Internal Control—Integrated Framework (2013) issued by the Committee of Sponsoring Organizations of the Treadway Commission.
/s/ DELOITTE & TOUCHE LLP
Certified Public Accountants
Tampa, Florida
March 4, 2015
49
Table of Contents
RTI SURGICAL, INC. AND SUBSIDIARIES
Consolidated Balance Sheets
(In thousands, except share data)
| December 31, | ||||||||
| 2014 | 2013 | |||||||
| Assets | ||||||||
| Current Assets: |
||||||||
| Cash and cash equivalents |
$ | 15,703 | $ | 18,721 | ||||
| Accounts receivable—less allowances of $818 at December 31, 2014 and $492 at December 31, 2013 |
38,833 | 31,752 | ||||||
| Inventories—net |
113,464 | 106,126 | ||||||
| Prepaid and other current assets |
6,668 | 5,483 | ||||||
| Deferred tax assets—net |
22,828 | 24,577 | ||||||
|
|
|
|
|
|||||
| Total current assets |
197,496 | 186,659 | ||||||
| Property, plant and equipment—net |
77,028 | 74,738 | ||||||
| Deferred tax assets—net |
6,193 | 5,452 | ||||||
| Goodwill |
54,887 | 54,887 | ||||||
| Other intangible assets—net |
30,261 | 33,786 | ||||||
| Other assets—net |
12,270 | 14,332 | ||||||
|
|
|
|
|
|||||
| Total assets |
$ | 378,135 | $ | 369,854 | ||||
|
|
|
|
|
|||||
| Liabilities and Stockholders’ Equity | ||||||||
| Current Liabilities: |
||||||||
| Accounts payable |
$ | 26,834 | $ | 23,231 | ||||
| Accrued expenses |
24,689 | 22,478 | ||||||
| Deferred tax liabilities |
— | 195 | ||||||
| Current portion of deferred revenue |
5,984 | 5,109 | ||||||
| Current portion of short and long-term obligations |
6,479 | 1,344 | ||||||
|
|
|
|
|
|||||
| Total current liabilities |
63,986 | 52,357 | ||||||
| Long-term obligations—less current portion |
69,413 | 67,706 | ||||||
| Other long-term liabilities |
11,607 | 13,446 | ||||||
| Deferred revenue |
12,460 | 18,755 | ||||||
|
|
|
|
|
|||||
| Total liabilities |
157,466 | 152,264 | ||||||
| Preferred stock Series A, $.001 par value: 5,000,000 shares authorized; 50,000 shares issued and outstanding |
52,834 | 49,537 | ||||||
| Stockholders’ equity: |
||||||||
| Common stock, $.001 par value: 150,000,000 shares authorized; 56,917,414 and 56,388,063 shares issued and outstanding, respectively |
57 | 56 | ||||||
| Additional paid-in capital |
415,702 | 415,426 | ||||||
| Accumulated other comprehensive loss |
(3,881 | ) | (812 | ) | ||||
| Accumulated deficit |
(243,854 | ) | (246,550 | ) | ||||
| Less treasury stock, 180,898 and 146,957 shares, respectively, at cost |
(189 | ) | (67 | ) | ||||
|
|
|
|
|
|||||
| Total stockholders’ equity |
167,835 | 168,053 | ||||||
|
|
|
|
|
|||||
| Total liabilities and stockholders’ equity |
$ | 378,135 | $ | 369,854 | ||||
|
|
|
|
|
|||||
See notes to consolidated financial statements.
50
Table of Contents
RTI SURGICAL, INC. AND SUBSIDIARIES
Consolidated Statements of Comprehensive (Loss) Income
(In thousands, except share and per share data)
| Year Ended December 31, | ||||||||||||
| 2014 | 2013 | 2012 | ||||||||||
| Revenues |
$ | 262,810 | $ | 197,979 | $ | 178,113 | ||||||
| Costs of processing and distribution |
129,013 | 117,874 | 92,896 | |||||||||
|
|
|
|
|
|
|
|||||||
| Gross profit |
133,797 | 80,105 | 85,217 | |||||||||
|
|
|
|
|
|
|
|||||||
| Expenses: |
||||||||||||
| Marketing, general and administrative |
107,653 | 81,635 | 58,376 | |||||||||
| Research and development |
15,536 | 15,241 | 12,231 | |||||||||
| Asset abandonments |
— | — | 20 | |||||||||
| Litigation settlement |
185 | 3,000 | 2,350 | |||||||||
| Restructuring charges |
— | 2,881 | — | |||||||||
| Acquisition expenses |
— | 6,004 | — | |||||||||
| Severance charges |
4,798 | — | — | |||||||||
|
|
|
|
|
|
|
|||||||
| Total operating expenses |
128,172 | 108,761 | 72,977 | |||||||||
|
|
|
|
|
|
|
|||||||
| Operating income (loss) |
5,625 | (28,656 | ) | 12,240 | ||||||||
|
|
|
|
|
|
|
|||||||
| Other (expense) income: |
||||||||||||
| Interest expense |
(1,357 | ) | (542 | ) | — | |||||||
| Interest income |
9 | 23 | 185 | |||||||||
| Foreign exchange (loss) gain |
(88 | ) | 251 | 19 | ||||||||
|
|
|
|
|
|
|
|||||||
| Total other (expense) income—net |
(1,436 | ) | (268 | ) | 204 | |||||||
|
|
|
|
|
|
|
|||||||
| Income (loss) before income tax benefit (provision) |
4,189 | (28,924 | ) | 12,444 | ||||||||
| Income tax (provision) benefit |
(1,493 | ) | 11,110 | (4,042 | ) | |||||||
|
|
|
|
|
|
|
|||||||
| Net income (loss) |
2,696 | (17,814 | ) | 8,402 | ||||||||
|
|
|
|
|
|
|
|||||||
| Convertible preferred dividend |
(3,113 | ) | (1,375 | ) | — | |||||||
|
|
|
|
|
|
|
|||||||
| Net (loss) income applicable to common shares |
$ | (417 | ) | $ | (19,189 | ) | $ | 8,402 | ||||
|
|
|
|
|
|
|
|||||||
| Other comprehensive (loss) gain: |
||||||||||||
| Unrealized foreign currency translation (loss) gain |
(3,069 | ) | 964 | 408 | ||||||||
|
|
|
|
|
|
|
|||||||
| Comprehensive (loss) income |
$ | (3,486 | ) | $ | (18,225 | ) | $ | 8,810 | ||||
|
|
|
|
|
|
|
|||||||
| Net (loss) income per common share—basic |
$ | (0.01 | ) | $ | (0.34 | ) | $ | 0.15 | ||||
|
|
|
|
|
|
|
|||||||
| Net (loss) income per common share—diluted |
$ | (0.01 | ) | $ | (0.34 | ) | $ | 0.15 | ||||
|
|
|
|
|
|
|
|||||||
| Weighted average shares outstanding—basic |
56,735,924 | 56,258,624 | 55,861,957 | |||||||||
|
|
|
|
|
|
|
|||||||
| Weighted average shares outstanding—diluted |
56,735,924 | 56,258,624 | 56,068,795 | |||||||||
|
|
|
|
|
|
|
|||||||
See notes to consolidated financial statements.
51
Table of Contents
RTI SURGICAL, INC. AND SUBSIDIARIES
Consolidated Statements of Stockholders’ Equity
(In thousands)
| Common Stock |
Additional Paid-in Capital |
Accumulated Other Comprehensive Loss |
Accumulated Deficit |
Treasury Stock |
Total | |||||||||||||||||||
| Balance, January 1, 2012 |
$ | 56 | $ | 411,699 | $ | (2,184 | ) | $ | (237,138 | ) | $ | (14 | ) | $ | 172,419 | |||||||||
| Net income |
— | — | — | 8,402 | — | 8,402 | ||||||||||||||||||
| Foreign currency translation adjustment |
— | — | 408 | — | — | 408 | ||||||||||||||||||
| Exercise of common stock options |
— | 514 | — | — | — | 514 | ||||||||||||||||||
| Stock-based compensation |
— | 2,078 | — | — | — | 2,078 | ||||||||||||||||||
| Purchase of treasury stock |
— | — | — | — | (20 | ) | (20 | ) | ||||||||||||||||
| Change in income tax benefit from stock-based compensation |
— | 191 | — | — | — | 191 | ||||||||||||||||||
|
|
|
|
|
|
|
|
|
|
|
|
|
|||||||||||||
| Balance, December 31, 2012 |
56 | 414,482 | (1,776 | ) | (228,736 | ) | (34 | ) | 183,992 | |||||||||||||||
|
|
|
|
|
|
|
|
|
|
|
|
|
|||||||||||||
| Net loss |
— | — | — | (17,814 | ) | — | (17,814 | ) | ||||||||||||||||
| Foreign currency translation adjustment |
— | — | 964 | — | — | 964 | ||||||||||||||||||
| Exercise of common stock options |
— | 332 | — | — | — | 332 | ||||||||||||||||||
| Stock-based compensation |
— | 2,220 | — | — | — | 2,220 | ||||||||||||||||||
| Purchase of treasury stock |
— | — | — | — | (33 | ) | (33 | ) | ||||||||||||||||
| Amortization of preferred stock |
||||||||||||||||||||||||
| Series A issuance costs |
— | (77 | ) | — | — | — | (77 | ) | ||||||||||||||||
| Preferred stock Series A dividend |
— | (1,375 | ) | — | — | — | (1,375 | ) | ||||||||||||||||
| Change in income tax benefit from stock-based compensation |
— | (156 | ) | — | — | — | (156 | ) | ||||||||||||||||
|
|
|
|
|
|
|
|
|
|
|
|
|
|||||||||||||
| Balance, December 31, 2013 |
56 | 415,426 | (812 | ) | (246,550 | ) | (67 | ) | 168,053 | |||||||||||||||
|
|
|
|
|
|
|
|
|
|
|
|
|
|||||||||||||
| Net income |
— | — | — | 2,696 | — | 2,696 | ||||||||||||||||||
| Foreign currency translation adjustment |
— | — | (3,069 | ) | — | — | (3,069 | ) | ||||||||||||||||
| Exercise of common stock options |
1 | 888 | — | — | — | 889 | ||||||||||||||||||
| Stock-based compensation |
— | 3,032 | — | — | — | 3,032 | ||||||||||||||||||
| Purchase of treasury stock |
— | — | — | — | (122 | ) | (122 | ) | ||||||||||||||||
| Amortization of preferred stock Series A issuance costs |
— | (184 | ) | — | — | — | (184 | ) | ||||||||||||||||
| Preferred stock Series A dividend |
— | (3,113 | ) | — | — | — | (3,113 | ) | ||||||||||||||||
| Change in income tax benefit from stock-based compensation |
— | (347 | ) | — | — | — | (347 | ) | ||||||||||||||||
|
|
|
|
|
|
|
|
|
|
|
|
|
|||||||||||||
| Balance, December 31, 2014 |
$ | 57 | $ | 415,702 | $ | (3,881 | ) | $ | (243,854 | ) | $ | (189 | ) | $ | 167,835 | |||||||||
|
|
|
|
|
|
|
|
|
|
|
|
|
|||||||||||||
See notes to consolidated financial statements.
52
Table of Contents
RTI SURGICAL, INC. AND SUBSIDIARIES
Consolidated Statements of Cash Flows
(In thousands)
| Year Ended December 31, | ||||||||||||
| 2014 | 2013 | 2012 | ||||||||||
| Cash flows from operating activities: |
||||||||||||
| Net income (loss) |
$ | 2,696 | $ | (17,814 | ) | $ | 8,402 | |||||
| Adjustments to reconcile net income (loss) to net cash provided by (used in) operating activities: |
||||||||||||
| Depreciation and amortization expense |
15,395 | 12,202 | 7,993 | |||||||||
| Provision for bad debts and product returns |
891 | 435 | 136 | |||||||||
| Provision for inventory write-downs |
3,763 | 1,785 | 3,114 | |||||||||
| Amortization of deferred revenue |
(5,420 | ) | (6,451 | ) | (4,656 | ) | ||||||
| Deferred income tax provision (benefit) |
502 | (11,544 | ) | 797 | ||||||||
| Stock-based compensation |
3,032 | 2,220 | 2,078 | |||||||||
| Other |
958 | 227 | 706 | |||||||||
| Change in assets and liabilities: |
||||||||||||
| Accounts receivable |
(8,058 | ) | (50 | ) | (1,121 | ) | ||||||
| Inventories |
(11,244 | ) | 5,231 | (2,880 | ) | |||||||
| Accounts payable |
4,087 | 5,276 | 3,527 | |||||||||
| Accrued expenses |
1,375 | (3,247 | ) | 1,002 | ||||||||
| Deferred revenue |
— | 6,000 | 3,000 | |||||||||
| Other operating assets and liabilities |
(1,083 | ) | 1,276 | (1,295 | ) | |||||||
|
|
|
|
|
|
|
|||||||
| Net cash provided by (used in) operating activities |
6,894 | (4,454 | ) | 20,803 | ||||||||
|
|
|
|
|
|
|
|||||||
| Cash flows from investing activities: |
||||||||||||
| Purchases of property, plant and equipment |
(15,577 | ) | (15,011 | ) | (11,089 | ) | ||||||
| Patent and acquired intangible asset costs |
(737 | ) | (915 | ) | (3,772 | ) | ||||||
| Acquisition of Pioneer Surgical Technology |
— | (126,307 | ) | — | ||||||||
| Acquisition of recovery agency assets |
— | — | (3,000 | ) | ||||||||
| Other investing activities |
— | — | 49 | |||||||||
|
|
|
|
|
|
|
|||||||
| Net cash used in investing activities |
(16,314 | ) | (142,233 | ) | (17,812 | ) | ||||||
|
|
|
|
|
|
|
|||||||
| Cash flows from financing activities: |
||||||||||||
| Proceeds from exercise of common stock options |
889 | 332 | 514 | |||||||||
| Proceeds from long-term obligations |
7,000 | 68,250 | — | |||||||||
| Net proceeds from short-term obligations |
658 | 638 | — | |||||||||
| Payment of debt issuance costs |
— | (699 | ) | — | ||||||||
| Proceeds from preferred stock issuance |
— | 50,000 | — | |||||||||
| Payment of preferred stock issuance costs |
— | (1,290 | ) | — | ||||||||
| Payment of preferred stock dividend |
— | (625 | ) | — | ||||||||
| Payments on long-term obligations |
(682 | ) | (142 | ) | (471 | ) | ||||||
| Other financing activities |
5 | (841 | ) | 474 | ||||||||
|
|
|
|
|
|
|
|||||||
| Net cash provided by financing activities |
7,870 | 115,623 | 517 | |||||||||
|
|
|
|
|
|
|
|||||||
| Effect of exchange rate changes on cash and cash equivalents |
(1,468 | ) | 89 | 10 | ||||||||
|
|
|
|
|
|
|
|||||||
| Net (decrease) increase in cash and cash equivalents |
(3,018 | ) | (30,975 | ) | 3,518 | |||||||
| Cash and cash equivalents, beginning of period |
18,721 | 49,696 | 46,178 | |||||||||
|
|
|
|
|
|
|
|||||||
| Cash and cash equivalents, end of period |
$ | 15,703 | $ | 18,721 | $ | 49,696 | ||||||
|
|
|
|
|
|
|
|||||||
| Supplemental cash flow disclosure: |
||||||||||||
| Cash paid for interest |
$ | 1,624 | $ | 570 | $ | 22 | ||||||
| Cash paid for income taxes, net of refunds |
578 | 2,819 | 3,187 | |||||||||
| Change in accrual for purchases of property, plant and equipment |
1,947 | 1,557 | 199 | |||||||||
| Change in accrual for acquired intangible asset costs |
— | — | 1,690 | |||||||||
| Change in accrued dividend payable |
3,113 | 750 | — | |||||||||
| Contingent consideration for asset purchase |
— | — | 900 | |||||||||
See notes to consolidated financial statements.
53
Table of Contents
RTI SURGICAL, INC. AND SUBSIDIARIES
Notes to Consolidated Financial Statements
Years Ended December 31, 2014, 2013 and 2012
(In thousands, except share and per share data)
1. Business
RTI Surgical, Inc. (the “Company”), and its subsidiaries recover and process human and animal tissue and manufacture metal and synthetic implants and instruments. The processing transforms the tissue into either conventional or precision machined allograft implants (human) or xenograft implants (animal). The implants are used for orthopedic and other surgical applications to promote the natural healing of human bone and other human tissue. These implants are distributed domestically and internationally, for use in reconstruction and fracture repair.
2. Summary of Significant Accounting Policies
Principles of Consolidation—The consolidated financial statements include the accounts of the Company and its wholly owned subsidiaries, Pioneer Surgical Technology, Inc. (“Pioneer”), Tutogen Medical, Inc. (“TMI”), RTI Biologics, Inc. – Cardiovascular (inactive), Biological Recovery Group (inactive), and RTI Services, Inc. The consolidated financial statements also include the accounts of RTI Donor Services, Inc. (“RTIDS”), which is a controlled entity. The consolidated financial statements have been prepared in accordance with accounting principles generally accepted in the United States of America (“U.S. GAAP”). All intercompany balances and transactions have been eliminated in consolidation.
RTIDS is a taxable not-for-profit entity organized and controlled by the Company. RTIDS is the corporate entity that is responsible for procuring tissue for the Company. Expenses incurred by RTIDS to procure tissue are passed through to the Company. RTIDS has no significant assets or liabilities except for its intercompany accounts receivable and accounts payable to tissue recovery agencies. The Company pays all expenses of RTIDS.
Use of Estimates—The preparation of consolidated financial statements in conformity with U.S. GAAP requires management to make estimates and assumptions that affect the reported amounts of assets and liabilities and disclosures of contingent assets and liabilities at the date of the financial statements and the reported amounts of revenues and expenses during the reporting period. Estimates and assumptions relating to inventories, receivables, long-lived assets, investment valuations and litigation are made at the end of each financial reporting period by management. Actual results could differ from those estimates.
Foreign Currency Translation—The functional currency of the Company’s foreign subsidiaries is the Euro. Assets and liabilities of the foreign subsidiaries are translated at the period end exchange rate while revenues and expenses are translated at the average exchange rate for the period. The resulting translation adjustments, representing unrealized, noncash gains and losses are recorded and presented as a component of comprehensive (loss) income. Gains and losses resulting from transactions of the Company and its subsidiaries, which are made in currencies different from their own, are included in income or loss as they occur and are included in other (expense) income in the consolidated statements of comprehensive (loss) income.
Fair Value of Financial Instruments—The estimated fair value of financial instruments disclosed in the consolidated financial statements has been determined by using available market information and appropriate valuation methodologies. The carrying value of all current assets and current liabilities approximates fair value because of their short-term nature. The carrying value of the long-term debt obligations approximates fair value. The carrying value of capital lease obligations approximates their fair value, based on current market prices.
Cash and Cash Equivalents— The Company considers all funds in banks and short-term highly liquid investments with an original maturity of three months or less to be cash and cash equivalents. Cash equivalents
54
Table of Contents
comprise overnight repurchase agreements. Cash balances are held at a few financial institutions and usually exceed insurable amounts. The Company mitigates this risk by depositing its uninsured cash in major well capitalized financial institutions, and by investing excess operating cash in overnight repurchase agreements which are 101% collateralized by U.S. Government backed securities with the Company’s bank. At December 31, 2013 and 2014, the Company had no cash equivalents as the full balance of cash and cash equivalents was held as cash.
Accounts Receivable Allowances— The Company maintains allowances for doubtful accounts based on the Company’s review and assessment of payment history and its estimate of the ability of each customer to make payments on amounts invoiced. If the financial condition of any of its customers were to deteriorate, additional allowances might be required. From time to time the Company must adjust its estimates. Changes in estimates of the collection risk related to accounts receivable can result in decreases and increases to current period net income.
Inventories—Inventories are stated at the lower of cost or market, with cost determined using the first-in, first-out method. Inventory writedowns for unprocessed donor tissue are recorded based on the estimated amount of inventory that will not pass the quality control process based on historical data, and the amount of inventory that is not readily distributable or is unusable. In addition, provisions for inventory writedowns are estimated for tissue in process inventory that is not readily distributable or is unusable. Any implantable donor tissue deemed to be obsolete is included in the writedown at the time the determination is made. Non-tissue inventory is evaluated for obsolescence and excess quantities by analyzing inventory levels, historical loss trends, expected product lives, product at risk of expiration, sales levels by product and projections of future sales demand.
Implant and Product Recalls—The Company accrues the estimated cost of recalls at the date the recall is initiated. The cost of recalls is primarily comprised of implant replacement costs. The Company incurred immaterial costs related to all of the recalls for the years ended December 31, 2014, 2013 and 2012.
Surgical Instruments—Surgical instruments which are included in property, plant and equipment are handheld devices used by surgeons during implant procedures. The Company retains title to the surgical instruments. Depreciation for surgical instruments is included in selling and marketing expenses in the accompanying consolidated statements of comprehensive (loss) income.
Property, Plant and Equipment—Property, plant and equipment are stated at cost less accumulated depreciation. The cost of equipment under capital leases and leasehold improvements is amortized on the straight-line method over the shorter of the lease term or the estimated useful life of the asset. Depreciation is computed on the straight-line method over the following estimated useful lives of the assets:
| Buildings |
25 to 40 years | |||
| Building improvements and leasehold improvements |
8 to 40 years | |||
| Processing equipment |
7 to 10 years | |||
| Office equipment, furniture and fixtures |
5 to 7 years | |||
| Computer hardware and software |
3 to 7 years | |||
| Surgical instruments |
3 years |
Software Costs—Included in property, plant and equipment are costs related to purchased software that are capitalized.
Debt Issuance Costs—Debt issuance costs include costs incurred to obtain financing and are amortized using the straight-line method, which approximates the effective interest method, over the life of the related debt. Debt issuance costs are included in prepaid and other current assets and other assets—net in the accompanying consolidated balance sheets.
55
Table of Contents
Long-Lived Assets— The Company periodically evaluates the period of depreciation or amortization for long-lived assets to determine whether current circumstances warrant revised estimates of useful lives. The Company reviews its property, plant and equipment for impairment whenever events or changes in circumstances indicate the carrying value of an asset may not be recoverable. Recoverability is measured by a comparison of the carrying amount to the net undiscounted cash flows expected to be generated by the asset. An impairment loss would be recorded for the excess of net carrying value over the fair value of the asset impaired. The fair value is estimated based on expected discounted future cash flows. The results of impairment tests are subject to management’s estimates and assumptions of projected cash flows and operating results. Changes in assumptions or market conditions could result in a change in estimated future cash flows and the likelihood of materially different reported results.
Goodwill— FASB Accounting Standards Codification (“ASC”) 350, Goodwill and Other Intangible Assets (“FASB ASC 350”), requires companies to test goodwill for impairment on an annual basis at the reporting unit level (or an interim basis if an event occurs that might reduce the fair value of a reporting unit below its carrying value). The Company has one reporting unit and the annual impairment test is performed at each year-end unless indicators of impairment are present and require more frequent testing. The Company did not have any identifiable intangible assets with indefinite useful lives as of December 31, 2014 and 2013.
Goodwill is tested for impairment annually by comparing the fair value of the reporting unit to its carrying amount, including goodwill. The Company adopted ASU No. 2011-08, Intangibles – Goodwill and Other: Testing Goodwill for Impairment, which permits the consideration of qualitative indicators of the fair value of a reporting unit when it is unlikely that a reporting unit has impaired goodwill. If the Company determines the fair value is more-likely- than-not greater than its carrying amount, no additional testing is considered necessary. However, if the Company determines the fair value is more-likely-than-not below the carrying value of the reporting unit, the Company performs the two step goodwill impairment test. If the two step goodwill impairment test is required, an income approach and a market approach are utilized. The conclusion from these two approaches are generally weighted equally and then adjusted to incorporate a control premium or acquisition premium that reflects the additional amount a buyer is willing to pay for elements of control and for a premium that reflects the buyer’s perception of its ability to add value through synergies.
In general, the income approach employs a discounted cash flow model that considers; 1) assumptions that marketplace participants would use in their estimates of fair value, including the cash flow period, terminal values based on a terminal growth rate and the discount rate; 2) current period actual results, and 3) projected results for future periods that have been prepared and approved by senior management of the Company. The forecasted cash flows do not include synergies that a marketplace participant would be expecting to achieve.
The market approach employs market multiples from guideline public companies operating in our industry. Estimates of fair value are derived by applying multiples based on revenue and earnings before interest, taxes, depreciation and amortization (“EBITDA”) adjusted for size and performance metrics relative to peer companies. A control premium was included in determining the fair value under this approach.
If the carrying amount of the reporting unit exceeds its calculated fair value, the second step of the goodwill impairment test is performed in accordance with FASB ASC 350 to measure the amount of the impairment loss, if any.
Both approaches used in the analysis have a degree of uncertainty. Potential events or changes in circumstances which could impact the key assumptions used in our goodwill impairment evaluation are as follows:
| • | Change in peer group or performance of peer group companies |
| • | Change in the Company’s markets and estimates of future operating performance |
56
Table of Contents
| • | Change in the Company’s estimated market cost of capital |
| • | Change in implied control premiums related to acquisitions in the medical device industry. |
Goodwill represents the excess of purchase price over fair value of tangible net assets of acquired businesses at the acquisition date, after amounts allocated to other identifiable intangible assets. Factors that contribute to the recognition of goodwill include securing synergies that are specific to our business and not available to other market participants and are expected to increase revenues and profits; acquisition of a talented workforce; cost savings opportunities; the strategic benefit of expanding our presence in core and adjacent markets; and diversifying our product portfolio.
Other Intangible Assets —Other intangible assets generally consist of patents, acquired exclusivity rights, licensing rights, trademarks, customer lists, non-compete agreements, distribution agreements, and procurement contracts. Patents and trademarks are amortized on the straight-line method over the shorter of the remaining protection period or estimated useful lives of between 8 and 16 years. The acquired exclusivity rights are being amortized over eight years, the remaining term of the amended distribution agreement. Licensing rights, customer lists, non-compete agreements, distribution agreements, and procurement contracts are amortized over estimated useful lives of between 5 to 25 years.
Other intangible assets are tested for impairment annually or whenever events or circumstances indicate that the carrying amount of an asset or asset group may not be recoverable. The Company had one asset group for the year ended December 31, 2013 and 2014. The recoverability test is described in the Company’s accounting policy for long-lived assets set forth above.
Revenue Recognition—Revenue is recognized upon shipping, or receipt by the Company’s customers of the implant, depending on the Company’s distribution agreements with the Company’s customers or distributors. Other revenues are recognized when all significant contractual obligations have been satisfied.
The Company permits returns of implants in accordance with the terms of contractual agreements with customers if the implant is returned in a timely manner, in unopened packaging, and from the normal channels of distribution. Allowances for returns are provided based upon analysis of the Company’s historical patterns of returns matched against the revenues from which they originated.
The Company records estimated implant returns, discounts, rebates and other distribution incentives as a reduction of revenue in the same period revenue is recognized. Estimates of implant returns are recorded for anticipated implant returns based on historical distributions and returns information. Estimates of discounts, rebates and other distribution incentives are recorded based on contractual terms, historical experience and trend analysis.
Other Revenues—Other revenues consists of service processing, tissue recovery fees, biomedical laboratory fees, recognition of previously deferred revenues, shipping fees, distribution of reproductions of our allografts to distributors for demonstration purposes and restocking fees.
Stock-Based Compensation Plans—The Company accounts for its stock-based compensation plans in accordance with FASB ASC 718, Accounting for Stock Compensation. FASB ASC 718 requires the measurement and recognition of compensation expense for all stock-based awards made to employees and directors, including employee stock options and restricted stock. Under the provisions of FASB ASC 718, and U.S. Securities and Exchange Commission Staff Accounting Bulletin No. 107, stock-based compensation cost is measured at the grant date, based on the calculated fair value of the award, and is recognized as an expense on a straight-line basis over the requisite service period of the entire award (generally the vesting period of the award).
Research and Development Costs—Research and development costs, including the cost of research and development conducted for others and the cost of contracted research and development, are expensed as incurred.
57
Table of Contents
Income Taxes—The Company uses the asset and liability method of accounting for income taxes. Deferred income taxes are recorded to reflect the tax consequences on future years for differences between the tax basis of assets and liabilities and their financial reporting amounts at each year-end based on enacted tax laws and statutory tax rates applicable to the periods in which the differences are expected to affect taxable income. Valuation allowances are established when necessary to reduce deferred tax assets to amounts which are more likely than not to be realized.
Earnings Per Share—Basic earnings per share (“EPS”) is computed by dividing earnings attributable to common stockholders by the weighted-average number of common shares outstanding for the periods. Diluted EPS reflects the potential dilution of securities that could share in the earnings. A reconciliation of the number of common shares used in the calculation of basic and diluted EPS is presented below:
| Year Ended December 31, | ||||||||||||
| 2014 | 2013 | 2012 | ||||||||||
| Basic shares |
56,735,924 | 56,258,624 | 55,861,957 | |||||||||
| Effect of dilutive securities: |
||||||||||||
| Stock options |
— | — | 206,838 | |||||||||
|
|
|
|
|
|
|
|||||||
| Diluted shares |
56,735,924 | 56,258,624 | 56,068,795 | |||||||||
|
|
|
|
|
|
|
|||||||
Options to purchase 5,735,784 shares of common stock at prices ranging from $2.69 to $9.57 per share which were outstanding as of December 31, 2014, were not included in the computation of diluted EPS because dilutive shares are not factored into the calculation of EPS when a loss applicable to common shares is reported as they would be anti-dilutive.
Options to purchase 5,518,604 shares of common stock at prices ranging from $2.54 to $13.52 per share which were outstanding as of December 31, 2013, were not included in the computation of diluted EPS because dilutive shares are not factored into the calculation of EPS when a loss applicable to common shares is reported as they would be anti-dilutive.
Options to purchase 5,083,834 shares of common stock at prices ranging from $2.54 to $14.95 per share which were outstanding as of December 31, 2012, were included in the computation of diluted EPS because dilutive shares are factored into the calculation of EPS when income applicable to common shares is reported.
For the years ended December 31, 2014 and 2013, 50,000 shares of convertible preferred stock and accrued but unpaid dividends were anti-dilutive on an as if-converted basis and were not included in the computation of diluted net loss per common share in either year.
3. Recently Issued Accounting Standards.
Presentation of Financial Statements—Going Concern—In August 2014, the Financial Accounting Standards Board issued Accounting Standards Update 2014-15, “Presentation of Financial Statements—Going Concern (Subtopic 205-40).” The new guidance addresses management’s responsibility to evaluate whether there is substantial doubt about an entity’s ability to continue as a going concern and to provide related footnote disclosures. Management’s evaluation should be based on relevant conditions and events that are known and reasonably knowable at the date that the financial statements are issued. The standard will be effective for the first interim period within annual reporting periods beginning after December 15, 2016. Early adoption is permitted. The Company does not expect to early adopt this guidance and does not believe that the adoption of this guidance will have a material impact on its consolidated financial statements.
Revenue from Contracts with Customers—In May 2014, the FASB issued Accounting Standards Update (“ASU”) No. 2014-09, Revenue from Contracts with Customers (Topic 606), which supersedes the revenue recognition requirements in Accounting Standards Codification (“ASC”) Topic 605, Revenue Recognition. This ASU is based on the principle that revenue is recognized to depict the transfer of goods or services to customers
58
Table of Contents
in an amount that reflects the consideration to which the entity expects to be entitled in exchange for those goods or services. The ASU also requires additional disclosure about the nature, amount, timing and uncertainty of revenue and cash flows arising from customer contracts, including significant judgments and changes in judgments and assets recognized from costs incurred to obtain or fulfill a contract. The effective date will be annual reporting periods beginning after December 15, 2016 using one of two retrospective application methods. The Company has not yet determined the potential effects, if any, on its consolidated financial statements.
4. Merger with Pioneer Surgical Technology, Inc.
On July 16, 2013, the Company completed its acquisition of Pioneer. Under the terms of the merger agreement dated June 12, 2013, the Company acquired Pioneer for $126,307 in cash. The transaction was funded through a combination of cash on hand, a new credit facility and a concurrent private placement of convertible preferred equity. The Company obtained from Toronto-Dominion Bank, N.A., TD Securities “USA” LLC (“TD Bank”) and Regions Bank, a 5 year, $80,000 senior secured facility, which includes a $60,000 term loan and a $20,000 revolving credit facility, that matures on July 16, 2018 with a variable interest rate between 100 and 300 basis points in excess of the one month LIBOR rate. The $20,000 revolving credit facility replaced the Company’s previous $15,000 U.S. credit facility.
Additionally, the Company received $50,000 in gross proceeds from a private placement of convertible preferred equity to WSHP Biologics Holdings, LLC, (“WSHP”), a leading healthcare-focused private equity firm. The convertible preferred stock is convertible into shares of the Company’s common stock. The convertible preferred stock will also accrue dividends at a rate of 6% per year. In 2013, the Company capitalized $1,989 in financing costs associated with the preferred stock issuance and the debt issuance and expensed $6,004 of acquisition costs. The acquisition costs are reflected separately in the accompanying Consolidated Statements of Comprehensive (Loss) Income.
The Company has accounted for the acquisition of Pioneer under ASC 805, Business Combinations. Pioneer’s results of operations are included in the consolidated financial statements for periods ending after July 16, 2013, the acquisition date.
The purchase price was financed as follows:
| (In thousands) | ||||
| Cash proceeds from term loan |
$ | 60,000 | ||
| Net cash proceeds from preferred share issuance |
48,710 | |||
| Cash from RTI Surgical |
17,597 | |||
|
|
|
|||
| Total purchase price |
$ | 126,307 | ||
|
|
|
|||
The table below represents an allocation of the total consideration to Pioneer’s tangible and intangible assets and liabilities based on management’s estimate of their respective fair values as of July 16, 2013.
| Inventories |
$ | 35,972 | ||
| Accounts receivable |
10,567 | |||
| Other current assets |
6,059 | |||
| Property, plant and equipment |
15,258 | |||
| Other assets |
13,260 | |||
| Current liabilities |
(10,893 | ) | ||
| Other long-term liabilities |
(19,841 | ) | ||
|
|
|
|||
| Net tangible assets acquired |
50,382 | |||
| Other intangible assets |
23,100 | |||
| Goodwill |
52,825 | |||
|
|
|
|||
| Total net assets acquired |
$ | 126,307 | ||
|
|
|
59
Table of Contents
Total net assets acquired as of July 16, 2013, are all part of the Company’s only operating segment. Fair values are based on management’s estimates and assumptions including variations of the income approach, the cost approach and the market approach.
The Company believes that the acquisition of Pioneer has offered and continues to offer the potential for substantial strategic and financial benefits. The transaction will enhance the Company’s existing core competency in biologics processing with the addition of Pioneer’s core competency in metals and synthetics. The Company believes the acquisition will enhance stockholder value through, among other things, enabling the Company to capitalize on the following strategic advantages and opportunities:
| • | Diversification of its implant portfolio. |
| • | Expansion of its direct distribution and marketing organizations. |
| • | Enhancement of its current international business. |
| • | Improvement of its margin profile and additional revenue opportunities. |
These potential benefits resulted in the Company paying a premium for Pioneer resulting in the recognition of goodwill. The $52,825 of goodwill was assigned to the Company’s only operating segment.
The fair value of receivables acquired is $10,567, with the gross contractual amount being $11,712, of which $1,145 was not expected to be collected.
The amount of Pioneer’s revenues and net income since the July 16, 2013 acquisition date, included in the Company’s Consolidated Statement of Comprehensive (Loss) Income for the year ended December 31, 2013, are $35,994 and $894, respectively.
The following unaudited pro forma information shows the results of the Company’s operations as though the acquisition had occurred as of the beginning of that period (in thousands, except per share data):
| December 31, | ||||||||
| 2013 | 2012 | |||||||
| Revenues |
$ | 243,001 | $ | 266,293 | ||||
| Net (loss) income applicable to common shares |
(5,597 | ) | 4,636 | |||||
| Basic net (loss) income per share |
(0.10 | ) | 0.08 | |||||
| Diluted net (loss) income per share |
(0.10 | ) | 0.08 | |||||
The pro forma results have been prepared for comparative purposes only and are not necessarily indicative of the actual results of operations had the merger taken place as of the beginning of the periods presented, or the results that may occur in the future.
These amounts have been calculated to reflect the additional depreciation, amortization, preferred dividend, and interest expense that would have been incurred assuming the fair value of adjustments and borrowings occurred on January 1, 2012 and January 1, 2013, together with the consequential tax effects. In addition, these amounts exclude costs incurred which are directly attributable to the acquisition, and which do not have a continuing impact on the combined companies’ operating results.
The Company completed its analysis of the purchase price allocation in the third quarter of 2014.
5. Stock-Based Compensation
The Company has five stock-based compensation plans under which employees, consultants and outside directors have received stock options and restricted stock awards. The Company’s policy is to grant stock options
60
Table of Contents
at an exercise price equal to 100% of the market value of a share of common stock at closing on the date of the grant. The Company’s stock options generally have ten-year contractual terms and vest over a one to five year period from the date of grant. The Company’s policy is to grant restricted stock awards at a fair value equal to 100% of the market value of a share of common stock at closing on the date of the grant. The Company’s restricted stock awards generally vest over one to three year periods.
1998 Stock Option Plan, 2004 Equity Incentive Plan and 2010 Equity Incentive Plan—The Company adopted equity incentive plans in 1998 (the “1998 Plan”), 2004 (the “2004 Plan”) and 2010 (the “2010 Plan”), which provide for the grant of incentive and nonqualified stock options and restricted stock to key employees, including officers and directors of the Company and consultants and advisors. The 2010 Plan allows for up to 5,000,000 shares of common stock to be issued with respect to awards granted. New stock options may no longer be awarded under either the 1998 Plan or the 2004 Plan.
TMI 1996 Stock Option Plan and TMI 2006 Incentive and Non-Statutory Stock Option Plan—In connection with the merger with TMI in 2008, the Company assumed the TMI 1996 Stock Option Plan and the TMI 2006 Incentive and Non-Statutory Stock Option Plan. The TMI 2006 Incentive and Non-Statutory Stock Option Plan allows for 1,830,000 shares of common stock which may be issued with respect to stock options granted to former TMI employees or employees of the Company hired subsequent to the TMI acquisition. New stock options may no longer be awarded under the TMI 1996 Stock Option Plan.
The Company uses the Black-Scholes model to value its stock option grants under FASB ASC 718 and expenses the related compensation cost using the straight-line method over the vesting period. The fair value of stock options is determined on the grant date using assumptions for the expected term, expected volatility, dividend yield, and the risk free interest rate. The term assumption is primarily based on the contractual vesting term of the option and historic data related to exercise and post-vesting cancellation history experienced by the Company. The Company uses the simplified method for estimating the expected term used to determine the fair value of options under FASB ASC 718. The expected term is determined separately for options issued to the Company’s directors and to employees. The Company’s anticipated volatility level is primarily based on the historic volatility of the Company’s common stock. The Company’s model includes a zero dividend yield assumption, as the Company has not historically paid nor does it anticipate paying dividends on its common stock. The risk free interest rate approximates recent U.S. Treasury note auction results with a similar life to that of the option. The Company’s model does not include a discount for post-vesting restrictions, as the Company has not issued awards with such restrictions. The period expense is then determined based on the valuation of the options, and at that time an estimated forfeiture rate is used to reduce the expense recorded. The Company’s estimate of pre-vesting forfeitures is primarily based on the recent historical experience of the Company, and is adjusted to reflect actual forfeitures as the options vest.
The following weighted-average assumptions were used to determine the fair value of options under FASB ASC 718:
| Year Ended December 31, | ||||||||||||
| 2014 | 2013 | 2012 | ||||||||||
| Expected term (years) |
6.50 | 6.50 | 6.50 | |||||||||
| Risk free interest rate |
2.29 | % | 1.30 | % | 1.38 | % | ||||||
| Volatility factor |
46.53 | % | 47.50 | % | 64.83 | % | ||||||
| Dividend yield |
— | — | — | |||||||||
61
Table of Contents
Stock Options
Stock options outstanding, exercisable and available for grant at December 31, 2014, are summarized as follows:
| Number of Shares |
Weighted Average Exercise Price |
Weighted Average Remaining Contractual Life (Years) |
Aggregate Intrinsic Value |
|||||||||||||
| Outstanding at January 1, 2014 |
5,518,604 | $ | 4.63 | |||||||||||||
| Granted |
993,500 | 3.84 | ||||||||||||||
| Exercised |
(263,620 | ) | 3.37 | |||||||||||||
| Forfeited or expired |
(512,700 | ) | 6.95 | |||||||||||||
|
|
|
|
|
|||||||||||||
| Outstanding at December 31, 2014 |
5,735,784 | $ | 4.34 | 5.81 | $ | 7,237 | ||||||||||
|
|
|
|
|
|
|
|
|
|||||||||
| Vested or expected to vest at December 31, 2014 |
5,069,943 | $ | 4.42 | 5.48 | $ | 6,271 | ||||||||||
|
|
|
|
|
|
|
|
|
|||||||||
| Exercisable at December 31, 2014 |
3,244,284 | $ | 4.86 | 4.11 | $ | 3,398 | ||||||||||
|
|
|
|
|
|
|
|
|
|||||||||
| Available for grant at December 31, 2014 |
1,696,587 | |||||||||||||||
|
|
|
|||||||||||||||
The aggregate intrinsic value in the tables above represents the total pre-tax intrinsic value of stock options for which the fair market value of the underlying common stock exceeds, or exceeded the respective stock option exercise price.
For the years ended December 31, 2014, 2013 and 2012, the Company recognized stock-based compensation as follows:
| Year Ended December 31, | ||||||||||||
| 2014 | 2013 | 2012 | ||||||||||
| Stock-based compensation: |
||||||||||||
| Costs of processing and distribution |
$ | 132 | $ | 132 | $ | 163 | ||||||
| Marketing, general and administrative |
2,840 | 2,028 | 1,785 | |||||||||
| Research and development |
60 | 60 | 130 | |||||||||
|
|
|
|
|
|
|
|||||||
| Total |
$ | 3,032 | $ | 2,220 | $ | 2,078 | ||||||
|
|
|
|
|
|
|
|||||||
For the years ended December 31, 2014, 2013, and 2012, the Company recognized total income tax benefits from stock-based compensation of $1,198, $883, and $801, respectively.
As of December 31, 2014, there was $2,506 of total unrecognized stock-based compensation related to nonvested stock options. That expense is expected to be recognized over a weighted-average period of 3.05 years.
Other information concerning stock options are as follows:
| Year Ended December 31, | ||||||||||||
| 2014 | 2013 | 2012 | ||||||||||
| Weighted average fair value of stock options granted |
$ | 1.87 | $ | 1.66 | $ | 2.43 | ||||||
| Aggregate intrinsic value of stock options exercised |
295 | 117 | 172 | |||||||||
The aggregate intrinsic value of stock options exercised in a period represents the pre-tax cumulative difference between the fair market value of the underlying common stock and the stock option exercise prices, of the stock options exercised during the period.
62
Table of Contents
Restricted Stock Awards
During 2014, the Company granted 274,266 shares of restricted stock with a weighted-average grant date fair value of $3.92 per share. As of December 31, 2014, there was $674 of total unrecognized stock-based compensation related to time-based, nonvested restricted stock. That expense is expected to be recognized on a straight-line basis over a weighted-average period of 1.13 years.
6. Inventories
Inventories by stage of completion are as follows:
| December 31, | ||||||||
| 2014 | 2013 | |||||||
| Unprocessed tissue and raw materials |
$ | 29,429 | $ | 31,468 | ||||
| Tissue and work in process |
44,688 | 39,417 | ||||||
| Implantable tissue and finished goods |
37,150 | 33,102 | ||||||
| Supplies |
2,197 | 2,139 | ||||||
|
|
|
|
|
|||||
| $ | 113,464 | $ | 106,126 | |||||
|
|
|
|
|
|||||
For the years ended December 31, 2014, 2013, and 2012, the Company had inventory write-downs of $3,763, $1,785 and $3,114, respectively, relating primarily to inventory obsolescence.
7. Property, Plant and Equipment
Property, plant and equipment are as follows:
| December 31, | ||||||||
| 2014 | 2013 | |||||||
| Land |
$ | 2,474 | $ | 2,618 | ||||
| Buildings and improvements |
49,483 | 50,106 | ||||||
| Processing equipment |
45,878 | 43,309 | ||||||
| Surgical instruments |
9,428 | 5,012 | ||||||
| Office equipment, furniture and fixtures |
3,863 | 3,994 | ||||||
| Computer equipment and software |
7,674 | 6,152 | ||||||
| Construction in process |
20,957 | 16,156 | ||||||
| Equipment under capital leases: |
||||||||
| Processing equipment |
— | 396 | ||||||
| Computer equipment |
— | 744 | ||||||
| Office equipment |
152 | 152 | ||||||
|
|
|
|
|
|||||
| 139,909 | 128,639 | |||||||
| Less accumulated depreciation |
(62,881 | ) | (53,901 | ) | ||||
|
|
|
|
|
|||||
| $ | 77,028 | $ | 74,738 | |||||
|
|
|
|
|
|||||
Depreciation expense for the years ended December 31, 2014, 2013, and 2012 was $11,010, $8,267, and $5,970, respectively.
63
Table of Contents
8. Goodwill
The changes in the carrying amount of goodwill for the years ended December 31, 2014 and 2013, respectively, are as follows:
| Year Ended December 31, |
||||||||
| 2014 | 2013 | |||||||
| Balance at January 1 |
$ | 54,887 | $ | 2,062 | ||||
| Goodwill acquired during the period |
— | 52,825 | ||||||
|
|
|
|
|
|||||
| Balance at December 31 |
$ | 54,887 | $ | 54,887 | ||||
|
|
|
|
|
|||||
On July 16, 2013, the Company completed its acquisition of Pioneer paying a premium, which resulted in the recognition of goodwill. Goodwill of $52,825 was assigned to the Company’s one operating segment. The Company performed its annual goodwill impairment test as of December 31, 2014, and concluded that there was no impairment of goodwill.
9. Other Intangible Assets
Other intangible assets are as follows:
| December 31, 2014 | December 31, 2013 | |||||||||||||||
| Gross | Gross | |||||||||||||||
| Carrying | Accumulated | Carrying | Accumulated | |||||||||||||
| Amount | Amortization | Amount | Amortization | |||||||||||||
| Patents |
$ | 11,420 | $ | 2,727 | $ | 10,637 | $ | 1,935 | ||||||||
| Acquired exclusivity rights |
— | — | 2,941 | 2,787 | ||||||||||||
| Acquired licensing rights |
10,850 | 6,538 | 10,850 | 5,326 | ||||||||||||
| Marketing and procurement intangible assets |
22,342 | 5,086 | 22,098 | 2,692 | ||||||||||||
|
|
|
|
|
|
|
|
|
|||||||||
| Total |
$ | 44,612 | $ | 14,351 | $ | 46,526 | $ | 12,740 | ||||||||
|
|
|
|
|
|
|
|
|
|||||||||
As a result of the acquisition of Pioneer on July 16, 2013, the Company acquired certain identifiable intangible assets in the amount of $23,100 consisting primarily of patents and distribution agreements which will be amortized over their estimated useful lives of between 5 to 12 years. The weighted average term of the patents and distribution agreements acquired as part of the Pioneer acquisition was 10.5 and 9.2 years, respectively.
Amortization expense for the years ended December 31, 2014, 2013, and 2012 was $4,385, $3,935, and $2,023, respectively. At December 31, 2014, management’s estimates of future amortization expense for the next five years are as follows:
| Amortization | ||||
| Expense | ||||
| 2015 |
$ | 4,000 | ||
| 2016 |
3,400 | |||
| 2017 |
3,300 | |||
| 2018 |
3,300 | |||
| 2019 |
3,300 | |||
|
|
|
|||
| $ | 17,300 | |||
|
|
|
|||
64
Table of Contents
10. Other Assets
Other assets are as follows:
| December 31, | ||||||||
| 2014 | 2013 | |||||||
| Indemnification asset |
$ | 11,394 | $ | 13,000 | ||||
| Other |
876 | 1,332 | ||||||
|
|
|
|
|
|||||
| $ | 12,270 | $ | 14,332 | |||||
|
|
|
|
|
|||||
Under the acquisition agreement, Pioneer deposited $13,000 in an escrow account and indemnified the Company for up to $13,000 for various outstanding legal issues. At acquisition, the Company recorded a $13,000 indemnification asset and a corresponding $13,000 indemnification liability. At December 31, 2014, other assets include $11,394 of remaining long-term indemnification assets. Under the acquisition agreement, the Company has submitted claims against the escrow account during the initial escrow period which ended on October 16, 2014. Under certain provisions of the agreement, the claims period for certain claims may be extended to 30 months after the closing date. The resolution of submitted claims will occur after the claims period ends.
Interest expense associated with the amortization of its debt issuance costs for the years ended December 31, 2014, 2013 and 2012 was $142, $57 and $23, respectively. The remaining unamortized debt issuance costs are included in Other in the table above.
11. Accrued Expenses
Accrued expenses are as follows:
| December 31, | ||||||||
| 2014 | 2013 | |||||||
| Accrued compensation |
$ | 6,220 | $ | 3,817 | ||||
| Accrued severance charges |
2,771 | — | ||||||
| Accrued distributor commissions |
3,159 | 2,059 | ||||||
| Accrued donor recovery fees |
3,249 | 5,771 | ||||||
| Accrued taxes |
1,249 | 200 | ||||||
| Accrued restructuring charges |
13 | 2,609 | ||||||
| Contingent consideration |
— | 39 | ||||||
| Other |
8,028 | 7,983 | ||||||
|
|
|
|
|
|||||
| $ | 24,689 | $ | 22,478 | |||||
|
|
|
|
|
|||||
The Company accrues for the estimated donor recovery fees due to third party recovery agencies as tissue is received.
12. Short and Long-Term Obligations
Short and long-term obligations are as follows:
| December 31, | ||||||||
| 2014 | 2013 | |||||||
| Term loan |
$ | 59,375 | $ | 60,000 | ||||
| Credit facilities |
16,435 | 8,911 | ||||||
| Capital leases |
82 | 139 | ||||||
| Total |
75,892 | 69,050 | ||||||
| Less current portion |
(6,479 | ) | (1,344 | ) | ||||
|
|
|
|
|
|||||
| Long-term portion |
$ | 69,413 | $ | 67,706 | ||||
|
|
|
|
|
|||||
65
Table of Contents
On July 16, 2013, the Company obtained from TD Bank and Regions Bank, a 5-year, $80,000 senior secured facility, which includes a $60,000 term loan and a $20,000 revolving credit facility, that matures on July 16, 2018 with a variable interest rate between 100 and 175 basis points in excess of the one month LIBOR rate. At December 31, 2014, the interest rate for the term loan and revolving credit facility is 2.42%. The facility is secured by substantially all the assets of the Company and its subsidiaries and guaranteed by the Company’s domestic subsidiaries, other than RTIDS. The $20,000 revolving credit facility replaced the Company’s previous $15,000 U.S. credit facility. As of December 31, 2014, there was $15,250 outstanding on the revolving credit facility. The term loan facility requires aggregate principal payments of $18,000 from January 1, 2015 through June 30, 2018 with a final balloon principal payment at the end of the loan agreement. The new credit agreement also contains various restrictive covenants which limit, among other things, indebtedness and liens, as well as payment of dividends, while requiring a minimum cash balance on hand of $10,000 and certain financial covenant ratios. On October 15, 2014, the Company entered into a second amendment to the second amended and restated loan agreement with TD Bank, N.A. and Regions Bank, which amended the loan agreement to remove certain financial covenants. The Company was in compliance with all financial covenants related to its term loan as of December 31, 2014.
In addition to the credit facility with TD Bank and Regions Bank, the Company has three credit facilities with German banks as of December 31, 2014. Under the terms of the revolving credit facilities with three German banks through its German subsidiary, the Company may borrow up to 1,700 Euro, or approximately $2,066, for working capital needs. The 1,000 Euro revolving credit facility is secured by a mortgage on the Company’s German facility. The 500 Euro revolving credit facility is secured by accounts receivable of the Company’s German subsidiary. The 200 Euro revolving credit facility is unsecured. The current interest rates for these lines of credit vary from 2.59% to 8.50%. As of December 31, 2014, there was $1,185 outstanding on revolving credit facilities with German banks.
The total available credit on the Company’s four revolving credit facilities at December 31, 2014 was $5,631. The Company was in compliance with all financial covenants related to its revolving credit facilities as of December 31, 2014.
The Company has capital leases with interest rates ranging from 1.49% to 2.85% and maturity dates through 2017. The $82 representing future maturities of capital leases includes interest in the amount of $1 at December 31, 2014. The present value of minimum lease payments as of December 31, 2014 was $81.
As of December 31, 2014, contractual maturities of short and long-term obligations are as follows:
| Term Loan | Credit Facilities |
Capital Leases |
Total | |||||||||||||
| 2015 |
$ | 5,250 | $ | 1,185 | $ | 44 | $ | 6,479 | ||||||||
| 2016 |
4,500 | — | 32 | 4,532 | ||||||||||||
| 2017 |
5,250 | — | 6 | 5,256 | ||||||||||||
| 2018 |
44,375 | 15,250 | — | 59,625 | ||||||||||||
|
|
|
|
|
|
|
|
|
|||||||||
| $ | 59,375 | $ | 16,435 | $ | 82 | $ | 75,892 | |||||||||
|
|
|
|
|
|
|
|
|
|||||||||
13. Other Long-Term Liabilities
Other long-term liabilities are as follows:
| December 31, | ||||||||
| 2014 | 2013 | |||||||
| Indemnification liability |
$ | 11,394 | $ | 13,000 | ||||
| Other |
213 | 446 | ||||||
|
|
|
|
|
|||||
| $ | 11,607 | $ | 13,446 | |||||
|
|
|
|
|
|||||
66
Table of Contents
As described in Note 10, the Company recorded a $13,000 indemnification liability on the date of the acquisition of Pioneer.
14. Income Taxes
The Company’s income tax (provision) benefit consists of the following components:
| Year Ended December 31, | ||||||||||||
| 2014 | 2013 | 2012 | ||||||||||
| Current: |
||||||||||||
| Federal |
$ | (1,062 | ) | $ | 127 | $ | (1,189 | ) | ||||
| State |
(150 | ) | 167 | (806 | ) | |||||||
| International |
(86 | ) | 219 | (407 | ) | |||||||
|
|
|
|
|
|
|
|||||||
| Total current |
(1,298 | ) | 513 | (2,402 | ) | |||||||
|
|
|
|
|
|
|
|||||||
| Deferred: |
||||||||||||
| Federal |
(1,118 | ) | 8,017 | (1,299 | ) | |||||||
| State |
(76 | ) | 1,675 | (181 | ) | |||||||
| International |
999 | 905 | (160 | ) | ||||||||
|
|
|
|
|
|
|
|||||||
| Total deferred |
(195 | ) | 10,597 | (1,640 | ) | |||||||
|
|
|
|
|
|
|
|||||||
| Total income tax (provision) benefit |
$ | (1,493 | ) | $ | 11,110 | $ | (4,042 | ) | ||||
|
|
|
|
|
|
|
|||||||
The components of the deferred tax assets and liabilities consisted of the following at:
| December 31, 2014 | December 31, 2013 | |||||||||||||||
| Deferred Income Tax | Deferred Income Tax | |||||||||||||||
| Asset | Liability | Asset | Liability | |||||||||||||
| Current: |
||||||||||||||||
| Allowance for bad debts |
$ | 415 | $ | — | $ | 400 | $ | — | ||||||||
| Inventory |
11,513 | — | 10,340 | — | ||||||||||||
| Net operating losses |
340 | — | 4,040 | — | ||||||||||||
| Tax credits |
2,370 | — | 1,630 | — | ||||||||||||
| Deferred compensation |
3,912 | — | 3,620 | — | ||||||||||||
| Deferred revenue |
1,969 | — | 2,027 | — | ||||||||||||
| Accrued liabilities |
2,517 | 2,643 | ||||||||||||||
| Other |
— | (208 | ) | — | (318 | ) | ||||||||||
|
|
|
|
|
|
|
|
|
|||||||||
| Total current |
23,036 | (208 | ) | 24,700 | (318 | ) | ||||||||||
|
|
|
|
|
|
|
|
|
|||||||||
| Noncurrent: |
||||||||||||||||
| Fixed assets and intangibles |
— | (6,485 | ) | — | (7,615 | ) | ||||||||||
| Investments |
2,073 | — | 2,085 | — | ||||||||||||
| Net operating losses |
3,293 | — | 2,593 | — | ||||||||||||
| Tax credits |
2,596 | — | 3,768 | — | ||||||||||||
| Deferred revenue |
5,318 | — | 5,066 | — | ||||||||||||
| Accrued liabilities |
357 | — | 24 | — | ||||||||||||
| Valuation allowance |
(959 | ) | — | (469 | ) | — | ||||||||||
|
|
|
|
|
|
|
|
|
|||||||||
| Total noncurrent |
12,678 | (6,485 | ) | 13,067 | (7,615 | ) | ||||||||||
|
|
|
|
|
|
|
|
|
|||||||||
| Total |
$ | 35,714 | $ | (6,693 | ) | $ | 37,767 | $ | (7,933 | ) | ||||||
|
|
|
|
|
|
|
|
|
|||||||||
67
Table of Contents
The Company expects its deferred tax assets of $29,021, net of the valuation allowance at December 31, 2014 of $959, to be realized through the generation of future taxable income and the reversal of existing taxable temporary differences.
Valuation allowances are established when necessary to reduce deferred tax assets to amounts which are more likely than not to be realized. As such, valuation allowances of $959 and $469 have been established at December 31, 2014 and December 31, 2013, respectively, against a portion of the deferred tax assets relating to certain net operating loss carryforwards. During 2014, the Company recorded a valuation allowance charge of $490 relating to certain foreign net operating losses.
The Company recorded a tax benefit from the exercise of stock options in the amount of $539, $315, and $1,107 for the years ended December 31, 2014, 2013 and 2012, respectively.
As of December 31, 2014, the Company has U.S. federal net operating loss carryforwards of $2,169 that will expire in the years 2026 through 2027.
As of December 31, 2014, the Company has U.S. state net operating loss carryforwards of $19,682 that will expire in the years 2018 through 2034.
As of December 31, 2014, the Company has foreign net operating loss carryforwards of $7,302 that will carryfoward indefinitely.
As of December 31, 2014, the Company has research tax credit carryforwards of $6,015 that will expire in years 2026 through 2034. As of December 31, 2014, the Company has alternative minimum tax credit carryforwards of $827 that will carryfoward indefinitely.
On December 19, 2014, the Tax Increase Prevention Act of 2014 (“TIPA”) was signed into law. The TIPA retroactively extended the research tax credit to the beginning of 2014. Under ASC 740, Accounting for Income Taxes, the effects of the tax legislation are recognized upon enactment. Therefore, the Company recognized the tax benefit associated with the 2014 research tax credits in 2014.
U.S. income taxes have not been provided on the undistributed earnings of the Company’s foreign subsidiaries. It is not practicable to estimate the amount of tax that might be payable. The Company’s intention is to indefinitely reinvest earnings of its foreign subsidiaries. As of December 31, 2014 and 2013, the amount of undistributed earnings related to our foreign subsidiaries considered to be indefinitely reinvested was $7,238 and $7,365, respectively.
The Company evaluates the need for deferred tax asset valuation allowances based on a more likely than not standard. The ability to realize deferred tax assets depends on the ability to generate sufficient taxable income within the carryback or carryforward periods provided for in the tax law for each applicable tax jurisdiction.
The assessment regarding whether a valuation allowance is required or should be adjusted also considers all available positive and negative evidence. It is difficult to conclude a valuation allowance is not required when there is significant objective and verifiable negative evidence, such as cumulative losses in recent years. The Company utilizes a rolling three years of actual results as the primary measure of cumulative losses in recent years.
When evaluating whether the Company has overcome the significant negative evidence that resulted from cumulative losses in recent years, the Company adjusted its historical loss for items that the Company determined were not indicative of its ability to generate taxable income in future years. The Company’s U.S. operations are in a cumulative income position after adjusting for the items that were not indicative of its ability to generate taxable income in future years. The Company considers this objectively verifiable evidence that its
68
Table of Contents
current U.S. operations existing on December 31, 2014, have consistently demonstrated the ability to operate at a profit. The Company believes that this evidence is sufficient to overcome the unadjusted cumulative U.S. losses in recent years. The Company has a history of utilizing 100 percent of its U.S. deferred taxes assets before they expire and the forecasts of taxable earnings project a complete realization of all U.S. deferred tax assets before they expire, including under stressed scenarios.
The Company’s foreign operations are in a cumulative loss position after adjusting for items not indicative of its ability to generate taxable income in future years. As of December 31, 2014, the Company’s foreign deferred tax assets primarily relate to net operating loss carryforwards. In general, the Company’s foreign net operating loss carryforwards can be carryforward indefinitely. Future taxable income exclusive of reversing temporary differences and carryfowards is one source of taxable income available that can be used to realize tax benefits. It is the Company’s intent, if foreign operations do not generate cumulative income in the near future, to employ a tax planning action that will allow the Company to generate foreign taxable earnings and utilize certain foreign net operating losses. As a result, the Company has not recorded an additional valuation allowance charge.
Upon considering all of the available positive and negative evidence, and the extent to which that evidence was objectively verifiable, the Company determined that the positive evidence outweighed the negative evidence and the deferred tax assets are more-likely-than-not realizable, as of and for the year ended December 31, 2014.
The Company will continue to regularly assess the realizability of our deferred tax assets. Changes in historical earnings performance and future earnings projections, among other factors, may cause the Company to adjust its valuation allowance, which would impact the Company’s income tax expense in the period the Company determines that these factors have changed.
As of December 31, 2014, the Company has $1,787 of unrecognized tax benefits. This entire balance of unrecognized tax benefits was recorded net against deferred tax assets in the accompanying consolidated balance sheet.
The Company’s unrecognized tax benefits are summarized as follows:
| Year Ended December 31, | ||||||||||||
| 2014 | 2013 | 2012 | ||||||||||
| Opening balance |
$ | 2,825 | $ | 1,797 | $ | 1,674 | ||||||
| (Reductions) additions based on tax positions related to the current year |
(136 | ) | (174 | ) | 274 | |||||||
| (Reductions) additions for tax positions of prior years |
(49 | ) | 1,337 | 336 | ||||||||
| Reductions for tax positions of prior years |
(853 | ) | (135 | ) | (487 | ) | ||||||
|
|
|
|
|
|
|
|||||||
| $ | 1,787 | $ | 2,825 | $ | 1,797 | |||||||
|
|
|
|
|
|
|
|||||||
The unrecognized tax benefits if recognized, would favorably impact the Company’s effective tax rate.
The Company’s policy is to recognize interest accrued related to unrecognized tax benefits in interest expense and penalties in the provision for income taxes. There were no interest and penalties recorded in 2014, 2013 and 2012 and no interest and penalties accrued at December 31, 2014 and 2013.
During 2014, the Internal Revenue Service (“IRS”) completed an examination of the Company’s 2010 U.S. federal tax return. In addition, during 2014, the German tax authorities completed an examination of the Company’s German subsidiary’s 2006 through 2009 German tax returns. No material adjustments were recorded as a result of the IRS or German examinations.
69
Table of Contents
The effective tax rate differs from the statutory federal income tax rate for the following reasons:
| Year Ended December 31, | ||||||||||||
| 2014 | 2013 | 2012 | ||||||||||
| Statutory federal rate |
35.00 | % | 35.00 | % | 35.00 | % | ||||||
| State income taxes—net of federal tax benefit |
3.51 | % | 4.14 | % | 5.16 | % | ||||||
| Foreign rate differential |
4.99 | % | (0.46 | %) | (2.23 | %) | ||||||
| Other permanent expenses |
(1.25 | %) | (4.27 | %) | — | |||||||
| Research tax credits |
(7.52 | %) | 3.56 | % | (2.06 | %) | ||||||
| Domestic production activities deduction |
(4.33 | %) | — | (2.29 | %) | |||||||
| Unrecognized tax benefits |
— | 0.86 | % | — | ||||||||
| Valuation allowance |
5.26 | % | — | — | ||||||||
| Other reconciling items, net |
(0.02 | %) | (0.42 | %) | (1.10 | %) | ||||||
|
|
|
|
|
|
|
|||||||
| Effective tax rate |
35.64 | % | 38.41 | % | 32.48 | % | ||||||
|
|
|
|
|
|
|
|||||||
For the years ended December 31, 2014, 2013 and 2012, the Company had no individually significant other reconciling items.
15. Preferred Stock
Preferred stock is as follows:
| December 31, | ||||||||
| 2014 | 2013 | |||||||
| Preferred shares issuance |
$ | 50,000 | $ | 50,000 | ||||
| Preferred shares issuance costs |
(1,290 | ) | (1,290 | ) | ||||
|
|
|
|
|
|||||
| Net proceeds |
48,710 | 48,710 | ||||||
| Amortization of preferred shares issuance costs |
261 | 77 | ||||||
| Accrued dividend payable |
3,863 | 750 | ||||||
|
|
|
|
|
|||||
| $ | 52,834 | $ | 49,537 | |||||
|
|
|
|
|
|||||
On June 12, 2013, the Company and WSHP entered into an investment agreement. Pursuant to the terms of the investment agreement, the Company agreed to a $50,000 private placement of convertible preferred equity with WSHP. In connection with the closing of the transactions contemplated by the investment agreement, the Company and WSHP amended the investment agreement on July 15, 2013, and the Company filed a Certificate of Designation of Series A Convertible Preferred Stock creating the Series A Convertible Preferred Stock, par value $0.001 per share (the “Preferred Stock”), and establishing the designations, preferences, and other rights of the Preferred Stock. The Preferred Stock accrues dividends at a rate of 6% per annum. To the extent dividends are not paid in cash in any quarter, the dividends which have accrued on each outstanding share of Preferred Stock during such three-month period will accumulate until paid in cash or converted to common stock. The payments of dividends may be restricted by various covenants under our new credit agreement with TD Bank and Regions Bank.
The Preferred Stock will be convertible at the election of the holders into shares of the Company’s common stock at an initial conversion price of $4.39 per share which would result in a conversion ratio of approximately 228 shares of common stock for each share of Preferred Stock. The Preferred Stock is convertible at the election of the Company five years after its issuance or at any time if the Company’s common stock closes at or above $7.98 per share for at least 20 consecutive trading days.
70
Table of Contents
The Company may, upon 30 days notice, redeem the Preferred Stock, in whole or in part, five years after its issuance at the initial liquidation preference of $1,000 per share of the Preferred Stock plus an amount per share equal to accrued but unpaid dividends (collectively, the “Liquidation Value”). The holders of the Preferred Stock may require the Company to redeem their Preferred Stock, in whole or in part, at the Liquidation Value seven years after its issuance or upon the occurrence of a change of control.
16. Stockholders’ Equity
Preferred Stock—The Company has 5,000,000 shares of preferred stock authorized under its Certificate of Incorporation of which 50,000 are currently issued and outstanding. These shares may be issued in one or more series having such terms as may be determined by the Company’s Board of Directors.
Common Stock—The Company has 150,000,000 shares of common stock authorized. The common stock’s voting, dividend, and liquidation rights presently are subject to or qualified by the rights of the holders of any outstanding shares of preferred stock. Holders of common stock are entitled to one vote for each share held at all stockholder meetings. Shares of common stock do not have redemption rights.
17. Restructuring Charges
The Company instituted a restructuring plan primarily related to termination of employees and a location closure as a result of the integration activities following the acquisition of Pioneer, which resulted in $2,881 of expenses for the year ended December 31, 2013. The total restructuring charges should be paid in full prior to February 28, 2015. Severance payments are made to terminated employees over periods ranging from one month to twelve months and will not have a material impact on cash flows of the Company in any quarterly period. The following table includes a rollforward of restructuring charges included in accrued expenses, see Note 11.
| Accrued restructuring charges at January 1, 2014 |
$ | 2,609 | ||
| Cash payments |
(2,596 | ) | ||
|
|
|
|||
| Accrued restructuring charges at December 31, 2014 |
$ | 13 | ||
|
|
|
18. Severance Charges
The Company recorded severance charges related to the termination of former employees as a result of the Company flattening its organizational structure, which resulted in $4,798 of expenses for the year ended December 31, 2014. The total severance charges should be paid in full prior to December 31, 2015. Severance payments are made to terminated employees over periods ranging from one month to twelve months and will not have a material impact on cash flows of the Company in any quarterly period. The following table includes a rollforward of severance charges included in accrued expenses, see Note 11.
| Accrued severance charges at January 1, 2014 |
$ | — | ||
| Employee severance charges accrued |
4,798 | |||
|
|
|
|||
| Subtotal severance charges |
4,798 | |||
| Severance cash payments |
(1,242 | ) | ||
| Stock based compensation |
(785 | ) | ||
|
|
|
|||
| Accrued severance charges at December 31, 2014 |
$ | 2,771 | ||
|
|
|
19. Retirement Benefits
The Company has a qualified 401(k) plan available to all U.S. employees who meet certain eligibility requirements. The 401(k) plan allows each employee to contribute up to the annual maximum allowed under the
71
Table of Contents
Internal Revenue Code. The Company has the discretion to make matching contributions up to 6% of the employee’s earnings. For the years ended December 31, 2014, 2013 and 2012, the amounts expensed under the plan were $2,663, $1,964 and $1,501, respectively.
20. Concentrations of Risk
Distribution—The Company’s principal concentration of risk is related to its limited distribution channels. The Company’s revenues include the distribution efforts of fourteen independent companies with significant revenues coming from three of the distribution companies, Zimmer, Medtronic and Davol. The following table presents percentage of total revenues derived from the Company’s largest distributors and international distribution:
| Year Ended December 31, | ||||||||||||
| 2014 | 2013 | 2012 | ||||||||||
| Percent of revenues derived from: |
||||||||||||
| Distributor |
||||||||||||
| Zimmer, Inc. |
18 | % | 17 | % | 14 | % | ||||||
| Medtronic, Inc. |
12 | % | 16 | % | 18 | % | ||||||
| Davol, Inc. |
5 | % | 9 | % | 11 | % | ||||||
| International |
9 | % | 10 | % | 12 | % | ||||||
The Company’s distribution agreements are subject to termination by either party for a variety of causes. No assurance can be given that such distribution agreements will be renewed beyond their expiration dates, continue in their current form or at similar rate structures. Any termination or interruption in the distribution of the Company’s implants through one of its major distributors could have a material adverse effect on the Company’s operations.
Tissue Supply—The Company’s operations are dependent on the availability of tissue from human donors. For the majority of the tissue recoveries, the Company relies on the efforts of independent procurement agencies to educate the public and increase the willingness to donate bone tissue. These procurement agencies may not be able to obtain sufficient tissue to meet present or future demands. Any interruption in the supply of tissue from these procurement agencies could have a material adverse effect on the Company’s operations.
21. Commitments and Contingencies
Distribution Agreement with Medtronic—On October 12, 2013, the Company entered into a replacement distribution agreement with Medtronic, plc. (“Medtronic”), pursuant to which Medtronic will distribute certain allograft implants for use in spinal, general orthopedic and trauma surgery. Under the terms of this distribution agreement, Medtronic will be a non-exclusive distributor except for certain specified implants for which Medtronic will be the exclusive distributor. Medtronic will maintain its exclusivity with respect to these specified implants unless the cumulative fees received by us from Medtronic for these specified implants decline by a certain amount during any trailing 12-month period. The initial term of this distribution agreement will continue through December 31, 2017, unless earlier terminated in accordance with this distribution agreement. This initial term will automatically renew for successive five-year periods, unless either party provides written notice of its intent not to renew at least one year prior to the expiration of the initial term or the applicable renewal period. This distribution agreement superseded and replaced our prior distribution agreement with Medtronic which would have expired in accordance with its terms in June 2014.
Exclusive License Agreement with Athersys—On September 10, 2010, the Company entered into an Exclusive License Agreement with Athersys, pursuant to which Athersys will provide the Company access to its MAPC technologies to develop and commercialize MAPC technology-based biologic implants for certain orthopedic applications. In consideration for the Exclusive License, the Company agreed to pay Athersys the following: 1) a non-refundable $3,000 license fee, payable in three time-based $1,000 installments, the last of
72
Table of Contents
which was paid in the first quarter of 2011, 2) payment of $2,000 contingent upon successful achievement of certain development milestones which the Company paid in 2012, and 3) up to $32,500 contingent upon achievement of certain cumulative revenue milestones in future years. In addition, the Company pays Athersys royalties from the distribution of implants under a tiered royalty structure based on achievement of certain cumulative revenue milestones. The term of this license agreement is the longer of five years, or the remaining life of any patent or trade secret. These acquired licensing rights are being amortized to expense on a straight-line basis over the expected life of the asset.
Distribution Agreement with Zimmer Dental Inc.—On September 3, 2010, the Company and Zimmer Dental Inc. (“Zimmer Dental”), a subsidiary of Zimmer, entered into an exclusive distribution agreement, with an effective date of September 30, 2010. This distribution agreement has an initial term of ten years. Under the terms of this distribution agreement, the Company has agreed to supply sterilized allograft and xenograft implants at an agreed upon transfer price, and Zimmer Dental has agreed to be the exclusive distributor of the implants for dental and oral applications worldwide (except Ukraine), subject to certain Company obligations under an existing distribution agreement with a third party with respect to certain implants for the dental market. In consideration for Zimmer Dental’s exclusive distribution rights, Zimmer Dental agreed to the following: 1) payment to the Company of $13,000 within ten days of the effective date (the “Upfront Payment”); 2) annual exclusivity fees (“Annual Exclusivity Fees”) paid annually for the term of the contract to be paid at the beginning of each calendar year; and, 3) escalating annual purchase minimums to maintain exclusivity. Upon occurrence of an event that materially and adversely affects Zimmer Dental’s ability to distribute the implants, Zimmer Dental may be entitled to certain refund rights with respect to the Upfront Payment and the then current Annual Exclusivity Fee, where such refund would be in an amount limited by a formula specified in this distribution agreement that is based substantially on the number of days from the occurrence of such event to the date that it is cured by the Company to the satisfaction of Zimmer Dental. The Upfront Payment, the Annual Exclusivity Fees and the fees associated with distributions of processed tissue are considered to be a single unit of accounting. Accordingly, the Upfront Payment and the Annual Exclusivity Fees are deferred as received and are being recognized as other revenues over the term of this distribution agreement based on the expected contractual escalating annual purchase minimums relative to the total contractual minimum purchase requirements in this distribution agreement. Additionally, the Company has considered the potential impact of this distribution agreement’s contractual refund provisions and does not expect these provisions to impact future expected revenue related to this distribution agreement.
Distribution Agreement with Davol—On July 13, 2009, the Company and Davol amended their previous distribution agreement with TMI for human dermis implants. Under the amended agreement; 1) Davol paid the Company $8,000 in non-refundable fees for exclusive distribution rights for the distribution to the breast reconstruction market until July 13, 2019; 2) the exclusive worldwide distribution agreement related to the hernia market was extended to July 13, 2019; and 3) Davol agreed to pay the Company certain additional exclusive distribution rights fees contingent upon the achievement of certain revenue milestones by Davol during the duration of the contract. In the fourth quarter of 2010, Davol paid the first revenue milestone payment of $3,500. The non-refundable fees and the fees associated with distributions of processed tissue are considered to be a single unit of accounting. Accordingly, the $8,000 and $3,500 exclusivity payments have been deferred and are being recognized as other revenues on a straight-line basis over the initial term of the amended contract of ten years, and the remaining term of the amended contract, respectively. The straight-line method approximates the expected pattern of implant distribution based on this distribution agreement’s contractual annual minimum purchase requirements. Davol did not achieve certain revenue growth milestones which resulted in Davol relinquishing its exclusive distribution rights in the hernia market effective January 1, 2013 and the breast reconstruction market effective January 1, 2015.
The Company’s aforementioned revenue recognition methods related to the Zimmer and Davol distribution agreements do not result in the deferral of revenue less than amounts that would be refundable in the event the agreements were to be terminated in future periods. Additionally, the Company evaluates the appropriateness of the aforementioned revenue recognition methods on an ongoing basis.
73
Table of Contents
Leases—The Company leases certain facilities, items of office equipment and vehicles under non-cancelable operating lease arrangements expiring on various dates through 2019. The facility leases generally contain renewal options and escalation clauses based upon increases in the lessors’ operating expenses and other charges. The Company anticipates that most of these leases will be renewed or replaced upon expiration. Rent expense for the years ended December 31, 2014, 2013, and 2012 was $1,609, $1,529 and $1,302, respectively, and is included as a component of marketing, general and administrative expenses.
Future minimum lease commitments under non-cancelable operating leases as of December 31, 2014 are as follows:
| Operating Leases |
||||
| 2015 |
$ | 2,080 | ||
| 2016 |
1,311 | |||
| 2017 |
589 | |||
| 2018 |
127 | |||
| 2019 |
67 | |||
|
|
|
|||
| $ | 4,174 | |||
|
|
|
|||
22. Legal and Regulatory Actions
The Company is, from time to time, involved in litigation relating to claims arising out of its operations in the ordinary course of business. The Company believes that none of these claims that were outstanding as of December 31, 2014 will have a material adverse impact on its financial position or results of operations.
Biomedical Tissue Service, Ltd.—The Company was named as a party, along with a number of other recovery and processor defendants, in lawsuits relating to the tissue recovery practices of BTS, an unaffiliated recovery agency. The Company settled the BTS cases in 2012 and 2013 for payments of $2,350 and $3,000. Accordingly, the Company recorded a litigation settlement charge of $3,000 in the second quarter of 2013.
Lanx, Inc.—Lanx, a subsidiary of Biomet, Inc. filed suit in the second quarter of 2013 against Pioneer in the U.S. District Court, District of Colorado, alleging that one of the Company’s medical devices infringed certain of Lanx’s U.S. intellectual property rights, and sought monetary damages and threatened injunctive relief. In the second quarter of 2014, the parties resolved the claim with no material financial impact to the Company or its operations. As part of the resolution of the claim, a settlement payment of $325 was made to Lanx from the indemnification escrow account, see Note 10 Other Assets.
Coloplast—The Company is presently named as co-defendant along with other companies in a small number of the transvaginal surgical mesh (“TSM”) mass tort claims being brought in various state and federal courts. The TSM litigation has as its catalyst various Public Health Notifications issued by the U.S. Food and Drug Administration (“FDA”) with respect to the placement of certain TSM implants that were the subject of 510k regulatory clearance prior to their distribution. The Company does not process or otherwise manufacture for distribution in the U.S. any implants that were the subject of these FDA Public Health Notifications. The Company denies any allegations against it and intends to vigorously defend itself.
In addition to claims made directly against the Company, Coloplast, a distributor of TSM’s and certain allografts processed and private labeled for them under a contract with the Company, has also been named as a defendant in individual TSM cases in various federal and state courts. Coloplast requested that the Company indemnify or defend Coloplast in those claims which allege injuries caused by the Company’s allograft implants, and on April 24, 2014, Coloplast sued RTI Surgical, Inc. in the Fourth Judicial District of Minnesota for declaratory relief and breach of contract. On December 11, 2014, Coloplast entered into a settlement agreement with RTI Surgical, Inc. and Tutogen Medical, Inc. (the “Company Parties”) resulting in dismissal of the case. Under the terms of the settlement agreement, the Company Parties are responsible for the defense and indemnification of two categories of present and future claims: (1) tissue only (where Coloplast is solely the distributor of Company processed allograft tissue and no Coloplast-manufactured or distributed synthetic mesh is
74
Table of Contents
identified) (“Tissue Only Claims), and (2) tissue plus non-Coloplast synthetic mesh (“Tissue-Non-Coloplast Claims). There are presently 311Tissue Only Claims and 318 Tissue-Non-Coloplast Claims for which the Company Parties are providing defense and indemnification. The defense and indemnification of these cases are covered under the Company’s insurance policy subject to a reservation of rights by the insurer.
Based on the current information available to the Company, it is not possible to evaluate and estimate with reasonable certainty the impact that current or any future TSM litigation may have on the Company.
The Company’s accounting policy is to accrue for legal costs as they are incurred.
In the quarter ended September 30, 2014, the Company received a letter from the FDA regarding the Company’s map3® cellular allogeneic bone graft. The letter addresses some technical aspects of the processing of the map3® allograft, as well as language included on the Company’s website. The Company has submitted an initial response to the FDA letter, and is preparing a comprehensive package of data to address the FDA’s comments and provide clarifying information regarding the technical components of the implant processing. The Company believes that in both developing and processing of map3®, the Company has properly considered the relevant regulatory requirements. Additionally, the Company has removed the relevant information from the website pending thorough review and revisions as needed. The Company is committed to resolving the concerns raised by the FDA. However, it is not possible to predict the specific outcome or timing of a resolution at this time.
In October 2012, the Company received a warning letter from the FDA related to environmental monitoring activities in certain areas of its processing facility in Alachua, Florida. The FDA re-inspected the processing facility in Alachua, Florida in September 2013, and determined that the Company had addressed the FDA’s concerns from the previous inspection. In October 2013, the Company received a final close out letter from the FDA to formally resolve their concerns. The warning letter did not restrict the Company’s ability to process or distribute implants, nor did it require the withdrawal of any implants from the marketplace.
23. Segment Data
The Company distributes human tissue, bovine and porcine animal tissue, metal and synthetic implants through various distribution channels. The Company operates in one reportable segment comprised of six lines of business. The Company’s lines of business are comprised primarily of six categories: spine, sports medicine, ortho fixation, BGS and general orthopedic, surgical specialties and dental. Discrete financial information is not available for these six lines of business. The following table presents revenues from these six categories and other revenues and their respective percentages of the Company’s total revenues for the years ended December 31, 2014, 2013 and 2012:
| Year Ended December 31, | ||||||||||||||||||||||||
| 2014 | 2013 | 2012 | ||||||||||||||||||||||
| (In thousands) | ||||||||||||||||||||||||
| Revenues: |
||||||||||||||||||||||||
| Spine |
$ | 82,663 | 31.5 | % | $ | 57,334 | 28.9 | % | $ | 38,866 | 21.9 | % | ||||||||||||
| Sports medicine |
46,758 | 17.8 | % | 42,594 | 21.5 | % | 51,197 | 28.7 | % | |||||||||||||||
| Ortho fixation |
37,133 | 14.1 | % | 14,525 | 7.3 | % | — | — | ||||||||||||||||
| BGS and general orthopedic |
36,747 | 14.0 | % | 27,864 | 14.1 | % | 29,308 | 16.5 | % | |||||||||||||||
| Surgical specialties |
26,999 | 10.3 | % | 27,666 | 14.0 | % | 30,897 | 17.3 | % | |||||||||||||||
| Dental |
20,810 | 7.9 | % | 19,779 | 10.0 | % | 21,435 | 12.0 | % | |||||||||||||||
| Other revenues |
11,700 | 4.5 | % | 8,217 | 4.2 | % | 6,410 | 3.6 | % | |||||||||||||||
|
|
|
|
|
|
|
|
|
|
|
|
|
|||||||||||||
| Total revenues |
$ | 262,810 | 100.0 | % | $ | 197,979 | 100.0 | % | $ | 178,113 | 100.0 | % | ||||||||||||
|
|
|
|
|
|
|
|
|
|
|
|
|
|||||||||||||
| Domestic revenues |
$ | 238,936 | 90.9 | % | $ | 177,207 | 89.5 | % | $ | 156,803 | 88.0 | % | ||||||||||||
| International revenues |
23,874 | 9.1 | % | 20,772 | 10.5 | % | 21,310 | 12.0 | % | |||||||||||||||
|
|
|
|
|
|
|
|
|
|
|
|
|
|||||||||||||
| Total revenues |
$ | 262,810 | 100.0 | % | $ | 197,979 | 100.0 | % | $ | 178,113 | 100.0 | % | ||||||||||||
|
|
|
|
|
|
|
|
|
|
|
|
|
|||||||||||||
75
Table of Contents
The following table presents property, plant and equipment—net by significant geographic location:
| December 31, | ||||||||
| 2014 | 2013 | |||||||
| Property, plant and equipment—net: |
||||||||
| Domestic |
$ | 63,009 | $ | 58,458 | ||||
| International |
14,019 | 16,280 | ||||||
|
|
|
|
|
|||||
| Total |
$ | 77,028 | $ | 74,738 | ||||
|
|
|
|
|
|||||
24. Quarterly Results of Operations (Unaudited)
The following table sets forth the results of operations for the periods indicated:
| March 31, 2014 |
June 30, 2014 |
September 30, 2014 |
December 31, 2014 |
|||||||||||||
| Quarter Ended: |
||||||||||||||||
| Revenues |
$ | 60,745 | $ | 66,029 | $ | 65,163 | $ | 70,873 | ||||||||
| Gross profit |
26,198 | 35,054 | 34,693 | 37,852 | ||||||||||||
| Net (loss) income applicable to common shares |
(3,060 | ) | 1,577 | 1,202 | (136 | ) | ||||||||||
| Net (loss) income per common share: |
||||||||||||||||
| Basic |
$ | (0.05 | ) | $ | 0.03 | $ | 0.02 | $ | (0.00 | ) | ||||||
| Diluted |
(0.05 | ) | 0.03 | 0.02 | (0.00 | ) | ||||||||||
The Company’s acquisition of Pioneer added diversification of our implant portfolio, expanded our direct distribution and marketing organizations and enhanced our international business. The Company continues to maintain its commitment to research and development and the introduction of new strategically targeted allograft, xenograft, metal and synthetic implants as well as focused clinical efforts to support their acceptance in the marketplace. In 2014, the Company’s net income was negatively impacted by a severance charge of $4,798 and a litigation settlement charge of $185.
The following table sets forth the results of operations for the periods indicated:
| March 31, 2013 |
June 30, 2013 |
September 30, 2013 |
December 31, 2013 |
|||||||||||||
| Quarter Ended: |
||||||||||||||||
| Revenues |
$ | 40,422 | $ | 42,309 | $ | 54,742 | $ | 60,506 | ||||||||
| Gross profit |
19,196 | 19,236 | 20,319 | 21,354 | ||||||||||||
| Net income (loss) applicable to common shares |
1,462 | (2,999 | ) | (9,125 | ) | (8,527 | ) | |||||||||
| Net income (loss) per common share: |
||||||||||||||||
| Basic |
$ | 0.03 | $ | (0.05 | ) | $ | (0.16 | ) | $ | (0.15 | ) | |||||
| Diluted |
0.03 | (0.05 | ) | (0.16 | ) | (0.15 | ) | |||||||||
In the third quarter of 2013, the Company completed its acquisition of Pioneer which added diversification of our implant portfolio, expanded our direct distribution and marketing organizations and enhanced our international business. Excluding the impact of the Pioneer acquisition, the Company experienced a moderate increase in fees from tissue distribution in its spine and surgical specialties implant categories and decreases in its sports medicine, BGS and general orthopedic and dental implant categories. In addition, sports medicine, BGS and general orthopedic and dental implant categories were negatively impacted by customer uncertainty surrounding our October 2012 FDA warning letter which was resolved in October 2013. In 2013, the Company’s net income was negatively impacted by a litigation settlement charge of $3,000, restructuring charges of $2,881 and acquisition expenses of $6,004.
76
Table of Contents
25. Subsequent Events
The Company evaluated subsequent events as of the issuance date of the consolidated financial statements as defined by FASB ASC 855 Subsequent Events, and identified no subsequent events that require adjustment to, or disclosure of, in these consolidated financial statements.
77
Table of Contents
RTI SURGICAL, INC. AND SUBSIDIARIES
Schedule II
Valuation and Qualifying Accounts
Years Ended December 31, 2014, 2013 and 2012
(Dollars in thousands)
| Description |
Balance at Beginning of Period |
Charged to Costs and Expenses |
Deductions- Write-offs, Payments |
Balance at End of Period |
||||||||||||
| For the year ended December 31, 2014: |
||||||||||||||||
| Allowance for doubtful accounts |
$ | 492 | $ | 709 | $ | 383 | $ | 818 | ||||||||
| Allowance for product returns |
343 | 182 | — | 525 | ||||||||||||
| Allowance for obsolescence |
5,399 | 3,763 | 4,050 | 5,112 | ||||||||||||
| Deferred tax asset valuation allowance |
469 | 490 | — | 959 | ||||||||||||
| For the year ended December 31, 2013: |
||||||||||||||||
| Allowance for doubtful accounts |
346 | 180 | 34 | 492 | ||||||||||||
| Allowance for product returns |
283 | 255 | 195 | 343 | ||||||||||||
| Allowance for obsolescence |
7,735 | 1,785 | 4,121 | 5,399 | ||||||||||||
| Deferred tax asset valuation allowance |
469 | — | — | 469 | ||||||||||||
| For the year ended December 31, 2012: |
||||||||||||||||
| Allowance for doubtful accounts |
323 | 54 | 31 | 346 | ||||||||||||
| Allowance for product returns |
383 | 82 | 182 | 283 | ||||||||||||
| Allowance for obsolescence |
8,171 | 3,114 | 3,550 | 7,735 | ||||||||||||
| Deferred tax asset valuation allowance |
469 | — | — | 469 | ||||||||||||
78
Table of Contents
SIGNATURES
Pursuant to the requirements of Section 13 or 15(d) of the Securities Exchange Act of 1934, the registrant has duly caused this report to be signed on its behalf by the undersigned, thereunto duly authorized.
| March 4, 2015 | RTI SURGICAL, INC. | |||||||
| By: | /s/ Brian K. Hutchison | |||||||
| Brian K. Hutchison | ||||||||
| President and Chief Executive Officer | ||||||||
Pursuant to the requirements of the Securities Exchange Act of 1934, this report has been signed below by the following persons on behalf of the registrant and in the capacities and on the dates indicated.
| Signature |
Title |
Date | ||
| /s/ Brian K. Hutchison Brian K. Hutchison |
President and Chief Executive Officer (Principal Executive Officer) and Director | March 4, 2015 | ||
| /s/ Robert P. Jordheim Robert P. Jordheim |
Executive Vice President and Chief Financial Officer (Principal Financial and Chief Accounting Officer) | March 4, 2015 | ||
| /s/ Dean H. Bergy Dean H. Bergy |
Chairman | March 4, 2015 | ||
| /s/ Philip R. Chapman Philip R. Chapman |
Director | March 4, 2015 | ||
| /s/ Roy D. Crowninshield Roy D. Crowninshield |
Director | March 4, 2015 | ||
| /s/ Peter F. Gearen Peter F. Gearen |
Director | March 4, 2015 | ||
| /s/ Curt M. Selquist Curt M. Selquist |
Director | March 4, 2015 | ||
| /s/ Adrian J.R. Smith Adrian J.R. Smith |
Director | March 4, 2015 | ||
| /s/ Ned H. Villers Ned H. Villers |
Director | March 4, 2015 | ||
| /s/ Shirley A. Weis Shirley A. Weis |
Director | March 4, 2015 | ||
Table of Contents
EXHIBIT INDEX
| Exhibit No. |
Description |
Incorporated by Reference | ||||||
| Form |
File No. |
Date Filed | ||||||
| 2.1 | Agreement and Plan of Merger, dated as of June 11, 2013, by and among RTI Biologics, Inc., Rockets MI Corporation, Pioneer Surgical Technology, Inc. and Shareholder Representative Services LLC, solely in its capacity as the stockholders’ agent. | 8-K | 000-31271 | 6/13/2013 | ||||
| 3.1 | Amended and Restated Certificate of Incorporation of RTI Surgical, Inc. | 8-K | 000-31271 | 2/29/2008 | ||||
| 3.2 | Bylaws. | 8-K | 000-31271 | 8/4/2008 | ||||
| 3.3 | Certificate of Designation of Series A Convertible Preferred Stock of RTI Surgical, Inc., dated July 16, 2013. | 8-K | 000-31271 | 7/19/2013 | ||||
| 3.4 | Certificate of Ownership and Merger dated July 16, 2013. | 8-K | 000-31271 | 7/19/2013 | ||||
| 4.3 | Specimen Stock Certificate. | S-1 | 333-35756 | 8/02/2000 | ||||
| 10.1‡ | Omnibus Stock Option Plan. | S-1 | 333-35756 | 4/27/2000 | ||||
| 10.2‡ | Year 2000 Compensation Plan. | S-1 | 333-35756 | 4/27/2000 | ||||
| 10.3‡ | RTI Surgical, Inc. 2004 Equity Incentive Plan. | 10-Q | 000-31271 | 6/30/2004 | ||||
| 10.4‡ | Form of Nonqualified Stock Option Grant Agreement. | 10-K(2004) | 000-31271 | 3/16/2005 | ||||
| 10.5‡ | Form of Incentive Stock Option Grant Agreement. | 10-K(2004) | 000-31271 | 3/16/2005 | ||||
| 10.6‡ | RTI Surgical, Inc. 2010 Equity Incentive Plan. | DEF 14A | 000-31271 | 3/19/2010 | ||||
| 10.7† | Exclusive Distribution Agreement between RTI Surgical, Inc. and Zimmer Dental Inc., dated as of September 3, 2010 and effective as of September 30, 2010. | 10-Q (Q3 2010) |
000-31271 | 11/08/2010 | ||||
| 10.8‡ | RTI Surgical, Inc. Executive Nonqualified Excess Plan. | 10-K(2011) | 000-31271 | 2/15/2012 | ||||
| 10.9‡ | Form of Executive Transition Agreement. | 8-K | 000-31271 | 9/4/2012 | ||||
| 10.10‡ | Executive Transition Agreement with Brian K. Hutchison. | 8-K | 000-31271 | 9/4/2012 | ||||
| 10.11 | Second Amended and Restated Loan Agreement dated July 16, 2013 by and among RTI Surgical, Inc., TD Bank, N.A., a national banking association, as administrative agent for the Lenders and each of the Lenders from time to time a party thereto. | 8-K | 000-31271 | 7/19/2013 | ||||
| 10.12 | First Amendment to the Second Amended and Restated Loan Agreement dated December 30, 2013 by and among RTI Surgical, Inc., TD Bank, N.A., a national banking association, as administrative agent for the Lenders and each of the Lenders from time to time a party thereto. | 8-K | 000-31271 | 12/30/2013 | ||||
| 10.13 | Investment Agreement, dated as of June 12, 2013, by and between RTI Biologics, Inc. and WSHP Biologics Holdings, LLC. | 8-K | 000-31271 | 6/13/2013 | ||||
Table of Contents
| Exhibit No. |
Description |
Incorporated by Reference | ||||||
| Form |
File No. |
Date Filed | ||||||
| 10.14 | Amendment to Investment Agreement, dated as of July 15, 2013 by and among RTI Biologics, Inc. and WSHP Biologics Holdings, LLC. | 8-K | 000-31271 | 7/19/2013 | ||||
| 10.15 | Investor Rights Agreement dated as of July 16, 2013 by and between RTI Surgical, Inc. and WSHP Biologics Holdings, LLC. | 8-K | 000-31271 | 7/19/2013 | ||||
| 10.16 | Form of Water Street Director Indemnification Agreement. | 8-K | 000-31271 | 7/19/2013 | ||||
| 10.17 | Form of Director Indemnification Agreement. | 8-K | 000-31271 | 7/19/2013 | ||||
| 10.18*† | 2013 Distribution Agreement, effective as of October 12, 2013, between RTI Surgical, Inc. and Medtronic Sofamor Danek USA, Inc. | 10-K(2013) | 000-31271 | 3/10/2014 | ||||
| 10.19* | Second Amendment to the Second Amended and Restated Loan Agreement dated October 15, 2014 by and among RTI Surgical, Inc., TD Bank, N.A., a national banking association, as administrative agent for the Lenders and each of the Lenders from time to time a party thereto. | |||||||
| 23.1* | Consent of Independent Registered Public Accounting Firm. | |||||||
| 31.1* | Certification of Brian K. Hutchison, President and Chief Executive Officer, pursuant to Section 302 of the Sarbanes-Oxley Act of 2002. | |||||||
| 31.2* | Certification of Robert P. Jordheim, Executive Vice President and Chief Financial Officer, pursuant to Section 302 of the Sarbanes-Oxley Act of 2002. | |||||||
| 32.1* | Certification of Brian K. Hutchison, President and Chief Executive Officer, pursuant to Section 906 of the Sarbanes-Oxley Act of 2002, regarding the information contained in RTI Surgical, Inc.’s Annual Report on Form 10-K for the year ended December 31, 2014. | |||||||
| 32.2* | Certification of Robert P. Jordheim, Executive Vice President and Chief Financial Officer, pursuant to Section 906 of the Sarbanes-Oxley Act of 2002, regarding the information contained in RTI Surgical, Inc.’s Annual Report on Form 10-K for the year ended December 31, 2014. | |||||||
| 101.INS* | XBRL Instance Document | |||||||
| 101.SCH* | XBRL Taxonomy Extension Schema Document | |||||||
| 101.CAL* | XBRL Taxonomy Extension Calculation Linkbase Document | |||||||
| 101.DEF* | XBRL Taxonomy Extension Definition Linkbase Document | |||||||
Table of Contents
| Exhibit No. |
Description |
Incorporated by Reference | ||||||
| Form |
File No. |
Date Filed | ||||||
| 101.LAB* | XBRL Taxonomy Extension Label Linkbase Document | |||||||
| 101.PRE* | XBRL Taxonomy Extension Presentation Linkbase Document | |||||||
| † | Confidential treatment requested as to certain portions, which portions were omitted and filed separately with the Commission. |
| ‡ | Indicates a management contract or any compensatory plan, contract, or arrangement. |
| * | Filed herewith. |