Attached files
| file | filename |
|---|---|
| 8-K - 8-K - UNITED INSURANCE HOLDINGS CORP. | form8-k2015investorpresent.htm |
| EX-99.2 - EXHIBIT 99.2 - UNITED INSURANCE HOLDINGS CORP. | exh992investorpresentation.htm |
United Insurance Holdings Corp. NASDAQ: UIHC Investor Presentation March 3, 2015
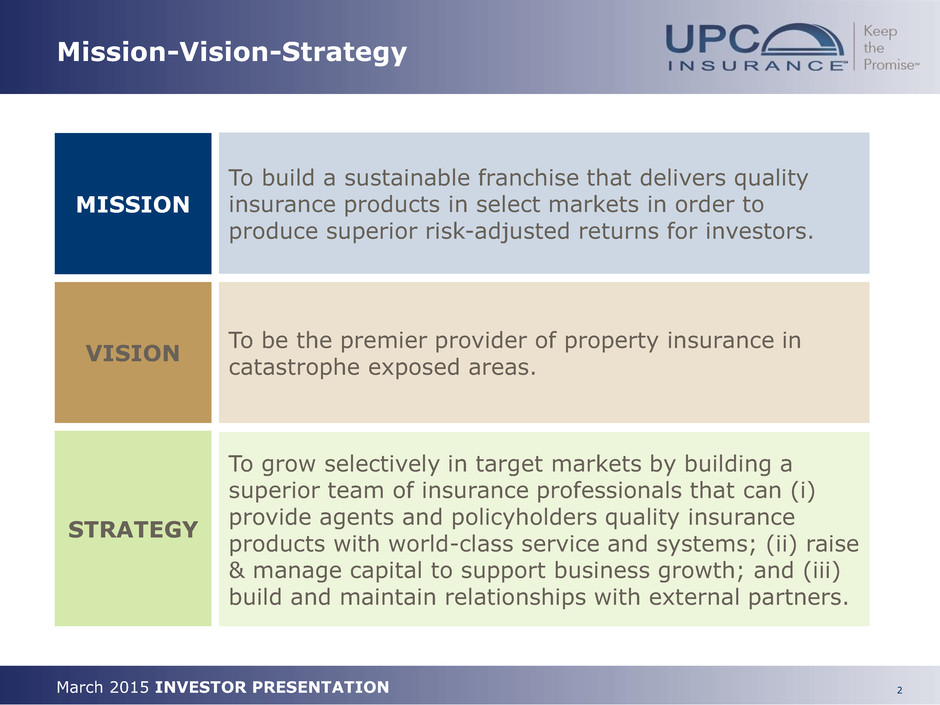
2 March 2015 INVESTOR PRESENTATION Mission-Vision-Strategy To build a sustainable franchise that delivers quality insurance products in select markets in order to produce superior risk-adjusted returns for investors. MISSION To be the premier provider of property insurance in catastrophe exposed areas. VISION To grow selectively in target markets by building a superior team of insurance professionals that can (i) provide agents and policyholders quality insurance products with world-class service and systems; (ii) raise & manage capital to support business growth; and (iii) build and maintain relationships with external partners. STRATEGY
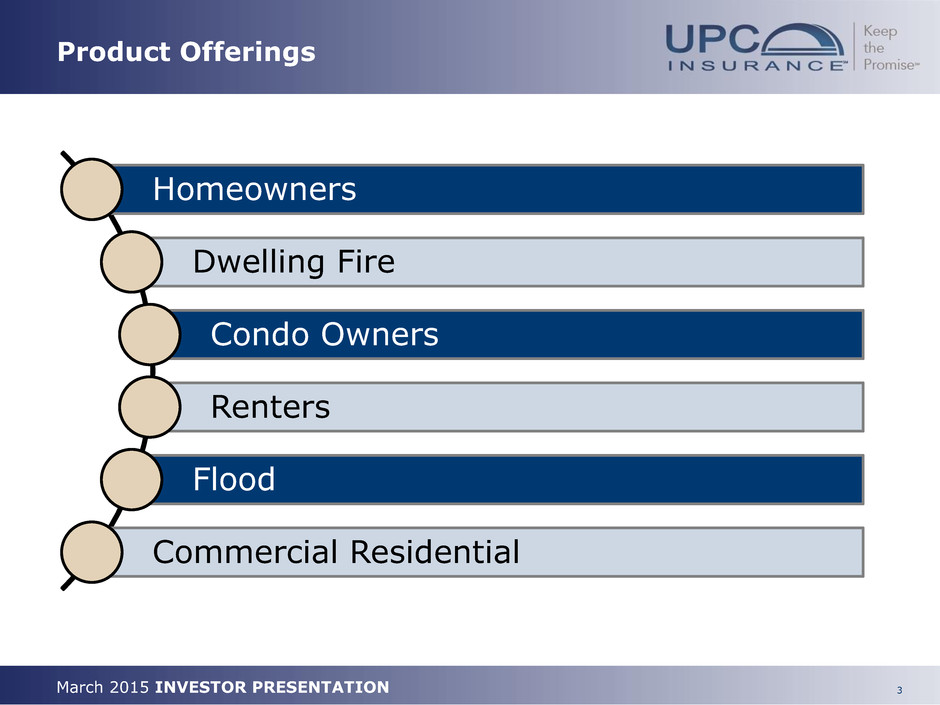
3 March 2015 INVESTOR PRESENTATION Product Offerings Homeowners Dwelling Fire Condo Owners Renters Flood Commercial Residential
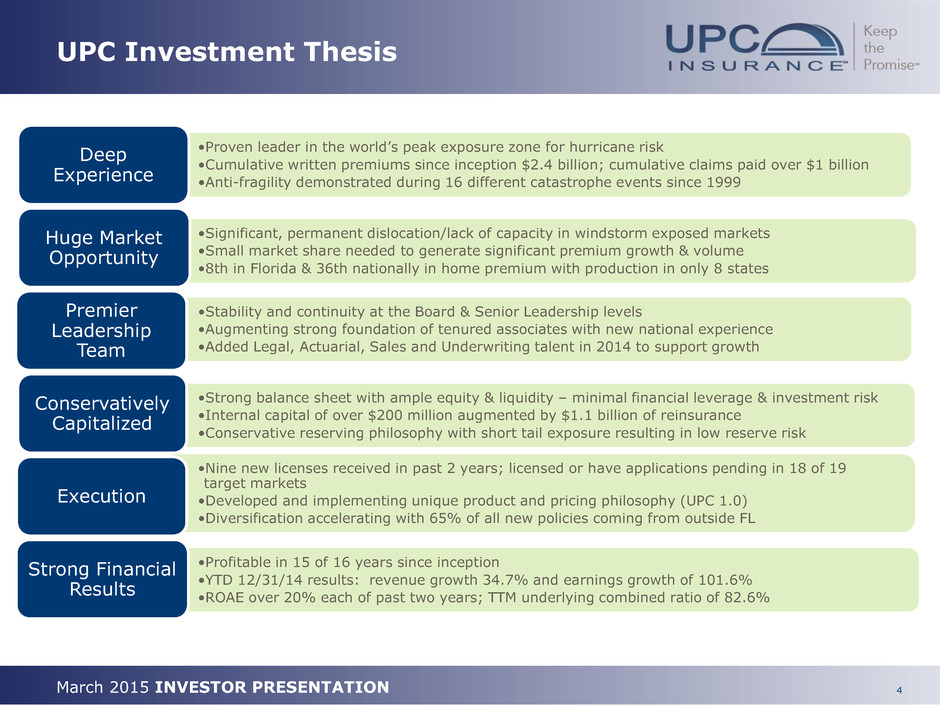
4 March 2015 INVESTOR PRESENTATION UPC Investment Thesis •Proven leader in the world’s peak exposure zone for hurricane risk •Cumulative written premiums since inception $2.4 billion; cumulative claims paid over $1 billion •Anti-fragility demonstrated during 16 different catastrophe events since 1999 Deep Experience •Significant, permanent dislocation/lack of capacity in windstorm exposed markets •Small market share needed to generate significant premium growth & volume •8th in Florida & 36th nationally in home premium with production in only 8 states Huge Market Opportunity •Stability and continuity at the Board & Senior Leadership levels •Augmenting strong foundation of tenured associates with new national experience •Added Legal, Actuarial, Sales and Underwriting talent in 2014 to support growth Premier Leadership Team •Strong balance sheet with ample equity & liquidity – minimal financial leverage & investment risk •Internal capital of over $200 million augmented by $1.1 billion of reinsurance •Conservative reserving philosophy with short tail exposure resulting in low reserve risk Conservatively Capitalized •Nine new licenses received in past 2 years; licensed or have applications pending in 18 of 19 target markets •Developed and implementing unique product and pricing philosophy (UPC 1.0) •Diversification accelerating with 65% of all new policies coming from outside FL Execution •Profitable in 15 of 16 years since inception •YTD 12/31/14 results: revenue growth 34.7% and earnings growth of 101.6% •ROAE over 20% each of past two years; TTM underlying combined ratio of 82.6% Strong Financial Results
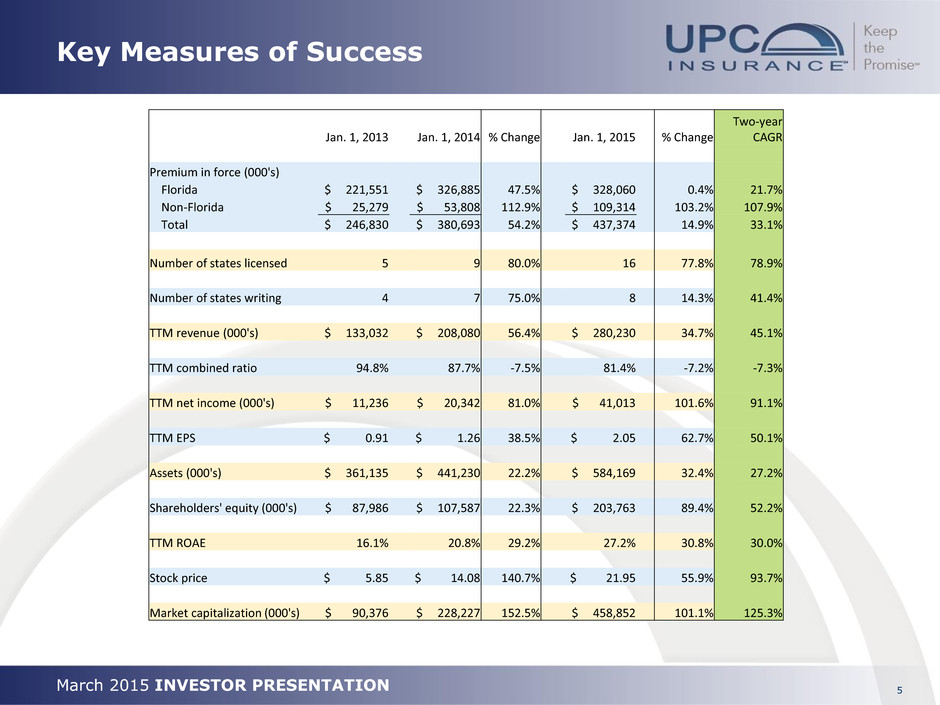
March 2015 INVESTOR PRESENTATION 5 Key Measures of Success Jan. 1, 2013 Jan. 1, 2014 % Change Jan. 1, 2015 % Change Two-year CAGR Premium in force (000's) Florida $ 221,551 $ 326,885 47.5% $ 328,060 0.4% 21.7% Non-Florida $ 25,279 $ 53,808 112.9% $ 109,314 103.2% 107.9% Total $ 246,830 $ 380,693 54.2% $ 437,374 14.9% 33.1% Number of states licensed 5 9 80.0% 16 77.8% 78.9% Number of states writing 4 7 75.0% 8 14.3% 41.4% TTM revenue (000's) $ 133,032 $ 208,080 56.4% $ 280,230 34.7% 45.1% TTM combined ratio 94.8% 87.7% -7.5% 81.4% -7.2% -7.3% TTM net income (000's) $ 11,236 $ 20,342 81.0% $ 41,013 101.6% 91.1% TTM EPS $ 0.91 $ 1.26 38.5% $ 2.05 62.7% 50.1% Assets (000's) $ 361,135 $ 441,230 22.2% $ 584,169 32.4% 27.2% Shareholders' equity (000's) $ 87,986 $ 107,587 22.3% $ 203,763 89.4% 52.2% TTM ROAE 16.1% 20.8% 29.2% 27.2% 30.8% 30.0% Stock price $ 5.85 $ 14.08 140.7% $ 21.95 55.9% 93.7% Market capitalization (000's) $ 90,376 $ 228,227 152.5% $ 458,852 101.1% 125.3%
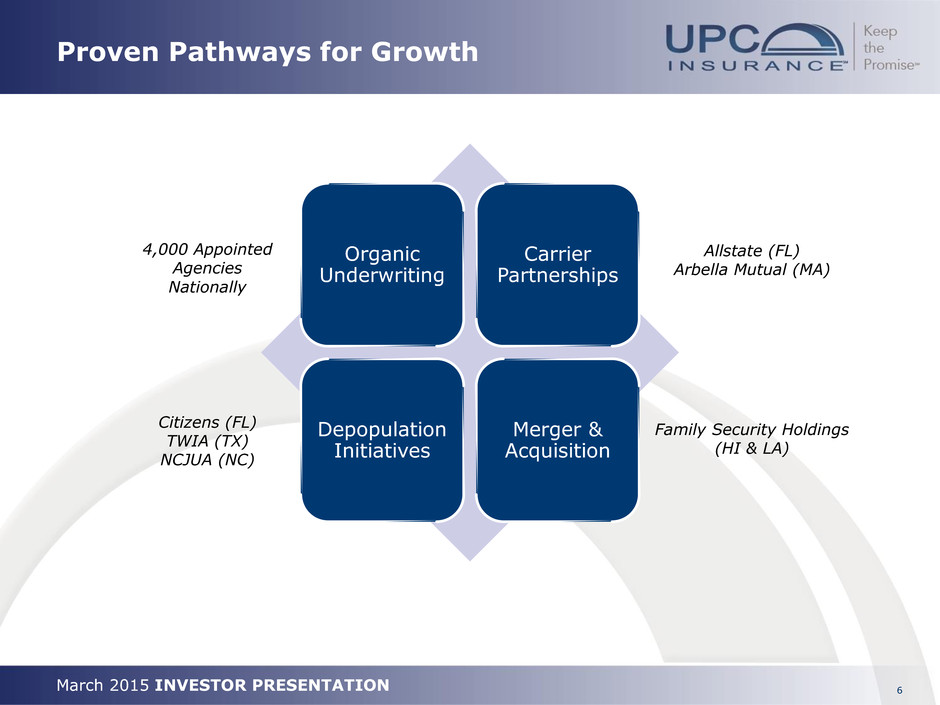
March 2015 INVESTOR PRESENTATION 6 Proven Pathways for Growth Organic Underwriting Carrier Partnerships Depopulation Initiatives Merger & Acquisition 4,000 Appointed Agencies Nationally Citizens (FL) TWIA (TX) NCJUA (NC) Family Security Holdings (HI & LA) Allstate (FL) Arbella Mutual (MA)
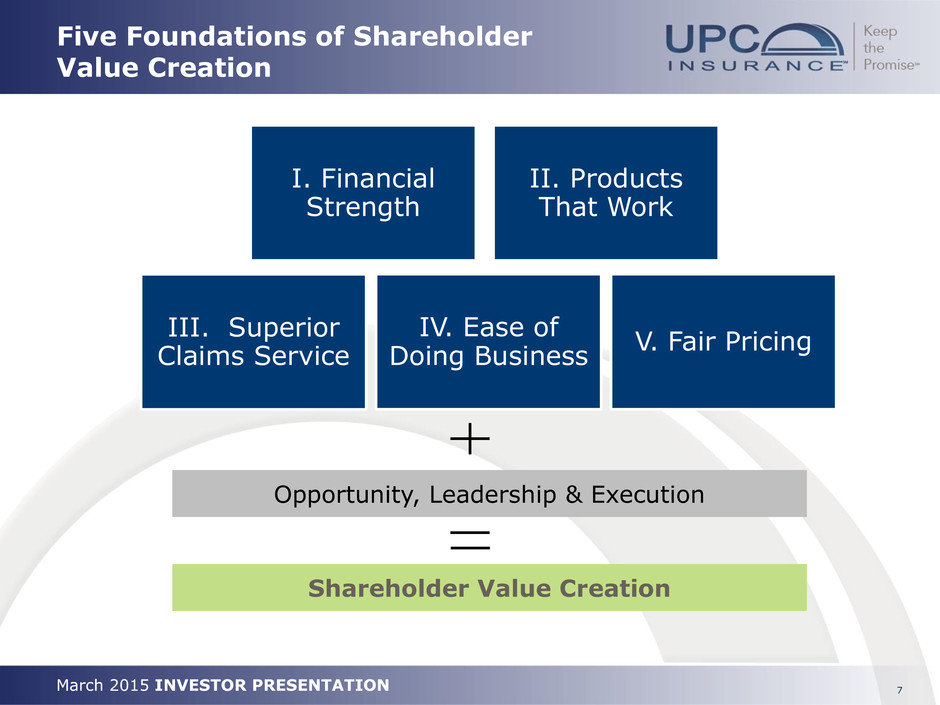
March 2015 INVESTOR PRESENTATION 7 Five Foundations of Shareholder Value Creation I. Financial Strength II. Products That Work III. Superior Claims Service IV. Ease of Doing Business V. Fair Pricing Opportunity, Leadership & Execution Shareholder Value Creation
March 2015 INVESTOR PRESENTATION OPPORTUNITY
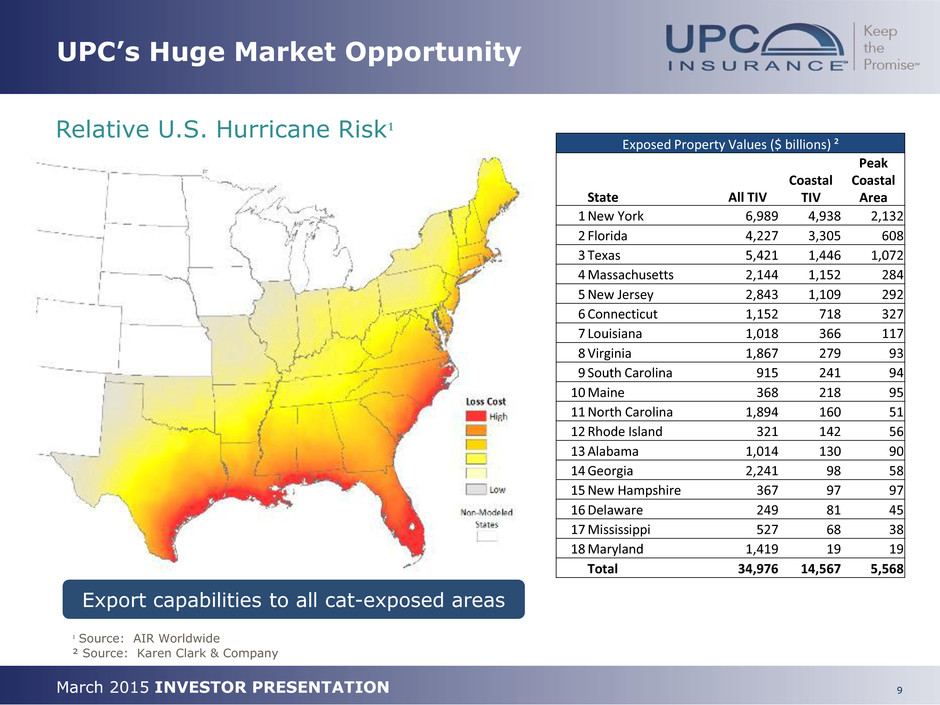
9 March 2015 INVESTOR PRESENTATION UPC’s Huge Market Opportunity Relative U.S. Hurricane Risk¹ ¹ Source: AIR Worldwide ² Source: Karen Clark & Company Exposed Property Values ($ billions) ² All TIV Coastal TIV Peak Coastal Area State 1 New York 6,989 4,938 2,132 2 Florida 4,227 3,305 608 3 Texas 5,421 1,446 1,072 4 Massachusetts 2,144 1,152 284 5 New Jersey 2,843 1,109 292 6 Connecticut 1,152 718 327 7 Louisiana 1,018 366 117 8 Virginia 1,867 279 93 9 South Carolina 915 241 94 10 Maine 368 218 95 11 North Carolina 1,894 160 51 12 Rhode Island 321 142 56 13 Alabama 1,014 130 90 14 Georgia 2,241 98 58 15 New Hampshire 367 97 97 16 Delaware 249 81 45 17 Mississippi 527 68 38 18 Maryland 1,419 19 19 Total 34,976 14,567 5,568 Export capabilities to all cat-exposed areas
March 2015 INVESTOR PRESENTATION LEADERSHIP
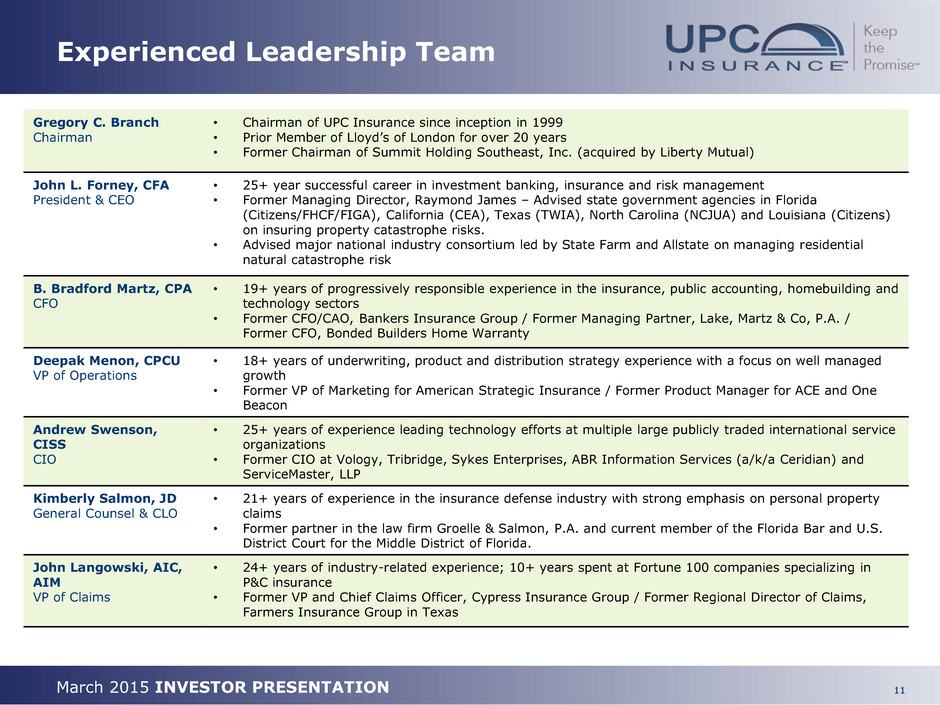
11 March 2015 INVESTOR PRESENTATION Gregory C. Branch Chairman • Chairman of UPC Insurance since inception in 1999 • Prior Member of Lloyd’s of London for over 20 years • Former Chairman of Summit Holding Southeast, Inc. (acquired by Liberty Mutual) John L. Forney, CFA President & CEO • 25+ year successful career in investment banking, insurance and risk management • Former Managing Director, Raymond James – Advised state government agencies in Florida (Citizens/FHCF/FIGA), California (CEA), Texas (TWIA), North Carolina (NCJUA) and Louisiana (Citizens) on insuring property catastrophe risks. • Advised major national industry consortium led by State Farm and Allstate on managing residential natural catastrophe risk B. Bradford Martz, CPA CFO • 19+ years of progressively responsible experience in the insurance, public accounting, homebuilding and technology sectors • Former CFO/CAO, Bankers Insurance Group / Former Managing Partner, Lake, Martz & Co, P.A. / Former CFO, Bonded Builders Home Warranty Deepak Menon, CPCU VP of Operations • 18+ years of underwriting, product and distribution strategy experience with a focus on well managed growth • Former VP of Marketing for American Strategic Insurance / Former Product Manager for ACE and One Beacon Andrew Swenson, CISS CIO • 25+ years of experience leading technology efforts at multiple large publicly traded international service organizations • Former CIO at Vology, Tribridge, Sykes Enterprises, ABR Information Services (a/k/a Ceridian) and ServiceMaster, LLP Kimberly Salmon, JD General Counsel & CLO • 21+ years of experience in the insurance defense industry with strong emphasis on personal property claims • Former partner in the law firm Groelle & Salmon, P.A. and current member of the Florida Bar and U.S. District Court for the Middle District of Florida. John Langowski, AIC, AIM VP of Claims • 24+ years of industry-related experience; 10+ years spent at Fortune 100 companies specializing in P&C insurance • Former VP and Chief Claims Officer, Cypress Insurance Group / Former Regional Director of Claims, Farmers Insurance Group in Texas Experienced Leadership Team
March 2015 INVESTOR PRESENTATION EXECUTION
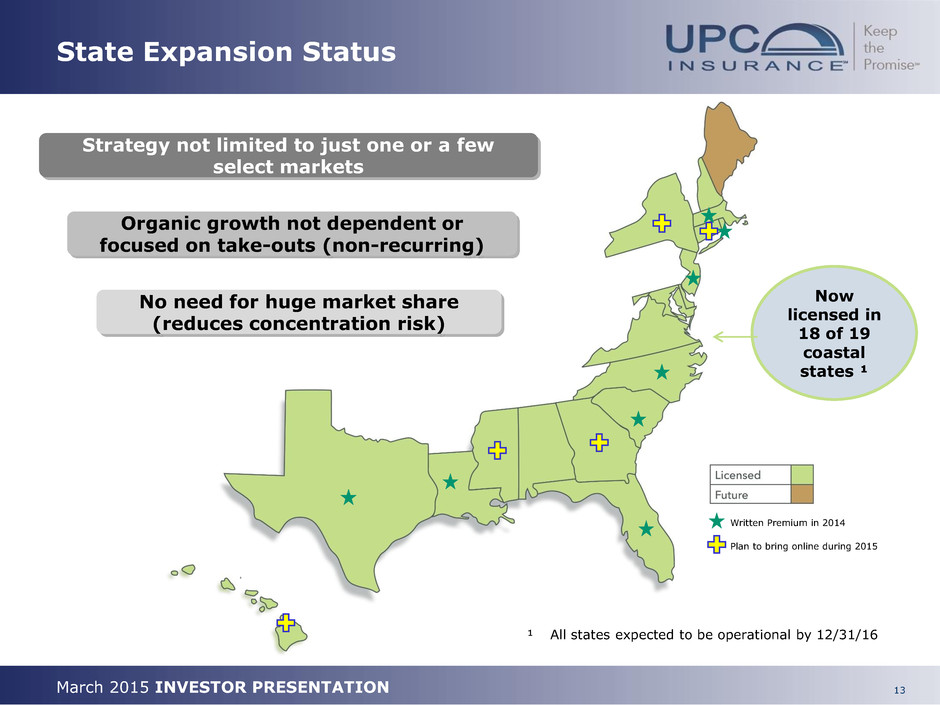
13 March 2015 INVESTOR PRESENTATION State Expansion Status Strategy not limited to just one or a few select markets No need for huge market share (reduces concentration risk) Organic growth not dependent or focused on take-outs (non-recurring) Now licensed in 18 of 19 coastal states ¹ Written Premium in 2014 Plan to bring online during 2015 ¹ All states expected to be operational by 12/31/16
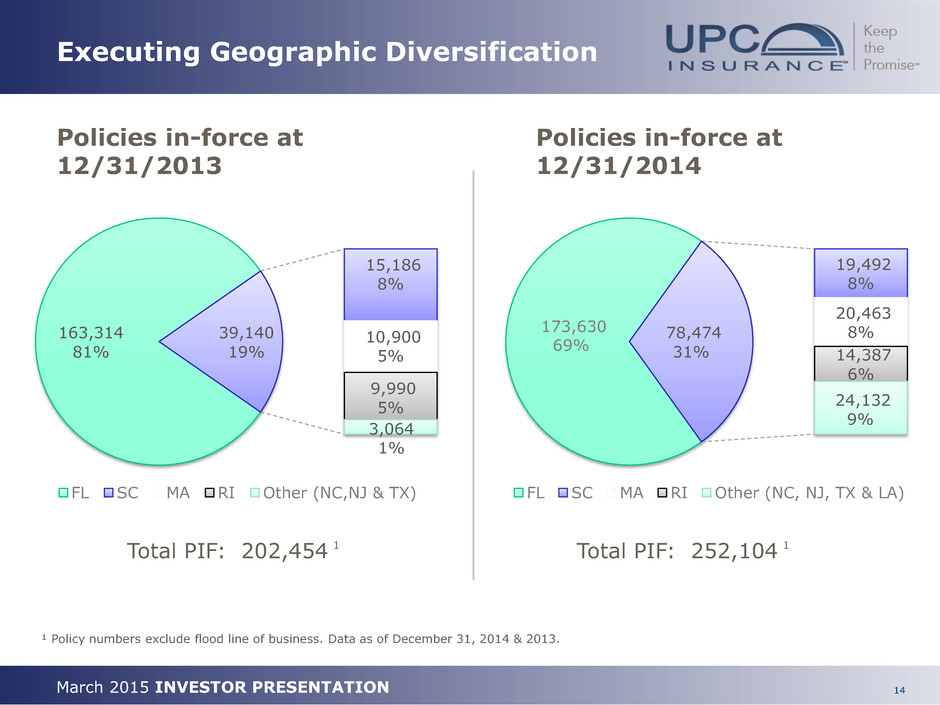
14 March 2015 INVESTOR PRESENTATION 163,314 81% 15,186 8% 10,900 5% 9,990 5% 3,064 1% 39,140 19% FL SC MA RI Other (NC,NJ & TX) Executing Geographic Diversification Policies in-force at 12/31/2014 Policies in-force at 12/31/2013 Total PIF: 202,454 1 Total PIF: 252,104 1 ¹ Policy numbers exclude flood line of business. Data as of December 31, 2014 & 2013. 173,630 69% 19,492 8% 20,463 8% 14,387 6% 24,132 9% 78,474 31% FL SC MA RI Other (NC, NJ, TX & LA)
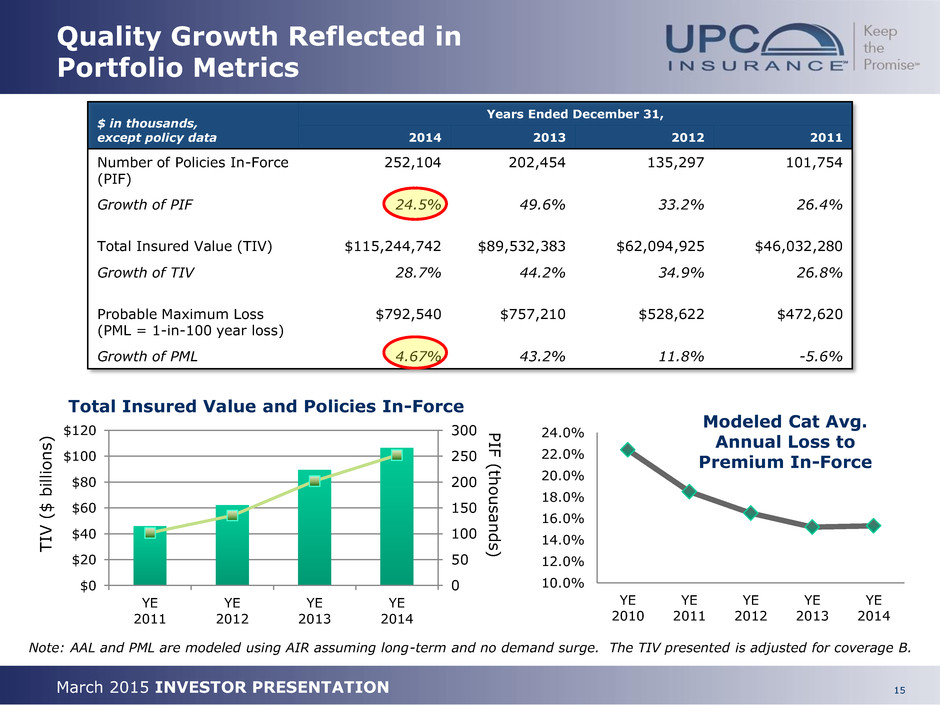
15 March 2015 INVESTOR PRESENTATION 0 50 100 150 200 250 300 $0 $20 $40 $60 $80 $100 $120 YE 2011 YE 2012 YE 2013 YE 2014 10.0% 12.0% 14.0% 16.0% 18.0% 20.0% 22.0% 24.0% YE 2010 YE 2011 YE 2012 YE 2013 YE 2014 Total Insured Value and Policies In-Force Quality Growth Reflected in Portfolio Metrics Modeled Cat Avg. Annual Loss to Premium In-Force $ in thousands, except policy data Years Ended December 31, 2014 2013 2012 2011 Number of Policies In-Force (PIF) 252,104 202,454 135,297 101,754 Growth of PIF 24.5% 49.6% 33.2% 26.4% Total Insured Value (TIV) $115,244,742 $89,532,383 $62,094,925 $46,032,280 Growth of TIV 28.7% 44.2% 34.9% 26.8% Probable Maximum Loss (PML = 1-in-100 year loss) $792,540 $757,210 $528,622 $472,620 Growth of PML 4.67% 43.2% 11.8% -5.6% Note: AAL and PML are modeled using AIR assuming long-term and no demand surge. The TIV presented is adjusted for coverage B. T IV ( $ b il li o n s ) P IF (th o u sa n d s )
March 2015 INVESTOR PRESENTATION FINANCIAL STRENGTH
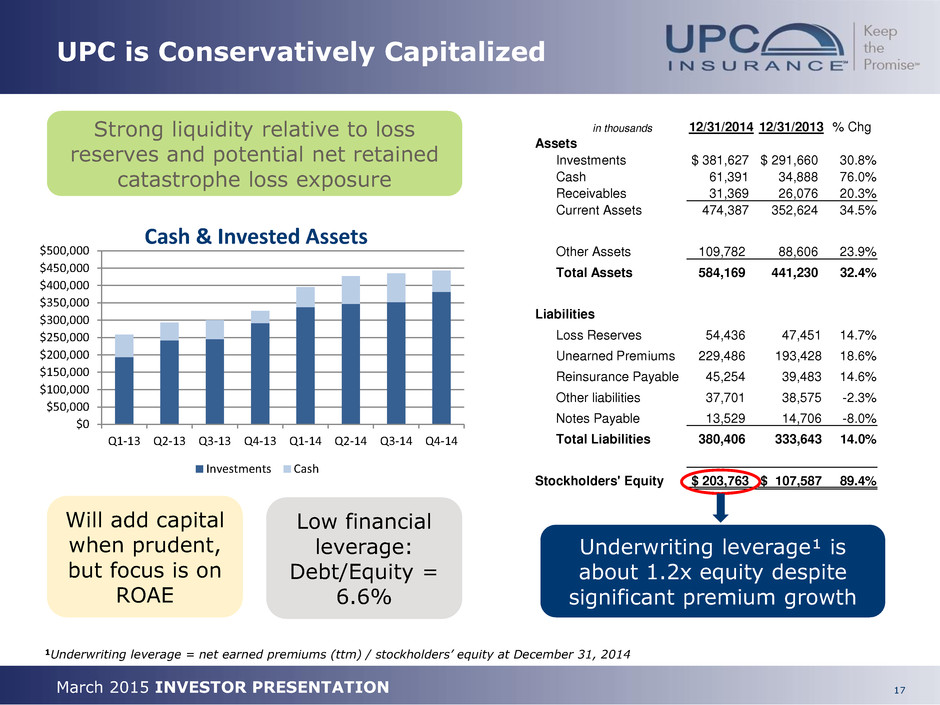
17 March 2015 INVESTOR PRESENTATION UPC is Conservatively Capitalized in thousands 12/31/2014 12/31/2013 % Chg Assets Investments $ 381,627 $ 291,660 30.8% Cash 61,391 34,888 76.0% Receivables 31,369 26,076 20.3% Current Assets 474,387 352,624 34.5% Other Assets 109,782 88,606 23.9% Total Assets 584,169 441,230 32.4% Liabilities Loss Reserves 54,436 47,451 14.7% Unearned Premiums 229,486 193,428 18.6% Reinsurance Payable 45,254 39,483 14.6% Other liabilities 37,701 38,575 -2.3% Notes Payable 13,529 14,706 -8.0% Total Liabilities 380,406 333,643 14.0% Stockholders' Equity $ 203,763 $ 107,587 89.4% Strong liquidity relative to loss reserves and potential net retained catastrophe loss exposure Underwriting leverage¹ is about 1.2x equity despite significant premium growth 1Underwriting leverage = net earned premiums (ttm) / stockholders’ equity at December 31, 2014 Will add capital when prudent, but focus is on ROAE $0 $50,000 $100,000 $150,000 $200,000 $250,000 $300,000 $350,000 $400,000 $450,000 $500,000 Q1-13 Q2-13 Q3-13 Q4-13 Q1-14 Q2-14 Q3-14 Q4-14 Cash & Invested Assets Investments Cash Low financial leverage: Debt/Equity = 6.6%
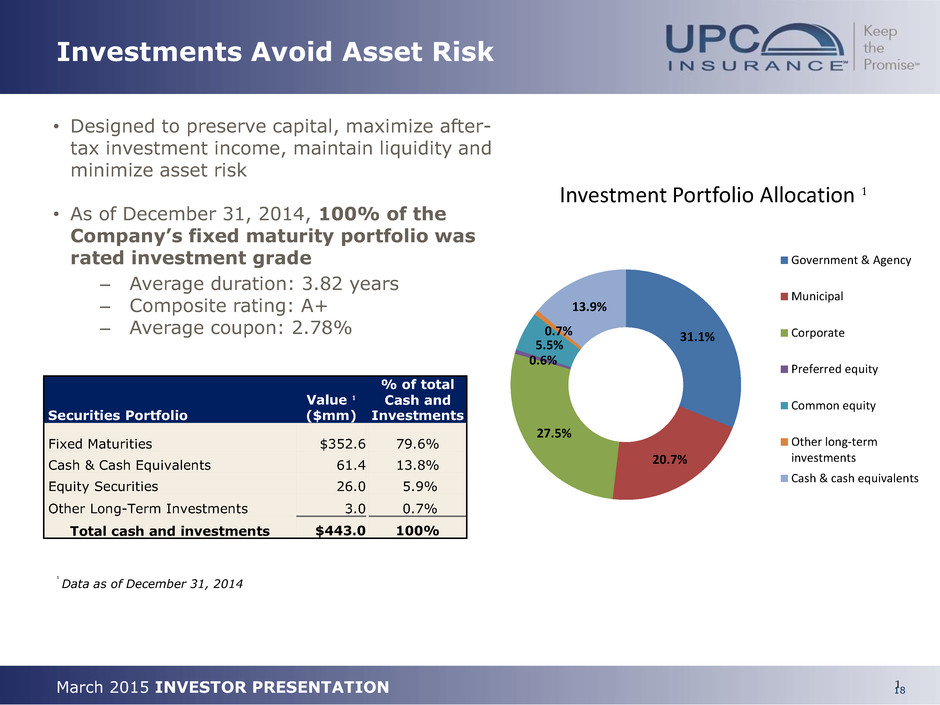
18 March 2015 INVESTOR PRESENTATION Investments Avoid Asset Risk 1 • Designed to preserve capital, maximize after- tax investment income, maintain liquidity and minimize asset risk • As of December 31, 2014, 100% of the Company’s fixed maturity portfolio was rated investment grade – Average duration: 3.82 years – Composite rating: A+ – Average coupon: 2.78% ¹ Data as of December 31, 2014 31.1% 20.7% 27.5% 0.6% 5.5% 0.7% 13.9% Investment Portfolio Allocation ¹ Government & Agency Municipal Corporate Preferred equity Common equity Other long-term investments Cash & cash equivalents Securities Portfolio Value ¹ ($mm) % of total Cash and Investments Fixed Maturities $352.6 79.6% Cash & Cash Equivalents 61.4 13.8% Equity Securities 26.0 5.9% Other Long-Term Investments 3.0 0.7% Total cash and investments $443.0 100%
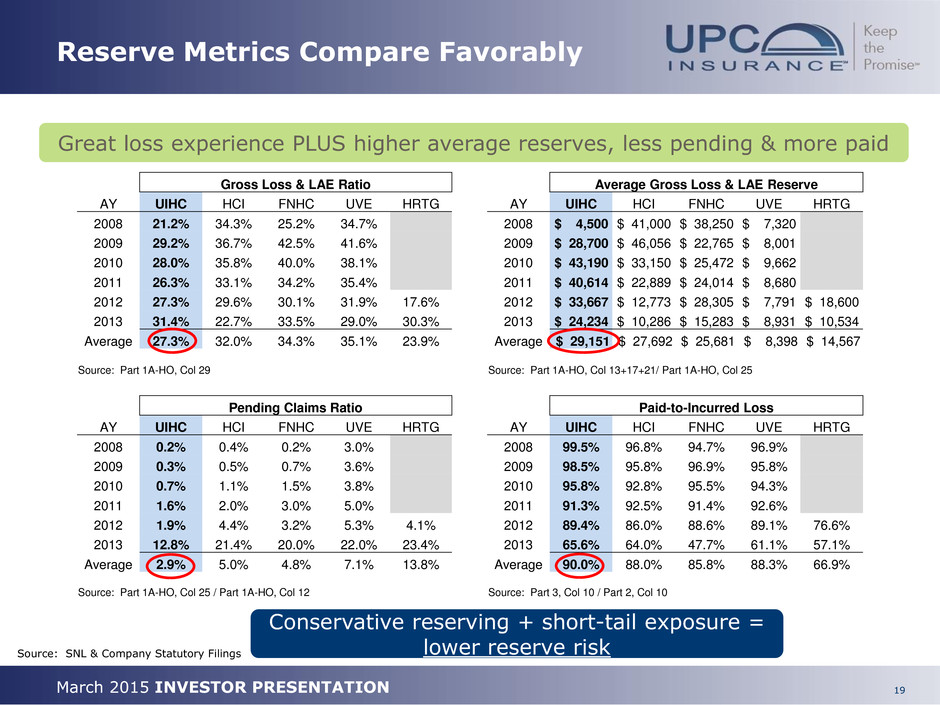
19 March 2015 INVESTOR PRESENTATION Reserve Metrics Compare Favorably Great loss experience PLUS higher average reserves, less pending & more paid Source: SNL & Company Statutory Filings Gross Loss & LAE Ratio Average Gross Loss & LAE Reserve AY UIHC HCI FNHC UVE HRTG AY UIHC HCI FNHC UVE HRTG 2008 21.2% 34.3% 25.2% 34.7% 2008 $ 4,500 $ 41,000 $ 38,250 $ 7,320 2009 29.2% 36.7% 42.5% 41.6% 2009 $ 28,700 $ 46,056 $ 22,765 $ 8,001 2010 28.0% 35.8% 40.0% 38.1% 2010 $ 43,190 $ 33,150 $ 25,472 $ 9,662 2011 26.3% 33.1% 34.2% 35.4% 2011 $ 40,614 $ 22,889 $ 24,014 $ 8,680 2012 27.3% 29.6% 30.1% 31.9% 17.6% 2012 $ 33,667 $ 12,773 $ 28,305 $ 7,791 $ 18,600 2013 31.4% 22.7% 33.5% 29.0% 30.3% 2013 $ 24,234 $ 10,286 $ 15,283 $ 8,931 $ 10,534 Average 27.3% 32.0% 34.3% 35.1% 23.9% Average $ 29,151 $ 27,692 $ 25,681 $ 8,398 $ 14,567 Source: Part 1A-HO, Col 29 Source: Part 1A-HO, Col 13+17+21/ Part 1A-HO, Col 25 Pending Claims Ratio Paid-to-Incurred Loss AY UIHC HCI FNHC UVE HRTG AY UIHC HCI FNHC UVE HRTG 2008 0.2% 0.4% 0.2% 3.0% 2008 99.5% 96.8% 94.7% 96.9% 2009 0.3% 0.5% 0.7% 3.6% 2009 98.5% 95.8% 96.9% 95.8% 2010 0.7% 1.1% 1.5% 3.8% 2010 95.8% 92.8% 95.5% 94.3% 2011 1.6% 2.0% 3.0% 5.0% 2011 91.3% 92.5% 91.4% 92.6% 2012 1.9% 4.4% 3.2% 5.3% 4.1% 2012 89.4% 86.0% 88.6% 89.1% 76.6% 2013 12.8% 21.4% 20.0% 22.0% 23.4% 2013 65.6% 64.0% 47.7% 61.1% 57.1% Average 2.9% 5.0% 4.8% 7.1% 13.8% Average 90.0% 88.0% 85.8% 88.3% 66.9% Source: Part 1A-HO, Col 25 / Part 1A-HO, Col 12 Source: Part 3, Col 10 / Part 2, Col 10 Conservative reserving + short-tail exposure = lower reserve risk
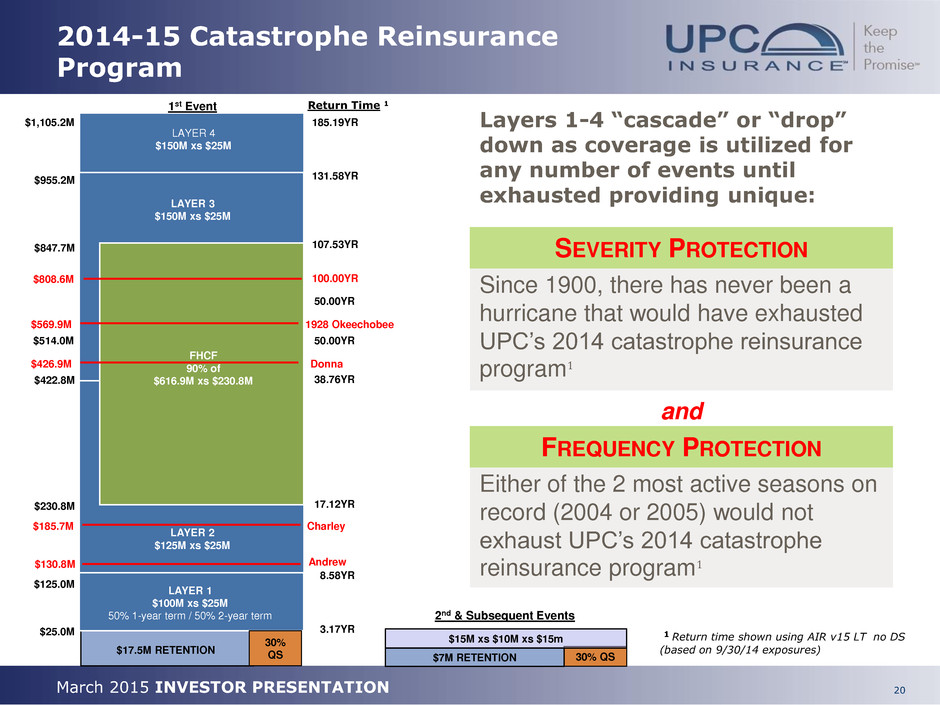
20 March 2015 INVESTOR PRESENTATION 2014-15 Catastrophe Reinsurance Program 1 Return time shown using AIR v15 LT no DS (based on 9/30/14 exposures) 30% QS $7M RETENTION $15M xs $10M xs $15m 2nd & Subsequent Events $25.0M LAYER 3 $150M xs $25M LAYER 1 $100M xs $25M 50% 1-year term / 50% 2-year term LAYER 2 $125M xs $25M $125.0M $422.8M $955.2M $17.5M RETENTION FHCF 90% of $616.9M xs $230.8M $847.7M $230.8M LAYER 4 $150M xs $25M $1,105.2M 3.17YR 8.58YR 17.12YR 107.53YR 131.58YR 185.19YR 38.76YR $808.6M 100.00YR $514.0M 50.00YR 30% QS Return Time 1 1st Event Andrew Charley $185.7M $130.8M Donna $426.9M 50.00YR 1928 Okeechobee $569.9M Since 1900, there has never been a hurricane that would have exhausted UPC’s 2014 catastrophe reinsurance program¹ SEVERITY PROTECTION Either of the 2 most active seasons on record (2004 or 2005) would not exhaust UPC’s 2014 catastrophe reinsurance program¹ FREQUENCY PROTECTION Layers 1-4 “cascade” or “drop” down as coverage is utilized for any number of events until exhausted providing unique: and
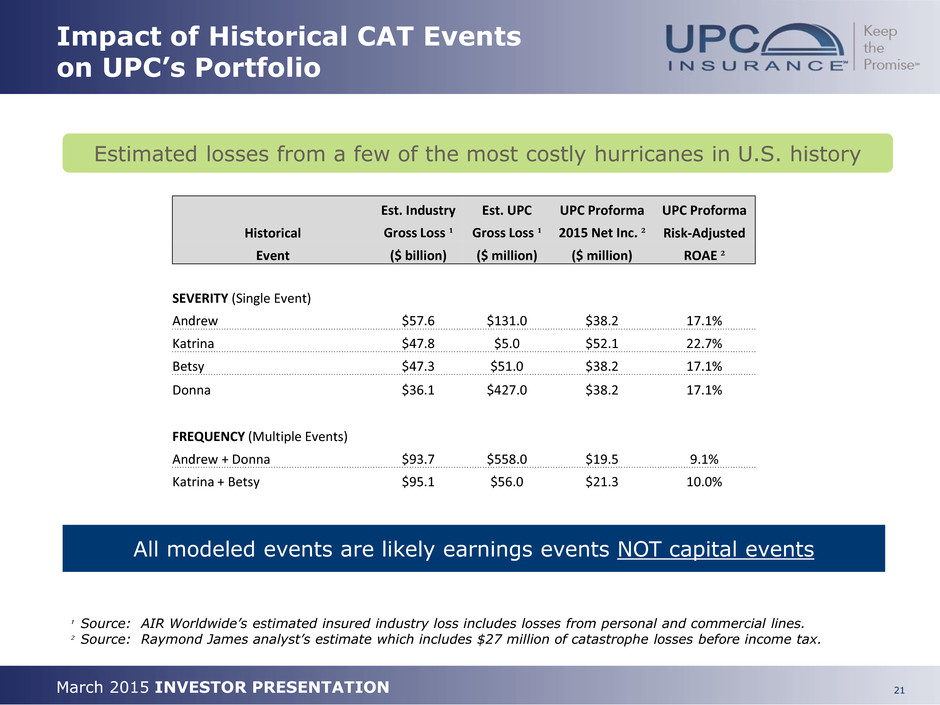
21 March 2015 INVESTOR PRESENTATION Impact of Historical CAT Events on UPC’s Portfolio ¹ Source: AIR Worldwide’s estimated insured industry loss includes losses from personal and commercial lines. ² Source: Raymond James analyst’s estimate which includes $27 million of catastrophe losses before income tax. All modeled events are likely earnings events NOT capital events Estimated losses from a few of the most costly hurricanes in U.S. history Est. Industry Est. UPC UPC Proforma UPC Proforma Historical Gross Loss ¹ Gross Loss ¹ 2015 Net Inc. ² Risk-Adjusted Event ($ billion) ($ million) ($ million) ROAE ² SEVERITY (Single Event) Andrew $57.6 $131.0 $38.2 17.1% Katrina $47.8 $5.0 $52.1 22.7% Betsy $47.3 $51.0 $38.2 17.1% Donna $36.1 $427.0 $38.2 17.1% FREQUENCY (Multiple Events) Andrew + Donna $93.7 $558.0 $19.5 9.1% Katrina + Betsy $95.1 $56.0 $21.3 10.0%
March 2015 INVESTOR PRESENTATION RESULTS
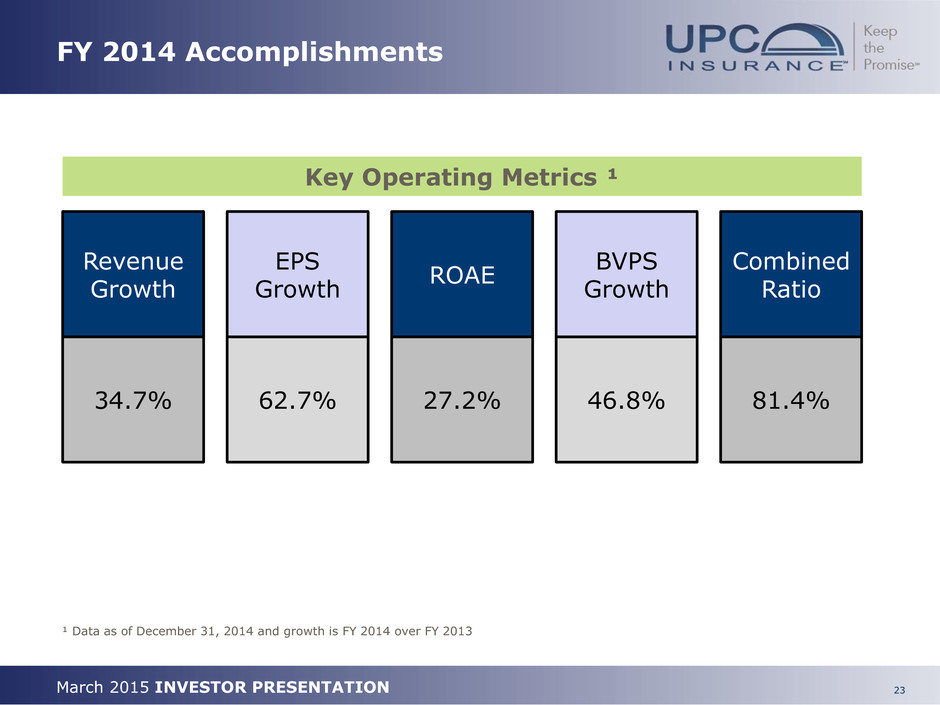
23 March 2015 INVESTOR PRESENTATION FY 2014 Accomplishments 34.7% Revenue Growth 62.7% EPS Growth 27.2% ROAE 46.8% BVPS Growth 81.4% Combined Ratio Key Operating Metrics ¹ ¹ Data as of December 31, 2014 and growth is FY 2014 over FY 2013

24 March 2015 INVESTOR PRESENTATION Operating Highlights Strong results fueled by diversification benefits of organic state expansion 1Ceding ratio = ceded earned premiums / gross earned premiums Consolidated GAAP ($000) Q4-14 Q4-13 % Chg YTD 2014 YTD 2013 % Chg Revenue Gross Earned $ 113,767 $ 106,702 6.6% $ 400,695 $ 316,708 26.5% Ceded Earned (36,088) (31,505) 14.5% (135,845) (119,330) 13.8% Net Earned 71,522 60,289 18.6% 264,850 197,378 34.2% Investment Income 1,904 1,227 55.2% 6,795 3,871 75.5% Realized gain(loss) 4 70 -94.3% (20) (129) 84.5% Other revenue 2,742 1,855 47.8% 8,605 6,960 23.6% Total Revenue 76,172 63,441 20.1% 280,230 208,080 34.7% Expenses Loss & LAE 31,472 29,698 6.0% 118,077 98,830 19.5% Policy Acquisition 16,989 14,056 20.9% 65,657 50,623 29.5% Operating & Admin 9,906 6,142 61.3% 31,753 23,774 33.6% Interest Expense 85 112 -24.1% 410 367 11.7% Total Expense 58,452 50,008 16.9% 215,897 173,594 24.4% Earnings before tax 17,720 13,433 31.9% 64,333 34,486 86.6% Other Inc. (Exp.) 61 — 100.0% 77 1 100.0% Income Tax 6,387 2,593 146.3% 23,397 14,145 65.4% Net Income 11,394 7,351 55.0% 41,013 20,342 101.6% Ceding Ratio1 -33.5% -34.3% 0.8 pts -33.9% -37.7% 3.8 pts Net Loss Ratio 44.0% 49.2% -5.2 pts 44.6% 50.0% -5.4 pts Net Expense Ratio 37.6% 33.5% 4.1 pts 36.8% 37.7% -0.9 pts Combined Ratio 81.6% 82.7% -1.1 pts 81.4% 87.7% -6.3 pts $0 $2,000 $4,000 $6,000 $8,000 $10,000 $12,000 Q1-14 Q2-14 Q3-14 Q4-14 Y/Y Earnings Growth Prior Year Current Year $0.77 $0.91 $1.26 $2.05 $- $0.50 $1.00 $1.50 $2.00 $2.50 EPS Growth 4 Year CAGR = 27.7%
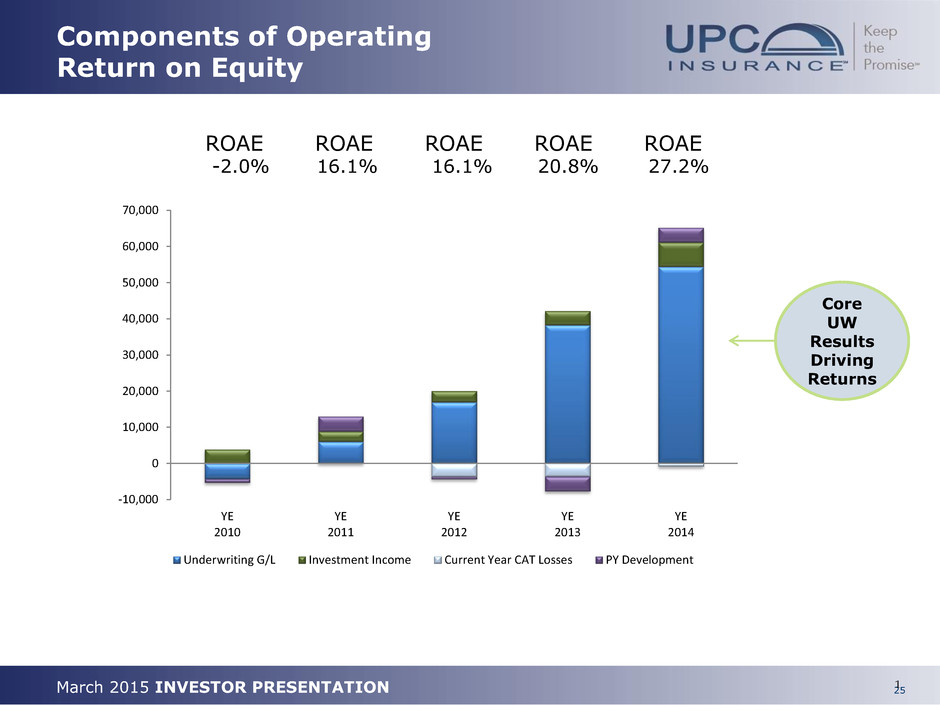
25 March 2015 INVESTOR PRESENTATION Components of Operating Return on Equity 1 Core UW Results Driving Returns ROAE ROAE ROAE ROAE ROAE -2.0% 16.1% 16.1% 20.8% 27.2% -10,000 0 10,000 20,000 30,000 40,000 50,000 60,000 70,000 YE 2010 YE 2011 YE 2012 YE 2013 YE 2014 Underwriting G/L Investment Income Current Year CAT Losses PY Development
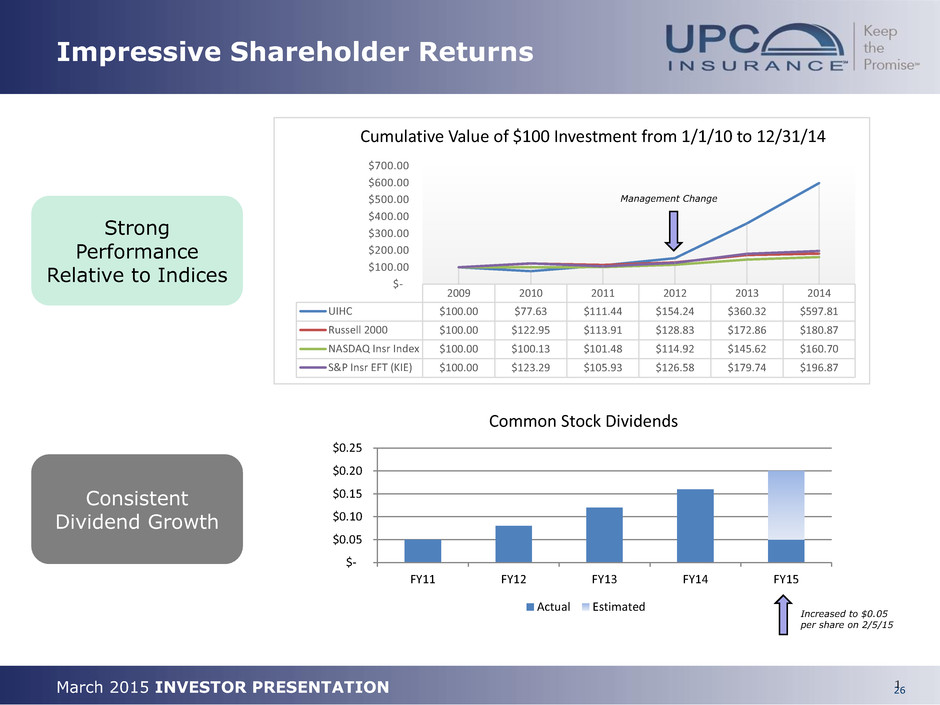
26 March 2015 INVESTOR PRESENTATION Impressive Shareholder Returns 1 $- $0.05 $0.10 $0.15 $0.20 $0.25 FY11 FY12 FY13 FY14 FY15 Common Stock Dividends Actual Estimated 2009 2010 2011 2012 2013 2014 UIHC $100.00 $77.63 $111.44 $154.24 $360.32 $597.81 Russell 2000 $100.00 $122.95 $113.91 $128.83 $172.86 $180.87 NASDAQ Insr Index $100.00 $100.13 $101.48 $114.92 $145.62 $160.70 S&P Insr EFT (KIE) $100.00 $123.29 $105.93 $126.58 $179.74 $196.87 $- $100.00 $200.00 $300.00 $400.00 $500.00 $600.00 $700.00 Cumulative Value of $100 Investment from 1/1/10 to 12/31/14 Consistent Dividend Growth Strong Performance Relative to Indices Management Change Increased to $0.05 per share on 2/5/15
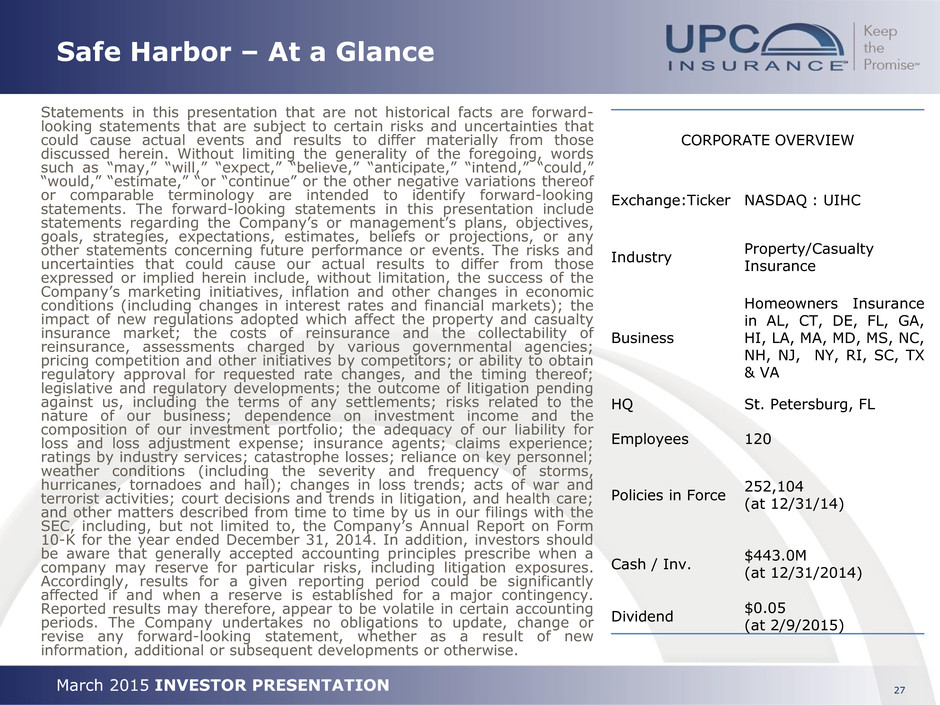
March 2015 INVESTOR PRESENTATION 27 Safe Harbor – At a Glance Statements in this presentation that are not historical facts are forward- looking statements that are subject to certain risks and uncertainties that could cause actual events and results to differ materially from those discussed herein. Without limiting the generality of the foregoing, words such as “may,” “will,” “expect,” “believe,” “anticipate,” “intend,” “could,” “would,” “estimate,” “or “continue” or the other negative variations thereof or comparable terminology are intended to identify forward-looking statements. The forward-looking statements in this presentation include statements regarding the Company’s or management’s plans, objectives, goals, strategies, expectations, estimates, beliefs or projections, or any other statements concerning future performance or events. The risks and uncertainties that could cause our actual results to differ from those expressed or implied herein include, without limitation, the success of the Company’s marketing initiatives, inflation and other changes in economic conditions (including changes in interest rates and financial markets); the impact of new regulations adopted which affect the property and casualty insurance market; the costs of reinsurance and the collectability of reinsurance, assessments charged by various governmental agencies; pricing competition and other initiatives by competitors; or ability to obtain regulatory approval for requested rate changes, and the timing thereof; legislative and regulatory developments; the outcome of litigation pending against us, including the terms of any settlements; risks related to the nature of our business; dependence on investment income and the composition of our investment portfolio; the adequacy of our liability for loss and loss adjustment expense; insurance agents; claims experience; ratings by industry services; catastrophe losses; reliance on key personnel; weather conditions (including the severity and frequency of storms, hurricanes, tornadoes and hail); changes in loss trends; acts of war and terrorist activities; court decisions and trends in litigation, and health care; and other matters described from time to time by us in our filings with the SEC, including, but not limited to, the Company’s Annual Report on Form 10-K for the year ended December 31, 2014. In addition, investors should be aware that generally accepted accounting principles prescribe when a company may reserve for particular risks, including litigation exposures. Accordingly, results for a given reporting period could be significantly affected if and when a reserve is established for a major contingency. Reported results may therefore, appear to be volatile in certain accounting periods. The Company undertakes no obligations to update, change or revise any forward-looking statement, whether as a result of new information, additional or subsequent developments or otherwise. CORPORATE OVERVIEW Exchange:Ticker NASDAQ : UIHC Industry Property/Casualty Insurance Business Homeowners Insurance in AL, CT, DE, FL, GA, HI, LA, MA, MD, MS, NC, NH, NJ, NY, RI, SC, TX & VA HQ St. Petersburg, FL Employees 120 Policies in Force 252,104 (at 12/31/14) Cash / Inv. $443.0M (at 12/31/2014) Dividend $0.05 (at 2/9/2015)
March 2015 INVESTOR PRESENTATION 28 Definitions of Non-GAAP Measures We believe that investors’ understanding of UPC Insurance’s performance is enhanced by our disclosure of the following non-GAAP measures. Our methods for calculating these measures may differ from those used by other companies and therefore comparability may be limited. Combined ratio excluding the effects of current year catastrophe losses, prior year development from lines in run-off and prior year development (underlying combined ratio) is a non-GAAP ratio, which is computed as the difference between four GAAP operating ratios: the combined ratio, the effect of current year catastrophe losses on the combined ratio, the effect of development from lines in run-off and prior year development on the combined ratio. We believe that this ratio is useful to investors and it is used by management to reveal the trends in our business that may be obscured by current year catastrophe losses, losses from lines in run-off and prior year development. Current year catastrophe losses cause our loss trends to vary significantly between periods as a result of their incidence of occurrence and magnitude, and can have a significant impact on the combined ratio. Prior year development from lines in run-off is caused by unexpected development from our commercial auto product that is no longer offered by the Company. Prior year development is unexpected loss development on historical reserves. We believe it is useful for investors to evaluate these components separately and in the aggregate when reviewing our performance. The most direct comparable GAAP measure is the combined ratio. The underlying combined ratio should not be considered as a substitute for the combined ratio and does not reflect the overall profitability of our business.
29
