Attached files
| file | filename |
|---|---|
| EX-31.2 - EX-31.2 - EVERTEC, Inc. | d827106dex312.htm |
| EX-23.1 - EX-23.1 - EVERTEC, Inc. | d827106dex231.htm |
| EX-31.1 - EX-31.1 - EVERTEC, Inc. | d827106dex311.htm |
| EX-21.1 - EX-21.1 - EVERTEC, Inc. | d827106dex211.htm |
| EX-32.2 - EX-32.2 - EVERTEC, Inc. | d827106dex322.htm |
| EX-10.36 - EX-10.36 - EVERTEC, Inc. | d827106dex1036.htm |
| EX-10.37 - EX-10.37 - EVERTEC, Inc. | d827106dex1037.htm |
| EX-10.40 - EX-10.40 - EVERTEC, Inc. | d827106dex1040.htm |
| EX-10.38 - EX-10.38 - EVERTEC, Inc. | d827106dex1038.htm |
| EX-10.39 - EX-10.39 - EVERTEC, Inc. | d827106dex1039.htm |
| EXCEL - IDEA: XBRL DOCUMENT - EVERTEC, Inc. | Financial_Report.xls |
| EX-32.1 - EX-32.1 - EVERTEC, Inc. | d827106dex321.htm |
Table of Contents
Index to Financial Statements
UNITED STATES
SECURITIES AND EXCHANGE COMMISSION
Washington, DC 20549
FORM 10-K
| x | ANNUAL REPORT PURSUANT TO SECTION 13 OR 15(d) OF THE SECURITIES EXCHANGE ACT OF 1934 |
For the fiscal year ended December 31, 2014
or
| ¨ | TRANSITION REPORT PURSUANT TO SECTION 13 OR 15(d) OF THE SECURITIES EXCHANGE ACT OF 1934 |
Commission File Number 001-35872
EVERTEC, Inc.
(Exact name of registrant as specified in its charter)
| Puerto Rico | 66-0783622 | |
| (State or other jurisdiction of incorporation or organization) |
(I.R.S. employer identification number) | |
| Cupey Center Building, Road 176, Kilometer 1.3, San Juan, Puerto Rico |
00926 | |
| (Address of principal executive offices) | (Zip Code) | |
(787) 759-9999
(Registrant’s telephone number, including area code)
Securities registered pursuant to Section 12(b) of the Act:
| Title of each class |
Name of each exchange on which registered | |
| Common Stock, $0.01 par value | New York Stock Exchange |
Securities registered pursuant to Section 12(g) of the Act: None
Indicate by check mark if the registrant is a well-known seasoned issuer, as defined in Rule 405 of the Securities Act. Yes ¨ No x
Indicate by check mark if the registrant is not required to file reports pursuant to Section 13 or Section 15(d) of the Act. Yes ¨ No x
Indicate by check mark whether the registrant (1) has filed all reports required to be filed by Section 13 or 15(d) of the Securities Exchange Act of 1934 during the preceding 12 months (or for such shorter period that the registrant was required to file such reports), and (2) has been subject to such filing requirements for the past 90 days. Yes x No ¨
Indicate by check mark whether the registrant has submitted electronically and posted on its corporate Web site, if any, every Interactive Data File required to be submitted and posted pursuant to Rule 405 of Regulation S-T (§232.405 of this chapter) during the preceding 12 months (or for such shorter period that the registrant was required to submit and post such files). Yes x No ¨
Indicate by check mark if disclosure of delinquent filers pursuant to Item 405 of Regulation S-K (§229.405 of this chapter) is not contained herein, and will not be contained, to the best of registrant’s knowledge, in definitive proxy or information statements incorporated by reference in Part III of this Form 10-K or any amendment to this Form 10-K. ¨
Indicate by check mark whether the registrant is a large accelerated filer, an accelerated filer, a non-accelerated filer, or a smaller reporting company. See the definitions of “large accelerated filer,” “accelerated filer” and “smaller reporting company” in Rule 12b-2 of the Exchange Act.:
| Large accelerated filer | x | Accelerated filer | ¨ | |||
| Non-accelerated filer | ¨ (Do not check if a smaller reporting company) | Smaller reporting company | ¨ | |||
Indicate by check mark whether the registrant is a shell company (as defined in Rule 12b-2 of the Exchange Act). Yes ¨ No x
The aggregate market value of the common stock held by non-affiliates of EVERTEC, Inc. was approximately $1,577,414,218 based on the closing price of $24.03 as of the close of business on June 30, 2014.
As of February 20, 2015, there were 77,893,144 outstanding shares of common stock of EVERTEC, Inc.
Documents Incorporated by Reference:
Part III incorporates certain information by reference to the Proxy Statement for the 2015 Annual Meeting of Shareholders
Table of Contents
Index to Financial Statements
EVERTEC, Inc.
2014 Annual Report on Form 10-K
| Page | ||||
| 1 | ||||
| Part I |
||||
| 3 | ||||
| 17 | ||||
| 36 | ||||
| 36 | ||||
| 36 | ||||
| 36 | ||||
| Part II |
||||
| 37 | ||||
| 40 | ||||
| Item 7—Management’s Discussion and Analysis of Financial Condition and Results of Operations |
42 | |||
| Item 7A—Quantitative and Qualitative Disclosures About Market Risks |
62 | |||
| 62 | ||||
| Item 9—Changes in and Disagreements with Accountants on Accounting and Financial Disclosure |
63 | |||
| 63 | ||||
| 65 | ||||
| Part III |
||||
| Item 10—Directors, Executive Officers and Corporate Governance |
66 | |||
| 66 | ||||
| 66 | ||||
| Item 13—Certain Relationships and Related Transactions and Director Independence |
66 | |||
| 66 | ||||
| Part IV |
||||
| 66 | ||||
| 73 | ||||
Table of Contents
Index to Financial Statements
This Annual Report on Form 10-K contains “forward-looking statements” within the meaning of, and subject to the protection of, the Private Securities Litigation Reform Act of 1995. Such statements can be identified by the use of forward-looking terminology such as “believes,” “expects,” “may,” “estimates,” “will,” “should,” “plans” or “anticipates” or the negative thereof or other variations thereon or comparable terminology, or by discussions of strategy. Readers are cautioned that any such forward-looking statements are not guarantees of future performance and may involve significant risks and uncertainties, and that actual results may vary materially from those in the forward-looking statements as a result of various factors. Among the factors that significantly impact our business and could impact our business in the future are:
| • | our reliance on our relationship with Popular, Inc. (“Popular”) for a significant portion of our revenues and with Banco Popular de Puerto Rico (“Banco Popular”), Popular’s principal banking subsidiary, to grow our merchant acquiring business; |
| • | our ability to renew our client contracts on terms favorable to us; |
| • | our dependence on our processing systems, technology infrastructure, security systems and fraudulent payment detection systems, as well as on our personnel and certain third parties with whom we do business, and the risks to our business if our systems are hacked or otherwise compromised; |
| • | our ability to develop, install and adopt new software, technology and computing systems; |
| • | a decreased client base due to consolidations and failures in the financial services industry; |
| • | the credit risk of our merchant clients, for which we may also be liable; |
| • | the continuing market position of the ATH network; |
| • | a reduction in consumer confidence, whether as a result of a global economic downturn or otherwise, which leads to a decrease in consumer spending; |
| • | our dependence on credit card associations, including any adverse changes in credit card association or network rules or fees; |
| • | changes in the regulatory environment and changes in international, legal, political, administrative or economic conditions; |
| • | the geographical concentration of our business in Puerto Rico; |
| • | operating an international business in multiple regions with potential political and economic instability, including Latin America; |
| • | increased legal compliance risks associated with operating in countries outside the United States; |
| • | our ability to execute our geographic expansion and acquisition strategies; |
| • | our ability to protect our intellectual property rights against infringement and to defend ourselves against claims of infringement brought by third parties; |
| • | our ability to recruit and retain the qualified personnel necessary to operate our business; |
| • | our ability to comply with U.S. federal, state, local and foreign, regulatory requirements; |
| • | evolving industry standards and adverse changes in global economic, political and other conditions; |
| • | our high level of indebtedness and restrictions contained in our debt agreements, including our senior secured credit facilities, as well as debt that could be incurred in the future; |
| • | our ability to generate sufficient cash to service our indebtedness and to generate future profits; and |
| • | other risks and uncertainties detailed in Part I, Item IA “Risk Factors” in this Annual Report on Form 10-K (“Report”). |
1
Table of Contents
Index to Financial Statements
These forward-looking statements involve a number of risks and uncertainties that could cause actual results to differ materially from those suggested by the forward-looking statements. Forward-looking statements should, therefore, be considered in light of various factors, including those set forth under “Item 1A. Risk Factors,” in “Item 7. Management’s Discussion and Analysis of Financial Condition and Results of Operations” and elsewhere in this Report. These forward-looking statements speak only as of the date of this Report, and we do not undertake any obligation to publicly release any revisions to these forward-looking statements to reflect events or circumstances after the date of this Report or to reflect the occurrence of unanticipated events.
INDUSTRY AND MARKET DATA
This Form 10-K includes industry data that we obtained from periodic industry publications, including the January 2013 and July 2014 Nilson Reports, the October 2013 Gartner Dataquest Market Statistics and the 2014 World Payments Report. Industry publications generally state that the information contained therein has been obtained from sources believed to be reliable. This Form 10-K also includes market share and industry data that were prepared primarily based on management’s knowledge of the industry and industry data. Unless otherwise noted, statements as to our market share and market position relative to our competitors are approximated and based on management estimates using the above-mentioned latest-available third-party data and our internal analyses and estimates. While we are not aware of any misstatements regarding any industry data presented herein, our estimates, in particular as they relate to market share and our general expectations, involve risks and uncertainties and are subject to change based on various factors, including those discussed under “Risk Factors,” “Forward-Looking Statements” and “Management’s Discussion and Analysis of Financial Condition and Results of Operations” in this Form 10-K.
The Gartner report, “Forecast: Enterprise IT Spending by Vertical Industry Market, Worldwide, 2011-2017, 3Q13 Update,” October 2013, described herein (the “Gartner Report”), represents data, research opinion or viewpoints published as part of a syndicated subscription service by Gartner, Inc. and are not representations of fact. The Gartner Report speaks as of its original publication date (and not as of the date of this Form 10-K) and the opinions expressed in the Gartner Report are subject to change without notice.
2
Table of Contents
Index to Financial Statements
Part I
Except as otherwise indicated or unless the context otherwise requires, (a) the terms “EVERTEC,” “we,” “us,” “our,” “our Company” and “the Company” refer to EVERTEC, Inc. and its subsidiaries on a consolidated basis, (b) the term “Holdings” refers to EVERTEC Intermediate Holdings, LLC, but not any of its subsidiaries and (c) the term “EVERTEC Group” refers to EVERTEC Group, LLC and its predecessor entities and their subsidiaries on a consolidated basis, including the operations of its predecessor entities prior to the Merger (as defined below). EVERTEC Inc.’s subsidiaries include Holdings, EVERTEC Group, EVERTEC Dominicana, SAS, EVERTEC Panamá, S.A., EVERTEC Costa Rica, S.A. (“EVERTEC CR”), EVERTEC Guatemala, S.A. and EVERTEC México Servicios de Procesamiento, S.A. de C.V. Neither EVERTEC nor Holdings conducts any operations other than with respect to its indirect or direct ownership of EVERTEC Group.
Company Overview
EVERTEC is the leading full-service transaction processing business in Latin America, providing a broad range of merchant acquiring, payment processing and business process management services. According to the July 2014 Nilson Report, we are the largest merchant acquirer in the Caribbean and Central America and one of the largest in Latin America, based on total number of transactions. We serve 19 countries in the region from our base in Puerto Rico. We manage a system of electronic payment networks that process more than two billion transactions annually, and offer a comprehensive suite of services for core bank processing, cash processing and technology outsourcing. In addition, we own and operate the ATH network, one of the leading personal identification number (“PIN”) debit networks in Latin America. We serve a diversified customer base of leading financial institutions, merchants, corporations and government agencies with “mission-critical” technology solutions that enable them to issue, process and accept transactions securely. We believe our business is well-positioned to continue to expand across the fast-growing Latin American region.
We are differentiated, in part, by our diversified business model, which enables us to provide our varied customer base with a broad range of transaction-processing services from a single source across numerous channels and geographic markets. We believe this single-source capability provides several competitive advantages that will enable us to continue to penetrate our existing customer base with complementary new services, win new customers, develop new sales channels and enter new markets. We believe these competitive advantages include:
| • | Our ability to provide best in class individual products across all verticals; |
| • | Our ability to provide in one package a range of services that traditionally had to be sourced from different vendors; |
| • | Our ability to serve customers with disparate operations in several geographies with a single integrated technology solution that enables them to manage their business as one enterprise; and |
| • | Our ability to capture and analyze data across the transaction processing value chain and use that data to provide value-added services that are differentiated from those offered by pure-play vendors that serve only one portion of the transaction processing value chain (such as only merchant acquiring or payment processing). |
Our broad suite of services spans the entire transaction processing value chain and includes a range of front-end customer-facing solutions such as the electronic capture and authorization of transactions at the point-of-sale, as well as back-end support services such as the clearing and settlement of transactions and account reconciliation for card issuers. These include: (i) merchant acquiring services, which enable point of sales (“POS”) and e-commerce merchants to accept and process electronic methods of payment such as debit, credit, prepaid and electronic benefit transfer (“EBT”) cards; (ii) payment processing services, which enable financial institutions
3
Table of Contents
Index to Financial Statements
and other issuers to manage, support and facilitate the processing for credit, debit, prepaid, automated teller machines (“ATM”) and EBT card programs; and (iii) business process management solutions, which provide “mission-critical” technology solutions such as core bank processing, as well as IT outsourcing and cash management services to financial institutions, corporations and governments. We provide these services through a highly scalable, end-to-end technology platform that we manage and operate in-house and that generates significant operating efficiencies that enable us to maximize profitability.
We sell and distribute our services mainly through a proprietary direct sales force with strong customer relationships. We are also building a variety of indirect sales channels that enable us to leverage the distribution capabilities of partners in adjacent markets, including value-added resellers. Also, we continue to pursue joint ventures and merchant acquiring alliances.
We benefit from an attractive business model, the hallmarks of which are recurring revenue, scalability, significant operating margins and low capital expenditure requirements. Our revenue is recurring in nature because of the “mission-critical” and embedded nature of the services we provide, the high switching costs associated with these services and the multi-year contracts we negotiate with our customers. Our business model enables us to continue to grow our business organically without significant additional capital expenditures.
We generate revenues based primarily on transaction or discount fees paid by our merchants and financial institutions in our merchant acquiring and payment processing segments and on transaction fees or fees based on number of accounts on file in our business solutions segment. Our total revenues increased from $276.3 million for the year ended December 31, 2009 to $361.1 million for the year ended December 31, 2014, representing a compound annual growth rate (“CAGR”) of 5%. Our Adjusted EBITDA (as defined in “Item 7. Management’s Discussion and Analysis of Financial Condition and Results of Operations—Net Income Reconciliation to EBITDA, Adjusted EBITDA, Adjusted Net Income and Adjusted Net Income per common share”) increased from $117.6 million for the year ended December 31, 2009 to $182.8 million for the year ended December 31, 2014, representing a CAGR of 9%. Our Adjusted Net Income (as defined in “Item 7. Management’s Discussion and Analysis of Financial Condition and Results of Operations—Net Income Reconciliation to EBITDA, Adjusted EBITDA, Adjusted Net Income and Adjusted Net Income per common share”) increased from $58.2 million for the year ended December 31, 2009 to $130.0 million for the year ended December 31, 2014, representing a CAGR of 17%.
Corporate Background
EVERTEC, Inc. (formerly known as Carib Latam Holdings, Inc.) is a Puerto Rico corporation organized in April 2012. Our main operating subsidiary, EVERTEC Group, LLC (formerly known as EVERTEC, LLC and EVERTEC, Inc., hereinafter “EVERTEC Group”), was organized in Puerto Rico in 1988. EVERTEC Group was formerly a wholly-owned subsidiary of Popular. On September 30, 2010, pursuant to an Agreement and Plan of Merger (as amended, the “Merger Agreement”), AP Carib Holdings, Ltd. (“Apollo”) acquired a 51% indirect ownership interest in EVERTEC Group as part of a merger (the “Merger”) and EVERTEC Group became a wholly-owned subsidiary of Holdings.
On April 17, 2012, EVERTEC Group was converted from a Puerto Rico corporation to a Puerto Rico limited liability company (the “Conversion”) for the purpose of improving its consolidated tax efficiency by taking advantage of changes to the Puerto Rico Internal Revenue Code, as amended (the “PR Code”), that permit limited liability companies to be treated as partnerships that are pass-through entities for Puerto Rico tax purposes. Concurrent with the Conversion, Holdings, which is our direct subsidiary, was also converted from a Puerto Rico corporation to a Puerto Rico limited liability company. Prior to these conversions, EVERTEC, Inc. was formed in order to act as the new parent company of Holdings and its subsidiaries, including EVERTEC Group. The transactions described above in this paragraph are collectively referred to as the “Reorganization.”
4
Table of Contents
Index to Financial Statements
History and Separation from Popular
We have a 25 year operating history in the transaction processing industry. Prior to the Merger, EVERTEC Group was 100% owned by Popular, the largest financial institution in the Caribbean, and operated substantially as an independent entity within Popular. As mentioned above, following the Merger, Apollo which is an affiliate of the leading private equity investor Apollo Global Management, LLC, owned a 51% interest in us and shortly thereafter, we began the transition to a separate, stand-alone entity. As a stand-alone company, we have made substantial investments in our technology and infrastructure, recruited various senior executives with significant transaction processing experience in Latin America, enhanced our profitability through targeted productivity and cost savings actions and broadened our footprint beyond the markets historically served.
We continue to benefit from our relationship with Popular. Popular is our largest customer, acts as one of our largest merchant referral partners and sponsors us with the card associations (such as Visa or MasterCard), enabling merchants to accept these card associations’ credit card transactions. Popular also provides merchant sponsorship as one of the participants of the ATH network, enabling merchants to connect to the ATH network and accept ATH debit card transactions. We provide a number of critical products and services to Popular, which are governed by a 15-year Amended and Restated Master Services Agreement (the “Master Services Agreement”) that runs through 2025.
Initial Public Offering and Secondary Offerings
On April 17, 2013, we completed our initial public offering of 28,789,943 shares of common stock at a price to the public of $20.00 per share. EVERTEC offered a total of 6,250,000 shares and selling stockholders offered a total of 22,539,943 shares, of which 13,739,284 shares were sold by Apollo, and 8,800,659 shares were sold by Popular. We used the net proceeds of approximately $117.4 million, after deducting underwriting discounts and commissions, from our sale of shares in the initial public offering and proceeds from borrowings under the 2013 Credit Agreement (as defined below), together with available cash on hand, to redeem our 11.0% senior notes due 2018 (the “senior notes”) and to refinance our previous senior secured credit facilities.
On September 18, 2013, we completed a public offering of 23,000,000 shares of our common stock by Apollo, Popular, and current and former employees at a price to the public of $22.50 per share. We did not receive any proceeds from this offering. After the completion of the offering, Apollo owned approximately 9.2 million shares, or 11.2%, of our common stock, and Popular owned approximately 17.5 million shares or 21.3% of our common stock.
On December 13, 2013, we completed a public offering of 15,233,273 shares of our common stock by Apollo, Popular, and current and former employees at a price to the public of $20.60 per share. We did not receive any proceeds from this offering. After the completion of the offering, Popular owns approximately 11.7 million shares, or 14.9% of our common stock, and Apollo no longer owns any shares of our common stock.
Principal Stockholder
Popular, Inc. (NASDAQ: BPOP), whose principal banking subsidiary’s history dates back to 1893, is the No. 1 bank holding company by both assets and deposits based in Puerto Rico, and, as of September 30, 2014, ranks 49 by assets among U.S. bank holding companies. As of December 31, 2014, Popular owned approximately 15% of our common stock.
5
Table of Contents
Index to Financial Statements
Industry Trends
Shift to Electronic Payments
The ongoing migration from cash, check and other paper methods of payment to electronic payments continues to benefit the transaction processing industry globally. This migration is driven by factors including customer convenience, marketing efforts by financial institutions, card issuer rewards and the development of new forms of payment. We believe that the penetration of electronic payments in the markets where we principally operate is significantly lower relative to more mature U.S. and European markets and that this ongoing shift will continue to generate substantial growth opportunities for our business.
Fast Growing Latin American and Caribbean Financial Services and Payments Markets
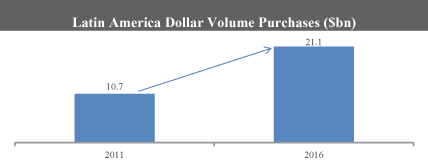
Currently, the adoption of banking products, including electronic payments, in the Latin American and Caribbean region is lower relative to the mature U.S. and European markets. As these markets continue to evolve and grow, the emergence of a larger and more sophisticated consumer base will influence and drive an increase in card (like debit, credit, prepayment, and EBT) and electronic payments usage. According to the January 2013 Nilson Report, Latin American purchase transactions are projected to continue to grow at a CAGR of 15% through 2016 (as illustrated in the chart below), which represents the third fastest growing market in the world.
We believe that the attractive characteristics of our markets and our leadership positions across multiple services and sectors will continue to drive growth and profitability in our businesses.
Ongoing Technology Outsourcing Trends
Financial institutions globally are facing significant challenges including the entrance of non-traditional competitors, the compression of margins on traditional products, significant channel proliferation and increasing regulation that could potentially curb profitability. Many of these institutions have traditionally fulfilled their IT needs through legacy computer systems, operated by the institution itself. Legacy systems are generally highly proprietary, inflexible and costly to operate and maintain and we believe the trend to outsource in-house technology systems and processes by financial institutions will continue. According to the Gartner Report, the banking and securities sector in Latin America is forecasted to have $33 billion of annual IT expenditures by 2017. We believe our ability to provide integrated, open, flexible, customer-centric and efficient IT products and services cater to the evolving needs of our customers, particularly for small- and mid-sized financial institutions in the Latin American markets in which we operate.
Industry Innovation
The electronic payments industry experiences ongoing technology innovation. Emerging payment technologies such as prepaid cards, contactless payments, payroll cards, mobile commerce, online “wallets” and innovative POS devices facilitate the continued shift away from cash, check and other paper methods of payment.
6
Table of Contents
Index to Financial Statements
According to the 2014 World Payments Report, mobile payments transactions are expected to grow by 60.8% annually through to 2015. E-payments growth will decelerate to 15.9% growth during the same period. The increasing demand for new and flexible payment options catering to a wider range of consumer segments is driving growth in the electronic payment processing sector.
Our Competitive Strengths
Market Leadership in Latin America and the Caribbean
We believe we have an inherent competitive advantage relative to U.S. competitors based on our ability to locally leverage our infrastructure, as well as our first-hand knowledge of the Latin American and Caribbean markets, language and culture. We have built leadership positions across the transaction processing value chain in the geographic markets that we serve, which we believe will enable us to continue to penetrate our core markets and provide advantages to enter new markets. According to the July 2014 Nilson Report, we are one of the largest merchant acquirers in Latin America and the largest in the Caribbean and Central America based on total number of transactions. We own and operate the ATH network, one of the leading ATM and PIN debit networks in Latin America. The ATH network and processing businesses processed over two billion transactions in 2014, which according to management estimates, makes ATH branded products the most frequently used electronic method of payment in Puerto Rico, exceeding the total transaction volume of Visa, MasterCard, American Express and Discover, combined. Given our scale and customer base of top tier financial institutions and government entities, we believe we are the leading card issuer and core bank processor in the Caribbean and the only non-bank provider of cash processing services to the U.S. Federal Reserve in the Caribbean. We believe our competitive position and strong brand recognition increases card acceptance, driving usage of our proprietary network, and presents opportunities for future strategic relationships.
Diversified Business Model Across the Transaction Processing Value Chain
Our leadership position in the region is driven in part by our diversified business model which provides the full range of merchant acquiring, payment processing and business solutions services to financial institutions, merchants, corporations and government agencies across different geographies. We offer end-to-end technology solutions through a single provider and we have the ability to tailor and customize the features and functionality of all our products and services to the specific requirements of our customers in various industries and across geographic markets. We believe the breadth of our offerings enables us to penetrate our customer base from a variety of perspectives and positions us favorably to cross-sell our other offerings over time. For example, we may host a client’s electronic cash register software (part of the business solutions segment), acquire transactions that originate at that electronic cash register (part of the merchant acquiring segment), route the transaction through the ATH network (part of the payment processing segment), and finally settle the transaction between the client and the issuer bank (part of the payment processing segment). In addition, we can serve customers with disparate operations in several geographies with a single integrated technology solution that enables them to access one processing platform and manage their business as one enterprise. We believe these services are becoming increasingly complementary and integrated as our customers seek to capture, analyze and monetize the vast amounts of data that they process across their enterprises. As a result, we are able to capture significant value across the transaction processing value chain and believe that this combination of attributes represents a differentiated value proposition vis-à-vis our competitors who have a limited product and service offering.
Broad and Deep Customer Relationships and Recurring Revenue Business Model
We have built a strong and long-standing portfolio of top tier financial institution, merchant, corporate and government customers across Latin America and the Caribbean, which provides us with a reliable, recurring revenue base and powerful references that have helped us expand into new channels and geographic markets. Customers representing approximately 99% of our 2013 revenue continued to be customers in 2014, due to the “mission-critical” and embedded nature of the services provided and the high switching costs associated with
7
Table of Contents
Index to Financial Statements
these services. Our Payment Processing and Merchant Acquiring segments, as well as certain business lines representing the majority of our business solutions segment, generate recurring revenues that collectively accounted for approximately 89% of our total revenues in 2014. We receive recurring revenues from services based on our customers’ on-going daily commercial activity such as processing loans, hosting accounts and information on our servers, and processing everyday payments at grocery stores, gas stations and similar establishments. We generally provide these services under one to five year contracts, often with automatic renewals. We also provide a few project-based services that generate non-recurring revenues in our business solutions segment such as IT consulting for a specific project or integration. Additionally, we entered into a 15-year Master Services Agreement with Popular on September 30, 2010. We provide a number of critical payment processing and business solutions products and services to Popular and benefit from the bank’s distribution network and continued support. Through our long-standing and diverse customer relationships, we are able to gain valuable insight into trends in the marketplace that allows us to identify new market opportunities. In addition, we believe the recurring nature of our business model provides us with significant revenue and earnings stability.
Highly Scalable, End-to-End Technology Platform
Our diversified business model is supported by our highly scalable, end-to-end technology platform which allows us to provide a full range of transaction processing services and develop and deploy a broad suite of technology solutions to our customers at low incremental costs and increasing operating efficiencies. We have spent over $140 million over the last five years on technology investments to continue to build the capacity and functionality of our platform and we have been able to achieve attractive economies of scale with flexible product development capabilities. We have a proven ability to seamlessly leverage our existing platforms to develop new products and services and expand in new markets. We believe that our platform will increasingly allow us to provide differentiated services to our customers and facilitate further expansion into new sales channels and geographic markets.
Experienced Management Team with a Strong Track Record of Execution
We have grown our revenue organically by introducing new products and services and expanding our geographic footprint throughout Latin America. We have a proven track record of creating value from operational and technology improvements and capitalizing on cross-selling opportunities. We have combined new leadership at EVERTEC, bringing many years of industry experience, with long-standing leadership at the operating business level. In April 2015, Morgan M. Schuessler, Jr., former President of International for Global Payments, Inc., will join our management team as President and Chief Executive Officer. In 2013, Eduardo Camargo, former Chief Information Officer and Chief Technology Officer for Bank of America Merrill Lynch Brazil, joined our management team as Chief Information Officer. In 2012, Philip Steurer, former Senior Vice President of Latin America for First Data Corporation, joined our management team as our Chief Operating Officer. Mr. Schuessler and Mr. Steurer both have extensive experience managing and growing transaction processing businesses in Latin America as well as North America, Asia and Europe. In addition, we successfully executed our separation from Popular, transitioning EVERTEC from a division of a larger company to a stand-alone entity with public company best practices. Instrumental to this transition was our Chief Financial Officer Juan J. Román, former CFO of Triple-S Management, a publicly listed insurance company. Collectively our management team benefits from an average of over 20 years of industry experience and we believe they are well positioned to continue to drive growth across business lines and regions.
8
Table of Contents
Index to Financial Statements
Our Growth Strategy
We intend to grow our business by continuing to execute on the following business strategies:
Continue Cross-Sales to Existing Customers
We seek to grow revenue by continuing to sell additional products and services to our existing merchant, financial institution, corporate and government customers. We intend to broaden and deepen our customer relationships by leveraging our full suite of end-to-end technology solutions. For example, we believe that there is significant opportunity to cross-sell our network services, ATM point-of-sale processing and card issuer processing services to our over 180 existing financial institution customers, particularly in markets outside of Puerto Rico. We will also seek to continue to cross-sell value added services into our existing merchant base of over 27,500 locations.
Leverage Our Franchise to Attract New Customers in the Markets We Currently Serve
We intend to attract new customers by leveraging our comprehensive product and services offering, the strength of our brand and our leading end-to-end technology platform. Furthermore, we believe we are uniquely positioned to develop new products and services to take advantage of our access to and position in markets we currently serve. For example, in markets we serve outside of Puerto Rico, we believe there is a significant opportunity to penetrate small to medium financial institutions with our products and services, as well as to penetrate governments with offerings such as EBT.
Expand in the Latin American Region
We believe there is substantial opportunity to expand our businesses in the Latin American region. We believe that we have a competitive advantage relative to U.S. competitors based on our ability to locally leverage our infrastructure, breadth of products and services as well as our first-hand knowledge of Latin American markets, language and culture. Significant growth opportunities exist in a number of large markets such as Colombia, México, and Chile, among others. We also believe that there is an opportunity to provide our services to existing financial institution customers in other regions where they operate. Additionally, we continually evaluate our strategic plans for geographic expansion, which can be achieved through joint ventures, partnerships, alliances or strategic acquisitions.
Develop New Products and Services
Our experience with our customers provides us with insight into their needs and enables us to continuously develop new transaction processing services. We plan to continue growing our merchant, financial institution, corporate and government customer base by developing and offering additional value-added products and services to cross-sell along with our core offerings. We intend to continue to focus on these and other new product opportunities in order to take advantage of our leadership position in the transaction processing industry in the Latin American and Caribbean region.
Our Business
We offer our customers end-to-end products and solutions across the transaction processing value chain from a single source across numerous channels and geographic markets, as further described below.
Merchant Acquiring
According to the July 2014 Nilson Report, we are the largest merchant acquirer in the Caribbean and Central America and one of the largest in Latin America based on total number of transactions. Our merchant acquiring business provides services to merchants at over 27,500 locations that allow them to accept electronic methods of
9
Table of Contents
Index to Financial Statements
payment such as debit, credit, prepaid and EBT cards carrying the ATH, Visa, MasterCard, Discover and American Express brands. Our full suite of merchant acquiring services includes, but is not limited to, the underwriting of each merchant’s contract, the deployment and rental of POS devices and other equipment necessary to capture merchant transactions, the processing of transactions at the point-of-sale, the settlement of funds with the participating financial institution, detailed sales reports and customer support. In 2014, our merchant acquiring business processed over 320 million transactions.
Our Merchant Acquiring business generated $79.1 million, or 21.9%, of total revenues and $34.3 million, or 24.2%, of total segment income from operations for the year ended December 31, 2014.
Payment Processing
We are the largest card processor and network services provider in the Caribbean. We provide an innovative and diversified suite of payment processing products and services to blue chip regional and global corporate customers, government agencies, and financial institutions across Latin American and the Caribbean. These services provide the infrastructure technology necessary to facilitate the processing and routing of payments across the transaction processing value chain.
At the point-of-sale, we sell transaction processing technology solutions, similar to the services in our merchant acquiring business, to other merchant acquirers to enable them to service their own merchant customers. We also offer terminal driving solutions to merchants, merchant acquirers (including our merchant acquiring business) and financial institutions, which provide the technology to securely operate, manage and monitor POS terminals and ATMs. We also rent POS devices to financial institution customers who seek to deploy them across their own businesses.
To connect the POS terminals to card issuers, we own and operate the ATH network, one of the leading ATM and PIN debit networks in Latin America. The ATH network connects the merchant or merchant acquirer to the card issuer and enables transactions to be routed or “switched” across the transaction processing value chain. The ATH network offers the technology, communications standards, rules and procedures, security and encryption, funds settlement and common branding that allow consumers, merchants, merchant acquirers, ATMs, card issuer processors and card issuers to conduct commerce seamlessly, across a variety of channels, similar to the services provided by Visa and MasterCard. The ATH network and processing businesses processed over two billion transactions in 2014. Management believes that over 70% of all ATM transactions and over 80% of all debit transactions in Puerto Rico are processed through the ATH network.
To enable financial institutions, governments and other businesses to issue and operate a range of payment products and services, we offer an array of card processing and other payment technology services, such as internet and mobile banking software services, bill payment systems and EBT solutions. Financial institutions and certain retailers outsource to us certain card processing services such as card issuance, processing card applications, cardholder account maintenance, transaction authorization and posting, fraud and risk management services, and settlement. Our payment products include electronic check processing, automated clearing house (“ACH”), lockbox, online, interactive voice response and web-based payments through personalized websites, among others.
We have been the only provider of EBT services to the Puerto Rican government since 1998. Our EBT application allows certain agencies to deliver government benefits to participants through a magnetic card system and serves over 775,000 active participants.
Our Payment Processing business accounted for $105.4 million, or 29.2%, of total revenues and $66 million, or 42.0%, of total segment income from operations for the year ended December 31, 2014.
10
Table of Contents
Index to Financial Statements
Business Solutions
We provide our financial institution, corporate and government customers with a full suite of business process management solutions including specifically core bank processing, network hosting and management, IT consulting services, business process outsourcing, item and cash processing, and fulfillment. In addition, we believe we are the only non-bank provider of cash processing services to the U.S. Federal Reserve in the Caribbean.
Our Business Solutions business accounted for $176.6 million, or 48.9%, of total revenues and $47.6 million, or 33.9%, of total segment income from operations for the year ended December 31, 2014.
For additional information regarding the Company’s segments refer to Note 21 of the Notes to Audited Consolidated Financial Statements included elsewhere in this Annual Report on Form 10-K.
Competition
Competitive factors impacting the success of our services include the quality of the technology-based application or service, application features and functions, ease of delivery and integration, ability of the provider to maintain, enhance, and support the applications or services, and price. We believe that we compete favorably in each of these categories. In addition, we believe that our relationship with Banco Popular, large market share and financial institution industry expertise, combined with our ability to offer multiple applications, services and integrated solutions to individual customers, enhances our competitiveness against companies with more limited offerings.
In merchant acquiring, we compete with several other service providers and financial institutions, including Vantiv, Inc., First Data Corporation, Global Payments Inc., Elavon, Inc., Sage Payment Solutions and some local banks. Also, the card associations and payment networks are increasingly offering products and services that compete with ours. The main competitive factors are price, brand awareness, strength of the relationship with financial institutions, system functionality, service capabilities and innovation. Our business is also impacted by the expansion of new payments methods and devices, card association business model expansion, and bank consolidation.
In payment processing, we compete with several other third party card processors and debit networks, including First Data Corporation, Fidelity National Information Services, Inc., Fiserv, Inc., Total System Services, Inc., Vantiv, Inc. and Global Payments Inc. Also, card associations and payment networks are increasingly offering products and services that compete with our products and services. The main competitive factors are price, system performance and reliability, system functionality, security, service capabilities and disaster recovery and business continuity capabilities.
In business solutions, our main competition includes internal technology departments within financial institutions, retailers, data processing or software development departments of large companies and/or large technology and consulting companies. Main competitive factors are price, system performance and reliability, system functionality, security, service capabilities, and disaster recovery and business continuity capabilities.
Intellectual Property
We own numerous registrations for several trademarks in different jurisdictions and own or have licenses to use certain software and technology, which are critical to our business and future success. For example, we own the ATH and EVERTEC trademarks, which are associated by the public, financial institutions and merchants with high quality and reliable electronic commerce, payments, and debit network solutions and services. Such goodwill allows us to be competitive, retain our customers, and expand our business. Further, we also use a combination of (i) proprietary software, and (ii) duly licensed third party software to operate our business and
11
Table of Contents
Index to Financial Statements
deliver secure and reliable products and services to our customers. The licensed software is subject to terms and conditions that we considered within the industry standards. Most are perpetual licenses and the rest are term licenses with renewable terms. In addition, we monitor these license agreements and maintain close contact with our suppliers to ensure their continuity of service.
We seek to protect our intellectual property rights by securing appropriate statutory intellectual property protection in the relevant jurisdictions, including patents. We also protect proprietary know-how and trade secrets through company confidentiality policies, licenses, programs, and contractual agreements.
Employees
As of December 31, 2014, we employed 1,700 persons across 6 countries in Latin America and the Caribbean. None of our employees are subject to collective bargaining agreements, and we consider our relationships with our employees to be good. We have not experienced any work stoppages.
Government Regulation and Payment Network Rules
Oversight by the Federal Reserve
Popular is a bank holding company that has elected to be treated as a financial holding company under the provisions of the Gramm-Leach-Bliley Act of 1999. So long as we are deemed to be a “subsidiary” of Popular for purposes of the BHC Act, we will be subject to regulation and oversight by the Board of Governors of the Federal Reserve System (the “Federal Reserve Board”) and our activities will be subject to several related significant restrictions, the more significant of which are discussed below.
Transactions with Affiliates
So long as we are deemed to be an affiliate of Popular for purpose of the affiliate transaction rules found in Section 23A and 23B of the Federal Reserve Act and Regulation W of the Federal Reserve Board, we will be subject to various restrictions on our ability to borrow from, and engage in certain other transactions with Popular’s bank subsidiaries, Banco Popular and Banco Popular North America (“BPNA”). In general these rules require that any “covered transaction” that we enter into with Banco Popular or BPNA (or any of their respective operating subsidiaries), as the case may be, must be secured by designated amounts of specified collateral and must be limited to 10% of Banco Popular’s or BPNA’s, as the case may be, capital stock and surplus. In addition, all “covered transactions” between Banco Popular or BPNA, on the one hand, and Popular and all of its subsidiaries and affiliates on the other hand, must be limited to 20% of Banco Popular’s or BPNA’s, as the case may be, capital stock and surplus. “Covered transactions” are defined by statute to include a loan or extension of credit, as well as a purchase of securities issued by an affiliate, a purchase of assets (unless otherwise exempted by the Federal Reserve Board) from the affiliate, the acceptance of securities issued by the affiliate as collateral for a loan, and the issuance of a guarantee, acceptance or letter of credit on behalf of an affiliate.
In addition, Section 23B and Regulation W require that as long as we are deemed an affiliate of Banco Popular or BPNA, all transactions between us and either Banco Popular or BPNA be on terms and conditions, including credit standards, that are substantially the same or at least as favorable to Banco Popular or BPNA, as the case may be, as those prevailing at the time for comparable transactions involving other non-affiliated companies or, in the absence of comparable transactions, on terms and conditions, including credit standards, that in good faith would be offered by Banco Popular or BPNA to, or would apply to, non-affiliated companies.
Permissible Activities
As long as we are deemed to be controlled by Popular for bank regulatory purposes, we may conduct only those activities that are authorized for a bank holding company or a financial holding company under the BHC Act, the Federal Reserve Board’s Regulation K and other relevant U.S. federal banking laws. These activities generally
12
Table of Contents
Index to Financial Statements
include activities that are related to banking, financial in nature or incidental to financial activities. In addition, restrictions placed on Popular as a result of supervisory or enforcement actions may restrict us or our activities in certain circumstances, even if these actions are unrelated to our conduct or business. For so long as we are deemed to be a foreign subsidiary of a bank holding company under the Federal Reserve Board’s regulations, we will rely on the authority granted under the Federal Reserve Board’s Regulation K to conduct our data processing, management consulting and related activities outside the United States. The Federal Reserve Board’s Regulation K generally limits activities of a bank holding company outside the Unites States that are not banking or financial in nature, specifically permitted under Regulation K to foreign subsidiaries or necessary to carry on such activities that are not otherwise permissible for a foreign subsidiary under the banking regulations. We continue to engage in certain activities outside the scope of such permissible activities pursuant to authority under the Federal Reserve Board’s Regulation K, which allows a bank holding company to retain, in the context of an acquisition of a going concern, such otherwise impermissible activities if they account for not more than 5% of either the consolidated assets or consolidated revenues of the acquired organization.
New lines of business, other new activities, divestitures or acquisitions that we may wish to commence in the future may not be permissible for us under the BHC Act, Regulation K or other relevant U.S. federal banking laws. Further, as a result of being subject to regulation and supervision by the Federal Reserve Board, we may be required to obtain the approval of the Federal Reserve Board before engaging in certain new activities or businesses, whether organically or by acquisition, unless such activities are considered financial in nature. More generally, the Federal Reserve Board has broad power to approve, deny or refuse to act upon applications or notices for us to conduct new activities, acquire or divest businesses or assets, or reconfigure existing operations.
Examinations
As a technology service provider to financial institutions, we are also subject to regulatory oversight and examination by the Federal Financial Institutions Examination Council (the “FFIEC”), an interagency body of federal financial regulators that includes the Federal Reserve Board. The office of the Commissioner of Financial Institutions of Puerto Rico also participates in such examinations by the FFIEC. In addition, independent auditors annually review several of our operations to provide reports on internal controls for our clients’ auditors and regulators.
Regulatory Reform and Other Legislative Initiatives
The payment card industry has come under increased scrutiny from lawmakers and regulators. In July 2010, the Dodd-Frank Act was signed into law in the United States. The Dodd-Frank Act sets forth significant structural and other changes to the regulation of the financial services industry and establishes a new agency, the Consumer Financial Protection Bureau, to regulate consumer financial products and services (including many offered by us and by our customers). In addition, Section 1075 of the Dodd-Frank Act (commonly referred to as the “Durbin Amendment”) imposes new restrictions on card networks and debit card issuers. More specifically, the Durbin Amendment provides that interchange transaction fees that a card issuer may receive or charge for an electronic debit transaction must be “reasonable and proportional” to the cost incurred by the card issuer in processing the transaction.
The Federal Reserve Board adopted the final regulations on June 29, 2011 and added a fraud-prevention adjustment on July 27, 2012. The regulations (a) set a cap on debit transaction interchange fees to $.21 +(5 bps times the value of the transactions) + $.01 (as a fraud adjustment for issuers that have in place policies and measures to address fraud); (b) require that issuers must enable at least two unaffiliated payment card networks on their debit cards without regard to authentication method; and (c) prohibit card issuers and payment card networks from entering into exclusivity arrangements for debit card processing and restrict card issuers and payment networks from inhibiting the ability of merchants to direct the routing of debit card transactions over
13
Table of Contents
Index to Financial Statements
networks of their choice. The Dodd-Frank Act also allows merchants to set minimum dollar amounts (currently, not to exceed $10) for the use of a credit card and provide discounts to consumers who pay with various payment methods, such as cash (which two practices previously violated applicable payment card network rules).
To date, the Durbin Amendment has had mixed implications for our business, but the overall net impact has been positive due to lower interchange costs improving the overall margins of the business. However, we cannot be certain that this trend will continue, and we believe that any future impact (positive or negative) resulting from the Durbin Amendment is uncertain due to the competitive landscape in which we operate. In addition to the Dodd-Frank Act, from time to time, various legislative and regulatory initiatives are introduced in Congress and state legislatures, as well as by regulatory agencies. Such initiatives may include proposals to diminish the powers of bank holding companies and their affiliates. Such legislation could change banking statutes and our operating environment in substantial and unpredictable ways. If enacted, such legislation could increase the cost of doing business or limit permissible activities. We cannot predict whether any such legislation will be enacted, and, if enacted, the effect that it, or any implementing regulations, would have on our financial condition or results of operations.
Other Government Regulations
In addition to oversight by the Federal Reserve Board, our services are subject to a broad range of complex federal, state, Puerto Rico and foreign regulation, including privacy laws, international trade regulations, the Bank Secrecy Act, anti-money laundering laws, the U.S. Internal Revenue Code, the PR Code, the Employee Retirement Income Security Act, the Health Insurance Portability and Accountability Act and other Puerto Rico laws and regulations. Failure of our services to comply with applicable laws and regulations could result in restrictions on our ability to provide such services, as well as the imposition of civil fines and/or criminal penalties. The principal areas of regulation (in addition to oversight by the Federal Reserve Board) that impact our business are described below.
Privacy
We and our financial institution clients are required to comply with various U.S. state, federal and foreign privacy laws and regulations, including those imposed under the Gramm-Leach-Bliley Act and the Health Insurance Portability and Accountability Act. These regulations place restrictions on the use of certain personal information. All financial institutions must disclose detailed privacy policies to their customers and offer them the opportunity to direct the financial institution not to share information with third parties. The regulations, however, permit financial institutions to share information with non-affiliated parties who perform services for the financial institutions. These laws also impose requirements for safeguarding personal information through the issuance of data security standards or guidelines. Certain state laws impose similar privacy obligations, as well as, in certain circumstances, obligations to provide notification to affected individuals, states officers and consumer reporting agencies, as well as businesses and governmental agencies that own data, of security breaches of computer databases that contain personal information. In addition, U.S. state and federal government agencies have been contemplating or developing new initiatives to safeguard privacy and enhance data security. Some foreign privacy laws are stricter than those applicable under U.S. federal, state or Puerto Rican law. As a provider of services to financial institutions, we are required to comply with the privacy regulations and are bound by the same limitations on disclosure of the information received from our customers as apply to the financial institutions themselves. See “Item 1A. Risk Factors—Risks Related to Our Business—Security breaches or our own failure to comply with privacy regulations and industry security requirements imposed on providers of services to financial institutions and card processing services could harm our business by disrupting our delivery of services and damaging our reputation.”
14
Table of Contents
Index to Financial Statements
Anti-Money Laundering and Office of Foreign Assets Control Regulation
Since we provide data processing services to both foreign and domestic financial institutions, we are required to comply with certain anti-money laundering and terrorist financing laws and economic sanctions imposed on designated foreign countries, nationals and others. Specifically, we must adhere to the requirements of the Bank Secrecy Act regarding processing and facilitation of financial transactions. Furthermore, as a data processing company that provides services to foreign parties and facilitates financial transactions between foreign parties, we are obligated to screen transactions for compliance with the sanctions programs administered by the U.S. Department of the Treasury’s Office of Foreign Assets Control (“OFAC”). These regulations prohibit us from entering into or facilitating a transaction that involves persons, governments, or countries designated by the U.S. Government under one or more sanctions regimes.
A major focus of governmental policy in recent years has been aimed at combating money laundering and terrorist financing. Preventing and detecting money laundering, and other related suspicious activities at their earliest stages warrants careful monitoring. The Bank Secrecy Act, along with a number of other anti-money laundering laws, imposes various reporting and record-keeping requirements concerning currency and other types of monetary instruments. Actions, such as structuring transactions to avoid Bank Secrecy Act and anti-money laundering law reporting requirements, failing to prepare or file required reports, preparing inaccurate reports, money laundering, attempted money laundering, and advising customers in any of these activities are violations or potential violations of law. These laws and regulations impose obligations to maintain appropriate policies, procedures and controls to detect, prevent and report money laundering and terrorist financing and to verify the identity of their customers. Failure to maintain and implement adequate programs to combat money laundering and terrorist financing, or to comply with all of the relevant laws or regulations, could have serious legal and reputational consequences for us.
The United States has imposed economic sanctions that affect transactions with designated foreign countries, nationals and others. The OFAC-administered sanctions targeting countries take many different forms. Generally, however, they contain one or more of the following elements: (1) restrictions on trade with or investment in a sanctioned country, including prohibitions against direct or indirect imports of goods or services from and exports to a sanctioned country and prohibitions on “U.S. persons” engaging in financial transactions relating to making investments in, or providing investment-related advice or assistance to, a sanctioned country; and (2) a blocking of assets in which the government or specially designated nationals of the sanctioned country have an interest, by prohibiting transfers of property subject to U.S. jurisdiction (including property in the possession or control of U.S. persons). Blocked assets (e.g., property and bank deposits) cannot be paid out, withdrawn, set off or transferred in any manner without a license from OFAC. Failure to comply with these sanctions could have serious legal and reputational consequences.
Foreign Corrupt Practices Act (“FCPA”) and Other
As a data processing company that services both foreign and domestic clients, our business activities in foreign countries, and in particular our transactions with foreign governmental entities, subject us to the anti-bribery provisions of the FCPA, as well as the laws and regulations of the foreign jurisdiction where we operate. Pursuant to applicable anti-bribery laws, our transactions with foreign government officials and political candidates are subject to certain limitations. Finally, in the course of business with foreign clients and subsidiaries, we export certain software and hardware that is regulated by the Export Administration Regulations from the United States to the foreign parties. Together, these regulations place restrictions on who we can transact with, what transactions may be facilitated, how we may operate in foreign jurisdictions, and what we may export to foreign countries.
15
Table of Contents
Index to Financial Statements
Association and Network Rules
Several of our subsidiaries are registered with or certified by card associations and payment networks, including the ATH network, MasterCard, Visa, American Express, Discover and numerous debit and EBT networks as members or as service providers for member institutions in connection with the services we provide to our customers. As such, we are subject to applicable card association and network rules, which could subject us to a variety of fines or penalties that may be levied by the card associations or networks for certain acts and/or omissions by us, our acquirer customers, processing customers and/or merchants. For example, “EMV” is a credit and debit card authentication methodology that the card associations are mandating to processors, issuers and acquirers in the payment industry. Compliance deadlines for EMV mandates vary by country and by payment network. We have invested significant resources and man-hours to develop and implement this methodology in all our payment related platforms. However, we are not certain if or when our financial institution customers will use or accept the methodology and the time it will take for this technology to be rolled-out to all customer ATM and POS devices connected to our platforms or adopted by our card issuing clients. Non-compliance with EMV mandates could result in lost business or financial losses from fraud or fines from network operators. We are also subject to network operating rules promulgated by the National Automated Clearing House Association relating to payment transactions processed by us using the Automated Clearing House Network and to various government laws regarding such operations, including laws pertaining to EBT.
Geographic Concentration
Our revenue composition by geographical area is based in Latin America and Caribbean. Latin America includes, among others, Costa Rica, México, Guatemala and Panamá. The Caribbean includes Puerto Rico, the Dominican Republic and Virgin Islands, among others. See Note 21 of the Notes to Audited Consolidated Financial Statements included elsewhere in this Annual Report on Form 10-K for additional information related to geographic areas.
Seasonality
Our payment businesses generally experiences increased activity during the traditional holiday shopping periods and around other nationally recognized holidays.
Available Information
EVERTEC’s Annual Report on Form 10-K, Quarterly Reports on Form 10-Q and Current Reports on Form 8-K and amendments to such reports (if applicable) filed or furnished pursuant to Sections 13(a) or 15(d) of the Securities Exchange Act of 1934, as amended (the “Exchange Act”) are available free of charge , through our website, http://www.evertecinc.com, as soon as reasonably practicable after such material is electronically filed with or furnished to the SEC. In addition, we makes available on our website under the heading of “Corporate Information” our: (i) Code of Ethics; (ii) Code of Ethics for Service Providers; (iii) Corporate Governance Guidelines; (iv) the charters of the Audit, Compensation and Nominating and Corporate Governance committees, and also we intend to disclose any amendments to the Code of Ethics. The aforementioned reports and materials can also be obtained free of charge upon written request or telephoning to the following address or telephone number:
EVERTEC, Inc.
Cupey Center Building
Road, 176, Kilometer 1.3
San Juan, Puerto Rico 00926
(787) 759-9999
16
Table of Contents
Index to Financial Statements
The public may read and copy any materials EVERTEC files with the SEC at the SEC’s Public Reference Room at 100 F Street, NE, Washington, D.C. 20549. In addition, the public may obtain information on the operation of the Public Reference Room by calling the SEC at 1-800-SEC-0330. Our filings with the SEC are also available to the public from commercial document retrieval services and at the web site maintained by the SEC at http://www.sec.gov.
Readers should carefully consider, in connection with other information disclosed in this Annual Report on Form 10-K, the risks and uncertainties described below. The following discussion sets forth some of the more important risk factors that could affect our business, financial condition, operating results or cash flow. However, other factors, besides those discussed below or elsewhere in this Report or other of our reports filed with or furnished to the Securities and Exchange Commission (“SEC”), also could adversely affect our business, financial condition, operating results or cash flow. We cannot assure you that the risk factors described below or elsewhere in this document are a complete set of all potential risks we may face; additional risks and uncertainties not presently known to us or not believed by us to be material may also negatively impact us. These risk factors also serve to describe factors which may cause our results to differ materially from those discussed in forward looking statements included herein or in other documents or statements that make reference to this Annual Report on Form 10-K. Please also refer to the section titled “Forward Looking Statements” in this Annual Report on Form 10-K.
Risks Related to Our Business
We expect to continue to derive a significant portion of our revenue from Popular.
Our services to Popular account for a significant portion of our revenues, and we expect that our services to Popular will continue to represent a significant portion of our revenues for the foreseeable future. In 2014, products and services billed through Popular accounted for approximately 45% of our total revenues, of which approximately 83% (or approximately 37% of total revenues) are derived from core bank processing and related services for Popular and approximately 17% (or approximately 8% of total revenues) are transaction processing activities driven by third parties. If Popular were to terminate, or fail to perform under, the Master Services Agreement or our other material agreements with Popular, our revenues could be significantly reduced.
We depend, in part, on our merchant relationships and our alliance with Banco Popular, a wholly-owned subsidiary of Popular, to grow our merchant acquiring business. If we are unable to maintain these relationships and this alliance, our business may be adversely affected.
Growth in our merchant acquiring business is derived primarily from acquiring new merchant relationships, new and enhanced product and service offerings, cross selling products and services into existing relationships, the shift of consumer spending to increased usage of electronic forms of payment, and the strength of our relationship with Banco Popular. A substantial portion of our business is generated from our ISO Agreement with Banco Popular.
Banco Popular acts as a merchant referral source and provides sponsorship into the ATH, Visa, Discover and MasterCard networks for merchants, as well as card association sponsorship, clearing and settlement services. We provide transaction processing and related functions. Both alliance partners may provide management, sales, marketing, and other administrative services. We rely on the continuing growth of our merchant relationships, our alliance with Banco Popular and other distribution channels. There can be no guarantee that this growth will continue and the loss or deterioration of these relationships could negatively impact our business and result in a reduction of our revenue and profit.
17
Table of Contents
Index to Financial Statements
If we are unable to renew client contracts at favorable terms, we could lose clients and our results of operations and financial condition may be adversely affected.
Failure to achieve favorable renewals of client contracts could negatively impact our business. Our contracts with private clients generally run for a period of one to five years, except for the Master Services Agreement with Popular, which has a term of 15 years, and provide for termination fees upon early termination. Our government contracts generally run for one year without automatic renewal periods due to requirements of the government procurement rules. Our standard merchant contract has an initial term of one or three years, with automatic one-year renewal periods. At the end of the contract term, clients have the opportunity to renegotiate their contracts with us and to consider whether to engage one of our competitors to provide products and services. If we are not successful in achieving high renewal rates and contract terms that are favorable to us, our results of operations and financial condition may be adversely affected.
Our substantial leverage could adversely affect our ability to raise additional capital to fund our operations, limit our ability to react to changes in the economy or our industry, expose us to interest rate risk to the extent of our variable rate debt and prevent us from meeting our obligations under our notes and senior secured credit facilities.
We are highly leveraged. As of December 31, 2014, the total principal amount of our indebtedness was approximately $700 million. Our high degree of leverage could have important consequences for you, including:
| • | increasing our vulnerability to adverse economic, industry or competitive developments; |
| • | requiring a substantial portion of cash flow from operations to be dedicated to the payment of principal and interest on our indebtedness, therefore reducing our ability to use our cash flow for other purposes, including for our operations, capital expenditures and future business opportunities; |
| • | exposing us to the risk of increased interest rates because our borrowings are at variable rates of interest; |
| • | making it more difficult for us to satisfy our obligations with respect to our indebtedness, and any failure to comply with the obligations of any of our other debt instruments, including restrictive covenants and borrowing conditions, could result in an event of default under the agreements governing such other indebtedness; |
| • | restricting us from making strategic acquisitions or causing us to make non-strategic divestitures; |
| • | limiting our ability to obtain additional debt or equity financing for working capital, capital expenditures, business development, debt service requirements, acquisitions and general corporate or other purposes; and |
| • | limiting our flexibility in planning for, or reacting to, changes in our business or market conditions and placing us at a competitive disadvantage compared to our competitors who are less highly leveraged and who therefore, may be able to take advantage of opportunities that our leverage prevents us from exploiting. |
For the year ended December 31, 2014, our cash interest expense on the senior secured credit facilities amounted to $22.4 million. Our interest expense could increase if interest rates increase because the entire amount of the indebtedness under the senior secured credit facilities bears interest at a variable rate. At December 31, 2014, we had approximately $695 million aggregate principal amount of variable rate indebtedness under the senior secured credit facilities. A 100 basis point increase in interest rates over our floor(s) on our debt balances outstanding as of December 31, 2014 under the senior secured credit facilities would increase our annual interest expense by approximately $6.9 million.
18
Table of Contents
Index to Financial Statements
We rely on our systems, employees and certain counterparties, and certain failures could materially adversely affect our operations.
Our businesses are dependent on our ability to process, record and monitor a large number of transactions. If any of our financial, accounting, or other data processing systems or applications fail or have other significant shortcomings or limitations, we could be materially adversely affected. We are similarly dependent on our employees. We could be materially adversely affected if one of our employees causes a significant operational breakdown or failure, either as a result of human error or where an individual purposefully sabotages or fraudulently manipulates our operations or systems. Third parties with which we do business could also be sources of operational risk to us, including relating to breakdowns or failures of such parties’ own systems or employees. Any of these occurrences could diminish our ability to operate one or more of our businesses, or result in potential liability to clients, reputational damage and regulatory intervention, any of which could materially adversely affect us.
We may be subject to disruptions of our operating systems arising from events that are wholly or partially beyond our control, which may include, for example, computer viruses or electrical or telecommunications outages, natural disasters, disease pandemics or other unanticipated damage to property or physical assets. Such disruptions may give rise to losses in service to customers and loss or liability to us. In addition, there is the risk that our controls and procedures as well as business continuity and data security systems prove to be inadequate. Any such failure could affect our operations and could materially adversely affect our results of operations by requiring us to expend significant resources to correct the defect, as well as by exposing us to litigation, regulatory fines or penalties or losses not covered by insurance.
If our amortizable intangible assets or goodwill become impaired, it may adversely affect our financial condition and operating results.
If our amortizable intangible assets or goodwill were to become impaired, we may be required to record a significant charge to earnings. Under the generally accepted accounting principles in the United States of America (“GAAP”), definitive useful life intangibles are evaluated periodically for impairment when events or changes in circumstances indicate that the carrying amount may not be recoverable. Goodwill is tested for impairment at least annually.
The goodwill impairment evaluation process requires us to make estimates and assumptions with regards to the fair value of our reporting units. Actual values may differ significantly from these estimates. Such differences could result in future impairment of goodwill that would, in turn, negatively impact our results of operations and the reporting unit where the goodwill is recorded.
For 2014, the Company used a “qualitative assessment” option or “step zero” for the goodwill impairment test for all of its reporting units. With this process, the Company first assesses whether it is “more likely than not” that the fair value of a reporting unit is less than its carrying amount. If the answer is no, then the fair value of the reporting unit does not need to be measured, and step one and step two are bypassed. In assessing the fair value of a reporting unit, which is based on the nature of the business and reporting unit’s current and expected financial performance, the Company uses a combination of factors such as general macroeconomic conditions, industry and market conditions, overall financial performance and the entity and reporting unit specific events. In 2014, step one and step two were bypassed for all reporting units.
Our risk management procedures may not be fully effective in identifying or helping us mitigate our risk exposure against all types of risks.
We operate in a rapidly changing industry, and we have experienced significant change in the past four years, including our separation from Popular following the Merger, our initial public offering in April 2013 and our
19
Table of Contents
Index to Financial Statements
listing on the New York Stock Exchange (“NYSE”). Accordingly, we may not be fully effective in identifying, monitoring and managing our risks. In some cases, the information we use to perform our risk assessments may not be accurate, complete or up-to-date. In other cases, our risk assessments may depend upon information that we may not have or cannot obtain. If we are not fully effective or we are not always successful in identifying all risks to which we are or may be exposed, we could be subject to losses, penalties, litigation or regulatory actions that could harm our reputation or have a material adverse effect on our business, financial conditions and results of operations.
Security breaches or our own failure to comply with privacy regulations and industry security requirements imposed on providers of services to financial institutions and card processing services could harm our business by disrupting our delivery of services and damaging our reputation.
As part of our business, we electronically receive, process, store and transmit sensitive business information of our customers. In addition, we collect personal consumer data, such as names and addresses, social security numbers, driver’s license numbers, cardholder data and payment history records. The uninterrupted operation of our information systems and the confidentiality of the customer/consumer information that resides on such systems are critical to the successful operations of our business. Despite the safeguards we have in place, unauthorized access to our computer systems or databases could result in the theft or publication of confidential information, the deletion or modification of records or could otherwise cause interruptions in our operations. These risks are increased when we transmit information over the Internet. Our visibility in the global payments industry may attract hackers to conduct attacks on our systems that could compromise the security of our data or could cause interruptions in the operations of our businesses and subject us to increased costs, litigation and other liabilities. There is also a possibility of mishandling or misuse, for example, if such information were erroneously provided to parties who are not permitted to have the information, either by fault of our systems, employees acting contrary to our policies, or where such information is intercepted or otherwise improperly taken by third parties. An information breach in the system and loss of confidential information such as credit card numbers and related information could have a longer and more significant impact on the business operations than a hardware failure and could result in claims against us for misuse of personal information, such as identity theft.
Additionally, as a provider of services to financial institutions, such as card processing services, we are subject directly (or indirectly through our clients) to the same laws, regulations, industry standards and limitations on disclosure of the information we receive from our customers as apply to the customers themselves. If we fail to comply with these regulations, standards and limitations, we could be exposed to claims for breach of contract, governmental proceedings, or prohibitions on card processing services. In addition, as more restrictive privacy laws, rules or industry security requirements are adopted in the future on the federal or local level or by a specific industry body, the change could have an adverse impact on us through increased costs or restrictions on business processes. We may be required to expend significant capital and other resources to comply with mandatory privacy and security standards required by law, industry standards or contracts.
Any inability to prevent security or privacy breaches or failure to comply with privacy regulations and industry security requirements could cause our existing customers to lose confidence in our systems and terminate their agreements with us, and could inhibit our ability to attract new customers, damage our reputation and/or adversely impact our relationship with administrative agencies.
We may experience breakdowns in our processing systems that could damage customer relations and expose us to liability.
We depend heavily on the reliability of our processing systems in our core businesses. A system outage or data loss, regardless of reason, could have a material adverse effect on our business, financial condition and results of operations. Not only would we suffer damage to our reputation in the event of a system outage or data loss, but we may also be liable to third parties. Some of our contractual agreements with financial institutions require the
20
Table of Contents
Index to Financial Statements
crediting of certain fees if our systems do not meet certain specified service levels. To successfully operate our business, we must be able to protect our processing and other systems from interruption, including from events that may be beyond our control. Events that could cause system interruptions include, but are not limited to, fire, natural disasters, telecommunications failure, computer viruses, terrorist acts and war. Although we have taken steps to protect against data loss and system failures, there is still risk that we may lose critical data or experience system failures. We perform the vast majority of disaster recovery operations ourselves, though we utilize select third parties for some aspects of recovery. To the extent we outsource our disaster recovery, we are at risk of the vendor’s unresponsiveness in the event of breakdowns in our systems. Furthermore, our property and business interruption insurance may not be adequate to compensate us for all losses or failures that may occur.
Lack of system integrity, fraudulent payments or credit quality related to funds settlement could result in a financial loss.
We settle funds on behalf of financial institutions, other businesses and consumers and process funds transactions from clients, card issuers, payment networks and consumers on a daily basis for a variety of transaction types. Transactions facilitated by us include debit card, credit card, electronic bill payment transactions, ACH payments, electronic benefits transfer transactions and check clearing that supports consumers, financial institutions and other businesses. These payment activities rely upon the technology infrastructure that facilitates the verification of activity with counterparties, the facilitation of the payment and, in some cases, the detection or prevention of fraudulent payments. If the continuity of operations, integrity of processing, or ability to detect or prevent fraudulent payments were compromised this could result in a financial loss to us.
We may experience defects, development delays, installation difficulties, system failure, or other service disruptions with respect to our technology solutions, which would harm our business and reputation and expose us to potential liability.
Many of our services are based on sophisticated software, technology and computing systems, and we may encounter delays when developing new technology solutions and services. Further, the technology solutions underlying our services have occasionally contained and may in the future contain undetected errors or defects when first introduced or when new versions are released. In addition, we may experience difficulties in installing or integrating our technologies on platforms used by our customers. Finally, our systems and operations could be exposed to damage or interruption from fire, natural disaster, power loss, telecommunications failure, unauthorized entry and computer viruses or other cyber attacks. Defects in our technology solutions, errors or delays in the processing of electronic transactions, or other difficulties could result in: (1) interruption of business operations; (2) delay in market acceptance; (3) additional development and remediation costs; (4) diversion of technical and other resources; (5) loss of customers; (6) negative publicity; or (7) exposure to liability claims.
Any one or more of the foregoing could have a material adverse effect on our business, financial condition and results of operations.
The ability to adopt technology to changing industry and customer needs or trends may affect our competitiveness or demand for our products, which may adversely affect our operating results.
Changes in technology may limit the competitiveness of and demand for our services. Our businesses operate in industries that are subject to technological advancements, developing industry standards and changing customer needs and preferences. Also, our customers continue to adopt new technology for business and personal uses. We must anticipate and respond to these industry and customer changes in order to remain competitive within our relative markets. For example, the ability to adopt technological advancements surrounding POS technology available to merchants could have an impact on our merchant acquiring business. Particular to this example is the “EMV” credit and debit card authentication methodology that the card associations are mandating to processors, issuers and acquirers in the payment industry. Compliance deadlines for EMV mandates vary by country and by
21
Table of Contents
Index to Financial Statements
payment network. We are investing significant resources and man-hours to develop and implement this methodology in all our payment related platforms. However, we are not certain if or when our financial institution customers will use or accept the methodology and the time it will take for this technology to be rolled-out to all customer ATM and POS devices connected to our platforms or adopted by our card issuing clients. Non-compliance with EMV mandates could result in lost business or financial losses from fraud or fines from network operators. Our inability to respond to new competitors and technological advancements could impact all of our businesses.
Consolidations in the banking and financial services industry could adversely affect our revenues by eliminating existing or potential clients and making us more dependent on a more limited number of clients.
In recent years, there have been a number of mergers and consolidations in the banking and financial services industry. Mergers and consolidations of financial institutions reduce the number of our clients and potential clients, which could adversely affect our revenues. Further, if our clients fail or merge with or are acquired by other entities that are not our clients, or that use fewer of our services, they may discontinue or reduce their use of our services. It is also possible that the larger banks or financial institutions resulting from mergers or consolidations would have greater leverage in negotiating terms with us or could decide to perform in-house some or all of the services which we currently provide or could provide. Any of these developments could have a material adverse effect on our business, financial condition and results of operations.
We are subject to the credit risk that our merchants will be unable to satisfy obligations for which we may also be liable.
We are subject to the credit risk of our merchants being unable to satisfy obligations for which we also may be liable. For example, as the merchant acquirer, we are contingently liable for transactions originally acquired by us that are disputed by the cardholder and charged back to the merchants. For certain merchants, if we are unable to collect this amount from the merchant, due to the merchant’s insolvency or other reasons, we will bear the loss for the amount of the refund or chargeback paid to the cardholder. Notwithstanding our adherence to industry standards with regards to the acceptance of new merchants and certain steps to screen for credit risk, it is possible that a default on such obligations by one or more of our merchants could have a material adverse effect on our business.
Increased competition or changes in consumer spending or payment preferences could adversely affect our business.
A decline in the market for our services, either as a result of increased competition, a decrease in consumer spending or a shift in consumer payment preferences, could have a material adverse effect on our business. We may face increased competition in the future as new companies enter the market and existing competitors expand their services. Some of these competitors could have greater overall financial, technical and marketing resources than us, which could enhance their ability to finance acquisitions, fund internal growth and respond more quickly to professional and technological changes. Some competitors could have or may develop a lower cost structure. New competitors or alliances among competitors could emerge, resulting in a loss of business for us and a corresponding decline in revenues and profit margin. Further, if consumer confidence decreases in a way that adversely affects consumer spending, whether in conjunction with a global economic downturn or otherwise, we could experience a reduction in the volume of transactions we process. In addition, if we fail to respond to changes in technology or consumer payment preferences, we could lose business to competitors.
Changes in credit card association or other network rules or standards could adversely affect our business.
In order to provide our transaction processing services, several of our subsidiaries are registered with or certified by Visa, Discover and MasterCard and other networks as members or as service providers for member
22
Table of Contents
Index to Financial Statements
institutions. As such, we and many of our customers are subject to card association and network rules that could subject us or our customers to a variety of fines or penalties that may be levied by the card associations or networks for certain acts or omissions by us, acquirer customers, processing customers and merchants. Visa, Discover, MasterCard and other networks, some of which are our competitors, set the standards with respect to which we must comply. The termination of Banco Popular’s or our subsidiaries’ member registration or our subsidiaries’ status as a certified service provider, or any changes in card association or other network rules or standards, including interpretation and implementation of the rules or standards, that increase the cost of doing business or limit our ability to provide transaction processing services to or through our customers, could have an adverse effect on our business, operating results and financial condition.
Changes in interchange fees or other fees charged by card associations and debit networks could increase our costs or otherwise adversely affect our business.
From time to time, card associations and debit networks change interchange, processing and other fees, which could impact our merchant acquiring and payment processing businesses. It is possible that competitive pressures will result in our merchant acquiring and payment processing businesses absorbing a portion of such increases in the future, which would increase our operating costs, reduce our profit margin and adversely affect our business, operating results and financial condition.
Our revenues from the sale of services to merchants that accept Visa, Discover and MasterCard cards are dependent upon our continued Visa, Discover and MasterCard registration and financial institution sponsorship.
In order to provide our Visa, Discover and MasterCard transaction processing services, we must be registered as a merchant processor of Visa, Discover and MasterCard. These designations are dependent upon our being sponsored by member banks of those organizations. If our sponsor banks should stop providing sponsorship for us, we would need to find another financial institution to serve as a sponsor, which could prove to be difficult and/or more expensive. If we are unable to find a replacement financial institution to provide sponsorship we may no longer be able to provide processing services to the affected customers which would negatively impact our revenues and earnings.
For purposes of the BHC Act, for as long as we are deemed to be controlled by Popular, we will be subject to supervision and examination by U.S. federal banking regulators, and our activities will be limited to those permissible for Popular. Furthermore, as a technology service provider to regulated financial institutions, we are subject to additional regulatory oversight and examination. As a regulated institution, we may be required to obtain regulatory approval before engaging in certain new activities or businesses, whether organically or by acquisition.
For so long as we are deemed to be a “subsidiary” of Popular for purposes of the Bank Holding Company Act of 1956 (the “BHC Act”), in other words deemed to be controlled by Popular, we will be subject to regulation and supervision by the Federal Reserve Board. The BHC Act defines “control” differently than GAAP. As a deemed subsidiary, we may conduct only those activities that are authorized for our deemed parent, which depend on whether it is treated as a bank holding company or a financial holding company. The activities that are permissible for subsidiaries of bank holding companies are those that are treated as closely related to banking; those that are permissible for subsidiaries of financial holding companies generally include activities that are financial in nature or complementary to financial activities. In addition, we are subject to regulatory oversight and examination by the Federal Financial Institution Examination Council because we are a technology service provider to regulated financial institutions, including Banco Popular.
New lines of business, other new activities, acquisitions that we may wish to commence or undertake in the future and the manner in which we conduct our business may not be permissible for us under the BHC Act,
23
Table of Contents
Index to Financial Statements
Regulation K or other relevant U.S. federal banking laws or may require the approval of the Federal Reserve Board or any other applicable U.S. federal banking regulator. Additional regulatory requirements may be imposed if Popular is subject to any enforcement action. More generally, the Federal Reserve Board has broad powers to approve, deny or refuse to act upon applications or notices submitted by Popular on our behalf with respect to new activities, the acquisition of businesses or assets, or the reconfiguration of existing operations. Any such action by the Federal Reserve Board may also depend on our ability to comply with the standards imposed by our regulators. There can be no assurance that any required regulatory approvals will be obtained. In additional, further restrictions placed on Popular as a result of supervisory or enforcement actions may be restrict us or our activities in certain circumstances, even if these actions are unrelated to our conduct or business.
Changes in laws, regulations and enforcement activities may adversely affect the products and services we provide and markets in which we operate.
We and our customers are subject to U.S. federal, Puerto Rico and other countries’ laws, rules and regulations that affect the electronic payments industry. Our customers are subject to numerous laws, rules and regulations applicable to banks, financial institutions, processors and card issuers in the United States and abroad. We are subject to regulation because of our activities in the countries where we carry them out and because of our relationship with Popular, and at times we are also affected by the laws, rules and regulations to which our customers are subject. Failure to comply with any of these laws, rules and regulations may result in the suspension or revocation of licenses or registrations, the limitation, suspension or termination of service, and/or the imposition of civil and criminal penalties, including fines which could have an adverse effect on our financial condition. In addition, even an inadvertent failure by us to comply with laws, rules and regulations, as well as rapidly evolving social expectations of corporate fairness, could damage our reputation or brands.
Furthermore, regulation of the electronic payment card industry, including regulations applicable to us and our customers, has increased significantly in recent years. There is also increasing scrutiny by the U.S. Congress of the manner in which payment card networks and card issuers set various fees, from which some of our customers derive significant revenue. For example, on July 21, 2010, the Dodd-Frank Act was signed into law in the United States. The Durbin Amendment contains requirements relating to payment card networks. To implement this provision, the Federal Reserve adopted rules which took effect on October 1, 2011 and April 1, 2012. These rules, among other things, place certain restrictions on the interchange transaction fees that a card issuer can receive for an electronic debit transaction originated at a merchant and also places various exclusivity prohibitions and routing requirements on such transactions. To date, the Durbin Amendment has had mixed implications for our business, but the overall net impact has been positive due to lower interchange costs improving the overall margins of the business. However, we cannot assure you that this trend will continue, and we believe that any future impact (positive or negative) resulting from the Durbin Amendment and subsequent developments is uncertain due to the competitive landscape in which we operate. See “Item 1. Business—Government Regulation and Payment Network Rules—Regulatory Reform and Other Legislative Initiatives.”
Further changes to laws, rules and regulations, or interpretation or enforcement thereof, could have a negative financial effect on us. We have structured our business in accordance with existing tax laws and interpretations of such laws. Changes in tax laws or their interpretations could decrease the value of revenues we receive and the amount of our cash flow and have a material adverse impact on our business.
Our business concentration in Puerto Rico imposes risks.
For both of the fiscal years ended December 31, 2014 and 2013, approximately 87% of our total revenues were generated from our operations in Puerto Rico. In addition, some revenues that are generated from our operations outside Puerto Rico are dependent upon our operations in Puerto Rico.
24
Table of Contents
Index to Financial Statements
In 2014, the government of Puerto Rico was our second largest customer representing approximately 10% of our total revenues. Revenues from the government of Puerto Rico come from numerous agencies and public corporations. A substantial portion of the services we provide to the government of Puerto Rico is considered mission-critical. Some of the government-sponsored initiatives we provide are indirectly funded in part by U.S. federal government programs. We believe the government of Puerto Rico will continue to engage our services despite the challenging financial situation it is currently facing.
Since 2006, the Puerto Rico economy has been experiencing recessionary conditions. Continuing economic decline could affect our customer base, general consumer spending, and our cost of operations and could have a material adverse effect on our business, financial condition and results of operations.
In addition, severe weather conditions that are prevalent in tropical climates and other natural disasters, could negatively affect, among other things, our ability to provide services, as well as our physical locations, property and equipment, and could have a material adverse effect on our financial condition and results of operations.
Rating downgrades on the Government of Puerto Rico’s debt obligations could slow the Puerto Rico economy and affect consumer spending
In February 2014, the principal nationally recognized statistical rating organizations downgraded the general-obligation bonds of the Commonwealth of Puerto Rico and other obligations of Puerto Rico instrumentalities to non-investment grade categories. The downgrades are based mostly on concerns about financial flexibility and a reduced capacity to borrow in the financial markets. If the government is unable to access the capital markets to place new debt or roll its upcoming maturities, the government may reduce spending, impose new taxes, and take other actions which could slow the economy. A prolonged recession or future fiscal measures may also impact our business. The continuing challenging economic environment could affect our customer base, depress general consumer spending, and lengthen the government’s payments, thus increasing our government accounts receivables; these outcomes, if realized, could have a material adverse effect on our business, financial condition and results of operations.
At December 31, 2014, the Company has no direct exposure to the Puerto Rico government, instrumentalities or municipalities’ debt obligations.
There are risks associated with our presence in international markets, including political or economic instability.
Our financial performance may be significantly affected by general economic, political and social conditions in the emerging markets where we operate. Many countries in Latin America have suffered significant economic, political and social crises in the past, and these events may occur again in the future. Instability in Latin America has been caused by many different factors, including:
| • | exposure to foreign exchange variation; |
| • | significant governmental influence over local economies; |
| • | substantial fluctuations in economic growth; |
| • | high levels of inflation; |
| • | exchange controls or restrictions on expatriation of earnings; |
| • | high domestic interest rates; |
| • | wage and price controls; |
| • | changes in governmental economic or tax policies; |
25
Table of Contents
Index to Financial Statements
| • | imposition of trade barriers; |
| • | unexpected changes in regulation which may restrict the movement of funds or result in the deprivation of contract rights or the taking of property without fair compensation; and |
| • | overall political, social and economic instability. |
Adverse economic, political and social conditions in the Latin America markets where we operate may create uncertainty regarding our operating environment, which could have a material adverse effect on our company.
Our business in countries outside the United States and transactions with foreign governments increase our compliance risks and exposes us to business risks.
Our operations outside the United States could expose us to trade and economic sanctions or other restrictions imposed by the United States or other local governments or organizations. The U.S. Departments of the Treasury and Justice (the “Agencies”), the SEC and other federal agencies and authorities have a broad range of civil and criminal penalties they may seek to impose against corporations and individuals for violations of economic sanctions laws, the FCPA and other federal statutes. Under economic sanctions laws, the Agencies may seek to impose modifications to business practices, including cessation of business activities involving sanctioned countries, and modifications to compliance programs, which may increase compliance costs. In addition, we are also subject to compliance with local government regulations. If any of the risks described above materialize, it could adversely impact our business, operating results and financial condition.
These regulations also prohibit improper payments or offers of payments to foreign governments and their officials and political parties by the United States and other business entities for the purpose of obtaining or retaining business. We have operations and deal with government entities and financial institutions in countries known to experience corruption, particularly certain emerging countries in Latin America, and further international expansion may involve more of these countries. Our activities in these countries create the risk of unauthorized payments or offers of payments by one of our employees or consultants that could be in violation of various laws including the FCPA, even though these parties are not always subject to our control. Our existing safeguards and any future improvements may prove to be less than effective, and our employees or consultants may engage in conduct for which we may be held responsible. Violations of the FCPA may result in severe criminal or civil sanctions, and we may be subject to other liabilities, which could negatively affect our business, operating results and financial condition.
We are also subject to the Export Administration Regulations (“EAR”) administered by the U.S. Department of Commerce’s Bureau of Industry and Security which regulates the export, re-export and re-transfer abroad of covered items made or originating in the United States as well as the transfer of covered U.S.-origin technology abroad. We have adopted an Export Management Compliance Policy, a comprehensive compliance program under which the goods and technologies that we export are identified and classified under the EAR to make sure they are being exported in compliance with the requirements of the EAR. However, there can be no assurance that we have not violated the EAR in past transactions or that our new policies and procedures will prevent us from violating the EAR in every transaction in which we engage. Any such violations of the EAR could result in fines, penalties or other sanctions being imposed on us, which could negatively affect our business, operating results and financial condition.
Moreover, some financial institutions refuse, even in the absence of a regulatory requirement, to provide services to companies operating in certain countries or engaging in certain practices because of concerns that the compliance efforts perceived to be necessary may outweigh the usefulness of the service relationship. Our operations outside the United States make it more likely that financial institutions may refuse to conduct business with us for this type of reason. Any such refusal could negatively affect our business, operating results and financial condition.
26
Table of Contents
Index to Financial Statements
We and our subsidiaries conduct business with financial institutions and/or card payment networks operating in countries whose nationals, including some of our customers’ customers, engage in transactions in countries that are the targets of U.S. economic sanctions and embargoes. If we are found to have failed to comply with applicable U.S. sanctions laws and regulations in these instances, we and our subsidiaries could be exposed to fines, sanctions and other penalties or other governmental investigations.
We and our subsidiaries conduct business with financial institutions and/or card payment networks operating in countries whose nationals, including some of our customers’ customers, engage in transactions in countries that are the target of U.S. economic sanctions and embargoes, including Cuba. As a U.S.-based entity, we and our subsidiaries are obligated to comply with the economic sanctions regulations administered by OFAC. These regulations prohibit U.S.-based entities from entering into or facilitating unlicensed transactions with, for the benefit of, or in some cases involving the property and property interests of, persons, governments, or countries designated by the U.S. government under one or more sanctions regimes. Failure to comply with these sanctions and embargoes may result in material fines, sanctions or other penalties being imposed on us or other governmental investigations. In addition, various state and municipal governments, universities and other investors maintain prohibitions or restrictions on investments in companies that do business involving sanctioned countries or entities.
For these reasons, we have established risk-based policies and procedures designed to assist us and our personnel in complying with applicable U.S. laws and regulations. These policies and procedures include the use of software to screen transactions we process for evidence of sanctioned-country and persons involvement. Consistent with a risk-based approach and the difficulties of identifying all transactions of our customers’ customers that may involve a sanctioned country, there can be no assurance that our policies and procedures will prevent us from violating applicable U.S. laws and regulations in every transaction in which we engage, and such violations could adversely affect our reputation, business, financial condition and results of operations.
Because we process transactions on behalf of the aforementioned financial institutions through the aforementioned payment networks, we have processed a limited number of transactions potentially involving sanctioned countries and there can be no assurances that, in the future, we will not inadvertently process such transactions. Due to a variety of factors, including technical failures and limitations of our transaction screening process, conflicts between U.S. and local laws, political or other concerns in certain countries in which we and our subsidiaries operate, and/or failures in our ability effectively to control employees operating in certain non-U.S. subsidiaries, we have not rejected every transaction originating from or otherwise involving sanctioned countries, or persons and there can be no assurances that, in the future, we will not inadvertently fail to reject such transactions.
On June 25, 2010, EVERTEC Group discovered potential violations of the Cuban Assets Control Regulations (“CACR”), which are administered by OFAC, which occurred due to an oversight in the activation of screening parameters for two customers located in Haiti and Belize. Upon discovery of these potential violations, EVERTEC Group initiated an internal review and submitted an initial notice of voluntary self-disclosure to OFAC on July 1, 2010. OFAC responded to this initial report with requests for additional information. EVERTEC Group provided the information requested on September 24, 2010 in its final notice of voluntary self-disclosure, which also included information on the remedial measures and new and enhanced internal controls adopted by EVERTEC Group to avoid this situation in the future. These potential violations involved a small number of processed transactions from Cuba compared to the overall number of transactions processed for these customers during the two-month period in which the screening failures occurred. We cannot predict the timing or ultimate outcome of the OFAC review, the total costs to be incurred in response to this review, the potential impact on our personnel, the effect of implementing any further measures that may be necessary to ensure full compliance with U.S. sanctions regulations, or to what extent, if at all, we could be subject to penalties or other governmental investigations.
27
Table of Contents
Index to Financial Statements
Separately, on September 15, 2010, EVERTEC Group submitted an initial notice of voluntary self-disclosure to OFAC regarding certain activities of its former Venezuelan subsidiary, EVERTEC de Venezuela, C.A. (which ceased being a subsidiary of EVERTEC Group after the closing of the Merger and is now known as Tarjetas y Transacciones en Red TRANRED, C.A. (“Tranred”)) and EVERTEC Group’s Costa Rican subsidiary (which continues to be a subsidiary of EVERTEC Group after the closing of the Merger). This initial self-disclosure informed OFAC that these subsidiaries appeared to have been involved in processing Cuba-related credit card transactions that EVERTEC Group and the subsidiary believed they could not reject under governing local law and policies, but which nevertheless may not be consistent with the CACR. With respect to EVERTEC Group and its former Venezuelan subsidiary, we disclosed that they completely ceased processing Cuba-related transactions for financial institutions operating in Venezuela on September 4, 2010. We also disclosed that EVERTEC Group’s Costa Rican subsidiary completely ceased processing Cuba-related credit card transactions for financial institutions operating in Costa Rica in January 2009. In addition, it was also disclosed that EVERTEC Group’s Costa Rican subsidiary’s switch had served as a conduit through which information about Cuban-related debit card transactions was transmitted to credit card associations and issuer banks, which made the decisions to approve or reject the transactions.
On November 15, 2010, EVERTEC Group submitted its final notice of voluntary self-disclosure on these transactions to OFAC. The final report indicated the measures that we had taken to determine the amount of the credit transactions relating to Cuba that had not been rejected between 2007 and 2010. In addition, we confirmed that EVERTEC Group terminated the routing of the Cuban-related debit card transaction information through its Costa Rican subsidiary on September 30, 2010. While the credit and debit card transactions at issue represent a small proportion of the overall number of transactions processed for these financial institutions, the transactions occurred over an extended period of time.
On August 7, 2013, Popular submitted a voluntary self-disclosure to OFAC regarding certain routed debit card transactions by Tranred between October 2012 and May 2013 that may be in violation of the CACR. The voluntary self-disclosure also states that transactions constitute a small number of transactions compared to the overall number of transactions Tranred processed, and are representative of transactions that may have occurred prior to October 2010 when the entity was subject to the ownership and control of EVERTEC. We have been advised by Popular that effective May 2013, Tranred implemented a new control filter in its debit card transactions routing system to prevent the routing by Tranred of any debit card transaction originating in Cuba.
Should OFAC determine that certain activities identified in the voluntary self-disclosures described above constituted violations of the CACR, civil or criminal penalties could be assessed against EVERTEC Group and/or its subsidiary. Since November 15, 2010, there have been no communications between OFAC and EVERTEC Group regarding the transactions included in the above described voluntary self-disclosures.
Popular agreed to specific indemnification obligations with respect to all of the matters described above and certain other matters, in each case, subject to the terms and conditions contained in the Merger Agreement and/or contained in the Venezuela Transition Services Agreement, dated September 29, 2010, as amended. However, we cannot assure you that we will be able to fully collect any claims made with respect to such indemnities or that Popular and/or Tranred will satisfy its indemnification obligations to us.
Our expansion and selective acquisition strategy exposes us to risks, including the risk that we may not be able to successfully integrate acquired businesses.
As part of our growth strategy, we evaluate opportunities for acquiring complementary businesses that may supplement our internal growth. However, there can be no assurance that we will be able to identify and purchase suitable operations. Furthermore, for as long as we are deemed a “subsidiary” of a bank holding company for purposes of the BHC Act, we may conduct only activities authorized under the BHC Act and the Federal Reserve Board’s Regulation K and other related regulations for a bank holding company or a financial holding company.
28
Table of Contents
Index to Financial Statements
These restrictions may limit our ability to acquire other businesses or enter into other strategic transactions. See “—For purposes of the BHC Act, for as long as we are deemed to be controlled by Popular, we will be subject to supervision and examination by U.S. federal banking regulators, and our activities are limited to those permissible for Popular. Furthermore, as a technology service provider to regulated financial institutions, we are subject to additional regulatory oversight and examination. As a regulated institution, we may be required to obtain regulatory approval before engaging in certain new activities or businesses, whether organically or by acquisition.”
In addition, in connection with any acquisitions, we must comply with U.S. federal and other antitrust and/or competition law requirements. Further, the success of any acquisition depends in part on our ability to integrate the acquired company, which may involve unforeseen difficulties and may require a disproportionate amount of our management’s attention and our financial and other resources. Although we conduct due diligence investigations prior to each acquisition, there can be no assurance that we will discover all operational deficiencies or material liabilities of an acquired business for which we may be responsible as a successor owner or operator. The failure to successfully integrate these acquired businesses or to discover such liabilities could adversely affect our operating results.
Failure to protect our intellectual property rights and defend ourselves from potential intellectual property infringement claims may diminish our competitive advantages or restrict us from delivering our services.
Our trademarks, proprietary software, and other intellectual property, including technology/software licenses, are important to our future success. For example, the ATH trademark and trade name is widely recognized in Latin America and the Caribbean and is associated with quality and reliable service. Therefore, such marks represent substantial intangible assets and are important to our business. Limitations or restrictions on our ability to use such marks or a diminution in the perceived quality associated therewith could have an adverse impact on the growth of our businesses. We also rely on proprietary software and technology, including third party software that is used under licenses. It is possible that others will independently develop the same or similar software or technology, which would permit them to compete with us more efficiently. Furthermore, if any of the third party software or technology licenses are terminated or otherwise determined to be unenforceable, then we would have to obtain a comparable license, which may involve increased license fees and other costs.
Despite our efforts to protect our proprietary or confidential business know-how and other intellectual property rights, unauthorized parties may attempt to copy or misappropriate certain aspects of our services, infringe upon our rights, or to obtain and use information that we regard as proprietary. Policing such unauthorized use of our proprietary rights is often very difficult, and therefore, we are unable to guarantee that the steps we have taken will prevent misappropriation of our proprietary software/technology or that the agreements entered into for that purpose will be effective or enforceable in all instances. Misappropriation of our intellectual property or potential litigation concerning such matters could have a material adverse effect on our results of operations or financial condition. Our registrations and/or applications for trademarks, copyrights, and patents could be challenged, invalidated or circumvented by others and may not be of sufficient scope or strength to provide us with maximum protection or meaningful advantage. If we are unable to maintain the proprietary nature of our software or technologies, we could lose competitive advantages and our businesses may be materially adversely affected. Furthermore, the laws of certain foreign countries in which we do business or contemplate doing business in the future may not protect intellectual property rights to the same extent as do the laws of the United States or Puerto Rico. Adverse determinations in judicial or administrative proceedings could prevent us from selling our services and products, or prevent us from preventing others from selling competing services, and may result in a material adverse effect on our business, financial condition and results of operations.
29
Table of Contents
Index to Financial Statements
If our applications or services or third party applications upon which we rely are found to infringe the proprietary rights of others, we may be required to change our business practices and may also become subject to significant costs and monetary penalties.
As our IT applications and services develop, we are increasingly subject to potential claims for intellectual property infringement, for example, patent or copyright infringement. Any such claims, even if lacking merit, could: (i) be expensive and time-consuming to defend; (ii) cause us to cease making, licensing or using software or applications that incorporate the challenged intellectual property; (iii) require us to redesign our software or applications, if feasible; (iv) divert management’s attention and resources; and (v) require us to enter into royalty or licensing agreements in order to obtain the right to use necessary technologies. Unfavorable resolution of these claims could result in us being restricted from delivering the related service and products, liable for damages, or otherwise result in a settlement that could be material to us.
The ability to recruit, retain and develop qualified personnel is critical to our success and growth.
All of our businesses function at the intersection of rapidly changing technological, social, economic and regulatory developments that requires a wide ranging set of expertise and intellectual capital. For us to successfully compete and grow, we must retain, recruit and develop the necessary personnel who can provide the needed expertise across the entire spectrum of our intellectual capital needs. In addition, we must develop our personnel to provide succession plans capable of maintaining continuity in the midst of the inevitable unpredictability of human capital. However, the market for qualified personnel is competitive and we may not succeed in recruiting additional personnel or may fail to effectively replace current personnel who depart with qualified or effective successors. Our effort to retain and develop personnel may also result in significant additional expenses, which could adversely affect our profitability. We cannot assure you that key personnel, including executive officers, will continue to be employed or that we will be able to attract and retain qualified personnel in the future. Failure to retain or attract key personnel could have a material adverse effect on us.
Failure to comply with U.S. state and federal antitrust requirements could adversely affect our business.
Due to our ownership of the ATH network and our merchant acquiring and payment processing business in Puerto Rico, we are involved in a significant percentage of the debit and credit card transactions conducted in Puerto Rico each day. Regulatory scrutiny of, or regulatory enforcement action in connection with, compliance with U.S. state and federal antitrust requirements could have a material adverse effect on our reputation and business.
The market for our electronic commerce services is evolving and may not continue to develop or grow rapidly enough for us to maintain and increase our profitability.
If the number of electronic commerce transactions does not continue to grow or if consumers or businesses do not continue to adopt our services, it could have a material adverse effect on the profitability of our business, financial condition and results of operations. We believe future growth in the electronic commerce market will be driven by the cost, ease-of-use, and quality of products and services offered to consumers and businesses. In order to consistently increase and maintain our profitability, consumers and businesses must continue to adopt our services.
The historical financial information for certain periods presented in this Annual Report on Form 10-K may not be representative of our results as a consolidated, stand-alone company and may not be a reliable indicator of our future results.
The historical financial statements of EVERTEC Group’s predecessor entities for certain periods included in this Annual Report on Form 10-K were prepared on a “carved-out” basis from Popular’s consolidated financial
30
Table of Contents
Index to Financial Statements
statements and do not reflect our operations as a separate stand-alone entity for such periods. Because our businesses were either wholly-owned subsidiaries of Popular, or were operated as divisions of wholly-owned subsidiaries of Popular, the historical financial statements for certain periods include assets, liabilities, revenues and expenses directly attributable to our operations and allocations to us of certain corporate expenses of Popular. These expenses for corporate services, which include expenses for accounting, tax, treasury, payroll and benefits administration, risk management, legal, public relations and compliance, have been allocated to us on the basis that management considers to reflect most fairly or reasonably the utilization of the services provided to or the benefit obtained by businesses comprising our company. However, the historical financial statements do not necessarily reflect what our financial position and results of operations would have been if we had been operated as a stand-alone entity during such periods, and may not be indicative of future results of operations or financial position.
We have identified a material weakness in our internal control over financial reporting which could, if not remediated, result in material misstatements in our financial statements.
Management is responsible for establishing and maintaining adequate internal control over financial reporting as defined in Rule 13a-15(f) under the Exchange Act. As disclosed in Item 9A, management identified a material weakness in our internal control over financial reporting because the segregation of duties within the accounting system was inadequate for multiple individuals within the Company, including members of executive management. Specifically, certain individuals have access to prepare and post journal entries across substantially all key accounts of the Company without an independent review performed by someone other than the preparer. Because of this material weakness, our management concluded that the Company did not maintain effective internal control over financial reporting as of December 31, 2014. Our management has performed a review of the prepare and post activity for the year ended December 31, 2014, concluding that none of the individuals with prepare and post capabilities created any posted journal entries. In addition, with the oversight of senior management and the audit committee, we have begun taking steps to remediate the underlying cause of the material weakness and improve the design of controls. If we are unable to successfully remediate the material weakness in our internal controls, it could result in inaccurate financial reporting or material misstatements in our annual or interim financial statements.
Risks Related to Our Structure, Governance and Stock Exchange Listing
We are a holding company and rely on dividends and other payments, advances and transfers of funds from our subsidiaries to meet our obligations and pay any dividends.
We have no direct operation and significant assets other than the ownership of 100% of the membership interest of Holdings, which in turn has no significant assets other than ownership of 100% of the membership interest of EVERTEC Group. Because we conduct our operations through our subsidiaries, we depend on those entities for dividends and other payments to generate the funds necessary to meet our financial obligations, and to pay any dividends with respect to our common stock. Legal and contractual restrictions in the senior secured credit facilities and other agreements which may govern future indebtedness of our subsidiaries, as well as the financial condition and operating requirements of our subsidiaries, may limit our ability to obtain cash from our subsidiaries. The earnings from, or other available assets of, our subsidiaries may not be sufficient to pay dividends or make distributions or loans enable us to pay any dividends on our common stock or other obligations.
Any declaration and payment of future dividends to holders of our common stock may be limited by restrictive covenants of our debt agreements, and will be at the sole discretion of our Board and will also depend on many factors.
Any declaration and payment of future dividends to holders of our common stock may be limited by restrictive covenants of our debt agreements, and will be at the sole discretion of our Board and will depend on many
31
Table of Contents
Index to Financial Statements
factors, including our financial condition, earnings, capital requirements, level of indebtedness, statutory and contractual restrictions applying to the payment of dividends and other considerations that our Board deems relevant. The terms of our senior secured credit facilities may restrict our ability to pay cash dividends on our common stock. We are prohibited from paying any cash dividend on our common stock unless we satisfy certain conditions. The senior secured credit facilities also include limitations on the ability of our subsidiaries to pay dividends to us. Furthermore, we will be permitted under the terms of our debt agreements to incur additional indebtedness that may severely restrict or prohibit the payment of dividends. The agreements governing our current and future indebtedness may not permit us to pay dividends on our common stock.
The requirements of having a class of publicly traded equity securities may strain our resources and distract management.
Upon completion of our initial public offering in April 2013, we became subject to additional reporting requirements of the Securities Exchange Act of 1934, as amended (the “Exchange Act”), the Sarbanes-Oxley Act of 2002, (the “Sarbanes-Oxley Act”), and the Dodd-Frank Act. The Dodd-Frank Act effects comprehensive changes to public company governance and disclosures in the United States and will subject us to additional federal regulation. We cannot predict with any certainty the requirements of the regulations ultimately adopted or how the Dodd-Frank Act and such regulations will impact the cost of compliance for a company with publicly traded common stock. We are currently evaluating and monitoring developments with respect to the Dodd-Frank Act and other new and proposed rules and cannot predict or estimate the amount of the additional costs we may incur or the timing of such costs. These laws, regulations and standards are subject to varying interpretations, in many cases due to their lack of specificity, and, as a result, their application in practice may evolve over time as new guidance is provided by regulatory and governing bodies. This could result in continuing uncertainty regarding compliance matters and higher costs necessitated by ongoing revisions to disclosure and governance practices. We intend to invest resources to comply with evolving laws, regulations and standards, and this investment may result in increased general and administrative expenses and a diversion of management’s time and attention from revenue-generating activities to compliance activities. If our efforts to comply with new laws, regulations and standards differ from the activities intended by regulatory or governing bodies due to ambiguities related to practice, regulatory authorities may initiate legal proceedings against us and our business may be harmed. As a company with publicly traded common stock, these new rules and regulations will make it more expensive for us to obtain director and officer liability insurance, and we may be required to accept reduced coverage or incur substantially higher costs to obtain coverage. These factors could also make it more difficult for us to attract and retain qualified members of our Board, particularly to serve on our audit committee, and qualified executive officers.
The Sarbanes-Oxley Act requires that we maintain effective disclosure controls and procedures and internal control over financial reporting. These requirements may place a strain on our systems and resources. Under Section 404 of the Sarbanes-Oxley Act, we are required to include a report of management on our internal control over financial reporting in this Annual Report on Form 10-K for the year ended December 31, 2014. In order to maintain and improve the effectiveness of our disclosure controls and procedures and internal control over financial reporting, significant resources and management oversight is required. This may divert management’s attention from other business concerns, which could have a material adverse effect on our business, financial condition, results of operations and cash flows. If we are unable to conclude that our disclosure controls and procedures and internal control over financial reporting are effective, or if we are no longer an emerging growth company and our independent public accounting firm is unable to provide us with an unqualified report on our internal control over financial reporting in future years, investors may lose confidence in our financial reports and our stock price may decline.
The price of our common stock may fluctuate significantly and you could lose all or part of your investment.
Volatility in the market price of our common stock may prevent you from being able to sell your common stock at or above the price you paid for your common stock. The market price for our common stock could fluctuate
32
Table of Contents
Index to Financial Statements
significantly for various reasons, including:
| • | our operating and financial performance and prospects; |
| • | changes in earnings estimates or recommendations by securities analysts who track our common stock or industry; |
| • | market perception of our success, or lack thereof, in pursuing our growth strategy; and |
| • | sales of common stock by us, our stockholders, Popular or members of our management team. |
In addition, the stock market has experienced significant price and volume fluctuations in recent years. This volatility has had a significant impact on the market price of securities issued by many companies, including companies in our industries. The changes frequently appear to occur without regard to the operating performance of the affected companies. Hence, the price of our common stock could fluctuate based upon factors that have little or nothing to do with us, and these fluctuations could materially reduce our share price.
Future sales or the possibility of future sales of a substantial amount of our common stock may depress the price of shares of our common stock.
We may sell additional shares of common stock in subsequent public offerings or otherwise, including financing acquisitions. Our amended and restated certificate of incorporation authorizes us to issue 206,000,000 shares of common stock, of which 77,893,144 are outstanding as of January 31, 2015. All of these shares, other than the 11,654,803 shares held by Popular and the shares held by our officers and directors, are freely transferable without restriction or further registration under the Securities Act.
In addition, we have filed a Form S-8 under the Securities Act covering 12,089,382 shares of our common stock reserved for issuance under our Carib Holdings, Inc. 2010 Equity Incentive Plan (or the 2010 Plan), and our EVERTEC, Inc. 2013 Equity Incentive plan (or the 2013 Plan) and certain options and restricted stock granted outside of these plans (which we refer to as the Equity Plans), but subject to the terms and conditions of the 2010 Plan. Accordingly, shares of our common stock registered under such registration statement may become available for sale in the open market upon grants under the Equity Incentive Plans, subject to vesting restrictions, Rule 144 limitations applicable to our affiliates and the contractual lock-up provisions described below.
We cannot predict the size of future issuances of our common stock or the effect, if any, that future issuances and sales of our common stock will have on the market price of our common stock. Sales of substantial amounts of our common stock (including any shares issued in connection with an acquisition), or the perception that such sales could occur, may adversely affect prevailing market prices for our common stock.
If securities analysts stop publishing research or reports about our company, or if they issue unfavorable commentary about us or our industry or downgrade our common stock, the price of our common stock could decline.
The trading market for our common stock will depend in part on the research and reports that third party securities analysts publish about our company and our industry. One or more analysts could downgrade our common stock or issue other negative commentary about our company or our industry. In addition, we may be unable or slow to attract research coverage. Alternatively, if one or more of these analysts cease coverage of our company, we could lose visibility in the market. As a result of one or more of these factors, the trading price of our common stock could decline.
The interests of Popular may conflict with or differ from your interests as a stockholder.
Popular have the right to nominate two members of our Board and, therefore, continues to be able to significantly influence our decisions. The interests of Popular could conflict with your interests as a holder of our common stock. For example, the concentration of ownership held by Popular, the terms of the Stockholder Agreement and
33
Table of Contents
Index to Financial Statements
our organizational documents (including Popular’s quorum rights and consent rights over amendments to our bylaws) and Popular’s right to terminate certain of its agreements with us in certain situations upon a change of control of EVERTEC Group, could delay, defer or prevent certain significant corporate actions that you as a stockholder may otherwise view favorably, including a change of control of us (whether by merger, takeover or other business combination). See “Certain Relationships and Related Party Transactions” for a description of the circumstances under which Popular may terminate certain of its agreements with us. A sale of a substantial number of shares of stock in the future by Popular could cause our stock price to decline.
Our organizational documents and Stockholder Agreement may impede or discourage a takeover, which could deprive our investors of the opportunity to receive a premium for their shares.
Provisions of our amended and restated certificate of incorporation, amended and restated bylaws and the Stockholder Agreement may make it more difficult for, or prevent a third party from, acquiring control of us without the approval of our Board and/or Popular. These provisions include:
| • | a voting agreement pursuant to which Popular agreed to vote its shares in favor of the Popular director nominees (which, constitute the right to appoint two of our nine directors), directors nominated by a committee of our Board in accordance with the Stockholder Agreement and the management director and to remove and replace any such directors in accordance with the terms of the Stockholder Agreement and applicable law and an agreement by us to take all actions within our control necessary and desirable to cause the election, removal and replacement of such directors in accordance with the Stockholder Agreement and applicable law; |
| • | requiring that a quorum for the transaction of business at any meeting of the Board (other than a reconvened meeting with the same agenda as the originally adjourned meeting) consist of (1) a majority of the total number of directors then serving on the Board and (2) at least one director nominated by Popular, for so long as it owns, together with its affiliates, 5% or more of our outstanding common stock; |
| • | prohibiting cumulative voting in the election of directors; |
| • | authorizing the issuance of “blank check” preferred stock without any need for action by stockholders other than Popular (as further described below); |
| • | prohibiting stockholders from acting by written consent unless the action is taken by unanimous written consent; |
| • | establishing advance notice requirements for nominations for election to our Board or for proposing matters that can be acted on by stockholders at stockholder meetings, which advance notice requirements are not applicable to any directors nominated in accordance with the terms of the Stockholder Agreement. |
Our issuance of shares of preferred stock could delay or prevent a change in control of us. Our Board has authority to issue shares of preferred stock, subject to the approval of at least one director nominated by Popular for so long as it, together with its respective affiliates, owns at least 10% of our outstanding common stock. Our Board may issue preferred stock in one or more series, designate the number of shares constituting any series, and fix the rights, preferences, privileges and restrictions thereof, including dividend rights, voting rights, rights and terms of redemption, redemption price or prices and liquidation preferences of such series. The issuance of shares of our preferred stock may have the effect of delaying, deferring or preventing a change in control without further action by the stockholders, even where stockholders are offered a premium for their shares. In addition, Popular, under and subject to the Stockholder Agreement and our organizational documents, will retain significant influence over matters requiring board or stockholder approval, including the election of directors. See “Certain Relationships and Related Party Transactions—Related Party Transactions” Together, our amended and restated certificate of incorporation, bylaws and Stockholder Agreement could make the removal of management more difficult and may discourage transactions that otherwise could involve payment of a premium
34
Table of Contents
Index to Financial Statements
over prevailing market prices for our common stock. Furthermore, the existence of the foregoing provisions, as well as the significant common stock owned by Popular and its individual right to nominate a specified number of directors in certain circumstances, could limit the price that investors might be willing to pay in the future for shares of our common stock. They could also deter potential acquirers of us, thereby reducing the likelihood that you could receive a premium for your common stock in an acquisition. See “Description of Capital Stock—Certain Anti-Takeover, Limited Liability and Indemnification Provisions.”
Risks Related to Our Indebtedness
Despite our high indebtedness level, we and our subsidiaries still may be able to incur significant additional amounts of debt, which could further exacerbate the risks associated with our substantial indebtedness.
We and our subsidiaries may be able to incur substantial additional indebtedness in the future, some of which may be secured. Although the agreement governing our senior secured credit facilities contain restrictions on the incurrence of additional indebtedness, these restrictions are subject to a number of significant qualifications and exceptions, and under certain circumstances, the amount of indebtedness that could be incurred in compliance with these restrictions could be substantial.
In addition to the $77.0 million which was available for borrowing under our revolving credit facility as of December 31, 2014, the terms of the senior secured credit facilities enable us to increase the amount available under the term loan and/or revolving credit facilities if we are able to obtain loan commitments from banks and satisfy certain other conditions. If new debt is added to our and our subsidiaries’ existing debt levels, the related risks that we face would increase.
Our debt agreements contain restrictions that limit our flexibility in operating our business.
The agreement governing the senior secured credit facilities contain, and any future indebtedness we incur may contain, various covenants that limit our ability to engage in specified types of transactions. These covenants limit our and our restricted subsidiaries’ ability to, among other things:
| • | incur additional indebtedness or issue certain preferred shares; |
| • | pay dividends on, repurchase or make distributions in respect of our capital stock or make other restricted payments; |
| • | make certain investments; |
| • | sell certain assets; |
| • | create liens; |
| • | consolidate, merge, sell or otherwise dispose of all or substantially all of our assets; |
| • | enter into certain transactions with our affiliates; and |
| • | designate our subsidiaries as unrestricted subsidiaries. |
As a result of these covenants, we are limited in the manner in which we conduct our business and we may be unable to engage in favorable business activities or finance future operations or capital needs. In addition, the covenants in the senior secured credit facilities require us to maintain a maximum senior secured leverage ratio and also limit our capital expenditures. A breach of any of these covenants could result in a default under one or more of these agreements, including as a result of cross default provisions and, in the case of our revolving credit facility, permit the lenders to cease making loans to us. Upon the occurrence of an event of default under the senior secured credit facilities, the lenders could elect to declare all amounts outstanding under the senior secured credit facilities to be immediately due and payable and terminate all commitments to extend further credit. Such actions by those lenders could cause cross defaults under our other indebtedness. If we were unable to repay
35
Table of Contents
Index to Financial Statements
those amounts, the lenders under our senior secured credit facilities could proceed against the collateral granted to them to secure that indebtedness. We have pledged a significant portion of our assets as collateral under the senior secured credit facilities. If the lenders under the senior secured credit facilities accelerate the repayment of borrowings, the proceeds from the sale or foreclosure upon such assets will first be used to repay debt under our senior secured credit facilities and we may not have sufficient assets to repay our unsecured indebtedness thereafter.
We may not be able to generate sufficient cash to service all of our indebtedness and may be forced to take other actions to satisfy our obligations under our indebtedness, which may not be successful.
Our ability to make scheduled payments on or to refinance our debt obligations depends on our financial condition and operating performance, which is subject to prevailing economic and competitive conditions and to certain financial, business and other factors beyond our control. We may not be able to maintain a level of cash flows from operating activities sufficient to permit us to pay the principal, premium, if any, and interest on our indebtedness.
If our cash flows and capital resources are insufficient to fund our debt service obligations, we may be forced to reduce or delay investments and capital expenditures, or to sell assets, seek additional capital or restructure or refinance our indebtedness. Our ability to restructure or refinance our debt will depend on the condition of the capital markets and our financial condition at such time. Any refinancing of our debt could be at higher interest rates and may require us to comply with more onerous covenants, which could further restrict our business operations. The terms of existing or future debt instruments may restrict us from adopting some of these alternatives. In addition, any failure to make payments of interest and principal on our outstanding indebtedness on a timely basis would likely result in a reduction of our credit rating, which could harm our ability to incur additional indebtedness. These alternative measures may not be successful and may not permit us to meet our scheduled debt service obligations.
Item 1B. Unresolved Staff Comments
None.
Our principal operations are conducted in Puerto Rico. Our principal executive offices are located at Cupey Center Building, Road 176, Kilometer 1.3, San Juan, Puerto Rico 00926.
We own one property in Costa Rica, in the province of San Jose, which is used by our Costa Rican subsidiary for its payment processing business. We also lease space in 9 other locations across Latin America and the Caribbean, including our headquarters in San Juan, Puerto Rico and various data centers and office facilities to meet our sales and operating needs. We believe that our properties are in good operating condition and adequately serve our current business operations. We also anticipate that suitable additional or alternative space, including those under lease options, will be available at commercially reasonable terms for future expansion.
We are defendants in various lawsuits or arbitration proceedings arising in the ordinary course of business. Management believes, based on the opinion of legal counsel and other factors, that the aggregated liabilities, if any, arising from such actions will not have a material adverse effect on the financial condition, results of operations and the cash flows of the Company.
Item 4. Mine Safety Disclosures
Not applicable.
36
Table of Contents
Index to Financial Statements
Part II
Item 5. Market for Registrant’s Common Equity, Related Stockholder Matters and Issuer Purchases of Equity Securities
Our common stock began trading on the NYSE under the symbol “EVTC” following our initial public offering on April 17, 2013. Before then, there was no public market for our common stock. The following table sets forth, for the periods indicated, the high and low sales prices of our common stock as reported by the NYSE.
| Price Range | ||||||||
| High | Low | |||||||
| Second quarter 2013 (beginning April 17, 2013) |
$ | 22.83 | $ | 19.11 | ||||
| Third quarter 2013 |
25.67 | 21.30 | ||||||
| Fourth quarter 2013 |
24.74 | 20.64 | ||||||
| First quarter 2014 |
26.33 | 22.90 | ||||||
| Second quarter 2014 |
25.34 | 22.08 | ||||||
| Third quarter 2014 |
24.66 | 21.69 | ||||||
| Fourth quarter 2014 |
23.00 | 20.47 | ||||||
As of February 23, 2015, the approximate number of record holders of our common stock was 167. The closing price as reported on the NYSE of our common stock on such date was $20.12 per share.
Dividends
We currently have a policy under which we pay a regular quarterly dividend on our common stock, subject to the declaration thereof each quarter by our Board. The following table provides a detail of dividend information for 2014 and 2013:
| Declaration Date |
Record Date |
Payment Date |
Dividend per share | |||||
| August 7, 2013 |
August 19, 2013 | September 6, 2013 | $ | 0.10 | ||||
| November 6, 2013 |
November 18, 2013 | December 6, 2013 | 0.10 | |||||
| February 12, 2014 |
February 25, 2014 | March 14, 2014 | 0.10 | |||||
| May 7, 2014 |
May 19, 2014 | June 6, 2014 | 0.10 | |||||
| August 6, 2014 |
August 18, 2014 | September 5, 2014 | 0.10 | |||||
| November 5, 2014 |
November 17, 2014 | December 5, 2014 | 0.10 | |||||
Any declaration and payment of future dividends to holders of our common stock will be at the discretion of our Board and will depend on many factors, including our financial condition, earnings, available cash, business opportunities, legal requirements, restrictions in our debt agreements and other contracts, capital requirements, level of indebtedness and other factors that our Board deems relevant. The covenants of our senior secured credit facilities may limit our ability to pay dividends on our common stock and limit the ability of our subsidiaries to pay dividends to us if we do not meet required performance metrics contained in our debt agreements. See “Management’s Discussion and Analysis of Financial Condition and Results of Operations—Financial Obligations.”
We paid a special dividend to our stockholders on May 9, 2012 in the aggregate amount of $269.8 million. This dividend was financed with net proceeds from a $170.0 million incremental term loan entered into by EVERTEC Group and an offering of $40.0 million of 11% senior notes due 2018, together with cash on hand. In addition, on December 18, 2012 we paid a special dividend to our stockholders and authorized an equitable adjustment to holders of vested options as discussed below in the aggregate amount of approximately $50.3 million. This dividend and equitable adjustment was financed primarily with cash on hand. In the case of stockholders who
37
Table of Contents
Index to Financial Statements
held restricted shares at the time of such dividend, the per share dividend amount was paid or is payable in accordance with the terms and conditions of the applicable restricted stock award agreement. The equitable adjustment was effective on December 18, 2012 and was paid (in the case of options that had vested at such time) or is payable as such options vest (in the case of options that were outstanding at such time but will vest in the future) in the form of a one-time cash bonus to holders of such options for shares of our common stock in the amount of $0.69 per share. In the case of options that had vested as of December 18, 2012, the equitable adjustment was paid on December 21, 2012 and in the case of unvested options will be paid in the future as the options vest, subject to our ability at such time to comply with our debt agreements and applicable law. We have not otherwise paid any dividends on our capital stock since the Merger.
We are a holding company and have no direct operations. We will only be able to pay dividends from our available cash on hand and funds received from our subsidiaries, Holdings and EVERTEC Group, whose ability to make any payments to us will depend upon many factors, including their operating results and cash flows. In addition, the senior secured credit facilities limit EVERTEC Group’s ability to pay distributions on its equity interests. See “Management’s Discussion and Analysis of Financial Condition and Results of Operations—Financial Obligations.”
Issuer Purchases of Equity Securities
| Period |
Total number of shares purchased |
Average price paid per share |
Total number of shares purchased as part of a publicly announced program |
Approximate dollar value of shares that may yet be purchased under the program |
||||||||||||
| 10/1/2013-12/31/2013 |
3,690,036 | $ | 20.325 | — | $ | — | ||||||||||
| 10/1/2014-12/31/2014 (1) |
1,146,870 | 21.798 | 1,146,870 | $ | 50,000,000 | |||||||||||
| 10/19/2014-11/19/2014 |
54,324 | 22.020 | — | $ | — | |||||||||||
|
|
|
|
|
|
|
|||||||||||
| Total |
4,891,230 | $ | 21.381 | 1,146,870 | ||||||||||||
|
|
|
|
|
|
|
|||||||||||
| (1) | On September 24, 2014, the Company announced a stock repurchase program authorizing the purchase of up to $75 million of the Company’s common stock over the next twelve months. |
Securities Authorized for Issuance Under Equity Compensation Plans
On September 30, 2010, the board of directors of Holdings adopted the 2010 Plan. Holdings reserved 5,843,208 shares of its Class B Non-Voting Common Stock for issuance upon exercise and grants of stock options, restricted stock and other equity awards under the Plan. On April 17, 2012, in connection with the Reorganization, the Company assumed the 2010 Plan and all of the outstanding equity awards issued thereunder or subject thereto. As a result, each of the then outstanding stock options to purchase shares of Holdings’ Class B Non-Voting Common Stock became a stock option to purchase the same number and class of shares of the Company’s Class B Non-Voting Common Stock, in each case on the same terms (including exercise price) as the original stock option. In connection with our initial public offering in April 2013, all of the outstanding shares of the Company’s Class B Non-Voting Common Stock and stock options to purchase shares of the Company’s Class B Non-Voting Common Stock were converted into and deemed exercisable for, respectively, shares of our common stock on a one-to-one basis. Similarly, each of the then outstanding shares of restricted stock of Holdings was converted into the same number of shares of restricted stock of the Company.
In connection with our initial public offering, we adopted the 2013 Plan and reserved 5,956,882 shares of our Common Stock for issuance upon exercise and grants of stock options, restricted stock and other equity awards. We have filed a Form S-8 under the Securities Act covering 12,089,382 shares of our common stock reserved for issuance under the Equity Plans and certain options and restricted stock granted outside of the Equity Plans but subject to the terms and conditions of the 2010 Plan.
38
Table of Contents
Index to Financial Statements
The following table summarizes equity compensation plans approved by security holders and equity compensation plans that were not approved by security holders as of December 31, 2014:
| Plan Category |
Number of securities to be issued upon exercise of outstanding options, warrants and rights (A) |
Weighted-average exercise price of outstanding options, warrants and rights (B) |
Number of securities remaining available for future issuance under equity compensation plans (excluding securities reflected in column (A)) (C) |
|||||||||
| Equity compensation plans approved by security holders |
N/A | N/A | N/A | |||||||||
| Equity compensation plans not approved by security holders |
316,000 | $ | 19.56 | 6,372,508 | ||||||||
Stock Performance Graph
The following Performance Graph shall not be deemed incorporated by reference and shall not constitute soliciting material or otherwise considered filed under the Securities Act of 1933 or the Exchange Act.
The following graph shows a comparison from April 12, 2013 (the date our common stock commenced trading on the NYSE) through December 31, 2014 of the cumulative total return for our common stock, the S&P 500 Index and the S&P Technology Index. The graph assumes that $100 was invested on April 12, 2013 in our common stock and each index and that all dividends were reinvested.
Note that historical stock price performance is not necessarily indicative of future stock price performance.
Comparison of twenty-one months cumulative total return of EVERTEC Inc.
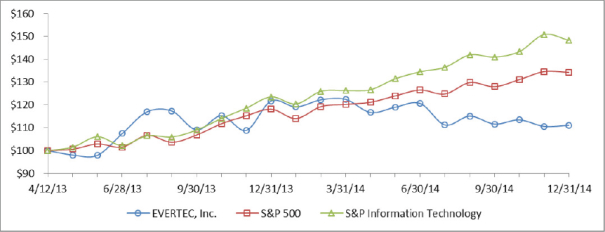
39
Table of Contents
Index to Financial Statements
Item 6. Selected Financial Data
The following table sets forth our selected historical consolidated and combined financial data as of the dates and for the periods indicated. The selected consolidated financial data as of and for the years ended December 31, 2014, 2013, 2012 and 2011 have been derived from the audited consolidated financial statements of EVERTEC (Successor), included in this Annual Report on Form 10-K. The selected historical consolidated financial data as of December 31, 2010, and for the three months ended December 31, 2010 have been derived from the audited consolidated financial statements of EVERTEC (Successor), not included in this Annual Report on Form 10-K. The selected historical combined financial data for the nine months ended September 30, 2010 have been derived from the audited combined financial statements of EVERTEC Business Group (Predecessor), not included in this Annual Report on Form 10-K.
The results of operations for any period are not necessarily indicative of the results to be expected for any future period and the historical consolidated and combined financial data presented below and elsewhere in this Annual Report on Form 10-K does not necessarily reflect what our financial position, results of operations and cash flows would have been had we operated as a separate stand-alone entity during the Predecessor period. The selected historical consolidated and combined financial data set forth below should be read in conjunction with, and are qualified by reference to, “Management’s Discussion and Analysis of Financial Condition and Results of Operations” and the consolidated financial statements and related notes thereto appearing elsewhere in this Annual Report on Form 10-K.
| Successor | Predecessor | |||||||||||||||||||||||
| Years ended December 31, | June 25, 2010 (inception) to December 31, 2010 |
Nine months ended September 30, 2010 |
||||||||||||||||||||||
| (Dollar amounts in thousands, except per share data) | 2014 | 2013 | 2012 | 2011 | ||||||||||||||||||||
| Statements of Income Data: |
||||||||||||||||||||||||
| Revenues: |
||||||||||||||||||||||||
| Merchant Aquiring, net |
$ | 79,136 | $ | 73,616 | $ | 69,591 | $ | 61,997 | $ |
14,789 |
|
$ | 39,761 | |||||||||||
| Payment Processing |
105,423 | 100,104 | 95,607 | 85,691 | 21,034 | 56,777 | ||||||||||||||||||
| Business Solutions |
176,570 | 184,297 | 177,292 | 173,434 | 46,586 | 118,482 | ||||||||||||||||||
|
|
|
|
|
|
|
|
|
|
|
|
|
|||||||||||||
| Total revenues |
361,129 | 358,017 | 342,490 | 321,122 | 82,409 | 215,020 | ||||||||||||||||||
| Operating costs and expenses |
||||||||||||||||||||||||
| Cost of revenues, exclusive of depreciation and amortization shown below |
156,517 | 163,080 | 159,666 | 155,377 | 41,839 | 113,246 | ||||||||||||||||||
| Selling, general and administrative expenses |
41,276 | 38,810 | 31,686 | 33,339 | 8,392 | 27,000 | ||||||||||||||||||
| Depreciation and amortization |
65,988 | 70,366 | 71,492 | 69,891 | 17,722 | 19,425 | ||||||||||||||||||
|
|
|
|
|
|
|
|
|
|
|
|
|
|||||||||||||
| Total operating costs and expenses |
263,781 | 272,256 | 262,844 | 258,607 | 67,953 | 159,671 | ||||||||||||||||||
|
|
|
|
|
|
|
|
|
|
|
|
|
|||||||||||||
| Income from operations |
97,348 | 85,761 | 79,646 | 62,515 | 14,456 | 55,349 | ||||||||||||||||||
| Interest income |
328 | 236 | 320 | 797 | 118 | 360 | ||||||||||||||||||
| Interest expense |
(26,081 | ) | (37,861 | ) | (54,331 | ) | (50,957 | ) | (13,436 | ) | (70 | ) | ||||||||||||
| Earnings of equity method investments |
1,140 | 935 | 564 | 833 | — | 2,270 | ||||||||||||||||||
| Other income (expenses) |
2,375 | (75,682 | ) | (8,491 | ) | (18,201 | ) | (36,164 | ) | 2,276 | ||||||||||||||
|
|
|
|
|
|
|
|
|
|
|
|
|
|||||||||||||
| Income (loss) before income taxes |
75,110 | (26,611 | ) | 17,708 | (5,013 | ) | (35,026 | ) | 60,185 | |||||||||||||||
| Income tax expense (benefit) |
7,578 | (1,990 | ) | (59,658 | ) | (29,227 | ) | (14,450 | ) | 23,017 | ||||||||||||||
|
|
|
|
|
|
|
|
|
|
|
|
|
|||||||||||||
| Net income (loss) from continuing operations |
67,532 | (24,621 | ) | 77,366 | 24,214 | (20,576 | ) | 37,168 | ||||||||||||||||
| Net income from discontinued operations |
— | — | — | — | — | 117 | ||||||||||||||||||
|
|
|
|
|
|
|
|
|
|
|
|
|
|||||||||||||
| Net income (loss) |
$ | 67,532 | $ | (24,621 | ) | $ | 77,366 | $ | 24,214 | $ | (20,576 | ) | $ | 37,285 | ||||||||||
|
|
|
|
|
|
|
|
|
|
|
|
|
|||||||||||||
| Net income (loss) per common share from continuing operations—basic |
$ | 0.86 | $ | (0.31 | ) | $ | 1.06 | $ | 0.33 | $ | (0.29 | ) | $ | 0.52 | ||||||||||
|
|
|
|
|
|
|
|
|
|
|
|
|
|||||||||||||
| Net income (loss) per common share from continuing operations—diluted |
$ | 0.86 | $ | (0.31 | ) | $ | 1.01 | $ | 0.33 | $ | (0.29 | ) | $ | 0.52 | ||||||||||
|
|
|
|
|
|
|
|
|
|
|
|
|
|||||||||||||
| Cash dividends declared per common share (1) |
$ | 0.40 | $ | 0.20 | $ | 4.39 | $ | — | $ | — | $ | — | ||||||||||||
|
|
|
|
|
|
|
|
|
|
|
|
|
|||||||||||||
40
Table of Contents
Index to Financial Statements
| Successor | Predecessor | |||||||||||||||||||||
| Years ended December 31, | June 25, 2010 (inception) to December 31, 2010 |
Nine months ended September 30, 2010 | ||||||||||||||||||||
| (Dollar amounts in thousands, except per share data) | 2014 | 2013 | 2012 | 2011 | ||||||||||||||||||
| Balance Sheet Data (at period end): |
||||||||||||||||||||||
| Cash |
$ | 32,114 | $ | 22,485 | $ | 25,634 | $ | 56,200 | $ | 55,199 | ||||||||||||
| Total assets |
890,235 | 921,311 | 977,745 | 1,046,860 | 1,092,179 | |||||||||||||||||
| Total long-term liabilities |
666,151 | 686,225 | 758,395 | 615,713 | 673,736 | |||||||||||||||||
| Total debt |
693,912 | 735,880 | 763,756 | 523,833 | 562,173 | |||||||||||||||||
| Total equity |
119,573 | 111,330 | 122,455 | 366,176 | 339,613 | |||||||||||||||||
| (1) | Adjusted to reflect the two for one stock split effective April 1, 2013. |
41
Table of Contents
Index to Financial Statements
Item 7. Management’s Discussion and Analysis of Financial Condition and Results of Operations
The following Management’s Discussion and Analysis of Financial Condition and Results of Operations (“MD&A”) covers: (i) the results of operations for the years ended December 31, 2014, 2013 and 2012; and (ii) the financial condition as of December 31, 2014 and 2013. See Note 1 of the Notes to Audited Consolidated Financial Statements for additional information about the Company and the basis of presentation of our financial statements. You should read the following discussion and analysis in conjunction with the financial statements and related notes appearing elsewhere herein. This MD&A contains forward-looking statements that involve risks and uncertainties. Our actual results may differ from those indicated in the forward-looking statements. See “Forward-Looking Statements” for a discussion of the risks, uncertainties and assumptions associated with these statements.
Overview
EVERTEC is the leading full-service transaction processing business in Latin America, providing a broad range of merchant acquiring, payment processing and business process management services. According to the July 2014 Nilson Report, we are the largest merchant acquirer in the Caribbean and Central America and one of the largest in Latin America, based on total number of transactions. We serve 19 countries in the region from our base in Puerto Rico. We manage a system of electronic payment networks that process more than two billion transactions annually, and offer a comprehensive suite of services for core bank processing, cash processing and technology outsourcing. In addition, we own and operate the ATH network, one of the leading personal identification number (“PIN”) debit networks in Latin America. We serve a diversified customer base of leading financial institutions, merchants, corporations and government agencies with “mission-critical” technology solutions that enable them to issue, process and accept transactions securely. We believe our business is well-positioned to continue to expand across the fast-growing Latin American region.
We are differentiated, in part, by our diversified business model, which enables us to provide our varied customer base with a broad range of transaction-processing services from a single source across numerous channels and geographic markets. We believe this single-source capability provides several competitive advantages that will enable us to continue to penetrate our existing customer base with complementary new services, win new customers, develop new sales channels and enter new markets. We believe these competitive advantages include:
| • | Our ability to provide in one package a range of services that traditionally had to be sourced from different vendors; |
| • | Our ability to serve customers with disparate operations in several geographies with a single integrated technology solution that enables them to manage their business as one enterprise; and |
| • | Our ability to capture and analyze data across the transaction processing value chain and use that data to provide value-added services that are differentiated from those offered by pure-play vendors that serve only one portion of the transaction processing value chain (such as only merchant acquiring or payment processing). |
Our broad suite of services spans the entire transaction processing value chain and includes a range of front-end customer-facing solutions such as the electronic capture and authorization of transactions at the point-of-sale, as well as back-end support services such as the clearing and settlement of transactions and account reconciliation for card issuers. These include: (i) merchant acquiring services, which enable point of sales (“POS”) and e-commerce merchants to accept and process electronic methods of payment such as debit, credit, prepaid and electronic benefit transfer (“EBT”) cards; (ii) payment processing services, which enable financial institutions and other issuers to manage, support and facilitate the processing for credit, debit, prepaid, automated teller machines (“ATM”) and EBT card programs; and (iii) business process management solutions, which provide “mission-critical” technology solutions such as core bank processing, as well as IT outsourcing and cash
42
Table of Contents
Index to Financial Statements
management services to financial institutions, corporations and governments. We provide these services through a highly scalable, end-to-end technology platform that we manage and operate in-house and that generates significant operating efficiencies that enable us to maximize profitability.
We sell and distribute our services primarily through a proprietary direct sales force with strong customer relationships. We are also building a variety of indirect sales channels that enable us to leverage the distribution capabilities of partners in adjacent markets, including value-added resellers. And we continue to pursue joint ventures and merchant acquiring alliances.
We benefit from an attractive business model, the hallmarks of which are recurring revenue, scalability, significant operating margins and low capital expenditure requirements. Our revenue is recurring in nature because of the mission-critical and embedded nature of the services we provide, the high switching costs associated with these services and the multi-year contracts we negotiate with our customers. Our business model enables us to continue to grow our business organically without significant additional capital expenditures.
Separation from and Key Relationship with Popular
Prior to the Merger on September 30, 2010, EVERTEC Group was 100% owned by Popular, the largest financial institution in the Caribbean, and operated substantially as an independent entity within Popular. After the consummation of the Merger, Popular retained an approximately 49% indirect ownership interest in EVERTEC Group and is our largest customer. In connection with, and upon consummation of, the Merger, EVERTEC Group entered into a 15-year Master Services Agreement, and several related agreements with Popular. Under the terms of the Master Services Agreement, Popular agreed to continue to use EVERTEC services on an ongoing exclusive basis, for the duration of the agreement, on commercial terms consistent with those of our historical relationship. Additionally, Popular granted us a right of first refusal on the development of certain new financial technology products and services for the duration of the Master Services Agreement. As of December 31, 2014, Popular retained a 15% interest in EVERTEC.
2014 Developments
On February 12, 2014, our Board approved a regular quarterly cash dividend of $0.10 per common share, paid on March 14, 2014 to stockholders of record at the close of business on February 25, 2014.
On May 7, 2014, our Board approved a regular quarterly cash dividend of $0.10 per common share, paid on June 6, 2014 to stockholders of record at the close of business on May 19, 2014.
On August 6, 2014, our Board approved a regular quarterly cash dividend of $0.10 per common share, paid on September 5, 2014 to stockholders of record at the close of business on August 18, 2014.
On September 24, 2014, the Company announced that its Board had approved a stock repurchase program that authorizes repurchases of up to $75 million of its common stock over the next twelve months.
On November 5, 2014, our Board approved a regular quarterly cash dividend of $0.10 per common share, paid on December 5, 2014 to stockholders of record at the close of business on November 17, 2014.
For additional information regarding these events, see Note 13 of the Notes to Audited Consolidated Financial Statements.
43
Table of Contents
Index to Financial Statements
Factors and Trends Affecting the Results of Our Operations
The ongoing migration from cash and paper methods of payment to electronic payments continues to benefit the transaction- processing industry globally. We believe that the penetration of electronic payments in the markets in which we operate is significantly lower relative to the U.S. market, and that this ongoing shift will continue to generate substantial growth opportunities for our business. For example, currently the adoption of banking products, including electronic payments, in the Latin American and Caribbean region is lower relative to the mature U.S. and European markets. We believe that the unbanked and underbanked population in our markets will continue to shrink, and therefore drive incremental penetration and growth of electronic payments in Puerto Rico and other Latin American regions. We also benefit from the trend for financial institutions and government agencies to outsource technology systems and processes. Many medium- and small-size institutions in the Latin American markets in which we operate have outdated computer systems and updating these IT legacy systems is financially and logistically challenging. We believe that our technology and business outsourcing solutions cater to the evolving needs of the financial institution customer base we target, providing integrated, open, flexible, customer-centric and efficient IT products and services.
We also expect our results of operations to be affected by regulatory changes that will occur as the payments industry has come under increased scrutiny from lawmakers and regulators. The Dodd-Frank Wall Street Reform and Consumer Protection Act of 2010 (the Dodd-Frank Act) signed into law in July 2010 is an example of changes in laws and regulations that could affect our operating results and financial condition.
Finally, our financial condition and results of operations are, in part, dependent on the economic and general conditions of the geographies in which we operate.
Critical Accounting Estimates
Our consolidated financial statements are prepared in accordance with GAAP. In connection with the preparation of our financial statements, we are required to make estimates and assumptions about future events, and apply judgments that affect the reported amounts of certain assets and liabilities, and in some instances, the reported amounts of revenues and expenses during the period.
We base our assumptions, estimates, and judgments on historical experience, current events and other factors that management believes to be relevant at the time our consolidated financial statements are prepared. However, because future events are inherently uncertain and their effects cannot be determined with certainty, actual results could differ from our assumptions and estimates, and such differences could be material. A summary of significant accounting policies is included in Note 1 of the Notes to Audited Consolidated Financial Statements appearing elsewhere in this Annual Report on Form 10-K. We believe that the following accounting estimates are the most critical; require the most difficult, subjective or complex judgments; and thus result in estimates that are inherently uncertain.
Revenue recognition
The Company’s revenue recognition policy follows the guidance from Accounting Standards Codification (“ASC”) 605 “Revenue Recognition”; ASC 605-25, “Revenue Recognition-Multiple Element Arrangements”; Accounting Standard Update (“ASU”) 2009-13, “Multiple-Deliverable Revenue Arrangements,” and; ASC 985, “Software,” which provided guidance on the recognition, presentation, and disclosure of revenue in financial statements. The Company recognizes revenue when the following four criteria are met: (i) evidence of an agreement exists, (ii) delivery and acceptance has occurred or services have been rendered, (iii) the selling price is fixed or determinable, and (iv) collection of the selling price is reasonably assured.
For multiple deliverable arrangements, we evaluate each distinct arrangement to determine if the elements or deliverables within the arrangement represent separate units of accounting pursuant to ASC 605-25. If the deliverables are determined to be separate units of accounting, revenues are recognized as units of accounting are
44
Table of Contents
Index to Financial Statements
delivered and the revenue recognition criteria are met. If the deliverables are not determined to be separate units of accounting, revenues for the delivered services are combined into one unit of accounting and recognized (i) over the life of the arrangement if all services are consistently delivered over such term, or if otherwise, (ii) at the time that all services and deliverables have been delivered. The selling price for each deliverable is based on vendor-specific objective evidence (VSOE), if available; on third-party evidence (TPE) if VSOE is not available; or on management’s best estimate of selling price (BESP) if neither VSOE nor TPE is available. We establish VSOE of selling price using the price charged when the same element is sold separately. We bifurcate or allocate the arrangement consideration to each of the deliverables based on the relative selling price of each unit of accounting.
We have two main categories of revenues according to the type of transactions we enter into with our customers: (a) transaction-based fees and (b) fixed fees and time and material.
Transaction-based fees
We provide services that generate transaction-based fees. Typically transaction-based fees depend on factors such as number of accounts or transactions processed. These factors typically consist of a fee per transaction or item processed, a percentage of dollar volume processed, a fee per account on file, or some combination thereof. Revenues derived from the transaction-based fee contracts is recognized when the underlying transaction is processed, which constitutes delivery of service.
Revenues from business contracts in our merchant acquiring segment comprise discounted fees charged to the merchants based on the sales amount of transactions processed. Revenues include a discount fee, membership fees charged to merchants, debit network fees, and POS rental fees. Pursuant to the guidance from ASC 605-45-45, “Revenue Recognition—Principal Agent Considerations,” we record merchant acquiring revenues net of interchange and assessments charged by the credit and debit card network associations and we recognize such revenues at the time of the sale (when a transaction is processed).
Payment processing comprises revenues related to providing financial institutions access to the ATH network and other card networks, and related services. Payment processing revenues also include revenues from card issuer processing services (such as credit and debit card processing, authorization and settlement, and fraud monitoring and control to debit or credit card issuers); payment processing services (such as payment and billing products for merchants, businesses and financial institutions); and EBT (which mostly consists of services to the Puerto Rico government for the delivery of government benefits to participants). Revenues in our payment processing segment are mostly comprised of fees per transaction processed or per account on file, or a combination of both; this revenue is recognized at the time transactions are processed or on a monthly basis for accounts on file.
Business solutions revenues consist of transaction-based fees from business process management solutions including core bank processing, business process outsourcing, item and cash processing, and fulfillment. Transaction-based fee revenues generated by our core bank processing services are derived from fees based on various factors such as the number of accounts on file (e.g., savings or checking accounts, loans, etc.), and the number of transactions processed or registered users (e.g., for online banking services). For services dependent on the number of transactions processed, revenues are recognized as the underlying transactions are processed. For services dependent on the number of users or accounts on file, revenues are recognized on a monthly basis based on the number of accounts on file each month. Item and cash processing revenues are based on the number of items (e.g. checks) processed, and revenues are recognized when the underlying item is processed. Fulfillment services include technical and operational resources for producing and distributing variable print documents such as statements, bills, checks and benefits summaries. Fulfillment revenues are based on the number pages for printing services and number of envelopes processed for mailing services. Revenues are recognized as services are delivered based on a fee per page printed or envelope mailed, as applicable.
45
Table of Contents
Index to Financial Statements
Fixed fees and time and material
We also provide services that generate a fixed fee per month or fees based on time and expenses incurred. These services are mostly provided in our business solutions segment. Revenues are generated from our core bank solutions, network hosting and management and IT consulting services.
In core bank solutions, we mostly provide access to applications and services such as back-up or recovery, hosting and maintenance that enable a bank to operate the related hosted services accessing our IT infrastructure. These contracts generally contain multiple elements or deliverables evaluated by us. Revenues are recognized according to the applicable guidance. Revenues are derived from fixed fees charged for the use of hosted services and are recognized on a monthly basis as delivered. Set-up fees are billed to the customer when the service is rendered; however, they are deferred and recognized as revenues over the term of the arrangement or the expected period of the customer relationship, whichever is longer, as set-up services rarely provide value to the customer on a stand-alone basis and are interrelated with the service to be provided under the contract.
In network hosting and management, we provide hosting services for network infrastructure at our facilities; automated monitoring services; maintenance of call centers; interactive voice response solutions, among other related services. Revenues are derived mainly from monthly fees as services are delivered. Set-up fees are billed up-front to the customer when the set-up service is rendered; however, they are deferred and recognized as revenues over the term of the arrangement or the expected period of the customer relationship, whichever is longer, as set-up services rarely provide value to the customer on a stand-alone basis and are interrelated with the service under the contract. Some arrangements under this line of service category may contain undelivered elements. In such cases, the undelivered elements are evaluated and recognized when the services are delivered or at the time that all deliverables under the contract have been delivered.
IT consulting services revenue consist mostly of time billings based on the number of hours dedicated to each client. Revenue from time billings is recognized as services are delivered.
We also charge members of the ATH network an annual membership fee; however, these fees are deferred and recognized as revenues on a straight-line basis over the year and recorded in our payment processing segment. In addition, occasionally we are a reseller of hardware and software products and revenues from these resale transactions are recognized when such product is delivered and accepted by client.
Service-level arrangements
The Company’s service contracts may include service level arrangements (SLA) generally allowing the customer to receive a credit for part of the service fee when the Company has not provided the agreed level of services. The SLA performance obligation is committed on a monthly basis; thus SLA performance is monitored and assessed for compliance with arrangements on a monthly basis, including determination and accounting for its economic impact, if any.
Goodwill and other intangible assets
Goodwill represents the excess of the purchase price and related costs over the value assigned to net assets acquired. Goodwill is not amortized, but is tested for impairment at least annually.
For 2014, we used a “qualitative assessment” option or “step zero” for the goodwill impairment test for all of its reporting units. With this process, we first assesses whether it is “more likely than not” that the fair value of a reporting unit is less than its carrying amount. If the answer is no, then the fair value of the reporting unit does not need to be measured, and step one and step two, as explained below, are bypassed. In assessing the fair value of a reporting unit, which is based on the nature of the business and reporting unit’s current and expected financial performance, we use a combination of factors such as industry and market conditions, overall financial performance and the entity and reporting unit specific events.
46
Table of Contents
Index to Financial Statements
In the past, the goodwill impairment test used was a two-step process at each reporting unit level. The first step used to identify potential impairment, compared the fair value of a reporting unit with its carrying amount, including goodwill. If the fair value of a reporting unit exceeded its carrying amount, goodwill of the reporting unit was not considered impaired and the second step of the impairment test was unnecessary. If needed, the second step consisted of comparing the implied fair value of the reporting unit with the carrying amount of that goodwill.
Other identifiable intangible assets with a definitive useful life are amortized using the straight-line method. These intangibles are evaluated periodically for impairment when events or changes in circumstances indicate that the carrying amount may not be recoverable.
Other identifiable intangible assets with a definitive useful life acquired in the Merger, include customer relationship, trademark, software packages and non-compete agreement. Customer relationship was valued using the excess earnings method under the income approach. Trademark was valued using the relief-from-royalty method under the income approach. Software packages, which include capitalized software development costs, were recorded at cost. Non-compete agreement was valued based on the estimated impact that theoretical competition would have on revenues and expenses.
Share-based compensation
Awards granted by EVERTEC Group’s ultimate parent company, EVERTEC, Inc., to employees of EVERTEC Group are accounted for in EVERTEC Group’s financial statements in accordance with ASC 718, which establish that awards of the parent company that are granted to employees of its consolidated subsidiary are accounted for in the separate financial statement of the subsidiary. Accordingly, the subsidiary would recognize compensation cost for the parent company awards and the offsetting entry is considered a capital contribution from the parent company. Stock options and restricted stock granted by EVERTEC, Inc. under the Equity Incentive Plans are expensed over the vesting period based on the fair value at the date the awards are granted. In accordance with applicable accounting guidance for stock-based compensation, compensation cost recognized includes the cost for all share-based awards based on the fair value of awards at the date granted.
We estimate the fair value of stock-based awards, on a contemporaneous basis, at the date they are granted using the Black-Sholes-Merton option pricing model for Tranche A options and the Monte Carlo simulation analysis for Tranche B and Tranche C options using the following assumptions: (1) stock price; (2) risk-free rate; (3) expected volatility; (4) expected annual dividend yield and (5) expected term. The risk-free rate is based on the U.S. Constant Maturities Treasury Interest Rate as of the grant date. The expected volatility is based on a combination of historical volatility and implied volatility from publicly traded companies in our industry. The expected annual dividend yield is based on management’s expectations of future dividends as of the grant date. The expected term for stock options granted under the 2010 Plan was based on the vesting time of the options. For the stock options granted under the 2013 Plan, the simplified method was used to estimate the expected term.
Upon option exercise, participants may elect to “net share settle”. Rather than requiring the participant to deliver cash to satisfy the exercise price and statutory minimum tax withholdings, we withhold a sufficient number of shares to cover these amounts and deliver the net shares to the participant. We recognize the associated tax withholding obligation as a reduction of additional paid-in capital. As compensation expense is recognized, a deferred tax asset is established. At the time stock options are exercised, a current tax deduction arises based on the value at the time of exercise. This deduction may exceed the associated deferred tax asset, resulting in a “windfall tax benefit”. The windfall is recognized in the consolidated balance sheet as an increase to additional paid-in capital, and is included in the consolidated statement of cash flows as a financing inflow.
In determining the amount of cash tax savings realized from the excess share-based compensation deductions, we follow the tax law ordering approach. Under this approach, the use of excess tax deductions associated with share-based awards is dictated by provision in the tax law that identify the sequence in which such benefits are utilized for tax purposes.
47
Table of Contents
Index to Financial Statements
See Note 14 of the Notes to Audited Consolidated Financial Statements appearing elsewhere in this Annual Report on Form 10-K for details regarding the Company’s share-based compensation.
Income Tax
Income taxes are accounted for under the asset and liability method. Deferred tax assets and liabilities are recognized for the future tax consequences attributable to differences between the financial statement carrying amounts of existing assets and liabilities and their respective tax bases and operating loss and tax credit carryforwards. Deferred tax assets and liabilities are measured using enacted tax rates expected to apply to taxable income in the years in which those temporary differences are expected to be recovered or settled. The effect on deferred tax assets and liabilities of a change in tax rates is recognized in the consolidated statements of income and comprehensive income in the period that includes the enactment date. We recognize the effect of income tax positions only if those positions are more likely than not to be sustained. Recognized income tax positions are measured at the largest amount that is greater than 50% likely to be realized. Changes in recognition or measurement are reflected in the period in which the change in judgment occurs. A deferred tax valuation allowance is established if it is considered more likely than not that all or a portion of the deferred tax asset will not be realized.
All companies within EVERTEC are legal entities which file separate income tax returns.
See Note 17 of the Notes to Audited Consolidated Financial Statements appearing elsewhere in this Annual Report on Form 10-K for details regarding the Company’s income taxes.
JOBS Act
We qualified as an “emerging growth company,” as such term is defined in the JOBS Act, which was signed into law on April 5, 2012, until December 31, 2013. As of December 31, 2014, the Company is considered a large accelerated filer and no longer qualifies for the reduced reporting requirements of the JOBS Act.
Recent Accounting Pronouncements
For a description of recent accounting standards, see Note 2 of the Notes to Audited Consolidated Financial Statements included in this Annual Report on Form 10-K.
Non-GAAP Financial Measures
EBITDA, Adjusted EBITDA, Adjusted Net Income and Adjusted Net Income per common share, as presented in this Annual Report on Form 10-K, are supplemental measures of our performance that are not required by, or presented in accordance with GAAP. They are not measurements of our financial performance under GAAP and should not be considered as alternatives to total revenues, net income or any other performance measures derived in accordance with GAAP or as alternatives to cash flows from operating activities as measures of our liquidity.
For more information regarding EBITDA, Adjusted EBITDA, Adjusted Net Income and Adjusted Net Income per common share, including a quantitative reconciliation of EBITDA, Adjusted EBITDA, Adjusted Net Income and Adjusted Net Income per common share to the most directly comparable GAAP financial performance measure, which is net income, see “—Net Income Reconciliation to EBITDA, Adjusted EBITDA, Adjusted Net Income and Adjusted Net Income per common share” and “—Covenant Compliance” below.
48
Table of Contents
Index to Financial Statements
Overview of Results of Operations
The following briefly describes the components of revenues and expenses as presented in the Consolidated Statements of Income (Loss) and Comprehensive Income (Loss). Descriptions of the revenue recognition policies are detailed in Note 1 of the Notes to Audited Consolidated Financial Statements included in this Annual Report on Form 10-K.
Merchant Acquiring, net. Merchant Acquiring revenue consists of income from services that allow merchants to accept electronic methods of payment. Our standard merchant contract has an initial term of one or three years, with automatic one-year renewal periods. In the Merchant Acquiring segment, sources of revenue include a discount fee (generally a percentage of the sales amount of a credit or debit card transaction value) and membership fees charged to merchants, debit network fees and rental income from POS devices and other equipment, net of credit card interchange and assessment fees charged by credit card associations (such as VISA or MasterCard) or payment networks.
Payment Processing. Payment Processing revenue comprises income related to providing financial institutions access to the ATH network and other card networks, including related services such as authorization, processing, management and recording of ATM and POS transactions, and ATM management and monitoring. Payment Processing revenue also includes income from card processing services for debit or credit issuers, such as credit and debit card processing, authorization and settlement and fraud monitoring and control services; payment processing services such as payment and billing products for merchants, businesses and financial institutions; and EBT, which principally consists of services to the Puerto Rico government for the delivery of government benefits to participants. Payment products include electronic check processing, automated clearing house (“ACH”), lockbox, interactive voice response and web-based payments through personalized websites, among others.
We generally enter into one to five year contracts with our private payment processing clients and one year contracts with our government payment processing clients. For ATH network and processing services, revenue is driven mainly by the number of transactions processed. Revenue is derived mainly from network fees, transaction switching and processing fees, and leasing of POS devices. For card issuer processing, revenue is dependent mostly upon the number of cardholder accounts on file, transactions and authorizations processed, the number of cards embossed and other processing services. For EBT services, revenue is derived mainly from the number of beneficiaries on file.
Business Solutions. Business Solutions revenue consists of income from a full suite of business process management solutions including core bank processing, network hosting and management, IT consulting services, business process outsourcing, item and cash processing, and fulfillment. We generally enter into one to five year contracts with our private Business Solutions clients and one year contracts with our government Business Solutions clients.
In addition, we are a reseller of hardware and software products; these resale transactions are generally one-time transactions. Revenue from sales of hardware or software products is recognized once the following four criteria are met: (i) evidence of an agreement exists, (ii) delivery and acceptance has occurred or services have been rendered, (iii) the selling price is fixed or determinable, and (iv) collection of the selling price is reasonably assured or probable, as applicable.
Cost of revenues. This caption includes the costs directly associated with providing services to customers, as well as, product and software sales, including software licensing and maintenance costs; telecommunications costs; personnel and infrastructure costs to develop and maintain applications, operate computer networks and provide associated customer support; and other operating expenses.
Selling, general and administrative. This caption consists mainly of salaries, wages and related expenses paid to sales personnel, administrative employees and management, advertising and promotional costs, audit and legal fees, and other selling expenses.
49
Table of Contents
Index to Financial Statements
Depreciation and amortization. This caption consists of our depreciation and amortization expense. Following the completion of the Merger, our depreciation and amortization expense increased as a result of the purchase price allocation adjustments to reflect the fair market value and revised useful life assigned to property and equipment and intangible assets in connection with the Merger.
Results of Operations
The following tables set forth certain consolidated financial information for the years ended December 31, 2014, 2013 and 2012. These tables and the related discussion should be read in conjunction with the information contained in our Audited Consolidated Financial Statements and the notes thereto included elsewhere in this Annual Report on Form 10-K.
Certain prior period balances have been reclassified to conform to the current presentation format which did not have any impact on net income.
Comparison of the years ended December 31, 2014 and 2013
The following tables present the components of our audited consolidated statements of income (loss) and comprehensive income (loss) by business segment and the change in those amounts for the years ended December 31, 2014 and 2013.
Revenues
| Years ended December 31, | ||||||||||||||||
| (Dollar amounts in thousands) | 2014 | 2013 | Variance | |||||||||||||
| Merchant Acquiring, net |
$ | 79,136 | $ | 73,616 | $ | 5,520 | 7 | % | ||||||||
| Payment Processing |
105,423 | 100,104 | 5,319 | 5 | % | |||||||||||
| Business Solutions |
176,570 | 184,297 | (7,727 | ) | -4 | % | ||||||||||
|
|
|
|
|
|
|
|
|
|||||||||
| Total revenues |
$ | 361,129 | $ | 358,017 | $ | 3,112 | 1 | % | ||||||||
|
|
|
|
|
|
|
|
|
|||||||||
Total revenues for the year ended December 31, 2014 were $361.1 million, an increase of $3.1 million or 1% compared with 2013.
Merchant Acquiring revenues increased $5.5 million or 7% compared with 2013. The revenue growth was primarily the result of an increase in transaction volumes of 19.44 million.
Payment Processing revenues grew $5.3 million or 5% compared with 2013. Revenue growth was driven mainly by an increase of $3.0 million in our card products business resulting from higher accounts on file due to new customer additions in our Latin America operations and by an increase in ATH and POS network and processing transactions.
Business solutions revenues decreased $7.7 million or 4% compared with 2013. The decrease is almost entirely attributable to a decline in hardware and software sales of $10.3 million, partially offset by an increase in demand for core banking and other services of $2.7 million.
50
Table of Contents
Index to Financial Statements
Operating costs and expenses
| Years ended December 31, | ||||||||||||||||
| (Dollar amounts in thousands) | 2014 | 2013 | Variance | |||||||||||||
| Cost of revenues, exclusive of depreciation and amortization shown below |
$ | 156,517 | $ | 163,080 | $ | (6,563 | ) | -4 | % | |||||||
| Selling, general and administrative expenses |
41,276 | 38,810 | 2,466 | 6 | % | |||||||||||
| Depreciation and amortization |
65,988 | 70,366 | (4,378 | ) | -6 | % | ||||||||||
|
|
|
|
|
|
|
|
|
|||||||||
| Total operating costs and expenses |
$ | 263,781 | $ | 272,256 | $ | (8,475 | ) | -3 | % | |||||||
|
|
|
|
|
|
|
|
|
|||||||||
Total operating costs and expenses for the year ended December 31, 2014 were $263.8 million, a decrease of $8.5 million or 3% compared with 2013.
Cost of revenues decreased $6.6 million or 4% compared with 2013. The decrease was due mainly to lower cost of sales incurred as a result of the aforementioned decrease in hardware and software sales, partially offset by higher software and equipment maintenance.
Selling, general and administrative expenses increased $2.5 million or 6% compared with 2013. The increase was due mainly to non-recurring expenses included in 2014 of $7.9 million associated to the CEO sucession and acceleration of vesting of certain stock options, and a $1.1 million in professional expenses related to the debt offering that was withdrawn. These increase was partially offset by $3.1 million non-cash charge taken in connection with the vesting of all Tranche B and C stock options and a $2.7 million of one time expenses related to the secondary offerings completed in 2013.
Depreciation and amortization expense decreased by $4.4 million or 6% compared with 2013. The decrease resulted from lower amortization of software packages that became fully depreciated.
Income from operations
The following table presents income from operations by reportable segments.
| Years ended December 31, | ||||||||||||||||
| (Dollar amounts in thousands) | 2014 | 2013 | Variance | |||||||||||||
| Segment income from operations |
||||||||||||||||
| Merchant Acquiring, net |
$ | 34,348 | $ | 35,376 | $ | (1,028 | ) | -3 | % | |||||||
| Payment Processing |
59,882 | 54,429 | 5,453 | 10 | % | |||||||||||
| Business Solutions |
47,587 | 42,430 | 5,157 | 12 | % | |||||||||||
|
|
|
|
|
|
|
|
|
|||||||||
| Total segment income from operations |
141,817 | 132,235 | 9,582 | 7 | % | |||||||||||
| Merger related depreciation and amortization and other unallocated expenses (1) |
(44,469 | ) | (46,474 | ) | 2,005 | 4 | % | |||||||||
|
|
|
|
|
|
|
|
|
|||||||||
| Income from operations |
$ | 97,348 | $ | 85,761 | $ | 11,587 | 14 | % | ||||||||
|
|
|
|
|
|
|
|
|
|||||||||
| (1) | Primarily represents non-operating depreciation and amortization expenses generated as a result of the Merger and certain non-recurring fees and expenses. |
Income from operations increased $11.6 million or 14% compared with 2013. The increase in income from operations was the result of the aforementioned factors affecting revenues and operating costs and expenses.
See Note 21 of the Notes to Audited Consolidated Financial Statements included in this Annual Report on Form 10-K for additional information on the Company’s reportable segments and for a reconciliation of income from operations to net income (loss).
51
Table of Contents
Index to Financial Statements
Non-operating (expenses) income
| Years ended December 31, | ||||||||||||||||
| (Dollar amounts in thousands) | 2014 | 2013 | Variance | |||||||||||||
| Non-operating (expenses) income |
||||||||||||||||
| Interest income |
$ | 328 | $ | 236 | $ | 92 | 39 | % | ||||||||
| Interest expense |
(26,081 | ) | (37,861 | ) | 11,780 | 31 | % | |||||||||
| Earnings of equity method investment |
1,140 | 935 | 205 | 22 | % | |||||||||||
| Other income (expenses) |
2,375 | (75,682 | ) | 78,057 | 103 | % | ||||||||||
|
|
|
|
|
|
|
|
|
|||||||||
| Total non-operating expenses |
$ | (22,238 | ) | $ | (112,372 | ) | $ | 90,134 | 80 | % | ||||||
|
|
|
|
|
|
|
|
|
|||||||||
Total non-operating expenses decreased $90.1 million compared with 2013. The decrease was primarily due to other income (expenses) in 2013 related to a $58.5 million charge associated with the extinguishment of debt and a $16.7 million expense related to the termination of our Consulting Agreements with Apollo and Popular. In addition, there was a decrease in interest expense of $11.8 million as a result of the debt refinancing transaction completed during the second quarter of 2013.
For additional information related to the extinguishment of debt and associated loss, see Note 11 of the Notes to Audited Consolidated Financial Statements included in this Annual Report on Form 10-K.
Income tax expense (benefit)
Income tax expense for the year ended December 31, 2014 amounted to approximately $7.5 million compared with an income tax benefit of $2.0 million in 2013. The income tax expense for 2014 is a result of taxable income, while the prior year benefit was attributable to a taxable loss as a result of higher non-operating expenses related to the extinguishment of debt, the termination of the consulting agreements, and the vesting of all Tranche B and C stock options and expenses related to the secondary offerings.
See Note 17 of the Notes to Audited Consolidated Financial Statements included in this Annual Report on Form 10-K for additional information regarding income taxes.
Comparison of the years ended December 31, 2013 and 2012
The following tables present the components of our audited consolidated statements of income (loss) and comprehensive income (loss) by business segment and the change in those amounts for the years ended December 31, 2013 and 2012.
Revenues
| Years ended December 31, | ||||||||||||||||
| (Dollar amounts in thousands) | 2013 | 2012 | Variance | |||||||||||||
| Merchant Acquiring, net |
$ | 73,616 | $ | 69,591 | $ | 4,025 | 6 | % | ||||||||
| Payment Processing |
100,104 | 95,607 | 4,497 | 5 | % | |||||||||||
| Business Solutions |
184,297 | 177,292 | 7,005 | 4 | % | |||||||||||
|
|
|
|
|
|
|
|
|
|||||||||
| Total revenues |
$ | 358,017 | $ | 342,490 | $ | 15,527 | 5 | % | ||||||||
|
|
|
|
|
|
|
|
|
|||||||||
Total revenues for the year ended December 31, 2013 were $358.0 million, an increase of $15.5 million or 5% compared with 2012.
52
Table of Contents
Index to Financial Statements
Merchant acquiring revenues increased $4.0 million or 6% compared with 2012 due to an increase in the number of transactions of 14.3 million and an increase in sales volume of $450.2 million. This increase was partially offset by certain one-time effects related to the Durbin Amendment during the first half of 2013.
Payment processing revenues grew $4.5 million or 5% compared with 2012, mainly because of an increase of $3.3 million in ATH network and POS processing transactions and an increase of $2.8 million in accounts on file within our card products business, partially offset by the year-over-year impact of $1.9 million of non-recurring increases in other processing services during 2012.
Business solutions revenues increased $7.0 million or 4% compared with 2012. The growth in business solutions revenues during 2013 was mostly due to $5.5 million in higher demand for our network product and services and $1.6 million in higher demand for our core banking products and services.
Operating costs and expenses
| Years ended December 31, | ||||||||||||||||
| (Dollar amounts in thousands) | 2013 | 2012 | Variance | |||||||||||||
| Cost of revenues, exclusive of depreciation and amortization shown below |
$ | 163,080 | $ | 159,666 | $ | 3,414 | 2 | % | ||||||||
| Selling, general and administrative expenses |
38,810 | 31,686 | 7,124 | 22 | % | |||||||||||
| Depreciation and amortization |
70,366 | 71,492 | (1,126 | ) | -2 | % | ||||||||||
|
|
|
|
|
|
|
|
|
|||||||||
| Total operating costs and expenses |
$ | 272,256 | $ | 262,844 | $ | 9,412 | 4 | % | ||||||||
|
|
|
|
|
|
|
|
|
|||||||||
Total operating costs and expenses for the year ended December 31, 2013 were $272.3 million, an increase of $9.4 million or 4% compared with 2012.
Cost of revenues increased $3.4 million or 2% compared with 2012 mainly because of a $5.3 million increase in product sales within our business solutions segment and a non-cash compensation expense of $1.8 million related to the vesting of all Tranche B and C stock options. Partially offsetting these increases were a $2.1 million decrease in professional services and a reduction in other operating expenses of $2.2 million mostly related to a non-cash asset write-off in 2012. Gross margin percentage for the year ended December 31, 2013 improved 101 basis points to 54.6% from 53.5% in 2012.
Selling, general and administrative expenses increased $7.1 million or 22% compared with 2012. The increase was mainly due to a $3.1 million non-cash charge taken in connection with the vesting of all Tranche B and C stock options, $2.7 million of one-time expenses related to the secondary offerings completed in the third and fourth quarters of 2013, and $1.1 million in payroll taxes associated with the cashless exercise of stock options.
Depreciation and amortization expense decreased by $1.1 million or 2% compared with 2012. The decrease in depreciation and amortization expense was mostly a result of lower amortization expense associated with software packages.
53
Table of Contents
Index to Financial Statements
Income from operations
The following table presents income from operations by reportable segments.
| Years ended December 31, | ||||||||||||||||
| (Dollar amounts in thousands) | 2013 | 2012 | Variance | |||||||||||||
| Segment income from operations |
||||||||||||||||
| Merchant Acquiring, net |
$ | 35,376 | $ | 33,836 | $ | 1,540 | 5 | % | ||||||||
| Payment Processing |
54,429 | 53,682 | 747 | 1 | % | |||||||||||
| Business Solutions |
42,430 | 39,845 | 2,585 | 6 | % | |||||||||||
|
|
|
|
|
|
|
|
|
|||||||||
| Total segment income from operations |
132,235 | 127,363 | 4,872 | 4 | % | |||||||||||
| Merger related depreciation and amortization and other unallocated expenses (1) |
(46,474 | ) | (47,717 | ) | 1,243 | -3 | % | |||||||||
|
|
|
|
|
|
|
|
|
|||||||||
| Income from operations |
$ | 85,761 | $ | 79,646 | $ | 6,115 | 8 | % | ||||||||
|
|
|
|
|
|
|
|
|
|||||||||
| (1) | Primarily represents non-operating depreciation and amortization expenses generated as a result of the Merger and certain non-recurring fees and expenses. |
Income from operations increased $6.1 million or 8% compared with 2012. This increase was driven by the aforementioned factors affecting our revenues and operating costs and expenses, the non-recurring non-cash expense related to the vesting of all Tranche B and C stock options, non-recurring expenses incurred in the secondary offerings, and the non-cash asset write-off in 2012. Excluding non-recurring expenses, income from operations would have increased by $12.0 million or 15%.
See Note 21 of the Notes to Audited Consolidated Financial Statements included in this Annual Report on Form 10-K for additional information on the Company’s reportable segments and for a reconciliation of income from operations to net income (loss).
Non-operating (expenses) income
| Years ended December 31, | ||||||||||||||||
| (Dollar amounts in thousands) | 2013 | 2012 | Variance | |||||||||||||
| Non-operating (expenses) income |
||||||||||||||||
| Interest income |
$ | 236 | $ | 320 | $ | (84 | ) | -26 | % | |||||||
| Interest expense |
(37,861 | ) | (54,331 | ) | 16,470 | 30 | % | |||||||||
| Earnings of equity method investment |
935 | 564 | 371 | 66 | % | |||||||||||
| Other expenses |
(75,682 | ) | (8,491 | ) | (67,191 | ) | -791 | % | ||||||||
|
|
|
|
|
|
|
|
|
|||||||||
| Total non-operating (expenses) income |
$ | (112,372 | ) | $ | (61,938 | ) | $ | (50,434 | ) | -81 | % | |||||
|
|
|
|
|
|
|
|
|
|||||||||
Total non-operating expenses increased $50.4 million compared with 2012. The increase in non-operating expenses in 2013 was driven mainly by a $58.5 million charge related to the extinguishment of debt and a $16.7 million expense related to the termination of our consulting agreements with Apollo and Popular. The increase was partially offset by a $16.5 million reduction in interest expense as a result of the debt refinancing we completed in the second quarter of 2013 and $8.8 million debt issuance cost incurred in 2012.
For additional information related to the extinguishment of debt and associated loss, see Note 11 of the Notes to Audited Consolidated Financial Statements included in this Annual Report on Form 10-K.
Income tax benefit
Income tax benefit for the year ended December 31, 2013 amounted to approximately $2.0 million compared with $59.7 million in 2012. The 2013 income tax benefit was attributable to a taxable loss as a result of higher non-operating expenses related to the extinguishment of debt, the termination of the consulting agreements, the vesting of all Tranche B and C stock options and expenses related to the secondary offerings, as explained above.
54
Table of Contents
Index to Financial Statements
The income tax benefit in 2012 was mainly due to a reduction of $66.4 million of our deferred tax liability. The deferred tax liability was originally recognized using enacted tax rates expected to apply to taxable income in the years in which those temporary differences were expected to be recovered or settled. In the fourth quarter of 2012, we received a tax grant from the Government of Puerto Rico that reduced our marginal corporate income tax rate from 30% to 4% on industrial development income. Accordingly, the effect on deferred tax liabilities of the change in tax rates was recognized in the consolidated statement of income and comprehensive income in the period that includes the enactment date.
See Note 17 of the Notes to Audited Consolidated Financial Statements included in this Annual Report on Form 10-K for additional information regarding income taxes.
Liquidity and Capital Resources
Liquidity
Our principal source of liquidity is cash generated from operations, and our primary liquidity requirements are the funding of capital expenditures and working capital needs. We also have a $100.0 million revolving credit facility, of which $77.0 million was available as of December 31, 2014.
At December 31, 2014, we had cash of $32.1 million, of which $23.8 million resides in our subsidiaries located outside of Puerto Rico for purposes of (i) funding the respective subsidiary’s current business operations and (ii) funding potential future investment outside of Puerto Rico. We intend to indefinitely reinvest these funds outside of Puerto Rico, and based on our liquidity forecast, we will not need to repatriate this cash to fund the Puerto Rico operations or to meet debt-service obligations. However, if in the future we determine that we no longer need to maintain such cash balances within our foreign subsidiaries, we may elect to distribute such cash to the Company in Puerto Rico. Distributions from the foreign subsidiaries to Puerto Rico may be subject to tax withholding and other tax consequences.
Our primary use of cash is for operating expenses, working capital requirements, capital expenditures, dividend payments, debt services and share repurchases. We intend to fund repurchases from cash on hand and available borrowings under the revolving credit facility.
Based on our current level of operations, we believe our cash flows from operations and the available senior secured revolving credit facility will be adequate to meet our liquidity needs for the next twelve months. However, our ability to fund future operating expenses, dividend payments and capital expenditures and our ability to make scheduled payments of interest, to pay principal on or refinance our indebtedness and to satisfy any other of our present or future debt obligations will depend on our future operating performance, which will be affected by general economic, financial and other factors beyond our control.
Comparison of the years ended December 31, 2014 and 2013
The following table presents our cash flows from operations for the years ended December 31, 2014 and 2013:
| (Dollar amounts in thousands) |
Years ended December 31, | |||||||
| 2014 | 2013 | |||||||
| Cash provided by operating activities |
$ | 139,948 | $ | 62,867 | ||||
| Cash used in investing activities |
(26,170 | ) | (28,944 | ) | ||||
| Cash used in financing activities |
(104,149 | ) | (37,072 | ) | ||||
|
|
|
|
|
|||||
| Increase (decrease) in cash |
$ | 9,629 | $ | (3,149 | ) | |||
|
|
|
|
|
|||||
Net cash provided by operating activities for the year ended December 31, 2014 was $139.9 million, an increase of $77.1 million compared with 2013. The increase was driven by higher income from operations in 2014, while
55
Table of Contents
Index to Financial Statements
prior year includes cash used to pay certain amounts related to the redemption of the senior notes and the extinguishment of debt of $41.9 million, and a $16.7 million payment related to the termination of the Consulting Agreements with Popular and Apollo.
Net cash used in investing activities is mostly related to purchases of property and equipment and intangible assets.
Net cash used in financing activities for the year ended December 31, 2014 was $104.1 million compared with $37.1 million in 2013. Cash used in financing activities in 2014 consisted of $47.5 million in debt repayments, $31.4 million in quarterly dividends paid and $26.2 million for common stock repurchased. Cash used in financing activities in 2013 included $755 million to repay outstanding debt, $75 million to repurchase our common stock, $12.1 million of debt issuance costs, $16.9 million to pay taxes resulting from cashless exercise of stock options, and $16.4 million in dividend payments. These cash uses were partially offset by proceeds of $700 million from new long-term debt (refinancing outstanding debt), $112.4 million net proceeds from the initial public offering, and $24.2 million proceeds from short-term borrowings.
Comparison of the years ended December 31, 2013 and 2012
The following table presents our cash flows from operations for the years ended December 31, 2013 and 2012:
| Years ended December 31, | ||||||||
| (Dollar amounts in thousands) | 2013 | 2012 | ||||||
| Cash provided by operating activities |
$ | 62,867 | $ | 82,664 | ||||
| Cash used in investing activities |
(28,944 | ) | (27,042 | ) | ||||
| Cash used in financing activities |
(37,072 | ) | (86,188 | ) | ||||
|
|
|
|
|
|||||
| Decrease in cash |
$ | (3,149 | ) | $ | (30,566 | ) | ||
|
|
|
|
|
|||||
Net cash provided by operating activities for the year ended December 31, 2013 was $62.9 million, a decrease of $19.8 million compared with 2012. The decline was attributable mostly to cash used to pay certain amounts related to the redemption of the senior notes and the extinguishment of debt of $41.9 million and $16.7 million payment related to the termination of our consulting agreements with Popular and Apollo, partially offset by a $16.5 million reduction in interest expense as a result of the debt refinancing completed during the second quarter of 2013, an $11 million reduction in other expenses mainly resulting from the absence in 2013 of an $8.8 million debt issuance cost incurred in 2012, and an increase in income from operations of $6.1 million.
Net cash used in investing activities for the year ended December 31, 2013 was $28.9 million compared with $27.0 million in 2012. The $1.9 million increase in cash used was mainly due to an increase in the acquisition of software in 2013.
Net cash used in financing activities for the year ended December 31, 2013 was $37.1 million compared with $86.2 million in 2012. Cash used in financing activities in 2013 included $755 million to repay outstanding debt , $75 million to repurchase our common stock, $12.1 million of debt issuance costs, $16.9 million to pay taxes resulting from cashless exercise of stock options, and $16.4 million in dividend payments. These cash uses were partially offset by proceeds of $700 million from new long-term debt (refinancing outstanding debt), $112.4 million net proceeds from the initial public offering, and $24.2 million proceeds from short-term borrowings. Cash used in financing activities during 2012 included $320 million of dividend payments and $2.2 million of debt issuance costs, partially offset by $235.7 million in proceeds received from the issuance of long-term debt and short-term borrowings.
In connection with our initial public offering, we entered into new $800.0 million senior secured credit facilities to refinance all of the outstanding indebtedness under the previously existing senior secured credit facilities and to redeem the portion of the indebtedness under the notes that remained outstanding after the application of the
56
Table of Contents
Index to Financial Statements
net proceeds from the initial public offering. For additional information regarding our debt, see Note 11 of the Notes to Audited Consolidated Financial Statements included in this Annual Report on Form 10-K.
Capital Resources
Our principal capital expenditures are for hardware and computer software (purchased and internally developed) and additions to property and equipment. We invested approximately $25.9 million, $28.5 million and $27.5 million for the years ended December 31, 2014, 2013 and 2012, respectively. Capital expenditures are expected to be funded by cash flow from operations and, if necessary, borrowings under our revolving credit facility.
Dividend Payments
We currently have a policy under which we pay a regular quarterly dividend on our common stock, subject to the declaration thereof each quarter by our Board. Refer to the table below for details regarding our dividends in 2014 and 2013:
| Declaration Date |
Record Date |
Payment Date |
Dividend per share | |||
| August 7, 2013 |
August 19, 2013 | September 6, 2013 | $0.10 | |||
| November 6, 2013 |
November 18, 2013 | December 6, 2013 | 0.10 | |||
| February 12, 2014 |
February 25, 2014 | March 14, 2014 | 0.10 | |||
| May 7, 2014 |
May 19, 2014 | June 6, 2014 | 0.10 | |||
| August 6, 2014 |
August 18, 2014 | September 5, 2014 | 0.10 | |||
| November 5, 2014 |
November 17, 2014 | December 5, 2014 | 0.10 |
Stock Repurchase
During the fourth quarter of 2014, the Company repurchased 1,201,194 shares of the Company’s common stock at a cost of $26.2 million. The Company funded such repurchase with cash on hand and borrowings to the existing revolving credit facility.
On December 13, 2013, we repurchased 3,690,036 shares of our common stock from the underwriters in connection with a secondary public offering. We funded the share repurchase with approximately $25.0 million in cash on hand and $50.0 million of borrowings under our revolving credit facility.
Financial Obligations
Refinancing
On April 17, 2013, EVERTEC Group entered into the 2013 Credit Agreement governing the senior secured credit facilities, consisting of a $300.0 million term loan A facility (the Term A Loan) that matures on April 17, 2018; a $400.0 million term loan B facility (the “Term B Loan”) that matures on April 17, 2020 and a $100.0 million revolving credit facility that matures on April 17, 2018. EVERTEC Group used the net proceeds it received from the 2013 Credit Agreement, together with other cash available to refinance EVERTEC Group’s previous senior secured credit facilities and redeem a portion of the senior notes, as further explained below, among other things.
On March 29, 2013, EVERTEC Group provided notice to Wilmington Trust, National Association (the Trustee) pursuant to the Indenture, dated as of September 30, 2010 (as supplemented by Supplemental Indenture No. 1, dated as of April 17, 2012, Supplemental Indenture No. 2, dated as of May 7, 2012 and Supplemental Indenture No. 3, dated as of May 7, 2012) between EVERTEC Group and EVERTEC Finance Corp. (together, the Co-Issuers), the Guarantors named therein and the Trustee (the Indenture), that the Co-Issuers had elected to (i) redeem $91.0 million principal amount of their outstanding senior notes, at a redemption price of 111.0%, plus accrued and unpaid interest, on April 29, 2013 (the Partial Redemption) and (ii) redeem all of their outstanding senior notes (after giving effect to the redemption of $91.0 million principal amount of the senior
57
Table of Contents
Index to Financial Statements
notes described in clause (i) at a redemption price of 100% plus a make-whole premium and accrued and unpaid interest, on April 30, 2013 (the Full Redemption). On April 17, 2013, the Co-Issuers and the Trustee entered into a Satisfaction and Discharge Agreement whereby EVERTEC Group caused to be irrevocably deposited with the Trustee, to satisfy and to discharge the Co-Issuers’ obligations under the Indenture (a) a portion of the net cash proceeds received by the Company in the initial public offering to Holdings, which contributed such proceeds to EVERTEC Group, in an amount sufficient to effect the Partial Redemption on April 29, 2013 and (b) proceeds from the 2013 Credit Agreement described above in an amount sufficient to effect the Full Redemption on April 30, 2013. On April 29, 2013, the Partial Redemption was effected and on April 30, 2013, the Full Redemption was effected.
Senior Secured Credit Facilities
Term A Loan
As of December 31, 2014, the outstanding principal amount of the Term A Loan was $277.5 million. The Term A Loan requires principal payments on the last business day of each quarter equal to (a) 1.250% of the original principal amount commencing on September 30, 2013 through June 30, 2016; (b) 1.875% of the original principal amount from September 30, 2016 through June 30, 2017; (c) 2.50% of the original principal amount from September 30, 2017 through March 31, 2018; and (d) the remaining outstanding principal amount on the maturity of the Term A Loan on April 17, 2018. Interest is based on EVERTEC Group’s first lien secured net leverage ratio and payable at a rate equal to, at the Company’s option, either (a) LIBOR rate plus an applicable margin ranging from 2.00% to 2.50% or (b) Base Rate plus an applicable margin ranging from 1.00% to 1.50%. Term A Loan has no LIBOR Rate or Base Rate minimum or floor.
Term B Loan
As of December 31, 2014, the outstanding principal amount of the Term B Loan was $394.0 million. The Term B Loan requires principal payments on the last business day of each quarter equal to 0.250% of the original principal amount commencing on September 30, 2013 and the remaining outstanding principal amount on the maturity of the Term B Loan on April 17, 2020. Interest is based on EVERTEC Group’s first lien secured net leverage ratio and payable at a rate equal to, at the Company’s option, either (a) LIBOR Rate plus an applicable margin ranging from 2.50% to 2.75%, or (b) Base Rate plus an applicable margin ranging from 1.50% to 1.75%. The LIBOR Rate and Base Rate are subject to floors of 0.75% and 1.75%, respectively.
Revolving Credit Facility
The revolving credit facility has a balance up to $100.0 million, with an interest rate on loans calculated the same as the applicable Term A Loan rate. The facility matures on April 17, 2018 and has a “commitment fee” payable one business day after the last business day of each quarter calculated based on the daily unused commitment during the preceding quarter. The commitment fee for the unused portion of this facility ranges from 0.125% to 0.375% based on EVERTEC Group’s first lien secured net leverage ratio. As of December 31, 2014, the outstanding balance of the revolving credit facility was $23.0 million.
All loans may be prepaid without premium or penalty. The new senior secured credit facilities allow EVERTEC Group to obtain, on an uncommitted basis at the sole discretion of participating lenders, an incremental amount of term loan and/or revolving credit facility commitments not to exceed the greater of (i) $200.0 million and (ii) maximum amount of debt that would not cause EVERTEC Group’s pro forma first lien secured net leverage ratio to exceed 4.25 to 1.00.
The senior secured revolving credit facility is available for general corporate purposes and includes borrowing capacity available for letters of credit and for short-term borrowings referred to as swing line borrowings. All obligations under the new senior secured credit facilities are unconditionally guaranteed by Holdings and, subject to certain exceptions, each of EVERTEC Group’s existing and future wholly-owned subsidiaries. All obligations
58
Table of Contents
Index to Financial Statements
under the new senior secured credit facilities, and the guarantees of those obligations, are secured by substantially all of EVERTEC Group’s assets and the assets of the guarantors, subject to certain exceptions.
See Note 11 of the Notes to Audited Consolidated Financial Statements appearing elsewhere in this Annual Report on Form 10-K for additional information.
Other Short-Term Borrowing
In August 2013, we entered into a financing agreement in the ordinary course of business to purchase certain hardware, software and maintenance and related services in the amount of $1.8 million to be repaid in three installments over a term of eight months. As of December 31, 2014, this other short-term borrowing had been fully repaid.
Note payable
In December 2014, EVERTEC entered into a non-interest bearing $4.6 million financing agreement to purchase software. The note will be repaid over a 36-month term in twelve quarterly installments. Prepayment penalties apply. As of December 31, 2014 the outstanding principal balance of this note payable is $4.6 million. The current portion of this note is recorded as part of accounts payable and the long-term portion is included in other long-term liabilities.
Covenant Compliance
The credit facilities contain various restrictive covenants. The Term A Loan and the revolving facility (subject to certain exceptions) require EVERTEC Group to maintain on a quarterly basis a specified maximum senior secured leverage ratio of up to 6.60 to 1.00 as defined in the 2013 Credit Agreement (total first lien senior secured debt to Adjusted EBITDA). In addition, the 2013 Credit Agreement, among other things: (a) limits EVERTEC Group’s ability and the ability of its subsidiaries to incur additional indebtedness, incur liens, pay dividends or make certain other restricted payments and enter into certain transactions with affiliates; (b) restricts EVERTEC Group’s ability to enter into agreements that would restrict the ability of its subsidiaries to pay dividends or make certain payments to its parent company; and (c) places restrictions on EVERTEC Group’s ability and the ability of its subsidiaries to merge or consolidate with any other person or sell, assign, transfer, convey or otherwise dispose of all or substantially all of their assets. However, all of the covenants in these agreements are subject to significant exceptions. As of December 31, 2014, the senior secured leverage ratio was 3.63 to 1.00.
In this Annual Report on Form 10-K, we refer to the term “Adjusted EBITDA” to mean EBITDA as so defined and calculated for purposes of determining compliance with the senior secured leverage ratio based on the financial information for the last twelve months at the end of each quarter.
Net Income Reconciliation to EBITDA, Adjusted EBITDA, Adjusted Net Income and Adjusted Net Income per common share
We define “EBITDA” as earnings before interest, taxes, depreciation and amortization. We define “Adjusted EBITDA” as EBITDA further adjusted to exclude unusual items and other adjustments described below. We define “Adjusted Net Income” as net income adjusted to exclude unusual items and other adjustments described below.
We present EBITDA and Adjusted EBITDA because we consider them important supplemental measures of our performance and believe they are frequently used by securities analysts, investors and other interested parties in the evaluation of companies in our industry. In addition, our presentation of Adjusted EBITDA is consistent with the equivalent measurements that are contained in the senior secured credit facilities in testing EVERTEC Group’s compliance with covenants therein such as the senior secured leverage ratio. We use Adjusted Net Income to measure our overall profitability because it better reflects our cash flows generation by capturing the actual cash taxes paid rather than our tax expense as calculated under GAAP and excludes the impact of the non-cash amortization and depreciation that was created as a result of the Merger. In addition, in evaluating EBITDA,
59
Table of Contents
Index to Financial Statements
Adjusted EBITDA and Adjusted Net Income, you should be aware that in the future we may incur expenses such as those excluded in calculating them. Further, our presentation of these measures should not be construed as an inference that our future operating results will not be affected by unusual or nonrecurring items.
Some of the limitations of EBITDA, Adjusted EBITDA and Adjusted Net Income are as follows:
| • | they do not reflect cash outlays for capital expenditures or future contractual commitments; |
| • | they do not reflect changes in, or cash requirements for, working capital; |
| • | although depreciation and amortization are non-cash charges, the assets being depreciated and amortized will often have to be replaced in the future, and EBITDA and Adjusted EBITDA do not reflect cash requirements for such replacements; |
| • | in the case of EBITDA and Adjusted EBITDA, they do not reflect interest expense, or the cash requirements necessary to service interest, or principal payments, on indebtedness; |
| • | in the case of EBITDA and Adjusted EBITDA, they do not reflect income tax expense or the cash necessary to pay income taxes; and |
| • | other companies, including other companies in our industry, may not use EBITDA, Adjusted EBITDA and Adjusted Net Income or may calculate EBITDA, Adjusted EBITDA and Adjusted Net Income differently than as presented in this Report, limiting their usefulness as a comparative measure. |
EBITDA, Adjusted EBITDA, Adjusted Net Income and Adjusted Net Income per common share are not measurements of liquidity or financial performance under GAAP. You should not consider EBITDA, Adjusted EBITDA, Adjusted Net Income and Adjusted Net Income per common share as alternatives to cash flows from operating activities or any other performance measures determined in accordance with GAAP, as an indicator of cash flows, as a measure of liquidity or as an alternative to operating or net income determined in accordance with GAAP.
A reconciliation of net income to EBITDA, Adjusted EBITDA and Adjusted Net Income is provided below:
| Year ended December 31, 2014 |
||||
| (Dollar amounts in thousands, except per share data) | ||||
| Net Income |
$ | 67,532 | ||
| Income tax expense |
7,578 | |||
| Interest expense, net |
25,753 | |||
| Depreciation and amortization |
65,988 | |||
|
|
|
|||
| EBITDA |
166,851 | |||
|
Software maintenance reimbursement and other costs (1) |
2,248 | |||
| Equity income (2) |
(815 | ) | ||
| Compensation and benefits (3) |
6,152 | |||
| Transaction, refinancing and other non-recurring fees (4) |
7,930 | |||
| Purchase accounting (5) |
446 | |||
|
|
|
|||
| Adjusted EBITDA |
182,812 | |||
| Operating depreciation and amortization (6) |
(29,518 | ) | ||
| Cash interest expense (7) |
(22,351 | ) | ||
| Cash income taxes (8) |
(976 | ) | ||
|
|
|
|||
| Adjusted Net Income |
$ | 129,967 | ||
|
|
|
|||
| Adjusted Net Income per common share: |
||||
| Basic |
$ | 1.66 | ||
| Diluted |
$ | 1.65 | ||
| Shares used in computing Adjusted Net Income per common share: |
||||
| Basic |
78,337,152 | |||
| Diluted |
78,891,139 | |||
60
Table of Contents
Index to Financial Statements
| (1) | Primarily represents reimbursements received for certain software maintenance expenses as part of the Merger. |
| (2) | Represents the elimination of non-cash equity earnings from our 19.99% equity investment in CONTADO, net of cash dividends received. |
| (3) | Primarily represents non-cash equity based compensation expense. |
| (4) | Represents fees and expenses associated with non-recurring fees and corporate transactions, including the withdrawn senior secured notes offering in the second quarter of 2014. |
| (5) | Represents the elimination of the effects of purchase accounting in connection with certain software related arrangements where EVERTEC receives reimbursements from Popular. |
| (6) | Represents operating depreciation and amortization expense which excludes amortization generated as a result of the Merger. |
| (7) | Represents interest expense, less interest income, as they appear on our consolidated statement of income (loss) and comprehensive income (loss), adjusted to exclude non-cash amortization of the debt issuance costs, premium and accretion of discount and other adjustment related to interest expense. |
| (8) | Represents cash taxes paid. |
Contractual Obligations
The Company’s contractual obligations as of December 31, 2014 are as follows:
| Payment due by periods | ||||||||||||||||||||
| (Dollar amounts in thousands) | Total | Less than 1 year |
1-3 years | 3-5 years | After 5 years | |||||||||||||||
| Long-term debt (1) |
$ | 765,997 | $ | 40,262 | $ | 93,737 | $ | 254,073 | $ | 377,925 | ||||||||||
| Operating leases (2) |
24,040 | 4,725 | 9,052 | 10,263 | — | |||||||||||||||
| Short-term borrowings (3) |
23,437 | 23,437 | — | — | — | |||||||||||||||
| Other long-term liabilities |
5,751 | 1,779 | 3,861 | 111 | — | |||||||||||||||
|
|
|
|
|
|
|
|
|
|
|
|||||||||||
| Total |
$ | 819,225 | $ | 70,203 | $ | 106,650 | $ | 264,447 | $ | 377,925 | ||||||||||
|
|
|
|
|
|
|
|
|
|
|
|||||||||||
| (1) | Long-term debt includes the payments of cash interest (based on interest rates as of December 31, 2014 for variable rate debt) and aggregate principal amount of the senior secured term loan facilities, as well as commitments fees related to the unused portion of our senior secured revolving credit facility, as required under the terms of the long-term debt agreements. |
| (2) | Includes certain facilities and equipment under operating leases. See Note 20 of the Notes to Audited Consolidated Financial Statements for additional information regarding operating lease obligations. |
| (3) | Excludes the payments of cash interest related to the outstanding portion of the senior secured revolving credit facility as of December 31, 2014. |
Off Balance Sheet Arrangements
In the ordinary course of business, the Company may enter into commercial commitments. As of December 31, 2014, we had an outstanding letter of credit of $1.0 million with a maturity of less than three months. Also, as of December 31, 2014 we had an off balance sheet item of $10.8 million related to the unused amount of windfall that is available to offset future taxable income.
See Notes 17 and 20 of the Notes to Audited Consolidated Financial Statements appearing elsewhere in this Annual Report on Form 10-K for additional information related to this off balance sheet item.
Seasonality
Our payment businesses generally experiences increased activity during the traditional holiday shopping periods and around other nationally recognized holidays.
61
Table of Contents
Index to Financial Statements
Effect of Inflation
While inflationary increases in certain inputs costs, such as occupancy, labor and benefits, and general administrative costs, have an impact on our operating results, inflation has had minimal net impact on our operating results during the last three years as overall inflation has been offset by increased selling process and cost reduction actions. We cannot assure you, however, that we will not be affected by general inflation in the future.
Item 7A. Quantitative and Qualitative Disclosures About Market Risk
We are exposed to market risks arising from our normal business activities. These market risks principally involve the possibility of change in interest rates that will adversely affect the value of our financial assets and liabilities or future cash flows and earnings. Market risk is the potential loss arising from adverse changes in market rates and prices.
Interest rate risks
We issued floating-rate debt which is subject to fluctuations in interest rates. Our senior secured credit facilities accrue interest at variable rates and only the Term B Loan is subject to floors or minimum rates. A 100 basis point increase in interest rates over our floor(s) on our debt balances outstanding as of December 31, 2014, under the senior secured credit facilities would increase our annual interest expense by approximately $6.7 million. The impact on future interest expense as a result of future changes in interest rates will depend largely on the gross amount of our borrowings at that time.
See Note 11 of the Notes to Audited Consolidated Financial Statements appearing elsewhere in this Annual Report on Form 10-K for additional information related to the senior secured credit facilities.
Foreign exchange risk
We conduct business in certain countries in Latin America. Some of this business is conducted in the countries’ local currencies. The resulting foreign currency translation adjustments, from operations for which the functional currency is other than the U.S. dollar, are reported in accumulated other comprehensive income (loss) in the audited consolidated balance sheet, except for highly inflationary environments in which the effects would be included in other operating income in the consolidated statements of income (loss) and comprehensive income (loss). At December 31, 2014, the Company had $6.5 million in an unfavorable foreign currency translation adjustment as part of accumulated other comprehensive income (loss) compared to a favorable foreign currency translation adjustment of $0.4 million at December 31, 2013.
Item 8. Financial Statements and Supplementary Data
The Audited Consolidated Financial Statements, together with EVERTEC’s independent registered public accounting firm report, are included herein beginning on page F-1 of this Annual Report on Form 10-K.
62
Table of Contents
Index to Financial Statements
Selected Quarterly Financial Data
The following tables present our selected financial data for each of the quarters in 2014 and 2013.
| Quarters ended, | ||||||||||||||||
| (Dollar amounts in thousands, except per share data) | March 31, 2014 | June 30, 2014 | September 30, 2014 | December 31, 2014 | ||||||||||||
| Revenues |
$ | 87,433 | $ | 91,333 | $ | 88,879 | $ | 93,484 | ||||||||
| Operating costs and expenses |
62,544 | 65,904 | 62,419 | 72,914 | ||||||||||||
|
|
|
|
|
|
|
|
|
|||||||||
| Income from operations |
24,889 | 25,429 | 26,460 | 20,570 | ||||||||||||
| Non-operating expenses |
(4,522 | ) | (5,694 | ) | (6,287 | ) | (5,735 | ) | ||||||||
|
|
|
|
|
|
|
|
|
|||||||||
| Income before income taxes |
20,367 | 19,735 | 20,173 | 14,835 | ||||||||||||
| Income tax expense |
2,161 | 1,962 | 1,082 | 2,373 | ||||||||||||
|
|
|
|
|
|
|
|
|
|||||||||
| Net income |
$ | 18,206 | $ | 17,773 | $ | 19,091 | $ | 12,462 | ||||||||
|
|
|
|
|
|
|
|
|
|||||||||
| Net income per common share—basic |
$ | 0.23 | $ | 0.23 | $ | 0.24 | $ | 0.16 | ||||||||
|
|
|
|
|
|
|
|
|
|||||||||
| Net income per common share—diluted |
$ | 0.23 | $ | 0.22 | $ | 0.24 | $ | 0.16 | ||||||||
|
|
|
|
|
|
|
|
|
|||||||||
| Quarters ended, | ||||||||||||||||
| (Dollar amounts in thousands, except per share data) | March 31, 2013 | June 30, 2013 | September 30, 2013 | December 31, 2013 | ||||||||||||
| Revenues |
$ | 87,539 | $ | 89,362 | $ | 87,614 | $ | 93,502 | ||||||||
| Operating costs and expenses |
67,140 | 72,424 | 65,750 | 66,942 | ||||||||||||
|
|
|
|
|
|
|
|
|
|||||||||
| Income from operations |
20,399 | 16,938 | 21,864 | 26,560 | ||||||||||||
| Non-operating expenses |
(14,876 | ) | (86,885 | ) | (5,703 | ) | (4,908 | ) | ||||||||
|
|
|
|
|
|
|
|
|
|||||||||
| Income (loss) before income taxes |
5,523 | (69,947 | ) | 16,161 | 21,652 | |||||||||||
| Income tax expense (benefit) |
51 | (5,012 | ) | 1,358 | 1,613 | |||||||||||
|
|
|
|
|
|
|
|
|
|||||||||
| Net income (loss) |
$ | 5,472 | $ | (64,935 | ) | $ | 14,803 | $ | 20,039 | |||||||
|
|
|
|
|
|
|
|
|
|||||||||
| Net income (loss) per common share—basic |
$ | 0.08 | $ | (0.82 | ) | $ | 0.18 | $ | 0.25 | |||||||
|
|
|
|
|
|
|
|
|
|||||||||
| Net income (loss) per common share—diluted |
$ | 0.07 | $ | (0.82 | ) | $ | 0.18 | $ | 0.24 | |||||||
|
|
|
|
|
|
|
|
|
|||||||||
Item 9. Changes in and Disagreements with Accountants on Accounting and Financial Disclosure
None
Item 9A. Controls and Procedures
Evaluation of Disclosure Controls and Procedures
The Company, under the direction of the Chief Executive Officer and the Chief Financial Officer, has established
disclosure controls and procedures as defined in Rule 13a-15(e) under the Securities Exchange Act of 1934, as amended (the “Exchange Act”) that are designed to provide reasonable assurance that information required to be disclosed by the Company in the reports that it files or submits under the Exchange Act is recorded, processed, summarized and reported within the time periods specified in the SEC’s rules and forms, and that such information is accumulated and communicated to management as appropriate to allow timely decisions regarding required disclosure.
As of December 31, 2014, an evaluation was performed under the supervision and with the participation of the
Company’s management, including the Chief Executive Officer and Chief Financial Officer, of the effectiveness
63
Table of Contents
Index to Financial Statements
of the design and operation of the Company’s disclosure controls and procedures pursuant to Rule 13a-15(b) under the Exchange Act. Based upon their evaluation, the Chief Executive Officer and Chief Financial Officer have concluded that as of December 31, 2014, the Company’s disclosure controls and procedures are not effective because of the material weakness in our internal control over financial reporting described below.
Management’s Report on Internal Control Over Financial Reporting
Management is responsible for establishing and maintaining adequate internal control over financial reporting as defined in Rule 13a-15(f) under the Exchange Act. Internal control over financial reporting is a process designed by, or under the supervision of our Chief Executive Officer and Chief Financial Officer and effected by the Company’s board of directors, management, and other personnel to provide reasonable assurance regarding the reliability of financial reporting and the preparation of financial statements for external purposes in accordance with generally accepted accounting principles. Because of its inherent limitations, internal control over financial reporting may not prevent or detect misstatements.
The Company’s management assessed the effectiveness of our internal control over financial reporting as of December 31, 2014. In making this assessment, management used the criteria established in the Internal Control-Integrated Framework (2013) issued by the Committee of Sponsoring Organizations of the Treadway Commission (the “COSO criteria”). A material weakness is a deficiency, or a combination of deficiencies, in internal control over financial reporting, such that there is a reasonable possibility that a material misstatement of the annual or interim financial statements will not be prevented or detected on a timely basis.
We determined that a material weakness in internal control over financial reporting exists because the segregation of duties within the accounting system was inadequate for multiple individuals within the Company, including members of executive management. Specifically, certain individuals have access to prepare and post journal entries across substantially all key accounts of the Company without an independent review performed by someone other than the preparer.
While the control deficiency did not result in any financial statement adjustments during the year ended December 31, 2014, it could result in misstatements to accounts and disclosures that would result in a material misstatement to the annual or interim consolidated financial statements that would not be prevented or detected. Accordingly, we have determined that this control deficiency constitutes a material weakness.
Because of this material weakness, our management concluded that the Company did not maintain effective internal control over financial reporting as of December 31, 2014.
The effectiveness of our internal control over financial reporting as of December 31, 2014 has been audited by PricewaterhouseCoopers LLP, an independent registered public accounting firm, as stated in their report which appears in Item 8 of this Form 10-K.
Remediation Plan
Our management has performed a review of the prepare and post activity for the year ended December 31, 2014, concluding that none of the individuals with prepare and post capabilities created and posted journal entries. In addition, with the oversight of senior management and the audit committee, we have begun taking steps to remediate the underlying cause of the material weakness and improve the design of controls, including the following:
| • | Performing a detailed assessment of the accounting system settings and configurations to restrict access to functions within the system; |
64
Table of Contents
Index to Financial Statements
| • | Reviewing access of individuals within the accounting system to determine that their access is commensurate with their job responsibilities; and |
| • | Designing detective controls to review and approve journal entry activity that is conducted by certain individuals and/or using certain access rights that may bypass intended systematically enforced approvals. |
We have completed or are in the process of implementing the aforementioned enhancements and believe that such actions will remediate the material weakness in internal control over financial reporting.
Changes in Internal Control Over Financial Reporting
There have not been any changes in the Company’s internal control over financial reporting that occurred during the fiscal quarter ended December 31, 2014 that materially affected, or are reasonably likely to materially affect, our internal control over financial reporting.
None
65
Table of Contents
Index to Financial Statements
Part III
Item 10. Directors, Executive Officers and Corporate Governance
The information required by this Item 10 will be included in EVERTEC’s proxy statement, to be filed pursuant to Regulation 14A within 120 days after the end of the 2014 fiscal year, and is incorporated herein by reference.
Item 11. Executive Compensation
The information required by this Item 10 will be included in EVERTEC’s proxy statement, to be filed pursuant to Regulation 14A within 120 days after the end of the 2014 fiscal year, and is incorporated herein by reference.
Item 12. Security Ownership of Certain Beneficial Owners and Management and Related Stockholder Matters
The information required by this Item 10 will be included in EVERTEC’s proxy statement, to be filed pursuant to Regulation 14A within 120 days after the end of the 2014 fiscal year, and is incorporated herein by reference.
Item 13. Certain Relationships and Related Party Transactions
The information required by this Item 10 will be included in EVERTEC’s proxy statement, to be filed pursuant to Regulation 14A within 120 days after the end of the 2014 fiscal year, and is incorporated herein by reference.
Item 14. Principal Accounting Fees and Services
The information required by this Item 10 will be included in EVERTEC’s proxy statement, to be filed pursuant to Regulation 14A within 120 days after the end of the 2014 fiscal year, and is incorporated herein by reference.
Part IV
Item 15. Exhibits and Financial Statement Schedules
(a) (1) Financial Statements
The following consolidated financial statements of EVERTEC, Inc. together with the Report of Independent Registered Public Accounting Firm, are included in Part II, Item 8, Financial Statements and Supplementary Data:
| • | Reports of Independent Registered Public Accounting Firm |
| • | Consolidated Balance Sheets as of December 31, 2014 and 2013 |
| • | Consolidated Statements of Income (Loss) and Comprehensive Income (Loss) for the years ended December 31, 2014, 2013 and 2012 |
| • | Consolidated Statements of Changes in Stockholders’ Equity for the years ended December 31, 2014, 2013 and 2012 |
| • | Consolidated Statements of Cash Flows for the years ended December 31, 2014, 2013 and 2012 |
| • | Notes to Audited Consolidated Financial Statements |
| • | Schedule I—Parent Company Only Financial Statements |
66
Table of Contents
Index to Financial Statements
(2) Financial Statement Schedules
All financial statement schedules are omitted because they are inapplicable not required or the information has been disclosed elsewhere in the financial statements or notes thereto.
(3) Exhibits
| Exhibit No. |
Description | |
| 2.1 | Agreement and Plan of Merger, dated June 30, 2010, by and among Popular, Inc., AP Carib Holdings, Ltd., Carib Acquisitions, Inc. and EVERTEC Group, LLC (incorporated by reference to Exhibit 2.1 of Popular, Inc.’s Current Report on Form 8-K filed on July 8, 2010, File No. 001-34084) | |
| 2.2 | Amendment to the Agreement and Plan of Merger, dated August 5, 2010, by and among Popular, Inc., AP Carib Holdings, Ltd., Carib Acquisition, Inc. and EVERTEC Group, LLC (incorporated by reference to Exhibit 2.2 of Registration Statement on Form S-4 of EVERTEC Group, LLC, filed on April 14, 2011, File No. 333-173504) | |
| 2.3 | Second Amendment to the Agreement and Plan of Merger, dated August 8, 2010, by and among Popular, Inc., AP Carib Holdings, Ltd., Carib Acquisition, Inc. and EVERTEC Group, LLC (incorporated by reference to Exhibit 2.1 of Popular, Inc.’s Current Report on Form 8-K filed on August 12, 2010, File No. 001-34084) | |
| 2.4 | Third Amendment to the Agreement and Plan of Merger, dated September 15, 2010, by and among Popular, Inc., AP Carib Holdings, Ltd., Carib Acquisition, Inc. and EVERTEC Group, LLC (incorporated by reference to Exhibit 2.1 of Popular, Inc.’s Current Report on Form 8-K filed on September 21, 2010, File No. 001-34084) | |
| 2.5 | Fourth Amendment to the Agreement and Plan of Merger, dated September 30, 2010, by and among Popular, Inc., AP Carib Holdings, Ltd., Carib Acquisition, Inc. and EVERTEC Group, LLC (incorporated by reference to Exhibit 2.1 of Popular, Inc.’s Current Report on Form 8-K filed on October 6, 2010, File No. 001-34084) | |
| 2.6 | Letter Agreement re: amendment to Merger Agreement, dated as of July 31, 2013, by and among Popular, Inc., EVERTEC Group, LLC (on behalf of itself and as successor in interest to Carib Acquisition, Inc.) and AP Carib Holdings, Ltd. (incorporated by reference to Exhibit 10.2 of EVERTEC, Inc.’s Current Report on Form 8-K filed on August 6, 2013, File No. 001-35872) | |
| 3.1 | Amended and Restated Certificate of Incorporation of EVERTEC, Inc. (incorporated by reference to Exhibit 3.1 of EVERTEC, Inc.’s Current Report on Form 8-K filed on April 23, 2013, File No. 001-35872) | |
| 3.2 | Amended and Restated Bylaws of EVERTEC, Inc. (incorporated by reference to Exhibit 3.2 of EVERTEC, Inc.’s Current Report on Form 8-K filed on April 23, 2013, File No. 001-35872) | |
| 4.1 | Form of common stock certificate of EVERTEC, Inc. (incorporated by reference to Exhibit 4.9 of EVERTEC, Inc.’s Amendment No. 2 to the Registration Statement on Form S-1 filed on March 28, 2013, File No. 333-186487) | |
| 4.2 | Stockholder Agreement, dated April 17, 2012, by and among EVERTEC, Inc. and the holders party thereto (incorporated by reference to Exhibit 99.1 of Popular, Inc.’s Current Report on Form 8-K filed on April 23, 2012, File No. 001-34084) | |
67
Table of Contents
Index to Financial Statements
| Exhibit No. |
Description | |
| 4.3 | First Amendment to the Stockholder Agreement, dated March 27, 2013, by and among EVERTEC, Inc. and the holders party thereto (incorporated by reference to Exhibit 4.10 of EVERTEC, Inc.’s Amendment No. 3 to the Registration Statement on Form S-1 filed on April 2, 2013, File No. 333-186487) | |
| 4.4 | Second Amendment to the Stockholder Agreement, dated June 30, 2013, by and among EVERTEC, Inc. and the holders party thereto (incorporated by reference to Exhibit 10.1 of EVERTEC, Inc.’s Quarterly Report on Form 10-Q filed on August 14, 2013, File No. 001-35872) | |
| 4.5 | Third Amendment to the Stockholder Agreement, dated November 13, 2013, by and among EVERTEC, Inc. and the holders party thereto (incorporated by reference to Exhibit 4.5 of EVERTEC, Inc.’s Annual Report on Form 10-K filed on March 17, 2014, File No. 001-35872) | |
| 10.1 | Credit Agreement, dated April 17, 2013, by and among EVERTEC Intermediate Holdings, LLC, EVERTEC Group, LLC, the lenders party thereto from time to time, JPMorgan Chase Bank, N.A., as administrative agent, collateral agent swingline lender and L/C issuer, J.P. Morgan Securities LLC and Goldman Sachs Bank USA, as joint lead arrangers, J.P. Morgan Securities LLC, Goldman Sachs Bank USA, Merrill Lynch, Pierce, Fenner & Smith Incorporated, Deutsche Bank Securities Inc. and Morgan Stanley Senior Funding, Inc., as joint bookrunners, Goldman Sachs Bank USA, Merrill Lynch, Pierce, Fenner & Smith Incorporated, Deutsche Bank Securities Inc. and Morgan Stanley Senior Funding, Inc., as co-syndication agents, and Credit Suisse Securities (USA) LLC and UBS Securities LLC, as co-documentation agents (incorporated by reference to Exhibit 10.1 of EVERTEC, Inc.’s Current Report on Form 8-K filed on April 23, 2013, File No. 001-35872) | |
| 10.2 | Amendment No. 1, dated as of May 14, 2013, to the Credit Agreement, dated as of April 17, 2013, by and among EVERTEC Intermediate Holdings, LLC, EVERTEC Group, LLC, JPMorgan Chase Bank, N.A., as administrative agent, and the lenders party thereto (incorporated by reference to Exhibit 10.1 of EVERTEC, Inc.’s Quarterly Report on Form 10-Q filed on May 15, 2013, File No. 001-35872) | |
| 10.3 | Guarantee Agreement, dated as of April 17, 2013, by and among EVERTEC Group, LLC, the loan parties identified on the signature pages thereof and JPMorgan Chase Bank, N.A., as administrative agent and collateral agent (incorporated by reference to Exhibit 10.2 of EVERTEC, Inc.’s Current Report on Form 8-K filed on April 23, 2013, File No. 001-35872) | |
| 10.4 | Collateral Agreement, dated as of April 17, 2013, by and among EVERTEC Intermediate Holdings, LLC, EVERTEC Group, LLC and each subsidiary of EVERTEC Group, LLC identified therein and JPMorgan Chase Bank, N.A., as collateral agent (incorporated by reference to Exhibit 10.3 of EVERTEC, Inc.’s Current Report on Form 8-K filed on April 23, 2013, File No. 001-35872) | |
| 10.5++ | Amended and Restated Master Service Agreement, dated as of September 30, 2010, by and among Popular, Inc. Banco Popular de Puerto Rico and EVERTEC Group, LLC (incorporated by reference to Exhibit 10.7 of EVERTEC, Inc.’s Amendment No. 3 to the Registration Statement on Form S-1 filed on April 2, 2013, File No. 333-186487) | |
| 10.6 | Technology Agreement, made and entered into as of September 30, 2010, by and between Popular, Inc. and EVERTEC Group, LLC (incorporated by reference to Exhibit 99.4 of Popular, Inc.’s Current Report on Form 8-K filed on October 6, 2010, File No. 001-34084) | |
| 10.7 | Amended and Restated Independent Sales Organization Sponsorship and Services Agreement, dated as of September 30, 2010, by and between Banco Popular de Puerto Rico and EVERTEC Group, LLC (incorporated by reference to Exhibit 10.7 of Registration Statement on Form S-4 of EVERTEC Group, LLC, filed on April 14, 2011, File No. 333-173504) | |
68
Table of Contents
Index to Financial Statements
| Exhibit No. |
Description | |
| 10.8 | IP Purchase and Sale Agreement, dated June 30, 2010, by and between Popular, Inc. (and Affiliates and Subsidiaries) and EVERTEC Group, LLC (incorporated by reference to Exhibit 10.1 of Popular, Inc.’s Current Report on Form 8-K filed on July 8, 2010, File. No. 001-34084) | |
| 10.9+ | EVERTEC, Inc. Amended and Restated 2010 Equity Incentive Plan (incorporated by reference to Exhibit 10.3 of Current Report on Form 8-K of EVERTEC Group, LLC, filed on April 18, 2012, File No. 333-173504) | |
| 10.10+ | EVERTEC, Inc. Amended and Restated Stock Option Agreement, dated as of May 9, 2012, by and between EVERTEC, Inc. and Juan Jose Román-Jimenez (incorporated by reference to Exhibit 10.6 of Quarterly Report on Form 10-Q of EVERTEC Group, LLC, filed on May 15, 2012, File No. 333-173504) | |
| 10.11+ | EVERTEC, Inc. Amended and Restated Stock Option Agreement, dated as of May 9, 2012, by and between EVERTEC, Inc. and Carlos J. Ramírez (incorporated by reference to Exhibit 10.7 of Quarterly Report on Form 10-Q of EVERTEC Group, LLC, filed on May 15, 2012, File No. 333-173504) | |
| 10.12+ | EVERTEC, Inc. Amended and Restated Stock Option Agreement, dated as of May 9, 2012, by and between EVERTEC, Inc. and Miguel Vizcarrondo (incorporated by reference to Exhibit 10.9 of Quarterly Report on Form 10-Q of EVERTEC Group, LLC, filed on May 15, 2012, File No. 333-173504) | |
| 10.13+ | EVERTEC, Inc. Amended and Restated Stock Option Agreement, dated as of May 9, 2012, by and between EVERTEC, Inc. and Miguel Vizcarrondo (incorporated by reference to Exhibit 10.10 of Quarterly Report on Form 10-Q of EVERTEC Group, LLC, filed on May 15, 2012, File No. 333-173504) | |
| 10.14 | Tax Payment Agreement, dated as of April 17, 2012, by and among EVERTEC, Inc., EVERTEC Intermediate Holdings, LLC and EVERTEC Group, LLC (incorporated by reference to Exhibit 10.2 of Current Report on Form 8-K of EVERTEC Group, LLC, filed on April 18, 2012, File No. 333-173504) | |
| 10.15 | Stock Contribution and Exchange Agreement, dated as of April 17, 2012, by and among EVERTEC Intermediate Holdings, LLC, EVERTEC, Inc., and the holders shares of common stock of EVERTEC Intermediate Holdings, LLC (incorporated by reference to Exhibit 10.41 of EVERTEC, Inc.’s Amendment No. 1 to the Registration Statement on Form S-1 filed on March 14, 2013, File No. 333-186487) | |
| 10.16+ | Stock Option Agreement, dated as of August 1, 2012, by and between EVERTEC, Inc. and Philip E. Steurer (incorporated by reference to Exhibit 10.2 of Quarterly Report on Form 10-Q of EVERTEC Group, LLC, filed on August 14, 2012, File No. 333-173504) | |
| 10.17++ | Amended and Restated ATH Network Participation Agreement, dated as of September 30, 2010, by and between Banco Popular de Puerto Rico and EVERTEC Group, LLC and service riders related thereto (incorporated by reference to Exhibit 10.48 of EVERTEC, Inc.’s Registration Statement on Form S-1 filed on February 6, 2013, File No. 333-186487) | |
| 10.18++ | ATH Support Agreement, dated as of September 30, 2010, by and between Banco Popular de Puerto Rico and EVERTEC Group, LLC (incorporated by reference to Exhibit 10.49 of EVERTEC, Inc.’s Registration Statement on Form S-1 filed on February 6, 2013, File No. 333-186487)1 | |
| 10.19 | Virgin Islands Services Agreement, dated as of September 15, 2010, by and between EVERTEC Group, LLC and Banco Popular de Puerto Rico (incorporated by reference to Exhibit 10.54 of EVERTEC, Inc.’s Registration Statement on Form S-1 filed on February 6, 2013, File No. 333-186487) | |
69
Table of Contents
Index to Financial Statements
| Exhibit No. |
Description | |
| 10.20 | Master Lease Agreement, dated as of April 1, 2004, by and between EVERTEC Group, LLC and Banco Popular de Puerto Rico (incorporated by reference to Exhibit 10.55 of EVERTEC, Inc.’s Registration Statement on Form S-1 filed on February 6, 2013, File No. 333-186487) | |
| 10.21 | First Amendment to Master Lease Agreement, dated as of January 1, 2006, by and between EVERTEC Group, LLC and Banco Popular de Puerto Rico (incorporated by reference to Exhibit 10.56 of EVERTEC, Inc.’s Registration Statement on Form S-1 filed on February 6, 2013, File No. 333-186487) | |
| 10.22 | Second Amendment to Master Lease Agreement, dated as of April 23, 2010, by and between EVERTEC Group, LLC and Banco Popular de Puerto Rico (incorporated by reference to Exhibit 10.57 of EVERTEC, Inc.’s Registration Statement on Form S-1 filed on February 6, 2013, File No. 333-186487) | |
| 10.23 | Third Amendment to Master Lease Agreement, dated as of September 30, 2010, by and between EVERTEC Group, LLC and Banco Popular de Puerto Rico (incorporated by reference to Exhibit 10.58 of EVERTEC, Inc.’s Registration Statement on Form S-1 filed on February 6, 2013, File No. 333-186487) | |
| 10.24+ | EVERTEC, Inc. 2013 Equity Incentive Plan (incorporated by reference to Exhibit 10.61 to EVERTEC, Inc.’s Amendment No. 1 to the Registration Statement on Form S-1 filed on March 14, 2013, File No. 333-186487) | |
| 10.25 | Form of Indemnification Agreement by and among EVERTEC, Inc. and its directors (incorporated by reference to Exhibit 10.62 of EVERTEC, Inc.’s Amendment No. 1 to the Registration Statement on Form S-1 filed on March 14, 2013, File No. 333-186487) | |
| 10.26+ | Stock Option Agreement, dated as of November 6, 2013 by and between EVERTEC, Inc. and Eduardo Franco de Camargo (incorporated by reference to Exhibit 10.60 of EVERTEC, Inc.’s Annual Report on Form 10-K/A filed on March 20, 2014, File No. 001-35872) | |
| 10.27+ | Amended and Restated Employment agreement dated July 1, 2014, by and between EVERTEC Group, LLC and Carlos J. Ramírez (incorporated by reference to Exhibit 10.61 of EVERTEC, Inc.’s Quarterly Report on Form 10-Q filed on August 7, 2014, File No. 001-35872) | |
| 10.28+ | Amended and Restated Employment agreement dated July 1, 2014, by and between EVERTEC Group, LLC and Eduardo Franco de Camargo (incorporated by reference to Exhibit 10.62 of EVERTEC, Inc.’s Quarterly Report on Form 10-Q filed on August 7, 2014, File No. 001-35872) | |
| 10.29+ | Amended and Restated Employment agreement dated July 1, 2014, by and between EVERTEC Group, LLC and Juan J. Román Jiménez (incorporated by reference to Exhibit 10.63 of EVERTEC, Inc.’s Quarterly Report on Form 10-Q filed on August 7, 2014, File No. 001-35872) | |
| 10.30+ | Amended and Restated Employment agreement dated July 1, 2014, by and between EVERTEC Group, LLC and Miguel Vizcarrondo (incorporated by reference to Exhibit 10.64 of EVERTEC, Inc.’s Quarterly Report on Form 10-Q filed on August 7, 2014, File No. 001-35872) | |
| 10.31+ | Amended and Restated Employment agreement dated July 1, 2014, by and between EVERTEC Group, LLC and Peter Harrington (incorporated by reference to Exhibit 10.65 of EVERTEC, Inc.’s Quarterly Report on Form 10-Q filed on August 7, 2014, File No. 001-35872) | |
| 10.32+ | Amended and Restated Employment agreement dated July 1, 2014, by and between EVERTEC Group, LLC and Phil Steurer (incorporated by reference to Exhibit 10.66 of EVERTEC, Inc.’s Quarterly Report on Form 10-Q filed on August 7, 2014, File No. 001-35872) | |
70
Table of Contents
Index to Financial Statements
| Exhibit No. |
Description | |
| 10.33+ | Form of Restricted Stock Unit Award Agreement for grants of restricted stock units to directors under the EVERTEC, Inc. 2013 Equity Incentive Plan (incorporated by reference to Exhibit 10.67 of EVERTEC, Inc.’s Quarterly Report on Form 10-Q filed on November 6, 2014, File No. 001-35872) | |
| 10.34+ | Employment Agreement, dated as of October 13, 2014, by and between EVERTEC Group, LLC and Alan I. Cohen (incorporated by reference to Exhibit 10.68 of EVERTEC, Inc.’s Quarterly Report on Form 10-Q filed on November 6, 2014, File No. 001-35872) | |
| 10.35+ | Restricted Stock Unit Award Agreement under the EVERTEC, Inc. 2013 Equity Incentive Plan, dated October 15, 2014, by and between EVERTEC, Inc. and Alan I. Cohen (incorporated by reference to Exhibit 10.69 of EVERTEC, Inc.’s Quarterly Report on Form 10-Q filed on November 6, 2014, File No. 001-35872) | |
| 10.36*+ | Separation Agreement and General Release, dated as of November 20, 2014, by and between EVERTEC Group, LLC and Peter Harrington | |
| 10.37*+ | Amended and Restated Employment Agreement, dated as of December 17, 2014, by and between EVERTEC Group, LLC, and Morgan M. Schuessler, Jr. | |
| 10.38*+ | Restricted Stock Unit Award Agreement under the EVERTEC, Inc. 2013 Equity Incentive Plan, dated as of December 17, 2014, by and between EVERTEC, Inc. and Thomas W. Swidarski | |
| 10.39*+ | Agreement, dated as of December 17, 2104, by and between EVERTEC, Inc. and Frank G. D’Angelo, relating to terms of appointment as Interim CEO | |
| 10.40*+ | Restricted Stock Unit Award Agreement under the EVERTEC, Inc. 2013 Equity Incentive Plan, dated as of January 1, 2015, by and between EVERTEC, Inc. and Frank G. D’Angelo | |
| 21.1* | Subsidiaries of EVERTEC, Inc. | |
| 23.1* | Consent of PricewaterhouseCoopers LLP, independent registered public accountants | |
| 31.1* | Certification of Chief Executive Officer pursuant to Rule 13a-14(a) and Rule 15d-14(a), as adopted pursuant to Section 302 of the Sarbanes-Oxley Act of 2002 | |
| 31.2* | Certification of Chief Financial Officer pursuant to Rule 13a-14(a) and Rule 15d-14(a), as adopted pursuant to Section 302 of the Sarbanes-Oxley Act of 2002 | |
| 32.1** | Certification of Chief Executive Officer pursuant to 18 U.S.C. Section 1350, as adopted pursuant to Section 906 of the Sarbanes-Oxley Act of 2002 | |
| 32.2** | Certification of Chief Financial Officer pursuant to 18 U.S.C. Section 1350, as adopted pursuant to Section 906 of the Sarbanes-Oxley Act of 2002 | |
| 101.INS XBRL**† | Instance document | |
| 101.SCH XBRL**† | Taxonomy Extension Schema | |
| 101.CAL XBRL**† | Taxonomy Extension Calculation Linkbase | |
| 101.DEF XBRL**† | Taxonomy Extension Definition Linkbase | |
| 101.LAB XBRL**† | Taxonomy Extension Label Linkbase | |
| 101.PRE XBRL**† | Taxonomy Extension Presentation Linkbase | |
| * | Filed herewith. |
| ** | Furnished herewith. |
| † | Pursuant to applicable securities laws and regulations, the Company is deemed to have complied with the reporting obligation relating to the submission of interactive data files in such exhibits and is not subject to |
71
Table of Contents
Index to Financial Statements
| liability under any anti-fraud provisions of the federal securities laws as long as the Company has made a good faith attempt to comply with the submission requirements and promptly amends the interactive data files after becoming aware that the interactive data files fail to comply with the submission requirements. Users of this data are advised that, pursuant to Rule 406T, these interactive data files are deemed not filed and otherwise are not subject to liability. |
| + | This exhibit is a management contract or a compensatory plan or arrangement. |
| ++ | Confidential treatment has been requested with respect to certain portions of this exhibit. Omitted portions have been filed separately with the SEC. |
72
Table of Contents
Index to Financial Statements
Pursuant to the requirements of Section 13 or 15(d) of the Securities Exchange Act of 1934, the registrant has duly caused this report to be signed on its behalf by the undersigned, thereunto duly authorized,
| EVERTEC, Inc. | ||||
| Date: March 2, 2015 | By: | /s/ Frank G. D’Angelo | ||
| Frank G. D’Angelo | ||||
| Chief Executive Officer | ||||
Pursuant to the requirements of the Securities Exchange Act of 1934, this report has been signed below by the following persons on behalf of the registrant and in the capacities and on the dates indicated.
| Signature |
Title |
Date | ||
| /s/ Frank G. D’Angelo |
Interim Chief Executive Officer (Principal Executive Officer) and Chairman of the Board | March 2, 2015 | ||
| Frank G. D’Angelo | ||||
| /s/ Juan J. Román |
Chief Financial Officer (Principal Financial and Accounting Officer) | March 2, 2015 | ||
| Juan J. Román | ||||
| /s/ Teresita Loubriel |
Director | March 2, 2015 | ||
| Teresita Loubriel | ||||
| /s/ Alan H. Schumacher |
Director | March 2, 2015 | ||
| Alan H. Schumacher | ||||
| /s/ Thomas W. Swidarski |
Director | March 2, 2015 | ||
| Thomas W. Swidarski | ||||
| /s/ Jorge A. Junquera |
Director |
March 2, 2015 | ||
| Jorge A. Junquera | ||||
| /s/ Nestor O. Rivera |
Director | March 2, 2015 | ||
| Nestor O. Rivera | ||||
| /s/ Olga M. Botero |
Director | March 2, 2015 | ||
| Olga M. Botero | ||||
73
Table of Contents
Index to Financial Statements
Audited Consolidated Financial Statements
| F-2 | ||||
| Consolidated Balance Sheets as of December 31, 2014 and 2013 |
F-4 | |||
| F-5 | ||||
| F-6 | ||||
| Consolidated Statements of Cash Flows for the years ended December 31, 2014, 2013 and 2012 |
F-7 | |||
| F-8 | ||||
| F-41 | ||||
F-1
Table of Contents
Index to Financial Statements

Report of Independent Registered Public Accounting Firm
To the Board of Directors and Stockholders of
EVERTEC, Inc.
In our opinion, the accompanying consolidated balance sheets and the related consolidated statements of income (loss) and comprehensive income (loss), of changes in stockholders’ equity and of cash flows present fairly, in all material respects, the financial position of EVERTEC, Inc. and its subsidiaries at December 31, 2014 and 2013, and the results of their operations and their cash flows for each of the three years in the period ended December 31, 2014 in conformity with accounting principles generally accepted in the United States of America. In addition, in our opinion, the financial statement schedule listed in the index appearing under Item 15(a)(2) presents fairly, in all material respects, the information set forth therein when read in conjunction with the related consolidated financial statements. Also in our opinion, the Company did not maintain, in all material respects, effective internal control over financial reporting as of December 31, 2014, based on criteria established in Internal Control—Integrated Framework (2013) issued by the Committee of Sponsoring Organizations of the Treadway Commission (COSO) because a material weakness in internal control over financial reporting related to inadequate segregation of duties within the accounting system for multiple individuals, including members of executive management, who had access to prepare and post journal entries across all key accounts existed as of that date. A material weakness is a deficiency, or a combination of deficiencies, in internal control over financial reporting, such that there is a reasonable possibility that a material misstatement of the annual or interim financial statements will not be prevented or detected on a timely basis. The material weakness referred to above is described in Management’s Report on Internal Control Over Financial Reporting appearing under Item 9A. We considered this material weakness in determining the nature, timing, and extent of audit tests applied in our audit of the December 31, 2014 consolidated financial statements and our opinion regarding the effectiveness of the Company’s internal control over financial reporting does not affect our opinion on those consolidated financial statements. The Company’s management is responsible for these financial statements and financial statement schedule, for maintaining effective internal control over financial reporting and for its assessment of the effectiveness of internal control over financial reporting included in management’s report referred to above. Our responsibility is to express opinions on these financial statements, on the financial statement schedule, and on the Company’s internal control over financial reporting based on our audits (which was an integrated audit in 2014). We conducted our audits in accordance with the standards of the Public Company Accounting Oversight Board (United States). Those standards require that we plan and perform the audits to obtain reasonable assurance about whether the financial statements are free of material misstatement and whether effective internal control over financial reporting was maintained in all material respects. Our audits of the financial statements included examining, on a test basis, evidence supporting the amounts and disclosures in the financial statements, assessing the accounting principles used and significant estimates made by management, and evaluating the overall financial statement presentation. Our audit of internal control over financial reporting included obtaining an understanding of internal control over financial reporting, assessing the risk that a material weakness exists, and testing and evaluating the design and operating effectiveness of internal control based on the assessed risk. Our audits also included performing such other procedures as we considered necessary in the circumstances. We believe that our audits provide a reasonable basis for our opinions.
A company’s internal control over financial reporting is a process designed to provide reasonable assurance regarding the reliability of financial reporting and the preparation of financial statements for external purposes in accordance with generally accepted accounting principles. A company’s internal control over financial reporting includes those policies and procedures that (i) pertain to the maintenance of records that, in reasonable detail,
F-2
Table of Contents
Index to Financial Statements
accurately and fairly reflect the transactions and dispositions of the assets of the company; (ii) provide reasonable assurance that transactions are recorded as necessary to permit preparation of financial statements in accordance with generally accepted accounting principles, and that receipts and expenditures of the company are being made only in accordance with authorizations of management and directors of the company; and (iii) provide reasonable assurance regarding prevention or timely detection of unauthorized acquisition, use, or disposition of the company’s assets that could have a material effect on the financial statements.
Because of its inherent limitations, internal control over financial reporting may not prevent or detect misstatements. Also, projections of any evaluation of effectiveness to future periods are subject to the risk that controls may become inadequate because of changes in conditions, or that the degree of compliance with the policies or procedures may deteriorate.
PricewaterhouseCoopers LLP (signed)
San Juan, PR
March 2, 2015
License No. LLP-216 Expires December 1, 2016
Stamp No. E139753 of the Puerto Rico Society of Certified Public Accountants was affixed to the record copy of this report.

F-3
Table of Contents
Index to Financial Statements
EVERTEC, Inc. Consolidated Balance Sheets
(Dollar amounts in thousands, except share data)
| December 31, 2014 |
December 31, 2013 |
|||||||
| Assets |
||||||||
| Current Assets: |
||||||||
| Cash |
$ | 32,114 | $ | 22,485 | ||||
| Restricted cash |
5,718 | 5,433 | ||||||
| Accounts receivable, net |
75,810 | 68,434 | ||||||
| Deferred tax asset |
399 | 2,537 | ||||||
| Prepaid expenses and other assets |
20,565 | 19,482 | ||||||
|
|
|
|
|
|||||
| Total current assets |
134,606 | 118,371 | ||||||
| Investment in equity investee |
11,756 | 10,639 | ||||||
| Property and equipment, net |
29,535 | 33,240 | ||||||
| Goodwill |
368,837 | 373,119 | ||||||
| Other intangible assets, net |
334,584 | 367,780 | ||||||
| Other long-term assets |
10,917 | 18,162 | ||||||
|
|
|
|
|
|||||
| Total assets |
$ | 890,235 | $ | 921,311 | ||||
|
|
|
|
|
|||||
| Liabilities and stockholders’ equity |
||||||||
| Current Liabilities: |
||||||||
| Accrued liabilities |
$ | 26,052 | $ | 26,571 | ||||
| Accounts payable |
22,879 | 20,588 | ||||||
| Unearned income |
9,825 | 5,595 | ||||||
| Income tax payable |
1,956 | 259 | ||||||
| Current portion of long-term debt |
19,000 | 19,000 | ||||||
| Short-term borrowings |
23,000 | 51,200 | ||||||
| Deferred tax liability, net |
1,799 | 543 | ||||||
|
|
|
|
|
|||||
| Total current liabilities |
104,511 | 123,756 | ||||||
| Long-term debt |
647,579 | 665,680 | ||||||
| Long-term deferred tax liability, net |
15,674 | 20,212 | ||||||
| Other long-term liabilities |
2,898 | 333 | ||||||
|
|
|
|
|
|||||
| Total liabilities |
$ | 770,662 | 809,981 | |||||
|
|
|
|
|
|||||
| Commitments and contingencies (Note 20) |
||||||||
| Stockholders’ equity |
||||||||
| Preferred stock, par value $0.01; 2,000,000 shares authorized; none issued |
— | — | ||||||
| Common stock, par value $0.01; 206,000,000 shares authorized; 77,893,144 shares issued and outstanding at December 31, 2014 (December 31, 2013 - 78,286,465) |
779 | 783 | ||||||
| Additional paid-in capital |
59,740 | 80,718 | ||||||
| Accumulated earnings |
65,576 | 29,403 | ||||||
| Accumulated other comprehensive (loss) income, net of tax |
(6,522 | ) | 426 | |||||
|
|
|
|
|
|||||
| Total stockholders’ equity |
119,573 | 111,330 | ||||||
|
|
|
|
|
|||||
| Total liabilities and stockholders’ equity |
$ | 890,235 | $ | 921,311 | ||||
|
|
|
|
|
|||||
The accompanying notes are an integral part of these audited financial statements.
F-4
Table of Contents
Index to Financial Statements
EVERTEC, Inc. Consolidated Statements of Income (Loss) and Comprehensive Income (Loss)
(Dollar amounts in thousands, except per share data)
| Years ended December 31, | ||||||||||||
| 2014 | 2013 | 2012 | ||||||||||
| Revenues |
||||||||||||
| Merchant Acquiring, net |
$ | 79,136 | $ | 73,616 | $ | 69,591 | ||||||
| Payment Processing (from affiliates: $27,094 $26,747 and $26,073) |
105,423 | 100,104 | 95,607 | |||||||||
| Business Solutions (from affiliates: $134,512, $137,560 and $125,635) |
176,570 | 184,297 | 177,292 | |||||||||
|
|
|
|
|
|
|
|||||||
| Total revenues |
361,129 | 358,017 | 342,490 | |||||||||
|
|
|
|
|
|
|
|||||||
| Operating costs and expenses |
||||||||||||
| Cost of revenues, exclusive of depreciation and amortization shown below |
156,517 | 163,080 | 159,666 | |||||||||
| Selling, general and administrative expenses |
41,276 | 38,810 | 31,686 | |||||||||
| Depreciation and amortization |
65,988 | 70,366 | 71,492 | |||||||||
|
|
|
|
|
|
|
|||||||
| Total operating costs and expenses |
263,781 | 272,256 | 262,844 | |||||||||
|
|
|
|
|
|
|
|||||||
| Income from operations |
97,348 | 85,761 | 79,646 | |||||||||
|
|
|
|
|
|
|
|||||||
| Non-operating (expenses) income |
||||||||||||
| Interest income |
328 | 236 | 320 | |||||||||
| Interest expense |
(26,081 | ) | (37,861 | ) | (54,331 | ) | ||||||
| Earnings of equity method investment |
1,140 | 935 | 564 | |||||||||
| Other income (expenses): |
||||||||||||
| Loss on extinguishment of debt |
— | (58,464 | ) | — | ||||||||
| Termination of consulting agreements |
— | (16,718 | ) | — | ||||||||
| Other income (expenses) |
2,375 | (500 | ) | (8,491 | ) | |||||||
|
|
|
|
|
|
|
|||||||
| Total other income (expenses) |
2,375 | (75,682 | ) | (8,491 | ) | |||||||
|
|
|
|
|
|
|
|||||||
| Total non-operating expenses |
(22,238 | ) | (112,372 | ) | (61,938 | ) | ||||||
|
|
|
|
|
|
|
|||||||
| Income (loss) before income taxes |
75,110 | (26,611 | ) | 17,708 | ||||||||
| Income tax expense (benefit) |
7,578 | (1,990 | ) | (59,658 | ) | |||||||
|
|
|
|
|
|
|
|||||||
| Net income (loss) |
67,532 | (24,621 | ) | 77,366 | ||||||||
|
|
|
|
|
|
|
|||||||
| Other comprehensive (loss) income, net of tax of $4, $59 and $13 |
||||||||||||
| Foreign currency translation adjustments |
(6,948 | ) | 1,268 | 476 | ||||||||
|
|
|
|
|
|
|
|||||||
| Total comprehensive income (loss) |
$ | 60,584 | $ | (23,353 | ) | $ | 77,842 | |||||
|
|
|
|
|
|
|
|||||||
| Net income (loss) per common share—basic |
$ | 0.86 | $ | (0.31 | ) | $ | 1.06 | |||||
|
|
|
|
|
|
|
|||||||
| Net income (loss) per common share—diluted |
$ | 0.86 | $ | (0.31 | ) | $ | 1.01 | |||||
|
|
|
|
|
|
|
|||||||
The accompanying notes are an integral part of these audited financial statements.
F-5
Table of Contents
Index to Financial Statements
EVERTEC, Inc. Consolidated Statements of Changes in Stockholders’ Equity
(Dollar amounts in thousands, except share data)
| Number of Shares of Common Stock |
Common Stock |
Additional Paid-in Capital |
Accumulated Earnings |
Accumulated Other Comprehensive (Loss) Income |
Total Stockholders’ Equity |
|||||||||||||||||||
| Balance at December 31, 2011 |
72,754,448 | $ | 726 | $ | 363,130 | $ | 3,638 | $ | (1,318 | ) | $ | 366,176 | ||||||||||||
| Issuance of common stock |
91,696 | 2 | 448 | 450 | ||||||||||||||||||||
| Share-based compensation recognized |
1,204 | 1,204 | ||||||||||||||||||||||
| Dividends (1) |
(312,627 | ) | (10,590 | ) | (323,217 | ) | ||||||||||||||||||
| Net income |
77,366 | 77,366 | ||||||||||||||||||||||
| Other comprehensive loss |
476 | 476 | ||||||||||||||||||||||
|
|
|
|
|
|
|
|
|
|
|
|
|
|||||||||||||
| Balance at December 31, 2012 |
72,846,144 | $ | 728 | $ | 52,155 | $ | 70,414 | $ | (842 | ) | $ | 122,455 | ||||||||||||
|
|
|
|
|
|
|
|
|
|
|
|
|
|||||||||||||
| Issuance of common stock upon initial public offering, net of offering costs |
6,250,000 | 63 | 112,369 | 112,432 | ||||||||||||||||||||
| Share-based compensation recognized |
6,179 | 6,179 | ||||||||||||||||||||||
| Tax windfall benefit on exercises of stock options and vesting of restricted stocks |
1,829 | 1,829 | ||||||||||||||||||||||
| Stock options exercised, net of cashless exercise |
2,880,357 | 29 | (16,851 | ) | (16,822 | ) | ||||||||||||||||||
| Repurchase of common stock |
(3,690,036 | ) | (37 | ) | (74,963 | ) | (75,000 | ) | ||||||||||||||||
| Net loss |
(24,621 | ) | (24,621 | ) | ||||||||||||||||||||
| Cash dividends paid on common stock |
(16,390 | ) | (16,390 | ) | ||||||||||||||||||||
| Other comprehensive income |
1,268 | 1,268 | ||||||||||||||||||||||
|
|
|
|
|
|
|
|
|
|
|
|
|
|||||||||||||
| Balance at December 31, 2013 |
78,286,465 | $ | 783 | $ | 80,718 | $ | 29,403 | $ | 426 | $ | 111,330 | |||||||||||||
|
|
|
|
|
|
|
|
|
|
|
|
|
|||||||||||||
| Share-based compensation recognized |
4,587 | 4,587 | ||||||||||||||||||||||
| Tax windfall benefit on exercises of stock options and vesting of restricted stocks |
3,669 | 3,669 | ||||||||||||||||||||||
| Stock options exercised, net of cashless exercise |
799,885 | 8.00 | (1,440 | ) | (1,432 | ) | ||||||||||||||||||
| Restricted stock units delivered |
7,988 | — | (26 | ) | (26 | ) | ||||||||||||||||||
| Repurchase of common stock |
(1,201,194 | ) | (12.00 | ) | (26,185 | ) | (26,197 | ) | ||||||||||||||||
| Net income |
67,532 | 67,532 | ||||||||||||||||||||||
| Dividend (2) |
21 | 21 | ||||||||||||||||||||||
| Cash dividends paid on common stock |
(31,359 | ) | (31,359 | ) | ||||||||||||||||||||
| Cash settlement of stock options |
(1,604 | ) | (1,604 | ) | ||||||||||||||||||||
| Other comprehensive loss |
(6,948 | ) | (6,948 | ) | ||||||||||||||||||||
|
|
|
|
|
|
|
|
|
|
|
|
|
|||||||||||||
| Balance at December 31, 2014 |
77,893,144 | $ | 779 | $ | 59,740 | $ | 65,576 | $ | (6,522 | ) | $ | 119,573 | ||||||||||||
|
|
|
|
|
|
|
|
|
|
|
|
|
|||||||||||||
| (1) | Includes an equitable adjustment to holders of outstanding stock options in consideration to dividends declared on December 18, 2012 amounting to approximately $3.6 million. |
| (2) | Related to dividend declared in 2012 and accrued upon vesting of stock options. Such options were forfeited during 2014. |
The accompanying notes are an integral part of these audited financial statements.
F-6
Table of Contents
Index to Financial Statements
EVERTEC, Inc. Consolidated Statements of Cash Flows
(Dollar amounts in thousands)
| Years ended December 31, | ||||||||||||
| 2014 | 2013 | 2012 | ||||||||||
| Cash flows from operating activities |
||||||||||||
| Net income (loss) |
$ | 67,532 | $ | (24,621 | ) | $ | 77,366 | |||||
| Adjustments to reconcile net income (loss) to net cash provided by operating activities: |
||||||||||||
| Depreciation and amortization |
65,988 | 70,366 | 71,492 | |||||||||
| Amortization of debt issue costs and premium and accretion of discount |
3,094 | 3,905 | 5,091 | |||||||||
| Write-off of debt issue costs, premium and discount accounted as loss on extinguishment of debt |
— | 16,555 | — | |||||||||
| Provision for doubtful accounts and sundry losses |
1,360 | 673 | 1,645 | |||||||||
| Deferred tax benefit |
(1,713 | ) | (5,702 | ) | (66,568 | ) | ||||||
| Share-based compensation |
4,587 | 6,179 | 1,204 | |||||||||
| Unrealized loss (gain) of indemnification assets |
446 | 383 | (966 | ) | ||||||||
| Amortization of a contract liability |
— | — | (703 | ) | ||||||||
| Loss on disposition of property and equipment and other intangibles |
734 | 538 | 1,671 | |||||||||
| Earnings of equity method investment |
(1,140 | ) | (935 | ) | (564 | ) | ||||||
| Dividend received from equity method investment |
326 | 984 | 1,630 | |||||||||
| Premium on issuance of long-term debt |
— | — | 2,000 | |||||||||
| (Increase) decrease in assets: |
||||||||||||
| Accounts receivable, net |
(6,608 | ) | 9,243 | (15,966 | ) | |||||||
| Prepaid expenses and other assets |
(1,067 | ) | 1,685 | 2,257 | ||||||||
| Other long-term assets |
3,365 | (1,381 | ) | (3,567 | ) | |||||||
| (Decrease) increase in liabilities: |
||||||||||||
| Accounts payable and accrued liabilities |
(2,883 | ) | (16,734 | ) | 6,800 | |||||||
| Income tax payable |
1,697 | (2,700 | ) | (424 | ) | |||||||
| Unearned income |
4,230 | 4,429 | 266 | |||||||||
|
|
|
|
|
|
|
|||||||
| Total adjustments |
72,416 | 87,488 | 5,298 | |||||||||
|
|
|
|
|
|
|
|||||||
| Net cash provided by operating activities |
139,948 | 62,867 | 82,664 | |||||||||
|
|
|
|
|
|
|
|||||||
| Cash flows from investing activities |
||||||||||||
| Net (increase) decrease in restricted cash |
(285 | ) | (494 | ) | 349 | |||||||
| Intangible assets acquired |
(15,046 | ) | (16,980 | ) | (10,896 | ) | ||||||
| Property and equipment acquired |
(10,898 | ) | (11,486 | ) | (16,613 | ) | ||||||
| Proceeds from sales of property and equipment |
59 | 16 | 118 | |||||||||
|
|
|
|
|
|
|
|||||||
| Net cash used in investing activities |
(26,170 | ) | (28,944 | ) | (27,042 | ) | ||||||
|
|
|
|
|
|
|
|||||||
| Cash flows from financing activities |
||||||||||||
| Proceeds from initial public offering, net of offering costs of $12,567 |
— | 112,432 | — | |||||||||
| Proceeds from issuance of long-term debt |
— | 700,000 | 208,725 | |||||||||
| Debt issuance costs |
— | (12,077 | ) | (2,174 | ) | |||||||
| Net (decrease) increase in short-term borrowings |
(27,000 | ) | 36,000 | 14,000 | ||||||||
| Proceeds from new short-term borrowing for purchase of equipment |
— | 1,800 | 12,995 | |||||||||
| Repayments of short-term borrowing for purchase of equipment |
(1,200 | ) | (13,596 | ) | — | |||||||
| Dividends paid |
(31,359 | ) | (16,390 | ) | (319,959 | ) | ||||||
| Statutory minimum withholding taxes paid on cashless exercises of stock options |
(2,001 | ) | (16,851 | ) | — | |||||||
| Tax windfall benefits on exercises of stock options and vesting of restricted stocks |
3,669 | 1,829 | — | |||||||||
| Issuance of common stock |
543 | 29 | 450 | |||||||||
| Repurchase of common stock |
(26,197 | ) | (75,000 | ) | — | |||||||
| Settlement of stock options |
(1,604 | ) | — | — | ||||||||
| Repayment and repurchase of long-term debt |
(19,000 | ) | (755,024 | ) | — | |||||||
| Repayment of other financing agreement |
— | (224 | ) | (225 | ) | |||||||
|
|
|
|
|
|
|
|||||||
| Net cash used in financing activities |
(104,149 | ) | (37,072 | ) | (86,188 | ) | ||||||
|
|
|
|
|
|
|
|||||||
| Net increase (decrease) in cash |
9,629 | (3,149 | ) | (30,566 | ) | |||||||
| Cash at beginning of the period |
22,485 | 25,634 | 56,200 | |||||||||
|
|
|
|
|
|
|
|||||||
| Cash at end of the period |
$ | 32,114 | $ | 22,485 | $ | 25,634 | ||||||
|
|
|
|
|
|
|
|||||||
| Supplemental disclosure of cash flow information: |
||||||||||||
| Cash paid for interest |
$ | 24,280 | $ | 41,340 | $ | 45,703 | ||||||
| Cash paid for income taxes |
976 | 2,340 | 2,837 | |||||||||
| Supplemental disclosure of non-cash activities: |
||||||||||||
| Liability related to unvested portion of stock options as a result of equitable adjustment (Note 14) |
$ | — | $ | — | $ | 3,151 | ||||||
| Payable due to vendor related to property and equipment and software acquired |
6,115 | 3,006 | — | |||||||||
The accompanying notes are an integral part of these audited financial statements.
F-7
Table of Contents
Index to Financial Statements
Notes to Audited Consolidated Financial Statements
| Note 1—The Company and Summary of Significant Accounting Policies |
F-9 | |||
| F-16 | ||||
| F-18 | ||||
| F-18 | ||||
| F-18 | ||||
| F-18 | ||||
| F-19 | ||||
| F-19 | ||||
| F-20 | ||||
| F-20 | ||||
| F-21 | ||||
| F-23 | ||||
| F-25 | ||||
| F-27 | ||||
| F-30 | ||||
| F-30 | ||||
| F-30 | ||||
| F-34 | ||||
| F-35 | ||||
| F-37 | ||||
| F-37 | ||||
| F-40 | ||||
F-8
Table of Contents
Index to Financial Statements
EVERTEC, Inc. Notes to Consolidated Financial Statements
Note 1—The Company and Summary of Significant Accounting Policies
The Company
EVERTEC, Inc. (formerly known as Carib Latam Holdings, Inc.) and its subsidiaries (collectively the “Company,” or “EVERTEC”) is the leading full-service transaction processing business in Latin America and the Caribbean. The Company is based in Puerto Rico and provides a broad range of merchant acquiring, payment processing and business process management services across 19 countries in the region. EVERTEC owns and operates the ATH network, one of the leading automated teller machine (“ATM”) and personal identification number (“PIN”) debit networks in Latin America. In addition, EVERTEC provides a comprehensive suite of services for core bank processing, cash processing and technology outsourcing in the regions the Company serves. EVERTEC serves a broad and diversified customer base of leading financial institutions, merchants, corporations and government agencies with “mission-critical” technology solutions that are essential to their operations, enabling them to issue, process and accept transactions securely. Management believes that the Company’s business is well-positioned to continue to expand across the fast-growing Latin American region.
Initial Public Offering and Other Public Offerings
On April 17, 2013, the Company completed its initial public offering of 28,789,943 shares of common stock at a price to the public of $20.00 per share. A total of 6,250,000 shares were offered by the Company and a total of 22,539,943 shares were offered by selling stockholders, of which 13,739,284 shares were sold by an affiliate of Apollo Global Management, LLC (“Apollo”) and 8,800,659 shares were sold by Popular, Inc. (“Popular”). The Company used the net proceeds of approximately $117.4 million, after the deduction of underwriting discount and commissions, from the sale of shares in the initial public offering and proceeds from borrowings under the 2013 Credit Agreement (as defined below), together with available cash on hand, to redeem the Company’s 11.0% senior notes due 2018 (the “senior notes”) and to refinance the Company’s previous senior secured credit facilities.
On September 18, 2013, the Company completed a public offering of 23,000,000 shares of the Company’s common stock by Apollo, Popular, and current and former employees at a price to the public of $22.50 per share. EVERTEC did not receive any proceeds from this offering. After the completion of the offering, Apollo owned approximately 9.2 million shares of EVERTEC’s common stock, or 11.2%, and Popular owned approximately 17.5 million shares of EVERTEC’s common stock, or 21.3%.
On December 13, 2013, the Company completed a public offering of 15,233,273 shares of its common stock by Apollo, Popular, and current and former employees at a price to the public of $20.60 per share. EVERTEC did not receive any proceeds from this offering. After the completion of the offering, Popular owned approximately 11.7 million shares of EVERTEC’s common stock, or 14.9%, and Apollo no longer owns any of the Company’s common stock.
Basis of Presentation
The consolidated financial statements of EVERTEC have been prepared in accordance with accounting principles generally accepted in the United States of America (“GAAP”). In the opinion of management, the accompanying consolidated financial statements, prepared in accordance with GAAP, contain all adjustments, all of which are normal and recurring in nature, necessary for a fair presentation. All significant intercompany accounts and transactions have been eliminated in consolidation.
Certain reclassifications have been made to the consolidated financial statements and related notes to conform with the presentation in 2014.
F-9
Table of Contents
Index to Financial Statements
EVERTEC, Inc. Notes to Consolidated Financial Statements
A summary of the most significant accounting policies used in preparing the accompanying consolidated financial statements is as follows:
Principles of Consolidation
The accompanying consolidated financial statements include the accounts and operations of the Company, which are presented in accordance with GAAP. The Company consolidates all entities that are controlled by ownership of a majority voting interest. All significant intercompany accounts and transactions are eliminated in the consolidated financial statements.
Use of Estimates
The preparation of the accompanying consolidated financial statements requires management to make estimates and assumptions that affect the reported amounts of assets and liabilities and disclosure of contingent assets and liabilities at the date of the financial statements and the reported amounts of revenues and expenses during the reporting period.
Revenue Recognition
The Company’s revenue recognition policy follows the guidance from Accounting Standards Codification (“ASC”) 605 Revenue Recognition; ASC 605-25, Revenue Recognition-Multiple Element Arrangements; and; ASC 985, Software, which provide guidance on the recognition, presentation, and disclosure of revenue in financial statements.
The Company recognizes revenue when the following four criteria are met: (i) persuasive evidence of an agreement exists, (ii) delivery and acceptance has occurred or services have been rendered, (iii) the selling price is fixed or determinable, and (iv) collection is reasonably assured. For multiple deliverable arrangements, EVERTEC evaluates each arrangement to determine if the elements or deliverables within the arrangement represent separate units of accounting pursuant to ASC 605-25. If the deliverables are determined to be separate units of accounting, revenues are recognized as these are delivered and revenue recognition criteria are met. If the deliverables are not determined to be separate units of accounting, revenues for the delivered services are combined into one unit of accounting and recognized (i) over the life of the arrangement if all services are consistently delivered over such term, or if otherwise, (ii) at the time that all services and deliverables have been delivered. The selling price for each deliverable is based on vendor specific objective evidence (“VSOE”) if available, third party evidence (“TPE”) if VSOE is not available, or management best estimate of selling price (“BESP”) if neither VSOE nor TPE is available. EVERTEC establishes VSOE of selling price using the price charged when the same element is sold separately. EVERTEC bifurcates or allocates the arrangement consideration to each of the deliverables based on the relative selling price of each unit of accounting.
The Company has two main categories of revenues according to the type of transactions EVERTEC enters into with the Company’s customers: (a) transaction-based fees and (b) fixed fees and time and material.
Transaction-based fees
The Company provides services that generate transaction-based fees. Typically transaction-based fees depend on factors such as number of accounts or transactions processed. These factors typically consist of a fee per transaction or item processed, a percentage of dollar volume processed or a fee per account on file, or some combination thereof. Revenue derived from the transaction-based fee contracts are recognized when the underlying transaction is processed, which constitutes delivery of service.
F-10
Table of Contents
Index to Financial Statements
EVERTEC, Inc. Notes to Consolidated Financial Statements
Revenues from business contracts in the Company’s Merchant Acquiring segment are primarily comprised of discount fees charged to the merchants based on the sales amount of transactions processed. Revenues include a discount fee and membership fees charged to merchants and debit network fees as well as point-of-sale (“POS”) rental fees. Pursuant to the guidance from ASC 605-45-45, Revenue Recognition—Principal Agent Considerations, EVERTEC records Merchant Acquiring revenues net of interchange and assessments charged by the credit and debit card network associations and recognizes such revenues at the time of the sale (when a transaction is processed).
Payment processing revenues are comprised of revenues related to providing access to the ATH network and other card networks to financial institutions, and related services. Payment processing revenues also include revenues from card issuer processing services (such as credit and debit card processing, authorization and settlement, and fraud monitoring and control to debit or credit card issuers), payment processing services (such as payment and billing products for merchants, businesses and financial institutions) and EBT (which principally consists of services to the Puerto Rico government for the delivery of government benefits to participants). Revenues in EVERTEC’s Payment Processing segment are primarily comprised of fees per transaction processed or per account on file, or a combination of both, and are recognized at the time transactions are processed or on a monthly basis for accounts on file.
Transaction-based fees within EVERTEC’s Business Solutions segment consist of revenues from business process management solutions including core bank processing, business process outsourcing, item and cash processing, and fulfillment. Transaction-based fee revenues generated by the Company’s core bank processing services are derived from fees based on various factors such as the number of accounts on file (e.g. savings or checking accounts, loans, etc.), and the number of transactions processed or registered users (e.g. for online banking services). For services dependent on the number of transactions processed, revenues are recognized as the underlying transactions are processed. For services dependent on the number of users or accounts on file, revenues are recognized on a monthly basis based on the number of accounts on file each month. Item and cash processing revenues are based upon the number of items (e.g. checks) processed and revenues are recognized when the underlying item is processed. Fulfillment services include technical and operational resources for producing and distributing variable print documents such as statements, bills, checks and benefits summaries. Fulfillment revenues are based upon the number pages for printing services and the number of envelopes processed for mailing services. Revenues are recognized as services are delivered based on a fee per page printed or envelope mailed, as applicable.
Fixed fees and time and material
The Company also provides services that generate a fixed fee per month or fees based on time and expenses incurred. These services are mostly provided in EVERTEC’s Business Solutions segment. Revenues are generated from EVERTEC’s core bank solutions, network hosting and management and IT consulting services.
In core bank solutions, the Company mostly provides access to applications and services such as back-up or recovery, hosting and maintenance that enable a bank to operate the related hosted services accessing the Company’s IT infrastructure. These contracts generally contain multiple elements or deliverables which are evaluated by EVERTEC and revenues are recognized according to the applicable guidance. Revenue is derived from fixed fees charged for the use of hosted services and are recognized on a monthly basis as delivered. Set-up fees are billed to the customer when the service is rendered; however, they are deferred and recognized as revenues over the term of the arrangement or the expected period of the customer relationship, whichever is longer, as set-up services rarely provide value to the customer on a stand-alone basis and are interrelated with the service to be provided under the contract.
In network hosting and management, EVERTEC provides hosting services for network infrastructure at EVETEC’s facilities; automated monitoring services; maintenance of call centers; interactive voice response
F-11
Table of Contents
Index to Financial Statements
EVERTEC, Inc. Notes to Consolidated Financial Statements
solutions, among other related services. Revenues are primarily derived from monthly fees as services are delivered. Set-up fees are billed up-front to the customer when the set-up service is rendered; however, they are deferred and recognized as revenues over the term of the arrangement or the expected period of the customer relationship, whichever is longer, as set-up services rarely provide value to the customer on a stand-alone basis and are interrelated with the service under the contract. There are some arrangements under this line of service category that may contain undelivered elements. In such cases, the undelivered elements are evaluated and recognized when the services are delivered or at the time that all deliverables under the contract have been delivered.
IT consulting services revenue primarily consists of time billings based upon the number of hours dedicated to each client. Revenue from time billings are recognized as services are delivered.
EVERTEC also charges members of the ATH network an annual membership fee; however, these fees are deferred and recognized as revenues on a straight-line basis over the year and recorded in the Company’s Payment Processing segment. In addition, occasionally EVERTEC is a reseller of hardware and software products and revenues from these resale transactions are recognized when such product is delivered and accepted by the client.
Service level arrangements
The Company’s service contracts may include service level arrangements (“SLA”) generally allowing the customer to receive a credit for part of the service fee when the Company has not provided the agreed level of services. The SLA performance obligation is committed on a monthly basis, thus SLA performance is monitored and assessed for compliance with arrangements on a monthly basis, including determination and accounting for its economic impact, if any.
Investment in Equity Investee
The Company accounts for investments using the equity method of accounting if the investment provides the Company the ability to exercise significant influence, but not control, over an investee. Significant influence is generally deemed to exist if the Company has an ownership interest in the voting stock of an investor of between 20 percent and 50 percent, although other factors are considered in determining whether the equity method of accounting is appropriate. Under this method, the investment, originally recorded at cost, is adjusted to recognize the Company’s share of net income or losses as they occur. The Company’s share of investee earnings or losses is recorded, net of taxes, within earnings in equity method investment caption in the consolidated statements of income (loss) and comprehensive income (loss). The Company’s consolidated revenues include fees for services provided to an investee accounted under the equity method. Additionally, the Company’s interest in the net asset of its equity method investee is reflected in the consolidated balance sheets. On the acquisition of the investment any difference between the cost of the investment and the amount of the underlying equity in net assets of an investee is required to be accounted as if the investee were a consolidated subsidiary. If the difference is assigned to depreciable or amortizable assets or liabilities, then the difference should be amortized or accreted in connection with the equity earnings based on the Company’s proportionate share of the investee’s net income or loss. If the investor is unable to relate the difference to specific accounts of the investee, the difference should be considered to be goodwill.
The Company considers whether the fair values of its equity method investment have declined below their carrying value whenever adverse events or changes in circumstances indicate that recorded values may not be recoverable. If the Company considered any such decline to be other than temporary (based on various factors, including historical financial results, product development activities and the overall health of the investee’s industry), then the Company would record a write-down to estimated fair value.
F-12
Table of Contents
Index to Financial Statements
EVERTEC, Inc. Notes to Consolidated Financial Statements
Property and Equipment
Property and equipment are stated at cost, net of accumulated depreciation and amortization. Depreciation of property and equipment is computed using the straight-line method and expensed over their estimated useful lives. Amortization of leasehold improvements is computed over the terms of the respective leases, including renewal options considered by management to be reasonably assured of being exercised, or the estimated useful lives of the improvements, whichever is shorter. Costs of maintenance and repairs which do not improve or extend the life of the respective assets are expensed as incurred.
Impairment on Long-lived Assets
Long-lived assets to be held and used, and long-lived assets to be disposed of, are evaluated for impairment whenever events or changes in circumstances indicate that the carrying amount of an asset may not be recoverable.
Capitalization of Software
EVERTEC Group develops software that is used in providing processing services to customers. Capitalized software includes purchased software and internally-developed software and is recognized as software packages within the other intangible assets line item in the consolidated balance sheets. Capitalization of internally developed software occurs only after the preliminary project stage is complete and management authorizes and commits to a software project and it is probable that the project will be completed. Tasks that are generally capitalized are as follows: (a) system design of a chosen path including software configuration and software interfaces; (b) employee costs directly associated with the internal-use computer software project; (c) software development (coding) and software and system testing and verification; (d) system installation; and (e) enhancements that add function and are considered permanent. These tasks are capitalized and amortized using the straight line method over its estimated useful life, which range from three to ten years and is included in depreciation and amortization in the consolidated statements of income (loss) and comprehensive income (loss).
Software and Maintenance Contracts
Software and maintenance contracts are recorded at cost. Amortization of software and maintenance contracts is computed using the straight-line method and expensed over their estimated useful lives which range from one to five years and are recognized in cost of revenues in the consolidated statements of income (loss) and comprehensive income (loss).
Software and maintenance contracts are recognized as prepaid expenses and other assets or within other long-term assets depending on their remaining useful lives.
Goodwill and Other Intangible Assets
Goodwill represents the excess of the purchase price and related costs over the value assigned to net assets acquired. Goodwill is not amortized, but is tested for impairment at least annually, or more often if events or circumstances indicate there may be impairment.
For 2014, the Company used a “qualitative assessment” option or “step zero” for the goodwill impairment test for all of its reporting units. With this process, the Company first assesses whether it is “more likely than not” that the fair value of a reporting unit is less than its carrying amount. If the answer is no, then the fair value of the reporting unit does not need to be measured, and step one and step two, as explained below, are bypassed. In
F-13
Table of Contents
Index to Financial Statements
EVERTEC, Inc. Notes to Consolidated Financial Statements
assessing the fair value of a reporting unit, which is based on the nature of the business and reporting unit’s current and expected financial performance, the Company uses a combination of factors such as industry and market conditions, overall financial performance and the entity and reporting unit specific events.
In the past, the goodwill impairment test used was a two-step process at each reporting unit level. The first step used to identify potential impairment, compared the fair value of a reporting unit with its carrying amount, including goodwill. If the fair value of a reporting unit exceeded its carrying amount, goodwill of the reporting unit was not considered impaired and the second step of the impairment test was unnecessary. If needed, the second step consisted of comparing the implied fair value of the reporting unit with the carrying amount of that goodwill.
For the years ended December 31, 2014, 2013 and 2012, no impairment losses associated with goodwill were recognized.
Other identifiable intangible assets with a definitive useful life are amortized using the straight-line method. These intangibles are evaluated periodically for impairment when events or changes in circumstances indicate that the carrying amount may not be recoverable.
Other identifiable intangible assets with a definitive useful life were acquired during September 2010 when Apollo acquired a 51% indirect ownership interest in EVERTEC as part of a merger (the “Merger”) and include customer relationship, trademark, software packages and non-compete agreement. Customer relationship was valued using the excess earnings method under the income approach. Trademark was valued using the relief-from-royalty method under the income approach. Software packages, which include capitalized software development costs, were recorded at cost. Non-compete agreement was valued based on the estimated impact that theoretical competition would have on revenues and expenses.
Indemnification Assets
Indemnification assets represent the Company’s estimates of payments from Popular related to expected losses on services provided to certain common customers of the Company and Popular, and for certain incremental software and license costs expected to be incurred by the Company (see Note 19) during the five years following the Merger date. Indemnification assets are recorded at the fair value of the expected cash flows. The indemnification asset decreases by the payments received from Popular and is subsequently adjusted to reflect the asset at fair value. The fair value adjustment, if any, is included in current period earnings. As of December 31, 2014 and 2013, the Company’s indemnification related to the software amounted to $1.4 million and $3.6 million, respectively. The current portion of the indemnification assets is included within accounts receivable, net and the other long-term portion is included within other long-term assets in the accompanying consolidated balance sheets. During 2012, the agreement for reimbursement of expected costs with Popular expired. Therefore, no fair value was recorded as of December 31, 2014, 2013 or 2012. For the year ended December 31, 2012, the Company recorded a gain amounting to $1.0 million. The Company recorded a $0.4 million loss in 2014, a $0.4 million loss for 2013, and a gain of $33,000 for 2012, related to the software.
Income Tax
Income taxes are accounted for under the asset and liability method. Deferred tax assets and liabilities are recognized for the future tax consequences attributable to differences between the financial statement carrying amounts of existing assets and liabilities and their respective tax bases and operating loss and tax credit carryforwards. Deferred tax assets and liabilities are measured using enacted tax rates expected to apply to taxable income in the years in which those temporary differences are expected to be recovered or settled. The
F-14
Table of Contents
Index to Financial Statements
EVERTEC, Inc. Notes to Consolidated Financial Statements
effect on deferred tax assets and liabilities of a change in tax rates is recognized in the consolidated statements of income (loss) and comprehensive income (loss) in the period that includes the enactment date. The Company recognizes the effect of income tax positions only if those positions are more likely than not of being sustained. Recognized income tax positions are measured at the largest amount that is greater than 50% likely of being realized. Changes in recognition or measurement are reflected in the period in which the change in judgment occurs. A deferred tax valuation allowance is established if it is considered more likely than not that all or a portion of the deferred tax asset will not be realized.
All companies within EVERTEC are legal entities which file separate income tax returns.
Cash
Cash includes cash on hand and in banks.
Restricted Cash
Restricted cash represents cash received on deposits from participating institutions of the ATH network that has been segregated for the development of the ATH brand. Also, restricted cash includes certain cash collected from the Ticketpop business and a reserve account for payment and transaction processing services to merchants. The restrictions of these accounts are based on contractual provisions entered into with third parties. This cash is maintained in separate accounts at a financial institution in Puerto Rico.
Allowance for Doubtful Accounts
An allowance for doubtful accounts is provided for based on the estimated uncollectible amounts of the related receivables. The estimate is primarily based on a review of the current status of specific accounts receivable. Receivables are considered past due if full payment is not received by the contractual date. Past due accounts are generally written off against the allowance for doubtful accounts only after all collection attempts have been exhausted.
Foreign Currency Translation
Assets and liabilities denominated in foreign currencies are translated to U.S. dollars using prevailing rates of exchange at the end of the period. Revenues, expenses, gains and losses are translated using weighted average rates for the period. The resulting foreign currency translation adjustment from operations for which the functional currency is other than the U.S. dollar is reported in accumulated other comprehensive income (loss). Gains and losses on transactions denominated in currencies other than the functional currencies are included in determining net income for the period in which exchange rates change.
Share-based Compensation
The Company estimates the fair value of stock-based awards, on a contemporaneous basis, at the date they are granted using the Black-Scholes-Merton option pricing model for Tranche A options and the Monte Carlo simulation analysis for Tranche B and Tranche C options using the following assumptions: (1) stock price; (2) risk-free rate; (3) expected volatility; (4) expected annual dividend yield and (5) expected term. The risk-free rate is based on the U.S. Constant Maturities Treasury Interest Rate as of the grant date. The expected volatility is based on a combination of historical volatility and implied volatility from publicly traded companies in the
F-15
Table of Contents
Index to Financial Statements
EVERTEC, Inc. Notes to Consolidated Financial Statements
Company’s industry. The expected annual dividend yield is based on management’s expectations of future dividends as of the grant date. The expected term for stock options granted under the 2010 Plan was based on the vesting time of the options. For the stock options granted under the 2013 Plan, the simplified method was used to estimate the expected term, given that the Company does not have appropriate exercise data on which to base the estimate nor is exercise data relating to employees of comparable companies easily obtainable.
Upon option exercise, participants may elect to “net share settle”. Rather than requiring the participant to deliver cash to satisfy the exercise price and statutory minimum tax withholdings, the Company withholds a sufficient number of shares to cover these amounts and delivers the net shares to the participant. The Company recognizes the associated tax withholding obligation as a reduction of additional paid-in capital.
As compensation expense is recognized, a deferred tax asset is established. At the time stock options are exercised, a current tax deduction arises based on the value at the time of exercise. This deduction may exceed the associated deferred tax asset, resulting in a “windfall tax benefit”. The windfall is recognized in the consolidated balance sheet as an increase to additional paid-in capital, and is included in the consolidated statement of cash flows as a financing inflow.
In determining the amount of cash tax savings realized from the excess share-based compensation deductions, the Company follows the tax law ordering approach. Under this approach, the utilization of excess tax deductions associated with share-based awards is dictated by provision in the tax law that identify the sequence in which such benefits are utilized for tax purposes.
Net Income (Loss) Per Common Share
Basic net income (loss) per common share is determined by dividing net income (loss) by the weighted-average number of common shares outstanding during the period.
Diluted net income (loss) per common share assumes the issuance of all potentially dilutive share equivalents using the treasury stock method. For stock options it is assumed that the proceeds will be used to buy back shares. Such proceeds equal the average unrecognized compensation plus exercise price and windfall tax benefits. For unvested restricted shares, the proceeds equal the average unrecognized compensation plus windfall tax benefits.
Note 2—Recent Accounting Pronouncements
The Financial Accounting Standards Board (“FASB”) has issued the following accounting pronouncements and guidance relevant to the Company’s operations:
In May 2014, the FASB issued updated guidance for revenue recognition. The core principle of the guidance is that an entity should recognize revenue to depict the transfer of promised goods or services to customers in an amount that reflects the consideration to which the entity expects to be entitled in exchange for those goods or services. To achieve that core principle, an entity should apply the following steps: identify the contract(s) with a customer; identify the performance obligations in the contract; determine the transaction price; allocate the transaction price to the performance obligations in the contract; and recognize revenue when (or as) the entity satisfies a performance obligation. The guidance also specifies the accounting for some costs to obtain or fulfill a contract with a customer. In addition, the updated guidance enhances and expands disclosures regarding revenue recognition. The amendments in this Update are effective for annual reporting periods beginning after December 15, 2016, including interim periods within that reporting period. Early application is not permitted. The Company is currently evaluating the impact of the adoption of this guidance on its financial statements.
F-16
Table of Contents
Index to Financial Statements
EVERTEC, Inc. Notes to Consolidated Financial Statements
In August 2014, the FASB issued updated guidance relating to disclosures for uncertainties about an entity’s ability to continue as a going concern. The amendments require management to assess an entity’s ability to continue as a going concern by incorporating and expanding upon certain principles that are currently in U.S. auditing standards. Specifically, the amendments (1) provide a definition of the term substantial doubt, (2) require an evaluation every reporting period including interim periods, (3) provide principles for considering the mitigating effect of management’s plans, (4) require certain disclosures when substantial doubt is alleviated as a result of consideration of management’s plans, (5) require an express statement and other disclosures when substantial doubt is not alleviated, and (6) require an assessment for a period of one year after the date that the financial statements are issued (or available to be issued). The amendments in this Update are effective for annual reporting periods ending after December 15, 2016, and for annual and interim periods thereafter. Early application is permitted. The Company does not expect this guidance to have an impact on the financial statements when adopted.
In November 2014, the FASB issued updated guidance relating to pushdown accounting for business combinations. The amendments in this Update provide an acquired entity with an option to apply pushdown accounting in its separate financial statements upon occurrence of an event in which an acquirer obtains control of the acquired entity. An acquired entity may elect the option to apply pushdown accounting in the reporting period in which the change-in-control event occurs. An acquired entity should determine whether to elect to apply pushdown accounting for each individual change-in-control event in which an acquirer obtains control of the acquired entity. If pushdown accounting is not applied in the reporting period in which the change-in-control event occurs, an acquired entity will have the option to elect to apply pushdown accounting in a subsequent reporting period to the acquired entity’s most recent change-in-control event. An election to apply pushdown accounting in a reporting period after the reporting period in which the change-in-control event occurred should be considered a change in accounting principle in accordance with Topic 250, Accounting Changes and Error Corrections. If pushdown accounting is applied to an individual change-in-control event, that election is irrevocable. If an acquired entity elects the option to apply pushdown accounting in its separate financial statements, it should disclose information in the current reporting period that enables users of financial statements to evaluate the effect of pushdown accounting. The amendments in this Update are effective on November 18, 2014. For the year ended December 31, 2014, the adoption of this guidance did not have an impact on the consolidated financial statements.
In January 2015, the FASB issued updated guidance eliminating from GAAP the concept of extraordinary items. Subtopic 225-20, Income Statement—Extraordinary and Unusual Items, required that an entity separately classify, present, and disclose extraordinary events and transactions. Presently, an event or transaction is presumed to be an ordinary and usual activity of the reporting entity unless evidence clearly supports its classification as an extraordinary item. Eliminating the concept of extraordinary items will save time and reduce costs for preparers because they will not have to assess whether a particular event or transaction event is extraordinary. This also alleviates uncertainty for preparers, auditors, and regulators because auditors and regulators no longer will need to evaluate whether a preparer treated an unusual and/or infrequent item appropriately. This Update will align more closely GAAP income statement presentation guidance with IAS 1, Presentation of Financial Statements, which prohibits the presentation and disclosure of extraordinary items. The amendments in this Update are effective for fiscal years, and interim periods within those fiscal years, beginning after December 15, 2015. A reporting entity may apply the amendments prospectively. A reporting entity also may apply the amendments retrospectively to all prior periods presented in the financial statements. Early adoption is permitted provided that the guidance is applied from the beginning of the fiscal year of adoption. The effective date is the same for both public business entities and all other entities. The Company is currently evaluating the impact, if any, of the adoption of this guidance on its financial statements.
F-17
Table of Contents
Index to Financial Statements
EVERTEC, Inc. Notes to Consolidated Financial Statements
At December 31, 2014 and 2013, the Company’s cash amounted to $32.1 million and $22.5 million, respectively, which is deposited in interest bearing deposit accounts within financial institutions. Cash deposited in an affiliate financial institution amounted to $7.8 million and $8.5 million as of December 31, 2014 and 2013, respectively.
Note 4—Accounts Receivable, Net
Accounts receivable, net consisted of the following:
| December 31, | ||||||||
| (Dollar amounts in thousands) | 2014 | 2013 | ||||||
| Trade |
$ | 53,503 | $ | 46,200 | ||||
| Due from affiliates, net |
13,140 | 12,030 | ||||||
| Settlement assets |
9,868 | 11,157 | ||||||
| Other |
306 | 69 | ||||||
| Less: allowance for doubtful accounts |
(1,007 | ) | (1,022 | ) | ||||
|
|
|
|
|
|||||
| Accounts receivable, net |
$ | 75,810 | $ | 68,434 | ||||
|
|
|
|
|
|||||
The Company records settlement assets that result from timing differences in the Company’s settlement processes with merchants, financial institutions, and credit card associations related to merchant and card transaction processing. The amounts are generally collected or paid the following business day.
Note 5—Prepaid Expenses and Other Assets
Prepaid expenses and other assets consisted of the following:
| December 31, | ||||||||
| (Dollar amounts in thousands) | 2014 | 2013 | ||||||
| Taxes other than income |
$ | 1,102 | $ | 859 | ||||
| Software licenses and maintenance contracts |
7,028 | 6,570 | ||||||
| Prepaid income taxes |
3,726 | 5,278 | ||||||
| Postage |
709 | 1,675 | ||||||
| Insurance |
1,321 | 1,120 | ||||||
| Deferred project costs |
3,040 | 1,958 | ||||||
| Other |
3,639 | 2,022 | ||||||
|
|
|
|
|
|||||
| Prepaid expenses and other assets |
$ | 20,565 | $ | 19,482 | ||||
|
|
|
|
|
|||||
Note 6—Investment in Equity Investee
CONTADO is the largest merchant acquirer and ATM network in the Dominican Republic. The Company uses the equity method of accounting to account for its equity interest in CONTADO. As a result of the acquisition in 2011 of CONTADO’s 19.99% equity interest, the Company preliminarily calculated an excess cost of the investment in CONTADO over the amount of underlying equity in net assets of approximately $9.0 million, which was mainly attributed to customer relationships, trademark and goodwill intangibles. The Company’s excess basis allocated to amortizable assets is recognized on a straight-line basis over the lives of the appropriate intangibles. Amortization expense for the years ended December 31, 2014, 2013 and 2012 amounted to approximately $0.3 million, $0.3 million and $0.4 million, respectively, was recorded as earnings of equity method investments in the consolidated statements of income (loss) and comprehensive income (loss). The
F-18
Table of Contents
Index to Financial Statements
EVERTEC, Inc. Notes to Consolidated Financial Statements
Company recognized $1.1 million, $0.9 million and $0.6 million as equity in CONTADO’s net income, net of amortization, in the consolidated statements of income (loss) and comprehensive income (loss) for the years ended December 31, 2014, 2013 and 2012, respectively. For the years ended December 31, 2014, 2013 and 2012, the Company received $0.3 million, $1.0 million and $1.6 million, respectively in dividends from CONTADO.
CONTADO fiscal year ends December 31 and is reported in the consolidated statements of income (loss) and comprehensive income (loss) for the period subsequent to the acquisition date on a one month lag. No significant event occurred in these operations subsequent to November 30, 2014 that would have materially affected the Company’s reported results.
Note 7—Property and Equipment, Net
Property and equipment, net consisted of the following:
| Useful life in years |
December 31, | |||||||||
| (Dollar amounts in thousands) | 2014 | 2013 | ||||||||
| Buildings |
30 | $ | 1,602 | $ | 1,726 | |||||
| Data processing equipment |
3 - 5 | 77,588 | 68,273 | |||||||
| Furniture and equipment |
3 - 20 | 7,540 | 6,385 | |||||||
| Leasehold improvements |
5 - 10 | 2,964 | 2,880 | |||||||
|
|
|
|
|
|||||||
| 89,694 | 79,264 | |||||||||
| Less—accumulated depreciation and amortization |
(61,580 | ) | (47,555 | ) | ||||||
|
|
|
|
|
|||||||
| Depreciable assets, net |
28,114 | 31,709 | ||||||||
| Land |
1,421 | 1,531 | ||||||||
|
|
|
|
|
|||||||
| Property and equipment, net |
$ | 29,535 | $ | 33,240 | ||||||
|
|
|
|
|
|||||||
Depreciation and amortization expense related to property and equipment was $15.5 million, $16.2 million and $16.4 million for the years ended December 31, 2014, 2013 and 2012, respectively.
The changes in the carrying amount of goodwill, allocated by reportable segments, were as follows (See Note 21):
| (Dollar amounts in thousands) | Merchant acquiring, net |
Payment processing |
Business solutions |
Total | ||||||||||||
| Balance at December 31, 2011 |
$ | 138,121 | $ | 186,470 | $ | 47,121 | $ | 371,712 | ||||||||
| Foreign currency translation adjustments |
— | 558 | 37 | 595 | ||||||||||||
|
|
|
|
|
|
|
|
|
|||||||||
| Balance at December 31, 2012 |
138,121 | 187,028 | 47,158 | 372,307 | ||||||||||||
| Foreign currency translation adjustments |
— | 594 | 218 | 812 | ||||||||||||
|
|
|
|
|
|
|
|
|
|||||||||
| Balance at December 31, 2013 |
138,121 | 187,622 | 47,376 | 373,119 | ||||||||||||
| Foreign currency translation adjustments |
— | (3,394 | ) | (888 | ) | (4,282 | ) | |||||||||
|
|
|
|
|
|
|
|
|
|||||||||
| Balance at December 31, 2014 |
$ | 138,121 | $ | 184,228 | $ | 46,488 | $ | 368,837 | ||||||||
|
|
|
|
|
|
|
|
|
|||||||||
Goodwill is tested for impairment on an annual basis, or more often if events or circumstances indicate there may be impairment, using the qualitative assessment option or step zero process. Using this process, the Company first assesses whether it is “more likely than not” that the fair value of a reporting unit is less than its carrying amount.
F-19
Table of Contents
Index to Financial Statements
EVERTEC, Inc. Notes to Consolidated Financial Statements
During the third quarter of 2014, the Company conducted a qualitative assessment of each reporting unit’s fair value as of August 31, 2014. As part of the Company’s qualitative assessment, EVERTEC considered the results for the Company’s 2011 impairment test (which indicated that the fair value of each reporting unit was in excess of 30% of its carrying amount) as well as current market conditions and changes in the carrying amount of the Company’s reporting units that occurred subsequent to the 2011 impairment test. Based on the results of this qualitative assessment, EVERTEC believes the fair value of goodwill for each of the Company’s reporting units continues to exceed their respective carrying amounts and concluded that it was not necessary to conduct the two-step goodwill impairment test. Accordingly, no impairment losses for the period were recognized.
Note 9—Other Intangible Assets
The carrying amount of other intangible assets consisted of the following:
| December 31, 2014 | ||||||||||||||
| (Dollar amounts in thousands) | Useful life in years | Gross amount |
Accumulated amortization |
Net carrying amount |
||||||||||
| Customer relationships |
14 | $ | 312,735 | $ | (95,482 | ) | $ | 217,253 | ||||||
| Trademark |
10 - 15 | 39,950 | (14,722 | ) | 25,228 | |||||||||
| Software packages |
3 - 10 | 138,188 | (86,605 | ) | 51,583 | |||||||||
| Non-compete agreement |
15 | 56,539 | (16,019 | ) | 40,520 | |||||||||
|
|
|
|
|
|
|
|||||||||
| Other intangible assets, net |
$ | 547,412 | $ | (212,828 | ) | $ | 334,584 | |||||||
|
|
|
|
|
|
|
|||||||||
| December 31, 2013 | ||||||||||||||
| (Dollar amounts in thousands) | Useful life in years | Gross amount |
Accumulated amortization |
Net carrying amount |
||||||||||
| Customer relationships |
14 | $ | 314,036 | $ | (73,180 | ) | $ | 240,856 | ||||||
| Trademark |
10 - 15 | 39,950 | (11,258 | ) | 28,692 | |||||||||
| Software packages |
3 - 10 | 119,598 | (65,655 | ) | 53,943 | |||||||||
| Non-compete agreement |
15 | 56,539 | (12,250 | ) | 44,289 | |||||||||
|
|
|
|
|
|
|
|||||||||
| Other intangible assets, net |
$ | 530,123 | $ | (162,343 | ) | $ | 367,780 | |||||||
|
|
|
|
|
|
|
|||||||||
Amortization expense related to intangibles was $50.5 million, $54.2 million and $55.1 million for the years ended December 31, 2014, 2013 and 2012, respectively. Amortization expense related to software costs was $21.0 million, $24.5 million and $25.4 million for the years ended December 31, 2014, 2013 and 2012, respectively. The estimated amortization expenses of balances outstanding at December 31, 2014 for the next five years are as follows:
| (Dollar amounts in thousands) | ||||
| 2015 |
$ | 48,083 | ||
| 2016 |
38,025 | |||
| 2017 |
34,879 | |||
| 2018 |
32,392 | |||
| 2019 |
31,593 | |||
Note 10—Other Long-Term Assets
As of December 31, 2014, other long-term assets included $9.3 million related to deferred debt-issuance costs and $1.6 million related to the long-term portion of certain software and maintenance contracts.
F-20
Table of Contents
Index to Financial Statements
EVERTEC, Inc. Notes to Consolidated Financial Statements
As of December 31, 2013, other long-term assets included $11.5 million related to deferred debt-issuance costs, $1.7 million related to the long-term portion of certain indemnification asset (See Note 19) and $5.0 million related to the long-term portion of certain software and maintenance contracts.
Note 11—Debt and Short-Term Borrowings
Total debt was as follows:
| December 31, | ||||||||
| (Dollar amounts in thousands) | 2014 | 2013 | ||||||
| Senior Secured Credit Facility (Term A) due on April 17, 2018 paying interest at a variable interest rate (London InterBank Offered Rate (“LIBOR”) plus applicable margin (1)(3)) |
$ | 277,239 | $ | 292,153 | ||||
| Senior Secured Credit Facility (Term B) due on April 17, 2020 paying interest at a variable interest rate (LIBOR plus applicable margin (2)(3)) |
389,340 | 392,527 | ||||||
| Senior Secured Revolving Credit Facility expiring on April 17, 2018 paying interest at a variable interest rate |
23,000 | 50,000 | ||||||
| Other short-term borrowing |
— | 1,200 | ||||||
| Note Payable due on October 1, 2017 (3) |
4,333 | — | ||||||
|
|
|
|
|
|||||
| Total debt |
$ | 693,912 | $ | 735,880 | ||||
|
|
|
|
|
|||||
| (1) | Applicable margin of 2.50% at December 31, 2014 and 2013. |
| (2) | Subject to a minimum rate (“LIBOR floor”) of 0.75% plus applicable margin of 2.75% at December 31, 2014 and 2013. |
| (3) | Includes unamortized discount. |
Senior Secured Credit Facilities
On April 17, 2013, EVERTEC Group entered into a credit agreement (the “2013 Credit Agreement”) governing the senior secured credit facilities, consisting of a $300.0 million term loan A facility (the “Term A Loan”) which matures on April 17, 2018, a $400.0 million term loan B facility (the “Term B Loan”) which matures on April 17, 2020 and a $100.0 million revolving credit facility which matures on April 17, 2018. The net proceeds received by EVERTEC Group from the new senior secured credit facilities, together with other cash available to EVERTEC Group, were used to, among other things, refinance EVERTEC Group’s previous senior secured credit facilities and redeem a portion of the senior notes, as further described below.
As a result of the debt refinancing, EVERTEC Group’s previous senior secured credit facilities were evaluated under ASC 470-50, Debtor’s Accounting for a Modification or Exchange of Debt Instruments. Accordingly, a portion of the unamortized discount and debt issue costs amounting to $6.4 million and $5.9 million, respectively, were treated as a modification and is amortized over the term of the new debt using the interest method. The remaining unamortized discount and debt issue costs of $3.4 million and $3.0 million, respectively, were considered to be related to the portion of the debt that was extinguished and written-off.
Senior Notes
On March 29, 2013, EVERTEC Group provided notice to Wilmington Trust, National Association (the “Trustee”) pursuant to the Indenture, dated as of September 30, 2010 (as supplemented by Supplemental Indenture No. 1, dated as of April 17, 2012, Supplemental Indenture No. 2, dated as of May 7, 2012 and Supplemental Indenture No. 3, dated as of May 7, 2012) between EVERTEC Group and EVERTEC Finance
F-21
Table of Contents
Index to Financial Statements
EVERTEC, Inc. Notes to Consolidated Financial Statements
Corp. (together, the “Co-Issuers”), the Guarantors named therein and the Trustee (the “Indenture”), that the Co-Issuers had elected to (i) redeem $91.0 million principal amount of their outstanding senior notes, at a redemption price of 111.0%, plus accrued and unpaid interest, on April 29, 2013 (the “Partial Redemption”) and (ii) redeem all of their outstanding senior notes (after giving effect to the redemption of $91.0 million principal amount of the senior notes described in clause (i)) at a redemption price of 100.0% plus a make-whole premium and accrued and unpaid interest, on April 30, 2013 (the “Full Redemption”). On April 17, 2013, the Co-Issuers and the Trustee entered into a Satisfaction and Discharge Agreement whereby EVERTEC Group caused to be irrevocably deposited with the Trustee, to satisfy and to discharge the Co-Issuers’ obligations under the Indenture (a) a portion of the net cash proceeds received by the Company in the initial public offering to Holdings, which contributed such proceeds to EVERTEC Group, in an amount sufficient to effect the Partial Redemption on April 29, 2013 and (b) proceeds from the 2013 Credit Agreement described above in an amount sufficient to effect the Full Redemption on April 30, 2013. On April 29, 2013, the Partial Redemption was effected and on April 30, 2013, the Full Redemption was effected.
Based on accounting guidance, the senior notes were considered extinguished. Accordingly, the outstanding premium of $1.8 million and unamortized debt issuance costs of $7.0 million were written-off and presented as a loss on extinguishment of debt. In addition, the redemption premium payments totaling $41.9 million were accounted for as a loss on extinguishment of debt.
Senior Secured Credit Facilities
Term A Loan
As of December 31, 2014, the outstanding principal amount of the Term A Loan was $277.5 million. The Term A Loan requires principal payments on the last business day of each quarter equal to (a) 1.250% of the original principal amount commencing on September 30, 2013 through June 30, 2016; (b) 1.875% of the original principal amount from September 30, 2016 through June 30, 2017; (c) 2.50% of the original principal amount from September 30, 2017 through March 31, 2018; and (d) the remaining outstanding principal amount on the maturity of the Term A Loan on April 17, 2018. Interest is based on EVERTEC Group’s first lien secured net leverage ratio and payable at a rate equal to, at the Company’s option, either (a) LIBOR Rate plus an applicable margin ranging from 2.00% to 2.50%, or (b) Base Rate plus an applicable margin ranging from 1.00% to 1.50%. Term A Loan has no LIBOR Rate or Base Rate minimum or floor.
Term B Loan
As of December 31, 2014, the outstanding principal amount of the Term B Loan was $394.0 million. The Term B Loan requires principal payments on the last business day of each quarter equal to 0.250% of the original principal amount commencing on September 30, 2013 and the remaining outstanding principal amount on the maturity of the Term B Loan on April 17, 2020. Interest is based on EVERTEC Group’s first lien secured net leverage ratio and payable at a rate equal to, at the Company’s option, either (a) LIBOR Rate plus an applicable margin ranging from 2.50% to 2.75%, or (b) Base Rate plus an applicable margin ranging from 1.50% to 1.75%. The LIBOR Rate and Base Rate are subject to floors of 0.75% and 1.75%, respectively.
Revolving Credit Facility
The revolving credit facility has an available balance up to $100.0 million, with an interest rate on loans calculated the same as the applicable Term A Loan rate. The facility matures on April 17, 2018 and has a “commitment fee” payable one business day after the last business day of each quarter calculated based on the daily unused commitment during the preceding quarter. The commitment fee for the unused portion of this facility ranges from 0.125% to 0.375% and is based on EVERTEC Group’s first lien secured net leverage ratio. As of December 31, 2014, the outstanding balance of the revolving credit facility was $23.0 million.
F-22
Table of Contents
Index to Financial Statements
EVERTEC, Inc. Notes to Consolidated Financial Statements
All loans may be prepaid without premium or penalty.
The senior secured credit facilities were evaluated under accounting guidance and accordingly, $7.2 million of debt issue costs were capitalized and are being amortized over the term of the new debt using the interest method and $4.9 million of debt issue costs were expensed and are presented in the Company’s financial statements as a loss on the extinguishment of debt.
The senior secured credit facilities contain various restrictive covenants. The Term A Loan and the revolving credit facility (subject to certain exceptions) require the Company to maintain on a quarterly basis a specified maximum senior secured leverage ratio of up to 6.60 to 1.00 as defined in the 2013 Credit Agreement (total first lien secured debt to adjusted EBITDA). In addition, the 2013 Credit Agreement, among other things: (a) limits the Company’s ability and the ability of the Company’s subsidiaries to incur additional indebtedness, incur liens, pay dividends or make certain other restricted payments and enter into certain transactions with affiliates; (b) restricts the Company’s ability to enter into agreements that would restrict the ability of the Company’s subsidiaries to pay dividends or make certain payments to EVERTEC; and (c) places restrictions on the Company’s ability and the ability of the Company’s subsidiaries to merge or consolidate with any other person or sell, assign, transfer, convey or otherwise dispose of all or substantially all of the Company’s assets. As of December 31, 2014, the Company was in compliance with the applicable restrictive covenants under the 2013 Credit Agreement.
Other short-term borrowing
In August 2013, EVERTEC entered into a financing agreement in the ordinary course of business to purchase certain hardware, software, maintenance and related services in the amount of $1.8 million to be repaid in three installments over a term of eight months. As of December 31, 2014, this other short-term borrowing had been fully repaid.
Note payable
In December 2014, EVERTEC entered into a non-interest bearing $4.6 million financing agreement to purchase softwares. The note will be repaid over a 36-month term in twelve quarterly installments. Prepayment penalties apply. As of December 31, 2014 the outstanding principal balance of this note payable is $4.6 million. The current portion of this note is recorded as part of accounts payable and the long-term portion is included in other long-term liabilities.
Note 12—Financial Instruments and Fair Value Measurements
Recurring Fair Value Measurements
Fair value measurement provisions establish a fair value hierarchy that requires an entity to maximize the use of observable inputs and minimize the use of unobservable inputs when measuring fair value. These provisions describe three levels of input that may be used to measure fair value:
Level 1: Inputs are unadjusted, quoted prices for identical assets or liabilities in active markets at the measurement date.
Level 2: Inputs, other than quoted prices included in Level 1, that are observable for the asset or liability through corroboration with market data at the measurement date.
Level 3: Unobservable inputs that reflect management’s best estimate of what market participants would use in pricing the asset or liability at the measurement date.
F-23
Table of Contents
Index to Financial Statements
EVERTEC, Inc. Notes to Consolidated Financial Statements
The Company uses observable inputs when available. Fair value is based upon quoted market prices when available. If market prices are not available, the Company may employ internally-developed models that mostly use market-based inputs including yield curves, interest rates, volatilities, and credit curves, among others. The Company limits valuation adjustments to those deemed necessary to ensure that the financial instrument’s fair value adequately represents the price that would be received or paid in the marketplace. Valuation adjustments may include consideration of counterparty credit quality and liquidity as well as other criteria. The estimated fair value amounts are subjective in nature and may involve uncertainties and matters of significant judgment for certain financial instruments. Changes in the underlying assumptions used in estimating fair value could affect the results. The fair value measurement levels are not indicative of risk of investment.
The following table summarizes fair value measurements by level at December 31, 2014 and 2013, for assets measured at fair value on a recurring basis:
| (Dollar amounts in thousands) | Level 1 | Level 2 | Level 3 | Total | ||||||||||||
| December 31, 2014 |
||||||||||||||||
| Financial assets: |
||||||||||||||||
| Indemnification assets: |
||||||||||||||||
| Software cost reimbursement |
$ | — | $ | — | $ | 1,428 | $ | 1,428 | ||||||||
| December 31, 2013 |
||||||||||||||||
| Financial assets: |
||||||||||||||||
| Indemnification assets: |
||||||||||||||||
| Software cost reimbursement |
$ | — | $ | — | $ | 3,586 | $ | 3,586 | ||||||||
The fair value of financial instruments is the amount at which an asset or obligation could be exchanged in a current transaction between willing parties, other than in a forced liquidation sale. Fair value estimates are made at a specific point in time based on the type of financial instrument and relevant market information. Many of these estimates involve various assumptions and may vary significantly from amounts that could be realized in actual transactions.
For those financial instruments with no quoted market prices available, fair values have been estimated using present value calculations or other valuation techniques, as well as management’s best judgment with respect to current economic conditions, including discount rates and estimates of future cash flows.
Indemnification assets include the present value of the expected future cash flows of certain expense reimbursement agreements with Popular. These contracts have termination dates up to September 2015 and were entered into in connection with the merger transaction completed on September 30, 2010 (“the Merger”). Management prepared estimates of the expected reimbursements to be received from Popular until the termination of the contracts, discounted the estimated future cash flows and recorded the indemnification assets as of the Merger closing date. Payments received during the quarters reduced the indemnification asset balance. The remaining balance was adjusted to reflect its fair value as of December 31, 2014 and 2013, therefore resulting in a net unrealized loss of $0.4 million in both periods, and a net unrealized gain of $1.0 million for the year ended December 31, 2012, which are reflected within the other expenses caption in the consolidated statements of income (loss) and comprehensive income (loss). The current portion of the indemnification assets is included within accounts receivable, net and the other long-term portion is included within other long-term assets in the accompanying consolidated balance sheets. See Note 19 for additional information regarding the expense reimbursement agreements.
The unobservable inputs related to the Company’s indemnification assets as of December 31, 2014 using the discounted cash flow model include the discount rate of 4.75% and the projected cash flows of $1.4 million.
F-24
Table of Contents
Index to Financial Statements
EVERTEC, Inc. Notes to Consolidated Financial Statements
For indemnification assets a significant increase or decrease in market rates and cash flows could result in a significant impact to the fair value. Also, the credit rating and/or the non-performance credit risk of Popular, which is subjective in nature, also could increase or decrease the sensitivity of the fair value of these assets.
The following table presents the carrying value, as applicable, and estimated fair values for financial instruments at December 31, 2014 and 2013:
| December 31, | ||||||||||||||||
| 2014 | 2013 | |||||||||||||||
| (Dollar amounts in thousands) | Carrying Amount |
Fair Value |
Carrying Amount |
Fair Value |
||||||||||||
| Financial assets: |
||||||||||||||||
| Indemnification assets: |
||||||||||||||||
| Software cost reimbursement |
$ | 1,428 | $ | 1,428 | $ | 3,586 | $ | 3,586 | ||||||||
| Financial liabilities: |
||||||||||||||||
| Senior secured term loan A |
$ | 277,240 | $ | 266,400 | $ | 292,153 | $ | 284,091 | ||||||||
| Senior secured term loan B |
389,340 | 385,462 | 392,527 | 387,055 | ||||||||||||
The fair value of the new senior secured term loans at December 31, 2014 and 2013 was obtained using the prices provided by third party service providers. Their pricing is based on various inputs such as: market quotes, recent trading activity in a non-active market or imputed prices. Also, the pricing may include the use of an algorithm that could take into account movement in the general high yield market, among other variants.
The senior secured term loans, which are not measured at fair value in the balance sheets, if measured, could be categorized as Level 3 in the fair value hierarchy.
The following table provides a summary of the change in fair value of the Company’s Level 3 assets:
| (Dollar amounts in thousands) | Indemnification Assets |
|||
| Balance—December 31, 2011 |
$ | 7,464 | ||
| Payments received |
(2,331 | ) | ||
| Unrealized loss recognized in other expenses |
966 | |||
|
|
|
|||
| Balance—December 31, 2012 |
$ | 6,099 | ||
|
|
|
|||
| Payments received |
(2,130 | ) | ||
| Unrealized gain recognized in other expenses |
(383 | ) | ||
|
|
|
|||
| Balance—December 31, 2013 |
$ | 3,586 | ||
|
|
|
|||
| Payments received |
(1,712 | ) | ||
| Unrealized loss recognized in other expenses |
(446 | ) | ||
|
|
|
|||
| Balance—December 31, 2014 |
$ | 1,428 | ||
|
|
|
|||
There were no transfers in or out of Level 3 during the years ended December 31, 2014, 2013 and 2012.
The Company is authorized to issue up to 206,000,000 shares of common stock of $0.01 par value. At December 31, 2014 and 2013, the Company had 77,893,144 and 78,286,465 shares outstanding, respectively. The Company is also authorized to issue 2,000,000 shares of $0.01 par value preferred stock. As of December 31, 2014, no shares of preferred stock have been issued.
F-25
Table of Contents
Index to Financial Statements
EVERTEC, Inc. Notes to Consolidated Financial Statements
Initial Public Offering and Other Public Offerings
On April 17, 2013, EVERTEC completed an initial public offering of 28,789,943 shares of common stock at a price to the public of $20.00 per share. A total of 6,250,000 shares were offered by EVERTEC and a total of 22,539,943 shares were offered by selling stockholders, of which 13,739,284 shares were sold by Apollo and 8,800,659 shares were sold by Popular. EVERTEC used the net proceeds of approximately $117.4 million, after the deduction of underwriting discount and commissions, from the Company’s sale of shares in the initial public offering and proceeds from borrowings under the 2013 Credit Agreement, together with available cash on hand, to redeem the Company’s senior notes and to refinance the Company’s previous senior secured credit facilities.
On September 18, 2013, EVERTEC completed a public offering of 23,000,000 shares of the Company’s common stock by Apollo, Popular, and current and former employees at a price to the public of $22.50 per share. EVERTEC did not receive any proceeds from this offering.
On December 13, 2013, EVERTEC completed a public offering of 15,233,273 shares of the Company’s common stock by Apollo, Popular, and current and former employees at a price to the public of $20.60 per share. EVERTEC did not receive any proceeds from this offering.
Stock Repurchase
During the fourth quarter of 2014, the Company repurchased 1,201,194 shares of the Company’s common stock at a cost of $26.2 million. The Company funded such repurchase with cash on hand and borrowings to the existing revolving credit facility.
On December 13, 2013, the Company repurchased 3,690,036 shares of its common stock. The Company funded the share repurchase with approximately $25.0 million in cash on hand and approximately $50.0 million of borrowings under its revolving credit facility.
Dividends
During 2013, the Company implemented a policy under which EVERTEC pays a regular quarterly dividend on the Company’s common stock, subject to the declaration thereof each quarter by the Company’s Board of Directors. The Company’s dividend activity in 2014 and 2013 was as follows:
| Declaration Date |
Record Date |
Payment Date |
Dividend per share | |||||
| August 7, 2013 |
August 19, 2013 | September 6, 2013 | $ | 0.10 | ||||
| November 6, 2013 |
November 18, 2013 | December 6, 2013 | 0.10 | |||||
| February 12, 2014 |
February 25, 2014 | March 14, 2014 | 0.10 | |||||
| May 7, 2014 |
May 19, 2014 | June 6, 2014 | 0.10 | |||||
| August 6, 2014 |
August 18, 2014 | September 5, 2014 | 0.10 | |||||
| November 5, 2014 |
November 17, 2014 | December 5, 2014 | 0.10 | |||||
On December 18, 2012, the Company’s Board of Directors declared a special dividend of approximately $53.4 million to its stockholders. The Company recorded excess over accumulated earnings of the cash distribution amounting to $52.4 million as a return of capital reducing additional paid in capital caption in the consolidated balance sheets.
F-26
Table of Contents
Index to Financial Statements
EVERTEC, Inc. Notes to Consolidated Financial Statements
On May 9, 2012, the Company used the net proceeds primarily from the incremental of the previous term loan, together with cash on hand, to pay a special cash dividend of $269.8 million to its stockholders. The Company recorded the excess over accumulated earnings of the cash distribution amounting to $260.2 million as a return of capital reducing additional paid in capital caption in the consolidated balance sheets.
Note 14—Share-based Compensation
Equity Incentive Plans
On September 30, 2010, the Holdings Board of Directors adopted the Carib Holdings, Inc. 2010 Equity Incentive Plan (the “2010 Plan”) to grant stock options, rights to purchase shares, restricted stock units and other stock-based rights to employees, directors, consultants and advisors. On April 17, 2012, in connection with the Reorganization, EVERTEC, Inc. assumed the 2010 Plan and all of the outstanding equity awards issued thereunder or subject thereto. EVERTEC, Inc. reserved 5,843,208 shares of its common stock for issuance upon exercise and grants of stock options, restricted stock and other equity awards under the 2010 Plan.
In connection with the Company’s initial public offering, the Company adopted the EVERTEC, Inc. 2013 Equity Incentive Plan (the “2013 Plan” and, together with the 2010 Plan, the “Equity Incentive Plans”). Under the 2013 Plan, 5,956,882 shares of its common stock are reserved for issuance upon exercise and grants of stock options, restricted stocks and other equity awards. In connection with the adoption of the 2013 Plan, the 2010 Plan remains in effect. However, no new awards will be granted under the 2010 Plan. The Equity Incentive Plans have a contractual term of ten years.
The following table summarizes the stock options activity for the years ended December 31, 2014, 2013 and 2012:
| Shares | Weighted-average exercise prices (1) |
|||||||
| Outstanding at December 31, 2011 |
5,388,548 | $ | 1.30 | |||||
| Granted (2) |
1,020,000 | 4.95 | ||||||
| Forfeitures |
(1,230,966 | ) | 1.30 | |||||
|
|
|
|
|
|||||
| Outstanding at December 31, 2012 |
5,177,582 | $ | 2.06 | |||||
| Granted |
150,000 | 23.36 | ||||||
| Exercised (3) |
(4,042,046 | ) | 1.99 | |||||
|
|
|
|
|
|||||
| Outstanding at December 31, 2013 |
1,285,536 | $ | 4.77 | |||||
| Granted |
100,000 | 24.01 | ||||||
| Forfeitures |
(31,164 | ) | 1.30 | |||||
| Exercised (3) |
(945,040 | ) | 1.96 | |||||
| Repurchased |
(93,332 | ) | 4.83 | |||||
|
|
|
|
|
|||||
| Outstanding at December 31, 2014 |
316,000 | $ | 19.56 | |||||
|
|
|
|
|
|||||
| Exercisable at December 31, 2014 |
50,000 | $ | 23.36 | |||||
|
|
|
|
|
|||||
| (1) | Exercise price was retroactively adjusted to reflect the equitable adjustment of $3.71 per share as discussed below. |
| (2) | Includes 100,000 of stock options that were not granted under the Equity Incentive Plans, but are subject to certain terms of the 2010 Plan. |
| (3) | At December 31, 2014, the total intrinsic value of options exercised during the year amounted to $19.3 million. |
F-27
Table of Contents
Index to Financial Statements
EVERTEC, Inc. Notes to Consolidated Financial Statements
In connection with the cash dividend declared on December 18, 2012, the Board of Directors of EVERTEC, Inc. approved an equitable adjustment to stock options previously granted as required by the 2010 Plan payable in form of a one-time cash bonus to holders of vested options for shares of common stock in the amount of $0.69 per share, which in the case of vested options was on December 21, 2012 and in the case of unvested options will be paid in the future as the options vest, subject to certain conditions. Accordingly, $2.8 million was recognized as other long-term liabilities related the accrual of the unvested portion of the stock options as of December 31, 2012. As of December 31, 2014 and 2013, the accrual of the unvested portion of stock options related to this equitable adjustment amounted to approximately $45,000 and $0.6 million, respectively.
As a result of the cash dividend, on May 9, 2012, the Board of Directors of EVERTEC, Inc. approved an equitable adjustment to stock options previously granted as required by its 2010 Plan in order to reduce the exercise price of the outstanding options granted under or subject to the terms of the 2010 Plan by $3.71 per share. This adjustment to the exercise price did not impact the compensation expense recognized by the Company for the year ended December 31, 2012 or the maximum unrecognized cost.
The following table presents information about fully vested stock options for the years ended December 31, 2014, 2013 and 2012:
| Years ended December 31, | ||||||||||||||||||||||||
| 2014 | 2013 | 2012 | ||||||||||||||||||||||
| Shares | Weighted average exercise price |
Shares | Weighted average exercise price |
Shares | Weighted average exercise price |
|||||||||||||||||||
| Vested stock options (1)(2)(3) |
766,995 | $ | 3.75 | 3,757,099 | $ | 2.07 | 279,750 | $ | 1.30 | |||||||||||||||
| (1) | At December 31, 2014, 2013 and 2012, the aggregate intrinsic value amounted to $14.0 million, $84.9 million and $1.6 million, respectively. |
| (2) | The weighted average contractual term of fully vested options is 6.06 years, 7.04 years and 7.85 years as of December 31, 2014, 2013 and 2012, respectively. |
| (3) | The fair value of vested stock options at December 31, 2014, 2013 and 2012 amounted to $17.0 million, $92.7 million and $2.0 million, respectively. |
Management uses the fair value method of recording stock-based compensation as described in the guidance for stock compensation in ASC topic 718. The fair value of stock options granted during 2014, 2013 and 2012 was estimated using the Black-Scholes-Merton (“BSM”) option pricing model, with the following assumptions:
| Years ended December 31, | ||||||||||||
| 2014 | 2013 | 2012 | ||||||||||
| Stock options granted under the 2013 Plan |
Stock options granted under the 2013 Plan |
Stock options granted under the 2010 Plan |
||||||||||
| Stock Price (1) |
$ | 24.01 per share | $ | 23.36 per share | $ | 5.19 per share | ||||||
| Risk-free rate |
1.80 | % | 1.68 | % | 0.59 | % | ||||||
| Expected volatility |
36.98 | % | 36.56 | % | 31.12 | % | ||||||
| Expected annual dividend yield |
1.63 | % | 1.71 | % | 0.00 | % | ||||||
| Expected term |
6 years | 6 years | 3.87 years | |||||||||
| (1) | As discussed above, on May 9, 2012 an equitable adjustment to stock options was approved which caused a reduction of $3.71 per share of the exercise price of the outstanding options. Accordingly, the stock price presented above reflects this equitable adjustment for 2012. |
The risk-free rate is based on the U.S. Constant Maturities Treasury Interest Rate as of the grant date. The expected volatility is based on a combination of historical volatility and implied volatility from public trade
F-28
Table of Contents
Index to Financial Statements
EVERTEC, Inc. Notes to Consolidated Financial Statements
companies in the Company’s industry. The expected annual dividend yield is based on management’s expectations of future dividends as of the grant date. The expected term for stock options granted under the 2010 Plan was based on the vesting time of the options. For the stock options granted under the 2013 Plan, the simplified method was used to estimate the expected term.
The following table summarizes the nonvested restricted shares activity for the years ended December 31, 2014, 2013 and 2012:
| Nonvested restricted shares |
Shares | Weighted-average grant date fair value |
||||||
| Nonvested at December 31, 2011 |
126,116 | $ | 5.00 | |||||
| Granted |
29,292 | 8.54 | ||||||
| Vested |
(39,988 | ) | 5.00 | |||||
|
|
|
|
|
|||||
| Nonvested at December 31, 2012 |
115,420 | $ | 5.90 | |||||
| Granted |
9,133 | 24.64 | ||||||
| Vested |
(115,420 | ) | 5.90 | |||||
|
|
|
|
|
|||||
| Nonvested at December 31, 2013 |
9,133 | $ | 24.64 | |||||
| Granted |
23,252 | 22.04 | ||||||
| Vested |
(9,133 | ) | 24.64 | |||||
|
|
|
|
|
|||||
| Nonvested at December 31, 2014 |
23,252 | $ | 22.04 | |||||
|
|
|
|
|
|||||
During the third quarter of 2014, the Company granted to four of its directors and to an executive officer restricted stock units under the 2013 Plan.
Share-based compensation recognized was as follows:
| Years ended December 31, | ||||||||||||
| (Dollar amounts in thousands) | 2014 | 2013 | 2012 | |||||||||
| Share-based compensation recognized, net |
||||||||||||
| Stock options |
$ | 4,305 | $ | 5,820 | $ | 595 | ||||||
| Restricted shares |
282 | 359 | 609 | |||||||||
Pursuant to the terms of the 2010 Plan, Tranche A stock options will generally vest in five equal installments, except for some grants as specified in the stock agreement, Tranche B options granted to employees and certain directors would vest at such time as the Investor Internal Rate of Return (“IRR”) equals or exceeds 25%, except for one grant that vests upon a 20% IRR, based on cash proceeds received by Apollo Investment Fund VII, L.P. (the “Investor”), and Tranche C options would vest at such time as the IRR equals or exceeds 30% based on cash proceeds received by the Investor.
As a result of the Initial Public Offering, the IRR required by the Tranche B and C options was achieved and accordingly, all Tranche B and C options became vested. As a result, the Company recognized a share-based compensation expense of $4.9 million in April 2013.
The share-based compensation expense related to the stock options amounting to $1.3 million is expected to be recognized over a weighted average period of 1.96 years.
The maximum unrecognized cost for restricted stock units was $0.4 million as of December 31, 2014. The cost is expected to be recognized over a weighted average period of 1.59 years.
F-29
Table of Contents
Index to Financial Statements
EVERTEC, Inc. Notes to Consolidated Financial Statements
EVERTEC, Inc. Puerto Rico Savings and Investment plan (“the EVERTEC Savings Plan”) was established, as a defined contribution savings plan qualified under section 1165(e) of the Puerto Rico Internal Revenue Code. Investments in the plan are participant directed, and employer matching contributions are determined based on specific provisions of the EVERTEC Savings Plan. Employees are fully vested in the employer’s contributions after five years of service. For the years ended December 31, 2014, 2013 and 2012, the costs incurred under the plan amounted to approximately $0.6 million for each of all periods.
Note 16—Total Other Income (Expenses)
For the year ended December 31, 2014, other income (expenses) is primarily comprised of $2.6 million in foreign currency transaction gains and a $0.4 million in expenses related to adjustments made to software indemnification assets as a result of certain maintenance contract cancellations during the year.
For the year ended December 31, 2013, other expenses are primarily comprised of a $58.5 million charge related to the extinguishment of debt (see Note 11) and a $16.7 million expense related to the termination of the Company’s consulting agreements with Apollo and Popular (see Note 19).
For the year ended December 31, 2012, other expenses primarily comprised of $8.8 million associated with the issuance of additional debt and $2.2 million of personnel separation charges, partially offset by $1.3 related to a gain in foreign exchange transactions of Latin America operations.
On April 17, 2012, EVERTEC Group was converted from a Puerto Rico corporation into a Puerto Rico limited liability company in order to take advantage of recent changes to the PR Code that allow limited liability companies to be treated as partnerships that are pass-through entities for Puerto Rico tax purposes. As a result of the Conversion, EVERTEC Group’s taxable income from its Puerto Rico operations flows through to its direct parent company and therefore to EVERTEC, Inc.
EVERTEC Group, Holdings and EVERTEC, Inc. entered into a Tax Payment Agreement pursuant to which EVERTEC Group is obligated to make certain payments to Holdings or EVERTEC, Inc. for taxable periods or portions thereof occurring on or after April 17, 2012 (the “Effective Date”). Under the Tax Payment Agreement, EVERTEC Group will make payments with respect to any and all taxes (including estimated taxes) imposed under the laws of Puerto Rico, the United States of America and any other jurisdiction or any political (including municipal) subdivision or authority or agency in Puerto Rico, the United States of America or such other jurisdiction, that would have been imposed on EVERTEC Group if EVERTEC Group had been a corporation for tax purposes of that jurisdiction, together with all interest and penalties with respect thereto (“Taxes”), reduced by taking into account any applicable net operating losses or other tax attributes of Holdings or EVERTEC, Inc. that reduce Holdings’ or EVERTEC, Inc.’s taxes in such period. The Tax Payment Agreement provides that the payments thereunder shall not exceed the net amount of Taxes that Holdings and EVERTEC, Inc. actually owe to the appropriate taxing authority for a taxable period. Further, the Tax Payment Agreement provides that if Holdings or EVERTEC, Inc. receives a tax refund attributable to any taxable period or portion thereof occurring on or after the Effective Date, EVERTEC, Inc. shall be required to recalculate the payment for such period required to be made by EVERTEC Group to Holdings or EVERTEC, Inc. If the payment, as recalculated, is less than the amount of the payment EVERTEC Group already made to Holdings or EVERTEC, Inc. in respect of such period, Holdings or EVERTEC, Inc. shall promptly make a payment to EVERTEC Group in the amount of such difference.
F-30
Table of Contents
Index to Financial Statements
EVERTEC, Inc. Notes to Consolidated Financial Statements
The components of income tax benefit consisted of the following:
| Years ended December 31, | ||||||||||||
| (Dollar amounts in thousands) | 2014 | 2013 | 2012 | |||||||||
| Current tax provision |
$ | 9,291 | $ | 3,712 | $ | 6,910 | ||||||
| Deferred tax benefit |
(1,713 | ) | (5,702 | ) | (66,568 | ) | ||||||
|
|
|
|
|
|
|
|||||||
| Income tax expense (benefit) |
$ | 7,578 | $ | (1,990 | ) | $ | (59,658 | ) | ||||
|
|
|
|
|
|
|
|||||||
For the year ended December 31, 2012, the Company recognized a reduction of $66.4 million of its deferred tax liability as a result of a tax grant received from the Government of Puerto Rico that reduced the Company’s marginal corporate income tax rate from 30% to 4% on industrial development income.
The Company conducts operations in Puerto Rico and certain countries throughout the Caribbean and Latin America. As a result, the income tax benefit includes the effect of taxes paid to the Puerto Rico government as well as foreign jurisdictions. The following table presents the segregation of income tax benefit based on location of operations:
| Years ended December 31, | ||||||||||||
| (Dollar amounts in thousands) | 2014 | 2013 | 2012 | |||||||||
| Income (loss) before income tax provision (benefit) |
||||||||||||
| Puerto Rico |
61,395 | (35,255 | ) | 9,941 | ||||||||
| United States |
2,131 | 2,031 | 1,534 | |||||||||
| Foreign countries |
11,584 | 6,613 | 6,233 | |||||||||
|
|
|
|
|
|
|
|||||||
| Total income (loss) before income tax provision (benefit) |
$ | 75,110 | $ | (26,611 | ) | $ | 17,708 | |||||
|
|
|
|
|
|
|
|||||||
| Current tax provision (benefit) |
||||||||||||
| Puerto Rico |
$ | 4,779 | $ | 913 | $ | 4,661 | ||||||
| United States |
(517 | ) | 753 | 622 | ||||||||
| Foreign countries |
5,029 | 2,046 | 1,627 | |||||||||
|
|
|
|
|
|
|
|||||||
| Total current tax provision |
$ | 9,291 | $ | 3,712 | $ | 6,910 | ||||||
|
|
|
|
|
|
|
|||||||
| Deferred tax benefit |
||||||||||||
| Puerto Rico |
$ | 56 | $ | (5,094 | ) | $ | (65,822 | ) | ||||
| United States |
(124 | ) | (5 | ) | (38 | ) | ||||||
| Foreign countries |
(1,645 | ) | (603 | ) | (708 | ) | ||||||
|
|
|
|
|
|
|
|||||||
| Total deferred tax benefit |
$ | (1,713 | ) | $ | (5,702 | ) | $ | (66,568 | ) | |||
|
|
|
|
|
|
|
|||||||
Taxes payable to foreign countries by EVERTEC’s subsidiaries will be paid by such subsidiary and the corresponding liability and expense will be presented in EVERTEC’s consolidated financial statements.
On June 30, 2013, the Governor of Puerto Rico signed into law Act 40, effective as of January 1, 2013, which increased the maximum corporate income tax rate from 30% to 39%. This rate increase is only applicable to the fully taxable operations of EVERTEC in Puerto Rico. As a result of this tax rate increase, the deferred taxes were revalued resulting in the Company recognizing additional non-cash income tax expense of $1.4 million for the first half of 2013. In addition, Act 40 established a national gross receipts tax based on gross revenues that is included as part of the alternative minimum tax calculation.
As of December 31, 2014, the Company has reported $22 million of unremitted earnings for foreign subsidiaries in the consolidated balance sheet. The Company had not recognized a deferred tax liability on undistributed
F-31
Table of Contents
Index to Financial Statements
EVERTEC, Inc. Notes to Consolidated Financial Statements
earnings for the Company’s foreign subsidiaries, because these earnings are intended to be permanently reinvested. The amount of the unrecognized deferred tax liability depends on judgment required to analyze the withholding tax due, the applicable tax law and factual circumstances in effect at the time of any such distributions, therefore, EVERTEC believes it is not practicable at this time to reliably determine the amount of unrecognized deferred tax liability related to the Company’s undistributed earnings. If circumstances change and it becomes apparent that some or all of the undistributed earnings of a subsidiary will be remitted and income taxes have not been recognized by the parent entity, the parent entity shall accrue as an expense of the current period income taxes attributable to that remittance.
On October 19, 2012, EVERTEC Group was granted an additional tax exemption under the Tax Incentive Act No. 73 of 2008. Under this grant, EVERTEC Group will benefit from a preferential income tax rate on industrial development income, as well as from tax exemptions with respect to its municipal and property tax obligations for certain activities derived from its data processing operations in Puerto Rico. The grant has a term of 15 years effective as of January 1, 2012 with respect to income tax obligations and January 1, 2013 with respect to municipal and property tax obligations.
The grant establishes a base taxable income amount with respect to EVERTEC Group’s industrial development income, which amount will continue to be subject to the ordinary income tax rate under existing law. Applicable taxable income in excess of the established base taxable income amount will be subject to a preferential rate of 4%. The base taxable income amount will be ratably reduced to zero by the fourth taxable year at which point all of EVERTEC Group’s applicable industrial development income will be taxed at the preferential rate of 4% for the remaining period of the grant. The grant also establishes a 90% exemption on certain real and property taxes and a 60% exemption on municipal taxes, in each case imposed on EVERTEC Group. In addition, distributions to stockholders by EVERTEC, Inc. of the industrial development income will not be subject to Puerto Rico tollgate taxes.
The grant contains customary commitments, conditions and representations that EVERTEC Group will be required to comply with in order to maintain the grant. The more significant commitments include: (i) maintaining at least 750 employees in EVERTEC Group’s Puerto Rico data processing operations during 2012 and at least 700 employees for the remaining years of the grant; and (ii) investing at least $200.0 million in building, machinery, equipment or computer programs to be used in Puerto Rico during the effective term of the grant (to be made over four year capital investment cycles in $50.0 million increments). Failure to meet the requirements could result, among other things, in reductions in the benefits of the grant or revocation of the grant in its entirety, which could result in EVERTEC, Inc. paying additional taxes or other payments relative to what such parties would be required to pay if the full benefits of the grant are available. In addition, the protection from Puerto Rican tollgate taxes on distributions to stockholders may be lost.
On October 11, 2011, the Puerto Rico Government approved a grant under Tax Incentive Law No. 73 of 2008, retroactively to December 1, 2009. Under this grant, activities derived from consulting and data processing services provided outside Puerto Rico are subject to a preferred rate that declines gradually from 7% to 4% by December 1, 2013. After this date, the rate remains at 4% until its expiration in November 1, 2024.
In addition, EVERTEC Group has a base tax rate of 7% on income derived from certain development and installation service in excess of a determined income for a 10-year period from January 1, 2008.
F-32
Table of Contents
Index to Financial Statements
EVERTEC, Inc. Notes to Consolidated Financial Statements
The following table presents the components of the Company’s deferred tax assets and liabilities:
| December 31, | ||||||||
| (Dollar amounts in thousands) | 2014 | 2013 | ||||||
| Deferred tax assets (“DTA”) |
||||||||
| Allowance for doubtful accounts |
$ | 346 | $ | 330 | ||||
| Net operating loss |
7,076 | 11,306 | ||||||
| Other temporary assets |
2,302 | 1,845 | ||||||
|
|
|
|
|
|||||
| Total gross deferred tax assets |
9,724 | 13,481 | ||||||
|
|
|
|
|
|||||
| Deferred tax liabilities (“DTL”) |
||||||||
| Deferred compensation |
$ | 1,145 | $ | 993 | ||||
| Difference between the assigned values and the tax basis of assets and liabilities recognized in purchase |
24,735 | 28,849 | ||||||
| Debt issue cost |
1,232 | 1,680 | ||||||
| Other temporary liabilities |
(314 | ) | 177 | |||||
|
|
|
|
|
|||||
| Total gross deferred tax liabilities |
26,798 | 31,699 | ||||||
|
|
|
|
|
|||||
| Deferred tax liability, net |
$ | (17,074 | ) | $ | (18,218 | ) | ||
|
|
|
|
|
|||||
Pursuant to the provision of the PR Code, net operating losses (“NOL”) can be carried forward for a period of seven, ten or twelve taxable years, depending on the taxable year generated. The Company incurred in NOLs during 2010 and 2013, which will expire in 2022 and in 2023, respectively. At December 31, 2014 the recorded value of the Company’s NOL carryforwards was $7.0 million. The recorded value of the Company’s NOL carryforwards is approximately $4.2 million lower than the total NOL carryforwards available to EVERTEC due to a windfall tax benefit. The windfall tax benefit is available to offset future taxable income and is considered an off-balance sheet item until the deduction reduces taxes payable. This windfall tax benefit results from tax deductions in excess of previously recorded compensation expense due to the difference in fair value of stock options at the time of the grant as compared to when they were exercised. The total gross NOL carryforwards available to EVERTEC, including the windfall tax benefit of $10.8 million, was $28.9 million as of December 31, 2014.
The Company recognizes in its financial statements the benefits of tax return positions if it is more likely than not to be sustained on audit based on its technical merits. On a quarterly basis, EVERTEC evaluates its tax positions and revises its estimates accordingly. There were no open uncertain tax positions as of December 31, 2014 or 2013 and accordingly the Company had no liability for unrecognized tax benefits.
F-33
Table of Contents
Index to Financial Statements
EVERTEC, Inc. Notes to Consolidated Financial Statements
The income tax expense (benefit) differs from the amount computed by applying the Puerto Rico statutory income tax rate to the income (loss) before income taxes as a result of the following:
| Years ended December 31, | ||||||||||||
| (Dollar amounts in thousands) | 2014 | 2013 | 2012 | |||||||||
| Computed income tax at statutory rates |
$ | 29,293 | $ | (10,378 | ) | $ | 5,313 | |||||
| Benefit of net tax-exempt interest income |
— | (180 | ) | (13 | ) | |||||||
| Tax expense (benefit) due to a change in estimate |
(916 | ) | 83 | 320 | ||||||||
| Adjustment to deferred taxes due to changes in enacted tax rate and tax grant |
485 | 1,441 | (66,423 | ) | ||||||||
| Effect of net disallowed operating losses in foreign entities |
83 | 93 | 1,012 | |||||||||
| Differences in tax rates due to multiple jurisdictions |
(942 | ) | 577 | 720 | ||||||||
| Effect of income subject to tax-exemption grant |
(20,425 | ) | 7,164 | (58 | ) | |||||||
| Reversal of tax uncertainties reserve |
— | (846 | ) | (707 | ) | |||||||
| Fair value adjustment of indemnification assets |
— | — | 340 | |||||||||
| Other |
— | 56 | (162 | ) | ||||||||
|
|
|
|
|
|
|
|||||||
| Income tax expense (benefit) |
$ | 7,578 | $ | (1,990 | ) | $ | (59,658 | ) | ||||
|
|
|
|
|
|
|
|||||||
There were no open uncertain tax positions as of December 31, 2014 or 2013.
Note 18—Net Income (Loss) Per Common Share
The reconciliation of the numerator and the denominator of the earnings per common share is as follows:
| Years ended December 31, | ||||||||||||
| (Dollar amounts in thousands, except per share data) | 2014 | 2013 | 2012 | |||||||||
| Net income (loss) |
$ | 67,532 | $ | (24,621 | ) | $ | 77,366 | |||||
|
|
|
|
|
|
|
|||||||
| Weighted average common shares outstanding |
78,337,152 | 78,914,310 | 72,687,622 | |||||||||
| Weighted average potential dilutive common shares (1)(2) |
553,987 | — | 3,948,795 | |||||||||
|
|
|
|
|
|
|
|||||||
| Weighted average common shares outstanding—assuming dilution |
78,891,139 | 78,914,310 | 76,636,417 | |||||||||
|
|
|
|
|
|
|
|||||||
| Net income (loss) per common share—basic |
$ | 0.86 | $ | (0.31 | ) | $ | 1.06 | |||||
|
|
|
|
|
|
|
|||||||
| Net income (loss) per common share—diluted |
$ | 0.86 | $ | (0.31 | ) | $ | 1.01 | |||||
|
|
|
|
|
|
|
|||||||
| (1) | Potential common shares consist of common stock issuable under the assumed exercise of stock options and restricted stock awards using the treasury stock method. |
| (2) | For the year ended December 31, 2013, 2,325,209 potential common shares consisting of common stock under the assumed exercise of stock options and restricted stock awards using the treasury stock method were not included in the computation of the diluted net income (loss) per share since their inclusion would have an antidilutive effect. |
Refer to Note 13 for a detail of dividends declared and paid during 2014 and 2013.
F-34
Table of Contents
Index to Financial Statements
EVERTEC, Inc. Notes to Consolidated Financial Statements
Note 19—Related Party Transactions
The following table presents the Company’s transactions with related parties for each of the periods presented below:
| Years ended December 31, | ||||||||||||
| (Dollar amounts in thousands) | 2014 | 2013 | 2012 | |||||||||
| Total revenues (1)(2) |
$ | 164,142 | $ | 167,325 | $ | 155,112 | ||||||
|
|
|
|
|
|
|
|||||||
| Cost of revenues |
$ | 1,342 | $ | 8,290 | $ | 426 | ||||||
|
|
|
|
|
|
|
|||||||
| Rent and other fees (3)(4) |
$ | 7,928 | $ | 27,762 | $ | 11,319 | ||||||
|
|
|
|
|
|
|
|||||||
| Interest earned from and charged by affiliate |
||||||||||||
| Interest income |
$ | 197 | $ | 130 | $ | 222 | ||||||
|
|
|
|
|
|
|
|||||||
| Interest expense (5) |
$ | — | $ | 2,471 | $ | 7,476 | ||||||
|
|
|
|
|
|
|
|||||||
| (1) | Total revenues from Popular as a percentage of revenues were 45%, 46% and 44% for each of the periods presented above. |
| (2) | Includes revenues generated from investee accounted for under the equity method of $2.5 million, $3.0 million and $3.7 million for the years ended December 31, 2014, 2013 and 2012, respectively. |
| (3) | Includes management fees to equity sponsors amounting to $3.5 million and $3.7 million for the years ended December 31, 2013 and 2012, respectively. Management fees paid during 2013 also includes $16.7 million resulting from the termination of the consulting agreements as explained below. Rent and other fees also include $5.9 million paid in connection with the redemption premium on the senior notes during the first half of 2013. |
| (4) | Includes $7.9 million, $11.1 million and $11.3 million recorded as selling, general and administrative expenses for each of the periods presented above, and $16.7 million recorded as non-operating expenses for the year ended December 31, 2013 in the audited consolidated statement of income (loss) and comprehensive income (loss). |
| (5) | Interest expense relates to interest accrued on the senior secured term loan and senior notes held by Popular. As a result of the debt refinancing and the redemption of the senior notes in April 2013, Popular’s participation in such debt was extinguished. See Note 11 for additional information related to the extinguishment of this debt. |
On April 17, 2013, EVERTEC entered into a termination agreement with Holdings, EVERTEC Group and Popular and a termination agreement with Holdings, EVERTEC Group and Apollo Management VII, L.P. in connection with the initial public offering (the “Termination Agreements”). The Termination Agreements terminated the consulting agreements (the “Consulting Agreements”), each dated September 30, 2010, entered into by Holdings and EVERTEC Group with each of Popular and Apollo Management, pursuant to which Holdings and EVERTEC Group received certain advisory services from each of Popular and Apollo Management. The Consulting Agreements were terminated in their entirety upon payment of termination fees of approximately $8.5 million to Apollo Management and $8.2 million to Popular, in each case, plus any unreimbursed expenses payable in accordance with the terms of the Termination Agreements.
F-35
Table of Contents
Index to Financial Statements
EVERTEC, Inc. Notes to Consolidated Financial Statements
At December 31, 2014 and 2013, the Company had the following balances arising from transactions with related parties:
| December 31, | ||||||||
| (Dollar amounts in thousands) | 2014 | 2013 | ||||||
| Cash and restricted cash deposits in affiliated bank |
$ | 13,566 | $ | 13,933 | ||||
|
|
|
|
|
|||||
| Indemnification assets from Popular reimbursement (1) |
||||||||
| Accounts receivable |
$ | 1,428 | $ | 1,900 | ||||
|
|
|
|
|
|||||
| Other long-term assets |
$ | — | $ | 1,686 | ||||
|
|
|
|
|
|||||
| Other due/to from affiliate |
||||||||
| Accounts receivable |
$ | 17,006 | $ | 18,799 | ||||
|
|
|
|
|
|||||
| Prepaid expenses and other assets |
$ | 1,141 | $ | 216 | ||||
|
|
|
|
|
|||||
| Accounts payable (2) |
$ | 5,260 | $ | 8,886 | ||||
|
|
|
|
|
|||||
| Unearned income |
$ | 8,154 | $ | 4,100 | ||||
|
|
|
|
|
|||||
| Other long-term liabilities (2) |
$ | 45 | $ | 333 | ||||
|
|
|
|
|
|||||
| (1) | Recorded in connection with reimbursement from Popular regarding certain software license fees. |
| (2) | Includes an account payable of $0.2 million for both December 31, 2014 and 2013 and a long-term liability of $45,000 and $0.3 million for December 31, 2014 and 2013, respectively, related to the unvested portion of stock options as a result of the equitable adjustment approved by the Company’s Board of Directors on December 18, 2012 that will be payable to executive officers and employees upon vesting of stock options. |
The balance of cash and restricted cash deposits in an affiliated bank was included within the cash and restricted cash line items in the accompanying consolidated balance sheets. Due from affiliates mainly included the amounts outstanding related to processing and information technology services billed to Popular subsidiaries according to the terms of the Master Services Agreement (“MSA”) under which EVERTEC Group has a contract to provide such services for at least 15 years on an exclusive basis for the duration of the agreement on commercial terms consistent with historical pricing practices among the parties. This amount was included in the accounts receivable, net in the consolidated balance sheets.
The Company is entitled to receive reimbursements from Popular regarding certain software license fees if such amounts exceed certain amounts for a period of five years from the closing date of the Merger. As a result of this agreement, the Company recorded approximately $11.2 million as a software reimbursement asset at fair value as of the Merger date. At December 31, 2014 and 2013, the current portion of said asset of $1.4 million and $1.9 million, respectively, is included within the accounts receivable, net caption and the long-term portion of $1.7 million as of December 31, 2013, none in 2014, is included in the other long-term assets caption in the accompanying consolidated balance sheets. Gains and losses related to the asset are included within the other expenses caption in the accompanying consolidated statements of income (loss) and comprehensive income (loss). See Note 12 and 16.
From time to time, EVERTEC Group obtains performance bonds from insurance companies covering the obligations of EVERTEC Group under certain contracts. Under the Merger Agreement, Popular is required to, subject to certain exceptions, cause the then outstanding performance bonds to remain outstanding or replace such bonds as needed for five years from the closing date of the Merger. EVERTEC Group entered into a reimbursement agreement with Popular to mirror Popular’s obligations. As a result, EVERTEC Group is required to reimburse Popular for payment of premiums and related charges and indemnification of Popular for certain losses, in case EVERTEC Group fails to perform or otherwise satisfy its obligations covered by such performance bonds.
F-36
Table of Contents
Index to Financial Statements
EVERTEC, Inc. Notes to Consolidated Financial Statements
As of December 31, 2014, EVERTEC Group has a credit facility with Popular for $3.6 million, on behalf of EVERTEC CR, under which a letter of credit of a similar amount was issued.
Note 20—Commitments and Contingencies
The Company leases certain facilities and equipment under operating leases. Most leases contain renewal options for varying periods. Future minimum rental payments on such operating leases at December 31, 2014 are as follows:
| (Dollar amounts in thousands) | Unrelated parties |
Related party | Minimum future rentals |
|||||||||
| 2015 |
$ | 625 | $ | 4,100 | $ | 4,725 | ||||||
| 2016 |
356 | 4,226 | 4,582 | |||||||||
| 2017 |
118 | 4,352 | 4,470 | |||||||||
| 2018 |
— | 4,483 | 4,483 | |||||||||
| 2019 and thereafter |
— | 5,780 | 5,780 | |||||||||
|
|
|
|
|
|
|
|||||||
| $ | 1,099 | $ | 22,941 | $ | 24,040 | |||||||
|
|
|
|
|
|
|
|||||||
Certain lease agreements contain provisions for future rent increases. The total amount of rental payments due over the lease term is being charged to rent expense on the straight-line method over the term of the lease. The difference between rent expense recorded and the amount paid is recorded as a deferred rent obligation.
Rent expense of office facilities and real estate for the years ended December 31, 2014 and 2013 amounted to $8.2 million and $7.7 million, respectively. Also, rent expense for telecommunications and other equipment for the years ended December 31, 2014 and 2013 amounted to $6.1 million and $7.0 million, respectively.
In the ordinary course of business, the Company may enter in commercial commitments. As of December 31, 2014, EVERTEC has an outstanding letter of credit of $1.0 million with a maturity of less than three months.
EVERTEC is a defendant in a number of legal proceedings arising in the ordinary course of business. Based on the opinion of legal counsel, management believes that the final disposition of these matters will not have a material adverse effect on the business, results of operations or financial condition of the Company. The Company has identified certain claims in which a loss may be incurred, but in the aggregate the loss would be minimal. For other claims, where the proceedings are in an initial phase, the Company is unable to estimate the range of possible loss for such legal proceedings. However, the Company at this time believes that any loss related to these latter claims will not be material.
The Company operates in three business segments: Merchant Acquiring, Payment Processing and Business Solutions.
The Merchant Acquiring segment consists of revenues from services that allow merchants to accept electronic methods of payment. In the Merchant Acquiring segment, revenues include a discount fee and membership fees charged to merchants, debit network fees and rental fees from POS devices and other equipment, net of credit card interchange and assessment fees charged by credit cards associations (such as VISA or MasterCard) or
F-37
Table of Contents
Index to Financial Statements
EVERTEC, Inc. Notes to Consolidated Financial Statements
payment networks. The discount fee is generally a percentage of the transaction value. EVERTEC also charge merchants for other services that are unrelated to the number of transactions or the transaction value.
The Payment Processing segment revenues are comprised of revenues related to providing access to the ATH network and other card networks to financial institutions, including related services such as authorization, processing, management and recording of ATM and POS transactions, and ATM management and monitoring. Payment Processing revenues also include revenues from card processing services (such as credit and debit card processing, authorization and settlement and fraud monitoring and control to debit or credit issuers), payment processing services (such as payment and billing products for merchants, businesses and financial institutions) and electronic benefit transfer (“EBT”) (which principally consist of services to the government of Puerto Rico for the delivery of benefits to participants).
For ATH network and processing services, revenues are primarily driven by the number of transactions processed. Revenues are derived primarily from network fees, transaction switching and processing fees, and the leasing POS devices. For card issuer processing, revenues are primarily dependent upon the number of cardholder accounts on file, transactions and authorizations processed, the number of cards embossed and other processing services. For EBT services, revenues are primarily derived from the number of beneficiaries on file.
In September 2012, the Company renamed the transaction processing segment to Payment Processing segment. The change of name does not constitute a change in the segment composition.
The Business Solutions segment consist of revenues from a full suite of business process management solutions in various product areas such as core bank processing, network hosting and management, IT professional services, business process outsourcing, item processing, cash processing, and fulfillment. Core bank processing and network services revenues are derived in part from a recurrent fee and from fees based on the number of accounts on file (i.e. savings or checking accounts, loans, etc.) or computer resources utilized. Revenues from other processing services within the Business Solutions segment are generally volume-based and depend on factors such as the number of accounts processed. In addition, EVERTEC are a reseller of hardware and software products and these resale transactions are generally one-time transactions.
The Company’s business segments are organized based on the nature of products and services. The Chief Operating Decision Maker (“CODM”) reviews their separate financial information to assess performance and to allocate resources.
Management evaluates the operating results of each of its reportable segments based upon revenues and operating income. Segment asset disclosure is not used by the CODM as a measure of segment performance since the segment evaluation is driven by earnings. As such, segment assets are not disclosed in the notes to the accompanying consolidated financial statements.
F-38
Table of Contents
Index to Financial Statements
EVERTEC, Inc. Notes to Consolidated Financial Statements
The following tables set forth information about the Company’s operations by its three business segments for the periods indicated:
| (Dollar amounts in thousands) | Merchant Acquiring, net |
Payment Processing |
Business Solutions |
Other | Total | |||||||||||||||
| Year ended December 31, 2014 |
||||||||||||||||||||
| Revenues |
$ | 79,136 | $ | 132,091 | $ | 176,570 | $ | (26,668 | )(1) | $ | 361,129 | |||||||||
| Income from operations |
34,348 | 59,882 | 47,587 | (44,469 | )(2) | 97,348 | ||||||||||||||
| Year ended December 31, 2013 |
||||||||||||||||||||
| Revenues |
73,616 | 125,610 | 184,297 | (25,506 | )(1) | 358,017 | ||||||||||||||
| Income from operations |
35,376 | 54,429 | 42,430 | (46,474 | )(2) | 85,761 | ||||||||||||||
| Year ended December 31, 2012 |
||||||||||||||||||||
| Revenues |
69,591 | 116,825 | 177,292 | (21,218 | )(1) | 342,490 | ||||||||||||||
| Income from operations |
33,836 | 53,682 | 39,845 | (47,717 | )(2) | 79,646 | ||||||||||||||
| (1) | Represents the elimination of intersegment revenues for services provided by the Payment Processing segment to the Merchant Acquiring segment, and other miscellaneous intersegment revenues. |
| (2) | Primarily represents non-operating depreciation and amortization expenses generated as a result of the Merger and certain non-recurring fees and expenses. |
The reconciliation of income from operations to consolidated net income (loss) is as follows:
| Years ended December 31, | ||||||||||||
| (Dollar amounts in thousands) | 2014 | 2013 | 2012 | |||||||||
| Segment income from operations |
||||||||||||
| Merchant Acquiring |
$ | 34,348 | $ | 35,376 | $ | 33,836 | ||||||
| Payment Processing |
59,882 | 54,429 | 53,682 | |||||||||
| Business Solutions |
47,587 | 42,430 | 39,845 | |||||||||
|
|
|
|
|
|
|
|||||||
| Total segment income from operations |
141,817 | 132,235 | 127,363 | |||||||||
| Merger related depreciation and amortization and other unallocated expenses (1) |
(44,469 | ) | (46,474 | ) | (47,717 | ) | ||||||
|
|
|
|
|
|
|
|||||||
| Income from operations |
$ | 97,348 | $ | 85,761 | $ | 79,646 | ||||||
|
|
|
|
|
|
|
|||||||
| Interest expense, net |
(25,753 | ) | (37,625 | ) | (54,011 | ) | ||||||
| Earnings of equity method investment |
1,140 | 935 | 564 | |||||||||
| Other expenses |
2,375 | (75,682 | ) | (8,491 | ) | |||||||
| Income tax (expense) benefit |
(7,578 | ) | 1,990 | 59,658 | ||||||||
|
|
|
|
|
|
|
|||||||
| Net income (loss) |
$ | 67,532 | $ | (24,621 | ) | $ | 77,366 | |||||
|
|
|
|
|
|
|
|||||||
| (1) | Primarily represents non-operating depreciation and amortization expenses generated as a result of the Merger and certain non-recurring fees and expenses. |
F-39
Table of Contents
Index to Financial Statements
EVERTEC, Inc. Notes to Consolidated Financial Statements
The geographic segment information below is classified based on the geographic location of the Company’s subsidiaries:
| Years ended December 31, | ||||||||||||
| (Dollar amounts in thousands) | 2014 | 2013 | 2012 | |||||||||
| Revenues (1) |
||||||||||||
| Puerto Rico |
$ | 312,569 | $ | 309,350 | $ | 295,285 | ||||||
| Caribbean |
13,752 | 16,225 | 16,280 | |||||||||
| Latin America |
34,808 | 32,442 | 30,925 | |||||||||
|
|
|
|
|
|
|
|||||||
| Total revenues |
$ | 361,129 | $ | 358,017 | $ | 342,490 | ||||||
|
|
|
|
|
|
|
|||||||
| (1) | Revenues are based on subsidiaries’ country of domicile. |
Major customers
For the years ended December 31, 2014, 2013 and 2012, the Company had one major customer which accounted for approximately $161.6 million or 45%, $163.8 million or 46% and $151.4 million or 44%, respectively, of total revenues. See Note 19.
The Company’s next largest customer, the Government of Puerto Rico, consolidating all individual agencies and public corporations, represented 10%, 11% and 9% of the Company’s total revenues for the years ended December 31, 2014, 2013 and 2012, respectively.
On February 18, 2015, the Company’s Board of Directors declared a regular quarterly cash dividend of $0.10 per share on the Company’s outstanding shares of common stock. The Board anticipates declaring this dividend in future quarters on a regular basis; however future declarations of dividends are subject to board of director approval and may be adjusted as business needs or market conditions change. The cash dividend of $0.10 per share will be paid on March 19, 2015 to stockholders of record as of the close of business on March 2, 2015.
F-40
Table of Contents
Index to Financial Statements
EVERTEC, Inc. Condensed Financial Statements
Parent Company Only
Condensed Balance Sheets
| December 31, | ||||||||
| (Dollar amounts in thousands) | 2014 | 2013 | ||||||
| Assets |
||||||||
| Current assets: |
||||||||
| Cash |
$ | 1,612 | $ | 1,285 | ||||
| Accounts receivable, net |
3,224 | — | ||||||
| Prepaid expenses and other assets |
3,690 | 11,574 | ||||||
| Deferred tax asset |
— | 2,494 | ||||||
|
|
|
|
|
|||||
| Total current assets |
8,526 | 15,353 | ||||||
| Investment in subsidiaries, at equity |
123,017 | 111,931 | ||||||
|
|
|
|
|
|||||
| Total assets |
$ | 131,543 | $ | 127,284 | ||||
|
|
|
|
|
|||||
| Liabilities and stockholders’ equity |
||||||||
| Current liabilities: |
||||||||
| Accrued liabilities |
$ | 49 | $ | 1,309 | ||||
| Accounts Payable |
5 | — | ||||||
| Deferred tax liability |
1,421 | — | ||||||
|
|
|
|
|
|||||
| Total current liabilities |
1,475 | 1,309 | ||||||
| Long-term deferred tax liability, net |
10,451 | 14,312 | ||||||
| Other long-term liabilities |
44 | 333 | ||||||
|
|
|
|
|
|||||
| Total liabilities |
11,970 | 15,954 | ||||||
|
|
|
|
|
|||||
| Stockholders’ equity: |
||||||||
| Common stock |
779 | 783 | ||||||
| Additional paid-in capital |
59,740 | 80,718 | ||||||
| Accumulated earnings |
65,576 | 29,403 | ||||||
| Accumulated other comprehensive income (loss), net of tax of $0 and $0 |
(6,522 | ) | 426 | |||||
|
|
|
|
|
|||||
| Total stockholders’ equity |
119,573 | 111,330 | ||||||
|
|
|
|
|
|||||
| Total liabilities and stockholders’ equity |
$ | 131,543 | $ | 127,284 | ||||
|
|
|
|
|
|||||
F-41
Table of Contents
Index to Financial Statements
Schedule I
Condensed Statements of Income and Comprehensive Income
| Years ended December 31, | ||||||||||||
| (Dollar amounts in thousands) | 2014 | 2013 | 2012 | |||||||||
| Non-operating income (expenses) |
||||||||||||
| Equity in earnings (losses) of subsidiaries |
$ | 74,134 | $ | (23,668 | ) | $ | 95,382 | |||||
| Interest income |
227 | 144 | 5 | |||||||||
| Other expenses |
(1,994 | ) | (4,780 | ) | (375 | ) | ||||||
|
|
|
|
|
|
|
|||||||
| Total non-operating income (expense) |
72,367 | (28,304 | ) | 95,012 | ||||||||
| Income (loss) before income taxes |
72,367 | (28,304 | ) | 95,012 | ||||||||
| Income tax expense (benefit) |
4,835 | (3,684 | ) | 17,646 | ||||||||
|
|
|
|
|
|
|
|||||||
| Net income (loss) |
67,532 | (24,621 | ) | 77,366 | ||||||||
| Other comprehensive income (loss), net of tax |
||||||||||||
| Foreign currency translation adjustments |
(6,948 | ) | 1,268 | 476 | ||||||||
|
|
|
|
|
|
|
|||||||
| Total comprehensive income (loss) |
$ | 60,584 | $ | (23,353 | ) | $ | 77,842 | |||||
|
|
|
|
|
|
|
|||||||
Condensed Statements of Cash Flows
| Years ended December 31, | ||||||||||||
| (Dollar amounts in thousands) | 2014 | 2013 | 2012 | |||||||||
| Cash flows from operating activities |
$ | 57,276 | $ | (5,322 | ) | $ | 317,389 | |||||
|
|
|
|
|
|
|
|||||||
| Cash flows from financing activities |
||||||||||||
| Proceeds from initial public offering, net of offering costs of $12,567 |
— | 112,432 | — | |||||||||
| Dividends paid |
(31,359 | ) | (16,390 | ) | (319,959 | ) | ||||||
| Repurchase of common stock |
(26,197 | ) | (75,000 | ) | — | |||||||
| Statutory minimum withholding taxes paid on cashless exercises of stock options |
(2,001 | ) | (16,851 | ) | — | |||||||
| Tax windfall benefits on exercises of stock options and vesting of restricted stocks |
3,669 | 1,829 | — | |||||||||
| Issuance of common stock |
543 | 29 | 450 | |||||||||
| Settlement of stock options |
(1,604 | ) | — | — | ||||||||
|
|
|
|
|
|
|
|||||||
| Net cash (used in) provided by financing activities |
(56,949 | ) | 6,049 | (319,509 | ) | |||||||
|
|
|
|
|
|
|
|||||||
| Net increase (decrease) in cash |
327 | 727 | (2,120 | ) | ||||||||
| Cash at beginning of the period |
1,285 | 557 | 2,677 | |||||||||
|
|
|
|
|
|
|
|||||||
| Cash at end of the period |
$ | 1,612 | $ | 1,285 | $ | 557 | ||||||
|
|
|
|
|
|
|
|||||||
| Supplemental disclosure of non-cash activities: |
||||||||||||
| Transfer of prepaid income taxes from subsidiary |
$ | — | $ | — | $ | 6,719 | ||||||
| Liability related to unvested portion of stock options as a result of equitable adjustment (Note 14) |
— | — | 3,151 | |||||||||
On March 13, 2014, June 5, 2014, September 4, 2014 and December 4, 2014, the parent company received cash distributions from Holdings for the payment of dividends to its stockholders’ amounting to $7.8 million, $7.8 million, $7.9 million and $7.8 million, respectively. On October 1, 2014, the parent company received a $25.0 million dividend from Holdings which was used in the repurchase of 1,146,870 shares of its common stock.
F-42
Table of Contents
Index to Financial Statements
Schedule I
On both August 31, 2013 and December 1, 2013, the parent company received cash distributions from Holdings of $8.2 million and used the proceeds of such distributions to pay dividends to its stockholders. On December 18, 2013, the parent company received a dividend from Holdings of approximately $75.0 million. The proceeds from this dividend were used in the repurchase of 3,690,036 shares of its common stock.
On December 18, 2012, the parent company received a cash distribution from Holdings of approximately $50.3 million and used the proceeds of such distribution to pay a dividend to its stockholders and to pay an equitable adjustment to holders of vested options. The Board of Directors approved an equitable adjustment to stock options payable in form of a one-time cash bonus to holders of vested options and in the case of unvested options will be paid as the options vest. On May 9, 2012, the parent company received a cash distribution from Holdings of approximately $269.8 million and used the proceeds of such distribution to pay a dividend to its stockholders. The Board of Directors approved an equitable adjustment to stock options in order to reduce the exercise price of the outstanding stock options.
F-43