Attached files
| file | filename |
|---|---|
| EXCEL - IDEA: XBRL DOCUMENT - BLUE NILE INC | Financial_Report.xls |
| EX-31.1 - CERTIFICATION OF PRINCIPAL CHIEF EXECUTIVE OFFICER REQUIRED UNDER RULE 13A-14(A - BLUE NILE INC | nile-1042015x10kex311.htm |
| EX-32.1 - CERTIFICATION OF PRINCIPAL CHIEF EXECUTIVE OFFICER REQUIRED UNDER RULE 13A-14(B) - BLUE NILE INC | nile-1042015x10kex321.htm |
| EX-32.2 - CERTIFICATION OF PRINCIPAL FINANCIAL OFFICER REQUIRED UNDER RULE 13A-14(B) - BLUE NILE INC | nile-1042015x10kex322.htm |
| EX-23.1 - CONSENT OF DELOITTE & TOUCHE LLP - BLUE NILE INC | nile-1042015x10kexhibit231.htm |
| EX-21.1 - SUBSIDIARIES OF THE REGISTRANT - BLUE NILE INC | nile-1042015x10kexhibit211.htm |
| EX-31.2 - CERTIFICATION OF PRINCIPAL FINANCIAL OFFICER REQUIRED UNDER RULE 13A-14(A) - BLUE NILE INC | nile-1042015x10kex312.htm |
UNITED STATES SECURITIES AND EXCHANGE COMMISSION
Washington, D.C. 20549
FORM 10-K
x ANNUAL REPORT PURSUANT TO SECTION 13 OR 15(d) OF THE SECURITIES EXCHANGE ACT OF 1934
For the fiscal year ended January 4, 2015
OR
¨ TRANSITION REPORT PURSUANT TO SECTION 13 OR 15(d)
OF THE SECURITIES EXCHANGE ACT OF 1934
For the transition period from to
Commission file number 000-50763
Blue Nile, Inc.
(Exact name of registrant as specified in its charter)
Delaware | 91-1963165 |
(State or other jurisdiction of incorporation or organization) | (I.R.S. Employer Identification No.) |
411 First Avenue South, Suite 700
Seattle, Washington 98104
(206) 336-6700
(Address and telephone number, including area code, of principal executive offices)
Securities registered pursuant to Section 12(b) of the Act:
Title of Each Class | Name of each exchange on which registered |
Common Stock, $.001 Par Value | The NASDAQ Stock Market LLC |
Securities registered pursuant to Section 12(g) of the Act:
None
Indicate by check mark if the registrant is a well-known seasoned issuer, as defined in Rule 405 of the Securities Act. Yes ¨ No x
Indicate by check mark if the registrant is not required to file reports pursuant to Section 13 or Section 15(d) of the Act. Yes ¨ No x
Indicate by check mark whether the registrant (1) has filed all reports required to be filed by Section 13 or 15(d) of the Securities Exchange Act of 1934 during the preceding 12 months (or for such shorter period that the registrant was required to file such reports), and (2) has been subject to such filing requirements for the past 90 days. Yes x No ¨
Indicate by check mark whether the registrant has submitted electronically and posted on its corporate Web site, if any, every Interactive Data File required to be submitted and posted pursuant to Rule 405 of Regulation S-T during the preceding 12 months (or for such shorter period that the registrant was required to submit and post such files). Yes x No ¨
Indicate by check mark if disclosure of delinquent filers pursuant to Item 405 of Regulation S-K (§229.405 of this chapter) is not contained herein, and will not be contained, to the best of registrant’s knowledge, in definitive proxy or information statements incorporated by reference in Part III of this Form 10-K or any amendment to this Form 10-K. ¨
Indicate by check mark whether the registrant is a large accelerated filer, an accelerated filer, a non-accelerated filer, or a smaller reporting company. See the definitions of “large accelerated filer,” “accelerated filer” and “smaller reporting company” in Rule 12b(2) of the Exchange Act.
Large accelerated filer ¨ | Accelerated filer x | |
Non-accelerated filer ¨ | Smaller reporting company ¨ | |
(do not check if a smaller reporting company) | ||
Indicate by check mark whether the registrant is a shell company (as defined in Rule 12b-2 of the Exchange Act). Yes ¨ No x
The aggregate market value of the voting stock held by non-affiliates of the registrant at June 29, 2014 was approximately $331 million, based on the last trading price of $27.97 per share, excluding approximately 52,000 shares held by directors and executive officers of the registrant. This calculation does not exclude shares held by organizations whose ownership exceeds 5% of the registrant’s outstanding common stock as of June 29, 2014 that have represented on Schedule 13G filed with the Securities and Exchange Commission that they are registered investment advisers or investment companies registered under Section 8 of the Investment Company Act of 1940.
The number of shares outstanding of the registrant’s common stock as of February 20, 2015 was 11,872,475.
DOCUMENTS INCORPORATED BY REFERENCE
Portions of the Company’s definitive Proxy Statement to be filed with the Commission pursuant to Regulation 14A in connection with the 2015 Annual Meeting of Stockholders are incorporated by reference into Part III of this Annual Report on Form 10-K. The proxy statement will be filed with the Securities and Exchange Commission within 120 days of the registrant's fiscal year ended January 4, 2015.
BLUE NILE, INC.
ANNUAL REPORT ON FORM 10-K FOR THE FISCAL YEAR ENDED JANUARY 4, 2015
Page | ||
PART I | ||
Item 1. | ||
Item 1A. | ||
Item 1B. | ||
Item 2. | ||
Item 3. | ||
Item 4. | ||
PART II | ||
Item 5. | ||
Item 6. | ||
Item 7. | ||
Item 7A. | ||
Item 8. | ||
Item 9. | ||
Item 9A. | ||
Item 9B. | ||
PART III | ||
Item 10. | ||
Item 11. | ||
Item 12. | ||
Item 13. | ||
Item 14. | ||
PART IV | ||
Item 15. | ||
2
PART I
This Annual Report on Form 10-K contains forward-looking statements that involve many risks and uncertainties. These statements, which relate to future events and our future performance, are based on current expectations, estimates, forecasts and projections about the industries in which we operate and the beliefs and assumptions of our management as of the date of this filing. In some cases, you can identify forward-looking statements by terms such as “would,” “could,” “may,” “will,” “should,” “expect,” “intend,” “plan,” “anticipate,” “believe,” “estimate,” “predict,” “potential,” “target,” “seek,” or “continue,” the negative of these terms or other variations of such terms. In addition, any statements that refer to projections of our future financial performance, our anticipated growth and trends in our business and other characterizations of future events or circumstances, are forward-looking statements. These statements are only predictions based upon assumptions made that are believed to be reasonable at the time, and are subject to risk and uncertainties. Therefore, actual events or results may differ materially and adversely from those expressed in any forward-looking statement. In evaluating these statements, you should specifically consider the risks described under the caption “Item 1A Risk Factors” and elsewhere in this Annual Report on Form 10-K. These factors, and other factors, may cause our actual results to differ materially from any forward-looking statements. Except as required by law, we undertake no obligation to publicly update or revise any forward-looking statements, whether as a result of new information, future events or otherwise.
Item 1. | Business |
General
Blue Nile's fiscal year ends on the Sunday nearest to December 31. The fiscal year ended on January 4, 2015 which included 53 weeks with the 53rd week falling in our fourth quarter. Fiscal years ended on December 29, 2013, December 30, 2012, January 1, 2012 and January 2, 2011 each included 52 weeks.
Overview
Incorporated in 1999 as a Delaware corporation, Blue Nile is a leading online retailer of high-quality diamonds and fine jewelry. We offer our products for sale through the Blue Nile website in over 40 countries and territories throughout the world. Our primary focus is on growing our business by providing unparalleled quality, selection and value to consumers and delivering exceptional customer service. We believe that our extensive and unique product selection, connection with our customers through our marketing and customer service efforts, and the value we provide to our customers through our competitive pricing will result in increasing our sales and market share both domestically and internationally. Our principal corporate office is located in Seattle, Washington. Our online business model allows us to avoid many of the costs that are typically incurred by physical retail stores. As a result, we are able to realize lower gross profit margins while remaining profitable and providing value to our customers through lower retail prices.
We have the following significant wholly-owned subsidiaries:
• | Blue Nile, LLC (“LLC”), which serves our customers in the U.S., Canada and Asia-Pacific; |
• | Blue Nile Worldwide, Inc., which serves our customers in Europe; |
• | Blue Nile (Shanghai) Trading Co., Ltd., which serves our customers in China, and |
• | Blue Nile Jewellery, Ltd (“Jewellery”), which operates a customer service and fulfillment center in Dublin, Ireland. |
Our domestic sales consist of products delivered to customers within the U.S. and our international sales consist of products delivered to customers outside the U.S.. Financial information by geographic area is included in Note 11 to the consolidated financial statements in Item 8 of this Annual Report on Form 10-K.
We have built a well-respected consumer brand by employing an informative sales process that empowers our customers while offering a broad selection of high-quality jewelry at very competitive prices. Our website showcases more than 200,000 independently certified diamonds and styles of fine jewelry, including rings, wedding bands, earrings, necklaces, pendants, bracelets, gifts, and accessories. We specialize in the customization of diamond jewelry with our “Build Your Own” feature that offers customers the ability to customize diamond rings, pendants and earrings. We have developed an efficient online cost structure and a unique supply solution that eliminates traditional layers of diamond wholesalers and brokers, which generally allows us to purchase most of our product offerings at lower prices by avoiding mark-ups imposed by those intermediaries. While we may selectively acquire diamond inventory that we believe will be attractive to our customers, our supply solution enables us to purchase only those diamonds that our customers have ordered. As a result, we are able to minimize the costs associated with carrying diamond inventory and limit our risk of potential mark-downs.
3
The importance of purchasing diamonds and fine jewelry leads consumers to seek out substantial information and trusted guidance throughout their purchasing process. Our comprehensive website and expertly trained customer service representatives (“diamond and jewelry consultants”) improve the traditional purchasing experience by providing education and detailed product information that enables our customers to objectively compare diamonds and fine jewelry products, and make informed decisions. Our website features an interactive search functionality that allows our customers to quickly find the products that meet their needs from our broad selection of diamonds and fine jewelry.
Business Strategies
Our objective is to maximize our revenue and profitability and increase market share both domestically and internationally by offering exceptional value to our customers through a high-quality customer experience that leverages supply chain efficiencies and an efficient cost structure. We have established and will continue to refine our scalable, capital-efficient business model that enables growth with lower working capital requirements than traditional store-based jewelry retailers. We focus on optimizing the cash flow dynamics of our business by managing inventory balances along with vendor payment terms. Over the longer term, our goal is to increase revenues, profit, and cash flow by leveraging our relatively low fixed-cost expenses as we achieve sales increases. Our strategic initiatives are aimed at driving long-term shareholder value by investing in enhancing the online user experience across multiple platforms, investing in the expansion of our international business, refining our product assortment, utilizing our data analytics to better determine demand elasticity to aggressively price our products, and deepening our supply chain.
Product Offerings and Supplier Relationships
Our merchandise consists of engagement and non-engagement products. The engagement product category includes gold or platinum engagement rings with a diamond center stone and loose diamonds. Our non-engagement product category includes rings, wedding bands, earrings, necklaces, pendants, bracelets, gifts and accessories containing precious metals, diamonds, gemstones, or pearls. Our core business is the engagement category.
Our online business model, combined with the strength of our supplier relationships, enables us to pursue a dynamic merchandising strategy. Our exclusive diamond supplier relationships allow us to display suppliers’ diamond inventories on the Blue Nile website for sale to consumers without holding the diamonds in our inventory until the products are ordered by customers. We purchase polished diamonds from over 50 suppliers, many of whom have long-standing relationships with us. We typically enter into multi-year agreements with diamond suppliers that provide for high-quality diamonds to be offered exclusively online to consumers through the Blue Nile website. Our diamond supply agreements have expiration dates ranging from 2015 to 2018. Our diamond suppliers purchase rough and polished diamonds from sources throughout the world. Their ability to supply us with diamonds is dependent upon their ability to procure these diamonds.
While we currently offer over 200,000 independently certified diamonds, we aim to limit our diamond offerings to those possessing characteristics associated with high-quality. Accordingly, we offer diamonds with specified characteristics in the areas of shape, cut, color, clarity, and carat weight.
We generally purchase diamonds on a “just in time” basis from our suppliers when a customer places an order for a specific diamond. We then assemble the diamond with a ring, pendant or earring setting from our inventory into customized diamond jewelry according to our customer’s specifications. The finished jewelry is delivered to the customer generally within three to seven business days from the order date and within one business day for diamonds held on consignment in our fulfillment facilities.
We offer a broad range of non-engagement products to complement our selection of high-quality customized diamond jewelry. In the case of non-engagement, unlike most diamonds that we sell, we typically take products into inventory before they are ordered by our customers. Our non-engagement products are purchased from over 100 manufacturers, most of whom have long-standing relationships with us. We generally enter into purchase order agreements with suppliers of non-engagement products. These purchase order agreements establish terms for quantity, price, payment and shipping. Additionally, we enter into operating agreements with these suppliers that include product quality requirements, product specifications and shipping procedures. We believe that our current suppliers are able to sufficiently meet our product needs and that there are alternative sources for most products that we purchase.
4
Marketing
Our marketing and advertising efforts include online and offline initiatives, which primarily consist of search engines, online display advertising, affiliate programs, direct online marketing, e-mail marketing, social networking/advertising and public relations.
Customer Service and Support
A key element of our business is our ability to provide a high level of customer service and support. We augment our online information resources with knowledgeable, highly-trained support staff through our call centers to give customers confidence in their purchases. Our diamond and jewelry consultants are trained to provide guidance on all steps in the process of buying engagement and non-engagement products, including, among other things, the process for selecting an appropriate item, the purchase of that item, financing and payment alternatives, and shipping services. Our commitment to customers is reflected in both high service levels that are provided by our extensively-trained diamond and jewelry consultants, as well as in our guarantees and policies. We prominently display all of our guarantees and policies on our website to create an environment of trust. These include policies relating to privacy, security, product availability, pricing, shipping, refunds, exchanges and special orders. We typically offer a return policy of 30 days. We generally do not extend credit to customers; however our customers can make purchases through third-party credit cards and our private label credit card through a sponsoring bank (the "Blue Nile Credit Card"). The Blue Nile Credit Card provides various financing options to our customers and is a vehicle for promoting loyalty programs and other unique offers to our cardholders.
Fulfillment Operations
Our fulfillment operations are designed to enhance value for our customers by fulfilling orders quickly, securely and accurately. When an order for customized diamond jewelry is received, the third-party supplier who holds the diamond in inventory generally ships it to us, or to independent third-party jewelers with whom we maintain ongoing relationships for assembly, within one to three business days. Upon receipt, the merchandise is sent to assembly for setting and sizing, which is performed by our jewelers or independent third-party jewelers. Each diamond is inspected upon arrival from our suppliers, and each finished product is inspected prior to shipment to a customer. Prompt and secure delivery of our products is a high priority, and we ship nearly all diamond and fine jewelry products via nationally recognized carriers. Loose diamonds and customized diamond jewelry products may be shipped by us or by our suppliers or third-party jewelers directly to our customers.
Technology and Systems
Our technology systems use a combination of proprietary, licensed and open-source technologies. We focus our internal development efforts on creating and enhancing the features and functionality of our website across multiple platforms as well as further refining our order processing and fulfillment systems to deliver a high-quality customer experience. We license third-party information technology systems for our financial reporting, inventory management, call center operations, order fulfillment and merchandising. We use hosted service providers for e-mail, content distribution and other services. We use redundant Internet carriers to minimize the risk of downtime. Our systems are monitored continuously using third-party software, and an on-call team is staffed to respond to any emergencies or unauthorized access in the technology infrastructure.
Seasonality
We generally experience seasonal fluctuations in demand for our products. Our quarterly sales are impacted by various gift giving holidays including Valentine’s Day (first quarter), Mother’s Day (second quarter) and Christmas (fourth quarter). As a result, our quarterly revenue is generally the lowest in the third quarter (as a result of the lack of recognized gift giving holidays) and highest in the fourth quarter. The fourth quarter accounted for approximately 33%, 32%, and 34% of our net sales in the fiscal years ended January 4, 2015, December 29, 2013 and December 30, 2012, respectively.
Competition
The engagement and non-engagement retail market is intensely competitive and highly fragmented. Our primary competition comes from online and offline retailers that offer products within the higher quality segment of the jewelry market. We also compete with other retailers that move into the higher quality jewelry segment. Current and potential competitors include the following:
• | independent jewelry stores, |
5
• | retail jewelry store chains, |
• | online retailers that sell jewelry and online jewelry retailers, |
• | department stores, chain stores and mass retailers, |
• | online auction sites, |
• | catalog and television shopping retailers, |
• | discount superstores and wholesale clubs, and |
• | Internet shopping clubs. |
In addition to these competitors, we may face competition from suppliers of our products that decide to sell directly to consumers, either through physical retail outlets or through an online store. We also face competition from entities that make and market synthetic stones and gems to compete in the market for diamonds and diamond jewelry.
We believe that the principal competitive factors in our market are product selection and quality, customer service and support, price, brand recognition, reputation, reliability and trust, website features and functionality, convenience, and delivery performance. We believe that we compete favorably in the market for engagement and non-engagement products by focusing on these factors.
Intellectual Property
We rely on general intellectual property law and contractual restrictions and, to a limited extent, copyrights and patents, to protect our proprietary rights and technology. These contractual restrictions include confidentiality agreements, invention assignment agreements and nondisclosure agreements with employees, contractors, suppliers and strategic partners. In addition, we pursue the registration of our trademarks and service marks in the U.S. and certain other countries. In the U.S. and certain other countries, we have registered or have applications pending for, “Blue Nile,” the BN logo, the Blue Nile BN stylized logo, “Build Your Own Ring”, “Build Your Own Five-Stone Ring,” “Build Your Own Three Stone Ring,” “Build Your Own Diamond Jewelry,” “Build Your Own Diamond Pendant,” “Build Your Own Earrings,” and "Build Your Own Charm Bracelet". In addition, we are the holder of a patent entitled "Computerized Search Technique, such as an Internet-Based Gemstone Search Technique" (U.S. Patent No. 8,271,521) and have several other U.S. patent applications pending which relate to certain features of our website. We have registered the bluenile.com, bluenile.co.uk and bluenile.ca Internet domain names and various other related domain names We have also registered copyrights with respect to certain images and information set forth on our website and certain computer codes incorporated in our website. Despite the protection of general intellectual property law and our contractual restrictions, it may be possible for a third-party to copy or otherwise obtain and use our intellectual property without our authorization. However, effective intellectual property protection or enforcement may not be available or cost effective in every country in which our products and services are made available. We also rely on technologies that we license from third parties, particularly software solutions for financial reporting, inventory management, order fulfillment and merchandising.
Employees
At January 4, 2015, we employed 288 full-time employees and 13 part-time employees. We also utilize temporary personnel on a seasonal basis. Our employees are not party to any collective bargaining agreement and we have never experienced an organized work stoppage. We believe our relations with our employees are good.
Available Information
We make available, free of charge, through our website, www.bluenile.com, our Annual Report on Form 10-K, quarterly reports on Form 10-Q, current reports on Form 8-K and any amendments to those reports as soon as reasonably practicable after electronically filing such material with or furnishing it to the Securities and Exchange Commission (“SEC”). Our SEC reports, as well as our corporate governance policies and code of ethics, can be accessed through the investor relations section of our website. The information found on our website is not part of this or any other report filed with or furnished to the SEC. All of our filings with the SEC may be obtained at the SEC’s Public Reference Room at 100 F Street, NE, Washington, DC 20549. For information regarding the operation of the SEC’s Public Reference Room, please contact the SEC at 1-800-SEC-0330. Additionally, the SEC maintains an Internet site that contains reports, proxy and information statements and other information regarding issuers that file electronically with the SEC at www.sec.gov. Amendments to, and waivers from, our code of ethics that apply to our principal executive officer, principal financial officer and principal accounting officer, or persons performing similar functions, and that relates to any element of the code of ethics definition enumerated in Item 406(b) of Regulation S-K will be disclosed at the website address provided above and, to the extent required by applicable regulations, on a current report on Form 8-K.
6
Item 1A. | Risk Factors |
You should carefully consider the risks described below and elsewhere in this Annual Report on Form 10-K, which could materially and adversely affect our business, results of operations or financial condition. Our business faces significant risks and the risks described below may not be the only risks we face. Additional risks not presently known to us or that we currently believe are immaterial may materially affect our business, results of operations, or financial condition. If any of these risks occur, the trading price of our common stock could decline and you may lose all or part of your investment.
Our business results are significantly affected by the value we are able to provide to our customers.
Demand for our products has been highly sensitive to pricing changes, because the success of our business model depends, in part, on our ability to offer quality products to customers at prices that are below those of traditional jewelry retailers. Pricing changes may result from changes in commodity prices or changes in our pricing strategy. The price of commodities upon which we are substantially dependent are subject to fluctuations arising from changes in supply and demand, competition, and market speculation. Because of our virtual inventory model for loose diamonds, our diamond product prices are much more sensitive to rapid fluctuations in the prices of diamonds than traditional retailers, which typically hold diamonds in inventory. Rapid and significant increases in commodity prices, particularly diamond prices, may materially and adversely affect our sales, gross margins, customer experience, and competitive position. Further, we have and will continue to change our product pricing strategies. Our pricing strategies have and will likely to continue to have a significant impact on our net sales, gross margins, and net income.
Our business may be adversely affected, if we are unable to provide a cost-effective shopping platform that is able to respond and adapt to rapid changes in technology and consumer preferences.
The number of people who access the Internet through devices other than personal computers, including mobile phones, smart phones, handheld computers such as notebooks and tablets, video game consoles, and television set-top devices, has increased dramatically in the past few years. The smaller screen size, functionality, and memory associated with some alternative devices may make the use of our website and purchasing our products more difficult; and the versions of our website developed for these devices may not be compelling to consumers. Each manufacturer or distributor may establish unique technical standards for its devices, and our website may not work or be viewable on these devices as a result. As new devices and new platforms are continually being released, it is difficult to predict the challenges we may encounter in developing versions of our website for use on these alternative devices and we may need to devote significant resources to the creation, support, and maintenance of such devices. If we are unable to attract consumers to our website through these devices or are slow to develop a version of our website that is more compatible with alternative devices, we may fail to capture a significant share of consumers in the market for diamonds and fine jewelry, which could adversely affect our business.
Further, we may be required to upgrade existing technologies or business applications, or implement new technologies or business applications. Our results of operations may be affected by the timing, effectiveness and costs associated with the successful implementation of any upgrades or changes to our systems and infrastructure.
General economic factors may adversely affect our financial performance and results of operations.
Our financial performance and results of operations depend significantly on worldwide economic conditions and their impact on consumer spending. Luxury products, such as diamonds and fine jewelry, are discretionary purchases for consumers. Recessionary economic cycles, higher interest rates, higher fuel and energy costs, inflation, levels of unemployment, conditions in the residential real estate and mortgage markets, access to credit, consumer debt levels, unsettled financial markets, and other economic factors that may affect consumer spending or buying habits could materially and adversely affect demand for our products. In addition, volatility in the financial markets has had and may continue to have a negative impact on consumer spending patterns. A reduction in consumer spending or disposable income may affect us more significantly than companies in other industries and companies with a more diversified product offering. In addition, negative national or global economic conditions may materially and adversely affect our suppliers’ financial performance, liquidity and access to capital. This may affect their ability to maintain their inventories, production levels and/or product quality, and could cause them to raise prices, lower production levels or cease their operations.
Economic factors such as increased commodity prices, shipping costs, inflation, higher costs of labor, insurance and healthcare, and changes in and/or interpretations of other laws, regulations, and taxes may also increase our cost of sales and
7
our selling, general and administrative expenses, and otherwise adversely affect our financial condition and results of operations. Any significant increases in costs may affect our business disproportionately than our competitors.
Further, any reduction in our sales will affect our liquidity. As discussed under “Liquidity and Capital Resources” in Part I, Item 2 of this Annual Report on Form 10-K, our liquidity is primarily dependent upon our net cash from operating activities. Our net cash from operating activities is sensitive to many factors, including changes in working capital. Working capital at any specific point in time is dependent upon many variables, including our operating results, seasonality, inventory management and level of product assortment expansion, the timing of cash receipts and payments, and vendor payment terms.
In order to increase net sales and to sustain or increase profitability, we must attract customers in a cost-effective manner.
Our success depends on our ability to attract customers in a cost-effective manner. Our investments in marketing may not effectively reach potential consumers or those consumers may not decide to buy from us or the volume of consumers that purchase from us does not yield the intended return on investment. With respect to our marketing channels, we rely on relationships with providers of online services, search engines, directories and other websites and e-commerce businesses to provide content, advertising banners and other links that direct customers to our websites. We rely on these relationships as significant sources of traffic to our website. In particular, we rely on Google as an important marketing channel, if Google changes its algorithms or if competition increases for advertisements on Google, we may be unable to cost-effectively drive qualified consumers to our website.
Our agreements with our marketing providers generally have terms of one year or less. If we are unable to develop or maintain these relationships on acceptable terms, our ability to attract new customers would be harmed. In addition, many of the parties with whom we have online-advertising arrangements could provide advertising services to other companies, including retailers with whom we compete. As competition for online advertising has increased, the cost for these services has also increased. A significant increase in the cost of the marketing vehicles upon which we rely could adversely impact our ability to attract customers in a cost-effective manner and harm our business and results of operations. Further, we use promotions as a way to drive sales, these promotional activities may not drive sales and may adversely affect our gross margins.
Our supplier relationships are a key component of our business.
A majority of the world’s supply of rough diamonds is controlled by a small number of diamond mining firms. As a result, any decisions made to restrict the supply of rough diamonds by these firms to our suppliers could substantially impair our ability to acquire diamonds at commercially reasonable prices, if at all. We do not currently have any direct supply relationships with these firms. Our ability to acquire diamonds and fine jewelry is also substantially dependent on our relationships with various suppliers. Approximately 18%, 20% and 14% of our payments to our diamond and fine jewelry suppliers for each of the years ended January 4, 2015, December 29, 2013 and December 30, 2012, respectively, were made to our top three suppliers for that year. The top three suppliers may change from year to year. Our inability to maintain and expand these and other future diamond and fine jewelry supply relationships on commercially reasonable terms or the inability of our current and future suppliers to maintain arrangements for the supply of products sold to us on commercially reasonable terms would substantially harm our business and results of operations. The financial performance and viability of our suppliers are also significantly dependent upon worldwide economic conditions and consumer demand for diamonds and fine jewelry. The failure of any of our principal suppliers to remain financially viable could adversely impact our supply of diamonds and fine jewelry for sale to our customers. Further, we typically have exclusive online supply relationships with our diamond suppliers. If we were no longer able to maintain these exclusive relationships with key suppliers, this may adversely impact our diamond supply and may harm our business results of operations.
Suppliers and manufacturers of diamonds as well as retailers of diamonds and diamond jewelry are vertically integrated and we expect they will continue to vertically integrate their operations either by developing retail channels for the products they manufacture or acquiring sources of supply, including, without limitation, diamond mining operations. To the extent such vertical integration efforts are successful, some of the fragmentation in the existing diamond supply chain could be eliminated, our ability to obtain an adequate supply of diamonds and fine jewelry from multiple sources could be limited and our competitors may be able to obtain diamonds at lower prices.
We may not succeed in sustaining and promoting the Blue Nile brand, which would prevent us from acquiring customers and increasing our net sales.
8
A component of our future growth is the continued establishment and promotion of the Blue Nile brand. Due to the competitive nature of the market for diamonds and fine jewelry, if we do not sustain and promote our brand and branded products, we may fail to build the critical mass of customers required to substantially increase our net sales. Promoting and positioning our brand will depend largely on the success of our marketing and merchandising efforts and our ability to provide a consistent, high-quality product and customer experience. To promote our brand and products, we have incurred and will continue to incur substantial expenses related to advertising and other marketing efforts. These expenses may not result in increased consumer demand for our products, which would negatively impact our financial results.
A critical component of our brand promotion strategy is establishing a relationship of trust with our customers, which we believe can be achieved by providing a high-quality customer experience. In order to provide a high-quality customer experience, we have invested and will continue to invest substantial amounts of resources in the development and functionality of our website, technology infrastructure, fulfillment operations and customer service operations. Our ability to provide a high-quality customer experience is also dependent, in large part, on external factors over which we may have little or no control, including, without limitation, the reliability and performance of our suppliers, third-party jewelry assemblers, third-party carriers, third party diamond grading labs, and networking vendors. We rely on temporary employees, especially during our peak holiday seasons, to supplement our full-time customer service and fulfillment employees. Temporary employees may not have the same level of commitment to our customers as our full-time employees. If our customers are dissatisfied with the quality of the products or the customer service they receive, or if we are unable to deliver products to our customers in a timely manner or at all, our customers may stop purchasing products from us. We also rely on third parties for information, including product characteristics and availability that we present to consumers on our website, which may, on occasion, be inaccurate. Likewise, we have implemented, and we require our suppliers to implement, rigorous quality assurance measures to ensure that all diamonds we sell are 100% natural. Despite these efforts and assurances from our suppliers to provide us only 100% natural diamonds, it is possible that man-made or enhanced diamonds could be mixed in with natural diamonds and passed to us without our detection. We have made commitments to our customers to sell 100% natural diamonds and any inclusion of man-made or enhanced diamonds could cause significant damage to our reputation and brand. Our failure to provide our customers with high-quality products and high-quality customer experiences for any reason could substantially harm our reputation and adversely impact our efforts to develop Blue Nile as a trusted brand. The failure of our brand promotion activities could adversely affect our ability to attract new customers and maintain customer relationships, and, as a result, substantially harm our business and results of operations.
Our financial results may be negatively affected if we are required to collect additional taxes on sales or disclose our customers' private information to tax authorities.
The application of indirect taxes (such as sales and use tax, value-added tax ("VAT"), goods and services tax, and similar taxes) to ecommerce businesses such as Blue Nile, and to our users is a complex and evolving issue. Currently, we collect indirect taxes related to purchases by customers located in the State of Washington and the State of New York, and certain indirect taxes required to be collected on sales to customers outside of the United States. One or more states or foreign countries have sought and others may seek to impose additional indirect tax collection obligations on us in the future and/or require us to disclose to tax authorities our customers' private information, including but not limited to names, addresses, purchase amounts, and purchase dates. For example:
• | the State of New York has passed legislation that requires any out-of-state seller of tangible personal property to collect and remit New York use tax if the seller engages affiliates above certain financial thresholds in New York to perform certain business promotion activities. Approximately one-third of U.S. states, including California, have enacted similar legislation. |
• | the U.S. Congress continues to pursue legislation that would allow states to require out-of-state sellers to collect and remit indirect taxes on orders shipped to their state. If enacted, legislation could require us to collect sales tax for orders shipped to all states with such a tax. |
Given that we sell high value items, indirect tax is a significant consideration, and thus additional obligations to collect indirect taxes from customers may adversely impact our future sales. A successful assertion by one or more states, U.S. Congress, or foreign countries to require the collection of indirect taxes on the sale of our products and/or to require us to disclose our customers' private information to tax authorities could result in substantial tax, penalty, and interest liabilities for past sales; discourage customers from purchasing products from us; decrease our competitive advantage; cause us to spend additional money, time, and other resources to understand and comply with multi-jurisdictional tax structures; cause us to discontinue certain successful sales and marketing initiatives; and otherwise substantially harm our business and results of operations.
Our systems may be vulnerable to security breaches.
9
Our business is heavily dependent on the operation of our technology systems. These systems are vulnerable to unauthorized access from unintentional events or errors caused by employees or third party service providers, or deliberate attacks through actions of third parties. Such security breaches may result in operational disruption, misappropriation of customer credit card or other sensitive information, or corruption of data.
We devote significant resources to address security vulnerabilities including the use of encryption and authentication technology licensed from third parties to effect secure transmission of confidential information, including credit card numbers. Advances in computer capabilities, human errors, and new discoveries in the field of cryptography or other developments may result in a compromise or breach of the technology used by us to protect customer transaction data. In addition, any party who is able to illicitly obtain a user’s password could access the customer’s transaction data. An increasing number of websites and Internet companies have reported breaches of their security.
Any such breach or compromise of our security could result in significant legal and financial exposure, damage to our reputation, and a loss of confidence in the security of our products and services that could potentially have an adverse effect on our business and results of operations. In addition, anyone who is able to circumvent our security measures could misappropriate proprietary information or cause interruptions in our operations, damage our computers or those of our customers. Because the techniques used to obtain unauthorized access, disable or degrade service, or sabotage systems change frequently and often are not recognized until launched against a target, we may be unable to anticipate these techniques or to implement adequate cost-effective preventative measures. These issues are likely to become more difficult as we expand the number of countries in which we operate. We may need to expend significant resources to protect against security breaches or to address problems caused by breaches. Regardless of our efforts, we may not be able to prevent a breach or contain a breach if it occurs.
We may be unsuccessful in further expanding our operations internationally.
For the year ended January 4, 2015, international net sales represented 17.1% of our total net sales. We continue to increase marketing and sales efforts and anticipate continuing to expand our international sales and operations in the future either by expanding local versions of our website for foreign markets, through acquisitions, investments or alliances with third parties, or through other means. Investments in foreign entities may be impaired and lose value, and this risk of loss is heightened by potential changes in the legal and regulatory environment in the international markets where these acquired businesses or joint ventures operate.
Further, any international expansion plans we choose to undertake will increase the complexity of our business, require attention from management and other personnel and cause additional strain on our operations, technology systems, financial resources, and our internal financial control and reporting functions. Further, our expansion efforts may be unsuccessful. We have limited experience selling our products in international markets and in conforming to the local cultures, standards or policies necessary to successfully compete in those markets. We cannot be certain that we will be able to expand our global presence if we choose to further expand internationally. In addition, we may have to compete with retailers that have more experience with local markets. Our ability to expand and succeed internationally may also be limited by the demand for our products, the ability to successfully transact in foreign currencies, the ability of our brand to resonate with consumers globally and the adoption of online or Internet commerce in these markets. Different privacy, censorship and liability standards and regulations, and different intellectual property laws in foreign countries may prohibit expansion into such markets or cause our business and results of operations to suffer.
Our current and future international operations may also fail to succeed due to other risks inherent in foreign operations, including:
• | the need to develop new supplier and jeweler relationships; |
• | international regulatory requirements, tariffs and duties; |
• | difficulties in staffing and managing foreign operations; |
• | longer payment cycles from credit card companies; |
• | greater difficulty in accounts receivable collection; |
• | our reliance on third-party carriers for product shipments to our customers; |
• | risk of theft of our products during shipment; |
• | limited payment, shipping and insurance options for us and our customers; |
• | potential adverse tax consequences; |
• | foreign currency exchange risk; |
• | lack of infrastructure to adequately conduct electronic commerce transactions or fulfillment operations; |
• | unclear foreign intellectual property protection laws; |
10
• | laws and regulations related to corporate governance and employee/employer relationships; |
• | price controls or other restrictions on foreign currency; |
• | difficulties in obtaining export, import or other business licensing requirements; |
• | customs and import processes, costs or restrictions; |
• | increased payment risk and greater difficulty addressing credit card fraud; |
• | consumer and data protection laws; |
• | lower levels of adoption or use of the Internet; |
• | geopolitical events, including war and terrorism; or |
• | the need to conduct business in foreign languages on both the website and in our customer service efforts. |
The People’s Republic of China (“PRC”) governs Blue Nile’s subsidiaries' and partners’ businesses and operations through laws, regulations and licensing requirements restricting (i) foreign investment in Internet sales, importation of goods and services, IT infrastructure, retail, and other sectors, and (ii) Internet content. There are uncertainties in the interpretation of the PRC laws, regulations and licensing requirements. If our Chinese business interests were found to be in violation of any existing or future PRC laws or regulations or if interpretations of laws and regulations were to change, the business could be subject to fines and other financial penalties, have licenses revoked, or be forced to shut down entirely.
We face significant competition and may be unsuccessful in competing against current and future competitors.
The retail jewelry industry is intensely competitive. Online retail, including mobile and tablet, is rapidly evolving and subject to changing technology, shifting consumer preferences and tastes, and frequent introductions of new products and services. We expect the competition in the sale of diamonds and fine jewelry to increase and intensify in the future. Our current and potential competitors range from large and established companies to emerging start-ups. Larger more established companies have longer operating histories, greater brand recognition, existing customer and supplier relationships, and significantly greater financial, marketing and other resources. Additionally, larger competitors seeking to establish an online presence may be able to devote substantially more resources to website systems development and exert more leverage over the supply chain for diamonds and fine jewelry than we can. Larger competitors may also be better capitalized to opportunistically acquire, invest or partner with other domestic and international businesses.
Emerging start-ups may be able to innovate and provide products and services faster than we can, and they may be willing to more aggressively price their products in order to gain market share. In addition, traditional store-based retailers offer consumers the ability to physically handle and examine products in a manner that is not possible over the Internet, as well as a more convenient means of returning and exchanging purchased products. If our competitors are more successful than us in offering compelling products or in attracting and retaining consumers, our revenues and growth rates could decline. Such reductions and/or inventory liquidations can have a short-term adverse effect on our sales. Current and potential competitors include:
• | independent jewelry stores; |
• | retail jewelry store chains, such as Tiffany & Co.; |
• | online retailers that sell jewelry and online jewelry retailers, such as Amazon.com, James Allen, and Brilliant Earth; |
• | department stores, chain stores and mass retailers, such as Nordstrom and Neiman Marcus; |
• | online auction sites, such as eBay; |
• | catalog and television shopping retailers, such as HSN and QVC; |
• | discount superstores and wholesale clubs, such as Wal-Mart and Costco Wholesale; and |
• | Internet shopping clubs, such as Gilt Groupe and Rue La La. |
In addition to these competitors, we may face competition from suppliers of our products that decide to sell directly to consumers, either through physical retail outlets or through online stores. We also face competition from entities that make and market synthetic stones and gems to compete in the market for diamonds and diamond jewelry.
As a result of seasonal fluctuations in our net sales, our quarterly results may fluctuate and could be below expectations.
We have experienced and expect to continue to experience seasonal fluctuations in our net sales. In particular, a disproportionate amount of our net sales has been realized during the fourth quarter as a result of the December holiday season, and we expect this seasonality to continue in the future. Approximately 33%, 32% and 34% of our net sales in the years ended January 4, 2015, December 29, 2013 and December 30, 2012, respectively, were generated during the fourth quarter of each year. In anticipation of increased sales activity during the fourth quarter, we may incur significant additional expenses, including higher inventory of fine jewelry, additional marketing, and additional staffing in our fulfillment and customer support operations. If we experience lower than expected net sales during any fourth quarter, it may have a disproportionately large
11
impact on our operating results and financial condition for that year. Further, we may experience an increase in our net shipping costs due to complimentary upgrades, split-shipments, and additional long-zone shipments necessary to ensure timely delivery for the holiday season. We also experience considerable fluctuations in net sales in periods preceding other annual occasions such as Valentine’s Day (first quarter) and Mother’s Day (second quarter). In the future, our seasonal sales patterns may become more pronounced, may strain our personnel and fulfillment activities, and may cause a shortfall in net sales as compared with expenses in a given period, which could substantially harm our business and results of operations.
We may have exposure to greater than anticipated tax liabilities.
We are subject to various federal, state and local taxes in both the United States and foreign jurisdictions. Significant judgment is required in evaluating and estimating worldwide provisions and accruals for these taxes. In the ordinary course of our business, there are many transactions and calculations where the ultimate tax determination is uncertain. Our determination of our tax liability is always subject to audit in various jurisdictions, and such jurisdictions may assess additional tax liabilities, penalties, and interest against us. Although we believe our estimates are reasonable, the ultimate outcome of a tax audit and any related litigation could be materially different from our tax provisions and accruals, and could have a material adverse effect on our financial results. Changes to tax laws, changes to interpretations of existing tax laws, and/or developments in an audit or litigation could have a material effect on our operating results and cash flow for the period or periods for which that change or development occurs, as well as for prior and subsequent periods. In addition, the imposition of additional tax obligations on our business by federal, state and local governments could create significant administrative burdens for us, decrease our future sales and harm our cash flow and operating results.
System interruptions that impair customer access to our website would damage our reputation and brand and substantially harm our business and results of operations.
The satisfactory performance, reliability and availability of our website, transaction processing systems and network infrastructure are critical to our reputation, our ability to attract and retain customers, and to maintain adequate customer service levels. Any future system interruptions, downtime or technical difficulties that result in the unavailability of our website or reduced order fulfillment performance could result in negative publicity, damage our reputation and brand, and cause our business and results of operations to suffer. We may be susceptible to such disruptions in the future. We may also experience temporary system interruptions for a variety of other reasons in the future, including power failures, failures of Internet service and telecommunication providers, software or human errors, or an overwhelming number of visitors trying to reach our website during periods of strong seasonal demand or promotions. Because we are dependent, in part, on third parties for the implementation and maintenance of certain aspects of our systems and because some of the causes of system interruptions may be outside of our control, we may not be able to remedy such interruptions in a timely manner, or at all.
Our corporate headquarters, primary fulfillment center, and the co-location facility which houses our computer and communication systems are located in Seattle, Washington. A natural disaster in Seattle, Washington may result in significant physical damage to or closure of one or more of these facilities, and significantly interrupt our customer service and fulfillment center operations, which could adversely affect our results of operations. Additionally, our systems and operations are vulnerable to damage or interruption from human error, fire, flood, power loss, telecommunications failure, terrorist attacks, acts of war, break-ins, and similar events. We do not presently have redundant systems in multiple locations and our business interruption insurance may be insufficient to compensate us for losses that may occur. Any interruptions in our fulfillment center operations for any significant period of time could damage our reputation and brand and substantially harm our business and results of operations.
We rely on our suppliers, third-party carriers and third-party jewelers as part of our fulfillment process, and these third parties may fail to adequately serve our customers.
We significantly rely on our suppliers to promptly ship us diamonds ordered by our customers. Any failure by our suppliers to sell and ship such products to us in a timely manner will have an adverse effect on our ability to fulfill customer orders and harm our business and results of operations. Our suppliers, in turn, rely on third-party carriers to ship diamonds to us, and in some cases, directly to our customers. We also rely on a limited number of third-party carriers to deliver inventory to us and product shipments to our customers. We and our suppliers are therefore subject to the risks, including employee strikes, inclement weather, power outages, national disasters, rising fuel costs and financial constraints associated with such carriers’ abilities to provide delivery services to meet our and our suppliers’ shipping needs. In addition, for some customer orders we rely on third-party jewelers to assemble and ship the product. Our suppliers’, third-party carriers’ or third-party jewelers’ failure to deliver high-quality products to us or our customers in a timely manner or to otherwise adequately serve our customers would damage our reputation and brand and substantially harm our business and results of operations.
12
Our stock price has been volatile historically, and may continue to be volatile. Further, sales of our common stock by stockholders with significant holdings may cause the price of our common stock to decrease.
The trading price of our common stock has been and may continue to be subject to wide fluctuations. Our stock price may fluctuate in response to a number of events and factors, such as quarterly variations in operating results, announcements by us or our competitors, including announcements relating to strategic decisions or key personnel, service disruptions, changes in financial estimates and recommendations by security analysts, the operating and stock price performance of other companies that investors may deem comparable to us, volatility in the financial markets, and news reports relating to trends in our markets or general economic conditions. The impact of these events and factors on our stock price is amplified by the relatively low number of our shares on the market.
In addition, several of our stockholders own significant portions of our common stock. If these stockholders were to sell all or a portion of their holdings of our common stock, the market price of our common stock could be negatively impacted. The effect of such sales, or of significant portions of our stock being offered or made available for sale, could result in strong downward pressure on our stock price. Investors should be aware that they could experience significant short-term volatility in our stock if such stockholders decide to sell all or a portion of their holdings of our common stock at once or within a short period of time.
Repurchases of our common stock or other investments we may make may not prove to be the best use of our cash resources.
We have and plan to continue to opportunistically repurchase shares of our common stock. Since the inception of our stock repurchase program in the first quarter of 2005 through January 4, 2015, we have repurchased an aggregate of 9.0 million shares for a total of $316.1 million. On October 28, 2013, our board of directors authorized the renewal of our stock repurchase program. We are authorized to repurchase up to $100.0 million of our common stock over the 24 months following the approval date. As of January 4, 2015, $59.7 million remained under the repurchase authorization.
These repurchases and any repurchases we may make in the future may not prove to be at optimal prices and our use of cash for the stock repurchase program may not prove to be the best use of our cash resources and may adversely impact our future liquidity.
In addition, we have used in the past, and may use in the future, our cash and cash equivalents to make investments in certain businesses and ventures as our management thinks appropriate. These investments may decline in value after they are made or we may entirely lose the cash associated with the investment.
We may not accurately forecast net sales and appropriately plan our expenses.
We may base our current and future expense levels on our operating forecasts and estimates of future net sales. Net sales and operating results are difficult to forecast because they generally depend on the volume and timing of the orders we receive, which are uncertain. Additionally, our business is affected by general economic and business conditions in the U.S. and international markets. A softening in net sales, whether caused by changes in customer preferences or a weakening in the U.S. or global economies, may result in decreased revenue levels. Some of our expenses are fixed, and as a result, we may be unable to adjust our spending in a timely manner to compensate for any unexpected shortfall in net sales. This inability could cause our net income in a given quarter to be lower than expected. We also make certain assumptions when forecasting the amount of expense we expect related to our stock-based compensation, which includes the expected volatility of our stock price, the expected life of stock options granted and the expected rate of stock option and restricted stock unit forfeitures. These assumptions are partly based on historical results. If actual results differ from our estimates, our net income in a given quarter may be lower than expected.
If we are unable to accurately manage our inventory of fine jewelry, our reputation, results of operations and cash flow could suffer.
Except for loose diamonds, substantially all of the fine jewelry we sell is from our physical inventory. We are faced with the constant challenge of balancing our inventory levels with our ability to meet our customer needs. Based on internally generated projections, we purchase jewelry and jewelry components. These projections are based on many unknown assumptions around consumer demand, fashion trends, time to manufacture, pricing, etc.. If these inventory projections are too high, our inventory may be too high, which may result in lower retail prices and gross margins, risk of obsolescence, and harm to our financial results. Conversely, if these projections are too low, and we underestimate the consumer demand for our products, we are exposed to lost business opportunities which could have a material adverse effect on our business, results of
13
operations, financial condition, and cash flows. Additionally, as we increase our product offerings, we may be forced to increase inventory levels, which will increase our risks related to our inventory.
We rely on our relationship with a third-party consumer credit company to offer financing for the purchase of our products.
The purchase of the diamond and fine jewelry products we sell is a substantial expense for many of our customers. We currently rely on our relationship with a consumer finance company to provide financing to our customers. If this company is not able to meet our customer’s needs for credit or otherwise adequately serve our customers or if we are unable to maintain this or other similar arrangements, we may not be able to offer financing alternatives to our customers, which may reduce demand for our products and substantially harm our business and results of operations.
Unusual weather patterns could adversely affect the Company's performance.
Our operating results could be negatively impacted by unusual weather patterns. Frequent or unusually heavy snow, ice or rain storms, hurricanes, floods, tornadoes or extended periods of unseasonable temperatures could adversely affect our product availability, and ability to deliver products to our customers, which may harm our brand, lead to higher return rates, and negatively impact our performance. Additionally, significant power outages may result in a loss of sales. Given the seasonality of our business, unusual weather in the fourth quarter may have a disproportionately larger impact on operating results for the fourth quarter and the full year.
We face foreign exchange risk.
The results of operations of certain of our subsidiaries are exposed to foreign exchange rate fluctuations. Upon translation from foreign currency from international sales into U.S. dollars, operating results may differ materially from expectations, and we may record significant gains or losses.
Additionally, we allow customers to purchase our products in 23 currencies. This exposes us to foreign exchange rate fluctuations and we may record significant gains or losses as a result of such fluctuations. We price our diamonds based on costs denominated in U.S. dollars. Therefore, when the U.S. dollar strengthens, the retail prices of our products in international markets will become more expensive and sales may decline.
We rely on the services of our small, specialized workforce and key personnel, many of whom would be difficult to replace.
We rely upon the continued service and performance of key technical, fulfillment and senior management personnel. If we lose any of these personnel or if our personnel do not work efficiently and effectively together, our business could suffer. Competition for qualified personnel in our industry is intense. We believe that our future success will depend on our continued ability to attract, hire and retain key employees. We do not have “key person” life insurance policies covering our employees.
The success of our business may depend on our ability to successfully expand our product offerings.
A component of our strategy is to expand our product offerings beyond our current offerings. If we offer new products that are not accepted by consumers, our net sales may fall short of expectations, our brand and reputation could be adversely affected, and we may incur substantial expenses that are not offset by increased net sales. Expansion of our product lines may also increase our inventory levels and strain our management and operational resources.
We face the risk of theft of our products from inventory or during shipment.
We have experienced and may continue to experience theft of our products while they are being held in our fulfillment centers or during the course of shipment to our customers by third-party shipping carriers. We have taken steps to prevent such theft. However, if security measures fail, losses exceed our insurance coverage or we are not able to maintain insurance at a reasonable cost, we could incur significant losses from theft, which would substantially harm our business and results of operations.
Our net sales consist exclusively of diamonds and fine jewelry, and demand for these products could decline.
Our net sales and results of operations are highly dependent on the demand for diamonds and diamond jewelry, particularly engagement rings. Should prevailing consumer tastes for diamonds decline, customs with respect to engagement
14
shift away from the presentation of diamond jewelry, or if there is a reduced rate of marriages, demand for our products would decline and our business and results of operations would be substantially harmed.
The significant cost of diamonds results in part from their scarcity. From time to time, attempts have been made to develop and market synthetic stones and gems to compete in the market for diamonds and diamond jewelry. We expect such efforts to continue in the future. If any such efforts are successful in creating widespread demand for alternative diamond products, demand and price levels for our products would decline and our business and results of operations would be substantially harmed.
Increased attention on “conflict” diamonds, which are diamonds extracted from war-torn regions in Africa and sold by rebel forces to fund insurrection, may decrease demand for diamonds. Diamonds are, in some cases, also believed to be used to fund terrorist activities in some regions. We support the Kimberley Process, an international initiative intended to ensure diamonds are not illegally traded to fund conflict. As part of this initiative, we require our diamond suppliers to sign a statement acknowledging compliance with the Kimberley Process, and invoices received for diamonds purchased by us must include a certification from the vendor that the diamonds are conflict free. In addition, we prohibit the use of our business or services for money laundering or terrorist financing in accordance with the USA Patriot Act. Through these and other efforts, we believe that the suppliers from whom we purchase our diamonds exclude conflict diamonds from their inventories. However, we cannot independently determine whether any diamond we offer was extracted from these regions. Current efforts to increase consumer awareness of this issue and encourage legislative response could adversely affect consumer demand for diamonds.
Consumer confidence is dependent, in part, on the certification of our diamonds by independent laboratories. A decline in the quality of the certifications provided by these laboratories could adversely impact demand for our products. Additionally, a decline in consumer confidence in the credibility of independent diamond grading certifications could adversely impact demand for our diamond products.
Our fine jewelry offerings must reflect the tastes and preferences of a wide range of consumers whose preferences may change regularly. There can be no assurance that the styles we offer will continue to be popular with consumers in the future. If our merchandise offerings are not popular with consumers and we are not able to adjust our product offerings in a timely manner, our net sales may decline or fail to meet expected levels.
Failure to adequately protect or enforce our intellectual property rights could substantially harm our business and results of operations.
We rely on a combination of patent, trademark, trade secret and copyright law, and contractual restrictions to protect our intellectual property. These afford only limited protection. Despite our efforts to protect and enforce our proprietary rights, unauthorized parties have attempted, and may in the future attempt, to copy aspects of our website images, features, compilation and functionality or to obtain and use information that we consider as proprietary, such as the technology used to operate our website, our content and our trademarks. We have registered or have applications pending for, “Blue Nile,” the BN logo, the Blue Nile BN stylized logo, “Build Your Own Ring”, “Build Your Own Five-Stone Ring,” “Build Your Own Three Stone Ring,” “Build Your Own Diamond Jewelry,” “Build Your Own Diamond Pendant,” “Build Your Own Earrings,” and "Build Your Own Charm Bracelet" as trademarks in the United States and in certain other countries. Our competitors have, and other competitors may, adopt service names similar to ours, thereby impeding our ability to build brand identity and possibly leading to consumer confusion. In addition, there could be potential trade name or trademark infringement claims brought by owners of other registered trademarks or trademarks that incorporate variations of the term Blue Nile or our other trademarks. Any claims or consumer confusion related to our trademarks could damage our reputation and brand and substantially harm our business and results of operations. In addition, we are the holder of a patent entitled "Computerized Search Technique, such as an Internet-Based Gemstone Search Technique" (U.S. Patent No. 8,271,521) and have several other U.S. patent applications pending at this time.
We currently hold the bluenile.com, bluenile.co.uk and bluenile.ca Internet domain names and various other related domain names. Domain names generally are regulated by Internet regulatory bodies. The regulation of domain names in the United States and in foreign countries is subject to change. Regulatory bodies have and may continue to establish additional top-level domains, appoint additional domain name registrars or modify the requirements for holding domain names. We may not be able to, or it may not be cost effective to, acquire or maintain all domain names that utilize the name Blue Nile in all of the countries in which we currently conduct or intend to conduct business. If we lose the ability to use a domain name, we could incur significant additional expenses to market our products within that country, including the development of new branding. This could substantially harm our business and results of operations.
15
Litigation or similar proceedings has been in the past and may be necessary in the future to enforce our intellectual property rights, to protect our trade secrets and domain names and to determine the validity and scope of the proprietary rights of others. Any litigation or adverse priority proceeding could result in substantial costs and diversion of resources and could substantially harm our business and results of operations. We sell and intend to increasingly sell our products internationally, and the laws of many countries do not protect our proprietary rights to as great an extent as do the laws of the United States.
Assertions by third parties of infringement by us of their intellectual property rights could result in significant costs and substantially harm our business and results of operations.
Third parties have, and may in the future, assert that we have infringed their patents or other intellectual property rights. We cannot predict whether any such assertions or claims arising from such assertions will substantially harm our business and results of operations. If we are forced to defend against any infringement claims, whether they are with or without merit or are determined in our favor, we may face costly litigation, diversion of technical and management personnel, or product shipment delays. Furthermore, the outcome of a dispute may be that we would need to develop non-infringing technology or enter into royalty or licensing agreements. Royalty or licensing agreements, if required, may be unavailable on terms acceptable to us, or at all.
Purchasers of diamonds and fine jewelry may not choose to shop online, which would prevent us from growing our business.
The online market for diamonds and fine jewelry is significantly less developed than the online market for books, music, toys and other consumer products. If this market does not gain widespread acceptance, our business may suffer. Our success will depend, in part, on our ability to attract consumers who have historically purchased diamonds and fine jewelry through traditional retailers. Furthermore, we may have to incur significantly higher and more sustained advertising and promotional expenditures or price our products more competitively than we currently anticipate in order to attract additional online consumers to our website and convert them into purchasing customers. Specific factors that could prevent consumers from purchasing diamonds and fine jewelry from us include:
• | concerns about buying luxury products such as diamonds and fine jewelry without a physical storefront, face-to-face interaction with sales personnel and the ability to physically handle and examine products; |
• | delivery time associated with Internet orders; |
• | product offerings that do not reflect consumer tastes and preferences; |
• | pricing that does not meet consumer expectations; |
• | concerns about the security of online transactions and the privacy of personal information; |
• | delayed shipments or shipments of incorrect or damaged products; |
• | inconvenience associated with returning or exchanging Internet purchased items; and |
• | usability, functionality and features of our website. |
Our failure to address risks associated with payment methods, credit card fraud and other consumer fraud could damage our reputation and brand and may cause our business and results of operations to suffer.
Under current credit card practices, we are liable for fraudulent credit card transactions because we do not obtain a cardholder’s signature. We do not currently carry insurance against this risk. To date, we have experienced minimal losses from credit card fraud, but we face the risk of significant losses from this type of fraud as our net sales increase and as we expand internationally. Our failure to adequately control fraudulent credit card transactions could damage our reputation and brand and substantially harm our business and results of operations. Additionally, for certain payment transactions, including credit and debit cards, we pay interchange and other fees. These fees may increase over time, which would raise our operating costs and lower our operating margins.
Government regulation of the Internet and e-commerce is evolving and unfavorable changes could substantially harm our business and results of operations.
We are not currently subject to direct federal, state or local regulation other than regulations applicable to businesses generally or directly applicable to retailing and online commerce. However, it is possible that laws and regulations may be adopted with respect to the Internet, which may impede the growth of Internet-based businesses. These regulations and laws may cover issues such as taxation, advertising, intellectual property rights, freedom of expression, pricing, restrictions on imports and exports, customs, tariffs, information security, privacy, data protection, content, distribution, electronic contracts and other communications, the provision of online payment services, broadband residential Internet access, and the characteristics and quality of products and services. Further, the growth of online commerce has prompted calls for more
16
stringent consumer protection laws. Several states have proposed legislation to limit the uses of personal user information gathered online or require online companies to establish privacy policies. The adoption of additional privacy or consumer protection laws could create uncertainty in Internet usage and reduce the demand for our products and services.
We are not certain how our business may be affected by the application of existing laws governing issues such as property ownership, copyrights, personal property, encryption and other intellectual property issues, taxation, libel, obscenity, qualification to do business, and export or import matters. The vast majority of these laws were adopted prior to the advent of the Internet. As a result, they do not contemplate or address the unique issues of the Internet and related technologies. Changes in laws intended to address these issues could create uncertainty for those conducting online commerce. This uncertainty could reduce demand for our products and services or increase the cost of doing business as a result of litigation costs or increased fulfillment costs and may substantially harm our business and results of operations.
We may need to implement additional finance and accounting systems, procedures and controls as we grow our business and organization to satisfy international and other new reporting requirements.
As a public reporting company, we are required to comply with the Sarbanes-Oxley Act of 2002 and the related rules and regulations of the SEC, including expanded disclosures and accelerated reporting requirements and more complex accounting rules. Additionally, as we expand internationally, we will be subject to international accounting and reporting requirements that are new to our business. Compliance with these and other new requirements may increase our costs and require additional management time and resources. We may need to implement additional or enhance our current finance and accounting systems, procedures and controls to satisfy new accounting and reporting requirements. If our internal controls over financial reporting are determined to be ineffective, investors could lose confidence in the reliability of our internal controls over financial reporting, which could adversely affect our stock price.
We may undertake acquisitions to expand our business, which may pose risks to our business and dilute the ownership of our existing stockholders.
A key component of our business strategy includes strengthening our competitive position and refining the customer experience on our website through internal development. However, from time to time, we may selectively pursue acquisitions of businesses, technologies or services. Integrating any newly acquired businesses, technologies or services may be expensive and time-consuming. To finance any acquisitions, it may be necessary for us to raise additional funds through public or private financings. Additional funds may not be available on terms that are favorable to us, and, in the case of equity financings, would result in dilution to our stockholders. If we do complete any acquisitions, we may be unable to operate such acquired businesses profitably or otherwise implement our strategy successfully. If we are unable to integrate any newly-acquired entities or technologies effectively, our business and results of operations could suffer. The time and expense associated with finding suitable and compatible businesses, technologies or services could also disrupt our ongoing business and divert our management’s attention. Future acquisitions by us could also result in large and immediate write-offs or assumptions of debt and contingent liabilities, any of which could substantially harm our business and results of operations.
Regulations related to conflict minerals could adversely impact our business.
The Dodd-Frank Wall Street Reform and Consumer Protection Act contains provisions to improve transparency and accountability concerning the supply of certain minerals, known as conflict minerals, originating from the Democratic Republic of Congo (the "DRC") and adjoining countries. As a result, in August 2012 the SEC adopted annual disclosure and reporting requirements for those companies who use conflict minerals mined from the DRC and adjoining countries in their products. We performed due diligence efforts in fiscal 2014 and will continue these efforts to adhere with the disclosure requirements. There may be costs associated with complying with these disclosure requirements, including those that may be incurred in conducting due diligence procedures to determine the sources of conflict minerals used in our products and other potential changes to products, processes or sources of supply as a consequence of such verification activities. The implementation of these rules could adversely affect the sourcing, supply and pricing of materials used in our products. As there may be only a limited number of suppliers offering conflict free conflict minerals, we cannot be sure that we will be able to obtain necessary conflict free conflict minerals from such suppliers in sufficient quantities or at competitive prices. Also, we may face reputational challenges if we determine that certain of our products contain minerals not determined to be conflict free or if we are unable to sufficiently verify the origins for all conflict minerals used in our products through the procedures we may implement.
Item 1B. | Unresolved Staff Comments |
None.
17
Item 2. | Properties |
As of January 4, 2015, our operational facilities consisted of five separate locations: a corporate headquarters and a fulfillment center, both located in Seattle, Washington, a fulfillment center located in Dublin, Ireland, and two facilities in Shanghai, People's Republic of China, one for Blue Nile Diamond (Shanghai), Ltd. and the other for Blue Nile (Shanghai) Trading Co., Ltd. Certain of the leases include renewal provisions at our option. We believe that the facilities housing our fulfillment centers will be adequate to meet our current requirements for our operations and that suitable additional or substitute space will be available as needed.
Location | Approximate Square Feet | Purpose | Lease Termination Date | |
Corporate headquarters | 40,000 | Office space | August 2021 | |
U.S. fulfillment center | 27,000 | Warehouse space | October 2019 | |
Ireland fulfillment center | 10,000 | Office and warehouse space | December 2016 | |
Blue Nile Diamond (Shanghai), Ltd. | 900 | Office space | December 2016 | |
Blue Nile (Shanghai) Trading Co., Ltd | 2,500 | Office space | March 2016 | |
Item 3. | Legal Proceedings |
See discussion of legal proceedings in Note 4 to the consolidated financial statements included in Item 8 of this Annual Report on Form 10-K.
Item 4. | Mine Safety Disclosures |
Not applicable.
PART II
Item 5. | Market for Registrant’s Common Equity, Related Stockholder Matters and Issuer Purchases of Equity Securities |
Market Information and Dividend Policy
Our common stock is quoted on The NASDAQ Stock Market LLC under the symbol “NILE.” On February 20, 2015, we had approximately 35 stockholders of record.
The following table sets forth the high and low sales prices of our common stock for fiscal years 2014 and 2013. The quotations are as reported in published financial sources.
High | Low | ||||||
Fiscal year 2014: | |||||||
First Quarter | $ | 49.14 | $ | 32.60 | |||
Second Quarter | $ | 36.16 | $ | 27.45 | |||
Third Quarter | $ | 30.39 | $ | 23.10 | |||
Fourth Quarter | $ | 37.50 | $ | 27.57 | |||
Fiscal year 2013: | |||||||
First Quarter | $ | 40.54 | $ | 28.90 | |||
Second Quarter | $ | 40.44 | $ | 30.62 | |||
Third Quarter | $ | 42.34 | $ | 35.90 | |||
Fourth Quarter | $ | 48.56 | $ | 36.56 | |||
We have not paid cash dividends on our common stock since inception, and it is not anticipated that cash dividends will be paid on shares of our common stock in the foreseeable future. Future payment of dividends, if any, will be at the discretion of our board of directors.
18
Performance Measurement Comparison (1)
The following graph compares the total cumulative stockholder return on the Company’s common stock with the total cumulative return of the NASDAQ Market Index and the RDG Internet Composite Index for the five-year period ending on January 4, 2015, our 2014 fiscal year end. Historical stock price performance should not be relied upon as an indication of future stock price performance.
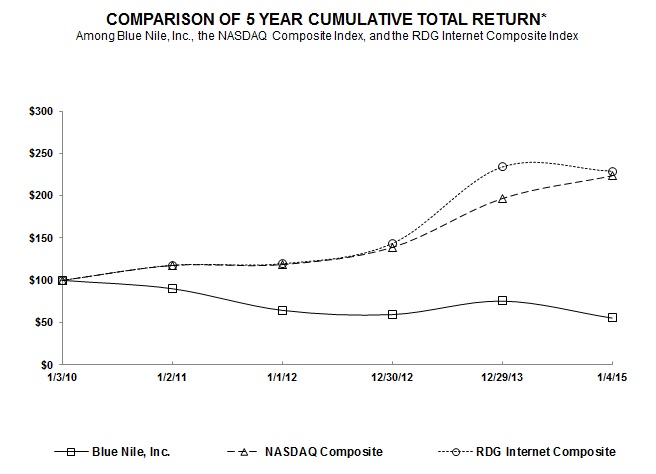
(1) This Section is not “soliciting material,” is not deemed “filed” with the SEC and is not to be incorporated by reference in any of our filings under the Securities Act of 1933, as amended, or the Securities Exchange Act of 1934, as amended, whether made before or after the date hereof and irrespective of any general incorporation language in any such filing.
(2) Assumes $100 was invested on January 3, 2010 at the closing price on this day, in Blue Nile’s common stock and on December 31, 2009 for each index, and all dividends have been reinvested. No cash dividends have been declared on Blue Nile’s common stock. Stockholder returns over the indicated period should not be considered indicative of future stockholder returns.
Item 6. | Selected Consolidated Financial Data |
Blue Nile's fiscal year ends on the Sunday nearest to December 31. The fiscal year ended on January 4, 2015 which included 53 weeks with the 53rd week falling in our fourth quarter. Fiscal years ended on December 29, 2013, December 30, 2012, January 1, 2012 and January 2, 2011 each included 52 weeks.
The table below shows selected consolidated financial data for each of our fiscal years ended January 4, 2015, December 29, 2013, December 30, 2012, January 1, 2012, and January 2, 2011. The consolidated statements of operations data and the additional operating data for each of the fiscal years ended January 4, 2015, December 29, 2013 and
19
December 30, 2012 and the consolidated balance sheets as of January 4, 2015 and December 29, 2013 are derived from our audited consolidated financial statements included elsewhere in this Annual Report on Form 10-K. The consolidated statements of operations for the fiscal years ended January 1, 2012 and January 2, 2011 and the consolidated balance sheet data as of December 30, 2012, January 1, 2012 and January 2, 2011, are derived from audited consolidated financial statements not included in this Annual Report on Form 10-K.
You should read the following selected consolidated financial and operating information together with “Management’s Discussion and Analysis of Financial Condition and Results of Operations” and our audited consolidated financial statements and the related notes included elsewhere in this Annual Report on Form 10-K. The historical results presented below are not necessarily indicative of future results. See Note 10 of the related notes to our consolidated financial statements included in Item 8 of this Annual Report on Form 10-K for the calculation of weighted average shares outstanding used in computing basic and diluted net income per share.
20
BLUE NILE, INC.
SELECTED CONSOLIDATED FINANCIAL DATA
Year Ended January 4, 2015 | Year Ended December 29, 2013 | Year Ended December 30, 2012 | Year Ended January 1, 2012 | Year Ended January 2, 2011 | |||||||||||||||
(53 Weeks) | (52 Weeks) | (52 Weeks) | (52 Weeks) | (52 Weeks) | |||||||||||||||
(In thousands, except per share data) | |||||||||||||||||||
Consolidated Statements of Operations Data: | |||||||||||||||||||
Net sales | $ | 473,516 | $ | 450,008 | $ | 400,035 | $ | 348,013 | $ | 332,889 | |||||||||
Gross profit | 86,642 | 83,651 | 75,058 | 72,132 | 71,940 | ||||||||||||||
Selling, general and administrative expenses | 72,430 | 69,343 | 62,771 | 55,213 | 50,654 | ||||||||||||||
Operating income | 14,212 | 14,308 | 12,287 | 16,919 | 21,286 | ||||||||||||||
Income before income taxes | 14,619 | 14,565 | 12,966 | 17,245 | 21,538 | ||||||||||||||
Income tax expense | 4,888 | 3,690 | 4,574 | 5,895 | 7,396 | ||||||||||||||
Net income | $ | 9,731 | $ | 10,875 | $ | 8,392 | $ | 11,350 | $ | 14,142 | |||||||||
Basic net income per share | $ | 0.80 | $ | 0.87 | $ | 0.64 | $ | 0.80 | $ | 0.98 | |||||||||
Diluted net income per share | $ | 0.80 | $ | 0.85 | $ | 0.63 | $ | 0.77 | $ | 0.94 | |||||||||
Shares used in computing basic net income per share | 12,144 | 12,540 | 13,204 | 14,182 | 14,446 | ||||||||||||||
Shares used in computing diluted net income per share | 12,209 | 12,760 | 13,427 | 14,675 | 15,080 | ||||||||||||||
Additional Operating Data: | |||||||||||||||||||
Net cash provided by operating activities | $ | 17,208 | $ | 23,438 | $ | 34,444 | $ | 15,454 | $ | 41,608 | |||||||||
Gross margin | 18.3 | % | 18.6 | % | 18.8 | % | 20.7 | % | 21.6 | % | |||||||||
Selling, general and administrative expenses as a percentage of net sales | 15.3 | % | 15.4 | % | 15.7 | % | 15.8 | % | 15.2 | % | |||||||||
As of January 4, 2015 | As of December 29, 2013 | As of December 30, 2012 | As of January 1, 2012 | As of January 2, 2011 | |||||||||||||||
(In thousands) | |||||||||||||||||||
Consolidated Balance Sheet Data: | |||||||||||||||||||
Cash and cash equivalents | $ | 91,186 | $ | 115,942 | $ | 87,017 | $ | 89,391 | $ | 113,261 | |||||||||
Accounts receivable | 3,708 | 3,526 | 3,485 | 4,867 | 1,771 | ||||||||||||||
Inventories | 41,668 | 34,530 | 33,270 | 29,267 | 20,166 | ||||||||||||||
Accounts payable | 128,675 | 122,322 | 116,209 | 95,590 | 90,296 | ||||||||||||||
Working capital(1) | (1,782 | ) | 23,198 | (3,027 | ) | 19,967 | 34,918 | ||||||||||||
Total assets | 157,334 | 176,925 | 145,901 | 143,025 | 151,811 | ||||||||||||||
Total long-term obligations | 2,640 | 2,917 | 2,838 | 2,745 | 830 | ||||||||||||||
Total stockholders’ equity | 13,703 | 40,605 | 14,109 | 35,024 | 49,061 | ||||||||||||||
____________________
(1) | Working capital consists of total current assets, including cash and cash equivalents, less total current liabilities. |
21
Non-GAAP Financial Measures
To supplement our consolidated financial statements presented in accordance with generally accepted accounting principles (“GAAP”), we use non-GAAP free cash flow as a measure of financial performance. We define non-GAAP free cash flow as net cash provided by (used in) operating activities less cash outflows for purchases of fixed assets, including internal use software and website development. We report sales information in accordance with GAAP. Internally, management monitors its sales performance on a non-GAAP basis that eliminates the positive or negative effects that result from translating international sales into U.S. dollars (the “constant exchange rate basis”). Our management does not itself, nor does it suggest that investors should, consider such non-GAAP financial measures in isolation from, or as a substitute for, financial information prepared in accordance with GAAP. Investors should also note that the non-GAAP financial measures used by us may not be the same non-GAAP financial measures, and may not be calculated in the same manner, as that of other companies. Whenever we use such non-GAAP financial measures, we provide a reconciliation of non-GAAP financial measures to the most closely applicable GAAP financial measures. Investors are encouraged to review the related GAAP financial measures and the reconciliation of these non-GAAP financial measures to their most directly comparable GAAP financial measures.
A reconciliation of differences of non-GAAP free cash flow from the comparable GAAP measure of net cash provided by operating activities is as follows (in thousands):
Year Ended January 4, 2015 | Year Ended December 29, 2013 | Year Ended December 30, 2012 | |||||||||
(53 Weeks) | (52 Weeks) | (52 Weeks) | |||||||||
Net cash provided by operating activities | $ | 17,208 | $ | 23,438 | $ | 34,444 | |||||
Purchases of fixed assets, including internal-use software and website development | (3,771 | ) | (5,528 | ) | (2,525 | ) | |||||
Non-GAAP free cash flow | $ | 13,437 | $ | 17,910 | $ | 31,919 | |||||
The following table reconciles year-over-year international sales percentage increases (decreases) from the GAAP sales measures to the non-GAAP constant exchange rate basis:
Year ended January 4, 2015 (53 Weeks) | Year over year growth | Effect of foreign exchange movements | Year over year growth on constant exchange rate basis | |||||
International net sales | 10.8 | % | (3.2 | )% | 14.0 | % | ||
Year ended December 29, 2013 (52 Weeks) | Year over year growth | Effect of foreign exchange movements | Year over year growth on constant exchange rate basis | |||||
International net sales | 17.3 | % | (2.9 | )% | 20.2 | % | ||
Year ended December 30, 2012 (52 Weeks) | Year over year growth | Effect of foreign exchange movements | Year over year growth on constant exchange rate basis | |||||
International net sales | 11.7 | % | (0.9 | )% | 12.6 | % | ||
22
Item 7. | Management’s Discussion and Analysis of Financial Condition and Results of Operations |
The following discussion should be read in conjunction with the consolidated financial statements and related notes which appear elsewhere in this Annual Report on Form 10-K. This discussion contains forward-looking statements that involve risks and uncertainties. Our actual results could differ materially from those anticipated in these forward-looking statements as a result of various factors, including those discussed below and elsewhere in this Annual Report on Form 10-K, particularly under the heading “Item 1A. Risk Factors.”
Management Overview
Blue Nile is a leading online retailer of high-quality diamonds and fine jewelry. We offer our products for sale through the Blue Nile website in over 40 countries and territories throughout the world. We believe that our extensive and unique product selection, connection with our customers through our marketing and customer service efforts, and the value we provide to our customers through our competitive pricing will result in increasing our sales and market share both domestically and internationally. Our primary focus is on growing our business by providing unparalleled quality, selection and value to consumers and delivering exceptional customer service. Our online business model allows us to avoid many of the costs that are typically incurred by physical retail stores. As a result, we are able to realize lower gross profit margins while remaining profitable and providing value to our customers through lower retail prices.
Our objective is to maximize our revenue and profitability and increase market share both domestically and internationally by offering exceptional value to our customers through a high-quality customer experience that leverages supply chain efficiencies and an efficient cost structure. We have established and will continue to refine our scalable, capital-efficient business model that enables growth with lower working capital requirements than traditional store-based jewelry retailers. We focus on optimizing the cash flow dynamics of our business by managing inventory balances along with vendor payment terms. Over the longer term, our goal is to increase revenues, profit, and cash flow by leveraging our relatively low fixed cost technology and operations infrastructure as we achieve sales increases. Our long-term financial focus is primarily on sustainable growth in free cash flow, a non-GAAP financial measure. Non-GAAP free cash flow is primarily driven by increasing our operating income and efficiently managing working capital and capital expenditures. Increases in operating income primarily result from increases in sales through our website, improvements in operating margins and the efficient management of operating costs, offset by the investments that we make in longer-term strategic initiatives.
Differentiating Factors and Value Proposition
Our innovative business model is designed to deliver exceptional value and service to customers. A significant portion of our revenues is derived through sales of engagement rings or jewelry products that feature a diamond. We have developed relationships with a large number of diamond suppliers with whom we have exclusive agreements as an online retailer. This allows us to offer our customers access to a large selection of high-quality diamonds through our website that we typically do not hold in inventory. In most cases, we purchase diamonds from our suppliers only as our customers place orders with us. As a result, we do not incur the significant costs that would be incurred by physical retail stores to carry high levels of diamond inventory. Our efficient operating model also provides for negative working capital benefits, since payments are received from customers within a few days of shipment of their order, but our vendor payment terms are typically in the 30-120 day range.
In addition to the working capital benefits of our model, the significant volume of diamonds that we purchase enhances our ability to buy from our suppliers at the best and lowest prices. We are able to pass these lower costs on to consumers, further increasing our value proposition.
Focus on Growth
In 2014, we focused on accelerating the sales growth rate of our business through enhancements to our user experience, development of our engagement and non-engagement product lines, and expansion of our international operations. We also focused on increasing the value proposition that we deliver to our consumers by utilizing our growing acumen in data science, aggressively pricing our products, and deepening our supply chain.
We believe that value is one of the most important drivers of engagement sales, and the current costs of diamonds is a significant factor to our growth rate. Generally, we purchase our diamonds on a real time basis from our suppliers when a customer places an order for a specific diamond. When the cost of diamonds is relatively steady or declines, we believe that our business benefits because we are able to immediately pass those lower costs on to consumers. When diamond prices increase sharply, we believe it is more difficult to grow because it is disruptive to the customers' shopping experience, and it shrinks our relative pricing advantage. Regardless of diamond pricing dynamics, we will remain focused on utilizing our
23
aggressive retail pricing, developing and expanding our product lines as well as deepening our supply chain, and continuing to provide our customers with a compelling website experience across all devices.
The total addressable market for the sale of non-engagement products is much greater than that for engagement, and we believe our brand is well-positioned to gain market share over time. To further drive growth in our non-engagement category, we will continue to expand a refined assortment of wedding bands, diamond jewelry and fashion jewelry, offer branded designs, and utilize disruptive and innovative technology such as the responsive website to provide our non-engagement consumers with a compelling shopping experience.
As part of our plan to accelerate growth in our international business, we extended our capabilities into markets with the highest potential for growth. We believe that the Asia-Pacific market, specifically Greater China, represents a significant long-term opportunity for us. We have and will continue to increase our investments in personnel, infrastructure, fulfillment capabilities, product selection, marketing and enhancing the user experience to drive growth and gain market share.
Investments during 2014 have increased our selling, general and administrative expenses compared to last year. We invested in the development of technology to enhance the user experience and in infrastructure to expand our ability to serve international customers. We believe that these investments will lead to increased growth in all categories of our business and provide higher profitability over the long-term.
Critical Accounting Policies
The preparation of our consolidated financial statements requires that we make certain estimates and judgments that affect amounts reported and disclosed in our consolidated financial statements and related notes. We base our estimates on historical experience and on other assumptions that we believe to be reasonable under the circumstances. Actual results may differ from these estimates. The following are the critical accounting policies that we believe require significant estimation and management judgment.
Revenue Recognition
We recognize revenue and the related gross profit on the date on which ownership passes from Blue Nile to our customers. For customers in the U.S., Canada, E.U., China, and United Arab Emirates (U.A.E), ownership passes at the time the package is received by the customer. For customers in other locations, ownership passes at the time the product is shipped as this is when risk of loss transfers. As we require customer payment prior to order shipment, any payments received prior to the transfer of ownership are not recorded as revenue. For U.S., Canadian, E.U., China and U.A.E. shipments, we utilize our freight vendors’ tracking information to determine when delivery has occurred, which is typically within one to three days after shipment. We also reduce revenue by a provision for returns, which is estimated based on our historical product return rates and current economic conditions. Our contracts with our suppliers generally allow us to return diamonds purchased and returned by our customers.
Stock-based Compensation
We account for stock-based compensation at fair value. We use the Black-Scholes-Merton option valuation model in determining the fair value of our stock options, which requires the input of highly subjective assumptions. These assumptions include estimating the length of time employees will retain their vested stock options before exercising them (“expected term”) and the estimated volatility of our common stock price over the expected term (“expected volatility”). Changes in these assumptions can materially affect the estimate of the fair value of employee stock options and consequently, the related amount of stock-based compensation expense recognized in the consolidated statements of operations.
We performed the following sensitivity analysis using changes in the expected term and expected volatility that could be reasonably possible in the near term. If we assumed a six-month increase or decrease in the expected term or a 500 basis point increase or decrease in expected volatility, the value of a newly granted hypothetical stock option would increase (decrease) by the following percentages:
Increase | Decrease | ||||
Expected term(1) | 5.1 | % | (5.4 | )% | |
Expected volatility(1) | 8.9 | % | (9.1 | )% | |
____________________
24
(1) | Sensitivity to change in assumptions was determined using the Black-Scholes-Merton valuation model compared to the following original assumptions: stock price and exercise price equal to the closing market price of Blue Nile, Inc. common stock on January 2, 2015, expected term of 4.5 years, expected volatility of 46.9%, expected dividend yield of 0% and a risk-free interest rate of 1.5%. |
In addition, we estimate the expected forfeiture rate and recognize stock-based compensation expense only for grants that are expected to vest. We estimate the forfeiture rate based on historical experience. To the extent our actual forfeiture rate is different from our estimate, stock-based compensation expense is adjusted accordingly.
Results of Operations
Blue Nile's fiscal year ends on the Sunday nearest to December 31. The fiscal year ended on January 4, 2015 which included 53 weeks with the 53rd week falling in our fourth quarter. Fiscal years ended on December 29, 2013, December 30, 2012, January 1, 2012 and January 2, 2011 each included 52 weeks.
The following table presents our historical operating results for the periods indicated as a percentage of net sales:
Year Ended January 4, 2015 | Year Ended December 29, 2013 | Year Ended December 30, 2012 | ||||||
(53 Weeks) | (52 Weeks) | (52 Weeks) | ||||||
Net sales | 100.0 | % | 100.0 | % | 100.0 | % | ||
Gross profit | 18.3 | % | 18.6 | % | 18.8 | % | ||
Selling, general and administrative expenses | 15.3 | % | 15.4 | % | 15.7 | % | ||
Operating income | 3.0 | % | 3.2 | % | 3.1 | % | ||
Other income, net | 0.1 | % | — | % | 0.1 | % | ||
Income before income taxes | 3.1 | % | 3.2 | % | 3.2 | % | ||
Income tax expense | 1.0 | % | 0.8 | % | 1.1 | % | ||
Net income | 2.1 | % | 2.4 | % | 2.1 | % | ||
The following describes certain items set forth in our consolidated statements of operations:
Net Sales. Substantially all of our net sales consist of diamonds and fine jewelry sold via the Internet, net of estimated returns. Historically, net sales have been higher in the fourth quarter as a result of higher consumer spending during the holiday season. We expect this seasonal trend to continue in the foreseeable future.
Gross Profit. Our gross profit consists of net sales less the cost of sales. Our cost of sales includes the cost of merchandise sold to customers, inbound and outbound shipping costs, depreciation on assembly-related assets, insurance on shipments and the costs incurred to set diamonds into ring, earring and pendant settings, including labor and related facilities costs. Our gross profit has fluctuated historically and we expect it to continue to fluctuate based primarily on our product acquisition costs, product mix and pricing decisions.
Selling, General and Administrative Expenses. Our selling, general and administrative expenses consist primarily of payroll and related benefit costs for our employees, stock-based compensation, marketing costs and credit card fees. These expenses also include certain facility-related costs, and fulfillment, customer service, technology and depreciation expenses, as well as professional fees and other general corporate expenses.
Fiscal Year. Our fiscal year generally ends on the Sunday closest to December 31. Each fiscal year consists of four 13-week quarters, with one extra week added in the fourth quarter every five to six years. Our fiscal year 2014 included one extra week in the fourth quarter, or 53 weeks for the fiscal year, as a result of our 4-4-5 retail reporting calendar.
The following table presents our historical operating results, including a comparison of the financial results for the periods indicated (dollars in thousands, except per share data):
25
Year Ended January 4, 2015 | Year Ended December 29, 2013 | Year Ended December 30, 2012 | Comparison of Year Ended January 4, 2015 to Year Ended December 29, 2013 | Comparison of Year Ended December 29, 2013 to Year Ended December 30, 2012 | |||||||||||||||||||||
(53 Weeks) | (52 Weeks) | (52 Weeks) | $ Change | % Change | $ Change | % Change | |||||||||||||||||||
Net sales | $ | 473,516 | $ | 450,008 | $ | 400,035 | $ | 23,508 | 5.2 | % | $ | 49,973 | 12.5 | % | |||||||||||
Cost of sales | 386,874 | 366,357 | 324,977 | 20,517 | 5.6 | % | 41,380 | 12.7 | % | ||||||||||||||||
Gross profit | 86,642 | 83,651 | 75,058 | 2,991 | 3.6 | % | 8,593 | 11.4 | % | ||||||||||||||||
Selling, general and administrative expenses | 72,430 | 69,343 | 62,771 | 3,087 | 4.5 | % | 6,572 | 10.5 | % | ||||||||||||||||
Operating income | 14,212 | 14,308 | 12,287 | (96 | ) | (0.7 | )% | 2,021 | 16.4 | % | |||||||||||||||
Other income, net: | |||||||||||||||||||||||||
Interest income, net | 117 | 107 | 133 | 10 | 9.3 | % | (26 | ) | (19.5 | )% | |||||||||||||||
Other income, net | 290 | 150 | 546 | 140 | 93.3 | % | (396 | ) | (72.5 | )% | |||||||||||||||
Total other income, net | 407 | 257 | 679 | 150 | 58.4 | % | (422 | ) | (62.2 | )% | |||||||||||||||
Income before income taxes | 14,619 | 14,565 | 12,966 | 54 | 0.4 | % | 1,599 | 12.3 | % | ||||||||||||||||
Income tax expense | 4,888 | 3,690 | 4,574 | 1,198 | 32.5 | % | (884 | ) | (19.3 | )% | |||||||||||||||
Net income | $ | 9,731 | $ | 10,875 | $ | 8,392 | $ | (1,144 | ) | (10.5 | )% | $ | 2,483 | 29.6 | % | ||||||||||
Basic net income per share | $ | 0.80 | $ | 0.87 | $ | 0.64 | $ | (0.07 | ) | $ | 0.23 | ||||||||||||||
Diluted net income per share | $ | 0.80 | $ | 0.85 | $ | 0.63 | $ | (0.05 | ) | $ | 0.22 | ||||||||||||||
Comparison of Fiscal Year Ended January 4, 2015 to Fiscal Year Ended December 29, 2013
Net Sales
Net sales increased 5.2% in the fiscal year ended January 4, 2015, compared with the fiscal year ended December 29, 2013, as a result of the execution of growth initiatives across our three main categories. The total net sales increase was due to an increase in average order value, partially offset by a decrease in orders. The increase in average order value was driven by an increase in engagement orders across all price points and non-engagement orders at higher price points while the decrease in orders is due to a decrease in non-engagement orders at the lower price points. Net sales for the additional week was estimated at $5.9 million, which contributed 1.3% of growth for the fiscal year ended January 4, 2015.
Net sales in the U.S. increased by 4.1% to $392.4 million for the fiscal year ended January 4, 2015 compared with $376.8 million for the fiscal year ended December 29, 2013.
U.S. engagement net sales increased 4.1% to $266.4 million for the fiscal year ended January 4, 2015 from $255.8 million for the fiscal year ended December 29, 2013. U.S. engagement net sales for the additional week was estimated at $2.9 million, which contributed 1.1% of growth for this category for the fiscal year ended January 4, 2015.
U.S. non-engagement net sales grew 4.2% to $126.0 million in the fiscal year ended January 4, 2015 from $121.0 million in the fiscal year ended December 29, 2013. U.S. non-engagement net sales for the additional week was estimated at $1.8 million, which contributed 1.5% of growth for this category for the fiscal year ended January 4, 2015.
International net sales increased 10.8% to $81.1 million for the year ended January 4, 2015, compared with $73.2 million for the year ended December 29, 2013. Internally, we monitor our international sales performance on a non-GAAP basis which eliminates the positive or negative effects that result from translating international sales into U.S. dollars (“constant exchange rate basis”). International net sales growth was negatively impacted by 3.2% due to changes in foreign exchange rates in 2014 compared with the rates in effect during 2013. Excluding the impact of changes in foreign exchange rates, international sales increased 14.0% in the year ended January 4, 2015. International net sales for the additional week was estimated at $1.2 million, which contributed 1.7% of growth for this category for the fiscal year ended January 4, 2015.
26
Gross Profit
Gross profit increased $3.0 million or 3.6% in the fiscal year ended January 4, 2015 compared with the fiscal year ended December 29, 2013. The increase in gross profit is due to the increase in net sales. Gross margin decreased to 18.3% in the year ended January 4, 2015 compared with 18.6% in the year ended December 29, 2013. The decrease in gross margin resulted primarily from mix shift to products at higher price points which carry lower mark-up as part of a strategy initiated in early 2014 to stimulate sales growth.
Costs for our products are impacted by prices for diamonds and precious metals, including gold, platinum and silver, which rise and fall based upon global supply and demand dynamics. In making retail pricing decisions, we take into account fluctuations in the pricing of diamonds and precious metals, which in turn, affect the gross margin that we realize from such products. While prices for diamonds and precious metals will continue to fluctuate based upon supply and demand, we cannot adequately predict the amount and timing of any such fluctuations. We expect that gross profit and gross margin will fluctuate in the future based on changes in product acquisition costs, particularly diamond prices, product mix and pricing decisions.
Selling, General and Administrative Expenses
Selling, general and administrative expenses increased 4.5% to $72.4 million in the fiscal year ended January 4, 2015 compared with $69.3 million in the fiscal year ended December 29, 2013 due to several factors. Compensation and benefits expenses increased $1.0 million due to increased headcount to support key business initiatives and higher compensation rates of our employees. Marketing and advertising costs increased approximately $0.9 million, primarily due to increased spending on online marketing vehicles to drive traffic to our website both domestically and internationally. Credit card interchange and payment processing fees increased approximately $0.5 million in the fiscal year ended January 4, 2015 primarily due to higher sales. Depreciation expense added approximately $0.5 million to expenses. These expense increases were partially offset by a decrease of approximately $0.7 million in stock-based compensation expense primarily due to a lower number of options outstanding at lower option fair values for the fiscal year ended January 4, 2015. As a percentage of net sales, selling, general and administrative expenses were 15.3% for the year ended January 4, 2015 compared to 15.4% for the year ended December 29, 2013 as sales accelerated faster than selling, general and administrative expenses.
Other Income, Net
The increase in other income, net in the fiscal year ended January 4, 2015 as compared with the fiscal year ended December 29, 2013 was primarily due to proceeds of approximately $0.6 million from a favorable settlement resulting from to a class action lawsuit related to interchange fees.
Income Taxes
The effective income tax rate for the fiscal year ended January 4, 2015 was 33.4% as compared with 25.3% for the fiscal year ended December 29, 2013. The increase is primarily due to the domestic production activities income tax benefit recorded in the third quarter of 2013 claimed for tax years prior to 2013.
Comparison of Fiscal Year Ended December 29, 2013 to Fiscal Year Ended December 30, 2012
Net Sales
Net sales increased 12.5% in the fiscal year ended December 29, 2013, compared with the fiscal year ended December 30, 2012, as a result of the execution of growth initiatives across our three main categories. The total net sales increase was due to an increase in average order value, partially offset by a decrease in orders. The increase in average order value was driven by an increase in engagement orders across all price points and non-engagement orders at higher price points while the decrease in orders is due to a decrease in non-engagement orders at the lower price points.
Net sales in the U.S. increased by 11.6% to $376.8 million for the fiscal year ended December 29, 2013 compared with $337.6 million for the fiscal year ended December 30, 2012. U.S. engagement net sales increased 12.9% to $255.8 million for the fiscal year ended December 29, 2013 from $226.6 million for the fiscal year ended December 30, 2012. U.S. non-engagement net sales grew 8.9% to $121.0 million in the fiscal year ended December 29, 2013 from $111.0 million in the fiscal year ended December 30, 2012. International net sales increased 17.3% to $73.2 million for the year ended December 29, 2013, compared with $62.4 million for the year ended December 30, 2012. Internally, we monitor our international sales performance on a non-GAAP basis which eliminates the positive or negative effects that result from translating international sales into U.S.
27
dollars (“constant exchange rate basis”). International net sales growth was negatively impacted by 2.9% due to changes in foreign exchange rates in 2013 compared with the rates in effect during 2012. Excluding the impact of changes in foreign exchange rates, international sales increased 20.2% in the year ended December 29, 2013.
Gross Profit
Gross profit increased $8.6 million or 11.4% in the fiscal year ended December 29, 2013 compared with the fiscal year ended December 30, 2012. The increase in gross profit is due to the increase in net sales. Gross margin decreased to 18.6% in the year ended December 29, 2013 compared with 18.8% in the year ended December 30, 2012. The decrease in gross margin is attributable to changes in our product mix. Our engagement products generally provide a lower gross margin than our non-engagement products. In the fiscal year ended December 29, 2013, sales of our engagement products grew faster than our non-engagement products and equaled 70.0% of our total revenue versus 69.1% in the fiscal year ended December 30, 2012.
Costs for our products are impacted by prices for diamonds and precious metals, including gold, platinum and silver, which rise and fall based upon global supply and demand dynamics. In making retail pricing decisions, we take into account fluctuations in the pricing of diamonds and precious metals, which in turn, affect the gross margin that we realize from such products. While prices for diamonds and precious metals will continue to fluctuate based upon supply and demand, we cannot adequately predict the amount and timing of any such fluctuations. We expect that gross profit and gross margin will fluctuate in the future based on changes in product acquisition costs, particularly diamond prices, product mix and pricing decisions.
Selling, General and Administrative Expenses
Selling, general and administrative expenses increased 10.5% to $69.3 million in the fiscal year ended December 29, 2013 compared with $62.8 million in the fiscal year ended December 30, 2012 due to several factors. Marketing and advertising costs increased approximately $3.2 million, primarily due to increased spending on online marketing vehicles to drive traffic to our website both domestically and internationally. Compensation and benefits expenses increased $2.0 million due to increased headcount to support order growth and key business initiatives. Payment processing fees increased approximately $1.2 million in the fiscal year ended December 29, 2013 primarily due to higher sales volumes. As a percentage of net sales, selling, general and administrative expenses were 15.4% for the year ended December 29, 2013 compared to 15.7% for the year ended December 30, 2012. The decrease in selling, general and administrative expenses as a percentage of net sales in the year ended December 29, 2013 resulted primarily from our ability to leverage our fixed cost base. We expect selling, general and administrative expenses to increase in absolute dollars in future periods as a result of our marketing efforts to drive increases in net sales, growth in our fulfillment and customer service operations to support higher sales volumes and increase in credit card processing fees and other expenses to support growth initiatives.
Other Income, Net
The decrease in other income, net in the fiscal year ended December 29, 2013 as compared with the fiscal year ended December 30, 2012 was primarily due to proceeds of approximately $0.4 million from a favorable settlement related to the De Beers anti-trust litigation in 2012.
Income Taxes
The effective income tax rate for the fiscal year ended December 29, 2013 was 25.3% as compared with 35.3% for the fiscal year ended December 30, 2012. During the fiscal year ended December 29, 2013, there was a change in accounting estimate relating to our income tax expense. We recognized an income tax benefit resulting primarily from the domestic production activities deduction related to the current and prior tax years recorded in the fiscal year ended December 29, 2013. The out-of-period impact of this deduction decreased our income tax expense and increased our net income by $1.1 million and $0.08 per diluted share for the year ended December 29, 2013.
Liquidity and Capital Resources
We are primarily funded by our cash flows from operations. The significant components of our working capital are inventory and liquid assets such as cash, cash equivalents and trade accounts receivable, reduced by accounts payable and accrued expenses. Our business model provides certain beneficial working capital characteristics. While we collect cash from sales to customers within several business days of the related sale, we typically have extended payment terms with our suppliers.
28
Our liquidity is primarily dependent upon our net cash from operating activities. Our net cash from operating activities is sensitive to many factors, including changes in working capital and the timing and magnitude of expenditures. Working capital at any specific point in time is dependent upon many variables, including our operating results, seasonality, inventory management and the level of product assortment, the timing of cash receipts and payments, and vendor payment terms.
At January 4, 2015, we had a working capital deficiency of $1.8 million, including cash and cash equivalents of $91.2 million and inventory of $41.7 million, offset by accounts payable and accrued liabilities totaling $140.7 million. Current levels of cash and cash equivalents reflect greater repurchases and fewer proceeds from stock option exercises during fiscal year 2014. On February 21, 2014, the Company renewed its Credit Agreement (the "Credit Agreement") which provides for a $40.0 million unsecured, revolving credit facility with an option to increase the credit limit by $10.0 million. See discussion of the Revolving Loan in Note 13 to the consolidated financial statements included in Item 8 of this Annual Report on Form 10-K. We currently do not have any outstanding debt under the Credit Agreement. However, projections of future cash needs and cash flows are subject to many factors and to uncertainty. We continually assess our capital structure and opportunities to obtain credit facilities, sell equity or debt securities, or undertake other transactions for strategic reasons or to further strengthen our financial position. However, there can be no assurance that additional equity, debt or other financing transactions will be available in amounts or on terms acceptable to us, if at all.
Net cash provided by operating activities was $17.2 million in the fiscal year ended January 4, 2015 compared to net cash provided by operating activities of $23.4 million in the fiscal year ended December 29, 2013. The decrease in cash provided by operating activities in the fiscal year ended January 4, 2015 was primarily attributable to a decrease in working capital due to increased inventory specifically in-process and in-transit inventory. We experience greater cash flow from operations in our fourth quarter compared to other quarters due to the significant increase in revenue from our holiday sales. In the first quarter we typically have a significant pay down of our accounts payable balance accumulated during the fourth quarter holiday season.
Net cash provided by operating activities was $23.4 million in the fiscal year ended December 29, 2013 compared to net cash provided by operating activities of $34.4 million in the fiscal year ended December 30, 2012. The decrease in cash provided by operating activities in the fiscal year ended December 29, 2013 was primarily attributable to higher net payment of accounts payable and accrued liabilities in fiscal 2013. The net increase in accounts payable totaled $6.4 million for the fiscal year ended December 29, 2013 compared to $20.4 million for the fiscal year ended December 30, 2012.
Net cash of $3.8 million was used in investing activities in the fiscal year ended January 4, 2015 which was primarily for purchases of property and equipment which includes capitalized costs to develop our website and internal-use software to support our operations. Net cash of $5.8 million was used in investing activities in the fiscal year ended December 29, 2013. Net cash of $5.5 million was used for purchases of property and equipment and capitalized costs to develop our website and internal-use software to support our operations. Also included in the purchase of property and equipment were costs associated with our corporate expansion. Net cash of $0.3 million was used to purchase a minority ownership in a privately-held company in the form of common stock and warrants. Net cash of $6.5 million was used in investing activities in the fiscal year ended December 30, 2012 due to the purchase of property and equipment and capitalized costs to develop our website and internal-use software to support our operations and the purchase of preferred shares in a privately-held company and a loan to the same privately-held company in exchange for a note receivable.
Our capital needs are generally minimal and include investments in technology and website enhancements, capital improvements to our leased warehouse and office facilities, and furniture and equipment. Additionally, we have the ability to reduce and/or delay capital investments in challenging economic conditions without significant disruption to our business or operations. Over the next 12 months, we do not expect purchases of property and equipment to exceed our historic levels.
Net cash of $38.1 million was used in financing activities for the fiscal year ended January 4, 2015 related primarily to the repurchase of common stock of $40.3 million partially offset by $2.4 million of proceeds from stock option exercises.
Since the inception of our stock buyback program in the first quarter of 2005 through January 4, 2015, we have repurchased approximately 9.0 million shares for a total of $316.1 million. Shares may be repurchased from time to time in open market transactions or in negotiated transactions off the market. The timing and amount of any shares repurchased are determined by management based on our evaluation of market conditions and other factors. Repurchases may also be made under a Rule 10b5-1 plan. We continually assess market conditions, our cash position, operating results, current forecasts and other factors when making decisions about stock repurchases. On October 28, 2013, our board of directors authorized the renewal of our stock repurchase program. Under this renewed program, we are authorized to repurchase up to $100.0 million of our common stock over the 24 months following the approval date. As of January 4, 2015, $59.7 million remained under the repurchase authorization.
29
Net cash of $11.2 million was provided by financing activities for the fiscal year ended December 29, 2013 related primarily to proceeds from stock option exercises of $21.4 million. This was partially offset by the repurchase of common stock for an aggregate purchase price of approximately $10.4 million. Net cash used in financing activities in the fiscal year ended December 30, 2012 was $30.3 million, primarily related to the repurchases of common stock.
The following table summarizes our contractual obligations and the expected effect on liquidity and cash flows as of January 4, 2015 (in thousands):
Contractual Obligations | Total | Less than 1 Year | 1-3 Years | 3-5 Years | Over 5 Years | |||||||||||||||
Operating leases | $ | 8,593 | $ | 1,524 | $ | 2,623 | $ | 2,534 | $ | 1,912 | ||||||||||
Financing obligation(1) | 175 | 36 | 72 | 67 | — | |||||||||||||||
Purchase obligations(2) | 10,601 | 10,601 | — | — | — | |||||||||||||||
Purchase obligations(3) | 3,140 | 3,140 | — | — | — | |||||||||||||||
$ | 22,509 | $ | 15,301 | $ | 2,695 | $ | 2,601 | $ | 1,912 | |||||||||||
____________________
(1) | During 2007, we made tenant improvements to our U.S. fulfillment center. Due to our financial involvement in the construction of the leased property, we recorded the building as property and equipment during the construction period. Upon completion, the transaction did not meet the criteria for sale-leaseback accounting, and accordingly, has been recorded as a long-term financing obligation. On May 5, 2014, we entered into the Third Amendment to the Commercial Lease Agreement dated July 21, 2006 for this fulfillment center to extend the lease term to October 31, 2019. |
(2) | Includes open merchandise purchase orders at January 4, 2015. |
(3) | Includes commitments for advertising and marketing and other services at January 4, 2015. |
We believe that our current cash and cash equivalent balances, cash flow from operations and our ability to borrow under the Credit Agreement will be sufficient to meet our anticipated operating and capital expenditure needs for at least the next 12 months. We currently do not have any outstanding debt under the Credit Agreement. However, projections of future cash needs and cash flows are subject to many factors and to uncertainty. We continually assess our capital structure and opportunities to obtain credit facilities, sell equity or debt securities, or undertake other transactions for strategic reasons or to further strengthen our financial position. However, there can be no assurance that additional equity, debt or other financing transactions will be available in amounts or on terms acceptable to us, if at all.
Off-Balance Sheet Arrangements
At January 4, 2015, we did not have any off-balance sheet arrangements or relationships with unconsolidated entities or financial partnerships, such as entities often referred to as structured finance or special purposes entities, which are typically established for the purpose of facilitating off-balance sheet arrangements or other contractually narrow or limited purposes.
Impact of Inflation
The effect of inflation and changing prices on our operations was not significant during the periods presented.
Item 7A. | Quantitative and Qualitative Disclosures About Market Risk |
Foreign Currency Exchange Risk
The functional currency of most of our subsidiaries is the applicable local currency. Assets and liabilities have been translated to U.S. dollars using the exchange rates effective on the balance sheet dates, while income and expense accounts are translated at the average rates in effect during the periods presented. The resulting translation adjustments are recorded as a component of other comprehensive income within stockholders’ equity.
We have foreign exchange risk related to foreign-denominated assets and liabilities of our subsidiaries. A majority of these foreign-denominated assets and liabilities relate to Jewellery, our wholly-owned Ireland subsidiary. Based on the balances of Jewellery’s assets and liabilities at January 4, 2015, December 29, 2013, and December 30, 2012, an assumed 10% negative
30
currency movement would have resulted in additional losses of approximately $0.2 million for each of the fiscal years ended January 4, 2015, December 29, 2013 and December 30, 2012.
We recognized gains and losses associated with transactions that are denominated in foreign currencies. We recorded a net loss resulting from foreign currency transactions of approximately $0.8 million for the fiscal year ended January 4, 2015 and $0.4 million for each of the fiscal years ended December 29, 2013 and December 30, 2012, within other income, net in the consolidated statements of operations.
We have foreign exchange risk related to our VAT payables, tax receivables, cash and cash equivalents, and intercompany accounts receivables and payables denominated in various foreign currencies. Based on the balances of these accounts at January 4, 2015, December 29, 2013 and December 30, 2012, an assumed 10% adverse change to foreign exchange would result in additional losses of approximately $0.3 million, $0.2 million and $0.1 million recorded to other income, net for fiscal years ended January 4, 2015, December 29, 2013 and December 30, 2012, respectively.
Interest Rate Risk
We are exposed to financial market risk that results primarily from fluctuations in interest rates. We maintain the majority of our cash, cash equivalents and short-term investments in accounts with major financial institutions within and outside the United States, in the form of demand deposits, money market accounts and other short-term investments. Deposits in these institutions may exceed the amounts of insurance provided, or deposits may not be covered by insurance. To date, we have not experienced any losses on our deposits of cash, cash equivalents and short-term investments.
The primary objective of our investment activities is to preserve principal while at the same time maximizing yields without significantly increasing risk. To achieve this objective, we invest in short-term, high-quality, interest-bearing securities. To minimize our exposure to an adverse shift in interest rates, we invest in short-term securities and maintain an average maturity of one year or less. If interest rates had averaged 100 basis points higher than they did in the year ended January 4, 2015, interest income for the year would have increased approximately $0.6 million. If interest rates had averaged 100 basis points higher than they did in the year ended December 29, 2013, interest income for the year would have increased approximately $0.6 million.
31
Item 8. | Financial Statements and Supplementary Data |
Index to Consolidated Financial Statements
Page | |
Financial Statements | |
Financial Statement Schedule | |
All other schedules are omitted because they are not applicable or the required information is shown in the financial statements or notes thereto. | |
32
REPORT OF INDEPENDENT REGISTERED PUBLIC ACCOUNTING FIRM
To the Board of Directors and Stockholders of
Blue Nile, Inc.
Seattle, Washington
We have audited the accompanying consolidated balance sheets of Blue Nile, Inc., and subsidiaries (the “Company”) as of January 4, 2015 and December 29, 2013, and the related consolidated statements of operations, comprehensive income, changes in stockholders’ equity, and cash flows for each of the three fiscal years in the period ended January 4, 2015. Our audits also included the financial statement schedule listed in the Index at Item 15. These financial statements and financial statement schedule are the responsibility of the Company's management. Our responsibility is to express an opinion on these financial statements and financial statement schedule based on our audits.
We conducted our audits in accordance with the standards of the Public Company Accounting Oversight Board (United States). Those standards require that we plan and perform the audit to obtain reasonable assurance about whether the consolidated financial statements are free of material misstatement. An audit includes examining, on a test basis, evidence supporting the amounts and disclosures in the financial statements. An audit also includes assessing the accounting principles used and significant estimates made by management, as well as evaluating the overall financial statement presentation. We believe that our audits provide a reasonable basis for our opinion.
In our opinion, the consolidated financial statements referred to above present fairly, in all material respects, the financial position of Blue Nile, Inc. and subsidiaries as of January 4, 2015 and December 29, 2013, and the results of their operations and their cash flows for each of the three years in the period ended January 4, 2015, in conformity with accounting principles generally accepted in the United States of America. Also, in our opinion, such financial statement schedule, when considered in relation to the basic consolidated financial statements taken as a whole, presents fairly, in all material respects, the information set forth therein.
We have also audited, in accordance with the standards of the Public Company Accounting Oversight Board (United States), the Company’s internal control over financial reporting as of January 4, 2015, based on the criteria established in Internal Control-Integrated Framework (2013) issued by the Committee of Sponsoring Organizations of the Treadway Commission and our report dated March 2, 2015 expressed an unqualified opinion on the Company’s internal control over financial reporting.
/s/ Deloitte & Touche LLP
Seattle, Washington
March 2, 2015
33
BLUE NILE, INC.
Consolidated Balance Sheets
(In thousands, except par value)
January 4, 2015 | December 29, 2013 | ||||||
Assets | |||||||
Current assets: | |||||||
Cash and cash equivalents | $ | 91,186 | $ | 115,942 | |||
Trade accounts receivable | 2,137 | 3,005 | |||||
Other accounts receivable | 1,571 | 521 | |||||
Inventories | 41,668 | 34,530 | |||||
Deferred income taxes | 1,123 | 1,038 | |||||
Prepaid income taxes | — | 247 | |||||
Prepaids and other current assets | 1,524 | 1,318 | |||||
Total current assets | 139,209 | 156,601 | |||||
Property and equipment, net | 10,422 | 10,188 | |||||
Intangible assets, net | 103 | 140 | |||||
Deferred income taxes | 3,064 | 5,470 | |||||
Note receivable | 2,000 | 2,000 | |||||
Other investments | 2,280 | 2,280 | |||||
Other assets | 256 | 246 | |||||
Total assets | $ | 157,334 | $ | 176,925 | |||
Liabilities and Stockholders’ Equity | |||||||
Current liabilities: | |||||||
Accounts payable | $ | 128,675 | $ | 122,322 | |||
Accrued liabilities | 11,992 | 10,751 | |||||
Current portion of long-term financing obligation | 32 | 51 | |||||
Current portion of deferred rent | 292 | 279 | |||||
Total current liabilities | 140,991 | 133,403 | |||||
Long-term financing obligation, less current portion | 489 | 574 | |||||
Deferred rent, less current portion | 1,982 | 2,229 | |||||
Other long-term liabilities | 169 | 114 | |||||
Commitments and contingencies | |||||||
Stockholders’ equity: | |||||||
Preferred stock, $0.001 par value; 5,000 shares authorized, none issued and outstanding | — | — | |||||
Common stock, $0.001 par value; 300,000 shares authorized; 21,615 shares and 21,480 shares issued, respectively; 11,859 shares and 12,932 shares outstanding, respectively | 22 | 22 | |||||
Additional paid-in capital | 227,146 | 223,261 | |||||
Accumulated other comprehensive loss | (236 | ) | (26 | ) | |||
Retained earnings | 103,489 | 93,758 | |||||
Treasury stock, at cost; 9,756 shares and 8,548 shares outstanding, respectively | (316,718 | ) | (276,410 | ) | |||
Total stockholders’ equity | 13,703 | 40,605 | |||||
Total liabilities and stockholders’ equity | $ | 157,334 | $ | 176,925 | |||
The accompanying notes are an integral part of these consolidated financial statements
34
BLUE NILE, INC.
Consolidated Statements of Operations
(In thousands, except per share data)
Year Ended January 4, 2015 | Year Ended December 29, 2013 | Year Ended December 30, 2012 | |||||||||
Net sales | $ | 473,516 | $ | 450,008 | $ | 400,035 | |||||
Cost of sales | 386,874 | 366,357 | 324,977 | ||||||||
Gross profit | 86,642 | 83,651 | 75,058 | ||||||||
Selling, general and administrative expenses | 72,430 | 69,343 | 62,771 | ||||||||
Operating income | 14,212 | 14,308 | 12,287 | ||||||||
Other income, net: | |||||||||||
Interest income, net | 117 | 107 | 133 | ||||||||
Other income, net | 290 | 150 | 546 | ||||||||
Total other income, net | 407 | 257 | 679 | ||||||||
Income before income taxes | 14,619 | 14,565 | 12,966 | ||||||||
Income tax expense | 4,888 | 3,690 | 4,574 | ||||||||
Net income | $ | 9,731 | $ | 10,875 | $ | 8,392 | |||||
Basic net income per share | $ | 0.80 | $ | 0.87 | $ | 0.64 | |||||
Diluted net income per share | $ | 0.80 | $ | 0.85 | $ | 0.63 | |||||
The accompanying notes are an integral part of these consolidated financial statements
35
BLUE NILE, INC.
Consolidated Statements of Comprehensive Income
(In thousands)
Year Ended January 4, 2015 | Year Ended December 29, 2013 | Year Ended December 30, 2012 | |||||||||
Net income | $ | 9,731 | $ | 10,875 | $ | 8,392 | |||||
Other comprehensive (loss) income: | |||||||||||
Foreign currency translation adjustments | (210 | ) | 74 | 23 | |||||||
Total comprehensive income | $ | 9,521 | $ | 10,949 | $ | 8,415 | |||||
The accompanying notes are an integral part of these consolidated financial statements
36
BLUE NILE, INC.
Consolidated Statements of Changes in Stockholders’ Equity
(In thousands)
Common Stock | Additional Paid-in Capital | Retained Earnings | Accumulated Other Comprehensive Income (Loss) | Treasury Stock | Total Stockholders’ Equity | ||||||||||||||||||||||||
Shares | Amount | Shares | Amount | ||||||||||||||||||||||||||
Balance, January 2, 2012 | 20,525 | $ | 21 | $ | 187,762 | $ | 74,491 | $ | (123 | ) | (6,757 | ) | $ | (227,127 | ) | $ | 35,024 | ||||||||||||
Net income | — | — | — | 8,392 | — | — | — | 8,392 | |||||||||||||||||||||
Other comprehensive income | — | — | — | — | 23 | — | — | 23 | |||||||||||||||||||||
Tax deficiency from exercise of stock options | — | — | (2,567 | ) | — | — | — | — | (2,567 | ) | |||||||||||||||||||
Exercise of common stock options | 221 | — | 6,867 | — | — | — | — | 6,867 | |||||||||||||||||||||
Issuance of common stock to directors | 3 | — | 120 | — | — | — | — | 120 | |||||||||||||||||||||
Vesting of restricted stock units | 3 | — | — | — | — | — | — | — | |||||||||||||||||||||
Stock-based compensation | — | — | 5,100 | — | — | — | — | 5,100 | |||||||||||||||||||||
Repurchase of common stock | — | — | — | — | — | (1,492 | ) | (38,850 | ) | (38,850 | ) | ||||||||||||||||||
Balance, December 30, 2012 | 20,752 | 21 | 197,282 | 82,883 | (100 | ) | (8,249 | ) | (265,977 | ) | 14,109 | ||||||||||||||||||
Net income | — | — | — | 10,875 | — | — | — | 10,875 | |||||||||||||||||||||
Other comprehensive income | — | — | — | — | 74 | — | — | 74 | |||||||||||||||||||||
Tax deficiency from exercise of stock options | — | — | (583 | ) | — | — | — | — | (583 | ) | |||||||||||||||||||
Exercise of common stock options | 716 | 1 | 21,376 | — | — | — | — | 21,377 | |||||||||||||||||||||
Issuance of common stock to directors | 2 | — | 80 | — | — | — | — | 80 | |||||||||||||||||||||
Vesting of restricted stock units | 10 | — | — | — | — | — | — | — | |||||||||||||||||||||
Stock-based compensation | — | — | 5,106 | — | — | — | — | 5,106 | |||||||||||||||||||||
Repurchase of common stock | — | — | — | — | — | (299 | ) | (10,433 | ) | (10,433 | ) | ||||||||||||||||||
Balance, December 29, 2013 | 21,480 | 22 | 223,261 | 93,758 | (26 | ) | (8,548 | ) | (276,410 | ) | 40,605 | ||||||||||||||||||
Net income | — | — | — | 9,731 | — | — | — | 9,731 | |||||||||||||||||||||
Other comprehensive loss | — | — | — | — | (210 | ) | — | — | (210 | ) | |||||||||||||||||||
Tax deficiency from exercise of stock options | — | — | (2,713 | ) | — | — | — | — | (2,713 | ) | |||||||||||||||||||
Exercise of common stock options | 99 | — | 2,413 | — | — | — | — | 2,413 | |||||||||||||||||||||
Issuance of common stock to directors | 3 | — | 80 | — | — | — | — | 80 | |||||||||||||||||||||
Vesting of restricted stock units | 42 | — | — | — | — | — | — | — | |||||||||||||||||||||
Shares withheld related to net share settlement of equity awards | (9 | ) | — | (282 | ) | — | — | — | — | (282 | ) | ||||||||||||||||||
Stock-based compensation | — | — | 4,387 | — | — | — | — | 4,387 | |||||||||||||||||||||
Repurchase of common stock | — | — | — | — | — | (1,208 | ) | (40,308 | ) | (40,308 | ) | ||||||||||||||||||
Balance, January 4, 2015 | 21,615 | $ | 22 | $ | 227,146 | $ | 103,489 | $ | (236 | ) | (9,756 | ) | $ | (316,718 | ) | $ | 13,703 | ||||||||||||
The accompanying notes are an integral part of these consolidated financial statements
37
BLUE NILE, INC.
Consolidated Statements of Cash Flows
(In thousands)
Year Ended January 4, 2015 | Year Ended December 29, 2013 | Year Ended December 30, 2012 | |||||||||
Operating activities: | |||||||||||
Net income | $ | 9,731 | $ | 10,875 | $ | 8,392 | |||||
Adjustments to reconcile net income to net cash provided by operating activities: | |||||||||||
Depreciation and amortization | 3,607 | 3,141 | 3,368 | ||||||||
(Gain) loss on disposal of property and equipment | — | (7 | ) | 45 | |||||||
Stock-based compensation | 4,361 | 5,028 | 5,087 | ||||||||
Deferred income taxes | 2,321 | 2,204 | 1,030 | ||||||||
Tax deficiency from exercise of stock options | (2,713 | ) | (583 | ) | (2,567 | ) | |||||
Excess tax benefit from exercise of stock options | (195 | ) | (361 | ) | (37 | ) | |||||
Changes in assets and liabilities: | |||||||||||
Receivables | (182 | ) | (41 | ) | (323 | ) | |||||
Inventories | (7,138 | ) | (1,260 | ) | (4,003 | ) | |||||
Prepaid federal income taxes | 247 | (247 | ) | — | |||||||
Prepaid expenses and other assets | (216 | ) | (218 | ) | (180 | ) | |||||
Accounts payable | 6,323 | 6,432 | 20,392 | ||||||||
Accrued liabilities | 1,241 | (1,688 | ) | 3,052 | |||||||
Other long-term liabilities | 55 | 89 | 25 | ||||||||
Deferred rent | (234 | ) | 74 | 163 | |||||||
Net cash provided by operating activities | 17,208 | 23,438 | 34,444 | ||||||||
Investing activities: | |||||||||||
Purchases of property and equipment | (3,771 | ) | (5,528 | ) | (2,525 | ) | |||||
Purchase of other investments | — | (280 | ) | (2,000 | ) | ||||||
Payments for note receivable | — | — | (2,000 | ) | |||||||
Net cash used in investing activities | (3,771 | ) | (5,808 | ) | (6,525 | ) | |||||
Financing activities: | |||||||||||
Repurchase of common stock | (40,308 | ) | (10,433 | ) | (38,850 | ) | |||||
Proceeds from stock option exercises | 2,413 | 21,377 | 8,572 | ||||||||
Taxes paid for net share settlement of equity awards | (282 | ) | — | — | |||||||
Excess tax benefit from exercise of stock options | 195 | 361 | 37 | ||||||||
Principal payments under long-term financing obligation | (104 | ) | (60 | ) | (59 | ) | |||||
Net cash (used in) provided by financing activities | (38,086 | ) | 11,245 | (30,300 | ) | ||||||
Effect of exchange rate changes on cash and cash equivalents | (107 | ) | 50 | 7 | |||||||
Net (decrease) increase in cash and cash equivalents | (24,756 | ) | 28,925 | (2,374 | ) | ||||||
Cash and cash equivalents, beginning of period | 115,942 | 87,017 | 89,391 | ||||||||
Cash and cash equivalents, end of period | $ | 91,186 | $ | 115,942 | $ | 87,017 | |||||
The accompanying notes are an integral part of these consolidated financial statements
38
BLUE NILE, INC.
Consolidated Statements of Cash Flows
(In thousands)
Year Ended January 4, 2015 | Year Ended December 29, 2013 | Year Ended December 30, 2012 | |||||||||
Supplemental disclosure of cash flow information: | |||||||||||
Cash paid for income taxes | $ | 3,675 | $ | 4,965 | $ | 4,121 | |||||
Cash paid for interest relating to long-term financing obligation | 3 | 2 | 3 | ||||||||
Non-cash investing and financing activities: | |||||||||||
Payable for purchases of property and equipment | 36 | 7 | 325 | ||||||||
The accompanying notes are an integral part of these consolidated financial statements
39
Note 1. | Description of the Company and Summary of Significant Accounting Policies |
The Company
Blue Nile, Inc. (the “Company”) is a leading online retailer of high-quality diamonds and fine jewelry. In addition to sales of diamonds and fine jewelry, the Company provides education, guidance and support to enable customers to more effectively learn about and purchase diamonds and fine jewelry. The Company, a Delaware corporation, based in Seattle, Washington, was formed in March 1999. The Company serves consumers in over 40 countries and territories all over the world through its website at www.bluenile.com.
Fiscal Year
The Company’s fiscal year ends on the Sunday closest to December 31. Each fiscal year consists of four 13-week quarters, with one extra week added in the fourth quarter every five to six years. The Company's fiscal year 2014 ending January 4, 2015 included one extra week in the fourth quarter as a result of the Company's 4-4-5 retail reporting calendar.
Principles of Consolidation
The accompanying consolidated financial statements include the accounts of the Company and its wholly-owned subsidiaries. All intercompany transactions and balances are eliminated in consolidation.
Use of Estimates
The preparation of financial statements in conformity with accounting principles generally accepted in the United States (“GAAP”) requires management to make estimates and assumptions that affect the reported amounts of assets and liabilities, the disclosure of contingent assets and liabilities at the date of the financial statements and the reported amounts of revenues and expenses during the reporting period. Some of the more significant estimates include the allowance for sales returns, accounting for taxes, and assumptions used to determine stock-based compensation expense. Actual results could differ materially from those estimates.
Foreign Currency
The functional currency of most of the Company’s subsidiaries is the applicable local currency. Assets and liabilities have been translated to U.S. dollars using the exchange rates effective on the balance sheet dates, while income and expense accounts are translated at the average rates in effect during the periods presented. The resulting translation adjustments are recorded as a component of other accumulated comprehensive income within stockholders’ equity.
The Company also recognizes gains and losses associated with transactions that are denominated in foreign currencies. The Company recorded a net loss resulting from foreign currency transactions of approximately $0.8 million for the fiscal year ended January 4, 2015 and approximately $0.4 million for each of the fiscal years ended December 29, 2013 and December 30, 2012, within other income, net in the consolidated statements of operations.
Concentration of Risk
The Company maintains the majority of its cash and cash equivalents in accounts with six major financial institutions within and outside the United States, in the form of demand deposits, money market accounts, and time deposits. Deposits in these institutions may exceed the amounts of insurance provided, or deposits may not be covered by insurance. The Company has not experienced losses on its deposits of cash and cash equivalents. The Company’s trade accounts receivable are primarily derived from credit card purchases from customers and the majority are settled within two business days.
The Company’s ability to acquire diamonds and fine jewelry is dependent on its relationships with various suppliers from whom it purchases diamonds and fine jewelry. The Company has reached agreements with certain suppliers to provide access to their inventories of diamonds for its customers, but the terms of these agreements are limited and do not govern the purchase of diamonds for its inventory. Purchase concentration by major supply vendor in fiscal year ended January 4, 2015 with comparative information for fiscal years ended December 29, 2013 and December 30, 2012, is as follows:
40
Year Ended | ||||||||
January 4, 2015 | December 29, 2013 | December 30, 2012 | ||||||
Vendor A | 7 | % | 10 | % | 6 | % | ||
Vendor B | 6 | % | 5 | % | 4 | % | ||
Vendor C | 5 | % | 5 | % | 4 | % | ||
18 | % | 20 | % | 14 | % | |||
Cash and Cash Equivalents
The Company considers all highly liquid investments with maturities of three months or less, from the date of purchase, to be cash equivalents.
Inventories
The Company’s diamond and fine jewelry inventories are valued at the lower of cost or market, using the specific identification method for diamonds and weighted average cost method for fine jewelry and watches. The Company lists loose diamonds on its website that are typically not included in inventory until the Company receives a customer order for those diamonds. Upon receipt of a customer order, the Company purchases a specific diamond and records it in inventory until it is delivered to the customer, at which time the revenue from the sale is recognized and inventory is relieved.
To determine if the cost of the Company's inventory should be written down, current and anticipated demand, customer preferences, age of the merchandise and fashion trends are considered. This write-down is equal to the difference between the cost of inventory and its estimated market value. The Company recorded inconsequential write-downs for the fiscal years ended January 4, 2015, December 29, 2013 and December 30, 2012.
Property and Equipment
Property and equipment are stated at cost less accumulated depreciation. Maintenance and repairs are expensed as incurred. Depreciation expense is calculated on a straight-line basis over the estimated useful lives of the related assets. The cost and related accumulated depreciation of assets sold or otherwise disposed of are removed from the accounts and the related gain or loss is reported in the statement of operations. Estimated useful lives by major asset category are as follows:
Asset | Life (in years) |
Software | 2-5 |
Computers and equipment | 2-5 |
Leasehold improvements | Shorter of lease term or asset life |
Building | Shorter of lease term or asset life |
Furniture and fixtures | 5-7 |
Capitalized Software
The Company capitalizes costs to develop its website and internal-use software and amortizes such costs on a straight-line basis over the estimated useful life of the software once it is available for use. Costs related to the design and maintenance of internal-use software and website development are expensed as incurred.
Impairment of Long-Lived Assets
The Company reviews the carrying value of its long-lived assets, including property and equipment and definite-lived intangible assets, whenever events or changes in circumstances indicate that the carrying value may not be recoverable. To the extent the estimated future cash inflows attributable to the assets, less estimated future cash outflows, are less than the carrying amount, an impairment loss would be recognized. The Company did not record an impairment loss for long-lived assets for the fiscal years ended January 4, 2015, December 29, 2013 or December 30, 2012.
41
Intangible Assets
Intangible assets are recorded at cost and consist primarily of the costs incurred to acquire licenses and other similar agreements with finite lives. The gross carrying amount of these licenses was approximately $0.5 million at both January 4, 2015 and December 29, 2013. Accumulated amortization was approximately $0.5 million at January 4, 2015 and $0.4 million at December 29, 2013. Amortization expense was approximately $37,000 in the fiscal year ended January 4, 2015, $55,000 in the fiscal year ended December 29, 2013 and $58,000 in the fiscal year ended December 30, 2012. Amortization expense is estimated to be $22,000 in fiscal 2015, $19,000 in fiscal 2016, $14,000 in fiscal 2017, $9,000 in fiscal 2018, and $3,000 in fiscal 2019.
Note Receivable and Other Investments
The Company holds a minority ownership of a privately-held company in the form of convertible preferred shares, purchased for an aggregate amount of $2.0 million, which we account for under the cost method of accounting.
The Company holds a $2.0 million note receivable (the "Note") from the same privately-held company. The interest rate changes over the term of the Note to LIBOR plus a predetermined rate per annum. The Note is recorded at its face amount on the Company's consolidated balance sheet.
The Company holds a minority ownership in another privately-held company in the form of common stock and warrants, purchased for $280,000, which we account for under the cost method of accounting.
The Company reviews the investments for impairment when events and circumstances indicate that the decline in fair value of the asset below the carrying value is other-than-temporary. This evaluation consists of several qualitative and quantitative factors regarding the severity and duration of the unrealized loss as well as the Company's ability and intent to hold the investment until a forecasted recovery occurs. Additionally, the Company assesses whether it has plans to sell the security or it is more likely than not that the Company will be required to sell the investment before recovery of its amortized cost basis. Factors considered include recent and projected financial results and operating trends; publicly available information that may affect the value of the investment; duration and severity of the decline in value; and our strategy and intentions for holding the investment.
Fair Value of Financial Instruments
The carrying amounts for the Company’s cash, cash equivalents, accounts receivable, note receivable, accounts payable and accrued liabilities approximate fair value due to their short maturities.
Treasury Stock
Treasury stock is recorded at cost and consists primarily of the repurchase of the Company’s common stock in the open market.
Income Taxes
Deferred tax assets and liabilities are determined based on the differences between financial reporting and tax bases of assets and liabilities and are measured using the tax rates that will be in effect when the differences are expected to reverse. Future tax benefits, such as return reserves, are recognized to the extent that realization of such benefits is considered to be more likely than not.
The Company utilizes a two-step approach to recognizing and measuring uncertain tax positions. The first step is to evaluate the tax position for recognition by determining if the weight of available evidence indicates it is more likely than not that the position will be sustained on audit, including resolution of related appeals or litigation processes, if any. The second step is to measure the tax benefit as the largest amount which is more than 50% likely of being realized upon ultimate settlement. The Company considers many factors when evaluating and estimating tax positions and tax benefits, which may require periodic adjustments and which may not accurately forecast actual outcomes. If applicable, interest and penalties related to unrecognized tax benefits are included in the provision for income taxes.
42
Revenue Recognition
Net sales consist of products sold via the Internet and shipping revenue, net of estimated returns and promotional discounts and excluding sales taxes. The Company recognizes revenue when all of the following have occurred: persuasive evidence of an agreement with the customer exists, delivery has occurred or services have been rendered, the selling price is fixed or determinable and collectability of the selling price is reasonably assured. The Company evaluates whether it is appropriate to record the gross amount of product sales and related costs or the net amount earned. Revenue is recorded at the gross amount when the Company is the primary obligor, is subject to inventory and credit risk, has latitude in establishing price and product specification, or has most of these indicators. When the Company is not primarily obligated and has no latitude in establishing the price, revenue will be recorded at the net amount earned.
The Company requires payment at the point of sale. Amounts received before the customer assumes the risk of loss are not recorded as revenue. For sales to customers in the U.S., Canada, E.U., China, and the United Arab Emirates (the "U.A.E."), the Company recognizes revenue when delivery has occurred, which is typically one to three days after shipment. For international sales, other than to Canada, E.U., China, and the U.A.E., revenue is recognized upon shipment as this is when risk of loss transfers. The Company generally offers a return policy of 30 days and provides an allowance for sales returns during the period in which the sales are made. At January 4, 2015 and December 29, 2013, the reserve for sales returns was $1.0 million and $1.4 million, respectively, and was recorded as an accrued liability. Sales and cost of sales reported in the consolidated statements of operations are reduced to reflect estimated returns. The estimates are based on the Company’s historical product return rates and current economic conditions.
The Company currently has a lifetime diamond upgrade program on all certified diamonds purchased since the Company's inception. This is accounted for as a guarantee and at January 4, 2015 and December 29, 2013, the estimated fair value of the guarantee is inconsequential.
The Company generally does not extend credit to customers, except through third party credit cards. The majority of sales are through credit cards, and trade accounts receivable are composed primarily of amounts due from financial institutions related to credit card sales. The Company does not maintain an allowance for doubtful accounts because payment is typically received within two business days after the sale is complete.
Shipping and Handling Costs
The Company’s shipping and handling costs primarily include payments to third-parties for shipping merchandise to the Company’s customers. Shipping and handling costs of approximately $4.8 million, $4.6 million and $4.5 million in the fiscal years ended January 4, 2015, December 29, 2013 and December 30, 2012, respectively, were included in cost of sales.
Cost of Sales
Cost of sales consists of the cost of merchandise sold to customers, inbound and outbound shipping costs, insurance on shipments, the costs incurred to set diamonds into ring, earring and pendant settings, including labor and related facility costs, and depreciation on assembly related property, plant and equipment.
Selling, General and Administrative Expenses
Selling, general and administrative expenses consist primarily of payroll and related benefit costs for the Company’s employees, marketing costs, stock-based compensation and credit card fees. These expenses also include certain facility-related costs, and fulfillment, customer service, technology and depreciation expenses, as well as professional fees and other general corporate expenses.
Fulfillment costs include costs incurred in operating and staffing the fulfillment center, including costs attributable to receiving, inspecting and warehousing inventories and picking, packaging and preparing customers’ orders for shipment. Fulfillment costs in the years ended January 4, 2015, December 29, 2013 and December 30, 2012 were approximately $3.3 million, $3.6 million and $3.7 million, respectively.
43
Marketing
Marketing costs are expensed as incurred. Costs associated with web portal advertising contracts are amortized over the period such advertising is expected to be used. Costs of advertising associated with radio, print and other media are expensed when such services are used. Marketing expense for the fiscal years ended January 4, 2015, December 29, 2013 and December 30, 2012 was approximately $25.0 million, $24.3 million and $21.0 million, respectively.
Stock-Based Compensation
The Company measures compensation cost for all stock options and restricted stock units granted based on fair value on the measurement date, which is typically the grant date. The fair value of each stock option granted is estimated on the grant date using the Black-Scholes-Merton option valuation model. The fair value of each restricted stock unit ("RSU") is based on the fair market value of the Company’s common stock on the date of the grant. Stock-based compensation expense is recognized on a straight-line basis over the requisite service period for each stock option or restricted stock unit grant expected to vest with forfeitures estimated at the date of grant based on the Company’s historical experience and future expectations.
Recent Accounting Pronouncements
In May 2014, the Financial Accounting Standards Board ("FASB") issued Accounting Standards Update No. 2014-09 (“ASU 2014-09”), “Revenue from Contracts with Customers (Topic 606)” which amends the existing accounting standards for revenue recognition. ASU 2014-09 is based on the principle that revenue should be recognized to depict the transfer of promised goods or services to customers in an amount that reflects the consideration to which the entity expects to be entitled in exchange for those goods or services. The new revenue standard may be applied retrospectively to each prior period presented or retrospectively with the cumulative effect recognized as of the date of adoption. Early adoption is not permitted. ASU 2014-09 is effective for the Company in the first quarter of fiscal year 2017. The Company is currently evaluating the effect that the updated standard will have on its consolidated financial statements as well as the expected adoption method and related disclosures.
In August 2014, the FASB issued Accounting Standards Update No. 2014-15 (“ASU 2014-15”), “Presentation of Financial Statements - Going Concern.” The new standard provides guidance around management's responsibility to evaluate whether there is substantial doubt about an entity's ability to continue as a going concern and to provide related footnote disclosures. The new standard is effective for fiscal years, and interim periods within those fiscal years, beginning after December 15, 2015. Early adoption is permitted. The adoption of this standard is not expected to have a material impact on our financial statements and related disclosures.
Note 2. | Inventories |
Inventories consist of the following (in thousands):
January 4, 2015 | December 29, 2013 | ||||||
Loose diamonds | $ | 6,439 | $ | 3,321 | |||
Fine jewelry and other | 35,229 | 31,209 | |||||
$ | 41,668 | $ | 34,530 | ||||
Note 3. | Property and Equipment |
Property and equipment consist of the following (in thousands):
44
January 4, 2015 | December 29, 2013 | ||||||
Computers and equipment | $ | 4,707 | $ | 4,325 | |||
Software and website development | 19,731 | 16,296 | |||||
Leasehold improvements | 6,615 | 6,654 | |||||
Furniture and fixtures | 1,249 | 1,255 | |||||
Building | 539 | 940 | |||||
Property and equipment, gross | 32,841 | 29,470 | |||||
Less: accumulated depreciation and amortization | (22,419 | ) | (19,282 | ) | |||
Property and equipment, net | $ | 10,422 | $ | 10,188 | |||
Total depreciation expense was approximately $3.6 million, $3.1 million, and $3.3 million for the fiscal years ended January 4, 2015, December 29, 2013 and December 30, 2012, respectively.
Capitalized software costs include external direct costs and internal direct labor and related employee benefits costs of developing software for internal use. Amortization begins in the period in which the software is ready for its intended use. The Company had approximately $6.3 million and $4.9 million of unamortized computer software and website development costs at January 4, 2015 and December 29, 2013, respectively. Depreciation and amortization expense of capitalized software and website development costs was approximately $2.0 million, $1.6 million and $2.0 million in the fiscal years ended January 4, 2015, December 29, 2013 and December 30, 2012, respectively.
Note 4. | Commitments and Contingencies |
In the ordinary course of business, the Company may be subject from time to time to various proceedings, lawsuits, disputes or claims. In addition, the Company is regularly audited by various tax authorities. Although the Company cannot predict with assurance the outcome of any litigation or audit, it does not believe there are currently any such actions that, if resolved unfavorably, would have a material impact on the Company’s financial condition, results of operations or cash flows.
Leases
The Company leases its office and warehouse facilities and some equipment under non-cancelable lease agreements with initial terms that generally range from two to eleven years. Some of the leases include renewal provisions at the Company’s option. At the inception of the lease, the Company evaluates each agreement to determine whether the lease will be accounted for as an operating or capital lease. The term of the lease used for this evaluation includes renewal option periods only in instances in which the exercise of the renewal option can be reasonably assured and failure to exercise such option would result in an economic penalty. Some of the office leases contain rent escalation clauses and rent holidays. Rent expense is recorded on a straight-line basis over the lease term with the difference between the rent paid and the straight-line rent expense recorded as a deferred rent liability. Lease incentive payments received from the landlord are recorded as deferred rent liabilities and are amortized on a straight-line basis over the lease term as a reduction in rent. For January 4, 2015 and December 29, 2013, the deferred rent balance related to lease incentives was approximately $1.7 million and $1.9 million, respectively.
On May 5, 2014, the Company entered into the Third Amendment to the Commercial Lease Agreement dated July 21, 2006 for its U.S. fulfillment center. The future minimum lease payments are included in the operating lease schedule below. During 2007, the Company made tenant improvements to its U.S. fulfillment center. Due to its financial involvement in the construction of the leased property, the Company recorded the building as property and equipment during the construction period. Upon completion, the transaction did not meet the criteria for sale-leaseback accounting, and accordingly, has been recorded as a long-term financing obligation.
Future minimum lease payments at January 4, 2015 are as follows (in thousands):
45
Financing Obligation | Operating Leases | ||||||
2015 | $ | 36 | $ | 1,524 | |||
2016 | 36 | 1,373 | |||||
2017 | 36 | 1,250 | |||||
2018 | 37 | 1,268 | |||||
2019 | 30 | 1,266 | |||||
Thereafter | — | 1,912 | |||||
Total minimum lease payments | 175 | $ | 8,593 | ||||
Less: amounts representing interest | (9 | ) | |||||
Present value of minimum lease payments | 166 | ||||||
Residual value | 355 | ||||||
Less: current maturities | (32 | ) | |||||
Total long-term financing obligation less current maturities | $ | 489 | |||||
Assets under the long-term financing obligation amounted to $0.5 million at January 4, 2015 and $0.6 million at December 29, 2013. These amounts are net of accumulated depreciation of approximately $20,000 as of January 4, 2015 and $0.3 million as of December 29, 2013. Such assets are classified within property and equipment, net, in the accompanying balance sheets. The residual value of the long-term financing obligation represents the estimated fair value of the financing at the end of the Company’s lease term. Rent expense under non-cancellable lease terms which includes certain common area maintenance costs, was approximately $1.3 million, $1.0 million and $0.8 million for the fiscal years ended January 4, 2015, December 29, 2013 and December 30, 2012, respectively.
Note 5. | Preferred Stock |
The Company has 5,000,000 shares of undesignated preferred stock authorized for future issuance. Shares of preferred stock may be issued from time to time in one or more series, with designations, preferences, and limitations established by the Company’s board of directors.
Note 6. | Stock-Based Compensation |
Stock Option Plans
As of January 4, 2015, the Company has a total of four equity plans.
The Company’s 2004 Equity Incentive Plan (“2004 Plan”) provides for the grant of non-statutory stock options, restricted stock awards, stock appreciation rights, RSUs and other forms of equity compensation, which may be granted to employees, including officers, non-employee directors and consultants. Upon the effectiveness of the 2013 Plan (as defined below), the 2004 Plan was suspended and any equity compensation that would have been granted under the 2004 Plan was thereafter granted under the 2013 Plan.
The Company’s 2004 Non-Employee Directors’ Stock Option Plan (“Directors’ Plan”) provides for the automatic grant of non-statutory stock options to purchase shares of common stock to non-employee directors. In April 2012, the Directors' Plan was suspended; therefore, any equity compensation that would have been granted under the Directors' Plan is now granted under the 2004 Plan. Upon the effectiveness of the 2013 Plan, any equity compensation that would have been granted under the Directors' Plan is now granted under the 2013 Plan.
On May 21, 2013, the Company adopted the 2013 Equity Incentive Plan (“2013 Plan”). The 2013 Plan provides for the grant of incentive stock options, nonstatutory stock options, stock appreciation rights, restricted stock awards, restricted stock unit awards, performance stock awards, performance cash awards and other stock awards. The 2013 Plan is intended to be the successor to the 2004 Plan and the Directors' Plan. Any equity compensation that would have been granted under the 2004 Plan or Directors' Plan is now granted under the 2013 Plan. As of January 4, 2015, there were 1,329,750 shares of common stock reserved for future grants under the 2013 Plan.
46
The majority of options granted generally provide for 25% vesting on the first anniversary from the date of grant with the remainder vesting monthly over the subsequent three years and expire 10 years from the date of grant. All of our outstanding stock options are non-qualified stock options. RSUs generally vest 25% on the first anniversary from the date of grant with the remaining vesting quarterly over three years.
Employee Stock Purchase Plans
In April 2004, the Company adopted the 2004 Employee Stock Purchase Plan (the “Purchase Plan”). As of January 4, 2015, 1,000,000 shares of common stock are authorized to be sold under the Purchase Plan. Commencing on the first day of the fiscal year in which the Company first makes an offering under the Purchase Plan, this amount will be increased annually for 20 years. The increase in amount is the lesser of 320,000 shares or one and one half percent of the number of shares of common stock outstanding on each such date, unless a lower number of shares is approved by the board of directors. The Purchase Plan is intended to qualify as an “employee stock purchase plan” within the meaning of Section 423 of the Internal Revenue Code. As of January 4, 2015, no shares of common stock have been offered for sale under the Purchase Plan.
Option Grants to Non-Employees
The Company accounts for equity instruments issued to non-employees at their fair value on the measurement date.
Stock-Based Compensation Expense
The following weighted average assumptions were used for the valuation of stock options granted during the periods presented:
Year Ended | |||||||||||
January 4, 2015 | December 29, 2013 | December 30, 2012 | |||||||||
Expected term | 4.5 years | 4.5 years | 4.3 years | ||||||||
Expected volatility | 46.9 | % | 56.9 | % | 58.9 | % | |||||
Expected dividend yield | 0.0 | % | 0.0 | % | 0.0 | % | |||||
Risk-free interest rate | 1.5 | % | 0.9 | % | 0.7 | % | |||||
Estimated weighted average fair value per option granted | $ | 13.28 | $ | 14.68 | $ | 15.45 | |||||
• | Expected Term — This is the estimated period of time until exercise and is based primarily on historical experience for options with similar terms and conditions, giving consideration to future expectations. The Company also considers the expected terms of other companies that have similar contractual terms, expected stock volatility and employee demographics. |
• | Expected Volatility — This is based on the Company’s historical stock price volatility commensurate with the expected term of the options on the date of grant. |
• | Expected Dividend Yield — The Company has not paid dividends in the past and does not expect to pay dividends in the near future. |
• | Risk-Free Interest Rate — This is the rate on nominal U.S. Government Treasury Bills with lives commensurate with the expected term of the options on the date of grant. |
The assumptions used to calculate the fair value of options granted are evaluated and revised, as necessary, to reflect market conditions and the Company’s experience.
The following table represents total stock-based compensation expense recognized in the consolidated financial statements (in thousands):
47
Year Ended | ||||||||||||
January 4, 2015 | December 29, 2013 | December 30, 2012 | ||||||||||
Stock-based compensation expense in selling, general and administrative expenses | $ | 4,196 | $ | 4,860 | $ | 4,867 | ||||||
Stock-based compensation expense in cost of sales | 85 | 88 | 100 | |||||||||
Total stock-based compensation expense in the consolidated statements of operations | $ | 4,281 | $ | 4,948 | $ | 4,967 | ||||||
Total related tax benefit | $ | 1,498 | $ | 1,732 | $ | 1,753 | ||||||
Stock-based compensation capitalized | $ | 106 | $ | 158 | $ | 133 | ||||||
Stock-based compensation capitalized is included in property and equipment, net, in the consolidated balance sheets as a component of the cost capitalized for website development and the development of software for internal use. As of January 4, 2015, the Company had total unrecognized compensation costs related to unvested stock options and RSUs of approximately $5.6 million, before income taxes. The Company expects to recognize this cost over a weighted average period of 1.91 years for the options and 2.63 years for the RSUs.
The following summarizes all stock option transactions from January 2, 2012 through January 4, 2015:
Options | Weighted average exercise price | Weighted average remaining contractual term | Total intrinsic value | |||||||||
(In thousands) | (In years) | (In thousands) | ||||||||||
Balance, January 2, 2012 | 2,391 | $ | 40.82 | |||||||||
Granted | 432 | 33.15 | ||||||||||
Exercised | (220 | ) | 31.15 | |||||||||
Canceled | (404 | ) | 50.26 | |||||||||
Balance, December 30, 2012 | 2,199 | 38.55 | ||||||||||
Granted | 117 | 31.67 | ||||||||||
Exercised | (716 | ) | 29.88 | |||||||||
Canceled | (107 | ) | 41.83 | |||||||||
Balance, December 29, 2013 | 1,493 | 41.93 | ||||||||||
Granted | 79 | 33.00 | ||||||||||
Exercised | (99 | ) | 24.39 | |||||||||
Canceled | (452 | ) | 49.56 | |||||||||
Balance, January 4, 2015 | 1,021 | $ | 39.56 | 6.00 | $ | 2,199 | ||||||
Vested and expected to vest at January 4, 2015 | 999 | $ | 39.71 | 5.95 | $ | 2,147 | ||||||
Exercisable at January 4, 2015 | 773 | $ | 41.51 | 5.38 | $ | 1,630 | ||||||
The total intrinsic value of options exercised were approximately $1.1 million, $7.3 million and $1.6 million in the fiscal years ended January 4, 2015, December 29, 2013 and December 30, 2012, respectively. During the fiscal years ended January 4, 2015, December 29, 2013 and December 30, 2012, the total fair value of options vested was approximately $2.9 million, $4.9 million and $4.6 million, respectively.
The following table summarizes additional information about stock options outstanding at January 4, 2015:
48
Outstanding | Exercisable | ||||||||||||||
Options | Weighted Average | ||||||||||||||
Remaining Contractual Life | Exercise Price | ||||||||||||||
Range of Exercise Price | Options | Weighted Average Exercise Price | |||||||||||||
(In thousands) | (In years) | (In thousands) | |||||||||||||
$20.28 — $32.42 | 265 | 6.33 | $ | 28.68 | 189 | $ | 27.92 | ||||||||
$32.43 — $33.45 | 287 | 7.28 | 33.27 | 158 | 33.25 | ||||||||||
$35.56 — $49.27 | 292 | 5.54 | 41.62 | 254 | 42.20 | ||||||||||
$49.28 — $94.99 | 177 | 4.20 | 62.69 | 172 | 62.92 | ||||||||||
1,021 | 6.00 | 39.56 | 773 | 41.51 | |||||||||||
The following summarizes all RSU activity from January 2, 2012 through January 4, 2015:
RSUs | Weighted Average Grant Date Fair Value | Weighted Average Remaining Contractual Term | Aggregate Intrinsic Value | |||||||||
(In thousands) | (In years) | (In thousands) | ||||||||||
Balance, January 2, 2012 | — | $ | — | |||||||||
Granted | 6 | 29.67 | ||||||||||
Vested | (3 | ) | 35.23 | |||||||||
Canceled | — | — | ||||||||||
Balance, December 30, 2012 | 3 | 29.67 | ||||||||||
Granted | 97 | 32.07 | ||||||||||
Vested | (10 | ) | 38.76 | |||||||||
Canceled | (2 | ) | 31.34 | |||||||||
Balance, December 29, 2013 | 88 | 31.01 | ||||||||||
Granted | 91 | 33.01 | ||||||||||
Vested | (42 | ) | 32.30 | |||||||||
Canceled | (28 | ) | 32.73 | |||||||||
Balance, January 4, 2015 | 109 | $ | 31.74 | 1.22 | $ | 3,810 | ||||||
Vested and expected to vest at January 4, 2015 | 96 | $ | 36.85 | 1.13 | $ | 3,368 | ||||||
The aggregate intrinsic value in the tables above are before applicable income taxes and represent the amount recipients would have received if all stock options had been exercised or RSUs had been released on the last business day of the period indicated, based on the closing stock price of the Company's common stock on such date. The total intrinsic value of RSUs vested was approximately $1.5 million, $0.5 million and $0.1 million in the fiscal years ended January 4, 2015, December 29, 2013 and December 30, 2012, respectively. During the fiscal years ended January 4, 2015, December 29, 2013 and December 30, 2012, the total fair value of RSUs vested was approximately $1.4 million, $0.4 million and $0.1 million, respectively.
Note 7. | Common Stock |
On October 28, 2013, the Company’s board of directors authorized the renewal of our stock repurchase program. Under this renewed program, we are authorized to repurchase up to $100.0 million of our common stock within the 24-month period following the approval date. In the fiscal year ended January 4, 2015, the Company repurchased 1.2 million shares of its common stock for an aggregate purchase price of approximately $40.3 million under this authorization. In the fiscal year ended December 29, 2013, the Company repurchased 299,240 shares of the Company’s common stock for an aggregate purchase price of approximately $10.4 million under a previous repurchase authorization that has since expired. As of January 4, 2015,
49
$59.7 million remained under the repurchase authorization. In the fiscal year ended December 30, 2012, the Company repurchased 1.5 million shares of the Company’s common stock for an aggregate purchase price of approximately $38.9 million under the same previous repurchase authorization that has since expired.
Note 8. | Employee Benefit Plan |
The Company has a defined contribution plan pursuant to Section 401(k) of the Internal Revenue Code covering all eligible officers and employees. The Company provides a discretionary matching contribution, which has generally been $0.50 for every $1.00 contributed by the employee up to 4% of each employee’s salary. Such contributions were approximately $0.3 million for each of the fiscal years ended January 4, 2015 and December 29, 2013 and December 30, 2012.
Note 9. | Income Taxes |
The expense for income taxes consists of the following (in thousands):
Year Ended | |||||||||||
January 4, 2015 | December 29, 2013 | December 30, 2012 | |||||||||
Current income tax expense | $ | 5,280 | $ | 2,069 | $ | 6,111 | |||||
Tax deficiency from stock based compensation recorded in equity | (2,713 | ) | (583 | ) | (2,567 | ) | |||||
Deferred income tax expense | 2,321 | 2,204 | 1,030 | ||||||||
Total income tax expense | $ | 4,888 | $ | 3,690 | $ | 4,574 | |||||
A reconciliation of the statutory Federal income tax rate to the effective tax rate is as follows:
Year Ended | ||||||||
January 4, 2015 | December 29, 2013 | December 30, 2012 | ||||||
Statutory federal income tax rate | 35.0 | % | 35.0 | % | 35.0 | % | ||
Domestic production activities deduction | (1.4 | )% | (7.8 | )% | — | % | ||
Other, net | (0.2 | )% | (1.9 | )% | 0.3 | % | ||
Effective tax rate | 33.4 | % | 25.3 | % | 35.3 | % | ||
Deferred income taxes reflect the net tax effect of temporary differences between amounts recorded for financial reporting purposes and amounts used for tax purposes. The major components of deferred tax assets are as follows (in thousands):
50
January 4, 2015 | December 29, 2013 | ||||||
Deferred tax assets: | |||||||
Current: | |||||||
Reserves and allowances | $ | 883 | $ | 804 | |||
Deferred rent | 91 | 96 | |||||
Inventory | 248 | 261 | |||||
Other | 270 | 190 | |||||
Noncurrent: | |||||||
Stock-based compensation | 5,135 | 7,174 | |||||
Deferred rent | 691 | 768 | |||||
Financing obligation | 171 | 201 | |||||
Other | 343 | 255 | |||||
Gross deferred tax assets | $ | 7,832 | $ | 9,749 | |||
Valuation allowance | (109 | ) | (36 | ) | |||
Gross deferred tax assets, net of valuation allowance | $ | 7,723 | $ | 9,713 | |||
Deferred tax liabilities: | |||||||
Current: | |||||||
Prepaid expenses | $ | (369 | ) | $ | (295 | ) | |
Other | — | (18 | ) | ||||
Noncurrent: | |||||||
Leased building | (182 | ) | (216 | ) | |||
Excess of book over tax depreciation and amortization | (2,985 | ) | (2,676 | ) | |||
Gross deferred tax liabilities | (3,536 | ) | (3,205 | ) | |||
Net deferred tax assets | $ | 4,187 | $ | 6,508 | |||
At January 4, 2015, the Company had foreign net operating loss carryforwards for income tax purposes of approximately $0.4 million. If not utilized the foreign net operating loss carryforwards will begin to expire in 2017.
The Company had a valuation allowance of $109,000 and $36,000 at January 4, 2015 and December 29, 2013, respectively. The valuation allowance relates to foreign net operating losses that would be realizable only upon the generation of future taxable income in the jurisdiction in which the losses were incurred.
Income taxes payable were $1.3 million at January 4, 2015 and were included in accrued liabilities. Prepaid income taxes were $0.2 million at December 29, 2013.
The Company has not provided for deferred taxes on unremitted earnings of subsidiaries outside the United States where such earnings are permanently reinvested. At January 4, 2015, unremitted earnings of foreign subsidiaries were $1.0 million. The amount of unrecognized deferred tax liability associated with these unremitted earnings is approximately $0.3 million. If these earnings were distributed in the form of dividends or otherwise, the Company would be subject to U.S. income taxes less an adjustment for applicable foreign tax credits.
The tax benefit realized for the tax deduction from stock-based compensation totaled $0.9 million, $2.7 million, and $0.6 million for the years ended January 4, 2015, December 29, 2013, and December 30, 2012, respectively.
As of January 4, 2015, the Company had $0.1 million of gross unrecognized tax benefits all of which, if recognized, would affect the effective tax rate. The Company is no longer subject to U.S. federal income tax examinations by tax authorities for years before 2011. The following table summarizes the gross unrecognized tax benefits activity for the fiscal years ended January 4, 2015, December 29, 2013, and December 30, 2012, (in thousands):
51
Year Ended | |||||||||||
January 4, 2015 | December 29, 2013 | December 30, 2012 | |||||||||
Unrecognized tax benefits - beginning balance | $ | 86 | $ | — | $ | — | |||||
Increase related to current year tax positions | 57 | 86 | — | ||||||||
Unrecognized tax benefits - ending balance | $ | 143 | $ | 86 | $ | — | |||||
Note 10. | Income Per Share |
Basic net income per share is based on the weighted average number of common shares outstanding. Diluted net income per share is based on the weighted average number of common shares and common share equivalents outstanding. Common share equivalents included in the computation represent shares issuable upon assumed exercise of outstanding stock options and conversion of unvested restricted stock units except when the effect of their inclusion would be antidilutive.
The following table sets forth the computation of basic and diluted net income per share (in thousands, except per share data):
Year Ended | |||||||||||
January 4, 2015 | December 29, 2013 | December 30, 2012 | |||||||||
Net income | $ | 9,731 | $ | 10,875 | $ | 8,392 | |||||
Weighted average common shares outstanding | 12,144 | 12,540 | 13,204 | ||||||||
Basic net income per share | $ | 0.80 | $ | 0.87 | $ | 0.64 | |||||
Dilutive effect of stock options and restricted stock units | 65 | 220 | 223 | ||||||||
Common stock and common stock equivalents | 12,209 | 12,760 | 13,427 | ||||||||
Diluted net income per share | $ | 0.80 | $ | 0.85 | $ | 0.63 | |||||
The following is a summary of the securities outstanding during the respective periods that have been excluded from the calculations because the effect on net income per share would have been antidilutive (in thousands):
Year Ended | ||
January 4, 2015 | December 29, 2013 | December 30, 2012 |
1,004 | 1,193 | 1,337 |
Note 11. | Segment and Geographic Information |
The Company’s only operating segment is online retail jewelry. The Company sells jewelry to customers within and outside the United States. No customer accounted for 10% or more of the Company’s revenues. Net sales were attributed on the basis of the country to where the product was shipped. Revenue from customers in individual foreign countries was not material to the financial statements.
The tables below represent information by geographic area (in thousands):
52
Year Ended | |||||||||||
January 4, 2015 | December 29, 2013 | December 30, 2012 | |||||||||
Net sales to customers: | |||||||||||
United States | |||||||||||
Engagement | $ | 266,379 | $ | 255,832 | $ | 226,578 | |||||
Non-engagement | 126,018 | 120,988 | 111,070 | ||||||||
Total United States | 392,397 | 376,820 | 337,648 | ||||||||
Other countries | |||||||||||
Engagement | 64,847 | 58,958 | 49,932 | ||||||||
Non-engagement | 16,272 | 14,230 | 12,455 | ||||||||
Total other countries | 81,119 | 73,188 | 62,387 | ||||||||
Total | $ | 473,516 | $ | 450,008 | $ | 400,035 | |||||
Year Ended | |||||||||||
January 4, 2015 | December 29, 2013 | December 30, 2012 | |||||||||
Long-lived assets (net book value): | |||||||||||
United States | $ | 10,403 | $ | 10,026 | $ | 7,803 | |||||
Other countries | 19 | 162 | 73 | ||||||||
Total | $ | 10,422 | $ | 10,188 | $ | 7,876 | |||||
Note 12. Related Party Transactions
Michael Potter, a director of the Company, is a member of the board of directors of zulily, Inc. ("zulily”), an online store offering daily sales of top-quality apparel, gear and other products for moms, babies and kids. Mr. Potter also has an ownership interest in zulily.
The Company did not sell any products to zulily during the fiscal years ended January 4, 2015 and December 29, 2013. The Company sold products to zulily of approximately $9,800 in fiscal year ended December 30, 2012.
As set forth in Note 1, the Company has a minority ownership in two privately-held companies. The Company sold products to one entity for approximately $1.2 million for fiscal year ended January 4, 2015, $1.8 million for fiscal year ended December 29, 2013, and $1.2 million for fiscal year ended December 30, 2012 respectively. The Company had trade receivables due from this entity of approximately $0.1 million at January 4, 2015 and $0.8 million at December 29, 2013 recorded in trade accounts receivable in the consolidated balance sheets. The Company sold products to the other entity for approximately $0.3 million for fiscal year ended January 4, 2015 and approximately $0.1 million for fiscal year ended December 29, 2013. The Company had receivables due from this entity of approximately $6,000 at January 4, 2015 recorded in trade accounts receivable in the consolidated balance sheets. The Company did not have any trade receivables due from this entity as of December 29, 2013.
Note 13. Revolving Line of Credit
On February 11, 2013, the Company entered into a Credit Agreement (the "Credit Agreement") with U.S. Bank National Association (the "Lender"). On February 21, 2014, the Company renewed its Credit Agreement (the "First Loan Modification") with the Lender. The First Loan Modification provides for a $40.0 million (the "New Credit Limit") unsecured, revolving credit facility (the "Renewed Revolving Loan") with an option to increase the borrowing limit by $10.0 million. Under the terms and conditions of the First Loan Modification, the Company may borrow from the Lender for one year with annual renewals at the Lender's discretion. The aggregate principal amounts outstanding at any one time shall not exceed the New Credit Limit. There was a $60,000 modification fee for the Renewed Revolving Loan. Interest on the advances is the daily reset LIBOR rate plus 1.65%.
53
The Renewed Revolving Loan also includes term-out provisions. The term-out provisions include the option to term out the outstanding line balance for a term of up to five years with full amortization. Outstanding term facilities will reduce availability on the revolving line of credit. The term out option will be subject to pro forma compliance with all covenants. Advances made for the purpose of repurchases of the Company’s common stock are required to be termed out at a minimum of $5.0 million. The Company also maintains the option to term out advances for other purposes in any increment. Interest on the termed out advances shall accrue on a fixed or floating basis rates predetermined by the Lender and Borrower.
Pursuant to the terms of the Credit Agreement, the Company must reduce the outstanding balance of the Renewed Revolving Loan to no more than zero for a minimum of 30 consecutive days annually. The Credit Agreement further provides that the Company maintain compliance with certain covenants.
As of the January 4, 2015, there are no amounts outstanding under the Credit Agreement and the Company is in compliance with its covenants under the Credit Agreement.
Note 14. Selected Quarterly Financial Information (unaudited)
Summarized quarterly financial information for fiscal years 2014 and 2013 is as follows (in thousands, except per share data):
Q1 | Q2 | Q3 | Q4 | ||||||||||||
2014 quarter: | |||||||||||||||
Net sales | $ | 103,726 | $ | 106,571 | $ | 105,760 | $ | 157,459 | |||||||
Gross profit | 19,125 | 20,167 | 18,850 | 28,500 | |||||||||||
Net income | 1,079 | 2,171 | 1,650 | 4,831 | |||||||||||
Basic net income per share | 0.08 | 0.18 | 0.14 | 0.41 | |||||||||||
Diluted net income per share | 0.08 | 0.18 | 0.14 | 0.41 | |||||||||||
Q1 | Q2 | Q3 | Q4 | ||||||||||||
2013 quarter: | |||||||||||||||
Net sales | $ | 97,111 | $ | 108,014 | $ | 98,925 | $ | 145,958 | |||||||
Gross profit | 17,646 | 20,097 | 18,687 | 27,221 | |||||||||||
Net income | 832 | 2,206 | 2,906 | 4,931 | |||||||||||
Basic net income per share | 0.07 | 0.18 | 0.23 | 0.38 | |||||||||||
Diluted net income per share | 0.07 | 0.17 | 0.23 | 0.38 | |||||||||||
54
Note 15. | Subsequent Events |
On February 17, 2015, the Company renewed its Credit Agreement with the Lender with essentially the same financial terms as under the First Loan Modification. The Credit Agreement termination date has now been extended to February 28, 2016.
55
BLUE NILE, INC.
SCHEDULE II
VALUATION AND QUALIFYING ACCOUNTS
Description | Balance at Beginning of Period | Charged to Revenue, Costs or Expenses | Deductions (A) | Balance at End of Period | |||||||||||
(In thousands) | |||||||||||||||
Reserve for sales returns: | |||||||||||||||
Year ended: | |||||||||||||||
January 4, 2015 | $ | 1,386 | $ | 49,860 | $ | (50,211 | ) | $ | 1,035 | ||||||
December 29, 2013 | 1,367 | 38,911 | (38,892 | ) | 1,386 | ||||||||||
December 30, 2012 | 1,087 | 36,720 | (36,440 | ) | 1,367 | ||||||||||
____________________
(A) | Deductions for sales returns consist of actual sales returns in each period. |
56
Item 9. | Changes in and Disagreements with Accountants on Accounting and Financial Disclosure |
None.
Item 9A. | Controls and Procedures |
Disclosure Controls and Procedures
Disclosure controls and procedures are controls and other procedures designed to ensure that information required to be disclosed by us in our periodic reports filed with the SEC is recorded, processed, summarized and reported, within the time periods specified by the SEC’s rules and SEC reports. Disclosure controls and procedures include, without limitation, controls and procedures designed to ensure that information required to be disclosed by an issuer in the reports that it files or submits under the Securities Exchange Act of 1934, as amended (the “Exchange Act”), is accumulated and communicated to the issuer’s management, including its principal executive and principal financial officers, or persons performing similar functions, as appropriate to allow timely decisions regarding required disclosure.
As of the end of the period covered by this Annual Report on Form 10-K, an evaluation was performed under the supervision and with the participation of our management, including our chief executive officer and chief financial officer (collectively, our “certifying officers”), of the effectiveness of the design and operation of our disclosure controls and procedures.
Based on their evaluation, our certifying officers concluded that the Company’s disclosure controls and procedures, as defined in Rules 13a-15(e) and 15d-15(e) under the Exchange Act, were effective at the reasonable assurance level as of the end of the period covered by this Annual Report on Form 10-K.
Report of Management on Internal Control over Financial Reporting
Our management is responsible for establishing and maintaining adequate internal control over financial reporting as defined in Rule 13a-15(f) under the Exchange Act. Internal control over financial reporting includes those policies and procedures that (1) pertain to the maintenance of records that in reasonable detail accurately and fairly reflect our transactions and dispositions of our assets; (2) provide reasonable assurance that our transactions are recorded as necessary to permit preparation of financial statements in accordance with generally accepted accounting principles, and that our receipts and expenditures are being made only in accordance with appropriate authorizations; and (3) provide reasonable assurance regarding prevention or timely detection of unauthorized acquisition, use or disposition of our assets that could have a material effect on our financial statements.
Because of its inherent limitations, our internal control over financial reporting may not prevent or detect misstatements. Also, projections of any evaluation of effectiveness to future periods are subject to the risk that controls may become inadequate because of changes in conditions, or that the degree of compliance with the policies or procedures may deteriorate.
Under the supervision and with the participation of our management, including the certifying officers, we assessed the effectiveness of our internal control over financial reporting as of January 4, 2015, using the criteria set forth by the Committee of Sponsoring Organizations of the Treadway Commission (COSO) in Internal Control — Integrated Framework (2013). Based on this assessment, management has concluded that our internal control over financial reporting was effective at the “reasonable assurance” level as of January 4, 2015.
Deloitte & Touche LLP, an independent registered public accounting firm, has audited the effectiveness of our internal control over financial reporting as of January 4, 2015, as stated in their audit report below.
Changes in Internal Control Over Financial Reporting
There were no changes in our internal control over financial reporting during the quarter ended January 4, 2015, that our certifying officers concluded materially affected, or are reasonably likely to materially affect, our internal control over financial reporting.
57
REPORT OF INDEPENDENT REGISTERED PUBLIC ACCOUNTING FIRM
To the Board of Directors and Stockholders of
Blue Nile, Inc.
Seattle, Washington
We have audited the internal control over financial reporting of Blue Nile, Inc. and subsidiaries (the “Company”) as of January 4, 2015, based on criteria established in Internal Control-Integrated Framework (2013) issued by the Committee of Sponsoring Organizations of the Treadway Commission. The Company’s management is responsible for maintaining effective internal control over financial reporting, and for its assessment of the effectiveness of internal control over financial reporting, included in the accompanying Management's Report on Internal Control Over Financial Reporting. Our responsibility is to express an opinion on the Company's internal control over financial reporting based on our audit.
We conducted our audit in accordance with the standards of the Public Company Accounting Oversight Board (United States). Those standards require that we plan and perform the audit to obtain reasonable assurance about whether effective internal control over financial reporting was maintained in all material respects. Our audit included obtaining an understanding of internal control over financial reporting, assessing the risk that a material weakness exists, testing and evaluating the design and operating effectiveness of internal control based on the assessed risk, and performing such other procedures as we considered necessary in the circumstances. We believe that our audit provides a reasonable basis for our opinion.
A company's internal control over financial reporting is a process designed by, or under the supervision of, the company’s principal executive and principal financial officers, or persons performing similar functions, and effected by the company’s board of directors, management, and other personnel to provide reasonable assurance regarding the reliability of financial reporting and the preparation of financial statements for external purposes in accordance with generally accepted accounting principles. A company's internal control over financial reporting includes those policies and procedures that (1) pertain to the maintenance of records that, in reasonable detail, accurately and fairly reflect the transactions and dispositions of the assets of the company; (2) provide reasonable assurance that transactions are recorded as necessary to permit preparation of financial statements in accordance with generally accepted accounting principles, and that receipts and expenditures of the company are being made only in accordance with authorizations of management and directors of the company; and (3) provide reasonable assurance regarding prevention or timely detection of unauthorized acquisition, use, or disposition of the company's assets that could have a material effect on the financial statements.
Because of the inherent limitations of internal control over financial reporting, including the possibility of collusion or improper management override of controls, material misstatements due to error or fraud may not be prevented or detected on a timely basis. Also, projections of any evaluation of effectiveness of the internal control over financial reporting to future periods are subject to the risk that controls may become inadequate because of changes in conditions, or that the degree of compliance with the policies or procedures may deteriorate.
In our opinion, the Company maintained, in all material respects, effective internal control over financial reporting as of January 4, 2015, based on the criteria established in Internal Control-Integrated Framework (2013) issued by the Committee of Sponsoring Organizations of the Treadway Commission.
We also have audited, in accordance with the standards of the Public Company Accounting Oversight Board (United States), the consolidated financial statements and financial statement schedule as of and for the year ended January 4, 2015 of the Company and our report dated March 2, 2015 expressed an unqualified opinion thereon.
/s/ Deloitte & Touche LLP
Seattle, Washington
March 2, 2015
58
Item 9B. | Other Information |
None.
PART III
Item 10. | Directors, Executive Officers and Corporate Governance |
The information required by this Item relating to our executive officers will be contained in our Proxy Statement with respect to our 2015 Annual Meeting of Stockholders under the caption “Executive Officers” and is incorporated herein by reference. The information required by this Item relating to our directors and nominees, including information with respect to audit committee financial experts and our code of ethics, will be contained in our Proxy Statement with respect to our 2015 Annual Meeting of Stockholders under the caption “Election of Directors” and is incorporated herein by reference. The information required by this Item regarding compliance with Section 16(a) of the Securities Exchange Act will be contained in our Proxy Statement with respect to our 2015 Annual Meeting of Stockholders under the caption “Section 16(a) Beneficial Ownership Reporting Compliance” and is incorporated herein by reference. The Proxy Statement will be filed with the Securities and Exchange Commission within 120 days of the end of our fiscal year.
Item 11. | Executive Compensation |
The information required by this Item will be contained in our Proxy Statement with respect to our 2015 Annual Meeting of Stockholders under the captions “Compensation of Executive Officers,” “Compensation Committee Interlocks and Insider Participation,” “Compensation Committee Report” and “Compensation of Directors,” and is incorporated herein by reference. The Proxy Statement will be filed with the Securities and Exchange Commission within 120 days of the end of our fiscal year.
Item 12. | Security Ownership of Certain Beneficial Owners and Management and Related Stockholder Matters |
The information required by this Item will be contained in our Proxy Statement with respect to our 2015 Annual Meeting of Stockholders under the captions “Security Ownership of Certain Beneficial Owners and Management” and “Equity Compensation Plan Information” and is incorporated herein by reference. The Proxy Statement will be filed with the Securities and Exchange Commission within 120 days of the end of our fiscal year.
Item 13. | Certain Relationships and Related Transactions, and Director Independence |
The information required by this Item will be contained in our Proxy Statement with respect to our 2015 Annual Meeting of Stockholders under the captions “Transactions with Related Persons” and “Election of Directors” and is incorporated herein by reference. The Proxy Statement will be filed with the Securities and Exchange Commission within 120 days of the end of our fiscal year.
Item 14. | Principal Accounting Fees and Services |
The information required by this Item will be contained in our Proxy Statement with respect to our 2015 Annual Meeting of Stockholders under the caption “Ratification of Selection of Independent Auditors” and is incorporated herein by reference. The Proxy Statement will be filed with the Securities and Exchange Commission within 120 days of the end of our fiscal year.
59
PART IV
Item 15. | Exhibits, Financial Statement Schedules |
Index to Consolidated Financial Statements
a. The following documents are filed as part of this Annual Report on Form 10-K:
Page | |||
1. | Financial Statements: | ||
2. | Financial Statement Schedule: | ||
All other schedules are omitted because they are not applicable or the required information is shown in the financial statements or notes thereto. | |||
3. | Exhibits: | ||
The exhibits listed in the Index to Exhibits, which appears immediately following the signature page and is incorporated herein by reference, are filed as part of this Annual Report on Form 10-K. | |||
60
SIGNATURES
Pursuant to the requirements of Section 13 or 15(d) of the Securities Exchange Act of 1934, the registrant has duly caused this Annual Report on Form 10-K to be signed on its behalf by the undersigned, thereunto duly authorized.
Date: March 2, 2015
Blue Nile, Inc. | ||
(Registrant) | ||
By | /s/ David Binder | |
David Binder | ||
Chief Financial Officer | ||
(Principal Financial Officer) | ||
POWER OF ATTORNEY
KNOW ALL PERSONS BY THESE PRESENTS, that each person whose signature appears below constitutes and appoints Harvey Kanter and David Binder, and each or any one of them, his or her true and lawful attorney-in-fact and agent, with full power of substitution and resubstitution, for him or her and in his or her name, place and stead, in any and all capacities, to sign any and all amendments (including posting effective amendments) to this Annual Report on Form 10-K, and to file the same, with all exhibits thereto, and other documents in connection therewith, with the Securities and Exchange Commission, granting unto said attorneys-in-facts and agents, and each of them, full power and authority to do and perform each and every act and thing requisite and necessary to be done in connection therewith, as fully to all intents and purposes as he or she might or could do in person, hereby ratifying and confirming all that said attorneys-in-fact and agents, or any of them, or their or his or her substitutes or substitutes, may lawfully do or cause to be done by virtue hereof.
This Annual Report on Form 10-K has been signed below by the following persons on behalf of the registrant and in the capacities and on the dates indicated, pursuant to the requirements of the Securities Exchange Act of 1934.
By | /s/ Harvey Kanter | March 2, 2015 | ||||
Harvey Kanter, Chief Executive Officer, President and Chairman of the Board (Principal Executive Officer) | ||||||
By | /s/ David Binder | March 2, 2015 | ||||
David Binder, Chief Financial Officer (Principal Financial Officer) | ||||||
By | /s/ Chris Bruzzo | February 26, 2015 | ||||
Chris Bruzzo, Director | ||||||
By | /s/ Scott Howe | February 25, 2015 | ||||
Scott Howe, Director | ||||||
By | /s/ Leslie Lane | February 27, 2015 | ||||
Leslie Lane, Director | ||||||
61
By | /s/ Mindy Meads | February 25, 2015 | ||||
Mindy Meads, Director | ||||||
By | /s/ Michael Potter | February 25, 2015 | ||||
Michael Potter, Director | ||||||
By | /s/ Steve Scheid | February 25, 2015 | ||||
Steve Scheid, Director | ||||||
By | /s/ Mary Alice Taylor | February 25, 2015 | ||||
Mary Alice Taylor, Director | ||||||
By | ||||||
Robert van Schoonenberg, Director | ||||||
62
EXHIBIT INDEX
The following exhibits are filed as part of this Annual Report on Form 10-K or are incorporated herein by reference. Where an exhibit is incorporated by reference, the number in parentheses indicates the document to which cross-reference is made. See the end of this exhibit index for a listing of cross-reference documents.
Exhibit Number | Description | |
3.1(1) | Amended and Restated Certificate of Incorporation of Blue Nile, Inc. | |
3.2(2) | Amended and Restated Bylaws of Blue Nile, Inc. | |
4.1 | Reference is made to Exhibits 3.1, and 3.2. | |
4.2(3) | Specimen Stock Certificate. | |
10.1.1(21)* | Blue Nile, Inc. Amended and Restated 1999 Equity Incentive Plan. | |
10.1.2(21)* | Form of Stock Option Agreement pursuant to the Blue Nile, Inc. 1999 Equity Incentive Plan. | |
10.2(10)* | Third Amended and Restated 2004 Non-Employee Directors’ Stock Option Plan. | |
10.3(21)* | Blue Nile, Inc. 2004 Employee Stock Purchase Plan. | |
10.4.1(11)* | Blue Nile, Inc. 2004 Equity Incentive Plan. | |
10.4.2(32)* | Form of Option Agreement pursuant to the 2004 Equity Incentive Plan. | |
10.4.3(32)* | Form of Stock Option Grant Notice-Employee pursuant to the 2004 Equity Incentive Plan. | |
10.4.4(32)* | Form of Stock Option Grant Notice-Non-Employee Director pursuant to the 2004 Equity Incentive Plan. | |
10.4.5(32)* | Form of Restricted Stock Unit Grant Notice-Employee under the Blue Nile, Inc. 2004 Equity Incentive Plan. | |
10.4.6(32)* | Form of Restricted Stock Unit Grant Notice-Non-Employee Director under the Blue Nile, Inc. 2004 Equity Incentive Plan. | |
10.4.7(32)* | Form of Restricted Unit Award Agreement under the Blue Nile, Inc. 2004 Equity Incentive Plan. | |
10.5.1(22)* | Blue Nile, Inc. 2013 Equity Incentive Plan. | |
10.5.2(23)* | Form of Option Agreement pursuant to the 2013 Equity Incentive Plan. | |
10.5.3(24)* | Form of Stock Option Grant Notice-Employee pursuant to the 2013 Equity Incentive Plan. | |
10.5.4(25)* | Form of Stock Option Grant Notice-Non-Employee Director pursuant to the 2013 Equity Incentive Plan. | |
10.5.5(26)* | Form of Restricted Stock Unit Grant Notice-Employee under the Blue Nile, Inc. 2013 Equity Incentive Plan. | |
10.5.6(27)* | Form of Restricted Stock Unit Grant Notice-Non-Employee Director under the Blue Nile, Inc. 2013 Equity Incentive Plan. | |
10.5.7(28)* | Form of Restricted Unit Award Agreement under the Blue Nile, Inc. 2013 Equity Incentive Plan. | |
10.6(13) | Lease Agreement, dated January 6, 2011, between Merrill Place LLC and the registrant. | |
10.6.1(11) | Lease, dated June 28, 2001, between Gull Industries, Inc. and the registrant. | |
10.6.2(11) | First Amendment to Lease, dated December 11, 2002 between Gull Industries, Inc. and the registrant. | |
10.6.3(11) | Second Amendment to Lease, dated November 15, 2003, between Gull Industries, Inc. and the registrant. | |
10.6.4(29) | First Amendment to Lease, dated April 1, 2012 between AGNM Merrill Place, LLC., and the registrant. | |
63
Exhibit Number | Description | |
10.6.5(30) | Second Amendment to Lease, dated November 14, 2012 between AGNM Merrill Place, LLC., and the registrant. | |
10.7(7) | Commercial lease, dated July 21, 2006, between Gull Industries, Inc. and the registrant. | |
10.7.1(8) | First Amendment to Commercial Lease, dated May 19, 2011 between 5901 Fourth LLC and the registrant. | |
10.7.2(15) | Third Amendment to Lease, dated May 5, 2014, between 5901 Fourth LLC and the registrant. | |
10.8(6)* | Offer Letter with Harvey Kanter, dated March 2, 2012. | |
10.9(31)* | Severance Agreement between Blue Nile, Inc. and Vijay Talwar, dated March 5, 2014. | |
10.10(9)* | Offer Letter with David Binder, dated June 30, 2011. | |
10.12(16)* | Offer Letter with Julie Yoakum, dated June 7, 2012. | |
10.13(5)* | Blue Nile Inc. Indemnification Agreement. | |
10.14(17)* | Performance Bonus Plan. | |
10.15(12)* | Amended and Restated Change of Control Severance Plan. | |
10.16(19) | Credit Agreement Between Blue Nile, Inc. and U.S. Bank National Association dated February 11, 2013. | |
10.17(21) | First Loan Modification Agreement Between Blue Nile, Inc. and U.S. Bank National Association dated February 21, 2014. | |
10.18(33) | Second Loan Modification Agreement Between Blue Nile, Inc. and U.S. Bank National Association dated February 17, 2015. | |
10.19(18)* | Executive Cash Bonus Plan for Fiscal Year 2014. | |
10.20(20)* | Executive Cash Bonus Plan for Fiscal Year 2015. | |
10.21(34)* | 2015 Change of Control Severance Plan | |
10.22(35)* | 2014 Compensation Program for Non-Employee Directors. | |
21.1(4) | Subsidiaries of the Registrant. | |
23.1(4) | Consent of Deloitte & Touche LLP. | |
24.1 | Powers of Attorney of Officers and Directors signing this Annual Report on Form 10-K (see page 60). | |
31.1(4) | Certification of Principal Chief Executive Officer Required Under Rule 13a-14(a) or Rule 15d-14(a) of the Securities Exchange Act of 1934, as amended. | |
31.2(4) | Certification of Principal Financial Officer Required Under Rule 13a-14(a) or Rule 15d-14(a) of the Securities Exchange Act of 1934, as amended. | |
32.1(14) | Certification of Principal Chief Executive Officer Required Under Rule 13a-14(b) or Rule 15d-14(b) of the Securities Exchange Act of 1934, as amended, and 18 U.S.C. Section 1350. | |
32.2 (14) | Certification of Principal Financial Officer Required Under Rule 13a-14(b) or Rule 15d-14(b) of the Securities Exchange Act of 1934, as amended, and 18 U.S.C. Section 1350. | |
101.INS | XBRL Instance Document | |
101.SCH | XBRL Taxonomy Extension Schema Document | |
101.CAL | XBRL Taxonomy Extension Calculation Linkbase Document | |
101.LAB | XBRL Taxonomy Extension Label Linkbase Document | |
101.PRE | XBRL Taxonomy Extension Presentation Linkbase Document | |
101.DEF | XBRL Taxonomy Extension Definition Linkbase Document | |
____________________
64
* | Denotes a management contract or compensatory plan, contract or agreement, in which the Company’s directors or executive officers may participate. |
(1) | Previously filed as Exhibit 3.1 to Blue Nile, Inc.’s Quarterly Report on Form 10-Q for the quarterly period ended July 4, 2004 (No. 000-50763), as filed with the Securities and Exchange Commission on August 6, 2004, and incorporated by reference herein. |
(2) | Previously filed as the like numbered exhibit to Blue Nile, Inc.’s Current Report on Form 8-K (No. 000-50763), as filed with the Securities and Exchange Commission on November 9, 2009, and incorporated by reference herein. |
(3) | Previously filed as Exhibit 4.2 to Blue Nile, Inc.’s Registration Statement on Form S-1/A (No. 333-113494), as filed with the Securities and Exchange Commission on May 4, 2004, as amended, and incorporated by reference herein. |
(4) | Filed herewith. |
(5) | Previously filed as Exhibit 10.1 to Blue Nile, Inc.’s Current Report on Form 8-K (No. 000-50763), as filed with the Securities and Exchange Commission on May 7, 2012, and incorporated by reference herein. |
(6) | Previously filed as Exhibit 10.1 to Blue Nile, Inc.’s Current Report on Form 8-K (No. 000-50763), as filed with the Securities and Exchange Commission on March 19, 2012, and incorporated by reference herein. |
(7) | Previously filed as Exhibit 10.1 to Blue Nile, Inc.’s Current Report on Form 8-K (No. 000-50763), as filed with the Securities and Exchange Commission on July 27, 2006, and incorporated by reference herein. |
(8) | Previously filed as Exhibit 10.1 to Blue Nile, Inc.’s Current Report on Form 8-K (No. 000-50763), as filed with the Securities and Exchange Commission on May 23, 2011, and incorporated by reference herein. |
(9) | Previously filed as Exhibit 10.1 to Blue Nile, Inc.’s Current Report on Form 8-K (No. 000-50763), as filed with the Securities and Exchange Commission on July 21, 2011, and incorporated by reference herein. |
(10) | Previously filed as Exhibit 10.1 to Blue Nile, Inc.’s Quarterly Report on Form 10-Q (No. 000-50763) as filed with the Securities and Exchange Commission on November 7, 2008, and incorporated by reference herein. |
(11) | Previously filed as the like numbered exhibit to Blue Nile, Inc.’s Registration Statement on Form S-1/A (No. 333-113494), as filed with the Securities and Exchange Commission on April 19, 2004, as amended, and incorporated by reference herein. |
(12) | Previously filed as Exhibit 10.20 to Blue Nile, Inc.'s Annual Report on Form 10-K (No. 000-50763), as filed with the Securities and Exchange Commission on February 27, 2012, and incorporated by reference herein. |
(13) | Previously filed as Exhibit 10.8 to Blue Nile, Inc.’s Annual Report on Form 10-K (No. 000-50763), as filed with the Securities and Exchange Commission on February 28, 2011, and incorporated by reference herein. |
(14) | Filed herewith. The certifications attached as Exhibits 32.1 and 32.2 accompany this Annual Report on Form 10-K pursuant to Section 906 of the Sarbanes-Oxley Act of 2002 and shall not be deemed “filed” by Blue Nile, Inc. for purposes of Section 18 of the Securities Exchange Act of 1934, as amended. |
(15) | Previously filed as Exhibit 10.4 to Blue Nile, Inc.’s Quarterly Report on Form 10-Q (No. 000-50763), as filed with the Securities and Exchange Commission on May 6, 2014 and incorporated by reference herein. |
(16) | Previously filed as Exhibit 10.5 to Blue Nile, Inc.’s Quarterly Report on Form 10-Q (No. 000-50763), as filed with the Securities and Exchange Commission on August 7, 2012 and incorporated by reference herein. |
(17) | Previously filed as Exhibit 10.1 to Blue Nile Inc.'s Current Report on Form 8-K (No. 000-50763) as filed with the Securities and Exchange Commission on May 25, 2010 and incorporated by reference herein. |
(18) | Previously filed as Exhibit 10.1 to Blue Nile, Inc.’s Current Report on Form 8-K (No. 000-50763), as filed with the Securities and Exchange Commission on March 26, 2014, and incorporated by reference herein. |
(19) | Previously filed as Exhibit 10.1 to Blue Nile, Inc.’s Current Report on Form 8-K (No. 000-50763), as filed with the Securities and Exchange Commission on February 12, 2013, and incorporated by reference herein. |
(20) | Previously filed as Exhibit 10.1 to Blue Nile, Inc.’s Current Report on Form 8-K (No. 000-50763), as filed with the Securities and Exchange Commission on February 10, 2015, and incorporated by reference herein. |
(21) | Previously filed as Exhibit 10.17 to Blue Nile, Inc.'s Annual Report on Form 10-K (No. 000-50763), as filed with the Securities and Exchange Commission on February 25, 2014, and incorporated by reference herein. |
65
(22) | Previously filed as Exhibit 99.1.1 to Blue Nile, Inc.’s Registration Statement on Form S-8 (No. 333-188740), as filed with the Securities and Exchange Commission on May 21, 2013, and incorporated by reference herein. |
(23) | Previously filed as Exhibit 99.1.2 to Blue Nile, Inc.’s Registration Statement on Form S-8 (No. 333-188740), as filed with the Securities and Exchange Commission on May 21, 2013, and incorporated by reference herein. |
(24) | Previously filed as Exhibit 99.1.3 to Blue Nile, Inc.’s Registration Statement on Form S-8 (No. 333-188740), as filed with the Securities and Exchange Commission on May 21, 2013, and incorporated by reference herein. |
(25) | Previously filed as Exhibit 99.1.4 to Blue Nile, Inc.’s Registration Statement on Form S-8 (No. 333-188740), as filed with the Securities and Exchange Commission on May 21, 2013, and incorporated by reference herein. |
(26) | Previously filed as Exhibit 99.1.5 to Blue Nile, Inc.’s Registration Statement on Form S-8 (No. 333-188740), as filed with the Securities and Exchange Commission on May 21, 2013, and incorporated by reference herein. |
(27) | Previously filed as Exhibit 99.1.6 to Blue Nile, Inc.’s Registration Statement on Form S-8 (No. 333-188740), as filed with the Securities and Exchange Commission on May 21, 2013, and incorporated by reference herein. |
(28) | Previously filed as Exhibit 99.1.7 to Blue Nile, Inc.’s Registration Statement on Form S-8 (No. 333-188740), as filed with the Securities and Exchange Commission on May 21, 2013, and incorporated by reference herein. |
(29) | Previously filed as Exhibit 10.5.1 to Blue Nile, Inc.'s Annual Report on Form 10-K (No. 000-50763), as filed with the Securities and Exchange Commission on February 25, 2013, and incorporated by reference herein. |
(30) | Previously filed as Exhibit 10.5.2 to Blue Nile, Inc.'s Annual Report on Form 10-K (No. 000-50763), as filed with the Securities and Exchange Commission on February 25, 2013, and incorporated by reference herein. |
(31) | Previously filed as Exhibit 10.1 to Blue Nile, Inc.’s Current Report on Form 8-K (No. 000-50763), as filed with the Securities and Exchange Commission on March 18, 2014, and incorporated by reference herein. |
(32) Previously filed as the like numbered exhibit to Blue Nile, Inc.’s Annual Report on Form 10-K (No. 000-50763), as filed with the Securities and Exchange Commission on February 25, 2013, and incorporated by reference herein.
(33) Previously filed as Exhibit 10.1 to Blue Nile, Inc.’s Current Report on Form 8-K (No. 000-50763), as filed with the Securities and Exchange Commission on February 20, 2015, and incorporated by reference herein.
(34) Previously filed as Exhibit 10.1 to Blue Nile, Inc.’s Current Report on Form 8-K (No. 000-50763), as filed with the Securities and Exchange Commission on January 23, 2015, and incorporated by reference herein.
(35) Previously filed as Exhibit 10.1 to Blue Nile, Inc.’s Quarterly Report on Form 10-Q (No. 000-50763), as filed with the Securities and Exchange Commission on August 7, 2014 and incorporated by reference herein.
66