Attached files
| file | filename |
|---|---|
| 8-K - OM ASSET MANAGEMENT PLC 8-K - BrightSphere Investment Group plc | a51046813.htm |
| EX-99.1 - EXHIBIT 99.1 - BrightSphere Investment Group plc | a51046813_ex991.htm |
Exhibit 99.2
 4Q 2014 EARNINGS PRESENTATION February 27, 2015 OMAM
DISCLAIMER 2 Forward Looking Statements This presentation may contain forward looking statements for the purposes of the safe harbor provision under the Private Securities Litigation Reform Act of 1995. Forward‐looking statements are identified by words such as “expect,” “anticipate,” “may,” “intends,” “believes,” “estimate,” “project,” and other similar expressions. Such statements involve a number of risks, uncertainties and other factors that could cause actual results to differ materially from these forward looking statements. These factors include, but are not limited to, the factors described in OMAM’s filings made with the Securities and Exchange Commission, including our Prospectus, as filed with the SEC on October 9, 2014, under the heading “Risk Factors.” Any forward‐looking statements in this presentation are based on assumptions as of today and we undertake no obligation to update these statements as a result of new information or future events. We urge you not to place undue reliance on any forwardlooking statements. Non‐GAAP Financial Measures This presentation may contain non‐GAAP financial measures. A reconciliation of GAAP to non‐GAAP measures is included in the presentation.
OVERVIEW AND HIGHLIGHTS 3 • 2014 ENI of $1.26 per share up 24% from $1.02 per share in 2013; 4Q ENI of $0.39 per share up 44% over prior period ENI of $0.27 per share • AUM of $221 billion up 11% from year‐end 2013 and 3% from end of 3Q • Net Client Cash Flows of $9.5 billion for 2014 and $3.8 billion for 4Q – 4.8% organic growth on beginning of year AUM – Full year annualized revenue impact of $54.5 million • Performance remains strong with AUM representing 63%, 66% and 78% of revenue outperforming benchmark on a 1‐, 3‐, and 5‐yr basis • $0.08 per share dividend approved for 4Q, payable on March 31 Please see definitions and additional notes.
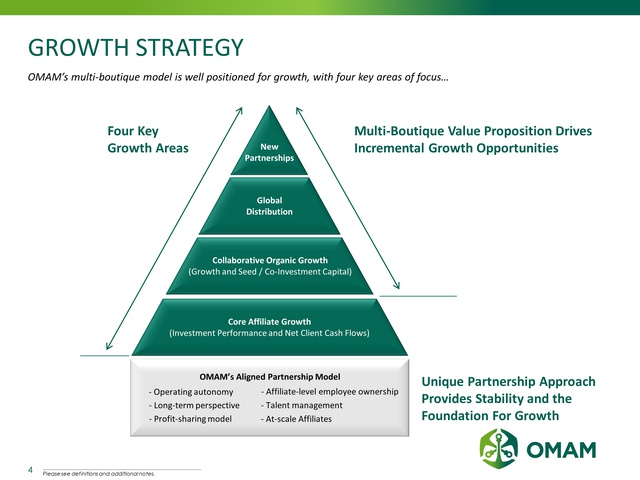
GROWTH STRATEGY 4 OMAM’s multi‐boutique model is well positioned for growth, with four key areas of focus… Global Distribution New Partnerships Collaborative Organic Growth (Growth and Seed / Co‐Investment Capital) Core Affiliate Growth (Investment Performance and Net Client Cash Flows) OMAM’s Aligned Partnership Model ‐ Affiliate‐level employee ownership ‐ Long‐term perspective ‐ Talent management ‐ Operating autonomy ‐ Profit‐sharing model ‐ At‐scale Affiliates Four Key Growth Areas Unique Partnership Approach Provides Stability and the Foundation For Growth Multi‐Boutique Value Proposition Drives Incremental Growth Opportunities Please see definitions and additional notes.
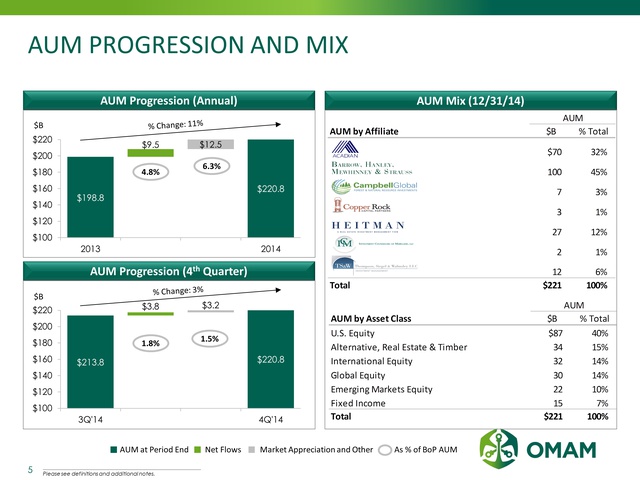
AUM PROGRESSION AND MIX 5 AUM at Period End Net Flows Market Appreciation and Other As % of BoP AUM AUM Progression (Annual) $198.8 $220.8 $9.5 $12.5 $100 $120 $140 $160 $180 $200 $220 2013 2014 4.8% 6.3% $B AUM Progression (4th Quarter) $213.8 $220.8 $3.8 $3.2 $100 $120 $140 $160 $180 $200 $220 3Q'14 4Q'14 $B 1.8% 1.5% AUM Mix (12/31/14) AUM AUM by Affiliate $B % Total $70 32% 100 45% 7 3% 3 1% 27 12% 2 1% 12 6% Total $221 100% Please see definitions and additional notes. % Change: 11% % Change:3% AUM by Asset Class U.S. Equity Alternative, Real Estate & Timber International Equity Global Equity Emerging Markets Equity Fixed Income Total AUM by Asset Class $B % Total U.S. Equity $87 40% Alternative, Real Estate & Timber 34 15% International Equity 32 14% Global Equity 30 14% Emerging Markets Equity 22 10% Fixed Income 15 7% Total $221 100% ACADIAN BARROW, HANLEY, MEWHINNEY & STRAUSS CampbellGlobal Copper Rock HEITMAN ICM TS&W
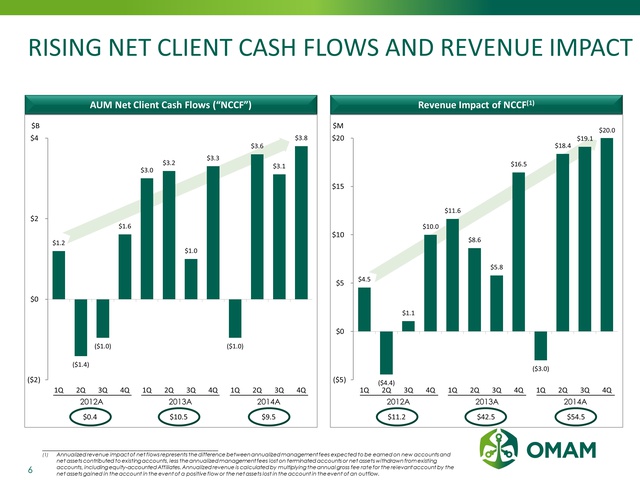
RISING NET CLIENT CASH FLOWS AND REVENUE IMPACT 6 $4.5 ($4.4) $1.1 $10.0 $11.6 $8.6 $5.8 $16.5 ($3.0) $18.4 $19.1 $20.0 ($5) $0 $5 $10 $15 $20 1Q 2Q 3Q 4Q 1Q 2Q 3Q 4Q 1Q 2Q 3Q 4Q $1.2 ($1.4) ($1.0) $1.6 $3.0 $3.2 $1.0 $3.3 ($1.0) $3.6 $3.1 $3.8 ($2) $0 $2 $4 1Q 2Q 3Q 4Q 1Q 2Q 3Q 4Q 1Q 2Q 3Q 4Q AUM Net Client Cash Flows (“NCCF”) Revenue Impact of NCCF(1) $B $M 2012A 2013A 2014A $0.4 $10.5 $9.5 2012A 2013A 2014A $11.2 $42.5 $54.5 (1) Annualized revenue impact of net flows represents the difference between annualized management fees expected to be earned on new accounts and net assets contributed to existing accounts, less the annualized management fees lost on terminated accounts or net assets withdrawn from existing accounts, including equity-accounted Affiliates. Annualized revenue is calculated by multiplying the annual gross fee rate for the relevant account by the net assets gained in the account in the event of a positive flow or the net assets lost in the account in the event of an outflow.
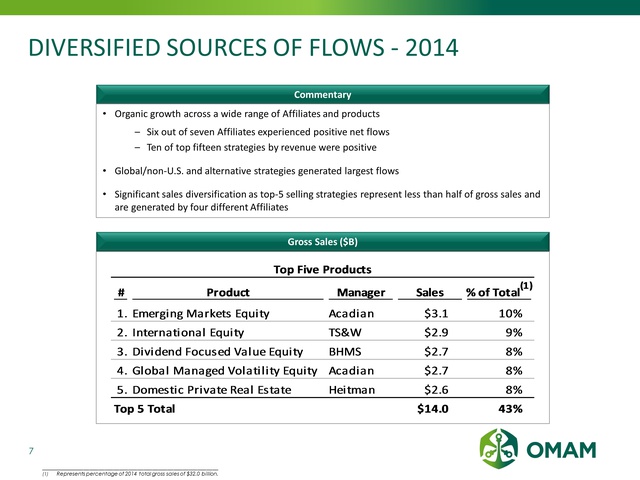
DIVERSIFIED SOURCES OF FLOWS ‐ 2014 7 Gross Sales $B Commentary Top Five Products # Product Manager Sales % of Total(1) 1. Emerging Markets Equity Acadian $3.1 10% 2. International Equity TS&W $2.9 9% 3. Dividend Focused Value Equity BHMS $2.7 8% 4. Global Managed Volatility Equity Acadian $2.7 8% 5. Domestic Private Real Estate Heitman $2.6 8% Top 5 Total $14.0 43% • Organic growth across a wide range of Affiliates and products – Six out of seven Affiliates experienced positive net flows – Ten of top fifteen strategies by revenue were positive • Global/non‐U.S. and alternative strategies generated largest flows • Significant sales diversification as top‐5 selling strategies represent less than half of gross sales and are generated by four different Affiliates (1) Represents percentage of 2014 total gross sales of $32.0 billion
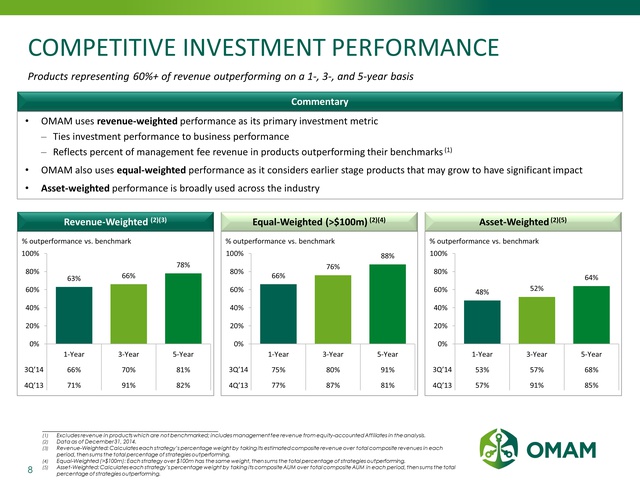
66% 78% 0% 20% 40% 60% 80% 100% 1‐Year 3‐Year 5‐Year 66% 70% 81% 71% 91% 82% COMPETITIVE INVESTMENT PERFORMANCE 8 48% 52% 64% 0% 20% 40% 60% 80% 100% 1‐Year 3‐Year 5‐Year 53% 57% 68% 57% 91% 85% 66% 76% 88% 0% 20% 40% 60% 80% 100% 1‐Year 3‐Year 5‐Year 75% 80% 91% 77% 87% 81% • OMAM uses revenue‐weighted performance as its primary investment metric ‒ Ties investment performance to business performance ‒ Reflects percent of management fee revenue in products outperforming their benchmarks (1) • OMAM also uses equal‐weighted performance as it considers earlier stage products that may grow to have significant impact • Asset‐weighted performance is broadly used across the industry (1) Excludes revenue in products which are not benchmarked; includes management fee revenue from equity-accounted Affiliates in the analysis. (2) Data as of December 31, 2014. (3) Revenue-Weighted: Calculates each strategy’s percentage weight by taking its estimated composite revenue over total composite revenues in each period, then sums the total percentage of strategies outperforming. (4) Equal-Weighted (>$100m): Each strategy over $100m has the same weight, then sums the total percentage of strategies outperforming. (5) Asset-Weighted: Calculates each strategy’s percentage weight by taking its composite AUM over total composite AUM in each period, then sums the total percentage of strategies outperforming. Commentary Equal‐Revenue‐Weighted (2)(3) Weighted (>$100m) (2)(4) Asset‐Weighted (2)(5) % outperformance vs. benchmark % outperformance vs. benchmark % outperformance vs. benchmark Products representing 60%+ of revenue outperforming on a 1‐, 3‐, and 5‐year basis 3Q’14 4Q’13 3Q’14 4Q’13 3Q’14 4Q’13
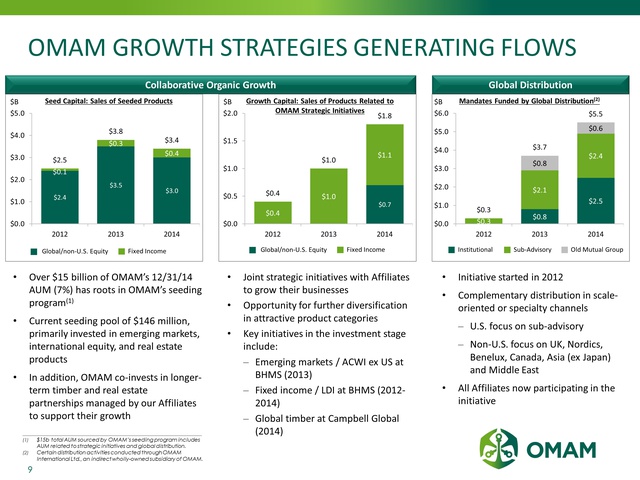
OMAM GROWTH STRATEGIES GENERATING FLOWS 9 Collaborative Organic Growth Global Distribution Mandates Funded by Global Distribution $0.8 $2.5 $0.3 $2.1 $2.4 $0.8 $0.6 $0.3 $3.7 $5.5 $0.0 $1.0 $2.0 $3.0 $4.0 $5.0 $6.0 2012 2013 2014 Institutional Sub‐Advisory Old Mutual Group Seed Capital: Sales of Products Seeded by OMAM Growth Capital: Sales of Products Related to OMAM Strategic Initiatives • Over $15 billion of OMAM’s 12/31/14 AUM (7%) has roots in OMAM’s seeding program(1) • Current seeding pool of $146 million, primarily invested in emerging markets products, international equity, and real estate • In addition, OMAM co‐invests in longerterm timber and real estate partnerships managed by our Affiliates to support their growth • Joint strategic initiatives with Affiliates to grow their businesses • Opportunity for further diversification in attractive product categories • Key initiatives in the investment stage include: ‒ Emerging markets / ACWI ex US at BHMS (2013) ‒ Fixed income / LDI at BHMS (2012‐ 2014) ‒ Global timber at Campbell Global (2014) • Initiative started in 2012 • Complementary distribution in scaleoriented or specialty channels ‒ US focus on sub‐advisory ‒ Non‐US focus on UK, Nordics, Benelux, Canada, Asia (ex Japan) and Middle East • All Affiliates now participating in the initiative $2.4 $3.5 $3.0 $0.1 $0.3 $0.4 $2.5 $3.8 $3.4 $0.0 $1.0 $2.0 $3.0 $4.0 $5.0 2012 2013 2014 $0.7 $0.4 $1.0 $1.1 $0.4 $1.0 $1.8 $0.0 $0.5 $1.0 $1.5 $2.0 2012 2013 2014 Fixed Income $B $B $B (1) $15b total AUM sourced by OMAM’s seeding program includes AUM related to strategic initiatives and global distribution. Global/Non U.S. Equity Fixed Income Global/Non U.S. Equity
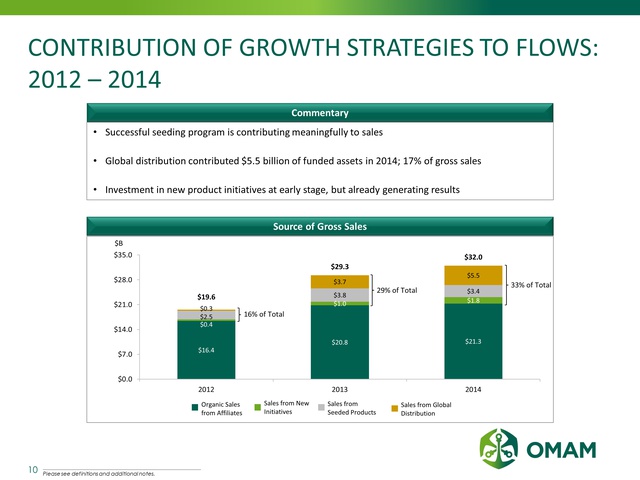
CONTRIBUTION OF GROWTH STRATEGIES TO FLOWS: 2012 – 2014 10 Source of Gross Sales Commentary • Successful seeding program is contributing meaningfully to sales • Global distribution contributed $5.5 billion of funded assets in 2014; 17% of gross sales • Investment in new product initiatives at early stage, but already generating results $16.4 $20.8 $21.3 $0.4 $1.0 $1.8 $2.5 $3.8 $3.4 $0.3 $3.7 $5.5 $19.6 $29.3 $32.0 $0.0 $7.0 $14.0 $21.0 $28.0 $35.0 2012 2013 2014 Sales from New Initiatives Sales from Seeded Products Organic Sales from Affiliates Sales from Global Distribution $B 16% of Total 29% of Total 33% of Total Please see definitions and additional notes.
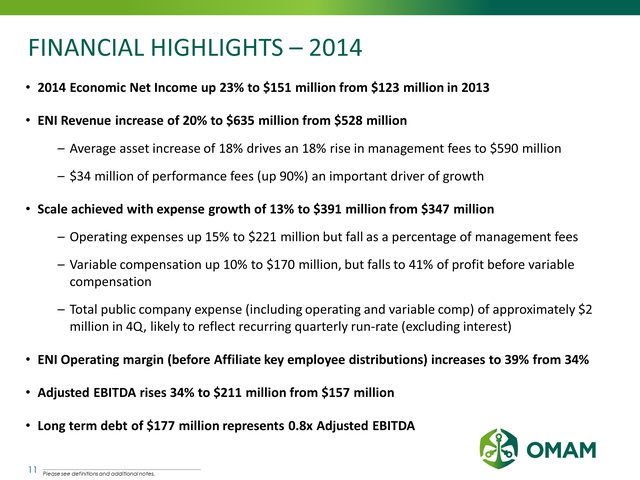
FINANCIAL HIGHLIGHTS – 2014 11 • 2014 Economic Net Income up 23% to $151 million from $123 million in 2013 • ENI Revenue increase of 20% to $635 million from $528 million – Average asset increase of 18% drives an 18% rise in management fees to $590 million – $34 million of performance fees (up 90%) an important driver of growth • Scale achieved with expense growth of 13% to $391 million from $347 million – Operating expenses up 15% to $221 million but fall as a percentage of management fees – Variable compensation up 10% to $170 million, but fall to 41% of profit before variable compensation – Total public company expense (including operating and variable comp) of approximately $2 million in 4Q, likely to reflect recurring quarterly run‐rate (excluding interest) • ENI Operating margin (before Affiliate key employee distributions) increases to 39% from 34% • Adjusted EBITDA rises 34% to $211 million from $157 million • Long term debt of $177 million represents 0.8x Adjusted EBITDA Please see definitions and additional notes.
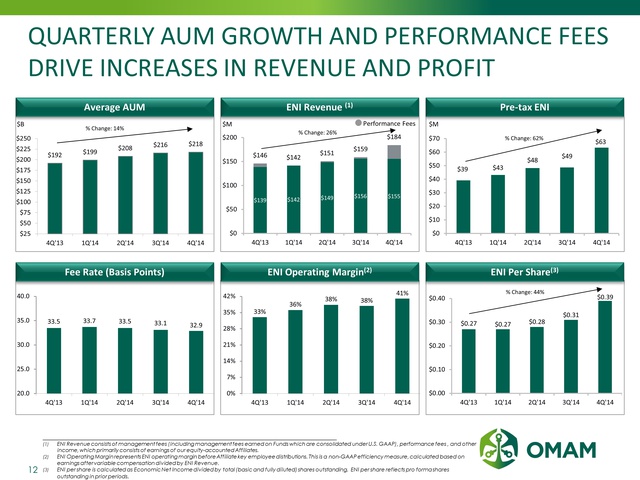
QUARTERLY AUM GROWTH AND PERFORMANCE FEES DRIVE INCREASES IN REVENUE AND PROFIT 12 Average AUM ENI Revenue (1) Pre‐tax ENI (1) ENI Revenue consists of management fees (including management fees earned on Funds which are consolidated under U.S. GAAP), performance fees , and other income, which primarily consists of earnings of our equity-accounted Affiliates. (2) ENI Operating Margin represents ENI operating margin before Affiliate key employee distributions. This is a non-GAAP efficiency measure, calculated based on earnings after variable compensation divided by ENI Revenue. (3) ENI per share is calculated as Economic Net Income divided by total (basic and fully diluted) shares outstanding. ENI per share reflects pro forma shares outstanding in prior periods. $M $0.27 $0.27 $0.28 $0.31 $0.39 $0.00 $0.10 $0.20 $0.30 $0.40 4Q'13 1Q'14 2Q'14 3Q'14 4Q'14 Fee Rate (Basis Points) $B $M % Change: 44% Performance Fees ENI Operating Margin(2) ENI Per Share(3) $192 $199 $208 $216 $218 $25 $50 $75 $100 $125 $150 $175 $200 $225 $250 4Q'13 1Q'14 2Q'14 3Q'14 4Q'14 % Change: 14% $139 $142 $149 $156 $155 $146 $142 $151 $159 $184 $0 $50 $100 $150 $200 4Q'13 1Q'14 2Q'14 3Q'14 4Q'14 % Change: 26% $39 $43 $48 $49 $63 $0 $10 $20 $30 $40 $50 $60 $70 4Q'13 1Q'14 2Q'14 3Q'14 4Q'14 % Change: 62% 33.5 33.7 33.5 33.1 32.9 20.0 25.0 30.0 35.0 40.0 4Q'13 1Q'14 2Q'14 3Q'14 4Q'14 33% 36% 38% 38% 41% 0% 7% 14% 21% 28% 35% 42% 4Q'13 1Q'14 2Q'14 3Q'14 4Q'14
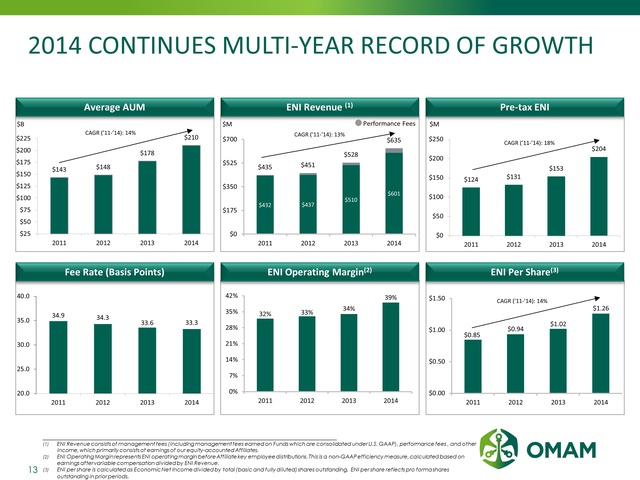
2014 CONTINUES MULTI‐YEAR RECORD OF GROWTH 13 $124 $131 $153 $204 $0 $50 $100 $150 $200 $250 2011 2012 2013 2014 34.9 34.3 33.6 33.3 20.0 25.0 30.0 35.0 40.0 2011 2012 2013 2014 Average AUM ENI Revenue (1) Pre‐tax ENI $143 $148 $178 $210 $25 $50 $75 $100 $125 $150 $175 $200 $225 2011 2012 2013 2014 $432 $437 $510 $601 $435 $451 $528 $635 $0 $175 $350 $525 $700 2011 2012 2013 2014 $M 32% 33% 34% 39% 0% 7% 14% 21% 28% 35% 42% 2011 2012 2013 2014 CAGR (’11‐’14): 13% $0.85 $0.94 $1.02 $1.26 $0.00 $0.50 $1.00 $1.50 2011 2012 2013 2014 Fee Rate (Basis Points) $B CAGR (’11‐’14): 14% CAGR (’11‐’14): 18% $M CAGR (’11‐’14): 14% Performance Fees ENI Operating Margin(2) ENI Per Share(3) (1) ENI Revenue consists of management fees (including management fees earned on Funds which are consolidated under U.S. GAAP), performance fees , and other income, which primarily consists of earnings of our equity-accounted Affiliates. (2) ENI Operating Margin represents ENI operating margin before Affiliate key employee distributions. This is a non-GAAP efficiency measure, calculated based on earnings after variable compensation divided by ENI Revenue. (3) ENI per share is calculated as Economic Net Income divided by total (basic and fully diluted) shares outstanding. ENI per share reflects pro forma shares outstanding in prior periods.
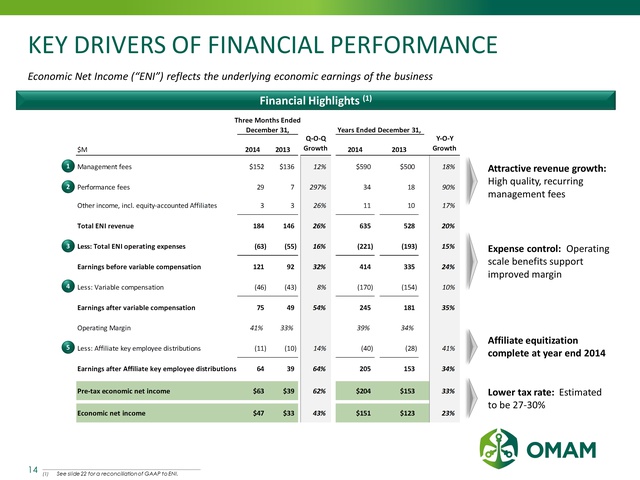
KEY DRIVERS OF FINANCIAL PERFORMANCE 14 Economic Net Income (“ENI”) reflects the underlying economic earnings of the business Three Months Ended December 31, Years Ended December 31, $M 2014 2013 Q‐O‐Q Growth 2014 2013 Y‐O‐Y Growth Management fees $152 $136 12% $590 $500 18% Performance fees 29 7 297% 34 18 90% Other income, incl. equity‐accounted Affiliates 3 3 26% 11 10 17% Total ENI revenue 184 146 26% 635 528 20% Less: Total ENI operating expenses (63) (55) 16% (221) (193) 15% Earnings before variable compensation 121 92 32% 414 335 24% Less: Variable compensation (46) (43) 8% (170) (154) 10% Earnings after variable compensation 75 49 54% 245 181 35% Operating Margin 41% 33% 39% 34% Less: Affiliate key employee distributions (11) (10) 14% (40) (28) 41% Earnings after Affiliate key employee distributions 64 39 64% 205 153 34% Pre‐tax economic net income $63 $39 62% $204 $153 33% Economic net income $47 $33 43% $151 $123 23% Attractive revenue growth: High quality, recurring management fees (1) See slide 22 for a reconciliation of GAAP to ENI. Financial Highlights (1) Expense control: Operating scale benefits support improved margin Affiliate equitization complete at year end 2014 Lower tax rate: Estimated to be 27‐30%
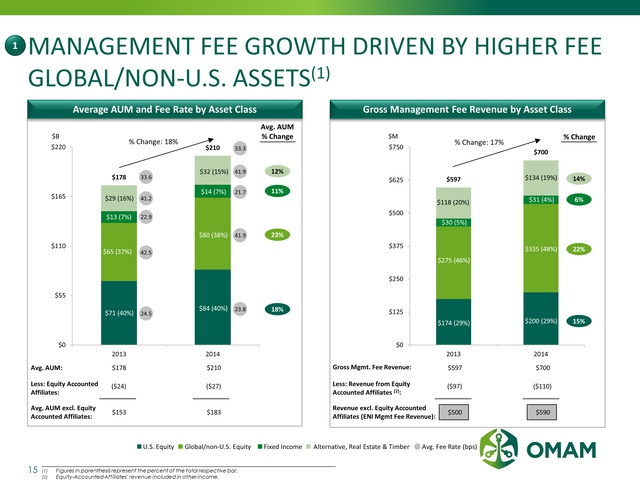
MANAGEMENT FEE GROWTH DRIVEN BY HIGHER FEE GLOBAL ASSETS(1) 15 $178 $210 $0 $55 $110 $165 $220 2013 2014 Gross Average AUM and Fee Rate by Asset Class Management Fee Revenue by Asset Class (1) Figures in parenthesis represent the percent of the total respective bar. (2) Equity-Accounted Affiliates’ revenue included in other income. $597 $700 $0 $125 $250 $375 $500 $625 $750 2013 2014 $M 14% 6% 22% 15% U.S. Equity Global/Non U.S. Equity Fixed Income Alternative, Real Estate & Timber Avg. Fee Rate (bps) $B Avg. AUM % Change 12% 11% 23% 18% % Change Avg. AUM: Less: Equity Accounted Affiliates: Avg. AUM excl. Equity Accounted Affiliates: ($24) ($27) $178 $210 $153 $183 Gross Mgmt. Fee Revenue: Less: Revenue from Equity Accounted Affiliates (2): Revenue excl. Equity Accounted Affiliates (ENI Mgmt Fee Revenue): ($97) ($110) $597 $700 $500 $590 24.5 42.5 22.9 41.2 33.6 23.8 41.9 21.7 41.9 33.3 % Change: 18% % Change: 17% 1 $84 (40%) $65 (37%) $80 (38%) $13 (7%) $14 (7%) $29 (16%) $32 (16%) $200 (29%) $276 (46%) $335 (48%) $30 (5%) $118 (20%) $32 (4%) $134 (19%) $174 (29%) $71 (40%)
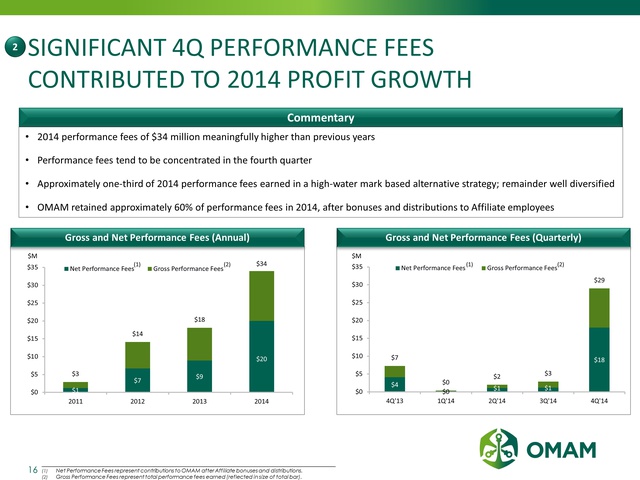
SIGNIFICANT 4Q PERFORMANCE FEES CONTRIBUTED TO 2014 PROFIT GROWTH 16 $1 $7 $9 $20 $3 $14 $18 $34 $0 $5 $10 $15 $20 $25 $30 $35 2011 2012 2013 2014 Net Performance Fees Gross Performance Fees $4 $0 $1 $1 $7 $18 $0 $2 $3 $29 $0 $5 $10 $15 $20 $25 $30 $35 4Q'13 1Q'14 2Q'14 3Q'14 4Q'14 Net Performance Fees Gross Performance Fees Gross and Net Performance Fees (Annual) Gross and Net Performance Fees (Quarterly) 2 • 2014 performance fees of $34 million meaningfully higher than previous years • Performance fees tend to be concentrated in the fourth quarter • Approximately one third of 2014 performance fees earned in a high‐water mark based alternative strategy; remainder well diversified • OMAM retained approximately 60% of performance fees in 2014, after bonuses and distributions to Affiliate employees Commentary (1) (2) (1) (2) (1) Net Performance Fees represent contributions to OMAM after Affiliate bonuses and distributions. (2) Gross Performance Fees represent total performance fees earned (reflected in size of total bar). $M $M
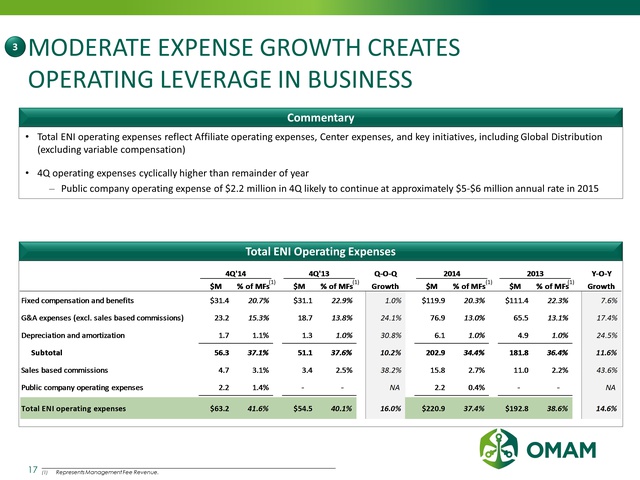
MODERATE EXPENSE GROWTH CREATES OPERATING LEVERAGE IN BUSINESS 17 Total ENI Operating Expenses • Total ENI operating expenses reflect Affiliate operating expenses, Center expenses, and key initiatives, including Global Distribution (excluding variable compensation) • 4Q operating expenses cyclically higher than remainder of year ‒ Public company operating expense of $2.2 million in 4Q likely to continue at approximately $5‐$6 million annual rate in 2015 Commentary 4Q'14 4Q'13 Q‐O‐Q 2014 2013 Y‐O‐Y $M % of MFs $M % of MFs Growth $M % of MFs $M % of MFs Growth Fixed compensation and benefits $31.4 20.7% $31.1 22.9% 1.0% $119.9 20.3% $111.4 22.3% 7.6% G&A expenses (excl. sales based commissions) 23.2 15.3% 18.7 13.8% 24.1% 76.9 13.0% 65.5 13.1% 17.4% Depreciation and amortization 1.7 1.1% 1.3 1.0% 30.8% 6.1 1.0% 4.9 1.0% 24.5% Subtotal 56.3 37.1% 51.1 37.6% 10.2% 202.9 34.4% 181.8 36.4% 11.6% Sales based commissions 4.7 3.1% 3.4 2.5% 38.2% 15.8 2.7% 11.0 2.2% 43.6% Public company operating expenses 2.2 1.4% ‐ ‐ NA 2.2 0.4% ‐ ‐ NA Total ENI operating expenses $63.2 41.6% $54.5 40.1% 16.0% $220.9 37.4% $192.8 38.6% 14.6% 3 (1) (1) (1) (1) (1) Represents Management Fee Revenue.
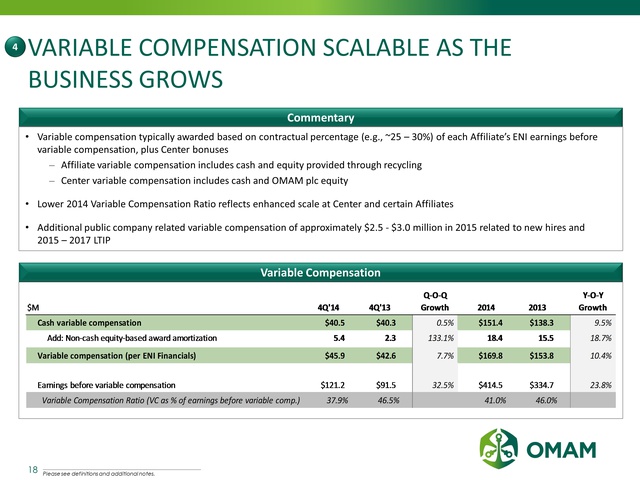
VARIABLE COMPENSATION SCALABLE AS THE BUSINESS GROWS 18 Variable Compensation Commentary 4 • Variable compensation typically awarded based on contractual percentage (e.g., ~25 – 30%) of each Affiliate’s ENI earnings before variable compensation, plus Center bonuses ‒ Affiliate variable compensation includes cash and equity provided through recycling ‒ Center variable compensation includes cash and OMAM plc equity • Lower 2014 Variable Compensation Ratio reflects enhanced scale at Center and certain Affiliates • Additional public company related variable compensation of approximately $2.5 million annually from 2015 related to new hires and LTIP Please see definitions and additional notes. Q‐O‐Q Y‐O‐Y $M 4Q'14 4Q'13 Growth 2014 2013 Growth Cash variable compensation $40.5 $40.3 0.5% $151.4 $138.3 9.5% Add: Non‐cash equity‐based award amortization 5.4 2.3 133.1% 18.4 15.5 18.7% Variable compensation (per ENI Financials) $45.9 $42.6 7.7% $169.8 $153.8 10.4% Earnings before variable compensation $121.2 $91.5 32.5% $414.5 $334.7 23.8% Variable Compensation Ratio (VC as % of earnings before variable comp.) 37.9% 46.5% 41.0% 46.0%
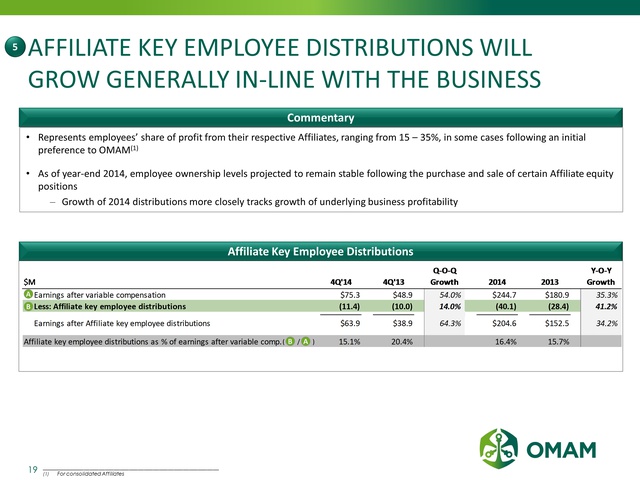
AFFILIATE KEY EMPLOYEE DISTRIBUTIONS WILL GROW GENERALLY IN‐LINE WITH THE BUSINESS 19 Affiliate Key Employee Distributions Commentary • Represents employees’ share of profit from their respective Affiliates, ranging from 15 – 35%, in some cases following an initial preference to OMAM(1) • As of year‐end 2014, employee ownership levels projected to remain stable following the purchase and sale of certain Affiliate equity positions ‒ Growth of 2014 distributions more closely tracks growth of underlying business profitability Q‐O‐Q Y‐O‐Y $M 4Q'14 4Q'13 Growth 2014 2013 Growth Earnings after variable compensation $75.3 $48.9 54.0% $244.7 $180.9 35.3% Less: Affiliate key employee distributions (11.4) (10.0) 14.0% (40.1) (28.4) 41.2% Earnings after Affiliate key employee distributions $63.9 $38.9 64.3% $204.6 $152.5 34.2% Affiliate key employee distributions as % of earnings after variable comp. 15.1% 20.4% 16.4% 15.7% (1) For consolidated Affiliates B A ( B / A )
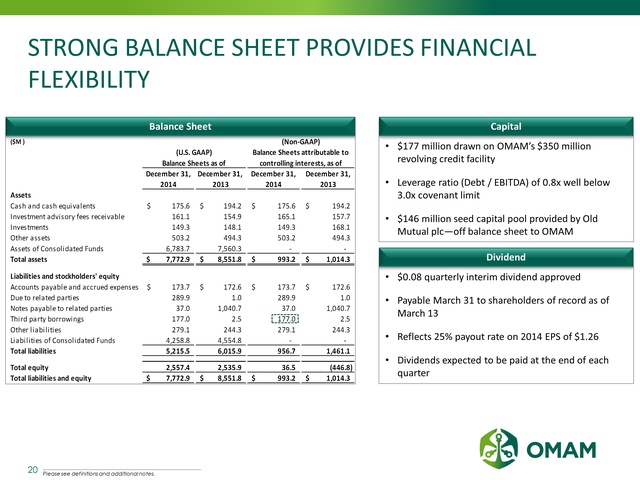
($M ) December 31, December 31, December 31, December 31, 2014 2013 2014 2013 Assets Cash and cash equivalents $ 175.6 $ 194.2 $ 175.6 $ 194.2 Investment advisory fees receivable 161.1 154.9 165.1 157.7 Investments 149.3 148.1 149.3 168.1 Other assets 503.2 494.3 503.2 494.3 Assets of Consolidated Funds 6,798.5 7,560.3 ‐ ‐ Total assets $ 7,772.9 $ 8,551.8 $ 993.2 $ 1,014.3 Liabilities and stockholders' equity Accounts payable and accrued expenses $ 173.7 $ 172.6 $ 173.7 $ 172.6 Due to related parties 289.9 1.0 289.9 1.0 Notes payable to related parties 37.0 1,040.7 37.0 1,040.7 Third party borrowings 177.0 2.5 177.0 2.5 Other liabilities 279.1 244.3 279.1 244.3 Liabilities of Consolidated Funds 4,258.8 4,554.8 (14.8) ‐ Total liabilities 5,215.5 6,015.9 941.9 1,461.1 Total equity 2,557.4 2,535.9 36.5 (446.8) Total liabilities and equity $ 7 ,772.9 $ 8,551.8 $ 978.4 $ 1,014.3 (U.S. GAAP) Balance Sheets as of (Non‐GAAP) Balance Sheets attributable to controlling interests, as of STRONG BALANCE SHEET PROVIDES FINANCIAL FLEXIBILITY 20 Balance Sheet Capital Dividend • $177 million drawn on OMAM’s $350 million revolving credit facility • Leverage ratio (Debt / EBITDA) of 0.8x well below 3.0x covenant limit • $146 million seed capital pool provided by Old Mutual plc—off balance sheet to OMAM • $0.08 interim quarterly dividend approved • Payable March 31 to shareholders of record as of March 13 • Reflects 25% payout rate on 2014 EPS of $1.26 • Dividends expected to be paid at the end of each quarter Please see definitions and additional notes

APPENDIX
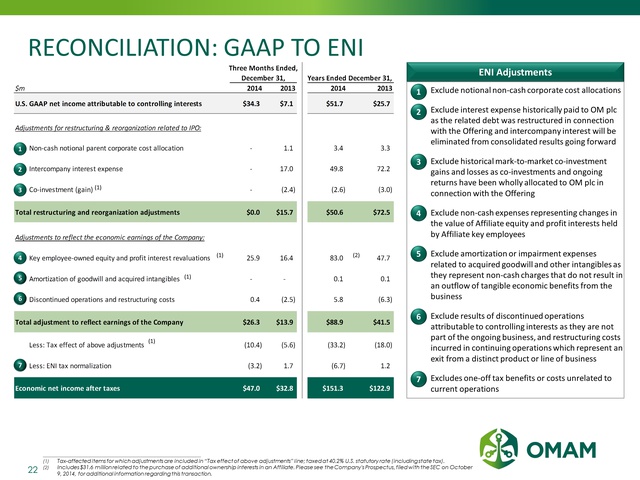
RECONCILIATION: GAAP TO ENI 22 Three Months Ended, December 31, Years Ended December 31, $m 2014 2013 2014 2013 U.S. GAAP net income attributable to controlling interests $34.3 $7.1 $51.7 $25.7 Adjustments for restructuring & reorganization related to IPO: i. Non‐cash notional parent corporate cost allocation ‐ 1.1 3.4 3.3 ii. Intercompany interest expense ‐ 17.0 49.8 72.2 iii. Co‐investment (gain) ‐ (2.4) (2.6) (3.0) Total restructuring and reorganization adjustments $0.0 $15.7 $50.6 $72.5 Adjustments to reflect the economic earnings of the Company: iv. Key employee‐owned equity and profit interest revaluations 2 5.9 16.4 83.0 47.7 v. Amortization of goodwill and acquired intangibles ‐ ‐ 0.1 0.1 vi. Discontinued operations and restructuring costs 0.4 (2.5) 5.8 (6.3) Total adjustment to reflect earnings of the Company $26.3 $13.9 $88.9 $41.5 Less: Tax effect of above adjustments (8.8) (5.6) (31.6) (18.0) Less: ENI tax normalization (4.8) 1.7 (8.3) 1.2 Economic net income after taxes $47.0 $32.8 $151.3 $122.9 1 2 3 4 5 6 ENI Adjustments i. Exclude notional non‐cash corporate cost allocations ii. Exclude interest expense historically paid to OM plc as the related debt was restructured in connection with the Offering and intercompany interest will be eliminated from consolidated results going forward iii. Exclude historical mark‐to‐market co‐investment gains and losses as co‐investments and ongoing returns have been wholly allocated to OM plc in connection with the Offering v. Exclude non‐cash expenses representing changes in the value of Affiliate equity and profit interests held by Affiliate key employees vi. Exclude amortization or impairment expenses related to acquired goodwill and other intangibles as they represent non‐cash charges that do not result in an outflow of tangible economic benefits from the business vii. Exclude results of discontinued operations attributable to controlling interests as they are not part of the ongoing business, and restructuring costs incurred in continuing operations which represent an exit from a distinct product or line of business viii. Excludes one‐off tax benefits or costs unrelated to current operations 1 2 3 4 5 6 7 7 (1) Tax-affected items for which adjustments are included in “Tax effect of above adjustments” line; taxed at 40.2% U.S. statutory rate (including state tax). (2) Includes $31.6 million related to the purchase of additional ownership interests in an Affiliate. Please see the Company's Prospectus, filed with the SEC on October 9, 2014, for additional information regarding this transaction.
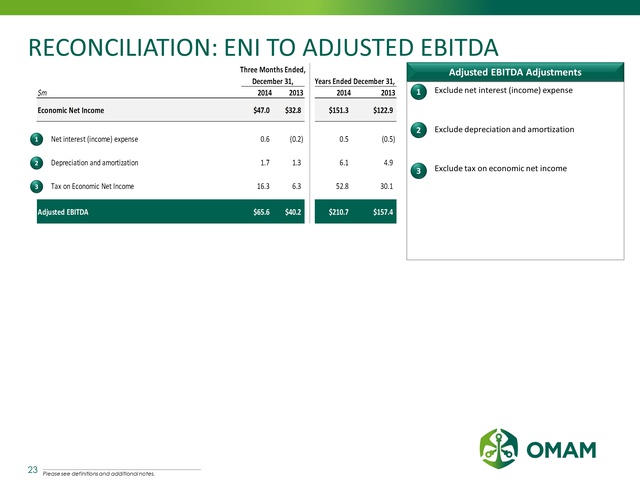
RECONCILIATION: ENI TO ADJUSTED EBITDA 23 1 2 3 Adjusted EBITDA Adjustments i. Exclude net interest (income) expense ii. Exclude depreciation and amortization iii. Exclude tax on economic net income 1 2 3 Please see definitions and additional notes. Three Months Ended, December 31, Years Ended December 31, $m 2014 2013 2014 2013 Economic Net Income $47.0 $32.8 $151.3 $122.9 Net interest (income) expense 0.6 (0.2) 0.5 (0.5) Depreciation and amortization 1 .7 1.3 6.1 4.9 Tax on Economic Net Income 16.3 6.3 52.8 30.1 Adjusted EBITDA $65.6 $40.2 $210.7 $157.4
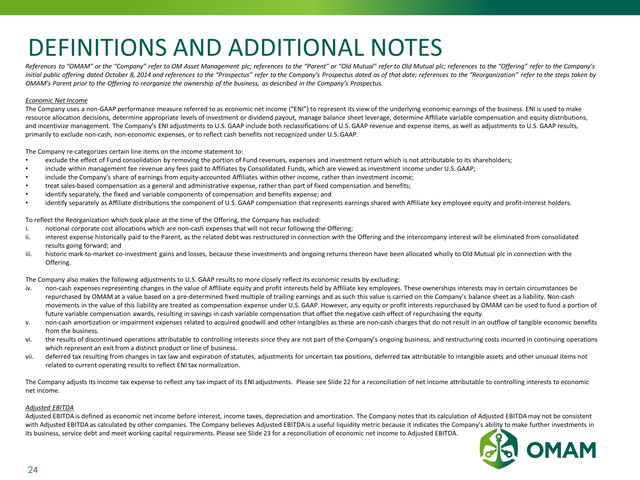
DEFINITIONS AND ADDITIONAL NOTES 24 Economic Net Income The Company uses a non‐GAAP performance measure referred to as economic net income (“ENI”) to represent its view of the underlying economic earnings of the business. ENI is used to make resource allocation decisions, determine appropriate levels of investment or dividend payout, manage balance sheet leverage, determine Affiliate variable compensation and equity distributions, and incentivize management. The Company’s ENI adjustments to U.S. GAAP include both reclassifications of U.S. GAAP revenue and expense items, as well as adjustments to U.S. GAAP results, primarily to exclude non‐cash, non‐economic expenses, or to reflect cash benefits not recognized under U.S. GAAP. The Company re‐categorizes certain line items on the income statement to: • exclude the effect of Fund consolidation by removing the portion of Fund revenues, expenses and investment return which is not attributable to its shareholders; • include within management fee revenue any fees paid to Affiliates by Consolidated Funds, which are viewed as investment income under U.S. GAAP; • include the Company’s share of earnings from equity‐accounted Affiliates within other income, rather than investment income; • treat sales‐based compensation as a general and administrative expense, rather than part of fixed compensation and benefits; • identify separately, the fixed and variable components of compensation and benefits expense; and • identify separately as Affiliate distributions the component of U.S. GAAP compensation that represents earnings shared with Affiliate key employee equity and profit‐interest holders. To reflect the Reorganization which took place at the time of the Offering, the Company has excluded: i. notional corporate cost allocations which are non‐cash expenses that will not recur following the Offering; ii. interest expense historically paid to the Parent, as the related debt was restructured in connection with the Offering and the intercompany interest will be eliminated from consolidated results going forward; and iii. historic mark‐to‐market co‐investment gains and losses, because these investments and ongoing returns thereon have been allocated wholly to Old Mutual plc in connection with the Offering. The Company also makes the following adjustments to U.S. GAAP results to more closely reflect its economic results by excluding: iv. non‐cash expenses representing changes in the value of Affiliate equity and profit interests held by Affiliate key employees. These ownerships interests may in certain circumstances be repurchased by OMAM at a value based on a pre‐determined fixed multiple of trailing earnings and as such this value is carried on the Company’s balance sheet as a liability. Non‐cash movements in the value of this liability are treated as compensation expense under U.S. GAAP. However, any equity or profit interests repurchased by OMAM can be used to fund a portion of future variable compensation awards, resulting in savings in cash variable compensation that offset the negative cash effect of repurchasing the equity. v. non‐cash amortization or impairment expenses related to acquired goodwill and other intangibles as these are non‐cash charges that do not result in an outflow of tangible economic benefits from the business. vi. the results of discontinued operations attributable to controlling interests since they are not part of the Company’s ongoing business, and restructuring costs incurred in continuing operations which represent an exit from a distinct product or line of business. vii. deferred tax resulting from changes in tax law and expiration of statutes, adjustments for uncertain tax positions, deferred tax attributable to intangible assets and other unusual items not related to current operating results to reflect ENI tax normalization. The Company adjusts its income tax expense to reflect any tax impact of its ENI adjustments. Please see Slide 22 for a reconciliation of net income attributable to controlling interests to economic net income. Adjusted EBITDA Adjusted EBITDA is defined as economic net income before interest, income taxes, depreciation and amortization. The Company notes that its calculation of Adjusted EBITDA may not be consistent with Adjusted EBITDA as calculated by other companies. The Company believes Adjusted EBITDA is a useful liquidity metric because it indicates the Company’s ability to make further investments in its business, service debt and meet working capital requirements. Please see Slide 23 for a reconciliation of economic net income to Adjusted EBITDA.
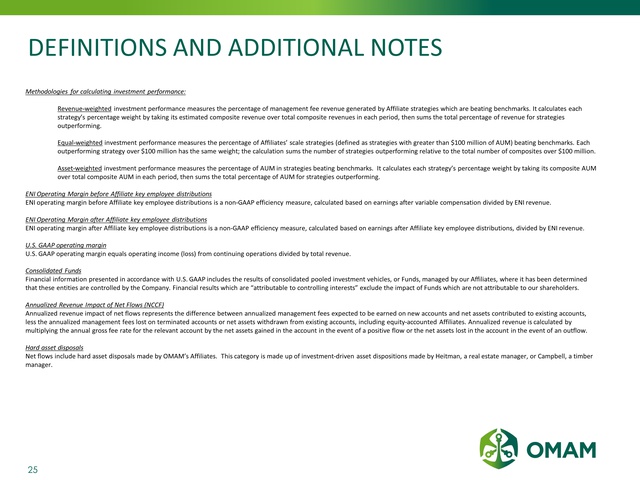
DEFINITIONS AND ADDITIONAL NOTES 25 Methodologies for calculating investment performance: Revenue‐weighted investment performance measures the percentage of management fee revenue generated by Affiliate strategies which are beating benchmarks. It calculates each strategy’s percentage weight by taking its estimated composite revenue over total composite revenues in each period, then sums the total percentage of revenue for strategies outperforming. Equal‐weighted investment performance measures the percentage of Affiliates’ scale strategies (defined as strategies with greater than $100 million of AUM) beating benchmarks. Each outperforming strategy over $100 million has the same weight; the calculation sums the number of strategies outperforming relative to the total number of composites over $100 million. Asset‐weighted investment performance measures the percentage of AUM in strategies beating benchmarks. It calculates each strategy’s percentage weight by taking its composite AUM over total composite AUM in each period, then sums the total percentage of AUM for strategies outperforming. ENI Operating Margin before Affiliate key employee distributions ENI operating margin before Affiliate key employee distributions is a non‐GAAP efficiency measure, calculated based on earnings after variable compensation divided by ENI revenue. ENI Operating Margin after Affiliate key employee distributions ENI operating margin after Affiliate key employee distributions is a non‐GAAP efficiency measure, calculated based on earnings after Affiliate key employee distributions, divided by ENI revenue. U.S. GAAP operating margin U.S. GAAP operating margin equals operating income (loss) from continuing operations divided by total revenue. Consolidated Funds Financial information presented in accordance with U.S. GAAP includes the results of consolidated pooled investment vehicles, or Funds, managed by our Affiliates, where it has been determined that these entities are controlled by the Company. Financial results which are “attributable to controlling interests” exclude the impact of Funds which are not attributable to our shareholders. Annualized Revenue Impact of Net Flows (NCCF) Annualized revenue impact of net flows represents the difference between annualized management fees expected to be earned on new accounts and net assets contributed to existing accounts, less the annualized management fees lost on terminated accounts or net assets withdrawn from existing accounts, including equity‐accounted Affiliates. Annualized revenue is calculated by multiplying the annual gross fee rate for the relevant account by the net assets gained in the account in the event of a positive flow or the net assets lost in the account in the event of an outflow. Hard asset disposals Net flows include hard asset disposals made by OMAM’s Affiliates. This category is made up of investment‐driven asset dispositions made by Heitman, a real estate manager, or Campbell, a timber manager.