Attached files
| file | filename |
|---|---|
| 8-K - CURRENT REPORT OF MATERIAL EVENTS OR CORPORATE CHANGES - HCC INSURANCE HOLDINGS INC/DE/ | a15-5576_18k.htm |
Exhibit 99.1
|
|
36th Annual Raymond James Institutional Investors Conference March 2, 2015 HCC Insurance Holdings, Inc. |
|
|
See Notice About This Presentation Notice About This Presentation ABOUT FORWARD-LOOKING STATEMENTS: This presentation contains certain “forward-looking statements” within the meaning of Section 27A of the Securities Act of 1933 and Section 21E of the Securities Exchange Act of 1934, which are intended to be covered by the safe harbors created by those laws. These forward-looking statements reflect our current expectations and projections about future events and include information about possible or assumed future results of our operations. All statements, other than statements of historical facts, included or incorporated by reference in this presentation that address activities, events or developments that we expect or anticipate may occur in the future, including such things as growth of our business and operations, business strategy, competitive strengths, goals, plans, future capital expenditures and references to future successes may be considered forward-looking statements. Generally, words such as “anticipate,” “believe,” “estimate,” “expect,” “intend,” “plan,” “probably” or similar expressions indicate forward-looking statements. Many risks and uncertainties may have an impact on the matters addressed in these forward-looking statements, which could affect our future financial results and performance. These events or factors could cause our results or performance to differ materially from those we express in our forward-looking statements. Although we believe that the assumptions underlying our forward-looking statements are reasonable, any of these assumptions, and, therefore, the forward-looking statements based on these assumptions, could themselves prove to be inaccurate. In light of the significant uncertainties inherent in the forward-looking statements that are included in this presentation, our inclusion of this information is not a representation by us or any other person that our objectives or plans will be achieved. Our forward-looking statements speak only at the date made, and we will not update these forward-looking statements unless the securities laws require us to do so. In light of these risks, uncertainties and assumptions, any forward-looking events discussed in this presentation may not occur. PRESENTATION FORMATTING: Certain figures included in this publication have been rounded for presentation and are provided for comparative purposes only. Our periodic reports filed with the Securities and Exchange Commission contain more detailed information, including specific figures. 2 |
|
|
See Notice About This Presentation 3 HCC Overview |
|
|
See Notice About This Presentation Overview 4 Leading specialty insurance underwriter Over 100 diverse, non-correlated lines of business Industry leading combined ratio Consistent, top-tier financial results and value creation regardless of market cycles Assets of $10.7 billion, shareholders’ equity of $3.9 billion and market capitalization of $5.2 billion as of 12/31/14 |
|
|
See Notice About This Presentation Strong Balance Sheet AA (Very Strong) from Standard & Poor’s A+ (Superior) from A.M. Best AA (Very Strong) from Fitch Ratings A1 (Good Security) from Moody’s 5 |
|
|
Consistent, Profitable Growth 6 Premium See Notice About This Presentation ($ in millions) CAGR (2009-2014) GWP: 3.2% NWP: 3.0% Gross Written Net Written |
|
|
Underwriting Focus 7 Underwriting Ratios See Notice About This Presentation Loss Ratio Expense Ratio |
|
|
See Notice About This Presentation Effective Catastrophe Management 8 1 1/1/15 PML excludes reinstatement premium and is based on 1 in 250 year estimates from RMS models and internal PML estimates for lines not modeled in RMS. After-tax Net Probable Maximum Loss (PML)1 for a single event managed to 5% of Shareholders’ Equity After-tax Net PML as % of Shareholders’ Equity CA Earthquake European Wind US Named Wind |
|
|
See Notice About This Presentation 9 2014 Results |

|
|
See Notice About This Presentation Earnings Per Share 10 2013 actual $4.04 EPS 2014 actual $4.61 EPS Third consecutive annual record |
|
|
See Notice About This Presentation Book Value Growth 11 Note: Results are full year 2014. 10.4% As reported 9.0% Excluding AOCI |
|
|
See Notice About This Presentation Combined Ratio 12 82.1% Target: mid-80s Note: Results are full year 2014. |
|
|
See Notice About This Presentation Expense Ratio Low expense ratio = competitive advantage 13 26.6% Note: Results are full year 2014. |
|
|
Note: Results are full year 2014. 1 Operating return on equity is a non-GAAP financial measure. See GAAP reconciliation on slide 36. See Notice About This Presentation Operating Return on Equity1 14 11.0% Target: 10% above 90-day T-bill |
|
|
See Notice About This Presentation 15 Segment Results |

|
|
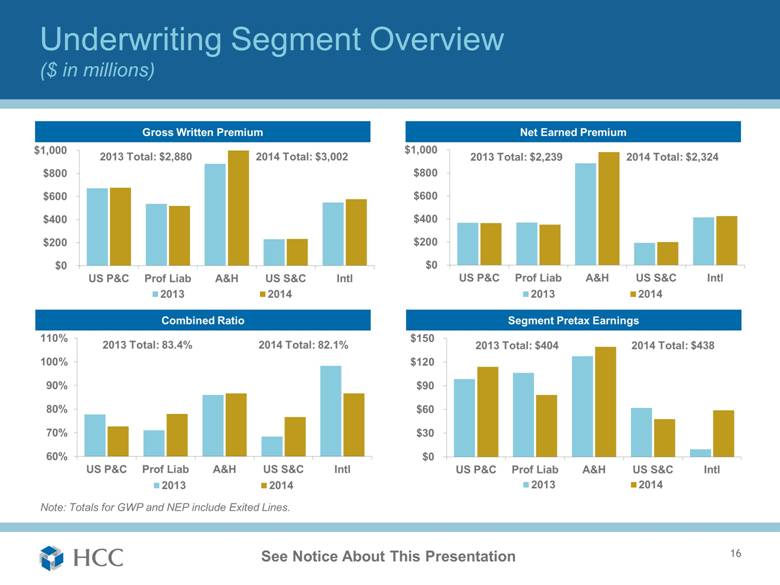
Underwriting Segment Overview ($ in millions) 16 See Notice About This Presentation Gross Written Premium Net Earned Premium Combined Ratio 2013 Total: $2,880 2014 Total: $3,002 2013 Total: $2,239 2014 Total: $2,324 2013 Total: 83.4% 2014 Total: 82.1% Segment Pretax Earnings 2013 Total: $404 2014 Total: $438 Note: Totals for GWP and NEP include Exited Lines. |
|
|
See Notice About This Presentation U.S. Property & Casualty 17 Note: Results are full year 2014. 72.7% combined ratio – 5 point improvement in loss ratio 16% earnings growth 24% GWP growth in Liability led by Primary Casualty Net favorable loss development of $42 million Continued focus on maintaining or improving margins in a competitive environment Gross Written Premium $676M Liability Aviation Sports & Entertainment Public Risk Other |
|
|
See Notice About This Presentation Professional Liability 18 78.0% combined ratio Low single-digit price increases on U.S. business; low single-digit price decreases on International business Margins remain favorable Cumulative paid loss ratio below 30% since inception in 2002 Leader in worldwide D&O market Gross Written Premium $517M Note: Results are full year 2014. U.S. D&O International D&O |
|
|
See Notice About This Presentation Accident & Health 19 86.7% combined ratio – consistent with prior year 13% GWP growth; 9% earnings growth Medical Stop-loss price increases above loss trends – market competitive but stable Net favorable loss development of $13 million Continued strong growth in Short-term Medical Gross Written Premium $998M Note: Results are full year 2014. Medical Stop-loss Short-term Medical |
|
|
See Notice About This Presentation U.S. Surety & Credit 20 76.7% combined ratio Consistent, strong underwriting results Net favorable loss development of $23 million Competitive environment in all lines; successfully maintaining margins U.S. and global economic recovery will benefit this segment Gross Written Premium $232M Note: Results are full year 2014. Commercial Surety Credit Contract Surety Other Surety |
|
|
See Notice About This Presentation International 21 86.7% combined ratio Earnings increased $49 million 5% GWP growth overall led by strong performance from Surety & Credit and Liability Favorable accident year loss ratio of 39.7% Net adverse development of $25 million due to $43 million charge for discontinued Spanish Surety Bonds Gross Written Premium $578M Note: Results are full year 2014. Marine & Energy Property Treaty Liability Surety Property D&F UK Credit Accident & Health |
|
|
See Notice About This Presentation 22 Investments |

|
|
See Notice About This Presentation Investments 23 High quality portfolio with average rating of “AA” Investment leverage of 2x Buy and hold strategy with ample liquidity to fund liabilities Equity allocation of 4% at year-end; realized gains of $66 million during 2014 Fixed Maturity Securities $6,611 Equity Securities 296 Short-term Investments 258 Total Investments $7,165 ($ in millions) Note: Results as of 12/31/14. |
|
|
See Notice About This Presentation Investment Portfolio 24 Average Rating AA Average Duration 4.7 years Average Life 8.1 years Average Yield 3.5% Average Tax Equivalent Yield 4.3% Fixed Maturity Securities Asset Allocation Dividend Yield 4.0% Beta 0.9 Equity Securities Note: Results as of 12/31/14. Munic MBS Corporate ABS Equity Short-Term Foreign Gov’t U.S. Gov’t |
|
|
See Notice About This Presentation 25 Capital Management |

|
|
See Notice About This Presentation 2014 Capital Management Initiatives Target returning 100% of net income through dividends and share repurchases in any given year Fourth Quarter Declared regular cash dividend of $0.295 per share 75th consecutive quarterly cash dividend Full Year 2014 Share repurchases of 4.7 million shares, or $225 million, at an average price of $47.70 Capital return of $327 million through dividends and share repurchases 26 |
|
|
See Notice About This Presentation 27 Crop Insurance Acquisition |
|
|
See Notice About This Presentation ProAg Summary Acquired Producers Ag Insurance Group, Inc. (ProAg) from CUNA Mutual Group for approximately $105 million effective January 1, 2015 Licensed provider of the U.S. Department of Agriculture’s (USDA) Multi-Peril Crop Insurance (MPCI) program offering a full suite of crop hail / named peril products 7th largest writer of MPCI (5.1% market share)1 One of the few crop insurers that has built a national platform Approximately 500 full-time and part-time employees supporting operations in over 40 states with 7 regional offices 28 1 Source: USDA’s Risk Management Agency 2014 reinsurance year data as of November 2014. Description MPCI Market Share by Gross Written Premium1 Rain and Hail Rural Community NAU Country Great American ARMtech GuideOne ProAg Farmers Mutual John Deere ADM All Others |
|
|
See Notice About This Presentation ProAg Product Mix 29 Product Mix MPCI Crop Mix 2014 Gross Earned Premium: $565M 2014 RY Gross Written Premium: $511M |
|
|
See Notice About This Presentation Crop Insurance – Benefits and Objectives 30 Future Objectives Benefits to HCC Excellent platform with an experienced management team Specialty line of business Historical profitability Lack of correlation with HCC’s existing lines Modest capital requirement Limited downside risk Expected to be accretive to earnings beginning in 2016 Grow business organically and through additional acquisitions |
|
|
See Notice About This Presentation 31 Peer Comparison |
|
|
32 Total Value Creation – 10 Years See Notice About This Presentation Source: Dowling & Partners; data through 12/31/14. Note: Total Value Creation is growth in tangible book value per share including dividends. 10 YEAR TOTAL VALUE CREATION CAGR (2004 - 2014) |
|
|
See Notice About This Presentation Outperformance with Low Volatility – 10 Years 33 Source: Dowling & Partners; data through 12/31/14. 10 YEAR (2004-2014) AVG. COMBINED RATIO & STANDARD DEVIATION IN C. RATIO |
|
|
10.5 point difference versus peers over last year 11.6 point difference versus peers over last three years 11.1 point difference versus peers over last five years See Notice About This Presentation Combined Ratio – HCC versus Peer Group 34 1 Year 3 Year2 5 Year2 1 Calculated by HCC using 12/31/14 and prior SEC filings for peer companies. Peers reflects average for peer companies. 2 Reflects average for three-year and five-year results. 1 1 1 82.1% 92.6% 83.0% 94.6% 85.0% 96.1% HCC Peers HCC Peers HCC Peers |
|
|
See Notice About This Presentation HCC’s Value Proposition Specialty Insurance businesses with strong long-term fundamentals and market leadership Diversified underwriting portfolio with historically low correlation Consistent track record of profitable growth and strong underwriting performance Lowest expense ratio amongst industry peers High quality investment portfolio Disciplined capital management Strong risk management practices Broadly experienced team 35 |
|
|
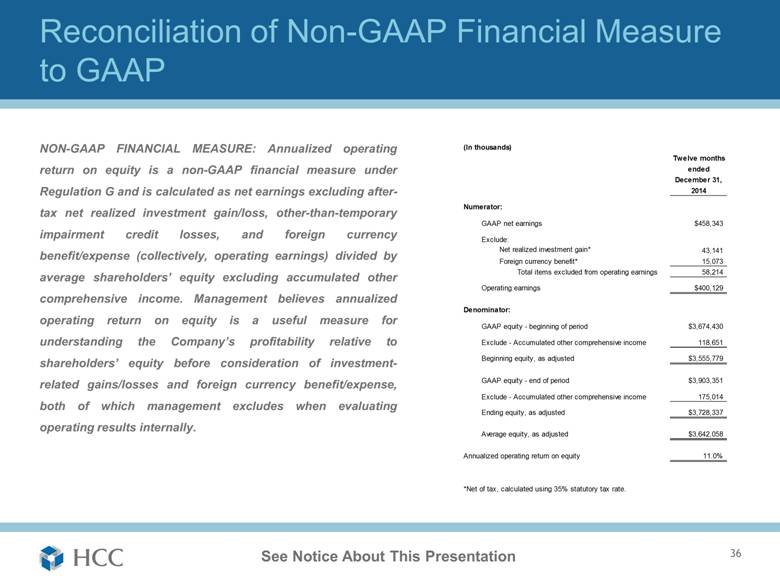
See Notice About This Presentation Reconciliation of Non-GAAP Financial Measure to GAAP NON-GAAP FINANCIAL MEASURE: Annualized operating return on equity is a non-GAAP financial measure under Regulation G and is calculated as net earnings excluding after-tax net realized investment gain/loss, other-than-temporary impairment credit losses, and foreign currency benefit/expense (collectively, operating earnings) divided by average shareholders’ equity excluding accumulated other comprehensive income. Management believes annualized operating return on equity is a useful measure for understanding the Company’s profitability relative to shareholders’ equity before consideration of investment-related gains/losses and foreign currency benefit/expense, both of which management excludes when evaluating operating results internally. 36 Twelve months ended December 31, 2014 $458,343 43,141 15,073 Total items excluded from operating earnings 58,214 $400,129 $3,674,430 118,651 $3,555,779 $3,903,351 175,014 $3,728,337 $3,642,058 11.0% Annualized operating return on equity *Net of tax, calculated using 35% statutory tax rate. Average equity, as adjusted Exclude - Accumulated other comprehensive income Ending equity, as adjusted Beginning equity, as adjusted GAAP equity - end of period GAAP equity - beginning of period Exclude - Accumulated other comprehensive income Operating earnings Denominator: Numerator: (In thousands) Foreign currency benefit* GAAP net earnings Exclude: Net realized investment gain* |
|
|
HCC Mind over risk 37 |