Attached files
| file | filename |
|---|---|
| EX-21 - EX-21 - HCC INSURANCE HOLDINGS INC/DE/ | d860932dex21.htm |
| EX-24 - EX-24 - HCC INSURANCE HOLDINGS INC/DE/ | d860932dex24.htm |
| EX-12 - EX-12 - HCC INSURANCE HOLDINGS INC/DE/ | d860932dex12.htm |
| EX-23 - EX-23 - HCC INSURANCE HOLDINGS INC/DE/ | d860932dex23.htm |
| EX-31.1 - EX-31.1 - HCC INSURANCE HOLDINGS INC/DE/ | d860932dex311.htm |
| EX-31.2 - EX-31.2 - HCC INSURANCE HOLDINGS INC/DE/ | d860932dex312.htm |
| EX-32.1 - EX-32.1 - HCC INSURANCE HOLDINGS INC/DE/ | d860932dex321.htm |
| EXCEL - IDEA: XBRL DOCUMENT - HCC INSURANCE HOLDINGS INC/DE/ | Financial_Report.xls |
| XML - IDEA: XBRL DOCUMENT - HCC INSURANCE HOLDINGS INC/DE/ | R9999.htm |
Table of Contents
UNITED STATES SECURITIES AND EXCHANGE COMMISSION
Washington, D.C. 20549
Form 10-K
| þ | ANNUAL REPORT PURSUANT TO SECTION 13 OR 15(d) OF THE SECURITIES EXCHANGE ACT OF 1934. |
| ¨ | TRANSITION REPORT PURSUANT TO SECTION 13 OR 15(d) OF THE SECURITIES EXCHANGE ACT OF 1934. |
For the fiscal year ended December 31, 2014
Commission file number 001-13790
HCC Insurance Holdings, Inc.
(Exact name of registrant as specified in its charter)
| Delaware | 76-0336636 | |
| (State or other jurisdiction of incorporation or organization) |
(IRS Employer Identification No.) | |
| 13403 Northwest Freeway, Houston, Texas |
77040-6094 (Zip Code) | |
| (Address of principal executive offices) |
(713) 690-7300
(Registrant’s telephone number, including area code)
Securities registered pursuant to Section 12(b) of the Act:
| Title of each class: |
Name of each exchange on which registered: | |
| Common Stock, $1.00 par value | New York Stock Exchange |
Securities registered pursuant to Section 12(g) of the Act: NONE
Indicate by check mark if the registrant is a well-known seasoned issuer as defined in Rule 405 of the Securities Act.
Yes þ No ¨
Indicate by check mark if the registrant is not required to file reports pursuant to Section 13 or Section 15(d) of the Exchange Act. Yes ¨ No þ
Indicate by check mark whether the registrant (1) has filed all reports required to be filed by Section 13 or 15(d) of the Securities Exchange Act of 1934 during the preceding 12 months (or for such shorter period that the registrant was required to file such reports), and (2) has been subject to such filing requirements for the past 90 days. Yes þ No ¨
Indicate by check mark whether the registrant has submitted electronically and posted on its corporate Web site, if any, every Interactive Data File required to be submitted and posted pursuant to Rule 405 of Regulation S-T (§232.405 of this chapter) during the preceding 12 months (or for such shorter period that the registrant was required to submit and post such files). þ Yes ¨ No
Indicate by check mark if disclosure of delinquent filers pursuant to Item 405 of Regulation S-K (§229.405 of this chapter) is not contained herein, and will not be contained, to the best of registrant’s knowledge, in definitive proxy or information statements incorporated by reference in Part III of this Form 10-K or any amendment to this Form 10-K. ¨
Indicate by check mark whether the registrant is a large accelerated filer, an accelerated filer, a non-accelerated filer, or a smaller reporting company. See definitions of “large accelerated filer,” “accelerated filer” and “smaller reporting company” in Rule 12b-2 of the Exchange Act. (Check one):
| Large accelerated filer þ |
Accelerated filer ¨ | |
|
Non-accelerated filer ¨ (Do not check if a smaller reporting company) |
Smaller reporting company ¨ |
Indicate by check mark whether the registrant is a shell company (as defined in Rule 12b-2 of the Exchange Act). Yes ¨ No þ
The aggregate market value on June 30, 2014 (the last business day of the registrant’s most recently completed second fiscal quarter) of the voting stock held by non-affiliates of the registrant was approximately $4.8 billion. For purposes of the determination of the above-stated amount, only Directors and executive officers are presumed to be affiliates, but neither the registrant nor any such person concede that they are affiliates of the registrant.
The number of shares outstanding of the registrant’s Common Stock, $1.00 par value, at February 13, 2015 was 96.3 million.
DOCUMENTS INCORPORATED BY REFERENCE:
Information called for in Part III of this Form 10-K is incorporated by reference to the registrant’s definitive Proxy Statement to be filed within 120 days of the close of the registrant’s fiscal year in connection with the registrant’s annual meeting of shareholders.
Table of Contents
HCC INSURANCE HOLDINGS, INC.
2
Table of Contents
FORWARD-LOOKING STATEMENTS
This Annual Report on Form 10-K contains certain “forward-looking statements” within the meaning of Section 27A of the Securities Act of 1933 and Section 21E of the Securities Exchange Act of 1934, which are intended to be covered by the safe harbors created by those laws. These forward-looking statements reflect our current expectations and projections about future events and include information about possible or assumed future results of our operations. All statements, other than statements of historical facts, included or incorporated by reference in this Report that address activities, events or developments that we expect or anticipate may occur in the future, including such things as growth of our business and operations, business strategy, competitive strengths, goals, plans, future capital expenditures and references to future successes may be considered forward-looking statements. Generally, words such as “anticipate,” “believe,” “estimate,” “expect,” “intend,” “plan,” “probably” or similar expressions indicate forward-looking statements.
Many risks and uncertainties may have an impact on the matters addressed in these forward-looking statements, which could affect our future financial results and performance, including, among other things:
| • | the effects of catastrophe losses, |
| • | volatility in crop prices and crop yields, |
| • | the cyclical nature of the insurance business, |
| • | inherent uncertainties in the loss estimation process, which can adversely impact the adequacy of loss reserves, |
| • | the impact of past and future potential economic or credit market downturns, including any potential ratings downgrade or impairment of the debt securities of sovereign issuers, |
| • | the effects of emerging claim and coverage issues, |
| • | the effects of extensive governmental regulation of the insurance industry, |
| • | changes to the country’s health care delivery system, |
| • | the effects of climate change on the risks we insure, |
| • | potential risk with agents and brokers, |
| • | the effects of industry consolidations, |
| • | our assessment of underwriting risk, |
| • | our retention of risk, which could expose us to potential losses, |
| • | the adequacy of reinsurance protection, |
| • | the ability and willingness of reinsurers to pay balances due us, |
| • | the occurrence of terrorist activities, |
| • | our ability to maintain our competitive position, |
| • | fluctuations in securities markets, which may reduce the value of our investment portfolio, reduce investment income or generate realized investment losses, |
| • | changes in our assigned financial strength ratings, |
| • | our ability to raise capital and funds for liquidity in the future, |
3
Table of Contents
| • | attraction and retention of qualified employees, |
| • | our ability to successfully expand our business through the acquisition of insurance-related companies, |
| • | impairment of goodwill, |
| • | the ability of our insurance company subsidiaries to pay dividends in needed amounts, |
| • | fluctuations in foreign exchange rates, |
| • | failure of, or loss of security related to, our information technology systems, |
| • | difficulties with outsourcing relationships, and |
| • | change of control. |
We describe these risks and uncertainties in greater detail in Item 1A, Risk Factors.
These events or factors could cause our results or performance to differ materially from those we express in our forward-looking statements. Although we believe that the assumptions underlying our forward-looking statements are reasonable, any of these assumptions, and, therefore, the forward-looking statements based on these assumptions, could themselves prove to be inaccurate. In light of the significant uncertainties inherent in the forward-looking statements that are included in this Report, our inclusion of this information is not a representation by us or any other person that our objectives or plans will be achieved.
Our forward-looking statements speak only at the date made, and we will not update these forward-looking statements unless the securities laws require us to do so. In light of these risks, uncertainties and assumptions, any forward-looking events discussed in this Report may not occur.
As used in this Report, unless otherwise required by the context, the terms “we,” “us” and “our” refer to HCC Insurance Holdings, Inc. and its consolidated subsidiaries and the term “HCC” refers only to HCC Insurance Holdings, Inc. All trade names or trademarks appearing in this Report are the property of their respective holders.
4
Table of Contents
Business Overview
HCC Insurance Holdings, Inc. is a leading specialty insurer with offices in the United States, the United Kingdom, Spain and Ireland. We underwrite over 100 classes of specialty insurance products in approximately 180 countries through five insurance underwriting segments. Our insurance underwriting segments are U.S. Property & Casualty, Professional Liability, Accident & Health, U.S. Surety & Credit and International. We market our insurance products through a network of independent agents and brokers, through managing general agents owned by the company, and directly to consumers. In addition, we assume insurance written by other insurance companies. Our principal executive office is located in Houston, Texas.
Our diverse portfolio of businesses is largely non-correlated and designed to generate consistent underwriting results regardless of market cycles. As a result, we have achieved an average combined ratio of 85.0% for the period 2010 – 2014, with less volatility over that period than our specialty peers. These profitable underwriting results have driven a 30% increase in shareholders’ equity over the past five years, while during the same period we paid $361.9 million in dividends to our shareholders and repurchased $854.3 million of our common stock. We generated 8.9% compounded growth in book value per share over that same period. We have been able to grow our gross written premium by 17% during the past five years as well, through a combination of organic growth, acquisitions and new underwriting teams.
We maintain financial strength ratings that are among the highest within the property and casualty insurance industry: “AA (Very Strong)” from Standard & Poor’s Financial Services LLC, “A+ (Superior)” from A.M. Best Company, Inc., “AA (Very Strong)” from Fitch Ratings, and “A1 (Good Security)” from Moody’s Investors Service, Inc. for our major domestic and international insurance companies. These ratings provide a competitive advantage in many of our lines of business.
Our Strategy
Our organization is focused on generating consistent, industry-leading combined ratios. By focusing on underwriting profitability, we are able to accomplish our primary objectives of maximizing net earnings and growing book value per share. We are aligned with this strategy through our culture and our performance incentives.
Key elements of our strategy are discussed below:
Diverse, Non-correlated Specialty Lines of Business
We concentrate our insurance writings in diverse specialty lines of business in which we believe we can achieve meaningful underwriting profits and, collectively, generate combined ratios consistently in the mid-80s. The diversity of our product lines results in our operating within five insurance underwriting segments that are largely non-correlated, meaning that insurance or economic cycles impacting one segment may not impact other segments or impact them to a lesser degree. We intentionally built the company around these non-correlated products as we believe this approach increases our chances of generating consistent underwriting results over time and through market cycles.
Our product diversity also provides operational flexibility, which permits us to shift the focus of our insurance underwriting activities among our various lines of business, emphasizing more profitable lines of business during periods of increased premium rates and de-emphasizing less profitable lines during periods of increased competition. We accomplish these shifts by increasing or decreasing the amount of gross premium written or by adjusting the amount of business reinsured.
5
Table of Contents
Experienced Underwriting Professionals Aligned with Our Strategy
Integral to our strategy is attracting, developing and retaining professionals with the requisite skills and knowledge to underwrite our diverse specialty product lines. These professionals include experienced underwriters in our chosen specialty lines with the authority to make decisions and quickly respond to our clients’ unique and rapidly changing needs. Our senior underwriters generally have more than 15 years of experience in their specialty line of business.
Our underwriters are aligned with our strategy and underwriting culture. This alignment is reinforced by our compensation practices, which are designed to reward disciplined underwriting and the generation of underwriting profit above all other measures. As a result, our underwriters have the expertise, mind-set and incentives to utilize the operational flexibility afforded by our diverse specialty lines of business.
Low Expense Ratio
Core to our overall underwriting performance is the maintenance of a low expense ratio. We accomplish this through disciplined expense management and a flat management structure. We also have a relatively small operational footprint despite the international breadth of our product offerings. We have resisted the tendency for the proliferation of branch offices in the United States and have centered our international business in London and Barcelona where we believe we have access to the lines of specialty international business that we desire.
New Lines of Business and Growth
We have historically accomplished significant growth through the successful acquisition and integration of insurance companies and underwriting agencies, making 50 acquisitions since becoming a public company in 1992. In recent years, we have actively recruited and hired new underwriting teams that we believe present opportunities for future profit and expansion of our business. We expect to continue to acquire complementary specialty insurance businesses and underwriting teams, while organically growing our current businesses. In considering new teams and potential acquisitions, we remain disciplined in pursuing those that meet our requirements for return on risk-adjusted capital and cultural fit. We believe our infrastructure, ratings and financial strength provide a solid operating platform for our future growth.
Effective January 1, 2015, we entered the crop insurance business through the acquisition of all of the capital stock of Producers Ag Insurance Group, Inc. (ProAg) from CUNA Mutual Group for $104.5 million cash. ProAg writes multi-peril crop, crop hail, named peril and livestock insurance and is currently the 7th largest multi-peril crop company in the U.S. with over $550.0 million of gross premium in 2014. Crop insurance is a non-correlated line of business we strategically targeted to add to our diversified portfolio of specialty insurance businesses. With an experienced management team and quality infrastructure, we expect ProAg to grow profitably over time and deliver results consistent with our return goals once fully integrated. ProAg’s operations will be included in our consolidated results of operations, financial position and cash flows beginning in 2015.
Effective Use of Reinsurance
Our financial strength and the profitability of our products provide significant flexibility with respect to the amount and types of reinsurance we buy. Our bias is towards retaining our business, which allows us to be flexible in our reinsurance purchases. Accordingly, the amount of reinsurance we purchase varies depending on the particular risks inherent in the policies underwritten; the pricing, coverage and terms of the reinsurance; and the competitive conditions within the relevant lines of business. Historically, we have purchased more reinsurance on new lines of business where we have less experience. As we gain experience with these new lines of business, we generally retain more of the business. When we decide to retain more underwriting risk in a particular line of business, we do so to retain more of the expected profitability of the business.
6
Table of Contents
Disciplined Investment Portfolio
Our investment objective is to protect and conservatively grow the cash flows and profits generated by our insurance underwriting segments. Our investment philosophy is guided by a focus on maximizing after-tax net investment income while generating long-term growth in shareholder value. Our investments include highly-rated fixed maturity securities and equity securities with attractive dividend yields.
Segment and Geographic Information
For financial information concerning our operations by segment and geographic data, see “Segment Operations” included in Item 7., Management’s Discussion and Analysis of Financial Condition and Results of Operations (Management’s Discussion and Analysis) and Note 12, “Segments” to the Consolidated Financial Statements.
Insurance Underwriting Operations
Our insurance operations are managed within our insurance underwriting segments. The following provides an overview of each of these segments.
U.S. Property & Casualty Segment
Our U.S. Property & Casualty segment includes specialty lines of insurance such as aviation, primary and excess casualty, small account errors and omissions liability (E&O), employment practices liability (EPLI), disability, contingency, public risk, technical and construction property, title and mortgage reinsurance, residual value, and brown water marine written in the U.S. The majority of the business is primary coverage, and claims are reported and settled on a short to medium-term basis. The aviation, contingency, public risk, technical and construction property, and brown water marine lines are exposed to natural peril and other catastrophic occurrences. Business is produced primarily from wholesale and specialty retail brokers.
Key lines of business within this segment are described below:
Aviation
Aviation insurance has been a core business for us since 1974. In the United States, we are an industry leader, providing customized coverages for both private and commercial aircraft operators, excluding major U.S. airlines. Private coverage, which is written on a direct to consumer basis, covers planes ranging in size from small single-engine aircraft to executive jets. With our commercial and special risk products, we provide coverage for risks such as air ambulances, vintage war birds and rotor wing aircraft. We also write aviation business internationally, including complex accounts such as national armed forces, law enforcement agencies and regional airlines. We are the lead underwriter on numerous policies in our international aviation portfolio.
Liability
Our liability business primarily consists of our casualty and small account E&O business. We began the casualty business in 2011 with two new underwriting teams focused on writing primary general liability and excess casualty coverages. The primary casualty unit typically writes policies with low limits ($5.0 million or less) on a surplus lines basis through wholesale brokers. The excess casualty unit also typically operates on a surplus lines basis through wholesale brokers, but these policies typically have low limits to medium limits (up to $10.0 million). The attachment points for excess policies are typically below $25.0 million. Due to the underlying nature of the claims associated with casualty business, the final settlement value of claims may not be determined for long periods of time.
7
Table of Contents
Our small account E&O business consists of policies with low limits. We provide E&O coverage to many classes of professional service providers, of which architects, engineers and related construction practices represent the largest concentration of insured professionals. Managing general agencies that we have acquired have provided insurance and risk management services for more than twenty years to these classes. We do not write a material amount of E&O coverage for the legal, medical or accounting professions. Our E&O business is produced through both wholesale and specialty retail brokers and is underwritten on both an admitted and surplus lines basis.
Sports & Entertainment
We are a leading underwriter of specialty sports and entertainment disability products, providing coverage of irreplaceable human assets, such as high profile athletes, entertainers and business executives. As a leader in the contingency market, we provide weather insurance and event cancellation, covering events such as collegiate championships, All-Star Games and large musical concerts. We also write kidnap and ransom insurance, providing coverage throughout the world. We write large limits (greater than $10.0 million) and purchase significant proportional and excess of loss reinsurance to manage these exposures.
Public Risk
We provide insurance coverage and associated risk management services to municipal entities and special districts, mainly serving populations of less than 100,000 in the United States. Types of coverage provided include automobile physical damage, automobile liability, boiler and machinery, crime, EPLI, general liability, inland marine, law enforcement liability, public officials liability, and property. We typically write large limits for property coverage, and low limits and medium limits for the other types of coverage.
Professional Liability Segment
Our Professional Liability segment primarily consists of our directors’ and officers’ (D&O) liability business. In addition, we write related professional liability and crime business coverages, including large account E&O liability, fiduciary liability, fidelity and bankers blanket bonds, EPLI, transactional insurance and cyber liability. The business is written for both U.S.-based and International-based policyholders from our offices in the United States, the United Kingdom and Spain. A significant amount of the business is received from major worldwide insurance brokerage companies. Along with the specialization and experience of our underwriters, HCC’s financial strength ratings help us maintain a competitive position in our D&O business.
We write both primary and excess policies for public and private companies. Our policies cover a large number of commercial classes and financial institution classes, which include investment banks, depository institutions, private equity companies, insurance companies, and brokers and investment advisors. A large amount of the public company and financial institution business is large limit that is subject to severity of loss on individual policies, as well as fluctuations in frequency of loss from changes in worldwide business and economic environments. Coverage is typically provided through “claims made” policies. However, the final settlement value of claims may not be determined for long periods of time due to the underlying nature of the claims, which involve complex litigation by third parties against our insureds.
8
Table of Contents
Accident & Health Segment
Our Accident & Health segment includes medical stop-loss and short-term medical products primarily written in the United States. Our short-term medical product experienced significant growth in 2014 as individuals selected this product in lieu of coverage under the U.S. Affordable Care Act, which began enrollments in late 2013.
We are a recognized market leader in the specialty accident and health industry. Since 1996, we have achieved growth primarily through acquisitions and ongoing development of specialized products. As a result of our acquisitions, we have fortified our market position and retained an experienced senior management team with an average of over 20 years of experience. Our more recent growth has been organic as we leverage our scale and relationships with brokers, as well as our Internet marketing capabilities. Our specialized product line combined with disciplined underwriting, innovative claims management and cost-efficient operations provides a superior operating margin for this segment.
Key lines of business within this segment are described below:
Medical Stop-Loss
Medical stop-loss insurance provides protection for catastrophic losses to employers that self-fund their employee benefit plans. We deliver this insurance to employers through insurance brokers, consultants and third party administrators. Our underwriting offices are strategically located throughout the United States, allowing us to geographically manage the business. Our highly-trained medical stop-loss claims unit exclusively deals with the complex nature of catastrophic health claims and works closely with employers and their plan administrators to control plan costs. Claims are reported and settled within 12 to 15 months for each reporting year. Each policy is underwritten annually, providing us the ability to maintain pricing in line with medical cost inflation.
Short-term Medical
Our short-term medical insurance provides temporary coverage, up to eleven months, for individuals in the United States without primary insurance during transitional periods. Our international medical insurance plans provide health insurance and specialized travel services to individuals outside their home country. Several types of international medical products are offered, including short and long-term individual and group plans. Both the short-term domestic and international medical products are purchased through an Internet portal accessed by consumers, brokers and consultants. The average policy term for short-term medical coverage is less than six months, and claims are reported and settled quickly.
U.S. Surety & Credit Segment
Our U.S. Surety & Credit segment conducts business through separate specialty surety underwriting operations and credit underwriting operations, which are described below:
Surety
Our surety business includes contract surety bonds, commercial surety bonds and bail bonds. A large amount of our contract surety book is characterized by relatively small limits and premiums. Significant classes within commercial surety are license and permit bonds, court bonds for fiduciaries as well as appeal bonds, and plug and abandonment bonds for the energy sector. Most of our commercial surety bond business is small limit and small premium business, but we also have a large commercial surety business that has higher limits. Our surety business is typically received from a large number of independent agents specializing in these coverages or from specialized units of large brokerage companies.
The surety industry has lower expected loss ratios and higher expense ratios than most areas of the property and casualty insurance industry. The lower expected loss ratios reflect the fact that the bond serves as financial protection to a third party in the event a principal is unable to honor an obligation, rather than an insurance policy that pays on behalf of a policyholder. In the event of a claim against a bond, we often receive subrogation recovery against the loss, including recovery from the bond principal. The higher expense ratios result from higher acquisition and underwriting expenses than in most property and casualty lines. The claims process can be complex, particularly on contract surety claims, and subrogation recovery frequently takes extended periods of time, resulting in medium tail business.
9
Table of Contents
Credit
Our credit business provides insurance policies that insure against the risk of non-payment on trade-related transactions and financings. These policies are provided to manufacturers, banks and trading companies. Coverage is provided on a single debtor or multiple debtor basis, with multi-debtor coverage generally provided on an excess of loss basis. Political risk insurance is also provided. The business is large limit and large premium business. Underwriting includes credit quality analysis of individual transactions, as well as controlling aggregation of limits by debtor and by country. Potential claims are reported promptly. While most policies have a term of two years or less, coverage can be as long as five years. In most claims, there is the possibility of subrogation recoveries, although these can extend over several years. As a result, the business has a medium tail.
International Segment
Our International segment includes energy, ocean marine, property treaty, surety, credit, liability, property (direct and facultative), accident and health and other smaller product lines written from operations in the United Kingdom, Spain and Ireland. A large part of the business is written in London through both our insurance company operations and our Lloyd’s syndicate and is primarily received from the major worldwide insurance brokerage companies.
Our energy, ocean marine, property treaty, property and accident and health lines are exposed to natural peril and other catastrophic occurrences. The underwriting process for these lines includes not only evaluation of individual risks but also aggregations of limits by peril by catastrophe area.
Key lines of business within this segment are described below:
Marine & Energy
We provide coverage for insureds involved in all areas of energy, ranging from upstream exploration and production, through midstream storage and transmission, to downstream refining and petrochemical activities. Offshore risks include drilling rigs, production and gathering platforms, and pipelines. We underwrite physical damage, liability, business interruption and various ancillary coverages. We also underwrite marine risks for ocean-going vessels. The marine and energy business is characterized by large limits and large premiums and includes both primary and excess policies. Claims for this business are reported and settled on a medium-term basis.
Property Treaty
Our property treaty line provides reinsurance to a variety of clients worldwide, offering a range of treaty coverages including property catastrophe, property risk and engineering, which covers property risks during construction. Catastrophe excess of loss business is the largest portion of the portfolio. The business is characterized by large limits, large premiums and short to medium-tail claims reporting and settlement.
Surety & Credit
Our surety business specializes in performance bonds for construction companies and also writes customs, pension, environment, auctioneer’s and other miscellaneous classes of bonds in the United Kingdom, Ireland, Spain and France. The business is written directly with the client or through insurance brokers. Our credit business is written through the U.K. specialist broker market with a focus on the construction sector. The credit business is characterized by small to medium limits and short-tail claims reporting and settlement.
Liability
Our liability lines primarily include U.K. professional indemnity, employers’ liability and public liability coverages. Professional indemnity coverages are focused on small and medium size enterprises and cover a range of professions. The employers’ liability and public liability lines provide coverage on both a primary and excess basis for a range of companies. The business is characterized by small to medium limits and long-tail claims reporting and settlement.
10
Table of Contents
Property (Direct and Facultative)
We write direct and facultative property coverage on a following basis, often with catastrophe exposure, for numerous classes including manufacturing, retail, real estate, hotels and municipalities. We provide coverage for both physical damage and business interruption on a worldwide basis to companies ranging in size from small to multinational.
Investing Segment
The Investing segment includes our consolidated investment portfolio, as well as the results from these investments, including investment income, investment related expenses, realized investment gains and losses, and other-than-temporary impairment credit losses on investments. We manage and evaluate our investments centrally as we believe this approach maximizes our investment performance and allows our underwriting segment managers to focus solely on the generation of underwriting results.
Our investment objectives are as follows:
| • | Preserve and grow our shareholders’ equity, |
| • | Maximize net investment income on an after-tax basis, |
| • | Maintain appropriate liquidity to satisfy the requirements of current operations and insurance reserve obligations, |
| • | Comply with all portfolio risk constraints established by management and the Board of Directors, |
| • | Comply with all applicable regulatory requirements, and |
| • | Effectively hedge the economic exposures of insurance liabilities in their functional currency. |
For additional discussion about the composition and results of our Investing Segment, see “Investing Segment” included in Management’s Discussion and Analysis and Note 2, “Investments” to the Consolidated Financial Statements.
Enterprise Risk Management
Enterprise Risk Management (ERM) is an integral part of our business and financial management processes, from our strategic planning process to our day-to-day operations. ERM helps us identify, analyze, assess, monitor, manage and communicate material risks (both internal and external) and opportunities that may affect our performance and reputation. Our business objectives drive the company’s activities and, therefore, the key objectives of our ERM process are to support our decision making and to promote a culture of risk awareness throughout the company, thereby allowing us to preserve and grow our shareholders’ equity.
Our ERM initiative is supported by the Enterprise Risk Oversight Committee of our Board of Directors. Our internal risk management functions are led by the Senior Vice President of our Enterprise Risk Management Department, who reports to the Chief Executive Officer. In addition, an internal Risk Committee, comprised of our senior executives, reports to the Chief Executive Officer and assists the Board in identifying and assessing risks.
We use a variety of methods and tools company-wide in our risk assessment and management efforts. Our key methods and tools include: 1) underwriting risk management, in which we set underwriting authority limits and approvals required for exceptions to established limits and monitor significant accumulations of exposures, particularly across business units and segments, 2) natural catastrophic risk management, where a variety of catastrophe modeling techniques, both internal and external, are used to monitor exposures against our stated risk tolerance, 3) a Reinsurance Security Policy Committee, which is responsible for monitoring reinsurers, reinsurance recoverable balances and changes in a reinsurer’s financial condition, 4) investment risk management, where the Investment and Finance Committee of our Board of Directors provides oversight of our capital and financial resources, as well as our investment policies, strategies, transactions and investment performance, 5) development and use of various analytical tools (including our economic capital model), which assist us with decisions on risk and expected return on risk, 6) the use of outside experts to perform scenario testing, where deemed beneficial and 7) a risk reporting framework, including a risk dashboard, to regularly communicate to management and the Board of Directors our risk profile related to our risk appetite and tolerances, which guide our risk and reward preferences over time. We plan to continue to invest in resources and technology to support our ERM process.
11
Table of Contents
Reserves for Insurance Claims
We underwrite insurance risks and establish actual and estimated reserves for insurance claims under the policies we have written. Our gross reserves for insurance claims, shown as loss and loss adjustment expense payable on our consolidated balance sheet, consist of reserves for reported claims (referred to herein as case reserves) and reserves for incurred but not reported losses (referred to herein as IBNR). Our IBNR reserves also cover potential movement in claims already reported. Our net reserves reflect the offset of reinsurance recoverables due to us from third party reinsurers, based upon the contractual terms of our reinsurance agreements. In the normal course of our business, we cede a portion of our premium to domestic and foreign reinsurers through treaty and facultative reinsurance agreements. Although reinsurance does not discharge us from liability to our policyholders, we participate in reinsurance agreements to limit our loss exposure and to protect us against catastrophic losses.
Our recorded reserves represent management’s best estimate of unpaid losses and loss adjustment expense as of each quarter end. The process of estimating our reserves is inherently uncertain and involves a considerable degree of judgment involving our management review and actuarial processes. The estimate of our reserves is increased or decreased as more information becomes known about the frequency and severity of losses for individual years. We believe our review process is effective, such that any required changes in reserves are recognized in the period of change as soon as the need for the change is evident. See “Critical Accounting Policies – Reserves” included in Management’s Discussion and Analysis for a full discussion of our reserving policies and procedures.
Loss development represents an increase or decrease in our estimates of ultimate losses related to business written in prior accident years. A redundancy, also referred to as favorable development, means our original ultimate loss estimate was higher than the current estimate. A deficiency, or adverse development, means our current ultimate loss estimate is higher than the original estimate. A loss development triangle details the subsequent years’ changes in our loss estimates from the prior loss estimates, based on experience at the end of each succeeding year.
The table below shows development of our reserves from 2004 through 2014, as of December 31, 2014. The first line shows our net reserves, including reserves for IBNR, recorded on our consolidated balance sheet at the indicated year-end. The first section of the table shows, by year, the cumulative amount of net losses and loss adjustment expenses paid at the end of each succeeding year. The second section shows the re-estimated net liability in later years for the years indicated. The cumulative redundancy (deficiency) line represents the difference between the latest re-estimated net liability and the originally estimated net reserves. The bottom section of the table shows our gross reserves and reinsurance recoverables, as well as re-estimated amounts at the indicated year-end.
12
Table of Contents
| (in thousands) | 2014 | 2013 | 2012 | 2011 | 2010 | 2009 | 2008 | 2007 | 2006 | 2005 | 2004 | |||||||||||||||||||||||||||||||||
| Reserves, net of reinsurance |
$ | 2,657,622 | $ | 2,779,401 | $ | 2,749,803 | $ | 2,683,483 | $ | 2,537,772 | $ | 2,555,840 | $ | 2,416,271 | $ | 2,342,800 | $ | 2,108,961 | $ | 1,533,433 | $ | 1,059,283 | ||||||||||||||||||||||
| Reserve adjustments* |
— | — | — | 14,705 | 20,969 | 32,569 | 59,303 | 70,242 | 46,761 | 21,997 | 6,613 | |||||||||||||||||||||||||||||||||
|
|
|
|
|
|
|
|
|
|
|
|
|
|
|
|
|
|
|
|
|
|
|
|||||||||||||||||||||||
| Adjusted reserves, net of reinsurance |
2,657,622 | 2,779,401 | 2,749,803 | 2,698,188 | 2,558,741 | 2,588,409 | 2,475,574 | 2,413,042 | 2,155,722 | 1,555,430 | 1,065,896 | |||||||||||||||||||||||||||||||||
| Cumulative paid, net of reinsurance, at: |
||||||||||||||||||||||||||||||||||||||||||||
| One year later |
856,896 | 736,351 | 729,335 | 726,445 | 763,140 | 618,699 | 687,675 | 556,096 | 222,336 | 172,224 | ||||||||||||||||||||||||||||||||||
| Two years later |
1,236,328 | 1,109,699 | 1,114,541 | 1,144,929 | 1,001,369 | 940,636 | 858,586 | 420,816 | 195,663 | |||||||||||||||||||||||||||||||||||
| Three years later |
1,494,937 | 1,369,086 | 1,432,617 | 1,263,091 | 1,177,900 | 1,013,122 | 588,659 | 337,330 | ||||||||||||||||||||||||||||||||||||
| Four years later |
1,668,676 | 1,645,216 | 1,408,275 | 1,331,379 | 1,176,404 | 702,072 | 424,308 | |||||||||||||||||||||||||||||||||||||
| Five years later |
1,875,365 | 1,604,167 | 1,392,797 | 1,299,663 | 822,133 | 495,642 | ||||||||||||||||||||||||||||||||||||||
| Six years later |
1,791,769 | 1,543,849 | 1,375,431 | 927,657 | 581,418 | |||||||||||||||||||||||||||||||||||||||
| Seven years later |
1,672,995 | 1,448,100 | 988,152 | 661,517 | ||||||||||||||||||||||||||||||||||||||||
| Eight years later |
1,584,105 | 1,053,879 | 701,979 | |||||||||||||||||||||||||||||||||||||||||
| Nine years later |
1,182,851 | 763,445 | ||||||||||||||||||||||||||||||||||||||||||
| Ten years later |
871,736 | |||||||||||||||||||||||||||||||||||||||||||
| Re-estimated liability, net of reinsurance, at: |
||||||||||||||||||||||||||||||||||||||||||||
| End of year |
2,657,622 | 2,779,401 | 2,749,803 | 2,698,188 | 2,558,741 | 2,588,409 | 2,475,574 | 2,413,042 | 2,155,722 | 1,555,430 | 1,065,896 | |||||||||||||||||||||||||||||||||
| One year later |
2,723,044 | 2,676,061 | 2,628,177 | 2,568,888 | 2,565,746 | 2,422,050 | 2,330,671 | 2,129,325 | 1,548,904 | 1,091,290 | ||||||||||||||||||||||||||||||||||
| Two years later |
2,635,256 | 2,608,244 | 2,506,803 | 2,525,266 | 2,367,979 | 2,241,422 | 2,018,898 | 1,522,411 | 1,090,568 | |||||||||||||||||||||||||||||||||||
| Three years later |
2,617,578 | 2,502,208 | 2,482,192 | 2,292,210 | 2,184,222 | 1,919,507 | 1,434,327 | 1,084,585 | ||||||||||||||||||||||||||||||||||||
| Four years later |
2,530,782 | 2,518,979 | 2,254,239 | 2,107,876 | 1,887,146 | 1,364,822 | 1,043,778 | |||||||||||||||||||||||||||||||||||||
| Five years later |
2,559,085 | 2,255,310 | 2,017,782 | 1,825,976 | 1,342,769 | 1,019,071 | ||||||||||||||||||||||||||||||||||||||
| Six years later |
2,295,129 | 2,207,316 | 1,797,913 | 1,292,149 | 1,019,322 | |||||||||||||||||||||||||||||||||||||||
| Seven years later |
2,055,768 | 1,839,545 | 1,316,416 | 983,932 | ||||||||||||||||||||||||||||||||||||||||
| Eight years later |
1,869,068 | 1,389,602 | 1,003,117 | |||||||||||||||||||||||||||||||||||||||||
| Nine years later |
1,438,312 | 1,071,886 | ||||||||||||||||||||||||||||||||||||||||||
| Ten years later |
1,074,603 | |||||||||||||||||||||||||||||||||||||||||||
| Cumulative redundancy (deficiency), net of reinsurance |
$ | 56,357 | $ | 114,547 | $ | 80,610 | $ | 27,959 | $ | 29,324 | $ | 180,445 | $ | 357,274 | $ | 286,654 | $ | 117,118 | ($ | 8,707 | ) | |||||||||||||||||||||||
|
|
|
|
|
|
|
|
|
|
|
|
|
|
|
|
|
|
|
|
|
|||||||||||||||||||||||||
| Gross reserves, end of year* |
$ | 3,728,085 | $ | 3,902,132 | $ | 3,767,850 | $ | 3,678,271 | $ | 3,497,954 | $ | 3,528,628 | $ | 3,484,886 | $ | 3,309,621 | $ | 3,150,213 | $ | 2,838,231 | $ | 2,096,940 | ||||||||||||||||||||||
| Reinsurance recoverables* |
1,070,463 | 1,122,731 | 1,018,047 | 980,083 | 939,213 | 940,219 | 1,009,312 | 896,579 | 994,491 | 1,282,801 | 1,031,044 | |||||||||||||||||||||||||||||||||
|
|
|
|
|
|
|
|
|
|
|
|
|
|
|
|
|
|
|
|
|
|
|
|||||||||||||||||||||||
| Net reserves, end of year* |
$ | 2,657,622 | $ | 2,779,401 | $ | 2,749,803 | $ | 2,698,188 | $ | 2,558,741 | $ | 2,588,409 | $ | 2,475,574 | $ | 2,413,042 | $ | 2,155,722 | $ | 1,555,430 | $ | 1,065,896 | ||||||||||||||||||||||
|
|
|
|
|
|
|
|
|
|
|
|
|
|
|
|
|
|
|
|
|
|
|
|||||||||||||||||||||||
| Re-estimated gross liability |
$ | 3,728,085 | $ | 3,902,453 | $ | 3,878,287 | $ | 3,852,960 | $ | 3,730,358 | $ | 3,783,421 | $ | 3,539,020 | $ | 3,128,566 | $ | 2,938,020 | $ | 2,798,852 | $ | 2,285,094 | ||||||||||||||||||||||
| Re-estimated reinsurance recoverables |
1,070,463 | 1,179,409 | 1,243,031 | 1,235,382 | 1,199,576 | 1,224,336 | 1,243,891 | 1,072,798 | 1,068,952 | 1,360,540 | 1,210,491 | |||||||||||||||||||||||||||||||||
|
|
|
|
|
|
|
|
|
|
|
|
|
|
|
|
|
|
|
|
|
|
|
|||||||||||||||||||||||
| Re-estimated net liability |
$ | 2,657,622 | $ | 2,723,044 | $ | 2,635,256 | $ | 2,617,578 | $ | 2,530,782 | $ | 2,559,085 | $ | 2,295,129 | $ | 2,055,768 | $ | 1,869,068 | $ | 1,438,312 | $ | 1,074,603 | ||||||||||||||||||||||
|
|
|
|
|
|
|
|
|
|
|
|
|
|
|
|
|
|
|
|
|
|
|
|||||||||||||||||||||||
| Cumulative gross redundancy (deficiency) |
($ | 321 | ) | ($ | 110,437 | ) | ($ | 174,689 | ) | ($ | 232,404 | ) | ($ | 254,793 | ) | ($ | 54,134 | ) | $ | 181,055 | $ | 212,193 | $ | 39,379 | ($ | 188,154 | ) | |||||||||||||||||
|
|
|
|
|
|
|
|
|
|
|
|
|
|
|
|
|
|
|
|
|
|||||||||||||||||||||||||
* Adjusted for acquisitions and dispositions.
13
Table of Contents
Most of our lines of business have historically experienced favorable loss development. The cumulative redundancies shown in the loss triangle table resulted from the net favorable loss development that we reported in our financial statements from 2007 through 2014. The amounts in the table below (in thousands) exclude adverse development related to both our diversified financial products in 2011 and the Spanish surety bonds in 2011 – 2014, which are discussed following the table.
| Gross | Net | |||||||
| 2014 |
$ | 82,184 | $ | 99,819 | ||||
| 2013 |
139,968 | 144,063 | ||||||
| 2012 |
159,110 | 118,911 | ||||||
| 2011 |
171,617 | 106,830 | ||||||
| 2010 |
16,352 | 22,663 | ||||||
| 2009 |
90,435 | 53,524 | ||||||
| 2008 |
72,044 | 82,371 | ||||||
| 2007 |
90,621 | 26,397 | ||||||
The majority of the net favorable development in the table above related to these products: 1) D&O in our Professional Liability segment, for the 2002 – 2006 underwriting years, 2) U.K. professional liability, energy and property (including redundancy on the 2005, 2008 and 2011 catastrophe losses) in our International segment, 3) surety in our U.S. Surety & Credit segment and 4) an assumed quota share program that we wrote from 2003 to 2008 in our U.S. Property & Casualty segment.
During the past four years, we increased our reserves related to a specific class of Spanish surety bonds, the majority of which were written prior to 2006. We increased net reserves by $43.5 million in 2014, $70.3 million in 2013, $48.9 million in 2012 and $12.8 million in 2011. See “Segment Operations – International Segment” included in Management’s Discussion and Analysis for additional discussion.
During 2011, we increased our net reserves by $104.2 million for the diversified financial products (DFP) line of business, which provides coverage for private equity partnerships, hedge funds, investment managers and similar groups. This increase resulted from revised assumptions with regards to the frequency and severity of claims, primarily in the 2009 and 2010 accident years. Our expectation prior to our 2011 reserve review was that the frequency and severity of claims after 2008 would be more consistent with our experience prior to the worldwide financial crisis in 2007 and 2008. However, our reserve review indicated that loss experience was emerging consistent with the financial crisis period, prompting our revised assumptions at that time.
The early years in the loss triangle table were also impacted by adverse development from a block of run-off assumed accident and health reinsurance business in our Exited Lines. This business was primarily excess coverage for large losses related to workers’ compensation policies. We increased our net reserves by $25.1 million in 2006 and $35.0 million in 2005, primarily due to reinsurance commutations totaling $20.2 million in 2006 and $26.0 million in 2005. Commutations can produce adverse development since, under generally accepted accounting principles, any excess of undiscounted reserves assumed over assets received must be recorded as a loss at the time the commutation is completed. The remaining adverse development affected the 2001 and prior accident years.
14
Table of Contents
Regulation
The business of insurance is extensively regulated by the government. Our business depends on our compliance with applicable laws and regulations and our ability to maintain valid licenses and approvals for our operations. Generally, regulatory authorities are vested with broad discretion to grant, renew and revoke licenses and approvals and to implement regulations governing the business and operations of insurers, insurance agents, brokers and third party administrators. In all jurisdictions, the applicable laws and regulations are subject to amendment or interpretation by regulatory authorities.
United States
State Governments
At this time, the insurance business in the United States is regulated primarily by the individual states. Although the extent of the regulation varies, it relates to, among other things: 1) standards of solvency that must be met and maintained, 2) licensing of insurers and their agents, 3) approval of policy forms, 4) restrictions on the size of risks that may be insured under a single policy, 5) regulation of market conduct, as well as other underwriting claim practices, 6) premium rates, 7) reserves and provisions for unearned premium, losses and other obligations, 8) the nature of and limitations on investments and 9) usage of certain methods of accounting for statutory reporting purposes.
State insurance regulations are intended primarily for the protection of policyholders rather than shareholders. The state insurance departments monitor compliance with regulations through periodic reporting procedures and examinations. The quarterly and annual financial reports to the state insurance regulators utilize statutory accounting principles, which are different from generally accepted accounting principles (GAAP) that we use in our reports to shareholders. Statutory accounting principles, in keeping with the intent to assure the protection of policyholders, are generally based on a solvency concept, while GAAP is based on a going-concern concept.
The state insurance regulators utilize risk-based capital measurements, developed by the National Association of Insurance Commissioners (NAIC), to identify insurance companies that potentially are inadequately capitalized. The NAIC’s risk-based capital model is intended to establish minimum capital thresholds that vary with the size and mix of an insurance company’s business and assets. It is designed to identify companies with capital levels that may require regulatory attention. At December 31, 2014, each of our domestic insurance companies’ total adjusted capital was significantly in excess of the authorized control level risk-based capital.
In 2012, the NAIC adopted the Risk Management and Own Risk and Solvency Assessment (ORSA) Model Act, which, following enactment at the state level, will be effective in 2015. ORSA requires U.S. insurance companies and their groups to regularly, but no less than annually: 1) conduct an assessment of the adequacy of its risk management framework and current and estimated future solvency position, 2) internally document the process and results of such assessment and 3) provide a confidential, high level summary of such assessment to certain state regulatory authorities. We are currently in the process of completing our initial submission and believe we have an ERM framework in place that is effective in meeting the ORSA requirements.
The U.S. state insurance regulations also affect the payment of dividends and other distributions by insurance companies to their shareholders. Generally, insurance companies are limited by these regulations in the payment of dividends above a specified level. Dividends in excess of those thresholds are “extraordinary dividends” and are subject to prior regulatory approval. Some states require prior regulatory approval for all dividends.
Because we are an insurance holding company, we are subject to the insurance holding company system regulatory requirements of a number of states. Under these regulations, we are required to report information regarding our capital structure, financial condition and management. We are also required to provide prior notice to, or seek the prior approval of, insurance regulatory authorities of certain agreements and transactions between our affiliated companies. These agreements and transactions must satisfy certain regulatory requirements.
15
Table of Contents
Federal Government
Although the U.S. Federal government has not historically regulated the insurance industry, the Dodd-Frank Wall Street Reform and Consumer Protection Act (Dodd-Frank Act), enacted in 2010, expands the federal presence in insurance oversight. The Dodd-Frank Act’s requirements include streamlining the state-based regulation of reinsurance and non-admitted insurance. The Dodd-Frank Act also established the Federal Insurance Office (FIO) within the U.S. Department of the Treasury, with powers over most lines of insurance, and the Financial Stability Oversight Council (FSOC).
The FIO is authorized to gather data and information to monitor aspects of the insurance industry, identify issues in the regulation of insurers about insurance matters, and preempt state insurance measures under certain circumstances. Although the FIO is prohibited from directly regulating the business of insurance, the FIO may also recommend enhanced regulations to state regulatory authorities or recommend to the FSOC that it designate an insurer as a “systemically important financial institution” (SIFI). An insurer designated as a SIFI could be subject to Federal Reserve supervision and heightened regulatory standards. While we do not believe that HCC or any of its companies qualify as a SIFI, it is possible the FSOC could conclude otherwise.
Our crop insurance business writes multi-peril crop insurance through the federal crop insurance program administered by the U.S. Department of Agriculture’s Risk Management Agency (RMA). The RMA sets all policy terms and conditions, mandates rates and forms, and establishes and monitors compliance standards under the program. We are a party to a Standard Reinsurance Agreement, which defines the reinsurance relationship between private insurance companies and the Federal Crop Insurance Corporation and specifies the terms and conditions of the underwriting risks each party will bear.
United Kingdom
In 2013, the United Kingdom reshaped the regulation of all financial services companies, including the insurance industry, by enacting three separate regulatory bodies. The Financial Policy Committee, a committee within the Bank of England, is responsible for identifying emerging risks to the financial system as a whole and providing strategic direction for the entire regulatory regime. The Prudential Regulatory Authority is responsible for promoting the safety and soundness of systemically important firms, including insurers, and ensuring policyholders are protected in the event of a company’s failure. The Financial Conduct Authority is responsible for overseeing consumer protection, promoting effective competition and protecting the integrity of the U.K. financial system. These bodies regulate operations in our U.K. insurance company, as well as its Spanish branch. Effective December 31, 2014, we received approval to merge our Spanish insurance company into our U.K. insurance company in early 2015.
We maintain 100% participation in Lloyd’s Syndicate 4141. Under our membership agreement with Lloyd’s, we must comply with all Lloyd’s rules and regulations, as well as applicable provisions of the Lloyd’s Acts and Financial Services and Markets Act 2000. Our underwriting capacity on Syndicate 4141 must be supported by a deposit of cash, securities or letters of credit (referred to as “Funds at Lloyd’s”), which is determined annually by Lloyd’s. Lloyd’s requires annual approval of Syndicate 4141’s business plan, including maximum underwriting capacity, and may require changes to any business plan or additional capital to support the underwriting capacity. If a member of Lloyd’s is unable to pay its debts to policyholders, such debts may be payable by the Lloyd’s Central Fund. Lloyd’s has the power to assess current Lloyd’s members up to 3% of the member’s underwriting capacity in any one year as a Central Fund contribution.
Our U.K. insurance companies will be required to meet the requirements of the European Union’s (EU) new financial services regulatory regime known as “Solvency II,” which is built on a risk-based approach to setting capital requirements for insurers. Solvency II establishes a revised set of EU-wide capital requirements and risk management standards that will replace the current solvency requirements. Solvency II is effective on January 1, 2016. We have made significant progress in meeting the Solvency II requirements in our U.K. companies; however, the broader impact to us will depend on whether the U.S. insurance regulatory regime is deemed “equivalent” to Solvency II. Whether the U.S. insurance regulatory regime will be deemed “equivalent” is still under consideration by EU authorities, so we are currently unable to predict the full impact of the Solvency II implementation.
16
Table of Contents
The Financial Stability Board (FSB), consisting of representatives of national financial authorities of the G20 nations, has issued a series of frameworks and recommendations intended to produce significant changes in how financial companies should be regulated. These frameworks and recommendations address such issues as financial group supervision, capital and solvency standards, systemic economic risk, corporate governance including compensation, and related issues associated with responses to the financial crisis. The FSB has directed the International Association of Insurance Supervisors (IAIS) to create standards relative to these areas and incorporate them in that body’s Insurance Core Principles, which form the baseline for how countries’ financial services regulatory efforts are measured relative to the insurance sector. That measurement is made by periodic Financial Sector Assessment Program (FSAP) reviews conducted by the World Bank and the International Monetary Fund, and the reports thereon spur development of country-specific additional or amended regulatory changes. Lawmakers and regulatory authorities in a number of jurisdictions in which our companies conduct business have already begun implementing legislative and regulatory changes consistent with these recommendations.
Insurance Companies
The following is a list of our insurance companies that are subject to regulation:
United States
| • | American Contractors Indemnity Company |
| • | Avemco Insurance Company |
| • | HCC Life Insurance Company |
| • | HCC Specialty Insurance Company |
| • | Houston Casualty Company |
| • | Producers Agriculture Insurance Company |
| • | Producers Lloyds Insurance Company |
| • | United States Surety Company |
| • | U.S. Specialty Insurance Company |
United Kingdom
| • | HCC International Insurance Company PLC |
| • | Houston Casualty Company-London |
| • | Lloyd’s of London Syndicate 4141 |
Bermuda
| • | HCC Reinsurance Company Limited |
Agencies
The jurisdictions in which each of our underwriting agencies operate impose licensing and other requirements. These regulations relate primarily to: 1) licensing as agents, brokers, reinsurance brokers, managing general agents or third party administrators, 2) advertising and business practice rules, 3) contractual requirements, 4) limitations on authority, 5) financial security and 6) record keeping requirements.
The following is a list of our underwriting agencies that are subject to regulation:
| • | HCC Casualty Insurance Services, Inc. |
| • | HCC Global Financial Products |
| • | HCC Indemnity Guaranty Agency |
| • | HCC Medical Insurance Services |
| • | HCC Specialty Underwriters, Inc. |
| • | HCC Underwriting Agency Ltd. |
| • | Pro Ag Management, Inc. |
| • | Professional Indemnity Agency, Inc. |
17
Table of Contents
Terrorism Risk Insurance Act
The Federal Terrorism Risk Insurance Act (TRIA) was initially enacted in 2002 to ensure the availability of insurance coverage for certain acts of terrorism, as defined in the TRIA. The Terrorism Risk Insurance Program Reauthorization Act of 2007 extended the program through December 31, 2014 and revised the definition of “act of terrorism.” On January 13, 2015, the President signed into law the Terrorism Risk Insurance Program Reauthorization Act of 2015 (Reauthorization Act). The Reauthorization Act extends the program through December 31, 2020.
Under the Reauthorization Act, we are required to offer terrorism coverage to our commercial policyholders in certain lines of business, for which we may charge an additional premium. The policyholders may or may not accept such coverage. In 2015, the Reauthorization Act requires a $100.0 million terrorism-related loss event to trigger coverage. The Federal government will reimburse 85% of an insurer’s losses in excess of the insurer’s deductible, up to the maximum annual Federal liability of $100.0 billion. Our deductible for 2015 is approximately $151.2 million, which we would have to meet before the Federal reimbursement would occur.
Beginning in 2016, the trigger for the terrorism-related loss event increases by $20 million each year to reach $200 million by 2020. In addition, the Federal government reimbursement will decrease by 1% each year to reach 80% by 2020.
Executive Officers
The following is a list of our Executive Officers:
|
Name |
Principal occupation during past five years |
Age | Served HCC since | |||
| William N. Burke, Jr. | Mr. Burke has served as our President and Chief Operating Officer since December 2012. He previously served as our Executive Vice President and Chief Operating Officer from March 2012 until December 2012. Prior to joining HCC, Mr. Burke served as Chief Operating Officer for Aon Risk Solutions – US Retail. He served in various other positions with Aon Corporation and its successor company for almost 30 years. He commenced his insurance career in 1977 with the Home Insurance Company. | 59 | 2012 | |||
| Mark W. Callahan | Mr. Callahan has served as our Executive Vice President since August 2010. During that time, he also served as our Chief Underwriting Officer from March 2011 to March 2013 and our Chief Actuary from August 2010 to March 2011. Prior to joining HCC, Mr. Callahan served as the Chief Risk, Underwriting, and Actuarial Services Officer for XL Insurance. During 12 years there, he also held the positions of Senior Vice President and Underwriter for XL Financial Solutions and Executive Vice President and Chief Actuarial Officer for XL Insurance. | 44 | 2010 | |||
| Barry J. Cook | Mr. Cook has served as our Executive Vice President of International Operations and Chief Executive Officer of HCC Insurance Holdings (International) Limited, with oversight for our international operations, since 2006. From 1992 to 2005, Mr. Cook served as Chief Executive Officer of Rattner Mackenzie Limited, which we acquired in 1999. | 54 | 1999 | |||
| Brad T. Irick | Mr. Irick has served as our Executive Vice President since May 2010 and our Chief Financial Officer since August 2010. Prior to joining HCC, Mr. Irick worked in public accounting for 21 years, including 18 years with PricewaterhouseCoopers LLC (PwC), where he served as audit and advisory partner for several multinational public insurance company clients. While at PwC, Mr. Irick served as the audit partner for HCC between 2004 and the first half of 2007. Mr. Irick is a Certified Public Accountant. | 48 | 2010 | |||
18
Table of Contents
|
Name |
Principal occupation during past five years |
Age | Served HCC since | |||
| Pamela J. Penny | Ms. Penny has served as our Executive Vice President and Chief Accounting Officer since 2008. She previously served as Senior Vice President – Finance from 2004 to November 2008. Prior to joining HCC, Ms. Penny served in several financial management positions, including Senior Vice President & Controller of American General Corporation (acquired by American International Group, Inc.), and a partner in the international accounting firm KPMG LLP. Ms. Penny is a Certified Public Accountant. | 60 | 2004 | |||
| Randy D. Rinicella | Mr. Rinicella has served as our Senior Vice President, General Counsel and Secretary since 2007. Prior to joining HCC, Mr. Rinicella was Vice President, General Counsel and Secretary of Dresser-Rand Group, Inc., a publicly-traded equipment supplier to the worldwide oil, gas, petrochemical and process industries, from 2005 until 2007. Mr. Rinicella was a shareholder at the national law firm of Buchanan Ingersoll PC from 2004 until 2005, where he was a member of the firm’s corporate finance & technology practice group. | 57 | 2007 | |||
| Michael J. Schell | Mr. Schell has served as our Executive Vice President since 2002. Prior to joining HCC, Mr. Schell was with the St. Paul Companies for 25 years, most recently as President and Chief Operating Officer of St. Paul Re. | 64 | 2002 | |||
| Christopher J.B. Williams | Mr. Williams has served as our Chief Executive Officer since December 2012 and as a member of our Board of Directors since May 2007, including as Chairman of the Board from August 2008 to May 2011. He previously served as our President from May 2011 to December 2012. Before joining HCC, Mr. Williams was Chairman of Wattle Creek Winery from 2005 to May 2011. Prior to his retirement in 2005, he served as the National Director for Life, Accident & Health of Willis Re. Mr. Williams currently serves as a member of the Investment and Finance Committee and the Enterprise Risk Oversight Committee of our Board. | 58 | 2011 | |||
Employees
At December 31, 2014, we had 1,983 employees. We added 489 employees in January 2015 in connection with our acquisition of ProAg. We are not a party to any collective bargaining agreement and have not experienced work stoppages or strikes as a result of labor disputes. We consider our employee relations to be good.
Available Information
The public may read and copy any materials that we file with the Securities and Exchange Commission (SEC) at the SEC’s Public Reference Room at 100 F Street, NE, Washington, DC 20549. The public may obtain information on the operation of the Public Reference Room by calling the SEC at 1-800-SEC-0330. In addition, the SEC maintains an Internet site (www.sec.gov) that contains financial reports, proxy statements and other information that we file electronically with the SEC.
We maintain an Internet website at www.hcc.com. The reference to our Internet website address in this Report does not constitute the incorporation by reference of the information contained at the website in this Report. We will make available, free of charge through publication on our Internet website, a copy of our Annual Report on Form 10-K and Quarterly Reports on Form 10-Q and any Current Reports on Form 8-K or amendments to those reports, filed with or furnished to the SEC.
19
Table of Contents
Risks Relating to our Industry
Because we are a property and casualty insurer, our business may suffer as a result of unforeseen catastrophe losses.
Property and casualty insurers are subject to claims arising from catastrophes. Catastrophic losses have had a significant impact on our historical results. Catastrophes can be caused by various events, including hurricanes, tsunamis, tornados, windstorms, earthquakes, hailstorms, explosions, flooding, severe winter weather and fires and may include man-made events, such as terrorist attacks and systemic risks. Droughts and other perils can also have a significant adverse effect on the results of our crop insurance business. The incidence, frequency and severity of catastrophes are inherently unpredictable. Some scientists believe that in recent years, changing climate conditions have added to the unpredictability and frequency of natural disasters.
The extent of losses from a catastrophe is a function of both the total amount of insured exposure in the area affected by the event and the severity of the event. Insurance companies are not permitted to reserve for a catastrophe until it has occurred. Catastrophes can cause losses in a variety of our property and casualty lines, and most of our past catastrophe-related claims have resulted from hurricanes and earthquakes; however, we experienced significant losses from the 2001 terrorist attack in the U.S. and the 2011 tsunami in Japan. A large part of our exposure to catastrophes comes from our International segment, particularly related to our property, property treaty and energy businesses.
Although we typically purchase reinsurance protection for risks we believe bear a significant level of catastrophe exposure, the nature or magnitude of losses attributed to a catastrophic event or events may result in losses that exceed our reinsurance protection. It is therefore possible that a catastrophic event or multiple catastrophic events could have a material adverse effect on our financial position, results of operations and liquidity.
Volatility in crop prices and crop yields could adversely affect our financial results.
Weather conditions and the level of crop prices in the commodities market heavily impact our crop insurance business. A significant portion of our crop insurance business provides revenue protection to insureds for their expected crop revenues, which can be affected by changes in crop prices. We face the risk that significant losses could be incurred in the event of a decline in the applicable commodity prices prior to harvest. Our crop results also could be negatively impacted by climate conditions, weather events, disease and pests. These factors are inherently unpredictable and could have a material adverse effect on our financial position, results of operations and cash flows, and result in significant volatility in our crop results from one year to the next.
The insurance and reinsurance business is historically cyclical, and we expect to experience periods with excess underwriting capacity and unfavorable premium rates, which could cause our results to fluctuate.
The insurance and reinsurance business historically has been a cyclical industry characterized by periods of intense price competition due to excessive underwriting capacity, as well as periods when shortages of capacity permitted an increase in pricing and, thus, more favorable premium levels. An increase in premium levels is often, over time, offset by an increasing supply of insurance and reinsurance capacity, either from capital provided by new entrants or by additional capital committed by existing insurers or reinsurers, which may cause prices to decrease. In addition, changes in the frequency and severity of losses suffered by insureds and insurers may affect the cycles of the insurance and reinsurance business significantly.
Any of these factors could lead to a significant reduction in premium rates, less favorable policy terms and fewer opportunities to underwrite insurance risks, which could have a material adverse effect on our results of operations and cash flows. These factors may also cause the price of our common stock to be volatile.
20
Table of Contents
Our loss reserves are based on an estimate of our future liability, which may prove to be inadequate.
We maintain loss reserves to cover our estimated liability for unpaid losses and loss adjustment expenses, including legal and other fees, for reported and unreported claims incurred at the end of each accounting period. Reserves do not represent an exact calculation of liability. Rather, reserves represent an estimate of what we expect the ultimate settlement and administration of claims will cost. These estimates are based on our assessment of facts and circumstances then known, as well as estimates of future trends in severity of claims, frequency of claims, judicial theories of liability and other factors. These variables are affected by both internal and external events that could increase our exposure to losses, including changes in actuarial projections, claims handling procedures, inflation, climate change, economic and judicial trends, and legislative changes.
Volatility in the financial markets, economic events, legal/regulatory changes and other external factors may result in an increase in the number of claims and the severity of the claims reported, particularly in lines of business such as directors’ and officers’ liability, errors and omissions liability and trade credit insurance. Many of these items are not directly quantifiable in advance. Additionally, there may be a significant reporting delay between the occurrence of the insured event and the time it is reported to us.
The inherent uncertainties of estimating reserves are greater for certain types of liabilities, particularly those in which the various considerations affecting the type of claim are subject to change and in which long periods of time may elapse before a definitive determination of liability is made. Reserve estimates are continually refined in a regular and ongoing process as experience develops and further claims are reported and settled. Adjustments to our loss and loss adjustment expenses are reflected in our results of operations in the periods in which such estimates are changed. Because setting reserves is inherently uncertain, there can be no assurance that current reserves will prove adequate in light of subsequent events. If actual claims prove to be greater than our reserves, our financial position, results of operations and liquidity may be materially adversely affected.
We may be impacted by claims relating to economic or credit market downturns.
We write corporate directors’ and officers’ liability, errors and omissions liability and other insurance coverages for financial institutions and financial services companies. We also write trade credit business for policyholders who have credit and political risk, as well as policies in certain countries that have had adverse economic conditions. The volatility in the economy and the financial markets in the past several years has impacted this part of the industry. As a result, this part of the industry has been the subject of heightened scrutiny and, in some cases, investigations by regulators with respect to the industry’s actions. These events may give rise to increased claims litigation, including class action suits, which may involve our insureds. To the extent that the frequency or severity of claims relating to these events exceeds our current estimates used for establishing reserves, it could increase our exposure to losses from such claims and could have a material adverse effect on our financial position and results of operations.
The effects of emerging claim and coverage issues on our business are uncertain.
As industry practices and legal, judicial, social and other environmental conditions change, unexpected and unintended liability for claims and coverage may emerge. These changing conditions may adversely affect our business by either extending coverage beyond our underwriting intent or by increasing the number or size of claims. In some instances, these changes may not become apparent until we have issued insurance or reinsurance contracts that are affected by the changes. As a result, the full extent of liability under our insurance or reinsurance contracts may not be known for many years after a contract is issued, and our financial position, results of operations and cash flows may be materially adversely affected.
We are subject to extensive governmental regulation.
We are subject to extensive governmental regulation and supervision. For complete information regarding the regulations to which we are subject, see Item 1, Business — Regulation. Our business depends on compliance with applicable laws and regulations and our ability to maintain valid licenses and approvals for our operations. Most insurance regulations are designed to protect the interests of policyholders rather than shareholders and other investors. In the United States, this regulation is generally administered by departments of insurance in each state in which we do business and includes a comprehensive framework of oversight of our operations and review of our financial position. U.S. Federal legislation may lead to additional federal regulation of the insurance industry in the coming years. Also, foreign governments regulate our international operations. Each foreign jurisdiction has its own unique regulatory framework that applies to our operations in that jurisdiction.
21
Table of Contents
Regulatory authorities have broad discretion to grant, renew or revoke licenses and approvals. Regulatory authorities may deny or revoke licenses for various reasons, including the violation of regulations. In some instances, we follow practices based on our interpretations of regulations, or those we believe to be generally followed by the industry, which ultimately may be different from the requirements or interpretations of regulatory authorities. If we do not have the requisite licenses and approvals and do not comply with applicable regulatory requirements, the insurance regulatory authorities could preclude or temporarily suspend us from carrying on some or all of our activities or otherwise penalize us. That type of action could have a material adverse effect on our results of operations. Also, changes in the level of regulation of the insurance industry (whether federal, state or foreign), or changes in laws or regulations themselves or interpretations by regulatory authorities, could have a material adverse effect on our business.
Virtually all states require insurers licensed to do business in that state to bear a portion of the loss suffered by some insureds as the result of impaired or insolvent insurance companies or to bear a portion of the cost of insurance for high-risk or uninsured individuals. Depending on state law, insurers can be assessed up to 2% of premium written for the relevant line of insurance in that state. In addition, states have from time to time passed legislation that has the effect of limiting the ability of insurers to manage catastrophe risk, such as legislation limiting insurers’ ability to increase rates and prohibiting insurers from withdrawing from catastrophe-exposed areas. The effect of these arrangements could materially adversely affect our results of operations.
The Dodd-Frank Act expands the U.S. Federal government’s presence in insurance oversight, streamlines state-based regulation of reinsurance and non-admitted insurance and establishes a new Federal Insurance Office with powers over most lines of insurance other than health insurance. The Federal Insurance Office is authorized to gather data and information to monitor aspects of the insurance industry, identify issues in the regulation of insurers about insurance matters, and preempt state insurance measures under certain circumstances. As the Dodd-Frank Act calls for numerous studies and contemplates further regulation, its future impact on our results of operations or financial position cannot be determined at this time.
The European Union (EU) is phasing in a new regulatory regime for the regulation of financial services known as “Solvency II,” which is built on a risk-based approach to setting capital requirements for insurers and reinsurers. Solvency II is currently expected to be implemented on January 1, 2016. The impact on us from our implementation of Solvency II will depend on the costs associated with implementation by each EU country, any increased capital requirements applicable to us, and any costs associated with adjustments to our operations. In addition, the overall impact will depend on whether the U.S. regulatory regime is deemed equivalent to Solvency II, thereby reducing the costs of implementation. As such, we are currently not able to predict the impact of Solvency II on our financial position and results of operations.
The operations of certain of our subsidiaries are subject to laws and regulations, including the USA PATRIOT Act of 2001, which requires companies to know certain information about their clients and to monitor their transactions for suspicious activities. In addition, the Department of the Treasury’s Office of Foreign Assets Control administers regulations requiring U.S. persons to refrain from doing business, or allowing their clients to do business through them, with certain organizations or individuals on a prohibited list maintained by the U.S. government or with certain countries. The United Kingdom, the European Union and other jurisdictions maintain similar laws and regulations. Although we have instituted compliance programs to address these requirements, our participation in the global market could expose us to penalties under these laws.
We participate in the Lloyd’s of London market through 100% participation in Lloyd’s Syndicate 4141. The Lloyd’s Franchise Board requires annual approval of Syndicate 4141’s business plan, including maximum underwriting capacity, and may require changes to our business plan or additional capital to support our underwriting. Lloyd’s also imposes various charges and assessments on its member companies. If Lloyd’s were to require material changes in our business plans, or if charges and assessments payable by us to Lloyd’s were to increase significantly, these events could have an adverse effect on our operations and financial results. In addition, no assurances can be given as to how much business Lloyd’s will permit us to underwrite in the future. The financial security of the Lloyd’s market is regularly assessed by three independent rating agencies. A satisfactory credit rating issued by an accredited rating agency is necessary for Lloyd’s syndicates to be able to trade in certain classes of business at current levels. We would be adversely affected if Lloyd’s current ratings were downgraded.
22
Table of Contents
Recent federal health care reform legislation may lead to additional changes in the country’s health care delivery system.
The Patient Protection and Affordable Care Act and the related amendments in the Health Care and Education Reconciliation Act (collectively, the Legislation), enacted in 2010, has led to changes in the U.S. health care delivery system. As a result of the Legislation, there have been and may continue to be numerous changes in the health care industry, including an increasing percentage of the population that is covered for health care costs. Currently, we do not believe the Legislation will have a material adverse effect on our business. However, as further regulation is contemplated under the Legislation, we are unable to assess with certainty the full impact the Legislation may have on our business.
We cannot predict the effect, if any, climate change may have on the risks we insure.
Various scientists, environmentalists, international organizations and regulators believe that global climate change has added, and will continue to add, to the unpredictability, frequency and severity of natural disasters (including, but not limited to, hurricanes, tornados, freezes, droughts, other storms and fires) in certain parts of the world. In response to this belief, a number of legal and regulatory measures as well as social initiatives have been introduced in an effort to reduce greenhouse gas and other carbon emissions, which may be chief contributors to global climate change. We cannot predict the impact that changing climate conditions, if any, will have on our results of operations or financial condition. Moreover, we cannot predict how legal, regulatory and social responses to concerns about global climate change will impact our business. To the extent climate change does increase the unpredictability, frequency or severity of natural disasters, we may face increased claims, which could have a material adverse effect on our financial position, results of operations and cash flows.
Our reliance on agents and brokers subjects us to risk.
In many cases, we market our insurance (and reinsurance) through insurance (and reinsurance) agents and brokers. Some of these agents and brokers provide a significant portion of our gross written premium for a particular line of business. As a result, some of these agents and brokers could demand higher payments that could put us at a competitive disadvantage and affect the way we price our products. The deterioration of our relationship with, or loss of all or a substantial portion of the business provided by, one or more agents and brokers could have a material adverse effect on our financial position, results of operations and cash flows.
In accordance with industry practice, we generally pay amounts owed on claims under our insurance and reinsurance contracts to agents and brokers, and these agents and brokers, in turn, pay these amounts to the clients that have purchased insurance or reinsurance from us. Although the law is unsettled and depends upon the facts and circumstances of the particular case, in some jurisdictions, if an agent or broker fails to make such a payment, we may remain liable to the insured or ceding insurer for the deficiency. Conversely, in certain jurisdictions, when the insured or ceding insurer pays premiums for these policies to agents and brokers, these premiums might be considered to have been paid and the insured or ceding insurer will no longer be liable to us for those amounts, whether or not we have actually received the premiums from the agent or broker. Consequently, we assume a degree of credit risk associated with agents and brokers with whom we transact business. However, due to the unsettled and fact-specific nature of the law, we are unable to quantify our exposure to this risk.
Consolidation in the insurance industry could adversely impact us.
Insurance industry participants may seek to consolidate through mergers and acquisitions. Continued consolidation within the insurance industry will further enhance the already competitive underwriting environment as we would likely experience more robust competition from larger competitors. These consolidated entities may use their enhanced market power and broader capital base to take business from us or to drive down pricing, which could adversely affect the results of our operations.
23
Table of Contents
Risks Relating to our Business
Our inability to accurately assess underwriting risk could reduce our net earnings.
Our underwriting success is dependent on our ability to accurately assess the risks associated with the business on which the risk is retained. We rely on the experience of our underwriting staff in assessing these risks. If we fail to accurately assess the risks we retain, we may fail to establish appropriate premium rates and our reserves may be inadequate to cover our losses, which could reduce our net earnings. The underwriting process is further complicated by our exposure to unpredictable developments, including earthquakes, weather-related events and other natural catastrophes, as well as war and acts of terrorism and those that may result from volatility in the financial markets, the economic downturn and systemic risks.
Retentions in various lines of business expose us to potential losses.
We retain risk for our own account on business underwritten by our insurance companies. The determination to not purchase reinsurance, or to reduce the amount of reinsurance we purchase, for a particular risk or line of business is based on a variety of factors including market conditions, pricing, availability of reinsurance, the level of our capital and our loss history. Such determinations have the effect of increasing our financial exposure to losses associated with such risks or in such lines of business and, in the event of significant losses associated with such risks or lines of business, could have a material adverse effect on our financial position, results of operations and cash flows.
If we are unable to purchase adequate reinsurance protection for some of the risks we have underwritten, we will be exposed to any resulting unreinsured losses.
We purchase reinsurance for a portion of the risks underwritten by our insurance companies, especially volatile and catastrophe-exposed risks. Market conditions beyond our control determine the availability and cost of the reinsurance protection we purchase. In addition, the historical results of reinsurance programs and the availability of capital also affect the availability of reinsurance. Our reinsurance facilities are generally subject to annual renewal. We cannot assure that we can maintain our current reinsurance facilities or that we can obtain other reinsurance facilities in adequate amounts and at favorable rates. Further, we cannot determine what effect catastrophic losses will have on the reinsurance market and on our ability to obtain adequate reinsurance at favorable rates. If we are unable to renew or to obtain new reinsurance facilities on acceptable terms, either our net exposures would increase or, if we are unwilling to bear such an increase in exposure, we would have to reduce the level of our underwriting commitments, especially in catastrophe-exposed risks. Either of these potential developments could have a material adverse effect on our financial position, results of operations and cash flows.
If the companies that provide our reinsurance do not pay all of our claims, we could incur severe losses.
We purchase reinsurance by transferring, or ceding, all or part of the risk we have assumed as a direct insurer to a reinsurance company in exchange for all or part of the premium we receive in connection with the risk. Through reinsurance, we have the contractual right to collect the amount reinsured from our reinsurers. Although reinsurance makes the reinsurer liable to us to the extent the risk is transferred or ceded to the reinsurer, it does not relieve us of our full liability to our policyholders. Accordingly, we bear credit risk with respect to our reinsurers.
We cannot assure that our reinsurers will pay all of our reinsurance claims, or that they will pay our claims on a timely basis. Additionally, catastrophic losses from multiple direct insurers may accumulate within the more concentrated reinsurance market and result in claims that adversely impact the financial condition of such reinsurers and thus their ability to pay such claims. Further, additional adverse developments in the capital markets could affect our reinsurers’ ability to meet their obligations to us. If we become liable for risks we have ceded to reinsurers or if our reinsurers cease to meet their obligations to us, because they are in a weakened financial position as a result of incurred losses or otherwise, our financial position, results of operations and cash flows could be materially adversely affected.
24
Table of Contents
As a direct insurer, we may have significant exposure for terrorist acts.
To the extent that reinsurers have excluded coverage for terrorist acts or have priced such coverage at rates that we believe are not practical, we, in our capacity as a direct insurer, do not have reinsurance protection and are exposed for potential losses as a result of any terrorist acts. To the extent an act of terrorism is certified by authorized personnel of the U.S. government, we may be covered under the Terrorism Risk Insurance Program Reauthorization Act of 2015 for up to 85% of our losses in 2015, up to the maximum amount set out in the Reauthorization Act. However, any such coverage would be subject to a mandatory deductible of approximately $151.2 million in 2015. In some jurisdictions outside of the United States, where we also have exposure to a loss from an act of terrorism, we have limited access to other government programs that may mitigate our exposure.
Interpretation of this law is untested and there may be uncertainty as to how it will be applied to specific circumstances. If we become liable for risks that are not covered under the Reauthorization Act, our financial position, results of operations and cash flows could be materially adversely affected.
We may be unsuccessful in competing against larger or more well-established business rivals.
We face competition from other specialty insurance companies, standard insurance companies and underwriting agencies, as well as from diversified financial services companies that are larger than we are and that have greater financial, marketing and other resources than we do. Some of these competitors also have longer experience and more market recognition than we do in certain lines of business. In addition, it may be difficult or prohibitively expensive for us to implement technology systems and processes that are competitive with the systems and processes of these larger companies. We cannot assure that we will maintain our current competitive position in the markets in which we operate, or that we will be able to expand our operations into new markets. If we fail to do so, our results of operations and cash flows could be materially adversely affected.
We invest a significant amount of our assets in securities that have experienced market fluctuations, which may reduce the value of our investment portfolio, reduce investment income or generate realized investment losses.
At December 31, 2014, approximately 92% of our investment portfolio was invested in fixed maturity securities. The fair value of these fixed maturity securities and the related investment income fluctuate depending on general economic and market conditions, including volatility in the financial markets and the economy as a whole. For our fixed maturity securities, the fair value generally increases or decreases in an inverse relationship with fluctuations in interest rates and credit spreads, while net investment income realized by us from future investments in fixed maturity securities will generally increase or decrease with interest rates. Mortgage-backed and asset-backed securities may have different net investment income and/or cash flows from those anticipated at the time of investment. These securities have prepayment risk because the timing of cash flows that result from the repayment of principal might occur earlier than anticipated, due to declining interest rates, or extension risk when cash flows may be received later than anticipated because of rising interest rates.
Although 98% of our portfolio is investment grade, all of our fixed maturity securities are subject to credit risk. For mortgage-backed securities, credit risk exists if mortgagors default on the underlying mortgages. During an economic downturn, our state, municipal and non-U.S. sovereign bond portfolios could be subject to a higher risk of default or impairments due to declining tax bases and revenue, notwithstanding the relatively low historical rates of default on these types of obligations. If any of the issuers of our fixed maturity securities suffer financial setbacks, the ratings on the fixed maturity securities could fall (with a concurrent fall in fair value) and, in a worst case scenario, the issuer could default on its financial obligations. If the issuer defaults, we could have realized losses associated with the impairment of the securities.
The impact of fluctuations in the market prices of securities affects our financial statements. Because all of our fixed maturity and equity securities are classified as available for sale, changes in the fair value of these securities are reflected in net unrealized investment gain or loss within our other comprehensive income. Similar treatment is not available for liabilities. Therefore, an increase in market interest rates could cause a decrease in our shareholders’ equity and financial position.
25
Table of Contents
Since 2008, the financial markets and the economy have been severely affected by various events. This has impacted interest rates and has caused large writedowns in other companies’ financial instruments either due to the market fluctuations or the impact of the events on the debtors’ financial condition. Turmoil in the financial markets and the economy, particularly related to potential future ratings downgrade and/or impairment of debt securities of sovereign issuers, could adversely affect the valuation of our investments and cause us to have to record other-than-temporary impairment credit losses on our investments, which could have a material adverse effect on our financial position and results of operations.
If rating agencies downgrade our financial strength ratings, our business and competitive position in the industry may suffer.
Ratings have become an increasingly important factor in establishing the competitive position of insurance companies. Our insurance companies are rated by Standard & Poor’s Financial Services LLC (S&P), Fitch Ratings (Fitch), Moody’s Investors Service, Inc. (Moody’s) and/or A.M. Best Company, Inc. (A.M. Best). The financial strength ratings reflect the rating agencies’ opinions of an insurance company’s and insurance holding company’s financial strength, operating performance, strategic position and ability to meet its obligations to policyholders and are not evaluations directed to investors. Our ratings are subject to periodic review by those entities, and the continuation of those ratings at current levels cannot be assured. If our ratings are reduced from their current levels, it could affect our ability to compete for high quality business and, thus, our financial position and results of operations could be adversely affected.
We may require additional capital or funds for liquidity in the future, which may not be available or may only be available on unfavorable terms.
Our future capital and liquidity requirements depend on many factors, including our ability to write new business successfully, to establish premium rates and reserves at levels sufficient to cover losses, and to maintain our current line of credit. We may need to raise additional funds through financings or curtail our growth and reduce our assets. Any equity or debt financing, if available at all in periods of stress and volatility in the financial markets, may be on terms that are not favorable to us. In the case of equity financings, dilution to our shareholders could result and, in any case, such securities may have rights, preferences and privileges that are senior to those of our common stock. If we cannot obtain adequate capital or funds for liquidity on favorable terms or at all, our business, results of operations and liquidity could be adversely affected. We may also be pre-empted from making acquisitions.
S&P, Fitch, Moody’s and A.M. Best rate our credit strength. If our credit ratings are reduced, it might significantly impede our ability to raise capital and borrow money, which could materially affect our business, results of operations and liquidity.
We may be unable to attract and retain qualified employees.
We depend on our ability to attract, retain and provide for the succession of skilled and experienced underwriting talent and other key employees (including our CEO, President/COO, CFO, senior executive officers and executives at our operating companies) who are knowledgeable about our business. Certain of our senior underwriters and other key employees have employment agreements that are for definite terms, and there is no assurance we will retain these employees beyond the current terms of their agreements. If the quality of our underwriting team and other key personnel decreases, we may be unable to maintain our current competitive position in the specialized markets in which we operate and be unable to expand our operations into new markets, which could materially adversely affect our business.
Our strategy of acquiring other companies and underwriting teams for growth may not succeed.
Our strategy for growth includes growing through acquisitions of insurance industry related companies. This strategy presents risks that could have a material adverse effect on our business and financial performance, including: 1) the diversion of our management’s attention, 2) our ability to assimilate the operations and personnel of the acquired companies, 3) the contingent and latent risks associated with the past operations of, and other unanticipated problems arising in, the acquired companies, 4) the need to expand management, administration and information technology systems and 5) increased competition for suitable acquisition opportunities and qualified employees.
26
Table of Contents
We cannot predict whether we will be able to find suitable acquisition targets, nor can we predict whether we would be able to acquire these additional companies on terms favorable to us or if we will be able to successfully integrate the acquired operations into our business. We do not know if we will realize any anticipated benefits of completed acquisitions or if there will be substantial unanticipated costs associated with new acquisitions. In addition, future acquisitions by us may result in potentially dilutive issuances of our equity securities, the incurrence of additional debt, and/or the recognition of potential impairment of goodwill and other intangible assets. Each of these factors could materially adversely affect our financial position and results of operations.
More recently, our growth has come through hiring underwriting teams focused on new lines of business. While more limited, many of the same risks above apply. Most notably, the diversion of management attention, the assimilation of new personnel and the need to expand management, administration and information technology systems are present. Also, because these are new lines of business for which we have limited experience, the results of these new lines could materially adversely affect our financial position and results of operations.
We are exposed to goodwill impairment risk as part of our business acquisition strategy.
We have recorded goodwill in connection with the majority of our business acquisitions. We are required to perform goodwill impairment tests at least annually and whenever events or circumstances indicate that the carrying value of our goodwill may not be recoverable from estimated future cash flows. As a result of our annual and other periodic evaluations, we may determine that a portion of our goodwill needs to be written down to fair value, which could materially adversely affect our financial position and results of operations.
We are an insurance holding company and, therefore, may not be able to receive dividends in needed amounts from our insurance company subsidiaries.
We have relied on, and in the future we may rely on, dividends from our insurance companies to meet our corporate cash flow requirements for paying principal and interest on outstanding debt obligations, dividends to shareholders and corporate expenses. The payment of dividends by our insurance companies is subject to regulatory restrictions and will depend on the surplus and future earnings of these subsidiaries, as well as the regulatory restrictions. As a result, we may not be able to receive dividends from our insurance companies at times and in amounts necessary to meet our obligations, which could materially adversely affect our financial position and liquidity.
Because we operate internationally, fluctuations in currency exchange rates may affect our assets and liabilities.
We underwrite insurance coverages that are denominated in a number of foreign currencies, and we establish and maintain our loss reserves for these policies in their respective currencies. Our principal area of exposure relates to fluctuations in exchange rates between the British pound sterling, the Euro and the U.S. dollar. Consequently, a change in the exchange rate between the U.S. dollar and the British pound sterling or the Euro could have a material adverse effect on our financial position, results of operations and cash flows. We hold assets, primarily available for sale fixed maturity securities, denominated in comparable foreign currencies that are intended to economically hedge the foreign currency risk related to these reserves denominated in foreign currencies but there can be no assurances that we will be successful in these efforts.
Our information technology systems or third-party systems that we utilize or access may fail or suffer a loss of security, which could adversely affect our business.
Our business is highly dependent upon the successful and uninterrupted functioning of our computer systems. We rely on these systems to perform actuarial and other modeling functions necessary for writing business, to process our premiums and policies, to process and make claims payments, to establish our loss reserves, and to prepare our management and external financial statements and information. The failure of these systems could interrupt our operations. In addition, in the event of a disaster such as a natural catastrophe, a blackout, a computer virus or hacking incident, a terrorist attack or war, our systems may be inaccessible for an extended period of time. These systems failures or disruptions could result in a material adverse effect on our business results. We also utilize and/or rely on computer systems developed and maintained by outsourcing relationships and key vendors. Their systems could experience the same risks, which could result in a material adverse effect on our business results.
27
Table of Contents
A security breach of our computer systems could damage our reputation or result in liability. We retain confidential information regarding our business dealings in our computer systems. We may be required to spend significant capital and other resources to protect against security breaches or to alleviate problems caused by such breaches. Despite the implementation of security measures, the infrastructure supporting our computer systems may be vulnerable to physical break-ins, computer viruses, programming errors, attacks by third parties or similar disruptive problems. In addition, we could be subject to liability if hackers were able to penetrate our network security or otherwise misappropriate confidential information. Furthermore, certain of our businesses are subject to compliance with laws and regulations enacted by U.S. federal and state governments, the European Union or other jurisdictions or enacted by various regulatory organizations or exchanges relating to the privacy and security of the information of clients, employees or others. The compromise of personal, confidential or proprietary information could result in remediation costs, legal liability, regulatory action and reputational harm, which could have a material adverse effect on our results of operations or financial condition.
If we experience difficulties with outsourcing relationships, our ability to conduct our business might be negatively impacted.
We outsource certain business and administrative functions to third parties and may do so increasingly in the future. If we fail to develop and implement our outsourcing strategies or our third party providers fail to perform as anticipated, we may experience operational difficulties, increased costs and a loss of business that may have a material adverse effect on our results of operations or financial position. By outsourcing certain business and administrative functions to third parties, we may be exposed to enhanced risk of data security breaches. Any breach of data security could damage our reputation and/or result in monetary damages, which could have a material adverse effect on our results of operations or financial condition.
We may not be able to delay or prevent an inadequate or coercive offer for change in control, and regulatory rules and required approvals might delay or deter a favorable change of control.
Our certificate of incorporation and bylaws do not have provisions that could make it more difficult for a third party to acquire a majority of our outstanding common stock. As a result, we may be more susceptible to an inadequate or coercive offer that could result in a change in control than a company whose charter documents have provisions that could delay or prevent a change in control.
Many state insurance regulatory laws contain provisions that require advance approval by state agencies of any change of control of an insurance company that is domiciled or, in some cases, has substantial business in that state. “Control” is generally presumed to exist through the ownership of 10% or more of the voting securities of a domestic insurance company or of any company that controls a domestic insurance company. We own, directly or indirectly, all of the shares of stock of insurance companies domiciled in a number of states. Any purchaser of shares of common stock representing 10% or more of the voting power of our common stock will be presumed to have acquired control of our domestic insurance subsidiaries unless, following application by that purchaser, the relevant state insurance regulators determine otherwise. Any transactions that would constitute a change in control of any of our individual insurance subsidiaries would generally require prior approval by the insurance departments of the states in which the insurance subsidiary is domiciled.
We have insurance subsidiaries domiciled in the United Kingdom and Bermuda. Insurers in those countries are also subject to change of control restrictions under their individual regulatory frameworks. These requirements may deter or delay possible significant transactions in our common stock or the disposition of our insurance companies to third parties, including transactions that could be beneficial to our shareholders.
Item 1B. Unresolved Staff Comments
None.
28
Table of Contents
Our principal and executive offices are located in Houston, Texas, in buildings owned by Houston Casualty Company. We also maintain offices in approximately 60 locations elsewhere in the United States, the United Kingdom, Spain and Ireland. The majority of these additional locations are in leased facilities.
Our major office facilities, with more than 25,000 square feet, are as follows:
| Segment |
Location |
Square feet |
Termination date of lease | |||||
| U.S. Property & Casualty and |
Houston, Texas | 77,000 | Owned | |||||
| Houston, Texas | 51,000 | Owned | ||||||
| U.S. Property & Casualty |
Mount Kisco, New York | 38,000 | Owned | |||||
| Wakefield, Massachusetts | 34,000 | February 28, 2017 | ||||||
| Auburn Hills, Michigan | 27,000 | May 31, 2017 | ||||||
| Dallas, Texas | 26,000 | May 31, 2019 | ||||||
| Accident & Health |
Atlanta, Georgia | 46,000 | June 30, 2019 | |||||
| U.S. Surety & Credit |
Los Angeles, California | 41,000 | October 31, 2016 | |||||
| International |
London, England | 30,000 | December 24, 2015 | |||||
Litigation
We are a party to lawsuits, arbitrations and other proceedings that arise in the normal course of our business. Many of such lawsuits, arbitrations and other proceedings involve claims under policies that we underwrite as an insurer or reinsurer, the liabilities for which, we believe, have been adequately included in our loss reserves. Also, from time to time, we are a party to lawsuits, arbitrations and other proceedings that relate to disputes with third parties, or that involve alleged errors and omissions on the part of our subsidiaries. We have provided accruals for these items to the extent we deem the losses probable and reasonably estimable. Although the ultimate outcome of these matters cannot be determined at this time, based on present information, the availability of insurance coverage and advice received from our outside legal counsel, we believe the resolution of any such matters will not, individually or in the aggregate, have a material adverse effect on our consolidated financial position, results of operations or cash flows.
Item 4. Mine Safety Disclosures
Not applicable.
29
Table of Contents
Item 5. Market for the Registrant’s Common Equity, Related Stockholder Matters and Issuer Purchases of Equity Securities
Price Range of Common Stock
Our common stock trades on the New York Stock Exchange under the ticker symbol “HCC”. The intra-day high and low sales prices for quarterly periods in the last three years, as reported by the New York Stock Exchange, were as follows:
| 2014 | 2013 | 2012 | ||||||||||||||||||||||
| High | Low | High | Low | High | Low | |||||||||||||||||||
| First quarter |
$ | 46.14 | $ | 41.19 | $ | 42.11 | $ | 37.37 | $ | 31.71 | $ | 26.62 | ||||||||||||
| Second quarter |
48.97 | 44.17 | 43.69 | 40.81 | 32.69 | 29.91 | ||||||||||||||||||
| Third quarter |
50.76 | 46.51 | 46.14 | 41.85 | 34.46 | 30.06 | ||||||||||||||||||
| Fourth quarter |
54.96 | 47.11 | 46.38 | 42.57 | 37.65 | 33.74 | ||||||||||||||||||
On February 13, 2015, the last reported sales price of our common stock as reported by the New York Stock Exchange was $55.48 per share.
Shareholders
We have one class of authorized capital stock. On February 13, 2015, there were 126.5 million shares of common stock issued and 96.3 million shares of common stock outstanding held by 717 shareholders of record; however, we estimate there are approximately 64,000 beneficial owners.
Dividend Policy
Cash dividends declared on a quarterly basis were as follows:
| 2014 | 2013 | 2012 | ||||||||||
| First quarter |
$ | 0.225 | $ | 0.165 | $ | 0.155 | ||||||
| Second quarter |
0.225 | 0.165 | 0.155 | |||||||||
| Third quarter |
0.295 | 0.225 | 0.165 | |||||||||
| Fourth quarter |
0.295 | 0.225 | 0.165 | |||||||||
Beginning in June 1996, we announced a planned quarterly program of paying cash dividends to shareholders. Our Board of Directors may review our dividend policy from time to time, and any determination with respect to future dividends will be made in light of regulatory and other conditions at that time, including our earnings, financial condition, capital requirements, loan covenants and other related factors. Under the terms of our bank loan facility, we are prohibited from paying dividends in excess of an agreed upon maximum amount in any year. That limitation does not affect our ability to pay dividends in a manner consistent with our past practice and current expectations. During 2014, we increased our regular quarterly dividend by $0.07 per share, marking the largest increase in the quarterly cash dividend in our history. We presently intend to continue paying quarterly dividends.
30
Table of Contents
Performance Graph
The following graph shows a comparison of cumulative total returns for an investment of $100.00 made on December 31, 2009 in the common stock of HCC Insurance Holdings, Inc., the Standard & Poor’s 500 Index, and the Standard & Poor’s 500 Property and Casualty Insurance Index.
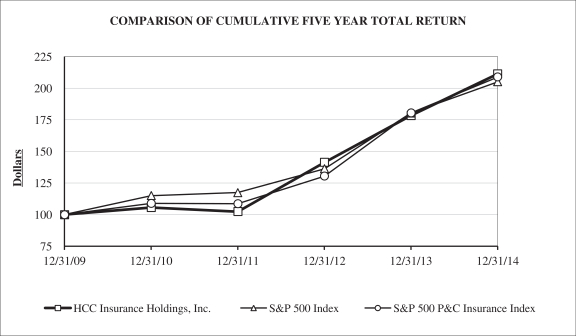
Total Return to Shareholders
(includes reinvestment of dividends)
| Company/Index | 2009 | 2010 | 2011 | 2012 | 2013 | 2014 | ||||||||||||||||||
| HCC Insurance Holdings, Inc. |
$ | 100.00 | $ | 105.65 | $ | 102.48 | $ | 141.34 | $ | 178.40 | $ | 211.35 | ||||||||||||
| S&P 500 Index |
100.00 | 115.06 | 117.49 | 136.30 | 180.44 | 205.14 | ||||||||||||||||||
| S&P 500 P&C Insurance Index |
100.00 | 108.94 | 108.67 | 130.52 | 180.50 | 208.91 | ||||||||||||||||||
This performance graph shall not be deemed to be incorporated by reference into our Securities and Exchange Commission filings and should not constitute soliciting material or otherwise be considered filed under the Securities Act of 1933, as amended, or the Securities Exchange Act of 1934, as amended.
31
Table of Contents
Issuer Purchases of Equity Securities
In 2012, the Board approved the purchase of up to $300.0 million of our common stock. On August 20, 2014, the Board approved a new authorization for $500.0 million (the Plan) and cancelled $130.9 million remaining under the previous authorization. Purchases under the Plan may be made in the open market or in privately negotiated transactions from time-to-time in compliance with applicable laws, rules and regulations, including Rule 10b-18 under the Securities Exchange Act of 1934, as amended. Purchases under the Plan will be made, subject to market and business conditions, the level of cash generated from our operations, cash required for acquisitions, our debt covenant compliance and other relevant factors. The Plan does not obligate us to purchase any particular number of shares, has no expiration date and may be suspended or discontinued at any time at the Board’s discretion. Our purchases in the fourth quarter of 2014 were as follows:
| Period |
Total number of shares purchased |
Average price paid per share |
Total number of shares purchased as part of publicly announced plans or programs |
Approximate dollar value of shares that may yet be purchased under the plans or programs |
||||||||||||
| October |
1,351,242 | $ | 48.51 | 1,351,242 | $ | 372,532,739 | ||||||||||
| November |
107,009 | $ | 52.75 | 107,009 | $ | 366,888,011 | ||||||||||
| December |
284,444 | $ | 52.62 | 284,444 | $ | 351,921,289 | ||||||||||
|
|
|
|
|
|||||||||||||
| Total |
1,742,695 | 1,742,695 | ||||||||||||||
|
|
|
|
|
|||||||||||||
32
Table of Contents
Item 6. Selected Financial Data
The selected consolidated financial data shown below has been derived from the Consolidated Financial Statements. All information contained herein should be read in conjunction with the Consolidated Financial Statements and related Notes, the Schedules, Exhibit 12 and Item 7., Management’s Discussion and Analysis of Financial Condition and Results of Operations included elsewhere in this Report. In the tables below, we revised loss and loss adjustment expense and other operating expense in 2010 – 2013 to correctly classify internal claims department costs. There was no impact on net earnings or total shareholders’ equity in any period. See Note 1, “General Information and Significant Accounting and Reporting Policies — Revision of Financial Statement Presentation” to the Consolidated Financial Statements for additional information.
| Years ended December 31, | ||||||||||||||||||||
| 2014 | 2013 | 2012 | 2011 | 2010 | ||||||||||||||||
| (in thousands, except per share data) | ||||||||||||||||||||
| REVENUE |
||||||||||||||||||||
| Net earned premium |
$ | 2,323,627 | $ | 2,239,240 | $ | 2,242,625 | $ | 2,127,170 | $ | 2,041,924 | ||||||||||
| Net investment income |
221,620 | 220,182 | 222,634 | 212,271 | 203,819 | |||||||||||||||
| Other operating income |
40,932 | 35,452 | 30,448 | 35,590 | 44,832 | |||||||||||||||
| Net realized investment gain |
66,370 | 42,030 | 31,148 | 3,653 | 12,104 | |||||||||||||||
| Other-than-temporary impairment credit losses |
- | - | (1,028) | (4,679) | (425) | |||||||||||||||
|
|
|
|
|
|
|
|
|
|
|
|||||||||||
| Total revenue |
2,652,549 | 2,536,904 | 2,525,827 | 2,374,005 | 2,302,254 | |||||||||||||||
|
|
|
|
|
|
|
|
|
|
|
|||||||||||
| EXPENSE |
||||||||||||||||||||
| Loss and loss adjustment expense, net |
1,326,835 | 1,322,454 | 1,338,074 | 1,429,370 | 1,241,976 | |||||||||||||||
| Policy acquisition costs, net |
294,670 | 279,439 | 281,201 | 266,125 | 255,136 | |||||||||||||||
| Other operating expense |
341,083 | 336,091 | 326,497 | 300,434 | 293,967 | |||||||||||||||
| Interest expense |
28,125 | 26,210 | 25,628 | 23,070 | 21,348 | |||||||||||||||
|
|
|
|
|
|
|
|
|
|
|
|||||||||||
| Total expense |
1,990,713 | 1,964,194 | 1,971,400 | 2,018,999 | 1,812,427 | |||||||||||||||
|
|
|
|
|
|
|
|
|
|
|
|||||||||||
| Earnings before income tax expense |
661,836 | 572,710 | 554,427 | 355,006 | 489,827 | |||||||||||||||
| Income tax expense |
203,493 | 165,513 | 163,187 | 99,763 | 144,731 | |||||||||||||||
|
|
|
|
|
|
|
|
|
|
|
|||||||||||
| Net earnings |
$ | 458,343 | $ | 407,197 | $ | 391,240 | $ | 255,243 | $ | 345,096 | ||||||||||
|
|
|
|
|
|
|
|
|
|
|
|||||||||||
| Net earnings attributable to unvested restricted stock |
(7,497) | (6,638) | (6,982) | (3,864) | (3,926) | |||||||||||||||
|
|
|
|
|
|
|
|
|
|
|
|||||||||||
| Net earnings available to common stock |
$ | 450,846 | $ | 400,559 | $ | 384,258 | $ | 251,379 | $ | 341,170 | ||||||||||
|
|
|
|
|
|
|
|
|
|
|
|||||||||||
| Earnings per common share |
||||||||||||||||||||
| Basic |
$ | 4.62 | $ | 4.05 | $ | 3.84 | $ | 2.31 | $ | 3.00 | ||||||||||
|
|
|
|
|
|
|
|
|
|
|
|||||||||||
| Diluted |
$ | 4.61 | $ | 4.04 | $ | 3.83 | $ | 2.30 | $ | 2.99 | ||||||||||
|
|
|
|
|
|
|
|
|
|
|
|||||||||||
| Weighted average shares outstanding |
||||||||||||||||||||
| Basic |
97,591 | 98,853 | 100,176 | 109,051 | 113,863 | |||||||||||||||
|
|
|
|
|
|
|
|
|
|
|
|||||||||||
| Diluted |
97,851 | 99,113 | 100,456 | 109,240 | 114,077 | |||||||||||||||
|
|
|
|
|
|
|
|
|
|
|
|||||||||||
| Cash dividends declared, per share |
$ | 1.04 | $ | 0.78 | $ | 0.64 | $ | 0.60 | $ | 0.56 | ||||||||||
|
|
|
|
|
|
|
|
|
|
|
|||||||||||
33
Table of Contents
| Years ended December 31, | ||||||||||||||||||||
| 2014 | 2013 | 2012 | 2011 | 2010 | ||||||||||||||||
| (in thousands, except ratios) | ||||||||||||||||||||
| Statistical data |
||||||||||||||||||||
| Gross written premium |
$ | 3,001,618 | $ | 2,880,249 | $ | 2,784,073 | $ | 2,649,126 | $ | 2,578,908 | ||||||||||
| Net written premium |
2,373,245 | 2,255,323 | 2,253,396 | 2,182,158 | 2,026,197 | |||||||||||||||
| Net loss ratio (1) |
55.5 | % | 57.6 | % | 58.2 | % | 65.8 | % | 59.4 | % | ||||||||||
| Expense ratio (2) |
26.6 | 25.8 | 25.4 | 25.3 | 25.6 | |||||||||||||||
|
|
|
|
|
|
|
|
|
|
|
|||||||||||
| Combined ratio |
82.1 | % | 83.4 | % | 83.6 | % | 91.1 | % | 85.0 | % | ||||||||||
|
|
|
|
|
|
|
|
|
|
|
|||||||||||
| December 31, | ||||||||||||||||||||
| 2014 | 2013 | 2012 | 2011 | 2010 | ||||||||||||||||
| (in thousands, except per share data) | ||||||||||||||||||||
| Balance sheet data |
||||||||||||||||||||
| Total investments |
$ | 7,164,906 | $ | 6,718,692 | $ | 6,950,398 | $ | 6,049,750 | $ | 5,687,095 | ||||||||||
| Premium, claims and other receivables |
553,027 | 580,107 | 549,725 | 688,732 | 635,867 | |||||||||||||||
| Reinsurance recoverables |
1,168,900 | 1,277,257 | 1,071,222 | 1,056,068 | 1,006,855 | |||||||||||||||
| Ceded unearned premium |
316,715 | 305,438 | 256,988 | 222,300 | 278,663 | |||||||||||||||
| Goodwill |
905,636 | 895,200 | 885,860 | 872,814 | 821,648 | |||||||||||||||
| Total assets |
$ | 10,714,346 | $ | 10,344,520 | $ | 10,267,807 | $ | 9,597,278 | $ | 9,036,107 | ||||||||||
|
|
|
|
|
|
|
|
|
|
|
|||||||||||
| Loss and loss adjustment expense payable |
$ | 3,728,085 | $ | 3,902,132 | $ | 3,767,850 | $ | 3,658,317 | $ | 3,471,858 | ||||||||||
| Reinsurance, premium and claims payable |
301,476 | 332,985 | 294,621 | 366,499 | 345,730 | |||||||||||||||
| Unearned premium |
1,198,930 | 1,134,849 | 1,069,956 | 1,031,034 | 1,045,877 | |||||||||||||||
| Notes payable |
824,251 | 654,098 | 583,944 | 478,790 | 298,637 | |||||||||||||||
| Total shareholders’ equity |
$ | 3,903,351 | $ | 3,674,430 | $ | 3,542,612 | $ | 3,273,982 | $ | 3,278,400 | ||||||||||
|
|
|
|
|
|
|
|
|
|
|
|||||||||||
| Book value per share (3) |
$ | 40.44 | $ | 36.62 | $ | 35.10 | $ | 31.45 | $ | 28.52 | ||||||||||
|
|
|
|
|
|
|
|
|
|
|
|||||||||||
| Shares outstanding |
96,521 | 100,336 | 100,928 | 104,101 | 114,968 | |||||||||||||||
|
|
|
|
|
|
|
|
|
|
|
|||||||||||
| (1) | Calculated by dividing net loss and loss adjustment expense less internal claims department costs by net earned premium. |
| (2) | Calculated by dividing segment underwriting expense, which includes internal claims department costs, by segment revenue. |
| (3) | Calculated by dividing total shareholders’ equity by shares outstanding. |
34
Table of Contents
Item 7. Management’s Discussion and Analysis of Financial Condition and Results of Operations
The following Management’s Discussion and Analysis should be read in conjunction with the Selected Financial Data and the Consolidated Financial Statements and related Notes.
Overview
We are a specialty insurance group with offices in the United States, the United Kingdom, Spain and Ireland, transacting business in approximately 180 countries. Our shares trade on the New York Stock Exchange and closed at $55.48 on February 13, 2015, resulting in market capitalization of $5.3 billion.
We underwrite and manage a variety of largely non-correlated specialty insurance products through five insurance underwriting segments: U.S. Property & Casualty, Professional Liability, Accident & Health, U.S. Surety & Credit and International. We market our insurance products through a network of independent agents and brokers, through managing general agents owned by the company, and directly to consumers. In addition, we assume insurance written by other insurance companies.
Our organization is focused on generating consistent, industry-leading combined ratios. We concentrate our insurance writings in selected specialty lines of business in which we believe we can achieve meaningful underwriting profit. We rely on experienced underwriting personnel working within defined and monitored limits, as well as our access to and expertise in the reinsurance marketplace, to limit or reduce risk. By focusing on underwriting profitability, we are able to accomplish our primary objectives of maximizing net earnings and growing book value per share.
Key facts about our consolidated group as of and for the year ended December 31, 2014 are as follows:
| • | We had consolidated shareholders’ equity of $3.9 billion, with book value per share of $40.44. |
| • | We generated net earnings of $458.3 million, or $4.61 per diluted share. |
| • | We produced total revenue of $2.7 billion, of which 88% related to net earned premium and 8% related to net investment income. |
| • | Our net loss ratio was 55.5% and our combined ratio was 82.1%. |
| • | Our debt to capital ratio was 17.4%. |
| • | We purchased $224.7 million of our common stock at an average cost of $47.70 per share. At year-end, we had $351.9 million remaining under our current $500 million share buyback authorization. |
| • | We increased our regular quarterly cash dividend to $0.295 per share, marking the 18th consecutive year of increases and the largest increase in the quarterly cash dividend in our history. We declared dividends of $1.04 per share and paid $96.5 million, which was $24.6 million more than we paid in 2013. |
Effective January 1, 2015, we completed the acquisition of all of the capital stock of Producers Ag Insurance Group, Inc. (ProAg) from CUNA Mutual Group for $104.5 million cash. ProAg writes multi-peril crop, crop hail, named peril and livestock insurance. ProAg’s operations will be included in our consolidated results of operations, financial position and cash flows beginning in 2015.
The following sections discuss our key operating results. The reason for any significant variances between 2013 and 2012 are the same as those discussed for variances between 2014 and 2013, unless otherwise noted. Amounts in tables are in thousands, except for earnings per share, percentages, ratios and number of employees.
35
Table of Contents
Results of Operations
Our results and key metrics for the past three years were as follows:
| 2014 | 2013 | 2012 | ||||||||||
| Net earnings |
$ | 458,343 | $ | 407,197 | $ | 391,240 | ||||||
|
|
|
|
|
|
|
|||||||
| Earnings per diluted share |
$ | 4.61 | $ | 4.04 | $ | 3.83 | ||||||
|
|
|
|
|
|
|
|||||||
| Net loss ratio |
55.5 | % | 57.6 | % | 58.2 | % | ||||||
| Expense ratio |
26.6 | 25.8 | 25.4 | |||||||||
|
|
|
|
|
|
|
|||||||
| Combined ratio |
82.1 | % | 83.4 | % | 83.6 | % | ||||||
|
|
|
|
|
|
|
|||||||
In 2014, we recognized no losses for major catastrophic events. During the prior two years, we recognized the following pretax net losses, including reinstatement premium, for major catastrophic events: 1) 2013 – European floods ($15.0 million) and German hail storms ($13.0 million) and 2) 2012 – Superstorm Sandy ($30.8 million). In all years, the remaining catastrophes, which we refer to as “small catastrophes” and that primarily impacted our property treaty line of business, were not individually significant events to us. We reinsure a portion of our exposure to catastrophic events, although we incur some additional cost for reinstatement premium to continue our reinsurance coverage for future loss events. The following table summarizes our accident year catastrophe losses, as well as the impact on key metrics.
| 2014 | 2013 | 2012 | ||||||||||
| Gross losses |
$ | 28,762 | $ | 56,639 | $ | 84,751 | ||||||
|
|
|
|
|
|
|
|||||||
| Net losses, after reinsurance |
$ | 28,683 | $ | 55,939 | $ | 52,390 | ||||||
| Reinstatement premium, net |
(2,247) | (3,932) | 401 | |||||||||
|
|
|
|
|
|
|
|||||||
| Total net catastrophe losses |
$ | 26,436 | $ | 52,007 | $ | 52,791 | ||||||
|
|
|
|
|
|
|
|||||||
| Impact of net catastrophe losses on: |
||||||||||||
| Net earnings per diluted share |
$ | (0.18) | $ | (0.34) | $ | (0.34) | ||||||
| Net loss ratio (percentage points) |
1.1 | % | 2.4 | % | 2.3 | % | ||||||
| Combined ratio (percentage points) |
1.1 | % | 2.3 | % | 2.4 | % | ||||||
We recognized net favorable loss development of $56.4 million in 2014, $73.7 million in 2013 and $70.0 million in 2012, which included, in the respective periods, $5.9 million, $7.3 million and $21.4 million of net favorable development related to prior year catastrophes. The total net favorable development also included adverse development of $43.5 million in 2014, $70.3 million in 2013 and $48.9 million in 2012 related to a specific class of Spanish surety bonds. See the “Loss and Loss Adjustment Expense” and “Segment Operations” sections below for discussion of our loss activity and the “Critical Accounting Policies” section below for discussion of our policies and procedures related to establishing and reviewing loss reserves.
36
Table of Contents
Revenue
We generate our revenue from five primary sources:
| • | risk-bearing earned premium produced by our insurance underwriting segments, |
| • | investment income earned on our consolidated investment portfolio by our Investing segment, |
| • | fee and commission income received from third party insurers for premium produced for them by our underwriting agencies, |
| • | transaction-based revenues, primarily related to residual value and mortgage reinsurance products in our U.S. Property & Casualty segment, and |
| • | realized investment gains and losses related to our investment portfolio. |
Total revenue increased $115.6 million in 2014, compared to 2013, due to an $84.4 million increase in net earned premium and higher net realized investment gains. The $11.1 million increase in total revenue in 2013, compared to 2012, related to higher net realized investment gains.
Gross written premium, net written premium and net earned premium are detailed below by segment.
| 2014 | 2013 | 2012 | ||||||||||
| U.S. Property & Casualty |
$ | 676,103 | $ | 670,764 | $ | 614,694 | ||||||
| Professional Liability |
517,152 | 536,085 | 539,383 | |||||||||
| Accident & Health |
998,387 | 883,055 | 835,796 | |||||||||
| U.S. Surety & Credit |
231,965 | 228,930 | 221,468 | |||||||||
| International |
577,637 | 548,499 | 531,167 | |||||||||
| Exited Lines |
374 | 12,916 | 41,565 | |||||||||
|
|
|
|
|
|
|
|||||||
| Total gross written premium |
$ | 3,001,618 | $ | 2,880,249 | $ | 2,784,073 | ||||||
|
|
|
|
|
|
|
|||||||
| U.S. Property & Casualty |
$ | 380,299 | $ | 385,355 | $ | 383,938 | ||||||
| Professional Liability |
346,720 | 359,509 | 378,138 | |||||||||
| Accident & Health |
992,034 | 881,368 | 835,008 | |||||||||
| U.S. Surety & Credit |
204,767 | 199,121 | 195,904 | |||||||||
| International |
448,949 | 417,039 | 419,155 | |||||||||
| Exited Lines |
476 | 12,931 | 41,253 | |||||||||
|
|
|
|
|
|
|
|||||||
| Total net written premium |
$ | 2,373,245 | $ | 2,255,323 | $ | 2,253,396 | ||||||
|
|
|
|
|
|
|
|||||||
| U.S. Property & Casualty |
$ | 363,998 | $ | 367,135 | $ | 354,050 | ||||||
| Professional Liability |
351,690 | 368,167 | 394,687 | |||||||||
| Accident & Health |
981,219 | 883,515 | 831,827 | |||||||||
| U.S. Surety & Credit |
199,764 | 194,286 | 207,955 | |||||||||
| International |
426,480 | 413,206 | 412,853 | |||||||||
| Exited Lines |
476 | 12,931 | 41,253 | |||||||||
|
|
|
|
|
|
|
|||||||
| Total net earned premium |
$ | 2,323,627 | $ | 2,239,240 | $ | 2,242,625 | ||||||
|
|
|
|
|
|
|
|||||||
The 2014 and 2013 growth in gross written premium from our insurance underwriting segments occurred primarily in: 1) the Accident & Health segment, from the growth of our medical stop-loss and short-term medical products, 2) the International segment, from increased writings in our surety & credit and liability lines of business and 3) the U.S. Property & Casualty segment, from our growing casualty line of business. Our net written premium increased in 2014, compared to 2013, due to growth in the Accident & Health segment and was flat in 2013, compared to 2012, due to increased reinsurance in 2013, primarily in the U.S. Property & Casualty segment. Net earned premium increased in 2014 as the medical stop-loss and short-term medical products were earned in less than twelve months. See the “Segment Operations” section below for further discussion of the relationship and changes in premium revenue within each insurance segment.
37
Table of Contents
Net investment income, which is included in our Investing segment, was essentially flat in 2014 and 2013 as declining income from reduced reinvestment yields on fixed maturity securities was offset by increasing dividend income from equity securities. Our investment expense increased in 2013 and decreased in 2014 due to changes in the mix of the portfolio. We recognized $66.4 million of net realized investment gains in 2014, compared to $42.0 million in 2013 and $31.1 million in 2012. The 2014 net realized investment gains were principally due to the sale of equity securities.
Loss and Loss Adjustment Expense
We incur expenses for insurance claims paid or payable to policyholders, as well as the potential liability for incurred but not reported claims, and the expense to adjust and settle all claims (collectively referred to as loss and loss adjustment expense).
In 2014, we revised the presentation of our 2013 and 2012 consolidated statements of earnings to correctly classify internal claims department costs as loss and loss adjustment expense. Previously these costs were included in other operating expense. See Note 1, “General Information and Significant Accounting and Reporting Policies — Revision of Financial Statement Presentation” to the Consolidated Financial Statements for additional information.
Our net loss ratio is the percentage of our loss and loss adjustment expense excluding internal claims department costs divided by our net earned premium in each year. In evaluating our businesses, we consider internal claims department costs to be operating expenses and, thus, exclude them from the calculation of our net loss ratios and include them in the calculation of our expense ratios. The reclassification discussed in the previous paragraph had no impact on our segment reporting, which reflects the way in which our management viewed and evaluated our segment results.
Loss development represents an increase or decrease in estimates of ultimate losses related to business written in prior accident years. We record such increases or decreases as loss and loss adjustment expense in the current reporting year. Favorable development means our original ultimate loss estimate was higher than the current estimate. Adverse development means the current ultimate loss estimate is higher than our original estimate. Loss development occurs as we review our loss exposure with our actuaries, increasing or decreasing estimates of our ultimate losses as a result of such reviews and as losses are finally settled or claims exposure changes.
The tables below detail our net loss and loss adjustment expense and our net loss ratios on a consolidated basis and for our segments.
| 2014 | 2013 | 2012 | ||||||||||
| U.S. Property & Casualty |
$ | 154,200 | $ | 175,190 | $ | 209,286 | ||||||
| Professional Liability |
206,690 | 195,429 | 229,873 | |||||||||
| Accident & Health |
696,288 | 630,210 | 601,076 | |||||||||
| U.S. Surety & Credit |
42,273 | 24,143 | 38,535 | |||||||||
| International |
196,134 | 249,199 | 189,410 | |||||||||
| Corporate & Other |
31,250 | 48,283 | 69,894 | |||||||||
|
|
|
|
|
|
|
|||||||
| Net loss and loss adjustment expense |
$ | 1,326,835 | $ | 1,322,454 | $ | 1,338,074 | ||||||
|
|
|
|
|
|
|
|||||||
38
Table of Contents
| 2014 | 2013 | 2012 | ||||||||||
| Net (favorable) adverse loss development |
||||||||||||
| U.S. Property & Casualty |
$ | (41,560) | $ | (39,363) | $ | 2,321 | ||||||
| Professional Liability |
973 | (26,346) | (25,897) | |||||||||
| Accident & Health |
(13,086) | (18,027) | (10,511) | |||||||||
| U.S. Surety & Credit |
(22,629) | (37,898) | (25,377) | |||||||||
| International |
25,050 | 43,805 | (10,084) | |||||||||
| Exited Lines |
(5,105) | 4,087 | (463) | |||||||||
|
|
|
|
|
|
|
|||||||
| Total net favorable loss development |
(56,357) | (73,742) | (70,011) | |||||||||
| Accident year catastrophe losses |
28,683 | 55,939 | 52,390 | |||||||||
| All other net loss and loss adjustment expense |
1,354,509 | 1,340,257 | 1,355,695 | |||||||||
|
|
|
|
|
|
|
|||||||
| Net loss and loss adjustment expense |
$ | 1,326,835 | $ | 1,322,454 | $ | 1,338,074 | ||||||
|
|
|
|
|
|
|
|||||||
| U.S. Property & Casualty |
42.4 | % | 47.7 | % | 59.1 | % | ||||||
| Professional Liability |
58.8 | 53.1 | 58.2 | |||||||||
| Accident & Health |
71.0 | 71.3 | 72.3 | |||||||||
| U.S. Surety & Credit |
21.2 | 12.4 | 18.5 | |||||||||
| International |
46.0 | 60.3 | 45.9 | |||||||||
|
|
|
|
|
|
|
|||||||
| Consolidated net loss ratio |
55.5 | % | 57.6 | % | 58.2 | % | ||||||
|
|
|
|
|
|
|
|||||||
| Consolidated accident year net loss ratio |
57.8 | % | 60.9 | % | 61.5 | % | ||||||
|
|
|
|
|
|
|
|||||||
Loss and loss adjustment expense increased $4.4 million in 2014 and decreased $15.6 million in 2013, compared to the respective prior year. The 2014 increase was primarily due to growth in the business and lower net favorable development in 2014, partially offset by lower catastrophe losses in 2014. The 2013 decrease was primarily due to a lower accident year net loss ratio in 2013 and flat net earned premium year-over-year. Excluding catastrophes, our accident year net loss ratio was 56.7% for 2014, 58.5% for 2013 and 59.1% for 2012. See the “Segment Operations” section below for additional discussion of the changes in net loss development and net loss ratios for each segment.
Our net paid loss ratio is the percentage of losses paid, net of reinsurance, divided by net earned premium for the year. Our net paid loss ratio was 58.7% in 2014, 56.5% in 2013 and 56.7% in 2012. The amount of claims paid fluctuates year-over-year due to the timing of claims settlement, the occurrence of catastrophic events and commutations, and the mix of our business. Our net paid loss ratio increased in 2014 primarily due to higher payments to settle claims related to Spanish surety bonds. In 2014 and 2013, we paid $243.3 million and $153.9 million, respectively, to settle these claims, of which approximately 60% was reinsured.
Policy Acquisition Costs
Policy acquisition costs relate to direct costs we incur to issue insurance policies, including commissions, premium taxes and compensation of our underwriters. The percentage of policy acquisition costs to net earned premium was 12.7% in 2014 and 12.5% in both 2013 and 2012. We record profit commissions due from reinsurers as an offset to policy acquisition costs. The higher percentage in 2014 related to lower profit commissions from reinsurers in 2014 and commissions on our growing short-term medical business.
39
Table of Contents
Other Operating Expense
Other operating expense increased 1% in 2014 and 3% in 2013. In 2014, higher employee compensation and benefit costs were offset by the year-over-year fluctuation in foreign currency benefit/expense. We recognized a foreign currency benefit of $23.2 million in 2014, compared to expense of $5.3 million and $6.2 million in 2013 and 2012. The foreign currency benefit/expense related to changes in the value of the British pound sterling and the Euro relative to the U.S. dollar. In 2013, higher employee compensation and benefit costs, compared to 2012, were partially offset by a $5.1 million benefit related to an indemnification liability. We reduced the indemnification liability, which related to a 2001 subsidiary sale, due to favorable claims activity and successful subrogation recoveries.
Excluding the foreign currency benefit/expense and indemnification benefits, other operating expense increased 9% in 2014 and 5% in 2013 mainly due to increased employee compensation and benefits costs. Our employee count grew to 1,983 at December 31, 2014 from 1,900 at December 31, 2013, mainly due to the addition of new underwriting teams. In addition, our bonus expense increased in 2014 and 2013 due to higher pretax earnings.
Other operating expense included $25.1 million, $16.2 million and $13.2 million of stock-based compensation expense in the respective three years. Stock-based compensation expense was higher in 2014 due to accelerated expense for certain unvested restricted stock awards for which the performance criteria were achieved in 2014, as well as higher grant prices due to the increase in our stock price. In 2014, we granted $17.4 million of restricted stock awards and units, with a weighted-average life of 2.9 years. At December 31, 2014, there was approximately $29.3 million of total unrecognized compensation expense related to unvested restricted stock awards and units, options and our employee stock purchase plan, which is expected to be recognized over a weighted-average period of 1.6 years. In 2015, we expect to recognize $15.9 million of expense for all stock-based awards outstanding at year-end 2014.
Interest Expense
Interest expense was $28.1 million, $26.2 million and $25.6 million in 2014, 2013 and 2012, respectively, and included $19.3 million per year for our Senior Notes. Our interest expense has increased due to a higher amount of outstanding borrowings on our $825.0 million Revolving Loan Facility, mainly to fund purchases of our common stock.
Income Tax Expense
Our income taxes are due to U.S. Federal, state, local and foreign jurisdictions. Our effective income tax rate was 30.7% for 2014, compared to 28.9% for 2013 and 29.4% for 2012. Fluctuations in our effective tax rate are due to the relationship of pretax income and tax-exempt investment income. In 2014, our pretax income was substantially higher and our tax-exempt investment income was flat compared to 2013. The lower effective rate in 2013 related to an increased benefit from tax-exempt investment income in that year.
Segment Operations
Each of our insurance segments bears risk for insurance coverage written within its portfolio of insurance products. Each segment generates income from premium written by our underwriting agencies, through third party agents and brokers, or on a direct basis. Certain segments also write facultative or individual account reinsurance, as well as treaty reinsurance business. In some cases, we purchase reinsurance to limit our losses from both individual policy losses and multiple policy losses from catastrophic occurrences and from aggregate losses in a year. Our segments maintain disciplined expense management and a streamlined management structure, which results in favorable expense ratios. The following provides operational information about our insurance underwriting segments, Investing segment and Corporate & Other category.
40
Table of Contents
U.S. Property & Casualty Segment
The following tables summarize the operations of the U.S. Property & Casualty segment.
| 2014 | 2013 | 2012 | ||||||||||
| Net earned premium |
$ | 363,998 | $ | 367,135 | $ | 354,050 | ||||||
| Other revenue |
20,822 | 24,266 | 18,865 | |||||||||
|
|
|
|
|
|
|
|||||||
| Segment revenue |
384,820 | 391,401 | 372,915 | |||||||||
|
|
|
|
|
|
|
|||||||
| Loss and loss adjustment expense, net |
154,200 | 175,190 | 209,286 | |||||||||
| Other expense |
116,553 | 117,910 | 116,398 | |||||||||
|
|
|
|
|
|
|
|||||||
| Segment expense |
270,753 | 293,100 | 325,684 | |||||||||
|
|
|
|
|
|
|
|||||||
| Segment pretax earnings |
$ | 114,067 | $ | 98,301 | $ | 47,231 | ||||||
|
|
|
|
|
|
|
|||||||
| Net loss ratio |
42.4 | % | 47.7 | % | 59.1 | % | ||||||
| Expense ratio |
30.3 | 30.1 | 31.2 | |||||||||
|
|
|
|
|
|
|
|||||||
| Combined ratio |
72.7 | % | 77.8 | % | 90.3 | % | ||||||
|
|
|
|
|
|
|
|||||||
| Aviation |
$ | 109,497 | $ | 112,597 | $ | 116,236 | ||||||
| Liability |
113,252 | 100,956 | 97,232 | |||||||||
| Sports & Entertainment |
26,616 | 26,083 | 18,926 | |||||||||
| Public Risk |
47,060 | 63,791 | 65,281 | |||||||||
| Other |
67,573 | 63,708 | 56,375 | |||||||||
|
|
|
|
|
|
|
|||||||
| Total net earned premium |
$ | 363,998 | $ | 367,135 | $ | 354,050 | ||||||
|
|
|
|
|
|
|
|||||||
| Aviation |
56.0 | % | 55.0 | % | 56.2 | % | ||||||
| Liability |
43.7 | 54.8 | 71.4 | |||||||||
| Sports & Entertainment |
58.0 | 58.9 | 48.4 | |||||||||
| Public Risk |
50.5 | 76.1 | 94.1 | |||||||||
| Other |
6.1 | (9.5) | 7.1 | |||||||||
|
|
|
|
|
|
|
|||||||
| Total net loss ratio |
42.4 | % | 47.7 | % | 59.1 | % | ||||||
|
|
|
|
|
|
|
|||||||
| Aviation |
$ | 134,388 | $ | 139,673 | $ | 144,621 | ||||||
| Liability |
190,085 | 153,770 | 129,183 | |||||||||
| Sports & Entertainment |
132,763 | 144,416 | 103,807 | |||||||||
| Public Risk |
69,800 | 70,665 | 85,857 | |||||||||
| Other |
149,067 | 162,240 | 151,226 | |||||||||
|
|
|
|
|
|
|
|||||||
| Total gross written premium |
$ | 676,103 | $ | 670,764 | $ | 614,694 | ||||||
|
|
|
|
|
|
|
|||||||
| Aviation |
$ | 113,336 | $ | 111,446 | $ | 112,712 | ||||||
| Liability |
145,480 | 111,398 | 104,523 | |||||||||
| Sports & Entertainment |
23,028 | 28,518 | 21,258 | |||||||||
| Public Risk |
41,261 | 55,666 | 69,081 | |||||||||
| Other |
57,194 | 78,327 | 76,364 | |||||||||
|
|
|
|
|
|
|
|||||||
| Total net written premium |
$ | 380,299 | $ | 385,355 | $ | 383,938 | ||||||
|
|
|
|
|
|
|
|||||||
41
Table of Contents
Our U.S. Property & Casualty segment pretax earnings increased 16% in 2014, compared to 2013, primarily due to a lower net loss ratio in 2014. Pretax earnings increased $51.1 million in 2013, compared to 2012, primarily due to: 1) net favorable loss development of $39.4 million in 2013, compared to net adverse loss development of $2.3 million in 2012 and 2) net catastrophe losses of $2.0 million in 2013, compared to $11.3 million in 2012.
Gross written premium was essentially flat in 2014 due to increased writings of our expanding casualty business (included in Liability), offset by cyclical reductions in disability and contingency (included in Sports & Entertainment) and title and residual value insurance (included in Other). The growth in 2013, compared to 2012, was due to higher writings in excess casualty, primary casualty and technical property, as well as higher writings for disability, residual value and title reinsurance. Net written premium was flat in the three years due to continuing growth in Liability, offset by reduced premium due to changes in reinsurance for the Public Risk line of business.
Loss expense decreased in 2014 and 2013, primarily due to favorable loss development in both years. In addition, the 2014 accident year loss ratio decreased due to lower losses from the Public Risk line of business, which we began to reunderwrite in late 2012.
The net (favorable) adverse loss development recognized by line of business was as follows:
| 2014 | 2013 | 2012 | ||||||||||
| Aviation |
$ | (9,001) | $ | (8,041) | $ | (701) | ||||||
| Liability |
(18,736) | (6,907) | 9,069 | |||||||||
| Sports & Entertainment |
(757) | (2,371) | (1,461) | |||||||||
| Public Risk |
(6,244) | (1,303) | 8,142 | |||||||||
| Other |
(6,822) | (20,741) | (12,728) | |||||||||
|
|
|
|
|
|
|
|||||||
| Total net (favorable) adverse loss development |
$ | (41,560) | $ | (39,363) | $ | 2,321 | ||||||
|
|
|
|
|
|
|
|||||||
The net loss development resulted from our annual review of reserves for this segment, which we conducted in the third quarter of each year. The majority of the lines of business in this segment provide primary coverage, and claims are reported and settled on a short to medium-term basis. Accordingly, changes to our ultimate losses for a given underwriting year typically result from revised actuarial expectations, as compared to the prior year reserve review, with respect to the settlement value of known claims.
In our Aviation line of business, we recognized favorable development in 2014 and 2013 based on recording these reserves in line with actuarially-indicated results since the respective prior year annual review.
In our Liability line of business, we experienced lower losses in 2014, compared to 2013, due to higher favorable development in the professional lines, which include our E&O and employment practices liability products. In 2014, we recognized favorable development in our professional lines based on better than expected actuarially-indicated results since our 2013 annual reserve review, primarily for underwriting years 2012 and prior. In 2013, we recognized favorable development for underwriting years 2010 – 2011 due to better than expected actuarially-indicated results. In 2012, we recognized adverse development related to underwriting years 2005 – 2010.
Our Public Risk line of business had a lower loss ratio in 2014, primarily due to our expectation of lower ultimate losses in 2014 following our re-underwriting of this business. In addition, we recognized higher favorable development in 2014 based on better than expected actuarially-indicated results since our 2013 annual reserve review. In 2012, we recognized adverse development due to deteriorating results related to underwriting years 2009 and 2010. In addition, Public Risk included catastrophe losses of: 1) 2013 – $2.0 million for Midwest tornadoes and 2) 2012 – $3.8 million for Superstorm Sandy and $3.2 million for United States spring storms.
The majority of the favorable loss development in Other relates to the run off of an assumed quota share contract for business that we wrote from 2003 – 2008. We recognized $5.0 million in 2014, $17.0 million in 2013 and $5.6 million in 2012, due to continued better than expected results since the prior annual review. This assumed quota share contract is no longer earning premium, resulting in low or negative loss ratios in total for the Other line.
42
Table of Contents
Professional Liability Segment
The following tables summarize the operations of the Professional Liability segment.
| 2014 | 2013 | 2012 | ||||||||||
| Net earned premium |
$ | 351,690 | $ | 368,167 | $ | 394,687 | ||||||
| Other revenue |
1,082 | (7) | 731 | |||||||||
|
|
|
|
|
|
|
|||||||
| Segment revenue |
352,772 | 368,160 | 395,418 | |||||||||
|
|
|
|
|
|
|
|||||||
| Loss and loss adjustment expense, net |
206,690 | 195,429 | 229,873 | |||||||||
| Other expense |
67,692 | 66,391 | 66,721 | |||||||||
|
|
|
|
|
|
|
|||||||
| Segment expense |
274,382 | 261,820 | 296,594 | |||||||||
|
|
|
|
|
|
|
|||||||
| Segment pretax earnings |
$ | 78,390 | $ | 106,340 | $ | 98,824 | ||||||
|
|
|
|
|
|
|
|||||||
| Net loss ratio |
58.8 | % | 53.1 | % | 58.2 | % | ||||||
| Expense ratio |
19.2 | 18.0 | 16.9 | |||||||||
|
|
|
|
|
|
|
|||||||
| Combined ratio |
78.0 | % | 71.1 | % | 75.1 | % | ||||||
|
|
|
|
|
|
|
|||||||
| Total gross written premium |
$ | 517,152 | $ | 536,085 | $ | 539,383 | ||||||
|
|
|
|
|
|
|
|||||||
| Total net written premium |
$ | 346,720 | $ | 359,509 | $ | 378,138 | ||||||
|
|
|
|
|
|
|
|||||||
Our Professional Liability segment pretax earnings decreased $28.0 million in 2014, compared to 2013, primarily due to $26.3 million of favorable loss development in 2013. Pretax earnings increased $7.5 million in 2013, compared to 2012, due to an improved net loss ratio, primarily related to re-underwriting of our diversified financial products (DFP) line of business beginning in 2012. The segment’s premium decreased from 2012 to 2014, primarily due to lower writings of DFP from re-underwriting this business. Net written premium and net earned premium also reflect the impact of reinsurance during the past three years.
The segment had net favorable (adverse) loss development of ($1.0) million in 2014, $26.3 million in 2013 and $25.9 million in 2012. The development in each year resulted from our annual review of reserves for this segment, which we conducted in the third quarter of each year. The majority of the insurance coverage in this segment is provided through “claims made” policies, and the final settlement value of these claims is not expected to be determined for several years due to the underlying complex nature of the claims. Accordingly, changes to our ultimate losses for a given underwriting year typically result from management’s revised expectations, as compared to the prior year reserve review, with respect to the settlement value of known claims.
In 2014, we reduced reserves for our U.S. D&O product by $24.5 million related to underwriting years prior to 2007, due to better than expected loss experience compared to our 2013 annual reserve review. We also strengthened reserves for underwriting year 2007, due to indications of higher ultimate losses.
The 2013 net favorable development consisted of $15.5 million for our U.S. D&O product and $10.8 million for our International D&O product. Our 2013 reserve review indicated better than expected experience for underwriting years prior to 2007 as well as 2009 and 2010 (totaling $64.2 million), partially offset by reserve strengthening of $37.9 million in underwriting years 2007 and 2008, which were impacted by the worldwide financial crisis.
The 2012 net favorable development consisted of $9.0 million for our U.S. D&O product and $16.9 million for our International D&O product. Our 2012 reserve review indicated that incurred loss development, primarily for underwriting years 2005 and 2006, was lower than expected as compared to our 2011 reserve review, primarily due to actual outcomes on reported claims. This favorable development was partially offset by higher estimates of ultimate losses in the 2008 underwriting year.
The fluctuations in the expense ratio primarily related to reinsurance profit commissions of $2.8 million in 2014, $6.5 million in 2013 and $5.1 million in 2012, recognized in conjunction with the favorable development in those years. The profit commissions, which offset the segment’s other expense, reduced the expense ratio by 0.8 percentage points in 2014, 1.8 percentage points in 2013 and 1.3 percentage points in 2012. Excluding the impact of profit commissions, the expense ratio increased over the three year period due to declining net earned premium.
43
Table of Contents
Accident & Health Segment
The following tables summarize the operations of the Accident & Health segment.
| 2014 | 2013 | 2012 | ||||||||||
| Net earned premium |
$ | 981,219 | $ | 883,515 | $ | 831,827 | ||||||
| Other revenue |
9,663 | 4,932 | 4,918 | |||||||||
|
|
|
|
|
|
|
|||||||
| Segment revenue |
990,882 | 888,447 | 836,745 | |||||||||
|
|
|
|
|
|
|
|||||||
| Loss and loss adjustment expense, net |
696,288 | 630,210 | 601,076 | |||||||||
| Other expense |
155,469 | 130,814 | 122,232 | |||||||||
|
|
|
|
|
|
|
|||||||
| Segment expense |
851,757 | 761,024 | 723,308 | |||||||||
|
|
|
|
|
|
|
|||||||
| Segment pretax earnings |
$ | 139,125 | $ | 127,423 | $ | 113,437 | ||||||
|
|
|
|
|
|
|
|||||||
| Net loss ratio |
71.0 | % | 71.3 | % | 72.3 | % | ||||||
| Expense ratio |
15.7 | 14.7 | 14.6 | |||||||||
|
|
|
|
|
|
|
|||||||
| Combined ratio |
86.7 | % | 86.0 | % | 86.9 | % | ||||||
|
|
|
|
|
|
|
|||||||
| Medical Stop-loss |
$ | 870,249 | $ | 816,499 | $ | 776,965 | ||||||
| Other |
110,970 | 67,016 | 54,862 | |||||||||
|
|
|
|
|
|
|
|||||||
| Total net earned premium |
$ | 981,219 | $ | 883,515 | $ | 831,827 | ||||||
|
|
|
|
|
|
|
|||||||
| Medical Stop-loss |
73.6 | % | 72.7 | % | 73.7 | % | ||||||
| Other |
50.6 | 54.8 | 52.1 | |||||||||
|
|
|
|
|
|
|
|||||||
| Total net loss ratio |
71.0 | % | 71.3 | % | 72.3 | % | ||||||
|
|
|
|
|
|
|
|||||||
| Medical Stop-loss |
$ | 876,540 | $ | 817,943 | $ | 777,351 | ||||||
| Other |
121,847 | 65,112 | 58,445 | |||||||||
|
|
|
|
|
|
|
|||||||
| Total gross written premium |
$ | 998,387 | $ | 883,055 | $ | 835,796 | ||||||
|
|
|
|
|
|
|
|||||||
| Medical Stop-loss |
$ | 870,187 | $ | 816,499 | $ | 776,965 | ||||||
| Other |
121,847 | 64,869 | 58,043 | |||||||||
|
|
|
|
|
|
|
|||||||
| Total net written premium |
$ | 992,034 | $ | 881,368 | $ | 835,008 | ||||||
|
|
|
|
|
|
|
|||||||
Our Accident & Health segment pretax earnings increased 9% in 2014 and 12% in 2013, compared to the prior year, due to growth in net earned premium. This increase was attributable to writing new medical stop-loss and short-term medical business, as well as rate increases on medical stop-loss renewals in 2014 and 2013. Our short-term medical product experienced significant growth in 2014 as individuals selected this product in lieu of coverage under the U.S. Affordable Care Act, which began enrollments in late 2013. The segment results included net favorable loss development of $13.1 million in 2014, $18.0 million in 2013 and $10.5 million in 2012. The segment’s expense ratio increased in 2014 due to higher commissions related to the short-term medical product, as well as higher compensation and benefits expense.
Our medical stop-loss business provides annual coverage for groups of employees, and claims are reported and settled within 12 to 15 months for each reporting year. Claims for our Other business, particularly the short-term medical product, are reported and settled quickly. We generally conducted our annual review of the segment’s reserves in the fourth quarter. Our reserve reviews indicated lower than expected claims activity related to our medical stop-loss product in: 1) 2014 – for underwriting years 2012 and 2013, 2) 2013 – for underwriting years 2011 and 2012 and 3) 2012 – for underwriting year 2011.
44
Table of Contents
U.S. Surety & Credit Segment
The following tables summarize the operations of the U.S. Surety & Credit segment.
| 2014 | 2013 | 2012 | ||||||||||
| Net earned premium |
$ | 199,764 | $ | 194,286 | $ | 207,955 | ||||||
| Other revenue |
2,505 | 1,468 | 843 | |||||||||
|
|
|
|
|
|
|
|||||||
| Segment revenue |
202,269 | 195,754 | 208,798 | |||||||||
|
|
|
|
|
|
|
|||||||
| Loss and loss adjustment expense, net |
42,273 | 24,143 | 38,535 | |||||||||
| Other expense |
112,232 | 109,550 | 113,619 | |||||||||
|
|
|
|
|
|
|
|||||||
| Segment expense |
154,505 | 133,693 | 152,154 | |||||||||
|
|
|
|
|
|
|
|||||||
| Segment pretax earnings |
$ | 47,764 | $ | 62,061 | $ | 56,644 | ||||||
|
|
|
|
|
|
|
|||||||
| Net loss ratio |
21.2 | % | 12.4 | % | 18.5 | % | ||||||
| Expense ratio |
55.5 | 56.0 | 54.4 | |||||||||
|
|
|
|
|
|
|
|||||||
| Combined ratio |
76.7 | % | 68.4 | % | 72.9 | % | ||||||
|
|
|
|
|
|
|
|||||||
| Surety |
$ | 146,347 | $ | 147,041 | $ | 158,711 | ||||||
| Credit |
53,417 | 47,245 | 49,244 | |||||||||
|
|
|
|
|
|
|
|||||||
| Total net earned premium |
$ | 199,764 | $ | 194,286 | $ | 207,955 | ||||||
|
|
|
|
|
|
|
|||||||
| Surety |
14.3 | % | 11.8 | % | 16.6 | % | ||||||
| Credit |
40.0 | 14.3 | 24.9 | |||||||||
|
|
|
|
|
|
|
|||||||
| Total net loss ratio |
21.2 | % | 12.4 | % | 18.5 | % | ||||||
|
|
|
|
|
|
|
|||||||
| Surety |
$ | 162,867 | $ | 165,505 | $ | 159,159 | ||||||
| Credit |
69,098 | 63,425 | 62,309 | |||||||||
|
|
|
|
|
|
|
|||||||
| Total gross written premium |
$ | 231,965 | $ | 228,930 | $ | 221,468 | ||||||
|
|
|
|
|
|
|
|||||||
| Surety |
$ | 147,293 | $ | 147,517 | $ | 144,573 | ||||||
| Credit |
57,474 | 51,604 | 51,331 | |||||||||
|
|
|
|
|
|
|
|||||||
| Total net written premium |
$ | 204,767 | $ | 199,121 | $ | 195,904 | ||||||
|
|
|
|
|
|
|
|||||||
Our U.S. Surety & Credit segment pretax earnings decreased $14.3 million in 2014, compared to 2013, primarily due to recognizing more net favorable loss development in 2013 than in 2014. The segment’s pretax earnings increased $5.4 million in 2013, compared to 2012, due to increased net favorable loss development in 2013. Premium in our credit line of business increased in 2014 due to writing new business. Premium in our surety line of business has remained relatively flat due to competition and economic conditions impacting the construction industry.
The segment had net favorable loss development of $22.6 million in 2014, $37.9 million in 2013 and $25.4 million in 2012. Each of our annual reserve reviews, which we conducted in the fourth quarter, indicated that actual loss experience was better than the actuarial expectations in the prior year reserve review. As a result, we recognized favorable loss development as follows: 1) 2014 – $20.3 million for surety and $2.3 million for credit, 2) 2013 – $20.6 million for surety and $17.3 million for credit and 3) 2012 – $18.0 million for surety and $7.4 million for credit.
45
Table of Contents
International Segment
The following tables summarize the operations of the International segment.
| 2014 | 2013 | 2012 | ||||||||||
| Net earned premium |
$ | 426,480 | $ | 413,206 | $ | 412,853 | ||||||
| Other revenue |
3,711 | 4,334 | 5,005 | |||||||||
|
|
|
|
|
|
|
|||||||
| Segment revenue |
430,191 | 417,540 | 417,858 | |||||||||
|
|
|
|
|
|
|
|||||||
| Loss and loss adjustment expense, net |
196,134 | 249,199 | 189,410 | |||||||||
| Other expense |
175,158 | 158,869 | 146,807 | |||||||||
|
|
|
|
|
|
|
|||||||
| Segment expense |
371,292 | 408,068 | 336,217 | |||||||||
|
|
|
|
|
|
|
|||||||
| Segment pretax earnings |
$ | 58,899 | $ | 9,472 | $ | 81,641 | ||||||
|
|
|
|
|
|
|
|||||||
| Net loss ratio |
46.0 | % | 60.3 | % | 45.9 | % | ||||||
| Expense ratio |
40.7 | 38.0 | 35.1 | |||||||||
|
|
|
|
|
|
|
|||||||
| Combined ratio |
86.7 | % | 98.3 | % | 81.0 | % | ||||||
|
|
|
|
|
|
|
|||||||
| Marine & Energy |
$ | 97,277 | $ | 97,143 | $ | 100,716 | ||||||
| Property Treaty |
99,064 | 112,042 | 100,565 | |||||||||
| Surety & Credit |
80,535 | 72,294 | 71,378 | |||||||||
| Liability |
88,309 | 75,329 | 76,484 | |||||||||
| Other |
61,295 | 56,398 | 63,710 | |||||||||
|
|
|
|
|
|
|
|||||||
| Total net earned premium |
$ | 426,480 | $ | 413,206 | $ | 412,853 | ||||||
|
|
|
|
|
|
|
|||||||
| Marine & Energy |
42.9 | % | 39.9 | % | 32.9 | % | ||||||
| Property Treaty |
18.6 | 47.0 | 24.4 | |||||||||
| Surety & Credit |
91.9 | 156.9 | 122.6 | |||||||||
| Liability |
37.0 | 36.5 | 33.1 | |||||||||
| Other |
47.6 | 30.0 | 29.7 | |||||||||
|
|
|
|
|
|
|
|||||||
| Total net loss ratio |
46.0 | % | 60.3 | % | 45.9 | % | ||||||
|
|
|
|
|
|
|
|||||||
| Marine & Energy |
$ | 158,256 | $ | 163,279 | $ | 155,931 | ||||||
| Property Treaty |
133,755 | 139,056 | 138,065 | |||||||||
| Surety & Credit |
105,144 | 90,584 | 84,288 | |||||||||
| Liability |
98,857 | 82,380 | 75,466 | |||||||||
| Other |
81,625 | 73,200 | 77,417 | |||||||||
|
|
|
|
|
|
|
|||||||
| Total gross written premium |
$ | 577,637 | $ | 548,499 | $ | 531,167 | ||||||
|
|
|
|
|
|
|
|||||||
| Marine & Energy |
$ | 99,288 | $ | 95,124 | $ | 105,585 | ||||||
| Property Treaty |
106,326 | 111,334 | 105,442 | |||||||||
| Surety & Credit |
89,233 | 77,857 | 74,977 | |||||||||
| Liability |
91,565 | 77,097 | 69,546 | |||||||||
| Other |
62,537 | 55,627 | 63,605 | |||||||||
|
|
|
|
|
|
|
|||||||
| Total net written premium |
$ | 448,949 | $ | 417,039 | $ | 419,155 | ||||||
|
|
|
|
|
|
|
|||||||
46
Table of Contents
Our International segment pretax earnings increased $49.4 million in 2014, compared to 2013, primarily due to the favorable impact of lower catastrophe losses and lower net adverse loss development in 2014. Segment earnings decreased $72.2 million in 2013, compared to 2012, primarily due to higher catastrophe losses in 2013 and net adverse loss development in 2013, compared to net favorable development in 2012.
The increase in premium in 2014 and 2013 was primarily due to increased writings in our Surety & Credit and Liability lines of business, as well as our accident and health and direct and facultative property lines of business (included in Other). The increase in 2014 was partially offset by decreased writings of Marine & Energy and Property Treaty business, due to reduced pricing and expanded competition in these lines.
The segment incurred lower net catastrophe losses in 2014 than in 2013 and 2012. We recognized no large catastrophe losses in 2014. In the prior years, we recognized pretax catastrophe losses, including reinstatement premium, for these major catastrophic events: 1) 2013 – European floods ($15.0 million) and German hail storms ($13.0 million) and 2) 2012 – Superstorm Sandy ($23.9 million). The remaining losses related to small catastrophes that impacted our property treaty business. The following table summarizes the segment’s accident year catastrophe losses, as well as the impact on key metrics:
| 2014 | 2013 | 2012 | ||||||||||
| Gross losses |
$ | 28,762 | $ | 54,639 | $ | 61,893 | ||||||
|
|
|
|
|
|
|
|||||||
| Net losses, after reinsurance |
$ | 28,683 | $ | 53,939 | $ | 41,063 | ||||||
| Reinstatement premium, net |
(2,247) | (3,932) | 401 | |||||||||
|
|
|
|
|
|
|
|||||||
| Total net catastrophe losses |
$ | 26,436 | $ | 50,007 | $ | 41,464 | ||||||
|
|
|
|
|
|
|
|||||||
| Impact of net catastrophe losses (in percentage points) on: |
||||||||||||
| Net loss ratio |
6.5 | % | 12.6 | % | 10.0 | % | ||||||
| Expense ratio |
(0.2) | (0.4) | - | |||||||||
|
|
|
|
|
|
|
|||||||
| Combined ratio |
6.3 | % | 12.2 | % | 10.0 | % | ||||||
|
|
|
|
|
|
|
|||||||
The International segment recognized net adverse loss development of $25.1 million in 2014 and $43.8 million in 2013, compared to net favorable development of $10.1 million in 2012. The net (favorable) adverse loss development recognized by line of business was as follows:
| 2014 | 2013 | 2012 | ||||||||||
| Marine & Energy |
$ | (4,754) | $ | (7,316) | $ | (18,851) | ||||||
| Property Treaty |
(8,478) | (1,303) | (1,116) | |||||||||
| Surety & Credit |
44,143 | 69,947 | 43,266 | |||||||||
| Liability |
(9,459) | (14,618) | (20,525) | |||||||||
| Other |
3,598 | (2,905) | (12,858) | |||||||||
|
|
|
|
|
|
|
|||||||
| Total net (favorable) adverse loss development |
$ | 25,050 | $ | 43,805 | $ | (10,084) | ||||||
|
|
|
|
|
|
|
|||||||
The totals in the above table include favorable development from prior years’ catastrophes of $5.4 million, $6.0 million and $18.9 million in 2014, 2013 and 2012, respectively, primarily related to these events: 1) 2014 – European floods, 2) 2013 – Superstorm Sandy and 3) 2012 – Hurricane Irene and the Japan earthquake and tsunami.
47
Table of Contents
The lines of business in our International segment provide a variety of coverages, most of which are medium to long-tail lines with moderate timing for claims reporting and medium to high reserve volatility. This segment incurs most of our catastrophe losses. In Marine & Energy, we insure complex, worldwide energy production facilities, oil rigs and offshore platforms that are subject to expensive business interruption claims and replacement costs. Catastrophe-related claims for energy projects may take several years to settle and can involve significant reserve volatility for coverage on both a primary and excess basis. The Property Treaty and direct and facultative property lines are short-tail with relatively fast claims reporting and lower reserve volatility. Our Liability business, providing primarily U.K. professional liability coverage, has long-tail claims reporting and medium reserve volatility.
We generally conduct our annual review of the International segment’s reserves in the fourth quarter. However, we accelerated our 2014 and 2013 annual reserve reviews to the third quarter of each year due to the timing of issues related to certain Spanish surety bonds and a growing actuarially-indicated redundancy in several lines of business.
The net adverse loss development in the Surety & Credit line of business in all three years primarily related to strengthening our reserves on a specific class of Spanish surety bonds, the majority of which were written prior to 2006. We recorded $48.9 million of net reserves in 2012 based on management’s evaluation of the claims and the likelihood that we would ultimately be required to pay the claims, based on information available at year-end 2012. In 2013, we revised the estimates of our liability under these bonds in light of an adverse Spanish Supreme Court ruling against an unaffiliated insurance company with respect to a type of surety bond similar to ours. This resulted in $70.3 million of net adverse development in 2013. We paid claims related to these bonds throughout 2014 and settled a majority of the outstanding claims in the third quarter of 2014. In light of these settlements, we revised our estimates of our liability under these bonds and strengthened these reserves, which resulted in $43.5 million of net adverse development in 2014.
Our actual loss experience for Marine & Energy was better than the actuarial expectations in each year’s reserve review compared to the prior year review. We conducted a detailed review of outstanding claims during each annual reserve review to assist in determining these reserves. We recognized net favorable development in 2014 related to the 2012 and prior accident years, partially offset by $10.0 million of reserve strengthening for the 2013 accident year. The net favorable development recognized in 2013 related to the 2008 – 2010 and 2012 accident years, as well as the release of $3.4 million of prior years’ catastrophe reserves related to Superstorm Sandy. The net favorable development recognized in 2012 related to the 2010 and prior accident years, and included the release of $5.1 million of prior years’ catastrophe reserves primarily related to the Japan earthquake and tsunami.
In Property Treaty, the 2014 net favorable development included the release of $6.0 million of prior years’ catastrophe reserves related to the 2013 European floods, as well as $1.5 million of reserve strengthening for the 2011 Denmark storms. The remaining net favorable development related to better than expected results compared to the prior reserve review.
The net favorable development in Liability included favorable development related to our U.K. professional liability product as follows: 1) 2014 – $12.7 million (for 2013 and prior accident years), 2) 2013 – $16.1 million (for 2011 and prior accident years) and 3) 2012 – $12.8 million (for 2010 and prior accident years). In each year, the actual loss experience was better than our actuarial expectations in the prior year reserve review. In addition, there was net adverse development of $3.2 million in 2014 and $1.5 million in 2013, and net favorable development of $7.7 million in 2012, primarily related to other liability business for accident years 2011 and prior.
The net favorable development of $12.9 million in the Other category related to reserve reductions for various 2011 catastrophic events.
The previously discussed favorable and adverse development, as well as the lower accident year catastrophe losses in 2014, caused the significant variances in the segment and line of business net loss ratios year-over-year. The segment’s expense ratio increased in 2014 and 2013 due to higher compensation and benefits expense, as well as higher technology costs. In addition, the 2014 expense ratio increased due to the impact of the stronger British pound sterling relative to the U.S. dollar, compared to 2013, as most of the segment’s operating expenses are incurred in British pound sterling.
48
Table of Contents
Investing Segment
Our Investing segment includes our consolidated investment portfolio, as well as all investment income, investment related expenses, realized investment gains and losses, and other-than-temporary impairment credit losses on investments. Our insurance segments generate the cash flow underlying these investments. We manage all investments and evaluate our investment results centrally and, thus, include them in a separate segment for reporting purposes.
We invest the majority of our funds in highly-rated fixed maturity securities, which are designated as available for sale securities. We held $6.6 billion of fixed maturity securities at December 31, 2014. Substantially all of our fixed maturity securities were investment grade and 73% were rated AAA or AA. In addition, we held $296.4 million of equity securities at December 31, 2014.
The following tables summarize the results and certain key metrics of our Investing segment.
| 2014 | 2013 | 2012 | ||||||||||
| Net investment income from: |
||||||||||||
| Fixed maturity securities |
||||||||||||
| Taxable |
$ | 96,886 | $ | 98,966 | $ | 114,047 | ||||||
| Exempt from U.S. income taxes |
113,980 | 113,875 | 107,488 | |||||||||
|
|
|
|
|
|
|
|||||||
| Total fixed maturity securities |
210,866 | 212,841 | 221,535 | |||||||||
| Equity securities |
16,555 | 14,537 | 3,959 | |||||||||
| Other |
1,434 | 828 | 3,476 | |||||||||
|
|
|
|
|
|
|
|||||||
| Total investment income |
228,855 | 228,206 | 228,970 | |||||||||
| Investment expense |
(7,235) | (8,024) | (6,336) | |||||||||
|
|
|
|
|
|
|
|||||||
| Total net investment income |
221,620 | 220,182 | 222,634 | |||||||||
| Net realized investment gain |
66,370 | 42,030 | 31,148 | |||||||||
| Other-than-temporary impairment credit losses |
- | - | (1,028) | |||||||||
|
|
|
|
|
|
|
|||||||
| Segment pretax earnings |
$ | 287,990 | $ | 262,212 | $ | 252,754 | ||||||
|
|
|
|
|
|
|
|||||||
| Fixed maturity securities: |
||||||||||||
| Average yield * |
3.5 | % | 3.6 | % | 3.9 | % | ||||||
| Average tax equivalent yield * |
4.3 | % | 4.5 | % | 4.7 | % | ||||||
| Weighted-average life |
8.1 years | 8.2 years | 8.2 years | |||||||||
| Weighted-average duration |
4.7 years | 5.1 years | 4.7 years | |||||||||
| Weighted-average rating |
AA | AA | AA | |||||||||
* Excluding realized and unrealized gains and losses.
In the past several years, the average yield on our fixed maturity securities has continued to decline due to lower reinvestment rates. Despite a persistent low interest rate environment, we have maintained a high quality investment portfolio by allocating funds to longer dated tax-exempt securities when the yield curve has been steep and relative value has been attractive. We have offset this duration extension by investing in securities with attractive yields and low duration, such as bank loans (classified as corporate securities), collateralized loan obligations (classified as asset-backed securities) and global publicly-traded equity securities. Our general policy has been to hold our available for sale securities through periods of fluctuating interest rates. We sell securities and recognize realized gains and losses from these sales if we can reinvest the proceeds to achieve our overall objectives of sufficient liquidity, enhanced income and long-term growth in book value.
49
Table of Contents
The weighted average duration of our fixed maturity securities portfolio decreased to 4.7 years at December 31, 2014 (compared to 5.1 years at December 31, 2013), primarily due to the impact of the lower market interest rates on our municipal securities with call options and structured securities with prepayment options. Duration increased in 2013 due to increased prevailing interest rates and spreads based on investor concerns that the U.S. Federal government would tighten its fiscal policies. Rates on 10-year U.S. Treasury notes declined 86 basis points in 2014 and increased 126 basis points in 2013.
This table summarizes our investments by type, substantially all of which are reported at fair value, at December 31, 2014 and 2013. The methodologies used to determine the fair value of our investments are described in Note 3, “Fair Value Measurements” to the Consolidated Financial Statements.
| December 31, 2014 | December 31, 2013 | |||||||||||||||
| Amount | % | Amount | % | |||||||||||||
| Fixed maturity securities |
||||||||||||||||
| U.S. government and government agency securities |
$ | 70,969 | 1 | % | $ | 92,709 | 1 | % | ||||||||
| Fixed maturity securities of states, municipalities and political subdivisions |
954,708 | 13 | 986,486 | 15 | ||||||||||||
| Special purpose revenue bonds of states, municipalities and political subdivisions |
2,389,012 | 33 | 2,265,195 | 34 | ||||||||||||
| Corporate securities |
1,276,835 | 18 | 1,225,238 | 18 | ||||||||||||
| Residential mortgage-backed securities |
821,694 | 11 | 618,119 | 9 | ||||||||||||
| Commercial mortgage-backed securities |
611,631 | 9 | 504,888 | 7 | ||||||||||||
| Asset-backed securities |
366,827 | 5 | 182,392 | 3 | ||||||||||||
| Foreign government securities |
118,692 | 2 | 147,446 | 2 | ||||||||||||
| Equity securities |
296,352 | 4 | 517,466 | 8 | ||||||||||||
| Short-term investments |
258,186 | 4 | 178,753 | 3 | ||||||||||||
|
|
|
|
|
|
|
|
|
|||||||||
| Total investments |
$ | 7,164,906 | 100 | % | $ | 6,718,692 | 100 | % | ||||||||
|
|
|
|
|
|
|
|
|
|||||||||
| Our total investments increased $446.2 million in 2014, principally from newly generated cash flow and a $108.8 million increase in the pretax net unrealized gain. At December 31, 2014, the net unrealized gain on our investment portfolio was $262.9 million, compared to $154.1 million at December 31, 2013. The increase in the net unrealized gain was due to the decline in interest rates in 2014. During 2014, we sold equity securities with a book value of $374.8 million, and realized a net gain of $61.8 million, in order to reposition our overall investment portfolio. | ||||||||||||||||
| The ratings of our individual securities within our fixed maturity securities portfolio at December 31, 2014 were as follows:
|
| |||||||||||||||
| Amount | % | |||||||||||||||
| AAA |
$ | 1,082,778 | 16 | % | ||||||||||||
| AA |
3,750,714 | 57 | ||||||||||||||
| A |
1,340,561 | 21 | ||||||||||||||
| BBB |
289,042 | 4 | ||||||||||||||
| BB and below |
147,273 | 2 | ||||||||||||||
|
|
|
|
|
|||||||||||||
| Total fixed maturity securities |
$ | 6,610,368 | 100 | % | ||||||||||||
|
|
|
|
|
|||||||||||||
50
Table of Contents
The table below indicates the contractual or expected maturity distribution of our fixed maturity securities at December 31, 2014. In the table, we allocated the maturities of our mortgage-backed and asset-backed securities based on the expected future principal payments. The weighted-average life of our mortgage-backed and asset-backed securities is approximately 5.3 years based on expected future cash flows.
| Non-structured | Mortgage-backed and | |||||||||||||||||||||||
| securities at | asset-backed securities | |||||||||||||||||||||||
| amortized cost | at amortized cost | Total | ||||||||||||||||||||||
| Amount | % | Amount | % | Amount | % | |||||||||||||||||||
| One year or less |
$ | 168,246 | 4 | % | $ | 78,484 | 4 | % | $ | 246,730 | 4 | % | ||||||||||||
| One year to five years |
1,150,042 | 25 | 752,017 | 43 | 1,902,059 | 30 | ||||||||||||||||||
| Five years to ten years |
1,392,501 | 30 | 891,455 | 51 | 2,283,956 | 36 | ||||||||||||||||||
| Ten years to fifteen years |
875,679 | 19 | 43,015 | 2 | 918,694 | 14 | ||||||||||||||||||
| More than fifteen years |
997,752 | 22 | 3,546 | - | 1,001,298 | 16 | ||||||||||||||||||
|
|
|
|
|
|
|
|
|
|
|
|
|
|||||||||||||
| Total fixed maturity securities |
$ | 4,584,220 | 100 | % | $ | 1,768,517 | 100 | % | $ | 6,352,737 | 100 | % | ||||||||||||
|
|
|
|
|
|
|
|
|
|
|
|
|
|||||||||||||
At December 31, 2014, we held $2.4 billion of special purpose revenue bonds, as well as $954.7 million of general obligation bonds, which are issued by states, municipalities and political subdivisions and collectively referred to as municipal bonds in the investment market. The overall rating of our municipal bonds was AA at December 31, 2014. Within our municipal bond portfolio, we held $474.7 million of pre-refunded bonds, which are supported by U.S. government debt obligations. Our special purpose revenue bonds are secured by revenue sources specific to each security. At December 31, 2014, the percentages of our special purpose revenue bond portfolio supported by these major revenue sources were as follows: 1) education – 24%, 2) transportation – 22%, 3) water and sewer – 19% and 4) electric – 12%.
Many of our special purpose revenue bonds are insured by mono-line insurance companies or supported by credit enhancement programs of various states and municipalities. We view bond insurance as credit enhancement and not credit substitution. We base our investment decision on the strength of the issuer. A credit review is performed on each issuer and on the sustainability of the revenue source before we acquire a special purpose revenue bond and periodically thereafter. The underlying average credit rating of our special purpose revenue bond issuers, excluding any bond insurance, was AA at December 31, 2014. Although economic conditions in the United States may reduce the source of revenue to support certain of these securities, the majority are supported by revenue from essential sources, as indicated above, which we believe generate a stable source of revenue.
At December 31, 2014, we held a commercial mortgage-backed securities portfolio with a fair value of $611.6 million, an average rating of AA+ and an average loan-to-value ratio of 63%. We owned no collateralized debt obligations (CDOs) and we are not counterparty to any credit default swap transactions.
Some of our fixed maturity securities have call or prepayment options. In addition, mortgage-backed and certain asset-backed securities have prepayment, extension or other market-related credit risk. Calls and prepayments subject us to reinvestment risk should interest rates fall and issuers call their securities and we reinvest the proceeds at lower interest rates. Prepayment risk exists if cash flows from the repayment of principal occurs earlier than anticipated because of declining interest rates. Extension risk exists if cash flows from the repayment of principal occurs later than anticipated because of rising interest rates. Credit risk exists if mortgagees default on the underlying mortgages. Net investment income and/or cash flows from investments that have call or prepayment options and prepayment, extension or credit risk may differ from what was anticipated at the time of investment. We mitigate these risks by investing in investment grade securities with varied maturity dates so that only a portion of our portfolio will mature at any point in time. In 2015, we expect approximately 11% of our fixed maturity securities portfolio to mature, call or prepay. Assuming prevailing interest rates remain constant throughout 2015, reinvestment of these funds will be at tax-equivalent yields that are approximately 160 basis points lower than the year-end 2014 yields for these securities.
51
Table of Contents
At December 31, 2014, we held corporate fixed securities issued by foreign corporations with an aggregate fair value of $478.3 million. In addition, we held securities issued by foreign governments, agencies or supranational entities with an aggregate fair value of $118.7 million. The following table details our holdings of foreign debt at December 31, 2014.
| Corporate debt | ||||||||||||||||||||||||||||
| Financial institutions | Non-financial institutions | Sovereign debt and agencies | ||||||||||||||||||||||||||
| Cost or | Cost or | Cost or | Total | |||||||||||||||||||||||||
| amortized | Fair | amortized | Fair | amortized | Fair | fair | ||||||||||||||||||||||
|
Country |
cost | value | cost | value | cost | value | value | |||||||||||||||||||||
| United Kingdom |
$ | 70,361 | $ | 72,994 | $ | 78,160 | $ | 79,185 | $ | 18,644 | $ | 18,646 | $ | 170,825 | ||||||||||||||
| Canada |
27,121 | 27,107 | 33,368 | 33,491 | 20,524 | 20,469 | 81,067 | |||||||||||||||||||||
| The Netherlands |
28,649 | 28,370 | 37,792 | 37,290 | 13,820 | 14,190 | 79,850 | |||||||||||||||||||||
| France |
13,215 | 13,219 | 39,554 | 39,626 | 2,858 | 2,894 | 55,739 | |||||||||||||||||||||
| Germany |
11,377 | 11,446 | 18,539 | 18,732 | 24,390 | 24,393 | 54,571 | |||||||||||||||||||||
| Switzerland |
33,162 | 33,651 | - | - | 9,826 | 8,818 | 42,469 | |||||||||||||||||||||
| Norway |
5,425 | 5,072 | 13,777 | 14,273 | 4,762 | 4,735 | 24,080 | |||||||||||||||||||||
| Sweden |
12,965 | 12,915 | 6,738 | 6,218 | 4,193 | 4,164 | 23,297 | |||||||||||||||||||||
| Supranational (1) |
- | - | - | - | 19,344 | 19,338 | 19,338 | |||||||||||||||||||||
| Other (2) |
11,592 | 11,275 | 32,587 | 33,402 | 1,118 | 1,045 | 45,722 | |||||||||||||||||||||
|
|
|
|
|
|
|
|
|
|
|
|
|
|
|
|||||||||||||||
| Total foreign debt |
$ | 213,867 | $ | 216,049 | $ | 260,515 | $ | 262,217 | $ | 119,479 | $ | 118,692 | $ | 596,958 | ||||||||||||||
|
|
|
|
|
|
|
|
|
|
|
|
|
|
|
|||||||||||||||
| (1) | Supranational represents investments in European Investment Bank, Inter-American Development Bank, International Bank for Reconstruction and Development, Asian Development Bank, and European System of Financial Supervisors. |
| (2) | Includes all countries whose total foreign debt is individually less than $10.0 million. |
Corporate & Other
Our Corporate & Other category includes operations not related to our segments, including unallocated corporate operating expenses, interest expense on notes payable, foreign currency expense (benefit) and underwriting results of our Exited Lines of business.
The following table summarizes activity in the Corporate & Other category.
| 2014 | 2013 | 2012 | ||||||||||
| Net earned premium |
$ | 476 | $ | 12,931 | $ | 41,253 | ||||||
| Other revenue |
3,149 | 459 | 86 | |||||||||
|
|
|
|
|
|
|
|||||||
| Total revenue |
3,625 | 13,390 | 41,339 | |||||||||
|
|
|
|
|
|
|
|||||||
| Loss and loss adjustment expense, net – Exited Lines |
(5,173 | ) | 15,879 | 37,331 | ||||||||
| Other expense – Exited Lines |
3,612 | 4,506 | 7,713 | |||||||||
| Other expense – Corporate |
64,826 | 54,778 | 61,083 | |||||||||
| Interest expense |
27,948 | 26,038 | 25,132 | |||||||||
| Foreign currency expense (benefit) |
(23,189 | ) | 5,288 | 6,184 | ||||||||
|
|
|
|
|
|
|
|||||||
| Total expense |
68,024 | 106,489 | 137,443 | |||||||||
|
|
|
|
|
|
|
|||||||
| Pretax loss |
$ | (64,399 | ) | $ | (93,099 | ) | $ | (96,104 | ) | |||
|
|
|
|
|
|
|
|||||||
52
Table of Contents
Net earned premium declined as we exited the HMO and medical excess reinsurance products in late 2012. Premium related to the other products included in Exited Lines was insignificant in all years. The loss and loss adjustment expense in 2013 and 2012 related to the HMO and medical excess reinsurance products. The Exited Lines recognized net favorable loss development of $5.1 million and $0.5 million in 2014 and 2012, respectively, and net adverse loss development of $4.1 million in 2013. The Exited Lines incur operating costs primarily for claims personnel and facilities.
Our Corporate expenses not allocated to the segments increased $10.0 million in 2014, compared to 2013, primarily due to: 1) an indemnification benefit of $5.1 million recognized in 2013, 2) higher incentive compensation based on the increase in consolidated pretax earnings and 3) expense related to certain unvested restricted stock awards for which the performance criteria were achieved in 2014. Our Corporate expenses not allocated to the segments decreased $6.3 million in 2013, compared to 2012, principally due to the $5.1 million indemnification benefit in 2013. We reduced our indemnification liability, which related to a 2001 subsidiary sale, due to favorable claims activity and successful subrogation recoveries. Our interest expense increased year-over-year due to higher borrowings on our Revolving Loan Facility.
The impact of foreign currency benefit/expense fluctuated year-over-year principally due to changes in the value of the British pound sterling and the Euro relative to the U.S. dollar. We hold available for sale securities denominated in non-functional currencies to economically hedge the currency exchange risk on our loss reserves denominated in non-functional currencies. The foreign currency benefit/expense related to loss reserves is recorded through the income statement, while the foreign currency benefit/expense related to available for sale securities is recorded through other comprehensive income within shareholders’ equity. This mismatch may cause fluctuations in our reported foreign currency benefit/expense in future periods.
Liquidity and Capital Management
We believe we have sufficient sources of liquidity at both a consolidated and insurance company legal entity level at a reasonable cost to pay claims and meet our other contractual obligations and liabilities as they become due in the short-term and long-term. Our current sources of liquidity include: 1) significant operating cash flow generated by our insurance companies, 2) our $7.2 billion investment portfolio, most of which is held by our insurance companies, 3) our revolving loan facility and 4) a $1.0 billion shelf registration. Our insurance companies have sufficient resources to pay potential claims. Based on historical payment patterns and claims history, as of year-end 2014 we project that our insurance companies will pay approximately $1.5 billion of claims and collect approximately $0.4 billion of reinsurance recoveries in 2015. In addition to expected cash flow from their 2015 operations, these companies had $6.3 billion of investments available at year-end 2014 to fund claims payments, if needed. Our sources of liquidity are discussed below.
Cash Flow
We manage the liquidity of our insurance companies such that each subsidiary’s anticipated claims payments will be met by its own current operating cash flows, cash, short-term investments or investment maturities. Our insurance companies receive substantial cash from premiums, reinsurance recoverables, surety collateral, outward commutations, proceeds from sales and redemptions of investments, and investment income. Their principal cash outflows are for the payment of claims and loss adjustment expenses, premium payments to reinsurers, return of surety collateral, inward commutations, purchases of investments, policy acquisition costs, operating expenses, taxes and dividends paid to the parent company. We report all of the insurance companies’ investing activity in our Investing segment for segment reporting purposes. Our parent company’s principal cash inflows relate to its investment portfolio and dividends paid by the insurance companies, and its principal cash outflows relate to debt service, operating expenses, dividends paid to shareholders and common stock purchases. Cash provided by operating activities can fluctuate due to timing differences in the collection of premium receivables, reinsurance recoverables and surety collateral; the payment of losses, premium payables and return of surety collateral; and the completion of commutations.
53
Table of Contents
The components of our net operating cash flows are summarized in the following table.
| 2014 | 2013 | 2012 | ||||||||||
| Net earnings |
$ | 458,343 | $ | 407,197 | $ | 391,240 | ||||||
| Change in premium, claims and other receivables, net of reinsurance, |
(14,803 | ) | 22,737 | 2,498 | ||||||||
| Change in unearned premium, net |
53,638 | 16,168 | 4,082 | |||||||||
| Change in loss and loss adjustment expense payable, net of reinsurance recoverables |
(53,702 | ) | (78,026 | ) | 75,389 | |||||||
| Change in accounts payable and accrued liabilities |
(22,343 | ) | (120,859 | ) | 100,091 | |||||||
| Gain on investments |
(66,370 | ) | (42,030 | ) | (30,120 | ) | ||||||
| Other, net |
123,874 | 57,520 | 117,967 | |||||||||
|
|
|
|
|
|
|
|||||||
| Cash provided by operating activities |
$ | 478,637 | $ | 262,707 | $ | 661,147 | ||||||
|
|
|
|
|
|
|
|||||||
Our cash provided by operating activities was $478.6 million in 2014, compared to $262.7 million in 2013 and $661.1 million in 2012. Cash provided by operating activities includes collateral funds we receive or refund for our U.S. surety business, for which we record a liability within accounts payable and accrued liabilities. We refunded U.S. surety collateral of $20.3 million in 2014 and $121.7 million in 2013, compared to a net receipt of $96.6 million in 2012. In addition, we paid $132.6 million of income tax payments in 2014, compared to $181.5 million in 2013 and $107.9 million in 2012.
Other fluctuations in our cash provided by operating activities relate to the timing of the collection and the payment of insurance-related receivables and payables. In regards to Spanish surety bonds, we paid claims of $243.3 million and collected reinsurance of $186.2 million in 2014, compared to paying claims of $153.9 million and collecting no reinsurance in 2013 as most claims were paid in the fourth quarter. We paid minimal claims in 2012. The net impact of our payment of claims and collection of recoverables related to these bonds will continue to impact our cash provided by operating activities in future periods.
On January 2, 2015, we paid $104.5 million to acquire ProAg. This acquisition is expected to grow profitably over time once fully integrated. Due to the timing of settlements with the U.S. government, our operating cash flow in 2015 and 2016 will be reduced until settlement of our 2015 reinsurance year in October 2016.
Investments
At December 31, 2014, we held a $7.2 billion investment portfolio, which included $258.2 million of liquid short-term investments. Our fixed maturity and equity securities portfolios are classified as available for sale. We expect to hold our fixed maturity securities until maturity, but we would be able to sell these securities, as well as our equity securities, to generate cash if needed. The parent company held $838.4 million of cash and investments at December 31, 2014, which are available to cover the holding company’s required cash disbursements.
Revolving Loan Facility
We maintain an $825.0 million Revolving Loan Facility (Facility), of which $294.1 million of available capacity remained at December 31, 2014. During the past three years, we used the Facility primarily to fund repurchases of our common stock. We expect to continue to use the Facility to opportunistically repurchase stock in 2015. The Facility expires in April 2019. See Note 7, “Notes Payable” to the Consolidated Financial Statements for additional information related to the Facility and our long-term indebtedness.
54
Table of Contents
Subsidiary Dividends
HCC’s obligations include servicing outstanding debt and interest, paying dividends to shareholders, purchasing HCC’s common stock, and paying corporate expenses. The principal assets of HCC are the shares of capital stock of its insurance company subsidiaries. A significant percentage of HCC’s profit is earned in our insurance companies, which has generated available capital in these companies. As a result, HCC receives dividends paid by our insurance companies. HCC can utilize these dividends for any purpose, including paying down debt, paying dividends to shareholders, funding acquisitions, purchasing our common stock and paying operating expenses.
Our domestic and foreign insurance companies paid HCC dividends of $377.2 million in 2014, $317.5 million in 2013 and $262.4 million in 2012. The payment of dividends by our insurance companies is subject to regulatory restrictions and will depend on the surplus and future earnings of these subsidiaries. HCC’s direct U.S. insurance company subsidiaries can pay an aggregate of $235.2 million in dividends in 2015 without obtaining special permission from U.S. state regulatory authorities.
Share Purchases
On August 20, 2014, our Board of Directors authorized a new $500.0 million stock purchase plan (the Plan) and cancelled $130.9 million remaining under a previous authorization. Purchases under the Plan may be made in the open market or in privately negotiated transactions from time-to-time in compliance with applicable laws, rules and regulations, including Rule 10b-18 under the Securities Exchange Act of 1934, as amended. Purchases under the Plan will be made subject to market and business conditions, the level of cash generated from our operations, cash required for acquisitions, our debt covenant compliance and other relevant factors. The Plan does not obligate us to purchase any particular number of shares, has no expiration date and may be suspended or discontinued at any time at the Board’s discretion. At February 13, 2015,
$340.6 million of repurchase authority remains under the Plan.
Since our repurchase program began in 2008, we have purchased 30.0 million shares for $953.1 million, or $31.82 per share, through December 31, 2014. In the past three years, we purchased our common stock as follows:
| 2014 | 2013 | 2012 | ||||||||||
| Shares of common stock |
4,710 | 1,055 | 5,567 | |||||||||
| Total cost |
$ | 224,706 | $ | 42,212 | $ | 178,669 | ||||||
| Weighted-average cost per share |
$ | 47.70 | $ | 40.02 | $ | 32.09 | ||||||
Shelf Registration
We have a “Universal Shelf” registration statement that provides for the issuance of $1.0 billion of securities, which may be debt securities, equity securities, or a combination thereof. The Universal Shelf provides us the means to access the debt and equity markets relatively quickly, if we are satisfied with the current pricing in the financial markets. Our current shelf registration expires in March 2015; however, we expect to replace it with a similar shelf registration prior to expiration.
Claims Payments
We maintain sufficient liquidity from our current cash, short-term investments and investment maturities, in combination with future operating cash flow, to pay anticipated policyholder claims on their expected payment dates. Each of our insurance companies pays its own claims using its own operating cash flows, cash, short-term investments or investment maturities.
The average duration of claims in many of our lines of business is relatively short. However, we write D&O, E&O and casualty insurance, all of which have a longer claims duration than our other products. We consider these different claims payment patterns in determining the duration of our investment portfolio. The weighted-average duration of all claims was approximately 2.3 years, 2.1 years and 2.2 years at December 31, 2014, 2013 and 2012, respectively. The weighted-average duration of our fixed maturity securities was 4.7 years, 5.1 years and 4.7 years at the respective year-end. The longer duration of our fixed maturity securities reflects the effects of the investment of our capital.
55
Table of Contents
Contractual Obligations
The following table summarizes our total contractual cash payment obligations by estimated payment date at December 31, 2014.
| Estimated payment dates | ||||||||||||||||||||
| Total | 2015 | 2016-2017 | 2018-2019 | Thereafter | ||||||||||||||||
| Gross loss and loss adjustment expense payable (1): |
||||||||||||||||||||
| U.S. Property & Casualty |
$ | 703,653 | $ | 291,072 | $ | 274,790 | $ | 91,821 | $ | 45,970 | ||||||||||
| Professional Liability |
1,756,600 | 480,868 | 695,876 | 313,153 | 266,703 | |||||||||||||||
| Accident & Health |
301,688 | 300,262 | 1,426 | - | - | |||||||||||||||
| U.S. Surety & Credit |
127,470 | 72,467 | 47,276 | 4,464 | 3,263 | |||||||||||||||
| International |
643,062 | 305,039 | 204,801 | 64,356 | 68,866 | |||||||||||||||
| Exited Lines |
195,612 | 52,243 | 33,821 | 26,457 | 83,091 | |||||||||||||||
|
|
|
|
|
|
|
|
|
|
|
|||||||||||
| Total gross loss and loss adjustment expense payable |
3,728,085 | 1,501,951 | 1,257,990 | 500,251 | 467,893 | |||||||||||||||
| Life and annuity policy benefits |
48,499 | 1,923 | 3,617 | 3,333 | 39,626 | |||||||||||||||
| 6.30% Senior Notes (2) |
394,500 | 18,900 | 37,800 | 337,800 | - | |||||||||||||||
| $825.0 million Revolving Loan Facility (3) |
559,197 | 7,900 | 15,800 | 535,497 | - | |||||||||||||||
| ProAg acquisition (4) |
119,493 | 119,493 | - | - | - | |||||||||||||||
| Operating leases |
39,202 | 11,870 | 17,491 | 7,213 | 2,628 | |||||||||||||||
| Earnout liabilities (5) |
27,373 | 16,291 | 1,137 | - | 9,945 | |||||||||||||||
| Purchase obligations (6) |
4,465 | 2,571 | 1,891 | 3 | - | |||||||||||||||
|
|
|
|
|
|
|
|
|
|
|
|||||||||||
| Total obligations |
$ | 4,920,814 | $ | 1,680,899 | $ | 1,335,726 | $ | 1,384,097 | $ | 520,092 | ||||||||||
|
|
|
|
|
|
|
|
|
|
|
|||||||||||
In preparing the contractual obligations table, we made the following estimates and assumptions:
| (1) | The estimated loss and loss adjustment expense payments for future periods assume that the percentage of ultimate losses paid from one period to the next by line of business will be relatively consistent over time. Actual payments will be influenced by many factors and could vary from the estimated amounts. |
| (2) | The 6.30% Senior Notes are due in November 2019. We pay interest semi-annually on May 15 and November 15, which is included in the above table. |
| (3) | The $825.0 million Revolving Loan Facility expires in April 2019. In the above table, the outstanding borrowings of $525.0 million at December 31, 2014 are shown in 2019, with the annual interest of LIBOR plus 125 basis points on the outstanding balance and the annual commitment fee of 15 basis points on the unused balance shown in each applicable year. |
| (4) | Includes $15.0 million of acquisition costs payable to third parties. See Note 5, “Acquisitions and Goodwill” to the Consolidated Financial Statements for information related to this acquisition. |
| (5) | See Note 14, “Related Party Transactions” to the Consolidated Financial Statements for information related to our earnout liabilities. |
| (6) | Purchase obligations primarily relate to agreements with vendors to purchase maintenance and administrative services for our technology systems and to license software. |
56
Table of Contents
Impact of Inflation
Our operations, like those of other property and casualty insurers, are susceptible to the effects of inflation because premiums are established before the ultimate amounts of loss and loss adjustment expense are known.
Although we consider the potential effects of inflation when setting premium rates, our premiums, for competitive reasons, may not fully offset the effects of inflation. However, because the majority of our products have a relatively short period of time between the occurrence of an insured event, reporting of the claim to us and the final settlement of the claim, or have claims that are not significantly impacted by inflation, the effects of inflation are minimized.
A portion of our revenue is related to health care insurance and reinsurance products that are subject to the effects of the underlying inflation of health care costs. Such inflation in the costs of health care tends to generate increases in premiums for medical stop-loss coverage, resulting in greater revenue but also higher claims payments. Inflation also may have a negative impact on insurance and reinsurance operations by causing higher claims settlements than originally estimated, without an immediate increase in premiums to a level necessary to maintain profit margins. We do not specifically provide for inflation when setting underwriting terms and claims reserves, although we do consider market trends in our quarterly reserve reviews.
Inflation can also affect interest rates. A significant increase in interest rates could increase our net investment income related to newly invested cash flow and could also have a material adverse effect on the fair value of our investments. In addition, the interest rate payable under our Revolving Loan Facility fluctuates with market interest rates. See Item 7A., Quantitative and Qualitative Disclosures About Market Risk — Interest Rate Risk for additional disclosures about the impact of changes in market interest rates on our fixed maturity securities and Revolving Loan Facility.
Critical Accounting Policies
The preparation of our consolidated financial statements in conformity with accounting principles generally accepted in the United States of America (GAAP) requires us to make estimates and assumptions when applying our accounting policies. The following sections provide information about our estimation processes related to certain of our critical accounting policies.
Reserves
Our recorded reserves represent management’s best estimate of unpaid losses and loss adjustment expenses as of each quarter end, based on information, facts and circumstances known at that time. The process of establishing reserves is complex, imprecise and inherently uncertain and, as such, involves a considerable degree of judgment involving our management review and actuarial processes. We must consider many variables that are subject to the outcome of future events. As a result, an integral component of our loss reserving process is the use of informed subjective estimates and judgments about our ultimate exposure to losses. Therefore, it is possible that management’s estimate of the ultimate liability for losses may change.
Management considers many factors in determining the ultimate losses and reserves for the various products in our five insurance underwriting segments. These factors include: 1) actuarial point estimates and the estimated ranges around these estimates, 2) information used to price the applicable policies, 3) historical loss information, where available, 4) public industry data for the product or similar products, 5) an assessment of current market conditions, 6) information on individual claims, 7) an assessment of current or potential litigation involving claims and 8) information from underwriting and claims personnel. The estimate of our reserves is increased or decreased as more information becomes known about the frequency and severity of losses for prior and current years. We believe our reserve review process is effective, such that any required changes in reserves are recognized in the period of change as soon as the need for the change is evident.
57
Table of Contents
Our actuaries monitor the adequacy and reasonableness of our recorded reserves for over 100 specialty insurance products by accident year or underwriting year, as applicable. The table on page 60 details the characteristics for our major products in each segment. Although the duration (the time period between the occurrence of a loss and the settlement of a claim) is either short-term or medium-term for the majority of these products, approximately 53% of our total gross reserves at December 31, 2014 related to long-tail products in our U.S. Property & Casualty, Professional Liability and International segments and our Exited Lines. These long-tail products include primary and excess casualty, directors’ and officers’ liability, large account E&O liability, International accident and health, and assumed accident and health reinsurance business that we no longer write. We write many of these contracts as excess insurance, where losses in lower layers must develop first before our excess coverage attaches. Significant periods of time, ranging up to several years or more, may elapse between occurrence of the loss, reporting of the loss to us, and settlement of the claim. In addition, many of these claims are susceptible to litigation and can be affected by escalating legal defense costs, contract interpretations and the changing economic and legal environment. As a result, our long-tail products are subject to greater levels of reserve volatility, creating favorable or adverse loss development over a longer period of time.
Our actuaries perform a comprehensive review of loss reserves for each major product at least once each year. The reviews take into consideration the variety of trends that impact the ultimate settlement of claims for each product type. These reviews generally follow a pre-set schedule, which covers the product lines in each segment, as follows: 1) third quarter – U.S. Property & Casualty and Professional Liability and 2) fourth quarter – Accident & Health, U.S. Surety & Credit, International and Exited Lines. Management determines if additional or earlier comprehensive reviews are warranted based on significant unusual issues identified during the year. In addition to these comprehensive reviews, each quarter the actuaries review the emergence of paid and reported losses relative to expectations (established during the annual reviews) for all product lines and, if considered necessary, perform a more detailed review of the particular reserves.
Our actuaries’ loss review process relies on the basic assumption that past experience, adjusted for the effects of current developments and likely trends, is a reasonable basis for predicting future outcomes. As part of their process, our actuaries use a variety of actuarial methods that analyze experience, trends and other relevant factors. The principal standard actuarial methods used by our actuaries for their comprehensive reviews include:
| • | Loss ratio method – This method uses loss ratios for prior accident years, adjusted for current trends, to determine an appropriate expected loss ratio for a given accident year. |
| • | Loss development methods – Loss development methods assume that the losses yet to emerge for an accident year are proportional to the paid or reported loss amounts observed to-date. The paid loss development method uses losses paid to-date, while the reported loss development method uses losses reported to-date. |
| • | Bornheutter-Ferguson method – This method is a combination of the loss ratio and loss development methods, where the loss development factor is given more weight as an accident year matures. |
| • | Frequency/severity method – This method projects claim counts and average cost per claim on a paid or reported basis for high frequency, low severity products. |
Our actuaries calculate an actuarial point estimate, as well as a high and low end of the actuarial range, for the products that they review. The actuarial point estimates represent our actuaries’ estimate of the most likely amount that will ultimately be paid to settle the net reserves we have recorded at a particular point in time. While standard actuarial techniques are utilized in making these actuarial point estimates, these techniques require a high degree of judgment, and changing conditions can cause fluctuations in the reserve estimates. From an actuarial perspective, a point estimate is considered the most likely amount to be paid. However, there is inherent uncertainty in the point estimate because it is only one value in a distribution of possible reserve estimates. The actuarial ranges represent our actuaries’ estimate of a likely lowest amount and highest amount that will ultimately be paid to settle the net reserves. There is still a possibility of ultimately paying an amount below the range or above the range. The range determinations are based on estimates and actuarial judgments and are intended to encompass reasonably likely changes in one or more of the variables that were used to determine the point estimates.
58
Table of Contents
Management evaluates the adequacy of our recorded consolidated reserves at each reporting period and approves increases or decreases in reserves, as considered necessary, based on a consideration of all material facts and circumstances known at that time. The Reserve Review Committee (which includes our Chief Executive Officer, President, Chief Financial Officer, executive management, chief actuary, segment management and key actuarial, claims and accounting personnel) meets each quarter to review our actuaries’ comprehensive review of loss reserves and assessment of the emergence of paid and reported losses relative to expectations. The Reserve Review Committee discusses factors impacting the reserves in that quarter, including the most recent actuarial point and range estimates for each insurance segment, to monitor the adequacy and reasonableness of the recorded reserves. If the recorded reserves vary significantly from the actuarial point estimate, management discusses the reasons for the variances. As a result of discussions during this meeting, as well as any additional meetings, the Reserve Review Committee determines whether any recorded reserves should be increased or decreased during the quarter to an amount that, in management’s judgment, is adequate based on all of the facts and circumstances considered during the meetings, including the actuarial point estimates. Historically, our consolidated net reserves at each quarter-end, which reflect management’s best estimate of unpaid losses and loss adjustment expenses, have been above the total actuarial point estimate and within the actuarial range.
Any increase or decrease in prior years’ reserves approved by the Reserve Review Committee generates favorable or adverse loss development related to our ultimate losses, which is reflected in our incurred but not reported (IBNR) reserves in the period of the reserve change. In addition, we may have loss development due to the normal claims settlement process. For our most recent accident years, recorded loss reserves are generally based on management’s establishment of ultimate loss ratios for each product line, based on historical loss trends and current market considerations. We do not recognize favorable or adverse development for these recent accident years until loss trends emerge. The time required for credible loss trends to emerge differs based on the characteristics of the product, and with long-tail products this can take several years. Over time, our recorded reserves align closer to the actuarial indications as we place additional weight on the credibility of assumptions relating to actual experience and claims outstanding.
The following table shows our recorded net reserves by segment, as well as the actuarial reserve point estimates, and the high and low ends of the actuarial reserve range as determined by our reserving actuaries, as of December 31, 2014.
| Recorded | Actuarial | Low end of | High end of | |||||||||||||
| net reserves | point estimate | actuarial range | actuarial range | |||||||||||||
| Total net reserves |
$ | 2,657,622 | $ | 2,536,372 | $ | 2,282,871 | $ | 2,749,633 | ||||||||
|
|
|
|
|
|
|
|
|
|||||||||
| U.S. Property & Casualty |
$ | 440,125 | $ | 428,649 | $ | 395,575 | $ | 457,778 | ||||||||
| Professional Liability |
1,204,814 | 1,137,110 | 931,393 | 1,300,119 | ||||||||||||
| Accident & Health |
299,997 | 299,997 | 283,180 | 315,412 | ||||||||||||
| U.S. Surety & Credit |
105,154 | 94,825 | 84,009 | 104,448 | ||||||||||||
| International |
447,257 | 418,047 | 384,267 | 447,923 | ||||||||||||
| Exited Lines |
160,275 | 157,744 | 132,140 | 178,506 | ||||||||||||
|
|
|
|||||||||||||||
| Total net reserves |
$ | 2,657,622 | ||||||||||||||
|
|
|
|||||||||||||||
The excess of the total recorded net reserves over the actuarial point estimate was 4.6% of recorded net reserves at December 31, 2014, compared to 3.9% at December 31, 2013. The percentage will vary each year, in total and by segment, depending upon current economic events, the nature of the underlying products and their potential volatility, severity of claims reported in the current year, historical development patterns and management’s judgment about these factors.
The low end of the actuarial range and the high end of the actuarial range for our total net reserves will not equal the sum of the low and high ends of the actuarial ranges for our insurance segments due to the estimated effect of diversification across the products in each segment. Some of the products in our segments may be more effectively modeled by a statistical distribution that is skewed or non-symmetric, which causes the midpoint of the range to be above the actuarial point estimate or mean value of the range. Our actuarial assumptions, estimates and judgments can change based on new information and changes in conditions, and, if they change, it will affect the determination of the range amounts.
59
Table of Contents
The following table details the characteristics and key assumptions used in the determination of the actuarial point estimates and ranges for our major products in each segment. We considered all lines of business written by the insurance industry when determining the relative characteristics of claims duration, speed of claim reporting and reserve volatility. Other companies may classify their own insurance products in different segments or utilize different actuarial assumptions. Major actuarial assumptions used include historical loss payment and reporting patterns, estimates for rate changes by product line, trends impacting losses, and the effects of large losses.
| Line of business |
Products |
Underwriting | Duration | Speed of claim reporting |
Reserve volatility | |||||
| U.S. Property & Casualty | Aviation | Direct and subscription | Medium | Fast | Medium | |||||
| Casualty | Direct | Long | Moderate | High | ||||||
| E&O liability | Direct | Medium | Moderate | Medium | ||||||
| Other liability | Direct and assumed | Medium | Moderate | Medium | ||||||
| Property | Direct and assumed | Short | Fast | Low | ||||||
| Professional Liability | D&O liability | Direct and subscription | Medium to long | Moderate | Medium to high | |||||
| E&O liability | Direct | Medium | Moderate | Medium | ||||||
| Accident & Health | Medical stop-loss | Direct | Short | Fast | Low | |||||
| Other medical | Direct | Short | Fast | Low | ||||||
| U.S. Surety & Credit | Surety | Direct | Medium | Fast | Low | |||||
| Credit | Direct | Medium | Fast | Low | ||||||
| International | Energy | Subscription | Medium | Moderate | Medium | |||||
| Marine | Subscription | Medium | Moderate | Medium | ||||||
| Property treaty | Assumed | Short | Fast | Medium | ||||||
| Surety & credit | Direct | Medium | Fast | Medium | ||||||
| E&O liability | Direct | Medium | Moderate | Medium | ||||||
| Other liability | Direct and assumed | Medium | Moderate | Medium to high | ||||||
| Property | Subscription | Short | Fast | Low | ||||||
| Accident & health | Direct and assumed | Medium to long | Moderate | Medium to high | ||||||
| Exited Lines | Accident & health | Assumed | Long | Slow | High | |||||
| Medical malpractice | Direct | Medium to long | Moderate | Medium to high | ||||||
| Other medical | Assumed | Short | Fast | Medium | ||||||
Direct insurance is coverage that is originated by our insurance companies and brokers in return for premium. Assumed reinsurance is coverage written by another insurance company, for which we assume all or a portion of the risk in exchange for all or a portion of the premium. Assumed reinsurance represented 10% and 12% of our gross written premium in 2014 and 2013, and 13% of our gross reserves ($483.1 million of $3.7 billion) at December 31, 2014, unchanged from 13% at December 31, 2013. Subscription business is direct insurance or assumed reinsurance where we only take a percentage of the total risk and premium and other insurers take their proportionate percentage of the remaining risk and premium.
The property treaty reinsurance business written in our International segment covers catastrophic risks worldwide. Our internal staff underwrites the business, which is placed by major brokers. Given the nature and size of these large losses, the brokers report these claims to us quickly. We establish loss reserves ($95.0 million at December 31, 2014) for this assumed reinsurance using a combination of our internal models, external sources that independently model catastrophic losses and estimates provided by our insureds.
60
Table of Contents
We assume facultative reinsurance business in our U.S. Property & Casualty, Professional Liability and International segments. This business includes reinsurance of a company’s captive insurance program or business that must be written through another insurance company licensed to write insurance in a particular country or locality. We establish loss reserves ($234.9 million at December 31, 2014) for this assumed reinsurance using the same methods and assumptions we use to set reserves for comparable direct business. Disputes, if any, generally relate to claims or coverage issues with insureds and are administered in the normal course of business.
Our Exited Lines include reserves for run-off assumed accident and health reinsurance business ($139.8 million at December 31, 2014), which is primarily reinsurance that provides excess coverage for large losses related to workers’ compensation policies. This business is slow to develop and may take more than twenty years to pay out. Losses in lower layers must develop first before our excess coverage attaches. This business is subject to late reporting of claims by cedants and state guaranty associations. To mitigate our exposure to unexpected losses reported by cedants, our claims personnel review reported losses to ensure they are reasonable and consistent with our expectations. In addition, our claims personnel periodically audit the cedants’ operations to assess whether cedants are submitting timely and accurate claims reports to us. Disputes with cedants related to claims or coverage issues are negotiated to resolution or settled through arbitration. We have commuted a portion of these reserves over the past ten years to reduce our exposure to adverse development. Based on the higher risk of the underlying insurance product and the potential for late reported claims, management believes there may be greater volatility in loss development for this product than for our other product lines.
The case reserves for reported losses related to our direct business and certain assumed reinsurance are initially set by our claims personnel or independent claims adjusters we retain. The case reserves are subject to our review, with a goal of setting them at the ultimate expected loss amount as soon as possible when the information becomes available. Case reserves for reported losses related to other assumed reinsurance are recorded based on information supplied to us by the ceding company. Our claims personnel monitor these assumed reinsurance reserves on a current basis and audit ceding companies’ claims to ascertain that claims are being recorded currently and that net reserves are being set at levels that properly reflect the liability related to the claims.
We determine our IBNR reserves by subtracting case reserves from our total estimated loss reserves, which are based on the ultimate expected losses for each product. The level of IBNR reserves in relation to total reserves depends upon the characteristics of the specific products within each segment, particularly related to the speed with which losses are reported and outstanding claims are paid. Segments that contain products for which losses are reported moderately or slowly will have a higher percentage of IBNR reserves than segments with products that report and settle claims more quickly.
Based on our reserving techniques, estimation processes and past results, we believe that our net reserves are adequate.
61
Table of Contents
The following tables show the composition of our gross, ceded and net reserves by segment at December 31, 2014 and 2013.
| December 31, 2014 |
Gross | Ceded | Net | % net IBNR to net total reserves |
||||||||||||
| Case reserves: |
||||||||||||||||
| U.S. Property & Casualty |
$ | 271,595 | $ | 87,547 | $ | 184,048 | ||||||||||
| Professional Liability |
758,449 | 218,841 | 539,608 | |||||||||||||
| Accident & Health |
285,421 | 781 | 284,640 | |||||||||||||
| U.S. Surety & Credit |
32,071 | 4,782 | 27,289 | |||||||||||||
| International |
333,617 | 100,163 | 233,454 | |||||||||||||
| Exited Lines |
130,805 | 30,945 | 99,860 | |||||||||||||
|
|
|
|
|
|
|
|||||||||||
| Total case reserves |
1,811,958 | 443,059 | 1,368,899 | |||||||||||||
|
|
|
|
|
|
|
|||||||||||
| IBNR reserves: |
||||||||||||||||
| U.S. Property & Casualty |
432,058 | 175,981 | 256,077 | 58 | % | |||||||||||
| Professional Liability |
998,151 | 332,945 | 665,206 | 55 | ||||||||||||
| Accident & Health |
16,267 | 910 | 15,357 | 5 | ||||||||||||
| U.S. Surety & Credit |
95,399 | 17,534 | 77,865 | 74 | ||||||||||||
| International |
309,445 | 95,642 | 213,803 | 48 | ||||||||||||
| Exited Lines |
64,807 | 4,392 | 60,415 | 38 | ||||||||||||
|
|
|
|
|
|
|
|||||||||||
| Total IBNR reserves |
1,916,127 | 627,404 | 1,288,723 | 48 | % | |||||||||||
|
|
|
|
|
|
|
|||||||||||
| Total loss and loss adjustment expense payable |
$ | 3,728,085 | $ | 1,070,463 | $ | 2,657,622 | ||||||||||
|
|
|
|
|
|
|
|||||||||||
| December 31, 2013 |
||||||||||||||||
| Case reserves: |
||||||||||||||||
| U.S. Property & Casualty |
$ | 278,414 | $ | 88,712 | $ | 189,702 | ||||||||||
| Professional Liability |
794,080 | 226,938 | 567,142 | |||||||||||||
| Accident & Health |
206,435 | 28 | 206,407 | |||||||||||||
| U.S. Surety & Credit |
26,508 | 6,735 | 19,773 | |||||||||||||
| International |
368,779 | 102,120 | 266,659 | |||||||||||||
| Exited Lines |
157,525 | 34,601 | 122,924 | |||||||||||||
|
|
|
|
|
|
|
|||||||||||
| Total case reserves |
1,831,741 | 459,134 | 1,372,607 | |||||||||||||
|
|
|
|
|
|
|
|||||||||||
| IBNR reserves: |
||||||||||||||||
| U.S. Property & Casualty |
387,457 | 129,696 | 257,761 | 58 | % | |||||||||||
| Professional Liability |
995,033 | 326,737 | 668,296 | 54 | ||||||||||||
| Accident & Health |
51,667 | (27 | ) | 51,694 | 20 | |||||||||||
| U.S. Surety & Credit |
86,408 | 6,672 | 79,736 | 80 | ||||||||||||
| International |
484,932 | 195,330 | 289,602 | 52 | ||||||||||||
| Exited Lines |
64,894 | 5,189 | 59,705 | 33 | ||||||||||||
|
|
|
|
|
|
|
|||||||||||
| Total IBNR reserves |
2,070,391 | 663,597 | 1,406,794 | 51 | % | |||||||||||
|
|
|
|
|
|
|
|||||||||||
| Total loss and loss adjustment expense payable |
$ | 3,902,132 | $ | 1,122,731 | $ | 2,779,401 | ||||||||||
|
|
|
|
|
|
|
|||||||||||
62
Table of Contents
Reinsurance Recoverables
We retain underwriting risk in order to retain a greater proportion of expected underwriting profits. Annually, we analyze our threshold for risk in each line of business and on an overall consolidated basis, based on a number of factors, including market conditions, pricing, competition and the inherent risks associated with each business type, and then we structure our reinsurance programs. We generally purchase reinsurance to reduce our net liability on individual risks and to protect against catastrophe losses and volatility. We have chosen not to purchase any reinsurance on businesses where volatility or catastrophe risks are considered remote and limits are within our risk tolerance.
We purchase reinsurance on a proportional basis to cover loss frequency, individual risk severity and catastrophe exposure. Some of the proportional reinsurance agreements may have maximum loss limits, most of which are greater than or equal to a 200% loss ratio. We also purchase reinsurance on an excess of loss basis to cover individual risk severity and catastrophe exposure. Additionally, we may obtain facultative reinsurance protection on a single risk. The type and amount of reinsurance we purchase varies year to year based on our risk assessment, our desired retention levels based on profitability and other considerations, and on the market availability of quality reinsurance at prices we consider acceptable. Our reinsurance programs renew throughout the year, and the price changes in recent years have not been material to our net underwriting results. Our reinsurance generally does not cover war or terrorism risks.
In our proportional reinsurance programs, we generally receive a commission on the premium ceded to reinsurers. This compensates our insurance companies for the direct costs associated with production of the business, the servicing of the business during the term of the policies ceded, and the costs associated with placement of the related reinsurance. In addition, certain of our reinsurance treaties allow us to share in any net profits generated under such treaties with the reinsurers. Various reinsurance brokers arrange for the placement of this reinsurance coverage on our behalf and are compensated, directly or indirectly, by the reinsurers.
Our reinsurance recoverables represented 30% and 35% of our shareholders’ equity at December 31, 2014 and 2013, respectively. A high percentage of our reinsurance recoverables relates to our D&O business, where it takes longer for claims reserves to result in paid claims. At year-end 2014, $107.7 million of our recoverables related to Spanish surety bonds.
In order to reduce our exposure to reinsurance credit risk, we evaluate the financial condition of our reinsurers and place our reinsurance with a diverse group of companies and syndicates, which we believe to be financially sound. Our Reinsurance Security Policy Committee carefully monitors the credit quality of our reinsurers when we place new and renewal reinsurance, as well as on an ongoing basis. The Reinsurance Security Policy Committee considers each current or potential reinsurer’s surplus or capacity level, financial strength ratings, operational criteria and other relevant information.
We continuously monitor our financial exposure to the reinsurance market and take necessary actions in an attempt to mitigate our exposure to possible credit loss. We monitor reinsurance recoverables to ensure diversification of credit risk by reinsurer. We limit our liquidity exposure for uncollected recoverables by holding funds in trust, letters of credit or other security, such that net balances due from reinsurers are significantly less than the gross balances shown in our consolidated balance sheets. We constantly monitor the collectibility of our reinsurance recoverables and record a reserve for uncollectible reinsurance when we determine an amount is potentially uncollectible. Our evaluation is based on our periodic reviews of our disputed and aged recoverables, as well as our assessment of recoverables due from reinsurers known to be in financial difficulty. In some cases, we make estimates as to what portion of a recoverable may be uncollectible. Our estimates and judgment about the collectibility of the recoverables and the financial condition of reinsurers can change, and these changes can affect the level of reserve required.
We maintain a reserve for potential collectibility issues, including disputed amounts and associated expenses. We review the level and adequacy of our reserve at each quarter-end based on recoverable balances that are past due or in dispute. The reserve was $1.5 million at both December 31, 2014 and 2013. See Note 4, “Reinsurance” to the Consolidated Financial Statements for additional information about recoverables related to Spanish surety bonds that are currently in dispute. While we believe the year-end reserve is adequate based on information currently available, market conditions may change or additional information might be obtained that may require us to change the reserve in the future.
63
Table of Contents
Deferred Taxes
We recognize deferred tax assets and liabilities based on the differences between the financial statement carrying amounts and the tax bases of assets and liabilities. We regularly review our deferred tax assets for recoverability, taking into consideration our history of earnings, expectations for future earnings, taxable income in carryback years and the expected timing of the reversals of existing temporary differences. When we believe it is more likely than not that a deferred tax asset will not be realized, we establish a valuation allowance for that deferred tax asset. Although realization is not assured, we believe that, as of December 31, 2014, it is more likely than not that we will be able to realize the benefit of recorded deferred tax assets, with the exception of certain tax loss carryforwards for which valuation allowances have been provided. If there is a material change in the tax laws such that the actual effective tax rate changes or the time periods within which the underlying temporary differences become taxable or deductible change, we will reevaluate our assumptions, which could result in a change in the valuation allowance required.
Valuation of Goodwill
Goodwill is impaired when the fair value of a reporting unit is less than its carrying amount. We assess our goodwill for impairment annually, or sooner if an event occurs or circumstances change that would more likely than not reduce the fair value of a reporting unit below its carrying amount. We conducted our annual goodwill impairment test as of June 30, 2014, which is consistent with the timeframe for our annual assessment in prior years. In 2014, we elected to perform a qualitative assessment for each of our five reporting units to determine whether further impairment testing would be necessary. We considered general economic conditions, industry and market conditions, our financial performance, key events and circumstances that could affect fair value using the income and market approaches, and additional factors such as significant changes in reporting unit management and regulatory factors. Based on our assessment, we determined that it is more likely than not that the fair value of each of our five reporting units exceeded its carrying amount as of June 30, 2014. In addition, we had no indicators of impairment at December 31, 2014.
In years where we assess goodwill for impairment by determining the fair value of each reporting unit, we consider three valuation approaches (market, income and cost) to determine the fair value of each reporting unit. We utilize the income and market valuation approaches and base our assumptions and inputs on market participant data, as well as our own data. For the income approach, we estimate the present value of each reporting unit’s expected cash flows to determine the fair value. We utilize estimated future cash flows of the portfolio of products included in each reporting unit, as well as a risk-appropriate rate of return specific to each reporting unit. We utilize our budgets and projection of future operations based on historical and expected industry trends to estimate our future cash flows and their probability of occurring as projected. We also determine fair value of each reporting unit based on market participant data, and use those results to test the reasonableness and validity of the income approach results.
Recent Accounting Guidance
See Note 1, “General Information and Significant Accounting and Reporting Policies — Recent Accounting Guidance” to the Consolidated Financial Statements for a description of recently issued accounting guidance that will impact our consolidated financial statements in future periods.
Item 7A. Quantitative and Qualitative Disclosures About Market Risk
Our principal assets and liabilities are financial instruments that are subject to the market risk of potential losses from adverse changes in market rates and prices. Our primary market risk exposures are interest rate risk on fixed maturity securities and variable rate debt, price risk on equity securities and foreign currency exchange rate risk.
64
Table of Contents
Interest Rate Risk
Substantially all of our insurance policies are short-duration contracts. To manage the exposures of our investment risks, we generally invest in investment grade securities with duration and liquidity characteristics that reflect the short-term nature of our insurance liabilities. We have not used derivatives to manage any of our investment-related market risks. The value of our portfolio of fixed maturity securities is inversely correlated to changes in the market interest rates. Some of our fixed maturity securities have call or prepayment options, which could subject us to reinvestment risk should interest rates fall or issuers call their securities and we reinvest the proceeds at lower interest rates. We attempt to mitigate prepayment risk by investing in securities with varied maturity dates, so that only a portion of the portfolio will mature, call or prepay at any point in time. Fluctuations in interest rates have a minimal effect on the value of our short-term investments due to their very short maturities and on equity securities that have no maturity date.
The fair value of our fixed maturity securities was $6.6 billion at December 31, 2014, compared to $6.0 billion at December 31, 2013. If market interest rates were to change 100 basis points, the fair value of our fixed maturity securities would have changed approximately $311.0 million at December 31, 2014. This compares to a change in fair value of approximately $307.0 million at December 31, 2013 for the same 100 basis points change in market interest rates. The change in fair value was determined using duration modeling assuming no prepayments.
Our 6.30% Senior Notes are not subject to interest rate changes. Our $825.0 million Revolving Loan Facility is subject to variable interest rates. At December 31, 2014, we had outstanding borrowings of $525.0 million under the Facility. If average interest rates increased 100 basis points during 2015, as compared to 2014, our projected 2015 interest expense would increase approximately $5.3 million. If average interest rates had increased 100 basis points during 2014, as compared to 2013, our 2014 interest expense would have increased approximately $3.6 million.
Price Risk on Equity Securities
Our portfolio of marketable equity securities is subject to price risk due to market changes. The fair value of our equity securities was $296.4 million at December 31, 2014, compared to $517.5 million at December 31, 2013. If the market price of our equity securities had changed 10%, the fair value of our equity portfolio would have changed approximately $29.6 million at December 31, 2014 and approximately $51.7 million at December 31, 2013.
Foreign Exchange Risk
We utilize the British pound sterling and the Euro as the functional currency in certain of our foreign operations. The table below (in thousands) shows the net assets of these subsidiaries grouped by functional currency and converted to U.S. dollars at December 31, 2014 and 2013. It also shows the expected dollar change in net assets that would occur if exchange rates changed 10% from exchange rates in effect at those times.
| December 31, | ||||||||||||||||
| 2014 | 2013 | |||||||||||||||
| Hypothetical | Hypothetical | |||||||||||||||
| U.S. dollar | 10% change | U.S. dollar | 10% change | |||||||||||||
| equivalent | in fair value | equivalent | in fair value | |||||||||||||
| Euro |
$ | 65,708 | $ | 6,571 | $ | 74,044 | $ | 7,404 | ||||||||
| British pound sterling |
35,202 | 3,520 | 37,337 | 3,734 | ||||||||||||
65
Table of Contents
The table below (in thousands) shows, for subsidiaries with a U.S. dollar functional currency, the net amount of significant foreign currency balances converted to U.S. dollars at December 31, 2014 and 2013, most of which relate to our available for sale equity securities. It also shows the expected dollar change in fair value that would occur if exchange rates changed 10% from exchange rates in effect at those times.
| December 31, | ||||||||||||||||
| 2014 | 2013 | |||||||||||||||
| Hypothetical | Hypothetical | |||||||||||||||
| U.S. dollar | 10% change | U.S. dollar | 10% change | |||||||||||||
| equivalent | in fair value | equivalent | in fair value | |||||||||||||
| Japanese yen |
$ | 37,392 | $ | 3,739 | $ | 27,886 | $ | 2,789 | ||||||||
| Canadian dollar |
25,447 | 2,545 | 31,021 | 3,102 | ||||||||||||
| Swiss franc |
13,264 | 1,326 | 45,886 | 4,589 | ||||||||||||
| Euro |
13,250 | 1,325 | 87,581 | 8,758 | ||||||||||||
| British pound sterling |
1,725 | 173 | 86,635 | 8,664 | ||||||||||||
Item 8. Financial Statements and Supplementary Data
The financial statements and supplementary financial information listed in the accompanying Index to Consolidated Financial Statements and Schedules are incorporated herein as part of this Report.
Item 9. Changes in and Disagreements with Accountants on Accounting and Financial Disclosure
None.
Item 9A. Controls and Procedures
Evaluation of Disclosure Controls and Procedures
We maintain disclosure controls and procedures (as defined in Rules 13a-15(e) and 15d-15(e) under the Securities Exchange Act of 1934, as amended (the Act)) that are designed to ensure that required information is recorded, processed, summarized and reported within the required timeframe, as specified in rules set forth by the Securities and Exchange Commission. Our disclosure controls and procedures are also designed to ensure that information required to be disclosed is accumulated and communicated to management, including our Chief Executive Officer (CEO) and Chief Financial Officer (CFO), to allow timely decisions regarding required disclosures.
Our management, with the participation of our CEO and CFO, evaluated the effectiveness of the design and operation of our disclosure controls and procedures as of December 31, 2014 using criteria established in the Internal Control — Integrated Framework (2013) issued by the Committee of Sponsoring Organizations of the Treadway Commission (COSO). Based on this evaluation, our CEO and CFO concluded that our disclosure controls and procedures were effective in providing reasonable assurance of achieving the purposes described in Rule 13a-15(e) under the Act as of December 31, 2014.
66
Table of Contents
Management’s Report on Internal Control Over Financial Reporting
Our management is responsible for establishing and maintaining adequate internal control over financial reporting as defined in Rules 13a-15(f) and 15d-15(f) under the Act. Internal control over financial reporting is a process designed to provide reasonable assurance regarding the reliability of financial reporting and the preparation of financial statements for external purposes in accordance with accounting principles generally accepted in the United States of America (GAAP). Internal control over financial reporting includes those policies and procedures that: 1) pertain to the maintenance of our records that, in reasonable detail, accurately and fairly reflect our transactions and dispositions of our assets, 2) provide reasonable assurance that we have recorded transactions as necessary to permit us to prepare consolidated financial statements in accordance with GAAP, and that receipts and expenditures are being made only in accordance with authorizations of our management and Board of Directors and 3) provide reasonable assurance regarding prevention or timely detection of unauthorized acquisition, use or disposition of our assets that could have a material effect on our consolidated financial statements.
Internal control over financial reporting cannot provide absolute assurance of achieving financial reporting objectives because of its inherent limitations. Internal control over financial reporting is a process that involves human diligence and compliance and is subject to lapses in judgment and breakdowns resulting from human failures. Internal control over financial reporting also can be circumvented by collusion or improper management override. Because of such limitations, there is a risk that material misstatements may not be prevented or detected on a timely basis by internal control over financial reporting. However, these inherent limitations are known features of the financial reporting process. Therefore, it is possible to design into the process safeguards to reduce, though not eliminate, this risk.
Management, including our CEO and CFO, conducted an assessment of the effectiveness of our internal control over financial reporting as of December 31, 2014 based on criteria established in the Internal Control — Integrated Framework (2013) issued by COSO.
Based on the results of this assessment, management concluded that our internal control over financial reporting was effective as of December 31, 2014 and that the consolidated financial statements included in this Report present fairly, in all material respects, our financial position, results of operations and cash flows for the years presented in accordance with GAAP.
The effectiveness of our internal control over financial reporting as of December 31, 2014 has been audited by PricewaterhouseCoopers LLP, an independent registered public accounting firm, as stated in their report, which is included in Item 15 of this Report.
Changes in Internal Control Over Financial Reporting
There were no changes in our internal control over financial reporting that occurred during the quarter ended December 31, 2014 that have materially affected, or are reasonably likely to materially affect, our internal control over financial reporting.
None.
67
Table of Contents
Item 10. Directors, Executive Officers and Corporate Governance
Code of Business Conduct and Ethics
We have adopted a Code of Business Conduct and Ethics that applies to all employees, officers and directors of our company. The complete text of our Code of Business Conduct and Ethics is available on our website at www.hcc.com and will be provided to any person free of charge upon request made to: HCC Insurance Holdings, Inc., Investor Relations Department, 13403 Northwest Freeway, Houston, Texas 77040. Any amendments to, or waivers of, the Code of Business Conduct and Ethics that apply to the Chief Executive Officer and the Senior Financial Officers will be disclosed on our website.
The information regarding our Executive Officers required by Item 401 of Regulation S-K is incorporated by reference to the “Executive Officers” section in Item 1., Business of this Report.
The other information regarding our Directors, Executive Officers and Corporate Governance required by this Item 10 is incorporated by reference to the sections “Corporate Governance” and “Section 16(a) Beneficial Ownership Reporting Compliance” in our definitive proxy statement for our Annual Meeting of Shareholders to be filed with the Securities and Exchange Commission within 120 days after December 31, 2014.
Item 11. Executive Compensation
The information regarding Executive Compensation required by this Item 11 is incorporated by reference to the sections “2014 Director Compensation Table,” “Corporate Governance – Committees of the Board – Compensation Committee – Compensation Committee Interlocks and Insider Participation,” and “Executive Compensation” in our definitive proxy statement for our Annual Meeting of Shareholders to be filed with the Securities and Exchange Commission within 120 days after December 31, 2014.
Item 12. Security Ownership of Certain Beneficial Owners and Management and Related Stockholder Matters
Equity Compensation Plan Information
The following table sets forth information as of December 31, 2014, with respect to compensation plans under which our equity securities are authorized for issuance. All such plans were approved by our shareholders.
| Weighted- | Number of securities | |||||
| average | remaining available | |||||
| Number of securities | exercise price of | for future issuance | ||||
| to be issued upon | outstanding | under equity | ||||
| exercise of | options, | compensation plans | ||||
| outstanding options, | warrants and | (excluding securities | ||||
| warrants and rights | rights | reflected in column (a)) | ||||
| Plan category |
(a) | (b) | (c) | |||
| Equity compensation plans approved by shareholders |
941,334 | $31.61 | 4,665,429 | |||
| (1) | The total in column (a) includes 139,334 restricted stock units issued under our equity incentive plan. These restricted stock units are not included in the calculation of weighted-average exercise price in column (b). |
| (2) | The total in column (c) includes 52,610 shares subject to purchase in the current offering period and 1,855,789 shares available for purchase in future offering periods under our 2013 Employee Stock Purchase Plan. |
68
Table of Contents
The other information regarding Security Ownership of Certain Beneficial Owners and Management and Related Stockholder Matters required by this Item 12 is incorporated by reference to the section “Stock Ownership Information” in our definitive proxy statement for our Annual Meeting of Shareholders to be filed with the Securities and Exchange Commission within 120 days after December 31, 2014.
Item 13. Certain Relationships and Related Transactions, and Director Independence
The information regarding Certain Relationships and Related Transactions, and Director Independence required by this Item 13 is incorporated by reference to the section “Certain Relationships and Related Party Transactions” in our definitive proxy statement for our Annual Meeting of Shareholders to be filed with the Securities and Exchange Commission within 120 days after December 31, 2014.
Item 14. Principal Accountant Fees and Services
The information regarding Principal Accountant Fees and Services required by this Item 14 is incorporated by reference to the sections “Corporate Governance” and “Proposal 3 – Ratification of Our Independent Registered Public Accounting Firm for 2015” in our definitive proxy statement for our Annual Meeting of Shareholders to be filed with the Securities and Exchange Commission within 120 days after December 31, 2014.
Item 15. Exhibits and Financial Statement Schedules
(a) Financial Statement Schedules
The financial statements and supplementary financial information listed in the accompanying Index to Consolidated Financial Statements and Schedules are filed as part of this Report.
(b) Exhibits
The exhibits listed in the accompanying Index to Exhibits on page 71 are filed as part of this Report.
69
Table of Contents
Pursuant to the requirements of Section 13 or 15(d) of the Securities Exchange Act of 1934, the Registrant has duly caused this Report to be signed on its behalf by the undersigned, thereunto duly authorized.
| HCC INSURANCE HOLDINGS, INC. (Registrant) | ||||||
| Dated: February 27, 2015 | By: | /s/ Christopher J.B. Williams | ||||
| (Christopher J.B. Williams) | ||||||
| Chief Executive Officer | ||||||
Pursuant to the requirements of the Securities Exchange Act of 1934, this Report has been signed below by the following persons on behalf of the Registrant and in the capacities and on the dates indicated.
| Name |
Title |
Date | ||
| /s/ CHRISTOPHER J.B. WILLIAMS |
Director, Chief Executive Officer | February 27, 2015 | ||
|
|
||||
| (Christopher J.B. Williams) |
(Principal Executive Officer) | |||
| /s/ EMMANUEL T. BALLASES* |
Director | February 27, 2015 | ||
|
|
||||
| (Emmanuel T. Ballases) |
||||
| /s/ FRANK J. BRAMANTI* |
Director | February 27, 2015 | ||
|
|
||||
| (Frank J. Bramanti) |
||||
|
/s/ WALTER M. DUER* |
Director | February 27, 2015 | ||
|
|
||||
| (Walter M. Duer) |
||||
| /s/ JAMES C. FLAGG, PH.D.* |
Director | February 27, 2015 | ||
|
|
||||
| (James C. Flagg, Ph.D.) |
||||
| /s/ THOMAS M. HAMILTON* |
Director | February 27, 2015 | ||
|
|
||||
| (Thomas M. Hamilton) |
||||
| /s/ BRAD T. IRICK |
Executive Vice President | February 27, 2015 | ||
|
|
||||
| (Brad T. Irick) |
and Chief Financial Officer | |||
| /s/ JOHN N. MOLBECK, JR.* |
Director | February 27, 2015 | ||
|
|
||||
| (John N. Molbeck, Jr.) |
||||
| /s/ SUSAN RIVERA* |
Director | February 27, 2015 | ||
|
|
||||
| (Susan Rivera) |
||||
| /s/ HANS D. ROHLF* |
Director | February 27, 2015 | ||
|
|
||||
| (Hans D. Rohlf) |
||||
| /s/ ROBERT A. ROSHOLT* |
Director and Chairman of the Board | February 27, 2015 | ||
|
|
||||
| (Robert A. Rosholt) |
||||
| /s/ J. MIKESELL THOMAS* |
Director | February 27, 2015 | ||
|
|
||||
| (J. Mikesell Thomas) |
||||
| /s/ PAMELA J. PENNY |
Executive Vice President | February 27, 2015 | ||
|
|
||||
| (Pamela J. Penny) |
and Chief Accounting Officer | |||
| *By: | /s/ PAMELA J. PENNY | |
| Pamela J. Penny Attorney-in-fact |
70
Table of Contents
INDEX TO EXHIBITS
|
Exhibit |
||||||
| 2.1 | — | Stock Purchase Agreement, dated September 29, 2014, by and among CMFG Life Insurance Company, CUNA Mutual Investment Corporation and HCC Insurance Holdings, Inc. (incorporated by reference to Exhibit 2.1 to Current Report on Form 8-K filed on September 30, 2014). | ||||
| 3.1 | — | Restated Certificate of Incorporation and Amendment of Certificate of Incorporation of HCC Insurance Holdings, Inc., filed with Delaware Secretary of State on July 23, 1996 and May 21, 1998, respectively (incorporated by reference to Exhibit 4.1 to Registration Statement on Form S-8 (Registration No. 333-61687) filed on August 17, 1998). | ||||
| 3.2 | — | Fourth Amended and Restated Bylaws of HCC Insurance Holdings, Inc. (incorporated by reference to Exhibit 3.1 to Current Report on Form 8-K filed on August 22, 2013). | ||||
| 4.1 | — | Specimen of Common Stock Certificate, $1.00 par value, of HCC Insurance Holdings, Inc. (incorporated by reference to Exhibit 4.1 to Registration Statement on Form S-1 (Registration No. 33-48737) filed on October 27, 1992). | ||||
| 4.2 | — | Indenture, dated August 23, 2001, between HCC Insurance Holdings, Inc. and First Union National Bank related to Debt Securities (Senior Debt) (incorporated by reference to Exhibit 4.1 to Current Report on Form 8-K filed on August 24, 2001). | ||||
| 4.3 | — | Form of Fourth Supplemental Indenture, dated November 16, 2009, between HCC Insurance Holdings, Inc. and U.S. Bank National Association related to 6.30% Senior Notes due 2019 (incorporated by reference to Exhibit 4.2 to Current Report on Form 8-K filed on November 13, 2009). | ||||
| 10.1 | — | Loan Agreement, dated March 8, 2011, among HCC Insurance Holdings, Inc., Wells Fargo Bank, National Association, as Administrative Agent, Barclays Bank PLC and Bank of America, N.A., as Co-Syndication Agents, JPMorgan Chase Bank, N.A. and The Royal Bank of Scotland PLC, as Co-Documentation Agents, and other lenders party thereto (incorporated by reference to Exhibit 10.1 to Current Report on Form 8-K filed on March 8, 2011). | ||||
| 10.2 | — | First Amendment to Loan Agreement, dated September 22, 2011, among HCC Insurance Holdings, Inc., Wells Fargo Bank, National Association, as Administrative Agent, Barclays Bank PLC and Bank of America, N.A., as Co-Syndication Agents, JPMorgan Chase Bank, N.A. and The Royal Bank of Scotland PLC, as Co-Documentation Agents, and the other lenders party thereto (incorporated by reference to Exhibit 10.1 to Current Report on Form 8-K filed on September 28, 2011). | ||||
| 10.3 | — | Second Amendment to Loan Agreement, dated April 26, 2013, among HCC Insurance Holdings, Inc., Wells Fargo Bank, National Association, as Administrative Agent, Barclays Bank PLC and Bank of America, N.A., as Co-Syndication Agents, JPMorgan Chase Bank, N.A. and The Royal Bank of Scotland PLC, as Co-Documentation Agents, and the other lenders party thereto (incorporated by reference to Exhibit 10.1 to Current Report on Form 8-K filed on April 30, 2013). | ||||
| 10.4 | — | Third Amendment to Loan Agreement, dated April 30, 2014, among HCC Insurance Holdings, Inc., Wells Fargo Bank, National Association, as Administrative Agent, Barclays Bank PLC and KeyBank National Association, as Co-Syndication Agents, Bank of America, N.A., BMO Harris Bank, N.A., JPMorgan Chase Bank, N.A., The Royal Bank of Scotland PLC and U.S. Bank National Association, as Co-Documentation Agents, and the other lenders party thereto (incorporated by reference to Exhibit 10.1 to Current Report on Form 8-K filed on May 1, 2014). | ||||
| 10.5 | — | Amended and Restatement Agreement, dated November 25, 2013, among HCC Insurance Holdings, Inc., The Royal Bank of Scotland PLC and Barclays Bank PLC (incorporated by reference to Exhibit 10.1 to Current Report on Form 8-K filed on November 29, 2013). | ||||
| 10.6 | — | Restated $90,000,000 Standby Letter of Credit Facility, dated November 25, 2013, among HCC Insurance Holdings, Inc., The Royal Bank of Scotland PLC and Barclays Bank PLC (incorporated by reference to Exhibit 10.2 to Current Report on Form 8-K filed on November 29, 2013). | ||||
| 10.7 | — | HCC Insurance Holdings, Inc. 2008 Flexible Incentive Plan (incorporated by reference to Exhibit 4.1 to Registration Statement on Form S-8 (Registration No. 33-152897) filed on August 8, 2008).* | ||||
| 10.8 | — | HCC Insurance Holdings, Inc. 2013 Employee Stock Purchase Plan (incorporated by reference to Exhibit 4.4 to Registration Statement on Form S-8 (Registration No. 333-190484) filed on August 8, 2013).* | ||||
71
Table of Contents
|
Exhibit |
||||||
| 10.9 | — | Form of Restricted Stock Award Agreement under the HCC Insurance Holdings, Inc. 2008 Flexible Incentive Plan (incorporated by reference to Exhibit 10.2 to Quarterly Report on Form 10-Q filed on November 7, 2008).* | ||||
| 10.10 | — | Form of Nonqualified Stock Option Agreement under the HCC Insurance Holdings, Inc. 2008 Flexible Incentive Plan (incorporated by reference to Exhibit 10.1 to Quarterly Report on Form 10-Q filed on November 7, 2008).* | ||||
| 10.11 | — | Form of Restricted Stock Unit Award Agreement under the HCC Insurance Holdings, Inc. 2008 Flexible Incentive Plan (incorporated by reference to Exhibit 10.3 to Quarterly Report on Form 10-Q filed on November 7, 2008).* | ||||
| 10.12 | — | Form of Restricted Stock Award Agreement under the HCC Insurance Holdings, Inc. 2008 Flexible Incentive Plan (service shares) (incorporated by reference to Exhibit 10.28 to Annual Report on Form 10-K filed on March 1, 2010).* | ||||
| 10.13 | — | Form of Restricted Stock Award Agreement under the HCC Insurance Holdings, Inc. 2008 Flexible Incentive Plan (performance shares) (incorporated by reference to Exhibit 10.29 to Annual Report on Form 10-K filed on March 1, 2010).* | ||||
| 10.14 | — | Form of Restricted Stock Award Agreement (U.S.) under the HCC Insurance Holdings, Inc. 2008 Flexible Incentive Plan (incorporated by reference to Exhibit 10.30 to Annual Report on Form 10-K filed on March 1, 2010).* | ||||
| 10.15 | — | Form of Restricted Stock Unit Award Agreement under the HCC Insurance Holdings, Inc. 2008 Flexible Incentive Plan (incorporated by reference to Exhibit 10.31 to Annual Report on Form 10-K filed on March 1, 2010).* | ||||
| 10.16 | — | Form of Restricted Stock Award Agreement under the HCC Insurance Holdings, Inc. 2008 Flexible Incentive Plan (budget performance shares) (incorporated by reference to Exhibit 10.3 to Quarterly Report on Form 10-Q filed on August 3, 2012).* | ||||
| 10.17 | — | Form of Time-Vesting Restricted Stock Award Agreement (executive officers) under the HCC Insurance Holdings, Inc. 2008 Flexible Incentive Plan (incorporated by reference to Exhibit 10.1 to Current Report on Form 8-K filed on March 18, 2013).* | ||||
| 10.18 | — | Form of Performance-Vesting Restricted Stock Award Agreement (executive officers) under the HCC Insurance Holdings, Inc. 2008 Flexible Incentive Plan (incorporated by reference to Exhibit 10.2 to Current Report on Form 8-K filed on March 18, 2013).* | ||||
| 10.19 | — | Employment Agreement, effective May 1, 2011, between Christopher J.B. Williams and HCC Insurance Holdings, Inc. (incorporated by reference to Exhibit 10.1 to Current Report on Form 8-K filed on May 2, 2011).* | ||||
| 10.20 | — | Amendment to Employment Agreement, dated May 15, 2012, between Christopher J.B. Williams and HCC Insurance Holdings, Inc. (incorporated by reference to Exhibit 10.2 to Current Report on Form 8-K filed on May 15, 2012).* | ||||
| 10.21 | — | Employment Agreement, effective May 10, 2010, between Brad T. Irick and HCC Insurance Holdings, Inc. (incorporated by reference to Exhibit 10.2 to Quarterly Report on Form 10-Q filed on August 6, 2010).* | ||||
| 10.22 | — | First Amendment to Employment Agreement, effective January 1, 2012, between Brad T. Irick and HCC Insurance Holdings, Inc. (incorporated by reference to Exhibit 10.16 to Annual Report on Form 10-K filed on February 29, 2012).* | ||||
| 10.23 | — | Employment Agreement, dated March 21, 2012, between William N. Burke and HCC Insurance Holdings, Inc. (incorporated by reference to Exhibit 10.1 to Current Report on Form 8-K filed on March 26, 2012).* | ||||
| 10.24 | — | Service Agreement, effective January 1, 2006, between Barry J. Cook and HCC Service Company Limited (UK) Branch (incorporated by reference to Exhibit 10.1 to Quarterly Report on Form 10-Q filed on May 10, 2007).* | ||||
| 10.25 | — | Renewal Letter, dated March 30, 2012, between Barry J. Cook and HCC Service Company, Inc. (incorporated by reference to Exhibit 10.2 to Current Report on Form 8-K filed on April 4, 2012).* | ||||
| 10.26 | — | Employment Agreement, effective March 1, 2007, between Craig J. Kelbel and HCC Insurance Holdings, Inc. (incorporated by reference to Exhibit 10.4 to Current Report on Form 8-K filed on August 10, 2007).* | ||||
72
Table of Contents
|
Exhibit |
||||||
| 10.27 | — | First Amendment to Employment Agreement, effective September 1, 2009, between Craig J. Kelbel and HCC Insurance Holdings, Inc. (incorporated by reference to Exhibit 10.1 to Current Report on Form 8-K filed on August 28, 2009).* | ||||
| 10.28 | — | Second Amendment to Employment Agreement, dated March 30, 2012, between Craig J. Kelbel and HCC Insurance Holdings, Inc. (incorporated by reference to Exhibit 10.1 to Current Report on Form 8-K filed on April 4, 2012).* | ||||
| 10.29 | — | Third Amendment to Employment Agreement, dated December 17, 2014, between Craig J. Kelbel and HCC Insurance Holdings, Inc. (incorporated by reference to Exhibit 10.1 to Current Report on Form 8-K filed on December 17, 2014).* | ||||
| 10.30 | — | Employment Agreement, effective June 1, 2007, between Michael J. Schell and HCC Insurance Holdings, Inc. (incorporated by reference to Exhibit 10.3 to Current Report on Form 8-K filed on August 10, 2007).* | ||||
| 10.31 | — | First Amendment to Employment Agreement, effective December 19, 2008, between Michael J. Schell and HCC Insurance Holdings, Inc. (incorporated by reference to Exhibit 10.2 to Current Report on Form 8-K filed on December 22, 2008).* | ||||
| 10.32 | — | Second Amendment to Employment Agreement, effective December 1, 2010, between Michael J. Schell and HCC Insurance Holdings, Inc. (incorporated by reference to Exhibit 10.1 to Current Report on Form 8-K filed on December 6, 2010).* | ||||
| 10.33 | — | Third Amendment to Employment Agreement, effective May 22, 2013, between Michael J. Schell and HCC Insurance Holdings, Inc. (incorporated by reference to Exhibit 10.31 to Annual Report on Form 10-K filed on February 28, 2014).* | ||||
| 10.34 | — | Relocation Policy and Reimbursement Agreement, dated April 27, 2011, between Christopher J.B. Williams and HCC Insurance Holdings, Inc. (incorporated by reference to Exhibit 10.3 to Current Report on Form 8-K filed on May 2, 2011).* | ||||
| 10.35 | — | HCC Insurance Holdings, Inc. Nonqualified Deferred Compensation Plan for Christopher J.B. Williams, effective May 1, 2011 (incorporated by reference to Exhibit 10.2 to Current Report on Form 8-K filed on May 2, 2011).* | ||||
| 10.36 | — | HCC Insurance Holdings, Inc. Nonqualified Deferred Compensation Plan for Non-Employee Directors (incorporated by reference to Exhibit 10.28 to Annual Report on Form 10-K filed on February 28, 2011).* | ||||
| 10.37 | — | Form of Indemnification Agreement between HCC Insurance Holdings, Inc. and recipient (incorporated by reference to Exhibit 10.29 to Annual Report on Form 10-K filed on February 28, 2011).* | ||||
| 12 | † | — | Statement Regarding Computation of Ratios. | |||
| 21 | † | — | Subsidiaries of HCC Insurance Holdings, Inc. | |||
| 23 | † | — | Consent of Independent Registered Public Accounting Firm — PricewaterhouseCoopers LLP dated February 27, 2015. | |||
| 24 | † | — | Powers of Attorney. | |||
| 31.1 | † | — | Certification by Chief Executive Officer pursuant to Section 302 of the Sarbanes-Oxley Act of 2002. | |||
| 31.2 | † | — | Certification by Chief Financial Officer pursuant to Section 302 of the Sarbanes-Oxley Act of 2002. | |||
| 32.1 | † | — | Certification of Chief Executive Officer and Chief Financial Officer pursuant to Section 906 of the Sarbanes-Oxley Act of 2002. | |||
| 101 | † | — | The following financial statements from the Company’s Annual Report on Form 10-K for the year ended December 31, 2014 formatted in XBRL: 1) Consolidated Balance Sheets, 2) Consolidated Statements of Earnings, 3) Consolidated Statements of Comprehensive Income, 4) Consolidated Statements of Changes in Shareholders’ Equity, 5) Consolidated Statements of Cash Flows and 6) Notes to Consolidated Financial Statements. | |||
† Filed herewith.
* Management contract or compensatory plan.
73
Table of Contents
INDEX TO CONSOLIDATED FINANCIAL STATEMENTS AND SCHEDULES
Schedules other than those listed above have been omitted because they are either not required, not applicable or the required information is shown in the Consolidated Financial Statements and related Notes or other Schedules.
74
Table of Contents
REPORT OF INDEPENDENT REGISTERED PUBLIC ACCOUNTING FIRM
To the Board of Directors and Shareholders
HCC Insurance Holdings, Inc.
In our opinion, the consolidated financial statements listed in the accompanying index present fairly, in all material respects, the financial position of HCC Insurance Holdings, Inc. and its subsidiaries at December 31, 2014 and 2013, and the results of their operations and their cash flows for each of the three years in the period ended December 31, 2014 in conformity with accounting principles generally accepted in the United States of America. In addition, in our opinion, the financial statement schedules listed in the accompanying index present fairly, in all material respects, the information set forth therein when read in conjunction with the related consolidated financial statements. Also in our opinion, the Company maintained, in all material respects, effective internal control over financial reporting as of December 31, 2014, based on criteria established in Internal Control — Integrated Framework 2013 issued by the Committee of Sponsoring Organizations of the Treadway Commission (COSO). The Company’s management is responsible for these financial statements and financial statement schedules, for maintaining effective internal control over financial reporting and for its assessment of the effectiveness of internal control over financial reporting, included in Management’s Report on Internal Control over Financial Reporting appearing under Item 9A. Our responsibility is to express opinions on these financial statements, on the financial statement schedules, and on the Company’s internal control over financial reporting based on our integrated audits. We conducted our audits in accordance with the standards of the Public Company Accounting Oversight Board (United States). Those standards require that we plan and perform the audits to obtain reasonable assurance about whether the financial statements are free of material misstatement and whether effective internal control over financial reporting was maintained in all material respects. Our audits of the financial statements included examining, on a test basis, evidence supporting the amounts and disclosures in the financial statements, assessing the accounting principles used and significant estimates made by management, and evaluating the overall financial statement presentation. Our audit of internal control over financial reporting included obtaining an understanding of internal control over financial reporting, assessing the risk that a material weakness exists, and testing and evaluating the design and operating effectiveness of internal control based on the assessed risk. Our audits also included performing such other procedures as we considered necessary in the circumstances. We believe that our audits provide a reasonable basis for our opinions.
A company’s internal control over financial reporting is a process designed to provide reasonable assurance regarding the reliability of financial reporting and the preparation of financial statements for external purposes in accordance with generally accepted accounting principles. A company’s internal control over financial reporting includes those policies and procedures that (i) pertain to the maintenance of records that, in reasonable detail, accurately and fairly reflect the transactions and dispositions of the assets of the company; (ii) provide reasonable assurance that transactions are recorded as necessary to permit preparation of financial statements in accordance with generally accepted accounting principles, and that receipts and expenditures of the company are being made only in accordance with authorizations of management and directors of the company; and (iii) provide reasonable assurance regarding prevention or timely detection of unauthorized acquisition, use, or disposition of the company’s assets that could have a material effect on the financial statements.
Because of its inherent limitations, internal control over financial reporting may not prevent or detect misstatements. Also, projections of any evaluation of effectiveness to future periods are subject to the risk that controls may become inadequate because of changes in conditions, or that the degree of compliance with the policies or procedures may deteriorate.
/s/ PricewaterhouseCoopers LLP
Houston, TX
February 27, 2015
F-1
Table of Contents
HCC INSURANCE HOLDINGS, INC. AND SUBSIDIARIES
CONSOLIDATED BALANCE SHEETS
(in thousands, except per share data)
| December 31, | ||||||||
| 2014 | 2013 | |||||||
| ASSETS | ||||||||
| Investments |
||||||||
| Fixed maturity securities – available for sale, at fair value (amortized cost: 2014 – $6,352,737 and 2013 – $5,921,487) |
$ | 6,610,368 | $ | 6,022,473 | ||||
| Equity securities – available for sale, at fair value (cost: 2014 – $291,070 and 2013 – $464,388) |
296,352 | 517,466 | ||||||
| Short-term investments, at cost (approximates fair value) |
258,186 | 178,753 | ||||||
|
|
|
|
|
|||||
| Total investments |
7,164,906 | 6,718,692 | ||||||
|
|
|
|
|
|||||
| Cash |
102,093 | 58,301 | ||||||
| Restricted cash and securities |
119,010 | 125,777 | ||||||
| Premium, claims and other receivables |
553,027 | 580,107 | ||||||
| Reinsurance recoverables |
1,168,900 | 1,277,257 | ||||||
| Ceded unearned premium |
316,715 | 305,438 | ||||||
| Ceded life and annuity benefits |
48,499 | 56,491 | ||||||
| Deferred policy acquisition costs |
220,321 | 201,698 | ||||||
| Goodwill |
905,636 | 895,200 | ||||||
| Other assets |
115,239 | 125,559 | ||||||
|
|
|
|
|
|||||
| Total assets |
$ | 10,714,346 | $ | 10,344,520 | ||||
|
|
|
|
|
|||||
| LIABILITIES | ||||||||
| Loss and loss adjustment expense payable |
$ | 3,728,085 | $ | 3,902,132 | ||||
| Life and annuity policy benefits |
48,499 | 56,491 | ||||||
| Reinsurance, premium and claims payable |
301,476 | 332,985 | ||||||
| Unearned premium |
1,198,930 | 1,134,849 | ||||||
| Deferred ceding commissions |
94,202 | 89,528 | ||||||
| Notes payable |
824,251 | 654,098 | ||||||
| Accounts payable and accrued liabilities |
615,552 | 500,007 | ||||||
|
|
|
|
|
|||||
| Total liabilities |
6,810,995 | 6,670,090 | ||||||
|
|
|
|
|
|||||
| SHAREHOLDERS’ EQUITY | ||||||||
| Common stock, $1.00 par value; 250,000 shares authorized (shares issued: 2014 – 126,472 and 2013 – 125,577; outstanding: 2014 – 96,521 and 2013 – 100,336) |
|
126,472 |
|
|
125,577 |
| ||
| Additional paid-in capital |
1,113,551 | 1,073,105 | ||||||
| Retained earnings |
3,441,424 | 3,085,501 | ||||||
| Accumulated other comprehensive income |
175,014 | 118,651 | ||||||
| Treasury stock, at cost (shares: 2014 – 29,951 and 2013 – 25,241) |
(953,110) | (728,404) | ||||||
|
|
|
|
|
|||||
| Total shareholders’ equity |
3,903,351 | 3,674,430 | ||||||
|
|
|
|
|
|||||
| Total liabilities and shareholders’ equity |
$ | 10,714,346 | $ | 10,344,520 | ||||
|
|
|
|
|
|||||
See Notes to Consolidated Financial Statements.
F-2
Table of Contents
HCC INSURANCE HOLDINGS, INC. AND SUBSIDIARIES
CONSOLIDATED STATEMENTS OF EARNINGS
(in thousands, except per share data)
| Years ended December 31, | ||||||||||||
| 2014 | 2013 | 2012 | ||||||||||
| REVENUE |
||||||||||||
| Net earned premium |
$ | 2,323,627 | $ | 2,239,240 | $ | 2,242,625 | ||||||
| Net investment income |
221,620 | 220,182 | 222,634 | |||||||||
| Other operating income |
40,932 | 35,452 | 30,448 | |||||||||
| Net realized investment gain |
66,370 | 42,030 | 31,148 | |||||||||
| Other-than-temporary impairment credit losses |
- | - | (1,028) | |||||||||
|
|
|
|
|
|
|
|||||||
| Total revenue |
2,652,549 | 2,536,904 | 2,525,827 | |||||||||
|
|
|
|
|
|
|
|||||||
| EXPENSE |
||||||||||||
| Loss and loss adjustment expense, net |
1,326,835 | 1,322,454 | 1,338,074 | |||||||||
| Policy acquisition costs, net |
294,670 | 279,439 | 281,201 | |||||||||
| Other operating expense |
341,083 | 336,091 | 326,497 | |||||||||
| Interest expense |
28,125 | 26,210 | 25,628 | |||||||||
|
|
|
|
|
|
|
|||||||
| Total expense |
1,990,713 | 1,964,194 | 1,971,400 | |||||||||
|
|
|
|
|
|
|
|||||||
| Earnings before income tax expense |
661,836 | 572,710 | 554,427 | |||||||||
| Income tax expense |
203,493 | 165,513 | 163,187 | |||||||||
|
|
|
|
|
|
|
|||||||
| Net earnings |
$ | 458,343 | $ | 407,197 | $ | 391,240 | ||||||
|
|
|
|
|
|
|
|||||||
| Earnings per common share |
||||||||||||
| Basic |
$ | 4.62 | $ | 4.05 | $ | 3.84 | ||||||
|
|
|
|
|
|
|
|||||||
| Diluted |
$ | 4.61 | $ | 4.04 | $ | 3.83 | ||||||
|
|
|
|
|
|
|
|||||||
See Notes to Consolidated Financial Statements.
F-3
Table of Contents
HCC INSURANCE HOLDINGS, INC. AND SUBSIDIARIES
CONSOLIDATED STATEMENTS OF COMPREHENSIVE INCOME
(in thousands)
| Years ended December 31, | ||||||||||||
| 2014 | 2013 | 2012 | ||||||||||
| Net earnings |
$ | 458,343 | $ | 407,197 | $ | 391,240 | ||||||
| Other comprehensive income (loss) |
||||||||||||
| Investment gains (losses): |
||||||||||||
| Investment gains (losses) during year |
175,219 | (240,601) | 135,746 | |||||||||
| Income tax charge (benefit) |
62,055 | (85,377) | 46,779 | |||||||||
|
|
|
|
|
|
|
|||||||
| Investment gains (losses), net of tax |
113,164 | (155,224) | 88,967 | |||||||||
|
|
|
|
|
|
|
|||||||
| Less reclassification adjustments to: |
||||||||||||
| Net realized investment gain |
66,370 | 42,030 | 31,148 | |||||||||
| Other-than-temporary impairment credit losses |
- | - | (1,028) | |||||||||
| Income tax expense |
23,230 | 14,711 | 10,542 | |||||||||
|
|
|
|
|
|
|
|||||||
| Total reclassifications included in net earnings,net of tax |
43,140 | 27,319 | 19,578 | |||||||||
|
|
|
|
|
|
|
|||||||
| Net unrealized investment gains (losses) |
70,024 | (182,543) | 69,389 | |||||||||
|
|
|
|
|
|
|
|||||||
| Foreign currency translation adjustment |
(9,529) | 6,078 | (2,720) | |||||||||
| Income tax charge (benefit) |
4,132 | 155 | (943) | |||||||||
|
|
|
|
|
|
|
|||||||
| Foreign currency translation adjustment, net of tax |
(13,661) | 5,923 | (1,777) | |||||||||
|
|
|
|
|
|
|
|||||||
| Other comprehensive income (loss) |
56,363 | (176,620) | 67,612 | |||||||||
|
|
|
|
|
|
|
|||||||
| Comprehensive income |
$ | 514,706 | $ | 230,577 | $ | 458,852 | ||||||
|
|
|
|
|
|
|
|||||||
See Notes to Consolidated Financial Statements.
F-4
Table of Contents
HCC INSURANCE HOLDINGS, INC. AND SUBSIDIARIES
CONSOLIDATED STATEMENTS OF CHANGES IN SHAREHOLDERS’ EQUITY
Years ended December 31, 2014, 2013 and 2012
(in thousands, except per share data)
| Common stock |
Additional paid-in capital |
Retained earnings |
Accumulated other comprehensive income |
Treasury stock |
Total shareholders’ equity |
|||||||||||||||||||||||
| Balance at December 31, 2011 |
$ | 122,720 | $ | 1,001,308 | $ | 2,429,818 | $ | 227,659 | $ | (507,523 | ) | $ | 3,273,982 | |||||||||||||||
| Net earnings |
- | - | 391,240 | - | - | 391,240 | ||||||||||||||||||||||
| Other comprehensive income |
- | - | - | 67,612 | - | 67,612 | ||||||||||||||||||||||
| Issuance of 2,079 shares for exercise of options, including tax effect |
2,079 | 57,759 | - | - | - | 59,838 | ||||||||||||||||||||||
| Purchase of 5,567 common shares |
- | - | - | - | (178,669 | ) | (178,669 | ) | ||||||||||||||||||||
| Stock-based compensation |
315 | 7,587 | - | - | - | 7,902 | ||||||||||||||||||||||
| Cash dividends declared, $0.64 per share |
- | - | (64,892 | ) | - | - | (64,892 | ) | ||||||||||||||||||||
| Other |
- | (14,401 | ) | - | - | - | (14,401 | ) | ||||||||||||||||||||
|
|
|
|
|
|
|
|
|
|
|
|
|
|||||||||||||||||
| Balance at December 31, 2012 |
125,114 | 1,052,253 | 2,756,166 | 295,271 | (686,192 | ) | 3,542,612 | |||||||||||||||||||||
| Net earnings |
- | - | 407,197 | - | - | 407,197 | ||||||||||||||||||||||
| Other comprehensive loss |
- | - | - | (176,620 | ) | - | (176,620 | ) | ||||||||||||||||||||
| Issuance of 381 shares for exercise of options, including tax effect |
381 | 12,527 | - | - | - | 12,908 | ||||||||||||||||||||||
| Purchase of 1,055 common shares |
- | - | - | - | (42,212 | ) | (42,212 | ) | ||||||||||||||||||||
| Stock-based compensation |
82 | 8,325 | - | - | - | 8,407 | ||||||||||||||||||||||
| Cash dividends declared, $0.78 per share |
- | - | (77,862 | ) | - | - | (77,862 | ) | ||||||||||||||||||||
|
|
|
|
|
|
|
|
|
|
|
|
|
|||||||||||||||||
| Balance at December 31, 2013 |
125,577 | 1,073,105 | 3,085,501 | 118,651 | (728,404 | ) | 3,674,430 | |||||||||||||||||||||
| Net earnings |
- | - | 458,343 | - | - | 458,343 | ||||||||||||||||||||||
| Other comprehensive income |
- | - | - | 56,363 | - | 56,363 | ||||||||||||||||||||||
| Issuance of 461 shares for exercise of options, including tax effect |
461 | 16,337 | - | - | - | 16,798 | ||||||||||||||||||||||
| Issuance of 92 shares for employee stock purchase plan |
92 | 3,347 | - | - | - | 3,439 | ||||||||||||||||||||||
| Purchase of 4,710 common shares |
- | - | - | - | (224,706 | ) | (224,706 | ) | ||||||||||||||||||||
| Stock-based compensation |
342 | 20,762 | - | - | - | 21,104 | ||||||||||||||||||||||
| Cash dividends declared, $1.04 per share |
- | - | (102,420 | ) | - | - | (102,420 | ) | ||||||||||||||||||||
|
|
|
|
|
|
|
|
|
|
|
|
|
|||||||||||||||||
| Balance at December 31, 2014 |
$ | 126,472 | $ | 1,113,551 | $ | 3,441,424 | $ | 175,014 | $ | (953,110 | ) | $ | 3,903,351 | |||||||||||||||
|
|
|
|
|
|
|
|
|
|
|
|
|
|||||||||||||||||
See Notes to Consolidated Financial Statements.
F-5
Table of Contents
HCC INSURANCE HOLDINGS, INC. AND SUBSIDIARIES
CONSOLIDATED STATEMENTS OF CASH FLOWS
(in thousands)
| Years ended December 31, | ||||||||||||
| 2014 | 2013 | 2012 | ||||||||||
| Operating activities |
||||||||||||
| Net earnings |
$ | 458,343 | $ | 407,197 | $ | 391,240 | ||||||
| Adjustments to reconcile net earnings to net cash provided by |
||||||||||||
| Change in premium, claims and other receivables |
11,060 | (16,584 | ) | 61,675 | ||||||||
| Change in reinsurance recoverables |
78,551 | (193,906 | ) | (6,812 | ) | |||||||
| Change in ceded unearned premium |
(11,657 | ) | (48,284 | ) | (34,580 | ) | ||||||
| Change in loss and loss adjustment expense payable |
(132,253 | ) | 115,880 | 82,201 | ||||||||
| Change in unearned premium |
65,295 | 64,452 | 38,662 | |||||||||
| Change in reinsurance, premium and claims payable |
(25,863 | ) | 39,321 | (59,177 | ) | |||||||
| Change in accounts payable and accrued liabilities |
(22,343 | ) | (120,859 | ) | 100,091 | |||||||
| Stock-based compensation expense |
26,142 | 15,531 | 12,088 | |||||||||
| Depreciation and amortization expense |
16,675 | 18,289 | 19,476 | |||||||||
| Gain on investments |
(66,370 | ) | (42,030 | ) | (30,120 | ) | ||||||
| Other, net |
81,057 | 23,700 | 86,403 | |||||||||
|
|
|
|
|
|
|
|||||||
| Cash provided by operating activities |
478,637 | 262,707 | 661,147 | |||||||||
|
|
|
|
|
|
|
|||||||
| Investing activities |
||||||||||||
| Sales of available for sale fixed maturity securities |
480,876 | 492,891 | 639,834 | |||||||||
| Sales of equity securities |
434,389 | 146,624 | 14,117 | |||||||||
| Sales of other investments |
- | 23,719 | 21,736 | |||||||||
| Maturity or call of available for sale fixed maturity securities |
532,706 | 627,041 | 697,404 | |||||||||
| Maturity or call of held to maturity fixed maturity securities |
- | - | 28,527 | |||||||||
| Cost of available for sale fixed maturity securities acquired |
(1,475,171 | ) | (1,346,498 | ) | (1,489,235 | ) | ||||||
| Cost of equity securities acquired |
(200,265 | ) | (345,129 | ) | (262,528 | ) | ||||||
| Change in short-term investments |
(86,467 | ) | 181,972 | (207,403 | ) | |||||||
| Payments for purchase of businesses, net of cash received |
(8,024 | ) | (8,328 | ) | (46,627 | ) | ||||||
| Proceeds from sales of subsidiaries |
16,589 | 2,031 | 2,029 | |||||||||
| Other, net |
(5,943 | ) | (9,377 | ) | (16,757 | ) | ||||||
|
|
|
|
|
|
|
|||||||
| Cash used by investing activities |
(311,310 | ) | (235,054 | ) | (618,903 | ) | ||||||
|
|
|
|
|
|
|
|||||||
| Financing activities |
||||||||||||
| Advances on line of credit |
275,000 | 180,000 | 185,000 | |||||||||
| Payments on line of credit |
(105,000 | ) | (110,000 | ) | (80,000 | ) | ||||||
| Sale of common stock |
20,237 | 12,908 | 59,838 | |||||||||
| Purchase of common stock |
(224,706 | ) | (47,869 | ) | (173,028 | ) | ||||||
| Dividends paid |
(96,544 | ) | (71,967 | ) | (64,345 | ) | ||||||
| Other, net |
7,478 | (3,814 | ) | (2,869 | ) | |||||||
|
|
|
|
|
|
|
|||||||
| Cash used by financing activities |
(123,535 | ) | (40,742 | ) | (75,404 | ) | ||||||
|
|
|
|
|
|
|
|||||||
| Net increase (decrease) in cash |
43,792 | (13,089 | ) | (33,160 | ) | |||||||
| Cash at beginning of year |
58,301 | 71,390 | 104,550 | |||||||||
|
|
|
|
|
|
|
|||||||
| Cash at end of year |
$ | 102,093 | $ | 58,301 | $ | 71,390 | ||||||
|
|
|
|
|
|
|
|||||||
See Notes to Consolidated Financial Statements.
F-6
Table of Contents
HCC INSURANCE HOLDINGS, INC. AND SUBSIDIARIES
NOTES TO CONSOLIDATED FINANCIAL STATEMENTS
(tables in thousands, except per share data)
(1) General Information and Significant Accounting and Reporting Policies
HCC Insurance Holdings, Inc. (HCC) and its subsidiaries (collectively we, us or our) include domestic and foreign property and casualty and life insurance companies and underwriting agencies with offices in the United States, the United Kingdom, Spain and Ireland. We underwrite a variety of largely non-correlated specialty insurance products, including property and casualty, accident and health, surety and credit product lines, in approximately 180 countries. We market our products through a network of independent agents and brokers, through managing general agents owned by the company, and directly to consumers. In addition, we assume insurance written by other insurance companies.
Our principal domestic insurance companies are Houston Casualty Company and U.S. Specialty Insurance Company, HCC Life Insurance Company, Avemco Insurance Company, American Contractors Indemnity Company and United States Surety Company. These companies operate throughout the United States. All of these insurance companies operate on an admitted basis, except Houston Casualty Company, which operates on a surplus lines basis in the United States and also insures international risks. Our principal foreign insurance companies are HCC International Insurance Company PLC, HCC Reinsurance Company Limited and the London branch of Houston Casualty Company. These companies operate principally from the United Kingdom. We also participate in Syndicate 4141, a Lloyd’s of London syndicate that we manage.
Basis of Presentation
Our consolidated financial statements have been prepared in conformity with accounting principles generally accepted in the United States of America (GAAP) and include the accounts of HCC and its subsidiaries. All significant intercompany balances and transactions have been eliminated in consolidation. Management must make estimates and assumptions that affect amounts reported in our consolidated financial statements and in disclosures of contingent assets and liabilities. Ultimate results could differ from those estimates.
Revision of Financial Statement Presentation
We revised the presentation of our 2013 and 2012 consolidated statements of earnings to correctly classify $32.4 million and $32.6 million of internal claims department costs, respectively, as loss and loss adjustment expense. Previously, these costs were included in other operating expense, which was not in compliance with GAAP. The impact of this incorrect classification was not considered to be material to previously issued financial statements and had no effect on our consolidated net earnings, shareholders’ equity or cash flows in any previously issued financial statements.
Net Earned Premium, Policy Acquisition Costs and Ceding Commissions
Substantially all of the property and casualty, surety, and accident and health policies written by our insurance companies qualify as short-duration contracts. We recognize in current earned income the portion of the premium that provides insurance protection in the period. For the majority of our insurance policies, we recognize premium, net of reinsurance, on a pro rata basis over the term of the related contract. For certain disability policies, directors’ and officers’ liability tail policies, surety bonds and construction contracts, we recognize premium, net of reinsurance, over the period of risk in proportion to the amount of insurance protection provided. Unearned premium represents the portion of premium written that relates to the unexpired period of protection. Premium for commercial title insurance and group life policies is recognized in earnings on the effective date of the contract and when the premium is due, respectively. When the limit under a specific ceded excess of loss reinsurance layer has been exhausted, we effectively expense the remaining premium for that limit and defer and amortize the reinstatement premium over the remaining period of risk.
We defer our direct costs to underwrite insurance policies, less amounts reimbursed by reinsurers, and charge or credit the costs to earnings proportionate with the premium earned. These policy acquisition costs include underwriters’ salaries and bonuses attributable to successful marketing or underwriting efforts, commissions, premium taxes, fees and other incremental underwriting costs. Historical and current loss adjustment expense experience and anticipated investment income are considered in determining any premium deficiency and recoverability of related deferred policy acquisition costs.
F-7
Table of Contents
HCC INSURANCE HOLDINGS, INC. AND SUBSIDIARIES
NOTES TO CONSOLIDATED FINANCIAL STATEMENTS
(tables in thousands, except per share data)
Premium, Claims and Other Receivables
We use the gross method for reporting receivables and payables on brokered transactions. We review the collectibility of our receivables, primarily related to premiums receivable, on a current basis and generally cancel insurance coverage if the premium is unpaid. We provide an allowance for amounts due from agents and brokers that are doubtful of collection. The allowance was $5.1 million and $5.8 million at December 31, 2014 and 2013, respectively. Our estimate of the level of the allowance could change as conditions change in the future.
Loss and Loss Adjustment Expense Payable
Loss and loss adjustment expense payable by our insurance companies is based on estimates of payments to be made for reported losses, incurred but not reported losses, and anticipated receipts from salvage and subrogation. Reserves are recorded on an undiscounted basis, except for reserves of acquired companies. The discount on those reserves is not material. Estimates for reported losses are based on all available information, including reports received from ceding companies on assumed business. Estimates for incurred but not reported losses are based both on our experience and the industry’s experience. We continually review the estimates with our actuaries, and any changes are reflected in loss and loss adjustment expense in our consolidated statements of earnings in the period of the change. While we believe that amounts included in our consolidated financial statements are adequate, such estimates may be more or less than the amounts ultimately paid when the claims are settled.
We have no material exposure to asbestos claims or environmental pollution losses in any of our segments. Policies issued by our insurance companies do not have significant environmental exposure because of the types of risks covered.
Reinsurance
We record all reinsurance recoverables and ceded unearned premium as assets, and deferred ceding commissions as liabilities. All such amounts are calculated based on the reinsurance contract terms and recorded in a manner consistent with the underlying reinsured contracts. We record a reserve for uncollectible reinsurance based on our assessment of the reinsurer’s creditworthiness and collectibility of the recorded amounts. Information utilized to calculate the reserve is subject to change, which could affect the level of the reserve in the future.
Cash and Short-term Investments
Cash consists of cash in banks, generally in operating accounts. Short-term investments, including certificates of deposit and money-market funds, are classified as investments in our consolidated balance sheets as they relate principally to our investment activities. We generally maintain our cash deposits in major banks and invest our short-term funds in institutional money-market funds and short-term financial instruments. These securities typically mature within ninety days and, therefore, bear minimal risk.
Restricted Cash and Securities
Our agencies hold funds of unaffiliated parties for the payment of claims, and our surety businesses hold funds as collateral for potential claims. We also hold certain securities in accordance with acquisition agreements. These restricted fiduciary funds are shown as restricted cash and securities in our consolidated balance sheets. The corresponding liability is included within loss and loss adjustment expense payable; reinsurance, premium and claims payable; or accounts payable and accrued liabilities in our consolidated balance sheets. Interest earned on these funds accrues to the benefit of the parties from whom the funds were withheld. Therefore, we do not include cash activity related to these funds in our consolidated statements of cash flows.
F-8
Table of Contents
HCC INSURANCE HOLDINGS, INC. AND SUBSIDIARIES
NOTES TO CONSOLIDATED FINANCIAL STATEMENTS
(tables in thousands, except per share data)
Investments
All of our fixed maturity securities are classified as available for sale and reported at fair value. In determining fair value, we apply the market approach, which uses quoted prices or other relevant data based on market transactions involving identical or comparable assets. The change in unrealized gain or loss on available for sale securities (including the foreign exchange effect for securities denominated in currencies other than the functional currency of the subsidiary) is recorded as a component of other comprehensive income, net of the related deferred income tax effect, within our consolidated shareholders’ equity. We purchase our available for sale fixed maturity securities with the expectation that we will hold them to maturity, but we may sell them if market conditions or credit-related risk warrant earlier sales.
Our available for sale fixed maturity securities portfolio includes mortgage-backed and asset-backed securities for which we recognize income using a constant effective yield based on anticipated prepayments and the estimated economic life of the securities. When actual prepayments differ significantly from anticipated prepayments, the estimated economic life is recalculated and the remaining unamortized premium or discount is amortized prospectively over the remaining economic life.
Equity securities and other investment securities are carried at fair value. We classify these securities as available for sale, and the change in carrying value is recorded as a component of other comprehensive income, net of the related deferred income tax effect, within our consolidated shareholders’ equity.
Short-term investments are carried at cost, which approximates fair value.
Realized investment gains or losses are determined on an average cost basis and included in earnings on the trade date. If a structured security fails to pay the full amount of expected principal, we recognize the unpaid amount as a realized loss in the period due and permanently reduce the security’s cost basis.
Other-than-temporary Impairments
A security has an impairment loss when its fair value is less than its cost or amortized cost at the balance sheet date. We evaluate impaired securities for possible other-than-temporary impairment loss at each quarter end, considering various factors including: 1) amount by which the security’s fair value is less than its cost, 2) length of time the security has been impaired, 3) whether we intend to sell the security, 4) if it is more likely than not that we will sell the security before recovery of its amortized cost basis, 5) whether the impairment is due to an issuer-specific event, credit issues or change in market interest rates, 6) the security’s credit rating and any recent downgrades and 7) stress testing of expected cash flows under various scenarios.
For each impaired security, we determine if: 1) we do not intend to sell the security and 2) it is more likely than not that we will not be required to sell the security before recovery of its amortized cost basis. If we cannot assert these conditions, we record an other-than-temporary impairment loss through our consolidated statements of earnings in the current period. For all other impaired securities, we assess whether the net present value of the cash flows expected to be collected from the security is less than its amortized cost basis. Such a shortfall in cash flows is referred to as a “credit loss.” For any such security, we separate the impairment loss into: 1) the credit loss and 2) the non-credit loss, which is the amount related to all other factors such as interest rate changes, fluctuations in exchange rates and market conditions. We charge the credit loss to current period earnings and the non-credit loss to other comprehensive income, within shareholders’ equity, on an after-tax basis. A security’s cost basis is permanently reduced by the amount of a credit loss. We accrete income over the remaining life of a fixed maturity security based on the interest rate necessary to discount the expected future cash flows to the new basis. If the security is non-income producing, we apply any cash proceeds as a reduction of principal when received.
F-9
Table of Contents
HCC INSURANCE HOLDINGS, INC. AND SUBSIDIARIES
NOTES TO CONSOLIDATED FINANCIAL STATEMENTS
(tables in thousands, except per share data)
Derivative Financial Instruments
We hold an interest in a long-term mortgage impairment insurance contract, denominated in British pound sterling, for which the exposure is measured based on movement in a specified U.K. housing index. The contract qualifies as a derivative financial instrument, is unhedged and is reported at fair value in other assets in our consolidated balance sheets. We record changes in fair value and any foreign exchange gain/loss on the contract within other operating income in our consolidated statements of earnings.
We utilize the British pound sterling and the Euro as the functional currency in certain of our foreign operations. As a result, we have exposure to fluctuations in exchange rates between these currencies and the U.S. dollar. From time to time, we may use derivative instruments to protect our investment in these foreign operations by limiting our exposure to fluctuations in exchange rates.
Other Operating Income
Fee and commission income, primarily from third party agency and broker commissions, is reported in other operating income in our consolidated statements of earnings. We recognize fee and commission income on the later of the effective date of the policy, the date when the premium can be reasonably established, or the date when substantially all services related to the insurance placement have been rendered to the client. We record revenue from profit commissions based on the profitability of business written, calculated using the respective commission formula and actual underwriting results through the date of calculation. Such amounts are adjusted if and when experience changes.
When our underwriting agencies utilize one of our insurance company subsidiaries as the policy issuing company, we eliminate in consolidation the fee and commission income against the related insurance company’s policy acquisition costs and defer the policy acquisition costs of the underwriting agencies.
Goodwill and Intangible Assets
Goodwill is impaired when the fair value of a reporting unit is less than its carrying amount. We assess our goodwill for impairment annually, or sooner if an event occurs or circumstances change that would more likely than not reduce the fair value of a reporting unit below its carrying amount. We noted no indicators of impairment in 2014. We conducted our 2014 goodwill impairment test as of June 30, 2014, which is consistent with the timeframe for our annual assessment in prior years. Our 2014 impairment test consisted of a qualitative assessment in which we determined that it is more likely than not that the fair value of each of our five reporting units exceeded its carrying amount as of June 30, 2014.
In years where we assess goodwill for impairment by determining the fair value of each reporting unit, we consider three valuation approaches (market, income and cost). We utilize the income and market valuation approaches and base our assumptions and inputs on market participant data, as well as our own data. For the income approach, we estimate the present value of each reporting unit’s expected cash flows to determine its fair value. We utilize estimated future cash flows of the portfolio of products included in each reporting unit, as well as a risk-appropriate rate of return specific to each reporting unit. We utilize our budgets and projection of future operations based on historical and expected industry trends to estimate our future cash flows and their probability of occurring as projected. We also determine fair value of each reporting unit based on market participant data, and use those results to test the reasonableness and validity of the income approach results. We utilized this methodology to determine the fair value of our reporting units in 2013. Our 2012 impairment test consisted of a qualitative assessment in which we determined that it is more likely than not that the fair value of each of our five reporting units exceeded its carrying amount as of June 30, 2012.
F-10
Table of Contents
HCC INSURANCE HOLDINGS, INC. AND SUBSIDIARIES
NOTES TO CONSOLIDATED FINANCIAL STATEMENTS
(tables in thousands, except per share data)
When we complete a business acquisition, we record the business combination using the acquisition method of accounting. We value all identifiable assets and liabilities at fair value and allocate any remaining consideration to goodwill in our purchase price allocations. We assign goodwill to applicable reporting units, based on the reporting unit’s share of the estimated future cash flows of all acquired insurance products. Any future adjustments to finalize pre-2009 purchase price allocations, other than for certain tax-related items, are recorded as an adjustment to goodwill. All other adjustments of purchase price allocations are recorded through earnings in the period when the adjustment is determined.
Intangible assets not subject to amortization are tested for impairment annually, or sooner if an event occurs or circumstances change that indicate that an intangible asset might be impaired. Other intangible assets are amortized over their respective useful lives.
Foreign Currency
We utilize the British pound sterling and the Euro as the functional currency in certain of our foreign operations. The cumulative translation adjustment, representing the effect of translating these subsidiaries’ assets and liabilities into U.S. dollars, is included in the foreign currency translation adjustment, net of the related deferred income tax effect, within accumulated other comprehensive income in consolidated shareholders’ equity.
For our other foreign subsidiaries and branches, the functional currency is the U.S. dollar. For all subsidiaries, transactions in non-functional currencies are translated at the rates of exchange in effect on the date the transaction occurs. Transaction gains and losses are recorded in earnings and included in other operating expense in the consolidated statements of earnings. We recognized a foreign currency benefit of $23.2 million in 2014, compared to $5.3 million and $6.2 million of expense in 2013 and 2012, respectively. Assets and liabilities recorded in non-functional currencies are translated into the functional currencies at exchange rates in effect at the balance sheet date.
For available for sale securities, unrealized gains and losses related to fluctuations in exchange rates are recorded as a component of other comprehensive income, net of the related deferred income tax effect, within consolidated shareholders’ equity until the securities mature or are sold.
The effect of exchange rate changes on cash balances held in foreign currencies was immaterial for all periods presented and is not shown separately in the consolidated statements of cash flows.
Income Taxes
We file a consolidated Federal income tax return and include the foreign subsidiaries’ income to the extent required by law. Deferred income tax is accounted for using the liability method, which reflects the tax impact of temporary differences between the bases of assets and liabilities for financial reporting purposes and such bases as measured by tax laws and regulations. We provide a deferred tax liability for un-repatriated earnings of our foreign subsidiaries at prevailing statutory rates when required. We regularly review our deferred tax assets for recoverability and establish a valuation allowance based on our history of earnings, expectations for future earnings, taxable income in carryback years and the expected timing of the reversals of existing temporary differences. Due to our history of earnings, expectations for future earnings, and taxable income in carryback years, we expect to be able to fully realize the benefit of any net deferred tax asset, excluding amounts covered by valuation allowances, on a consolidated basis.
We maintain a liability for our uncertain tax positions where we determine it is not more likely than not the tax position will be sustained upon examination by the appropriate tax authority. Changes in the liability for our uncertain tax positions are reflected in income tax expense in the period when a new uncertain tax position arises, we change our judgment about the likelihood of uncertainty, the tax issue is settled, or the statute of limitations expires. We report any potential net interest income or expense and penalties related to changes in our uncertain tax positions in our consolidated statements of earnings as interest expense and other operating expense, respectively.
F-11
Table of Contents
HCC INSURANCE HOLDINGS, INC. AND SUBSIDIARIES
NOTES TO CONSOLIDATED FINANCIAL STATEMENTS
(tables in thousands, except per share data)
Stock-Based Compensation
We measure the fair value of restricted stock awards and units based on the closing stock price of our common stock on the grant date and expense that value on a straight-line basis over the vesting period. For restricted stock awards/units that contain a performance condition, we recognize expense based on the awards/units expected to vest and adjust the cumulative expense whenever our estimate of the number of awards/units to vest changes. For restricted stock awards that contain a market condition, we determine the fair value at the grant date using a Monte Carlo simulation model that takes into account the probabilities of numerous vesting outcomes. This fair value is expensed on a straight-line basis over the vesting period and is not adjusted for the ultimate number of shares to vest. For stock option awards, we use the Black-Scholes option pricing model to determine the fair value of an option on its grant date and expense that value on a straight-line basis over the option’s vesting period. For grants of unrestricted common stock, we measure fair value based on the closing stock price of our common stock on the grant date and expense that value on the grant date. We calculate expense for our employee stock purchase plan using a Black-Scholes option pricing model and recognize the expense over each six-month offering period.
Earnings Per Share
Basic earnings per share is computed by dividing net earnings attributable to common stock by the weighted-average common shares outstanding during the year. Diluted earnings per share is computed by dividing net earnings attributable to common stock by the weighted-average common shares outstanding plus the weighted-average potential common shares outstanding during the year. Outstanding common stock options and unvested restricted stock with no right to dividends, when dilutive, are included in the weighted-average potential common shares outstanding. We use the treasury stock method to calculate the dilutive effect of potential common shares outstanding. We treat unvested restricted stock and unvested restricted stock units that contain non-forfeitable rights to dividends or dividend-equivalents as participating securities and include them in the earnings allocation in calculating earnings per share under the two-class method.
Recent Accounting Guidance
A new accounting standard issued in 2014 will change the manner in which most companies recognize revenue. The standard requires that revenue reflect the transfer of goods or services to customers based on the consideration/payment the company expects to be entitled to in exchange for those goods or services; however, the standard does not change the accounting for insurance contracts or investment income. The new standard also requires enhanced disclosures about revenue. This accounting guidance is effective in the first quarter of 2017 and may be applied on a full retrospective or modified retrospective approach. We are currently assessing the impact the implementation of this standard will have on our consolidated financial statements.
F-12
Table of Contents
HCC INSURANCE HOLDINGS, INC. AND SUBSIDIARIES
NOTES TO CONSOLIDATED FINANCIAL STATEMENTS
(tables in thousands, except per share data)
(2) Investments
The cost or amortized cost, gross unrealized gain or loss, and fair value of our fixed maturity and equity securities, all of which are classified as available for sale, were as follows:
| Cost or amortized cost |
Gross unrealized gain |
Gross unrealized loss |
Fair value | |||||||||||||
| December 31, 2014 |
||||||||||||||||
| U.S. government and government agency securities |
$ | 70,279 | $ | 827 | $ | (137 | ) | $ | 70,969 | |||||||
| Fixed maturity securities of states, municipalities |
896,130 | 58,738 | (160 | ) | 954,708 | |||||||||||
| Special purpose revenue bonds of states, municipalities |
2,246,707 | 143,291 | (986 | ) | 2,389,012 | |||||||||||
| Corporate securities |
1,251,625 | 36,759 | (11,549 | ) | 1,276,835 | |||||||||||
| Residential mortgage-backed securities |
805,458 | 20,215 | (3,979 | ) | 821,694 | |||||||||||
| Commercial mortgage-backed securities |
593,956 | 19,707 | (2,032 | ) | 611,631 | |||||||||||
| Asset-backed securities |
369,103 | 316 | (2,592 | ) | 366,827 | |||||||||||
| Foreign government securities |
119,479 | 767 | (1,554 | ) | 118,692 | |||||||||||
|
|
|
|
|
|
|
|
|
|||||||||
| Total fixed maturity securities |
$ | 6,352,737 | $ | 280,620 | $ | (22,989 | ) | $ | 6,610,368 | |||||||
|
|
|
|
|
|
|
|
|
|||||||||
| Equity securities |
$ | 291,070 | $ | 24,069 | $ | (18,787 | ) | $ | 296,352 | |||||||
|
|
|
|
|
|
|
|
|
|||||||||
| December 31, 2013 |
||||||||||||||||
| U.S. government and government agency securities |
$ | 91,047 | $ | 2,157 | $ | (495 | ) | $ | 92,709 | |||||||
| Fixed maturity securities of states, municipalities |
941,580 | 50,885 | (5,979 | ) | 986,486 | |||||||||||
| Special purpose revenue bonds of states, municipalities |
2,240,412 | 71,541 | (46,758 | ) | 2,265,195 | |||||||||||
| Corporate securities |
1,195,387 | 40,860 | (11,009 | ) | 1,225,238 | |||||||||||
| Residential mortgage-backed securities |
622,766 | 15,289 | (19,936 | ) | 618,119 | |||||||||||
| Commercial mortgage-backed securities |
502,069 | 16,155 | (13,336 | ) | 504,888 | |||||||||||
| Asset-backed securities |
183,660 | 319 | (1,587 | ) | 182,392 | |||||||||||
| Foreign government securities |
144,566 | 3,237 | (357 | ) | 147,446 | |||||||||||
|
|
|
|
|
|
|
|
|
|||||||||
| Total fixed maturity securities |
$ | 5,921,487 | $ | 200,443 | $ | (99,457 | ) | $ | 6,022,473 | |||||||
|
|
|
|
|
|
|
|
|
|||||||||
| Equity securities |
$ | 464,388 | $ | 58,842 | $ | (5,764 | ) | $ | 517,466 | |||||||
|
|
|
|
|
|
|
|
|
|||||||||
F-13
Table of Contents
HCC INSURANCE HOLDINGS, INC. AND SUBSIDIARIES
NOTES TO CONSOLIDATED FINANCIAL STATEMENTS
(tables in thousands, except per share data)
Substantially all of our fixed maturity securities are investment grade. The following tables display the gross unrealized losses and fair value of all available for sale securities that were in a continuous unrealized loss position for the periods indicated.
| Less than 12 months | 12 months or more | Total | ||||||||||||||||||||||
| Fair value | Unrealized losses |
Fair value | Unrealized losses |
Fair value | Unrealized losses |
|||||||||||||||||||
| December 31, 2014 |
||||||||||||||||||||||||
| Fixed maturity securities |
||||||||||||||||||||||||
| U.S. government and government agency securities |
$ | 14,813 | $ | (8 | ) | $ | 11,236 | $ | (129 | ) | $ | 26,049 | $ | (137 | ) | |||||||||
| Fixed maturity securities of states, municipalities and political subdivisions |
3,857 | (21 | ) | 19,337 | (139 | ) | 23,194 | (160 | ) | |||||||||||||||
| Special purpose revenue bonds of states, municipalities and political subdivisions |
4,041 | (19 | ) | 100,947 | (967 | ) | 104,988 | (986 | ) | |||||||||||||||
| Corporate securities |
393,274 | (7,085 | ) | 69,662 | (4,464 | ) | 462,936 | (11,549 | ) | |||||||||||||||
| Residential mortgage-backed securities |
37,434 | (100 | ) | 226,256 | (3,879 | ) | 263,690 | (3,979 | ) | |||||||||||||||
| Commercial mortgage-backed securities |
5,228 | (26 | ) | 99,868 | (2,006 | ) | 105,096 | (2,032 | ) | |||||||||||||||
| Asset-backed securities |
181,579 | (1,245 | ) | 78,797 | (1,347 | ) | 260,376 | (2,592 | ) | |||||||||||||||
| Foreign government securities |
55,280 | (1,498 | ) | 7,187 | (56 | ) | 62,467 | (1,554 | ) | |||||||||||||||
| Equity securities |
111,251 | (17,839 | ) | 3,934 | (948 | ) | 115,185 | (18,787 | ) | |||||||||||||||
|
|
|
|
|
|
|
|
|
|
|
|
|
|||||||||||||
| Total |
$ | 806,757 | $ | (27,841 | ) | $ | 617,224 | $ | (13,935 | ) | $ | 1,423,981 | $ | (41,776 | ) | |||||||||
|
|
|
|
|
|
|
|
|
|
|
|
|
|||||||||||||
| December 31, 2013 |
||||||||||||||||||||||||
| Fixed maturity securities |
||||||||||||||||||||||||
| U.S. government and government agency securities |
$ | 23,717 | $ | (495 | ) | $ | - | $ | - | $ | 23,717 | $ | (495 | ) | ||||||||||
| Fixed maturity securities of states, municipalities and political subdivisions |
136,160 | (5,277 | ) | 8,997 | (702 | ) | 145,157 | (5,979 | ) | |||||||||||||||
| Special purpose revenue bonds of states, municipalities and political subdivisions |
684,560 | (35,832 | ) | 83,228 | (10,926 | ) | 767,788 | (46,758 | ) | |||||||||||||||
| Corporate securities |
277,853 | (8,202 | ) | 35,437 | (2,807 | ) | 313,290 | (11,009 | ) | |||||||||||||||
| Residential mortgage-backed securities |
306,874 | (15,861 | ) | 31,687 | (4,075 | ) | 338,561 | (19,936 | ) | |||||||||||||||
| Commercial mortgage-backed securities |
203,347 | (12,611 | ) | 4,915 | (725 | ) | 208,262 | (13,336 | ) | |||||||||||||||
| Asset-backed securities |
126,922 | (1,587 | ) | - | - | 126,922 | (1,587 | ) | ||||||||||||||||
| Foreign government securities |
78,182 | (357 | ) | - | - | 78,182 | (357 | ) | ||||||||||||||||
| Equity securities |
75,620 | (5,437 | ) | 7,016 | (327 | ) | 82,636 | (5,764 | ) | |||||||||||||||
|
|
|
|
|
|
|
|
|
|
|
|
|
|||||||||||||
| Total |
$ | 1,913,235 | $ | (85,659 | ) | $ | 171,280 | $ | (19,562 | ) | $ | 2,084,515 | $ | (105,221 | ) | |||||||||
|
|
|
|
|
|
|
|
|
|
|
|
|
|||||||||||||
F-14
Table of Contents
HCC INSURANCE HOLDINGS, INC. AND SUBSIDIARIES
NOTES TO CONSOLIDATED FINANCIAL STATEMENTS
(tables in thousands, except per share data)
At December 31, 2014, we held approximately 2,900 fixed maturity and equity securities, of which 24% included at least one lot in an unrealized loss position. A security has an impairment loss when its fair value is less than its cost or amortized cost at the balance sheet date. We evaluate our securities for possible other-than-temporary impairment losses at each quarter end. During 2014, our reviews covered all impaired securities where the loss exceeded $1.0 million and the loss either exceeded 10% of cost or the security had been in a loss position for longer than twelve consecutive months. During 2013 and 2012, our reviews covered all impaired securities where the loss exceeded $0.5 million and the loss either exceeded 10% of cost or the security had been in a loss position for longer than twelve consecutive months. Our reviews considered the factors described in the “Other-than-temporary Impairments” section in Note 1.
For other-than-temporary impairment losses, we recognize an other-than-temporary impairment loss in earnings in the period that we determine: 1) we intend to sell the security, 2) it is more likely than not that we will be required to sell the security before recovery of its amortized cost basis or 3) the security has a credit loss. Any non-credit portion of the other-than-temporary impairment loss is recognized in shareholders’ equity. We recognized no other-than-temporary impairment losses in 2014 and 2013. In 2012, we recognized $2.0 million of other-than-temporary impairment losses, of which $1.0 million was recognized in other comprehensive income and $1.0 million was recognized in earnings, as reported in our consolidated statement of earnings.
Certain of the securities for which we had previously recognized an other-than-temporary impairment loss had both a credit loss and an impairment loss recorded in other comprehensive income. The balance of these securities was $5.0 million at January 1, 2012. During 2012, we sold all but one of these securities, and sold the remaining security in 2013. No such securities were held at December 31, 2014.
We do not consider the $41.8 million of gross unrealized losses in our portfolio at December 31, 2014 to be other-than-temporary impairments because: 1) as of that date, we had received all contractual interest and principal payments on the fixed maturity securities, 2) we do not intend to sell the securities, 3) it is more likely than not that we will not be required to sell the securities before recovery of their amortized cost or cost bases and 4) the unrealized loss relates to non-credit factors, such as interest rate changes, fluctuations in exchange rates and market conditions.
The change in our unrealized pretax net gains (losses) on investments during each year was as follows:
| 2014 | 2013 | 2012 | ||||||||||
| Available for sale fixed maturity securities |
$ | 156,645 | $ | (324,363 | ) | $ | 91,947 | |||||
| Equity securities |
(47,796 | ) | 44,266 | 8,812 | ||||||||
| Other investments |
- | (2,534 | ) | 4,867 | ||||||||
|
|
|
|
|
|
|
|||||||
| Change in net unrealized investment gains (losses) |
$ | 108,849 | $ | (282,631 | ) | $ | 105,626 | |||||
|
|
|
|
|
|
|
|||||||
F-15
Table of Contents
HCC INSURANCE HOLDINGS, INC. AND SUBSIDIARIES
NOTES TO CONSOLIDATED FINANCIAL STATEMENTS
(tables in thousands, except per share data)
The amortized cost and fair value of our fixed maturity securities at December 31, 2014, by contractual maturity, are shown below. Expected maturities may differ from contractual maturities because borrowers may have the right to call or prepay obligations with or without call or prepayment penalties. The weighted-average life of our mortgage-backed and asset-backed securities was 5.3 years at December 31, 2014.
| Cost or amortized cost |
Fair value | |||||||
| Due in 1 year or less |
$ | 168,246 | $ | 171,070 | ||||
| Due after 1 year through 5 years |
1,150,042 | 1,177,120 | ||||||
| Due after 5 years through 10 years |
1,392,501 | 1,470,264 | ||||||
| Due after 10 years through 15 years |
875,679 | 934,490 | ||||||
| Due after 15 years |
997,752 | 1,057,272 | ||||||
|
|
|
|
|
|||||
| Securities with contractual maturities |
4,584,220 | 4,810,216 | ||||||
| Mortgage-backed and asset-backed securities |
1,768,517 | 1,800,152 | ||||||
|
|
|
|
|
|||||
| Total fixed maturity securities |
$ | 6,352,737 | $ | 6,610,368 | ||||
|
|
|
|
|
|||||
At December 31, 2014, our domestic insurance companies had deposited fixed maturity securities of $39.0 million (amortized cost of $38.7 million) to meet the deposit requirements of various state insurance departments. There are withdrawal and other restrictions on these deposits, but we direct how the deposits are invested and we earn interest on the funds.
The sources of our net investment income were as follows:
| 2014 | 2013 | 2012 | ||||||||||
| Fixed maturity securities |
$ | 210,866 | $ | 212,841 | $ | 221,535 | ||||||
| Equity securities |
16,555 | 14,537 | 3,959 | |||||||||
| Other |
1,434 | 828 | 3,476 | |||||||||
|
|
|
|
|
|
|
|||||||
| Total investment income |
228,855 | 228,206 | 228,970 | |||||||||
| Investment expense |
(7,235 | ) | (8,024 | ) | (6,336 | ) | ||||||
|
|
|
|
|
|
|
|||||||
| Net investment income |
$ | 221,620 | $ | 220,182 | $ | 222,634 | ||||||
|
|
|
|
|
|
|
|||||||
F-16
Table of Contents
HCC INSURANCE HOLDINGS, INC. AND SUBSIDIARIES
NOTES TO CONSOLIDATED FINANCIAL STATEMENTS
(tables in thousands, except per share data)
Realized pretax gains (losses) on the sale of investments, which exclude other-than-temporary impairment credit losses, included the following:
| 2014 | 2013 | 2012 | ||||||||||
| Gains |
||||||||||||
| Fixed maturity securities |
$ | 9,805 | $ | 20,191 | $ | 32,644 | ||||||
| Equity securities |
68,671 | 20,886 | 797 | |||||||||
| Other investments |
- | 5,345 | 2,074 | |||||||||
|
|
|
|
|
|
|
|||||||
| Total gains |
78,476 | 46,422 | 35,515 | |||||||||
|
|
|
|
|
|
|
|||||||
| Losses |
||||||||||||
| Fixed maturity securities |
(5,268 | ) | (1,174 | ) | (3,327 | ) | ||||||
| Equity securities |
(6,838 | ) | (3,218 | ) | (1,039 | ) | ||||||
| Other investments |
- | - | (1 | ) | ||||||||
|
|
|
|
|
|
|
|||||||
| Total losses |
(12,106 | ) | (4,392 | ) | (4,367 | ) | ||||||
|
|
|
|
|
|
|
|||||||
| Net |
||||||||||||
| Fixed maturity securities |
4,537 | 19,017 | 29,317 | |||||||||
| Equity securities |
61,833 | 17,668 | (242 | ) | ||||||||
| Other investments |
- | 5,345 | 2,073 | |||||||||
|
|
|
|
|
|
|
|||||||
| Net realized investment gain |
$ | 66,370 | $ | 42,030 | $ | 31,148 | ||||||
|
|
|
|
|
|
|
|||||||
(3) Fair Value Measurements
Our financial instruments include assets and liabilities carried at fair value, as well as assets and liabilities carried at cost or amortized cost but disclosed at fair value in our financial statements. In determining fair value, we generally apply the market approach, which uses prices and other relevant data based on market transactions involving identical or comparable assets and liabilities. We classify our financial instruments into the following three-level hierarchy:
| • | Level 1 – Inputs are based on quoted prices in active markets for identical instruments. |
| • | Level 2 – Inputs are based on observable market data (other than quoted prices), or are derived from or corroborated by observable market data. |
| • | Level 3 – Inputs are unobservable and not corroborated by market data. |
Our Level 1 investments consist of U.S. Treasuries, money market funds and equity securities traded in an active exchange market. We use unadjusted quoted prices for identical instruments to measure fair value.
Our Level 2 investments include most of our fixed maturity securities, which consist of U.S. government agency securities, foreign government securities, municipal bonds (including those held as restricted securities), corporate debt securities, bank loans, mortgage-backed and asset-backed securities (including collateralized loan obligations), and deposits supporting our Lloyd’s syndicate business. Level 2 also includes certificates of deposit and other interest-bearing deposits at banks, which we report as short-term investments. We measure fair value for the majority of our Level 2 investments using matrix pricing and observable market data, including benchmark securities or yields, reported trades, broker/dealer quotes, issuer spreads, two-sided markets, bids, offers, default rates, loss severity and other economic measures. We measure fair value for our structured securities using observable market data in cash flow models.
F-17
Table of Contents
HCC INSURANCE HOLDINGS, INC. AND SUBSIDIARIES
NOTES TO CONSOLIDATED FINANCIAL STATEMENTS
(tables in thousands, except per share data)
We are responsible for the prices used in our fair value measurements. We use independent pricing services to assist us in determining fair value for 99% of our Level 2 investments. The pricing services provide a single price or quote per security. We use data provided by our third party investment managers and Lloyd’s of London to value the remaining Level 2 investments. To validate that these quoted prices are reasonable estimates of fair value, we perform various quantitative and qualitative procedures, including: 1) evaluation of the underlying methodologies, 2) analysis of recent sales activity, 3) analytical review of our fair values against current market prices and 4) comparison of the pricing services’ fair value to other pricing services’ fair value for the same investment. No markets for our investments were judged to be inactive at year-end. Based on these procedures, we did not adjust the prices or quotes provided by our independent pricing services, third party investment managers or Lloyd’s of London as of December 31, 2014 or 2013.
Our Level 2 financial instruments also include our notes payable. We determine the fair value of our 6.30% Senior Notes based on quoted prices in an inactive market. The fair value of borrowings under our Revolving Loan Facility approximates the carrying amount because interest is based on 30-day LIBOR plus a margin.
Our Level 3 securities include certain fixed maturity securities and an insurance contract that we account for as a derivative and classify in other assets. Our Level 3 category also includes liabilities for future earnout payments due to former owners of businesses we acquired, which are classified within accounts payable and accrued liabilities. We determine fair value of the derivative and the earnout payments based on internally developed models that use assumptions or other data that are not readily observable from objective sources. Fixed maturity securities classified as Level 3 at December 31, 2013 included special purpose revenue bond auction rate securities, which had interest rates that reset at periodic intervals. These securities were thinly traded and observable market data was not readily available. We determined the fair value of these securities using prices quoted by a broker.
F-18
Table of Contents
HCC INSURANCE HOLDINGS, INC. AND SUBSIDIARIES
NOTES TO CONSOLIDATED FINANCIAL STATEMENTS
(tables in thousands, except per share data)
The following tables present the fair value of our financial instruments that were carried or disclosed at fair value. Unless indicated, these items were carried at fair value on our consolidated balance sheets.
| Level 1 | Level 2 | Level 3 | Total | |||||||||||||
| December 31, 2014 |
||||||||||||||||
| Fixed maturity securities |
||||||||||||||||
| U.S. government and government agency securities |
$ | 63,663 | $ | 7,306 | $ | - | $ | 70,969 | ||||||||
| Fixed maturity securities of states, municipalities and political subdivisions |
- | 954,708 | - | 954,708 | ||||||||||||
| Special purpose revenue bonds of states, municipalities and political subdivisions |
- | 2,389,012 | - | 2,389,012 | ||||||||||||
| Corporate securities |
- | 1,276,687 | 148 | 1,276,835 | ||||||||||||
| Residential mortgage-backed securities |
- | 821,694 | - | 821,694 | ||||||||||||
| Commercial mortgage-backed securities |
- | 611,631 | - | 611,631 | ||||||||||||
| Asset-backed securities |
- | 366,827 | - | 366,827 | ||||||||||||
| Foreign government securities |
- | 118,692 | - | 118,692 | ||||||||||||
|
|
|
|
|
|
|
|
|
|||||||||
| Total fixed maturity securities |
63,663 | 6,546,557 | 148 | 6,610,368 | ||||||||||||
| Equity securities |
296,352 | - | - | 296,352 | ||||||||||||
| Short-term investments* |
159,297 | 98,889 | - | 258,186 | ||||||||||||
| Restricted cash and securities |
- | 2,729 | - | 2,729 | ||||||||||||
| Premium, claims and other receivables |
- | 56,493 | - | 56,493 | ||||||||||||
| Other assets |
18 | - | 1,306 | 1,324 | ||||||||||||
|
|
|
|
|
|
|
|
|
|||||||||
| Total assets measured at fair value |
$ | 519,330 | $ | 6,704,668 | $ | 1,454 | $ | 7,225,452 | ||||||||
|
|
|
|
|
|
|
|
|
|||||||||
| Notes payable* |
$ | - | $ | 875,094 | $ | - | $ | 875,094 | ||||||||
| Accounts payable and accrued liabilities – earnout liabilities |
- | 2,729 | 8,744 | 11,473 | ||||||||||||
|
|
|
|
|
|
|
|
|
|||||||||
| Total liabilities measured at fair value |
$ | - | $ | 877,823 | $ | 8,744 | $ | 886,567 | ||||||||
|
|
|
|
|
|
|
|
|
|||||||||
* Carried at cost or amortized cost on consolidated balance sheet.
F-19
Table of Contents
HCC INSURANCE HOLDINGS, INC. AND SUBSIDIARIES
NOTES TO CONSOLIDATED FINANCIAL STATEMENTS
(tables in thousands, except per share data)
| Level 1 | Level 2 | Level 3 | Total | |||||||||||||
| December 31, 2013 |
||||||||||||||||
| Fixed maturity securities |
||||||||||||||||
| U.S. government and government agency securities |
$ | 84,032 | $ | 8,677 | $ | - | $ | 92,709 | ||||||||
| Fixed maturity securities of states, municipalities |
- | 986,486 | - | 986,486 | ||||||||||||
| Special purpose revenue bonds of states, municipalities and political subdivisions |
- | 2,255,928 | 9,267 | 2,265,195 | ||||||||||||
| Corporate securities |
- | 1,225,088 | 150 | 1,225,238 | ||||||||||||
| Residential mortgage-backed securities |
- | 618,119 | - | 618,119 | ||||||||||||
| Commercial mortgage-backed securities |
- | 504,888 | - | 504,888 | ||||||||||||
| Asset-backed securities |
- | 182,392 | - | 182,392 | ||||||||||||
| Foreign government securities |
- | 147,446 | - | 147,446 | ||||||||||||
|
|
|
|
|
|
|
|
|
|||||||||
| Total fixed maturity securities |
84,032 | 5,929,024 | 9,417 | 6,022,473 | ||||||||||||
| Equity securities |
517,466 | - | - | 517,466 | ||||||||||||
| Short-term investments* |
68,958 | 109,795 | - | 178,753 | ||||||||||||
| Restricted cash and securities |
- | 1,853 | - | 1,853 | ||||||||||||
| Premium, claims and other receivables |
- | 66,515 | - | 66,515 | ||||||||||||
| Other assets |
20 | - | 941 | 961 | ||||||||||||
|
|
|
|
|
|
|
|
|
|||||||||
| Total assets measured at fair value |
$ | 670,476 | $ | 6,107,187 | $ | 10,358 | $ | 6,788,021 | ||||||||
|
|
|
|
|
|
|
|
|
|||||||||
| Notes payable* |
$ | - | $ | 707,656 | $ | - | $ | 707,656 | ||||||||
| Accounts payable and accrued liabilities – earnout liability |
- | 1,853 | 7,259 | 9,112 | ||||||||||||
|
|
|
|
|
|
|
|
|
|||||||||
| Total liabilities measured at fair value |
$ | - | $ | 709,509 | $ | 7,259 | $ | 716,768 | ||||||||
|
|
|
|
|
|
|
|
|
|||||||||
* Carried at cost or amortized cost on consolidated balance sheet.
F-20
Table of Contents
HCC INSURANCE HOLDINGS, INC. AND SUBSIDIARIES
NOTES TO CONSOLIDATED FINANCIAL STATEMENTS
(tables in thousands, except per share data)
The following table presents the changes in fair value of our Level 3 financial instruments.
| Fixed maturity securities |
Other assets | Total assets | Accounts payable and accrued liabilities |
|||||||||||||
| Balance at December 31, 2012 |
$ | 164 | $ | 349 | $ | 513 | $ | 7,009 | ||||||||
| Purchases |
9,430 | - | 9,430 | - | ||||||||||||
| Gains (losses) reported in: |
||||||||||||||||
| Net earnings |
54 | 592 | 646 | (250 | ) | |||||||||||
| Other comprehensive loss |
(231 | ) | - | (231 | ) | - | ||||||||||
|
|
|
|
|
|
|
|
|
|||||||||
| Balance at December 31, 2013 |
9,417 | 941 | 10,358 | 7,259 | ||||||||||||
| Sales or settlements |
(9,859 | ) | - | (9,859 | ) | (61 | ) | |||||||||
| Increase in earnout liabilities |
- | - | - | 1,588 | ||||||||||||
| Gains (losses) reported in: |
||||||||||||||||
| Net earnings |
375 | 365 | 740 | (258 | ) | |||||||||||
| Other comprehensive income |
215 | - | 215 | - | ||||||||||||
| Transfers out of Level 3 |
- | - | - | (300 | ) | |||||||||||
|
|
|
|
|
|
|
|
|
|||||||||
| Balance at December 31, 2014 |
$ | 148 | $ | 1,306 | $ | 1,454 | $ | 8,744 | ||||||||
|
|
|
|
|
|
|
|
|
|||||||||
In 2014, we transferred an earnout liability from Level 3 to Level 2 because the earnout was attained and the funds held as collateral were deposited in restricted cash and securities. There were no transfers between Level 1, Level 2 or Level 3 in 2013.
F-21
Table of Contents
HCC INSURANCE HOLDINGS, INC. AND SUBSIDIARIES
NOTES TO CONSOLIDATED FINANCIAL STATEMENTS
(tables in thousands, except per share data)
(4) Reinsurance
In the normal course of business, our insurance companies cede a portion of their premium to reinsurers through treaty and facultative reinsurance agreements. Although reinsurance does not discharge the direct insurer from liability to its policyholder, our insurance companies participate in such agreements in order to limit their loss exposure, protect them against catastrophic losses and diversify their business. The following tables present the effect of such reinsurance transactions on our premium, loss and loss adjustment expense and policy acquisition costs.
| 2014 | 2013 | 2012 | ||||||||||
| Direct written premium |
$ | 2,689,478 | $ | 2,545,054 | $ | 2,422,517 | ||||||
| Reinsurance assumed |
312,140 | 335,195 | 361,556 | |||||||||
| Reinsurance ceded |
(628,373) | (624,926) | (530,677) | |||||||||
|
|
|
|
|
|
|
|||||||
| Net written premium |
$ | 2,373,245 | $ | 2,255,323 | $ | 2,253,396 | ||||||
|
|
|
|
|
|
|
|||||||
| Direct earned premium |
$ | 2,633,433 | $ | 2,482,527 | $ | 2,396,756 | ||||||
| Reinsurance assumed |
306,896 | 333,344 | 351,611 | |||||||||
| Reinsurance ceded |
(616,702) | (576,631) | (505,742) | |||||||||
|
|
|
|
|
|
|
|||||||
| Net earned premium |
$ | 2,323,627 | $ | 2,239,240 | $ | 2,242,625 | ||||||
|
|
|
|
|
|
|
|||||||
| Direct loss and loss adjustment expense |
$ | 1,551,700 | $ | 1,616,097 | $ | 1,467,393 | ||||||
| Reinsurance assumed |
119,980 | 151,145 | 162,534 | |||||||||
| Reinsurance ceded |
(344,845) | (444,788) | (291,853) | |||||||||
|
|
|
|
|
|
|
|||||||
| Net loss and loss adjustment expense |
$ | 1,326,835 | $ | 1,322,454 | $ | 1,338,074 | ||||||
|
|
|
|
|
|
|
|||||||
| Policy acquisition costs |
$ | 445,794 | $ | 413,782 | $ | 398,453 | ||||||
| Ceding commissions |
(151,124) | (134,343) | (117,252) | |||||||||
|
|
|
|
|
|
|
|||||||
| Net policy acquisition costs |
$ | 294,670 | $ | 279,439 | $ | 281,201 | ||||||
|
|
|
|
|
|
|
|||||||
The table below shows the components of our reinsurance recoverables in our consolidated balance sheets at December 31, 2014 and 2013.
| 2014 | 2013 | |||||||
| Reinsurance recoverable on paid losses |
$ | 99,937 | $ | 156,026 | ||||
| Reinsurance recoverable on outstanding losses |
443,059 | 459,134 | ||||||
| Reinsurance recoverable on incurred but not reported losses |
627,404 | 663,597 | ||||||
| Reserve for uncollectible reinsurance |
(1,500) | (1,500) | ||||||
|
|
|
|
|
|||||
| Total reinsurance recoverables |
$ | 1,168,900 | $ | 1,277,257 | ||||
|
|
|
|
|
|||||
F-22
Table of Contents
HCC INSURANCE HOLDINGS, INC. AND SUBSIDIARIES
NOTES TO CONSOLIDATED FINANCIAL STATEMENTS
(tables in thousands, except per share data)
In order to reduce our exposure to reinsurance credit risk, we evaluate the financial condition of our reinsurers and place our reinsurance with a diverse group of companies and syndicates, which we believe to be financially sound. Our recoverables are due principally from highly-rated reinsurers. The following table shows reinsurance balances with our reinsurers that had a net recoverable balance greater than $30.0 million at December 31, 2014 and 2013. The companies’ ratings were the latest published by A.M. Best Company, Inc. as of February 13, 2015 (for 2014) and February 14, 2014 (for 2013). The total recoverables column includes paid losses recoverable, outstanding losses recoverable and incurred but not reported losses recoverable. The total credits column includes letters of credit and cash that are available to us as collateral, as well as amounts we owe reinsurers that can be offset against amounts due to us.
|
Reinsurer |
Rating | Location | Total recoverables |
Total credits |
Net recoverables |
|||||||||||
| December 31, 2014 |
||||||||||||||||
| Transatlantic Reinsurance Company |
A | New York | $ | 157,349 | $ | 8,063 | $ | 149,286 | ||||||||
| Axis Reinsurance Company |
A+ | New York | 103,836 | 12,593 | 91,243 | |||||||||||
| Hannover Rück SE |
A+ | Germany | 107,125 | 18,468 | 88,657 | |||||||||||
| ACE Property & Casualty Insurance Company |
A++ | Pennsylvania | 58,996 | 5,552 | 53,444 | |||||||||||
| Swiss Reinsurance America Corporation |
A+ | New York | 45,756 | 5,314 | 40,442 | |||||||||||
| Arch Reinsurance Company |
A+ | Nebraska | 37,172 | 602 | 36,570 | |||||||||||
| December 31, 2013 |
||||||||||||||||
| Transatlantic Reinsurance Company |
A | New York | $ | 172,165 | $ | 18,196 | $ | 153,969 | ||||||||
| Hannover Rück SE |
A+ | Germany | 128,518 | 20,559 | 107,959 | |||||||||||
| Axis Reinsurance Company |
A+ | New York | 92,562 | 11,983 | 80,579 | |||||||||||
| ACE Property & Casualty Insurance Company |
A+ | Pennsylvania | 67,742 | 4,267 | 63,475 | |||||||||||
| Arch Reinsurance Company |
A+ | Nebraska | 40,481 | 3,693 | 36,788 | |||||||||||
HCC Life Insurance Company previously sold its entire block of individual life insurance and annuity business to Swiss Re Life & Health America, Inc. (rated “A+” by A.M. Best Company, Inc.) in the form of an indemnity reinsurance contract. Ceded life and annuity benefits included in our consolidated balance sheets at December 31, 2014 and 2013 were $48.5 million and $56.5 million, respectively.
At each quarter end, we review our financial exposure to the reinsurance market based on our individual reinsurance recoverable balances as of the prior quarter end. We take actions to collect outstanding balances or to mitigate our exposure to possible loss. We had a $1.5 million reserve for potentially uncollectible amounts in 2014 and 2013. Reinsurance recoverables related to our settlement of Spanish surety bond claims totaled $107.7 million at December 31, 2014, including $49.9 million on paid losses. Our reinsurers have paid our reinsurance claims related to Spanish surety bonds in full on a timely basis, with the exception of a small number of reinsurers that are currently in run-off and disputing balances owed us. Recoverables from these run-off reinsurers totaled $46.2 million, including $39.4 million on paid losses, at December 31, 2014. No payments have been received from these reinsurers despite their participation in substantially the same contracts and terms of our other reinsurers. We are vigorously pursuing collection of these recoverables, including through arbitration where necessary, and believe these amounts are fully recoverable. Accordingly, we have not recorded a reserve for uncollectibility related to these amounts. While we believe our reserve at year-end 2014 is adequate based on information currently available, market conditions may change or additional information might be obtained that may require us to change the reserve in the future.
F-23
Table of Contents
HCC INSURANCE HOLDINGS, INC. AND SUBSIDIARIES
NOTES TO CONSOLIDATED FINANCIAL STATEMENTS
(tables in thousands, except per share data)
Reinsurers not authorized by the respective states of domicile of our U.S. domiciled insurance companies are required to collateralize reinsurance obligations due to us. The table below shows, at December 31, 2014 and 2013, the amounts of letters of credit and cash that are available to us as collateral, as well as amounts we owe reinsurers that can be offset against amounts due to us.
| 2014 | 2013 | |||||||
| Payables to reinsurers |
$ | 172,871 | $ | 208,850 | ||||
| Letters of credit |
96,895 | 100,529 | ||||||
| Funds held in trust |
133,981 | 88,310 | ||||||
|
|
|
|
|
|||||
| Total credits |
$ | 403,747 | $ | 397,689 | ||||
|
|
|
|
|
|||||
(5) Acquisitions and Goodwill
Acquisitions
Effective January 1, 2015, we completed the acquisition of all of the capital stock of Producers Ag Insurance Group, Inc. (ProAg) from CUNA Mutual Group for $104.5 million cash. ProAg writes multi-peril crop, crop hail, named peril and livestock insurance.
In 2014, we acquired an agency for $6.4 million cash and a contingent earnout for a three-year period. We recognized $7.0 million of goodwill related to this acquisition.
Goodwill
The goodwill balances by reportable segment and the changes in goodwill are shown in the table below.
| U.S. Property & Casualty |
Professional Liability |
Accident & Health |
U.S. Surety & Credit |
International | Total | |||||||||||||||||||
| Balance at December 31, 2012 |
$ | 223,000 | $ | 314,089 | $ | 144,113 | $ | 79,700 | $ | 124,958 | $ | 885,860 | ||||||||||||
| Earnout and other |
- | 9,104 | - | - | 236 | 9,340 | ||||||||||||||||||
|
|
|
|
|
|
|
|
|
|
|
|
|
|||||||||||||
| Balance at December 31, 2013 |
223,000 | 323,193 | 144,113 | 79,700 | 125,194 | 895,200 | ||||||||||||||||||
| Acquisition |
- | - | - | 6,996 | - | 6,996 | ||||||||||||||||||
| Earnout and other |
- | 4,131 | - | - | (691) | 3,440 | ||||||||||||||||||
|
|
|
|
|
|
|
|
|
|
|
|
|
|||||||||||||
| Balance at December 31, 2014 |
$ | 223,000 | $ | 327,324 | $ | 144,113 | $ | 86,696 | $ | 124,503 | $ | 905,636 | ||||||||||||
|
|
|
|
|
|
|
|
|
|
|
|
|
|||||||||||||
We acquired HCC Global Financial Products, which underwrites our U.S. and International directors’ and officers’ liability business in our Professional Liability segment, in 2002. The purchase agreement includes a contingency for future earnout payments based on the settlement of claims. The ultimate total net earnout cannot be finally determined until all claims are settled or paid. All adjustments to the ultimate purchase price have been, or will be, recorded to goodwill.
F-24
Table of Contents
HCC INSURANCE HOLDINGS, INC. AND SUBSIDIARIES
NOTES TO CONSOLIDATED FINANCIAL STATEMENTS
(tables in thousands, except per share data)
(6) Liability for Unpaid Loss and Loss Adjustment Expense
The table below provides a reconciliation of our liability for loss and loss adjustment expense payable (referred to as reserves) at December 31, 2014, 2013 and 2012.
| 2014 | 2013 | 2012 | ||||||||||
| Reserves at beginning of year |
$ | 3,902,132 | $ | 3,767,850 | $ | 3,658,317 | ||||||
| Less reinsurance recoverables on reserves |
1,122,731 | 1,018,047 | 974,834 | |||||||||
|
|
|
|
|
|
|
|||||||
| Net reserves at beginning of year |
2,779,401 | 2,749,803 | 2,683,483 | |||||||||
| Net reserve additions from acquired businesses |
- | - | 14,705 | |||||||||
| Net loss and loss adjustment expense: |
||||||||||||
| Provision for loss and loss adjustment expense for claims occurring |
1,383,192 | 1,396,196 | 1,408,085 | |||||||||
| Decrease in estimated loss and loss adjustment expense for claims occurring in prior years |
(56,357) | (73,742) | (70,011) | |||||||||
|
|
|
|
|
|
|
|||||||
| Net loss and loss adjustment expense |
1,326,835 | 1,322,454 | 1,338,074 | |||||||||
|
|
|
|
|
|
|
|||||||
| Net loss and loss adjustment expense payments for claims occurring during: |
||||||||||||
| Current year |
543,605 | 562,049 | 575,573 | |||||||||
| Prior years |
856,896 | 736,351 | 729,335 | |||||||||
|
|
|
|
|
|
|
|||||||
| Net loss and loss adjustment expense payments |
1,400,501 | 1,298,400 | 1,304,908 | |||||||||
|
|
|
|
|
|
|
|||||||
| Foreign currency adjustment |
(48,113) | 5,544 | 18,449 | |||||||||
|
|
|
|
|
|
|
|||||||
| Net reserves at end of year |
2,657,622 | 2,779,401 | 2,749,803 | |||||||||
| Plus reinsurance recoverables on reserves |
1,070,463 | 1,122,731 | 1,018,047 | |||||||||
|
|
|
|
|
|
|
|||||||
| Reserves at end of year |
$ | 3,728,085 | $ | 3,902,132 | $ | 3,767,850 | ||||||
|
|
|
|
|
|
|
|||||||
| The table below details our loss and loss adjustment expense on a consolidated basis, as well as the net (favorable) adverse loss development by segment. | ||||||||||||
| 2014 | 2013 | 2012 | ||||||||||
| Net (favorable) adverse loss development |
||||||||||||
| U.S. Property & Casualty |
$ | (41,560 | ) | $ | (39,363 | ) | $ | 2,321 | ||||
| Professional Liability |
973 | (26,346 | ) | (25,897 | ) | |||||||
| Accident & Health |
(13,086 | ) | (18,027 | ) | (10,511 | ) | ||||||
| U.S. Surety & Credit |
(22,629 | ) | (37,898 | ) | (25,377 | ) | ||||||
| International |
25,050 | 43,805 | (10,084 | ) | ||||||||
| Exited Lines |
(5,105 | ) | 4,087 | (463 | ) | |||||||
|
|
|
|
|
|
|
|||||||
| Total net favorable loss development |
(56,357 | ) | (73,742 | ) | (70,011 | ) | ||||||
| Accident year catastrophe losses |
28,683 | 55,939 | 52,390 | |||||||||
| All other net loss and loss adjustment expense |
1,354,509 | 1,340,257 | 1,355,695 | |||||||||
|
|
|
|
|
|
|
|||||||
| Net loss and loss adjustment expense |
$ | 1,326,835 | $ | 1,322,454 | $ | 1,338,074 | ||||||
|
|
|
|
|
|
|
|||||||
F-25
Table of Contents
HCC INSURANCE HOLDINGS, INC. AND SUBSIDIARIES
NOTES TO CONSOLIDATED FINANCIAL STATEMENTS
(tables in thousands, except per share data)
Loss development represents an increase or decrease in estimates of ultimate losses related to business written in prior accident years. We record such increases or decreases as loss and loss adjustment expense in the current reporting year. Favorable development means our original ultimate loss estimate was higher than the current estimate. Adverse development means the current ultimate loss estimate is higher than our original estimate. Loss development occurs as we review our loss exposure with our actuaries, increasing or decreasing estimates of our ultimate losses as a result of such reviews, and as losses are finally settled or claims exposure changes.
Based on our annual review of reserves in our five insurance underwriting segments and in our Exited Lines, we recognized net favorable loss development of $56.4 million, $73.7 million and $70.0 in 2014, 2013, and 2012, respectively. These amounts included favorable development of $5.9 million, $7.3 million and $21.4 million, respectively, from the release of prior years’ catastrophe reserves. The primary drivers of development in each year by segment are described below.
U.S. Property & Casualty
Net favorable loss development of $41.6 million in 2014 was due to better than expected loss experience, primarily in underwriting years 2012 and prior, compared to the 2013 annual reserve review. The majority of the development related to various liability lines of business ($18.7 million), our aviation business ($9.0 million) and a run-off assumed quota share contract that we wrote from 2003 – 2008 ($5.0 million).
Net favorable development of $39.4 million in 2013 was due to better than expected experience, primarily in underwriting years 2011 and prior, compared to the 2012 reserve review. This amount included $17.0 million of favorable development related to the run-off assumed quota share contract, where expected ultimate losses have continued to decline. In addition, we recognized $5.8 million of favorable development related to our errors and omissions (E&O) business.
In 2012, the segment recognized net adverse development of $2.3 million, which included adverse development of $8.1 million in our public risk business and $7.0 million in our E&O business, partially offset by $5.6 million of favorable development in the run-off assumed quota share contract. The adverse development, which impacted underwriting years 2010 and prior for public risk and 2011 and prior for E&O, was based on higher than expected losses compared to our 2011 reserve review.
Professional Liability
In 2014, we recognized minimal loss development based on our annual review of reserves.
Net favorable development of $26.3 million in 2013 was due to better than expected loss experience, compared to the 2012 reserve review. This development included reserve releases related to underwriting years prior to 2007 as well as 2009 and 2010 (totaling $64.2 million), partially offset by reserve strengthening of $37.9 million in underwriting years 2007 and 2008, which were impacted by the worldwide financial crisis.
Net favorable development of $25.9 million in 2012 included reserve releases of $62.1 million due to better than expected loss experience, compared to the 2011 reserve review. This development related to underwriting years prior to 2007 and was partially offset by reserve strengthening in underwriting year 2008.
Accident & Health
The segment recognized net favorable development as follows: 1) 2014 – $13.1 million related to underwriting years 2012 and 2013, 2) 2013 – $18.0 million related to underwriting years 2011 and 2012 and 3) 2012 – $10.5 million related to underwriting year 2011. Our review of the segment’s reserves indicated better than expected claims activity in our medical stop-loss product.
F-26
Table of Contents
HCC INSURANCE HOLDINGS, INC. AND SUBSIDIARIES
NOTES TO CONSOLIDATED FINANCIAL STATEMENTS
(tables in thousands, except per share data)
U.S. Surety & Credit
The segment recognized net favorable development as follows: 1) 2014 – $20.3 million related to surety and $2.3 million related to credit, 2) 2013 – $20.6 million for surety and $17.3 million for credit and 3) 2012 – $18.0 million for surety and $7.4 million for credit. Our review of the segment’s reserves indicated better experience than our actuarial expectations in each year’s review compared to the prior year review.
International
In 2014, the segment’s $25.1 million net adverse loss development primarily related to $44.1 million of adverse development for the surety & credit line of business, partially offset by net favorable development in various lines of business and a $5.4 million reduction of prior years’ catastrophe reserves. In the third quarter of 2014, we increased our reserves on a specific class of Spanish surety bonds to reflect our revised estimates of our liability under these bonds in light of our settlement of a majority of the outstanding claims during that quarter. The segment’s favorable development primarily related to our energy, property treaty and liability lines, which had better than expected loss experience in underwriting years 2013 and prior, compared to our annual 2013 reserve review. The net favorable development related to catastrophe reserves was primarily due to reserve releases for the 2013 European floods ($6.0 million), partially offset by reserve increases for the 2011 Denmark storms ($1.5 million).
In 2013, the segment’s net adverse development of $43.8 million was due to reserve strengthening in the surety & credit line of business, partially offset by net favorable development in other lines of business, primarily energy and liability. For surety & credit, we increased our reserves by $70.3 million on the Spanish surety bonds discussed above. The increase was made to reflect our revised estimates of our liability under these bonds in light of an adverse Spanish Supreme Court ruling published in 2013. We recognized net favorable development of $10.1 million in energy and $16.1 million in our U.K. professional liability products based on better than expected loss experience primarily in underwriting years 2011 and prior, compared to our 2012 reserve review. In addition, we recognized favorable development related to our release of catastrophe reserves for Superstorm Sandy ($3.4 million) and the 2010 New Zealand earthquake ($2.3 million), due to lower than expected losses.
The segment’s $10.1 million of net favorable development in 2012 included $59.0 million of net favorable development, primarily related to the liability and energy lines, partially offset by $48.9 million of adverse development related to the Spanish surety bonds. The adverse development was based on management’s evaluation of the claims and the likelihood that we would ultimately be required to pay the claims, based on information available at that time. The segment’s net favorable development related to better than expected experience in underwriting years 2011 and prior and also included $18.9 million of catastrophe reserve releases, primarily for Hurricane Irene ($10.7 million) and the Japan earthquake and tsunami ($4.6 million).
F-27
Table of Contents
HCC INSURANCE HOLDINGS, INC. AND SUBSIDIARIES
NOTES TO CONSOLIDATED FINANCIAL STATEMENTS
(tables in thousands, except per share data)
(7) Notes Payable
Our notes payable consisted of the following at December 31, 2014 and 2013.
| 2014 | 2013 | |||||||
| 6.30% Senior Notes |
$ | 299,251 | $ | 299,098 | ||||
| Revolving Loan Facility |
525,000 | 355,000 | ||||||
|
|
|
|
|
|||||
| Total notes payable |
$ | 824,251 | $ | 654,098 | ||||
|
|
|
|
|
|||||
The estimated fair value of our Senior Notes was $350.1 million at December 31, 2014 and $352.7 million at December 31, 2013, based on quoted market prices. The estimated fair value of our Revolving Loan Facility approximated the carrying value at December 31, 2014 and 2013, based on borrowing rates offered to us at that time.
Senior Notes
Our $300.0 million 6.30% Senior Notes due 2019 were issued in 2009 at a discount of $1.5 million, for an effective interest rate of 6.37%. We pay interest semi-annually in arrears on May 15 and November 15. The Senior Notes are unsecured and subordinated general obligations of HCC. The Senior Notes may be redeemed in whole at any time or in part from time to time, at our option, at the redemption price determined in the manner described in the indenture governing the Senior Notes. The indenture contains covenants that impose conditions on our ability to create liens on the capital stock of our restricted subsidiaries (as defined in the indenture) or to engage in sales of the capital stock of our restricted subsidiaries. We were in compliance with these covenants at December 31, 2014.
Revolving Loan Facility
On April 30, 2014, we entered into an agreement to modify our $600.0 million Revolving Loan Facility (Facility) to increase the borrowing capacity to $825.0 million and extend the term to April 30, 2019, among other changes. The Facility allows us to borrow up to the maximum allowed on a revolving basis until the Facility expires. The borrowing rate is LIBOR plus 125 basis points, subject to increase or decrease based on changes in our debt rating. The weighted-average interest rate on borrowings under the Facility at December 31, 2014 was 1.4%. In addition, we pay an annual commitment fee of 15 basis points on the unused balance of the Facility. The borrowings and letters of credit issued under the Facility reduced our available borrowing capacity on the Facility to $294.1 million at December 31, 2014. The Facility contains two restrictive financial covenants that require HCC to maintain a minimum consolidated net worth and a maximum leverage ratio of 35%. We were in compliance with these covenants at December 31, 2014. In addition, HCC is restricted from paying annual dividends in excess of the greater of $150.0 million or 33% of our prior year’s net earnings.
Subsidiary Letters of Credit
At December 31, 2014, certain of our subsidiaries had outstanding letters of credit with banks totaling $6.3 million. Of this amount, $5.9 million of outstanding letters of credit reduced our borrowing capacity under the Facility at year-end 2014.
Standby Letter of Credit Facility
We had a $90.0 million Standby Letter of Credit Facility (Standby Facility) that was used to guarantee our performance in our Lloyd’s of London Syndicate, which was scheduled to expire on December 31, 2017. In December 2014, we internally funded the guarantee, cancelled all letters of credit issued under the Standby Facility and terminated the Standby Facility. We paid an annual fee of 105 basis points for the Standby Facility in 2014.
F-28
Table of Contents
HCC INSURANCE HOLDINGS, INC. AND SUBSIDIARIES
NOTES TO CONSOLIDATED FINANCIAL STATEMENTS
(tables in thousands, except per share data)
(8) Income Taxes
At December 31, 2014 and 2013, we had current income taxes payable of $27.9 million and $2.0 million, respectively, included in accounts payable and accrued liabilities in the consolidated balance sheets.
The following table summarizes the differences between our effective tax rate for financial statement purposes and the Federal statutory rate.
| 2014 | 2013 | 2012 | ||||||||||
| Statutory tax rate |
35.0 | % | 35.0 | % | 35.0 | % | ||||||
|
|
|
|
|
|
|
|||||||
| Federal tax at statutory rate |
$ | 231,643 | $ | 200,448 | $ | 194,049 | ||||||
| Nontaxable municipal bond interest and dividend received deduction |
(35,166 | ) | (34,734 | ) | (31,939 | ) | ||||||
| State income taxes, net of federal tax benefit |
2,135 | 2,097 | 3,619 | |||||||||
| Foreign income taxes |
42,093 | 42,691 | 40,703 | |||||||||
| Foreign tax credit |
(42,093 | ) | (42,691 | ) | (40,703 | ) | ||||||
| Uncertain tax positions (net of federal tax benefit on state positions: $223 in 2014, $340 in 2013 and $719 in 2012) |
1,091 | 518 | 878 | |||||||||
| Other, net |
3,790 | (2,816 | ) | (3,420 | ) | |||||||
|
|
|
|
|
|
|
|||||||
| Income tax expense |
$ | 203,493 | $ | 165,513 | $ | 163,187 | ||||||
|
|
|
|
|
|
|
|||||||
| Effective tax rate |
30.7 | % | 28.9 | % | 29.4 | % | ||||||
|
|
|
|
|
|
|
|||||||
| The components of income tax expense were as follows: | ||||||||||||
| 2014 | 2013 | 2012 | ||||||||||
| Federal current |
$ | 126,442 | $ | 117,933 | $ | 94,493 | ||||||
| Federal deferred |
30,359 | 804 | 20,827 | |||||||||
|
|
|
|
|
|
|
|||||||
| Total federal |
156,801 | 118,737 | 115,320 | |||||||||
|
|
|
|
|
|
|
|||||||
| State current |
1,740 | 2,649 | 2,570 | |||||||||
| State deferred |
1,545 | 578 | 2,997 | |||||||||
|
|
|
|
|
|
|
|||||||
| Total state |
3,285 | 3,227 | 5,567 | |||||||||
|
|
|
|
|
|
|
|||||||
| Foreign current |
35,243 | 37,978 | 34,678 | |||||||||
| Foreign deferred |
6,850 | 4,713 | 6,025 | |||||||||
|
|
|
|
|
|
|
|||||||
| Total foreign |
42,093 | 42,691 | 40,703 | |||||||||
|
|
|
|
|
|
|
|||||||
| Uncertain tax positions |
1,314 | 858 | 1,597 | |||||||||
|
|
|
|
|
|
|
|||||||
| Income tax expense |
$ | 203,493 | $ | 165,513 | $ | 163,187 | ||||||
|
|
|
|
|
|
|
|||||||
F-29
Table of Contents
HCC INSURANCE HOLDINGS, INC. AND SUBSIDIARIES
NOTES TO CONSOLIDATED FINANCIAL STATEMENTS
(tables in thousands, except per share data)
The net deferred tax liability is included in accounts payable and accrued liabilities in our consolidated balance sheets. The deferred tax liability that related to the book over tax basis of our foreign subsidiaries at December 31, 2014 and 2013 was based on the assumption that we will merge certain subsidiaries in our International operations. The composition of deferred tax assets and liabilities at December 31, 2014 and 2013 was as follows:
| 2014 | 2013 | |||||||
| Excess of financial statement unearned premium over tax |
$ | 30,225 | $ | 26,821 | ||||
| Discounting of loss reserves, net of salvage and subrogation |
40,046 | 50,481 | ||||||
| Excess of financial statement accrued expenses over tax |
20,103 | 18,920 | ||||||
| Allowance for bad debts, not deductible for tax |
2,427 | 3,146 | ||||||
| Stock-based compensation expense in excess of deduction for tax |
8,919 | 5,163 | ||||||
| Financial statement loss for Lloyd’s syndicates in excess of deduction for tax |
- | 351 | ||||||
| Federal tax net operating loss carryforwards |
2,983 | 3,202 | ||||||
| State tax net operating loss carryforwards |
441 | 181 | ||||||
| Foreign tax net operating loss carryforwards |
20,008 | 22,605 | ||||||
| Federal benefit of state uncertain tax positions |
1,705 | 1,482 | ||||||
| Valuation allowance |
(25,050) | (27,430 | ) | |||||
|
|
|
|
|
|||||
| Total deferred tax assets |
101,807 | 104,922 | ||||||
|
|
|
|
|
|||||
| Unrealized gain on increase in value of securities |
91,515 | 52,424 | ||||||
| Deferred policy acquisition costs, net of ceding commissions, deductible for tax |
15,764 | 14,570 | ||||||
| Amortizable goodwill for tax |
123,017 | 110,064 | ||||||
| Financial statement income for Lloyd’s syndicates in excess of taxable income |
7,143 | - | ||||||
| Book basis in net assets of foreign subsidiaries in excess of tax basis |
23,075 | 2,414 | ||||||
| Depreciation and other items |
12,676 | 14,458 | ||||||
|
|
|
|
|
|||||
| Total deferred tax liabilities |
273,190 | 193,930 | ||||||
|
|
|
|
|
|||||
| Net deferred tax liability |
$ | (171,383) | $ | (89,008 | ) | |||
|
|
|
|
|
|||||
Changes in the valuation allowance account applicable to deferred tax assets relate primarily to net operating losses in various foreign and state tax jurisdictions. Changes in the valuation allowance were as follows:
| 2014 | 2013 | 2012 | ||||||||||
| Balance at beginning of year |
$ | 27,430 | $ | 9,187 | $ | 7,983 | ||||||
| State net operating loss carryforwards |
260 | (2,228) | (651) | |||||||||
| Foreign net operating loss carryforwards |
(3,232) | 20,207 | 296 | |||||||||
| Other |
592 | 264 | 1,559 | |||||||||
|
|
|
|
|
|
|
|||||||
| Balance at December 31 |
$ | 25,050 | $ | 27,430 | $ | 9,187 | ||||||
|
|
|
|
|
|
|
|||||||
F-30
Table of Contents
HCC INSURANCE HOLDINGS, INC. AND SUBSIDIARIES
NOTES TO CONSOLIDATED FINANCIAL STATEMENTS
(tables in thousands, except per share data)
At December 31, 2014, we had Federal, state and Spanish tax net operating loss carryforwards of approximately $8.5 million, $17.6 million and $71.7 million, respectively, which will expire in varying amounts through 2034. We had $11.7 million of additional foreign net operating losses in the U.K., France and Ireland that can be carried forward indefinitely. Future use of our $8.5 million Federal loss carryforward is subject to statutory limitations due to a prior ownership change. We have recorded valuation allowances of $5.0 million and $20.0 million against our state and Spanish loss carryforwards, respectively. Based on our history of taxable income in our domestic insurance and other operations, we believe it is more likely than not that the deferred tax assets related to net operating loss carryforwards, excluding amounts covered by valuation allowances, will be realized.
At December 31, 2014 and 2013, we had recorded tax liabilities for unrecognized gross tax benefits related to uncertain tax positions of $6.3 million and $5.0 million, respectively. If the uncertain tax benefits as of year-end 2014 had been recognized in 2014, the total amount of such benefits would have reduced our 2014 income tax expense and our effective tax rate. At December 31, 2014, it is reasonably possible that liabilities for unrecognized tax benefits could decrease $0.1 million (including no interest or penalties) in the next twelve months, due to the expiration of statutes of limitation.
The changes in our liability for unrecognized gross tax benefits were as follows:
| 2014 | 2013 | 2012 | ||||||||||
| Balance at beginning of year |
$ | 5,003 | $ | 4,129 | $ | 2,522 | ||||||
| Gross increases |
||||||||||||
| Tax position of current year |
593 | 632 | 145 | |||||||||
| Tax positions of prior years |
825 | 506 | 2,988 | |||||||||
| Gross decreases |
||||||||||||
| Statute expirations |
(151) | (264) | (713) | |||||||||
| Settlements |
- | - | (404) | |||||||||
| Tax positions of prior years |
- | - | (409) | |||||||||
|
|
|
|
|
|
|
|||||||
| Balance at December 31 |
$ | 6,270 | $ | 5,003 | $ | 4,129 | ||||||
|
|
|
|
|
|
|
|||||||
We report any potential net interest income and expense and penalties related to changes in our uncertain tax positions in our consolidated statements of earnings as interest expense and other operating expense, respectively. We recognized net interest expense of $0.7 million in 2014, $0.3 million in 2013 and $0.5 million in 2012, and no penalties in any year. At December 31, 2014, we had no accrual for penalties and $1.9 million for interest payable.
We file income tax returns in the U.S. Federal jurisdiction, and various state and foreign jurisdictions. With a few exceptions, we are no longer subject to U.S. Federal, state and local, or foreign income tax examinations by tax authorities for years before 2009. We currently are not under U.S. Federal examination. Our income tax returns for New York (2007 – 2012), Massachusetts (2009 – 2010), Illinois (2009 – 2011), California (2011 – 2012), Spain (2009 – 2010) and France (2011 – 2013) are currently under audit. While we cannot predict the outcome of these audits, we do not anticipate the results to have a material effect on our consolidated financial position, results of operations or cash flows.
F-31
Table of Contents
HCC INSURANCE HOLDINGS, INC. AND SUBSIDIARIES
NOTES TO CONSOLIDATED FINANCIAL STATEMENTS
(tables in thousands, except per share data)
(9) Shareholders’ Equity
Treasury Stock
We purchased our common stock as follows:
| 2014 | 2013 | 2012 | ||||||||||
| Shares of common stock |
4,710 | 1,055 | 5,567 | |||||||||
| Total cost |
$ | 224,706 | $ | 42,212 | $ | 178,669 | ||||||
| Weighted-average cost per share |
$ | 47.70 | $ | 40.02 | $ | 32.09 | ||||||
Dividends
U.S. insurance companies are limited in the amount of dividends they can pay to their parent by the laws of their state of domicile. The maximum dividends that our direct domestic insurance subsidiaries can pay in 2015 without special permission is $235.2 million.
Accumulated Other Comprehensive Income
The components of accumulated other comprehensive income in our consolidated balance sheets were as follows:
| Net unrealized investment gains (losses) |
Foreign currency translation adjustment |
Accumulated other comprehensive income |
||||||||||
| Balance at December 31, 2011 |
$ | 213,114 | $ | 14,545 | $ | 227,659 | ||||||
| Other comprehensive income (loss) – 2012 |
69,389 | (1,777) | 67,612 | |||||||||
|
|
|
|
|
|
|
|||||||
| Balance at December 31, 2012 |
282,503 | 12,768 | 295,271 | |||||||||
| Other comprehensive income (loss) – 2013 |
(182,543) | 5,923 | (176,620) | |||||||||
|
|
|
|
|
|
|
|||||||
| Balance at December 31, 2013 |
99,960 | 18,691 | 118,651 | |||||||||
| Other comprehensive income (loss) – 2014 |
70,024 | (13,661) | 56,363 | |||||||||
|
|
|
|
|
|
|
|||||||
| Balance at December 31, 2014 |
$ | 169,984 | $ | 5,030 | $ | 175,014 | ||||||
|
|
|
|
|
|
|
|||||||
Other
In 2012, we acquired the non-controlling interest of an entity we previously controlled and consolidated, resulting in a decrease in additional paid-in capital of $14.4 million.
F-32
Table of Contents
HCC INSURANCE HOLDINGS, INC. AND SUBSIDIARIES
NOTES TO CONSOLIDATED FINANCIAL STATEMENTS
(tables in thousands, except per share data)
(10) Earnings Per Share
The following table details the numerator and denominator used in our earnings per share calculations.
| 2014 | 2013 | 2012 | ||||||||||
| Net earnings |
$ | 458,343 | $ | 407,197 | $ | 391,240 | ||||||
| Less: net earnings attributable to unvested restricted stock |
(7,497 | ) | (6,638 | ) | (6,982 | ) | ||||||
|
|
|
|
|
|
|
|||||||
| Net earnings available to common stock |
$ | 450,846 | $ | 400,559 | $ | 384,258 | ||||||
|
|
|
|
|
|
|
|||||||
| Weighted-average common shares outstanding |
97,591 | 98,853 | 100,176 | |||||||||
| Dilutive effect of outstanding securities (determined using treasury stock method) |
260 | 260 | 280 | |||||||||
|
|
|
|
|
|
|
|||||||
| Weighted-average common shares and potential common shares outstanding |
97,851 | 99,113 | 100,456 | |||||||||
|
|
|
|
|
|
|
|||||||
| Earnings per common share |
||||||||||||
| Basic |
$ | 4.62 | $ | 4.05 | $ | 3.84 | ||||||
|
|
|
|
|
|
|
|||||||
| Diluted |
$ | 4.61 | $ | 4.04 | $ | 3.83 | ||||||
|
|
|
|
|
|
|
|||||||
(11) Stock-Based Compensation
Our stock-based compensation plan, the 2008 Flexible Incentive Plan, is administered by the Compensation Committee of the Board of Directors. We currently have restricted stock awards, restricted stock units and stock options outstanding under this plan. Each restricted stock award and unit entitles the recipient to one share or equivalent unit of our common stock. Outstanding restricted stock awards and units vest over a period of up to five years, which is the requisite service period. Each option granted under the plan may be used to purchase one share of our common stock. Outstanding options vest over a period of up to five years, which is the requisite service period, and expire six to ten years after the grant date.
In 2013, our stockholders authorized the issuance of up to 2.0 million shares of our common stock under the 2013 Employee Stock Purchase Plan (ESPP). The ESPP encourages share ownership by providing employees the opportunity to purchase HCC common stock at 85% of the closing price of the stock on either the first day or the last day of each six-month offering period (whichever is lower). Employees can invest between 1% and 15% of their base salary, subject to a maximum of the lesser of 1,500 shares in each offering period or $25,000 in each calendar year. We issued 0.1 million shares of common stock during 2014 upon completion of the first two ESPP offering periods. We recognize expense related to the ESPP over each offering period. The expense includes the 15% discount and the fair value of the “look-back” option calculated using a Black-Scholes option pricing model.
The consolidated statements of earnings reflect total stock-based compensation expense of $25.1 million, $16.2 million and $13.2 million in 2014, 2013 and 2012, respectively. The total tax benefit recognized in earnings from stock-based compensation arrangements was $8.8 million, $5.7 million and $4.6 million in 2014, 2013 and 2012, respectively. At December 31, 2014, there was approximately $29.3 million of total unrecognized compensation expense related to unvested restricted stock awards and units, options and our employee stock purchase plan that is expected to be recognized over a weighted-average period of 1.6 years. At December 31, 2014, 3.7 million shares of our common stock were authorized and reserved for the exercise of options and release of restricted stock units, of which 0.9 million shares were reserved for awards previously granted and 2.8 million shares were reserved for future issuance.
F-33
Table of Contents
HCC INSURANCE HOLDINGS, INC. AND SUBSIDIARIES
NOTES TO CONSOLIDATED FINANCIAL STATEMENTS
(tables in thousands, except per share data)
Restricted Stock
We measure the fair value of our restricted stock awards and units based on the closing price of our common stock on the grant date and expense that value on a straight-line basis over the vesting period.
Certain awards of restricted stock and restricted stock units contain a performance condition based on the ultimate results for the applicable underwriting year. The number of such shares that vest could be higher or lower than initially granted. We measure fair value for these awards based on the closing price of our common stock on the grant date, and we recognize expense on a straight-line basis over the vesting period for those restricted stock awards or units expected to vest. These awards earn dividends or dividend equivalents during the vesting period.
Beginning in 2013, certain of our executive officers were granted performance-based restricted stock. This restricted stock vests after three years and can vest from 0% to 200% of the initial shares granted. Vesting is based equally on an operating return on equity performance factor (ROE factor) and a total shareholder return performance factor (TSR factor). The ROE factor is calculated by comparing our actual results over the three-year period to an internal target, whereas the TSR factor is calculated by comparing our TSR over the three-year period to that of nine peer companies. The ROE factor qualifies as a performance condition and those awards are accounted for in the same manner as the other restricted stock grants described above. The TSR factor qualifies as a market condition, and we determine the fair value at grant date using a Monte Carlo simulation model that takes into account the probabilities of numerous outcomes of our TSR as well as that of the peer companies. This fair value is expensed on a straight-line basis over the vesting period and is not adjusted for the ultimate number of shares to vest. No dividends are earned during the vesting period on these shares.
The fair value of restricted stock awards that vested during 2014, 2013 and 2012 was $13.0 million, $14.4 million and $10.9 million, respectively. The fair value of restricted stock units that vested during 2014, 2013 and 2012 was $0.4 million, $1.6 million and $2.6 million, respectively.
The following table details activity for our restricted stock awards and units during 2014.
| Number of shares |
Weighted- average grant date fair value |
Weighted- average contractual life |
Aggregate intrinsic value |
|||||||||||||
| Restricted Stock Awards |
||||||||||||||||
| Outstanding, beginning of year |
1,437 | $ | 32.91 | |||||||||||||
| Awarded |
398 | 44.73 | ||||||||||||||
| Vested |
(271 | ) | 28.30 | |||||||||||||
| Forfeited |
(6 | ) | 40.70 | |||||||||||||
|
|
|
|||||||||||||||
| Outstanding, end of year |
1,558 | 36.70 | 1.6 years | $ | 83,383 | |||||||||||
|
|
|
|||||||||||||||
| Restricted Stock Units |
||||||||||||||||
| Outstanding, beginning of year |
135 | $ | 33.91 | |||||||||||||
| Awarded |
13 | 45.17 | ||||||||||||||
| Vested |
(9 | ) | 28.41 | |||||||||||||
|
|
|
|||||||||||||||
| Outstanding, end of year |
139 | 35.31 | 1.1 years | $ | 7,457 | |||||||||||
|
|
|
|||||||||||||||
| Expected to vest, end of year |
132 | 1.0 years | 7,069 | |||||||||||||
|
|
|
|||||||||||||||
F-34
Table of Contents
HCC INSURANCE HOLDINGS, INC. AND SUBSIDIARIES
NOTES TO CONSOLIDATED FINANCIAL STATEMENTS
(tables in thousands, except per share data)
Stock Options
The table below shows the weighted-average fair value of options granted and the related weighted-average assumptions used in the Black-Scholes model, which we use to determine the fair value of an option on its grant date. We expense the fair value on a straight-line basis over the option’s vesting period. The risk-free interest rate is based on the U.S. Treasury rate that most closely approximates each option’s expected term. We based our expected volatility on the historical volatility of our stock over a period matching each option’s expected term. Our dividend yield is based on an average of our historical dividend payments divided by the stock price. We used historical exercise patterns by grant type to estimate the expected option life.
| 2014 | 2013 | 2012 | ||||||||||
| Fair value of options granted |
$ | 6.51 | $ | 7.17 | $ | 7.89 | ||||||
| Risk free interest rate |
1.4 | % | 1.0 | % | 1.1 | % | ||||||
| Expected volatility |
18.4 | % | 23.0 | % | 31.4 | % | ||||||
| Expected dividend yield |
2.1 | % | 1.8 | % | 2.1 | % | ||||||
| Expected option life |
4.1 years | 4.9 years | 6.6 years | |||||||||
The following table details our stock option activity during 2014.
| Number of shares |
Weighted- average exercise price |
Weighted- average contractual life |
Aggregate intrinsic value |
|||||||||||||
| Outstanding, beginning of year |
1,293 | $ | 29.50 | |||||||||||||
| Granted |
10 | 52.51 | ||||||||||||||
| Exercised |
(461) | 25.66 | ||||||||||||||
| Forfeited and expired |
(40) | 37.28 | ||||||||||||||
|
|
|
|||||||||||||||
| Outstanding, end of year |
802 | 31.61 | 4.2 years | $ | 17,575 | |||||||||||
|
|
|
|||||||||||||||
| Vested or expected to vest, end of year |
771 | 31.49 | 4.2 years | 16,983 | ||||||||||||
|
|
|
|||||||||||||||
| Exercisable, end of year |
311 | 29.26 | 3.7 years | 7,554 | ||||||||||||
|
|
|
|||||||||||||||
The aggregate intrinsic value (the amount by which the fair value of the underlying stock exceeds the exercise price) of options exercised during 2014, 2013 and 2012 was $10.1 million, $5.6 million and $10.2 million, respectively. Exercise of options during 2014, 2013 and 2012 resulted in cash receipts of $11.8 million, $10.3 million and $60.0 million, respectively. The tax benefits realized from stock options exercised during 2014, 2013 and 2012 were $3.5 million, $2.0 million and $3.7 million, respectively.
Common Stock Grants
In 2012 and 2013, we granted fully-vested common stock valued at $80,000 to each non-management director as part of their annual compensation for serving on our Board of Directors. Beginning in 2014, we granted fully-vested common stock valued at $110,000 to each non-management director. New directors were granted a pro-rata portion of the value for the applicable year based on the date they joined the Board. Two directors who had previously deferred their annual grants under a deferred compensation plan retired in 2014. Upon retirement, additional shares valued at $323,000, representing the increase in value of the deferred amounts, were issued to the former directors. We also granted $200,000 of fully vested common stock to the chairman of our Board in each of the past three years. The number of shares granted was based on our closing stock price on the grant date, which was either the day of the Annual Meeting of Shareholders, the day the director joined the Board or the date the values in the deferred compensation plan were paid.
F-35
Table of Contents
HCC INSURANCE HOLDINGS, INC. AND SUBSIDIARIES
NOTES TO CONSOLIDATED FINANCIAL STATEMENTS
(tables in thousands, except per share data)
(12) Segments
We report HCC’s results in six operating segments, which includes an Investing segment. Each of our five insurance underwriting segments bears risk for insurance coverage written within its portfolio of insurance products. Each segment generates income from premium written by our underwriting agencies, through third party agents and brokers, or on a direct basis. Fee and commission income earned by our agencies from third party insurance companies is included in segment revenue. Each segment incurs insurance losses, acquisition costs and other administrative expenses related to our insurance companies and underwriting agencies. We monitor and assess each segment’s pretax results based on underwriting profit, gross and net written premium, and its combined ratio, consisting of the net loss ratio and expense ratio.
Included in the portfolio of products for each insurance underwriting segment are the following key products:
| • | U.S. Property & Casualty – aviation, primary and excess casualty, small account errors and omissions liability (E&O), employment practices liability (EPLI), disability, contingency, public risk, technical and construction property, title and mortgage reinsurance, residual value, and brown water marine written in the United States. |
| • | Professional Liability – directors’ and officers’ (D&O) liability, large account E&O liability, fiduciary liability, fidelity and bankers’ blanket bonds, EPLI, transactional insurance and cyber liability, written in the United States and internationally. |
| • | Accident & Health – medical stop-loss and short-term domestic and international medical coverages written in the United States. |
| • | U.S. Surety & Credit – contract surety bonds, commercial surety bonds and bail bonds written in the United States and credit insurance managed in the United States. |
| • | International – energy, ocean marine, property treaty, surety, credit, liability, property (direct and facultative), accident and health and other smaller product lines written outside the United States. |
The Investing segment includes our consolidated investment portfolio, as well as all investment income, investment related expenses, realized investment gains and losses, and other-than-temporary impairment credit losses on investments. All investment activity is reported as revenue, consistent with our consolidated presentation.
In addition to our segments, we include a Corporate & Other category to reconcile segment results to consolidated totals. The Corporate & Other category includes: 1) a reclassification of internal claims department costs that are managed as operating expenses in our segments, but reported as loss and loss adjustment expense in our consolidated financial statements, 2) corporate operating expenses not allocated to the segments, 3) interest expense on notes payable, 4) foreign currency expense (benefit) and 5) underwriting results of our Exited Lines. Our Exited Lines include these eight product lines that we no longer write and do not expect to write in the future: 1) accident and health business managed by our underwriting agency, LDG Reinsurance, 2) workers’ compensation, 3) provider excess, 4) Spanish medical malpractice, 5) U.K. motor, 6) film completion bonds, 7) HMO reinsurance and 8) medical excess reinsurance.
The majority of our stock-based compensation expense is included in Corporate & Other. All bonuses are expensed in the respective employee’s segment in the year the bonuses are earned. Any such bonuses that will be paid by restricted stock awards or units, which will be granted by the Compensation Committee in the following year, are reversed within Corporate & Other. The appropriate stock-based compensation expense for these awards will be recorded in Corporate & Other as the awards vest in future years. The majority of our depreciation and amortization expense is included in Corporate & Other.
F-36
Table of Contents
HCC INSURANCE HOLDINGS, INC. AND SUBSIDIARIES
NOTES TO CONSOLIDATED FINANCIAL STATEMENTS
(tables in thousands, except per share data)
The following tables present information by business segment.
| U.S. Property & Casualty |
Professional Liability |
Accident & Health |
U.S. Surety & Credit |
International | Investing | Corporate & Other |
Consolidated | |||||||||||||||||||||||||
| Year ended December 31, 2014 |
||||||||||||||||||||||||||||||||
| Net earned premium |
$ | 363,998 | $ | 351,690 | $ | 981,219 | $ | 199,764 | $ | 426,480 | $ | - | $ | 476 | $ | 2,323,627 | ||||||||||||||||
| Other revenue |
20,822 | 1,082 | 9,663 | 2,505 | 3,711 | 287,990 | 3,149 | 328,922 | ||||||||||||||||||||||||
|
|
|
|
|
|
|
|
|
|
|
|
|
|
|
|
|
|||||||||||||||||
| Segment revenue |
384,820 | 352,772 | 990,882 | 202,269 | 430,191 | 287,990 | 3,625 | 2,652,549 | ||||||||||||||||||||||||
|
|
|
|
|
|
|
|
|
|
|
|
|
|
|
|
|
|||||||||||||||||
| Loss and LAE |
154,200 | 206,690 | 696,288 | 42,273 | 196,134 | - | 31,250 | 1,326,835 | ||||||||||||||||||||||||
| Other expense |
116,553 | 67,692 | 155,469 | 112,232 | 175,158 | - | 36,774 | 663,878 | ||||||||||||||||||||||||
|
|
|
|
|
|
|
|
|
|
|
|
|
|
|
|
|
|||||||||||||||||
| Segment expense |
270,753 | 274,382 | 851,757 | 154,505 | 371,292 | - | 68,024 | 1,990,713 | ||||||||||||||||||||||||
|
|
|
|
|
|
|
|
|
|
|
|
|
|
|
|
|
|||||||||||||||||
| Segment pretax earnings (loss) |
$ | 114,067 | $ | 78,390 | $ | 139,125 | $ | 47,764 | $ | 58,899 | $ | 287,990 | $ | (64,399 | ) | $ | 661,836 | |||||||||||||||
|
|
|
|
|
|
|
|
|
|
|
|
|
|
|
|
|
|||||||||||||||||
| Year ended December 31, 2013 |
||||||||||||||||||||||||||||||||
| Net earned premium |
$ | 367,135 | $ | 368,167 | $ | 883,515 | $ | 194,286 | $ | 413,206 | $ | - | $ | 12,931 | $ | 2,239,240 | ||||||||||||||||
| Other revenue |
24,266 | (7 | ) | 4,932 | 1,468 | 4,334 | 262,212 | 459 | 297,664 | |||||||||||||||||||||||
|
|
|
|
|
|
|
|
|
|
|
|
|
|
|
|
|
|||||||||||||||||
| Segment revenue |
391,401 | 368,160 | 888,447 | 195,754 | 417,540 | 262,212 | 13,390 | 2,536,904 | ||||||||||||||||||||||||
|
|
|
|
|
|
|
|
|
|
|
|
|
|
|
|
|
|||||||||||||||||
| Loss and LAE |
175,190 | 195,429 | 630,210 | 24,143 | 249,199 | - | 48,283 | 1,322,454 | ||||||||||||||||||||||||
| Other expense |
117,910 | 66,391 | 130,814 | 109,550 | 158,869 | - | 58,206 | 641,740 | ||||||||||||||||||||||||
|
|
|
|
|
|
|
|
|
|
|
|
|
|
|
|
|
|||||||||||||||||
| Segment expense |
293,100 | 261,820 | 761,024 | 133,693 | 408,068 | - | 106,489 | 1,964,194 | ||||||||||||||||||||||||
|
|
|
|
|
|
|
|
|
|
|
|
|
|
|
|
|
|||||||||||||||||
| Segment pretax earnings (loss) |
$ | 98,301 | $ | 106,340 | $ | 127,423 | $ | 62,061 | $ | 9,472 | $ | 262,212 | $ | (93,099 | ) | $ | 572,710 | |||||||||||||||
|
|
|
|
|
|
|
|
|
|
|
|
|
|
|
|
|
|||||||||||||||||
| Year ended December 31, 2012 |
||||||||||||||||||||||||||||||||
| Net earned premium |
$ | 354,050 | $ | 394,687 | $ | 831,827 | $ | 207,955 | $ | 412,853 | $ | - | $ | 41,253 | $ | 2,242,625 | ||||||||||||||||
| Other revenue |
18,865 | 731 | 4,918 | 843 | 5,005 | 252,754 | 86 | 283,202 | ||||||||||||||||||||||||
|
|
|
|
|
|
|
|
|
|
|
|
|
|
|
|
|
|||||||||||||||||
| Segment revenue |
372,915 | 395,418 | 836,745 | 208,798 | 417,858 | 252,754 | 41,339 | 2,525,827 | ||||||||||||||||||||||||
|
|
|
|
|
|
|
|
|
|
|
|
|
|
|
|
|
|||||||||||||||||
| Loss and LAE |
209,286 | 229,873 | 601,076 | 38,535 | 189,410 | - | 69,894 | 1,338,074 | ||||||||||||||||||||||||
| Other expense |
116,398 | 66,721 | 122,232 | 113,619 | 146,807 | - | 67,549 | 633,326 | ||||||||||||||||||||||||
|
|
|
|
|
|
|
|
|
|
|
|
|
|
|
|
|
|||||||||||||||||
| Segment expense |
325,684 | 296,594 | 723,308 | 152,154 | 336,217 | - | 137,443 | 1,971,400 | ||||||||||||||||||||||||
|
|
|
|
|
|
|
|
|
|
|
|
|
|
|
|
|
|||||||||||||||||
| Segment pretax earnings (loss) |
$ | 47,231 | $ | 98,824 | $ | 113,437 | $ | 56,644 | $ | 81,641 | $ | 252,754 | $ | (96,104 | ) | $ | 554,427 | |||||||||||||||
|
|
|
|
|
|
|
|
|
|
|
|
|
|
|
|
|
|||||||||||||||||
In the above tables, the reconciling amounts for internal claims department costs included in Corporate & Other, which increase loss and LAE and decrease other expense, were $36.4 million in 2014, $32.4 million in 2013 and $32.6 million in 2012.
F-37
Table of Contents
HCC INSURANCE HOLDINGS, INC. AND SUBSIDIARIES
NOTES TO CONSOLIDATED FINANCIAL STATEMENTS
(tables in thousands, except per share data)
The following table presents total assets by segment at December 31, 2014 and 2013.
| 2014 | 2013 | |||||||||||
| U.S. Property & Casualty |
$ | 985,871 | $ | 914,697 | ||||||||
| Professional Liability |
1,104,892 | 1,110,592 | ||||||||||
| Accident & Health |
242,278 | 235,950 | ||||||||||
| U.S. Surety & Credit |
189,054 | 168,389 | ||||||||||
| International |
688,828 | 859,659 | ||||||||||
| Investing |
7,228,608 | 6,800,313 | ||||||||||
| Corporate & Other |
274,815 | 254,920 | ||||||||||
|
|
|
|
|
|||||||||
| Total |
$ | 10,714,346 | $ | 10,344,520 | ||||||||
|
|
|
|
|
|||||||||
| The tables below present the split of our revenue, pretax earnings and total assets by geographic location. For these disclosures, we determine geographic location by the country of domicile of our subsidiaries that write the business and not by the location of insureds or reinsureds from whom the business was generated. | ||||||||||||
| 2014 | 2013 | 2012 | ||||||||||
| Domestic |
$ | 1,984,992 | $ | 1,868,557 | $ | 1,880,954 | ||||||
| Foreign |
667,557 | 668,347 | 644,873 | |||||||||
|
|
|
|
|
|
|
|||||||
| Total revenue |
$ | 2,652,549 | $ | 2,536,904 | $ | 2,525,827 | ||||||
|
|
|
|
|
|
|
|||||||
| Domestic |
$ | 437,774 | $ | 443,898 | $ | 364,083 | ||||||
| Foreign |
224,062 | 128,812 | 190,344 | |||||||||
|
|
|
|
|
|
|
|||||||
| Total pretax earnings |
$ | 661,836 | $ | 572,710 | $ | 554,427 | ||||||
|
|
|
|
|
|
|
|||||||
| December 31, | ||||||||||||
| 2014 | 2013 | |||||||||||
| Domestic |
$ | 7,750,039 | $ | 7,397,509 | ||||||||
| Foreign |
2,964,307 | 2,947,011 | ||||||||||
|
|
|
|
|
|||||||||
| Total assets |
$ | 10,714,346 | $ | 10,344,520 | ||||||||
|
|
|
|
|
|||||||||
F-38
Table of Contents
HCC INSURANCE HOLDINGS, INC. AND SUBSIDIARIES
NOTES TO CONSOLIDATED FINANCIAL STATEMENTS
(tables in thousands, except per share data)
(13) Commitments and Contingencies
Catastrophe and Large Loss Exposure
We have exposure to catastrophic and other large losses caused by natural perils (such as hurricanes, earthquakes, floods, tsunamis, hail storms and tornados) and man-made events (such as terrorist attacks). The incidence, timing and severity of these losses are unpredictable. We assess our exposures in areas most vulnerable to natural catastrophes and apply procedures to ascertain our probable maximum loss from a single event. We maintain reinsurance protection to reduce our potential losses from a future event. In 2014, we recognized accident year gross losses of $28.8 million from catastrophic events related to various small catastrophes. After reinsurance and reinstatement premium, our pretax loss was $26.4 million. In 2013, we recognized accident year gross losses of $56.6 million, primarily due to European floods, German hail storms and various small catastrophes. After reinsurance and reinstatement premium, our pretax loss was $52.0 million. In 2012, we recognized accident year gross losses of $84.8 million, primarily from Superstorm Sandy in the United States. After reinsurance and reinstatement premium, our pretax loss was $52.8 million.
Litigation
We are a party to lawsuits, arbitrations and other proceedings that arise in the normal course of our business. Many of such lawsuits, arbitrations and other proceedings involve claims under policies that we underwrite as an insurer or reinsurer, the liabilities for which, we believe, have been adequately included in our loss reserves. Also, from time to time, we are a party to lawsuits, arbitrations and other proceedings that relate to disputes with third parties, or that involve alleged errors and omissions on the part of our subsidiaries. We have provided accruals for these items to the extent we deem the losses probable and reasonably estimable. Although the ultimate outcome of these matters cannot be determined at this time, based on present information, the availability of insurance coverage and advice received from our outside legal counsel, we believe the resolution of any such matters will not, individually or in the aggregate, have a material adverse effect on our consolidated financial position, results of operations or cash flows.
Indemnifications
In conjunction with the sales of business assets and subsidiaries, we have provided indemnifications to the buyers. Certain indemnifications cover typical representations and warranties related to our responsibilities to perform under the sales contracts. Under other indemnifications, we agree to reimburse the purchasers for taxes or ERISA-related amounts, if any, assessed after the sale date but related to pre-sale activities. We cannot quantify the maximum potential exposure covered by all of our indemnifications because the indemnifications cover a variety of matters, operations and scenarios and some have no time limit. For those with a time limit, the longest such indemnification expires in 2025. We accrue a loss when a valid claim is made by a purchaser and we believe we have potential exposure.
Terrorist Exposure
Under the Terrorism Risk Insurance Program Reauthorization Act of 2015 (Reauthorization Act), we are required to offer terrorism coverage to our commercial policyholders in certain lines of business, for which we may charge an additional premium. The policyholders may or may not accept such coverage. The Reauthorization Act requires a $100.0 million terrorism-related loss event to trigger coverage in 2015. For such an event in 2015, the Federal government will reimburse 85% of our losses in excess of our deductible, up to the maximum annual amount in the Reauthorization Act. Our deductible is approximately $151.2 million for 2015. Currently, the Reauthorization Act expires on December 31, 2020.
F-39
Table of Contents
HCC INSURANCE HOLDINGS, INC. AND SUBSIDIARIES
NOTES TO CONSOLIDATED FINANCIAL STATEMENTS
(tables in thousands, except per share data)
Leases
We lease administrative office facilities and transportation equipment under operating leases that expire at various dates through 2024. The agreements generally require us to pay rent, utilities, real estate or property taxes, sales taxes, insurance and repairs. We recognize rent expense on a straight-line basis over the term of the lease, including free-rent periods. Rent expense under operating leases totaled $16.7 million in 2014, $15.7 million in 2013 and $16.0 million in 2012.
At December 31, 2014, future minimum rental payments required under long-term, non-cancelable operating leases, excluding certain expenses payable by us, were as follows:
| 2015 |
$ | 11,870 | ||
| 2016 |
10,098 | |||
| 2017 |
7,393 | |||
| 2018 |
5,411 | |||
| 2019 |
1,802 | |||
| Thereafter |
2,628 | |||
|
|
|
|||
| Total future minimum rental payments |
$ | 39,202 | ||
|
|
|
(14) Related Party Transactions
We have amounts due to former owners of businesses we have acquired, some of whom are officers of certain of our subsidiaries. We had earnout liabilities of $27.1 million and $22.8 million at December 31, 2014 and 2013, respectively, reported in accounts payable and accrued liabilities in our consolidated balance sheets. We paid $3.0 million in 2014 and $7.2 million in 2013 related to these earnout agreements.
(15) Statutory Information
Our insurance companies file financial statements prepared in accordance with statutory accounting principles prescribed or permitted by domestic or foreign insurance regulatory authorities. The differences between statutory financial statements and financial statements prepared in accordance with GAAP vary between domestic and foreign jurisdictions.
Statutory capital and surplus and net income, after intercompany eliminations, included in those companies’ respective filings with regulatory authorities were as follows:
| 2014 | 2013 | 2012 | ||||||||||
| Statutory capital and surplus |
$ 2,615,818 | $ | 2,517,867 | $ | 2,374,420 | |||||||
| Statutory net income |
483,403 | 453,649 | 445,999 | |||||||||
The statutory capital and surplus of each of our insurance companies is significantly in excess of regulatory risk-based capital requirements.
F-40
Table of Contents
HCC INSURANCE HOLDINGS, INC. AND SUBSIDIARIES
NOTES TO CONSOLIDATED FINANCIAL STATEMENTS
(tables in thousands, except per share data)
(16) Supplemental Information
Supplemental cash flow information was as follows:
| 2014 | 2013 | 2012 | ||||||||||
| Income taxes paid |
$ | 132,571 | $ | 181,521 | $ | 107,918 | ||||||
| Interest paid |
27,700 | 25,795 | 24,107 | |||||||||
| Dividends declared but not paid at year-end |
28,451 | 22,575 | 16,680 | |||||||||
(17) Quarterly Financial Data (Unaudited)
| Fourth Quarter | Third Quarter | Second Quarter | First Quarter | |||||||||||||||||||||||||||||
| 2014 | 2013 | 2014 | 2013 | 2014 | 2013 | 2014 | 2013 | |||||||||||||||||||||||||
| Net earned premium |
$ | 601,832 | $ | 560,030 | $ | 586,935 | $ | 556,668 | $ | 572,248 | $ | 561,356 | $ | 562,612 | $ | 561,186 | ||||||||||||||||
| Other revenue |
68,175 | 76,600 | 103,103 | 79,809 | 71,326 | 68,075 | 86,318 | 73,180 | ||||||||||||||||||||||||
|
|
|
|
|
|
|
|
|
|
|
|
|
|
|
|
|
|||||||||||||||||
| Total revenue |
670,007 | 636,630 | 690,038 | 636,477 | 643,574 | 629,431 | 648,930 | 634,366 | ||||||||||||||||||||||||
|
|
|
|
|
|
|
|
|
|
|
|
|
|
|
|
|
|||||||||||||||||
| Loss and LAE expense |
339,434 | 305,477 | 320,758 | 328,530 | 335,897 | 347,353 | 330,746 | 341,094 | ||||||||||||||||||||||||
| Other expense |
166,010 | 174,770 | 164,623 | 167,847 | 170,033 | 157,247 | 163,212 | 141,876 | ||||||||||||||||||||||||
|
|
|
|
|
|
|
|
|
|
|
|
|
|
|
|
|
|||||||||||||||||
| Total expense |
505,444 | 480,247 | 485,381 | 496,377 | 505,930 | 504,600 | 493,958 | 482,970 | ||||||||||||||||||||||||
|
|
|
|
|
|
|
|
|
|
|
|
|
|
|
|
|
|||||||||||||||||
| Earnings before income taxes |
164,563 | 156,383 | 204,657 | 140,100 | 137,644 | 124,831 | 154,972 | 151,396 | ||||||||||||||||||||||||
| Income tax expense |
51,534 | 41,373 | 64,390 | 41,925 | 40,508 | 36,669 | 47,061 | 45,546 | ||||||||||||||||||||||||
|
|
|
|
|
|
|
|
|
|
|
|
|
|
|
|
|
|||||||||||||||||
| Net earnings |
$ | 113,029 | $ | 115,010 | $ | 140,267 | $ | 98,175 | $ | 97,136 | $ | 88,162 | $ | 107,911 | $ | 105,850 | ||||||||||||||||
|
|
|
|
|
|
|
|
|
|
|
|
|
|
|
|
|
|||||||||||||||||
| Earnings per share |
||||||||||||||||||||||||||||||||
| Basic |
$ | 1.17 | $ | 1.15 | $ | 1.41 | $ | 0.98 | $ | 0.97 | $ | 0.88 | $ | 1.08 | $ | 1.05 | ||||||||||||||||
| Diluted |
1.16 | 1.14 | 1.41 | 0.98 | 0.97 | 0.87 | 1.07 | 1.05 | ||||||||||||||||||||||||
| Weighted-average shares outstanding |
||||||||||||||||||||||||||||||||
| Basic |
95,373 | 98,770 | 97,909 | 98,723 | 98,442 | 98,870 | 98,662 | 99,056 | ||||||||||||||||||||||||
| Diluted |
95,636 | 99,046 | 98,134 | 98,993 | 98,660 | 99,121 | 98,913 | 99,287 | ||||||||||||||||||||||||
The sum of earnings per share for the quarters may not equal the annual amounts due to rounding.
As discussed in “Revision of Financial Statement Presentation” in Note 1, we revised our previously issued consolidated statements of earnings to correctly classify internal claims department costs as loss and loss adjustment expense. These costs previously had been included in other operating expense. The unaudited quarterly financial data presented above also has been revised. The amounts reclassified in 2014 and 2013 were as follows: 1) first quarter – $8.9 million and $8.4 million, respectively, 2) second quarter – $8.8 million and $7.9 million, respectively, 3) third quarter – $8.8 million and $8.1 million, respectively and 4) fourth quarter 2013 – $8.0 million. There was no impact on net earnings in any quarterly period.
F-41
Table of Contents
HCC INSURANCE HOLDINGS, INC. AND SUBSIDIARIES
SUMMARY OF INVESTMENTS
OTHER THAN INVESTMENTS IN RELATED PARTIES
(in thousands)
| December 31, 2014 | ||||||||||||
| Column A |
Column B | Column C | Column D | |||||||||
| Amount | ||||||||||||
| shown in | ||||||||||||
| Type of Investment |
Cost | Value | balance sheet | |||||||||
| Fixed maturity securities |
||||||||||||
| Bonds — United States government and government agencies and authorities |
$ | 70,279 | $ | 70,969 | $ | 70,969 | ||||||
| Bonds — states, municipalities and political subdivisions |
896,130 | 954,708 | 954,708 | |||||||||
| Bonds — special revenue |
2,246,707 | 2,389,012 | 2,389,012 | |||||||||
| Bonds — corporate |
1,251,625 | 1,276,835 | 1,276,835 | |||||||||
| Residential mortgage-backed securities |
805,458 | 821,694 | 821,694 | |||||||||
| Commercial mortgage-backed securities |
593,956 | 611,631 | 611,631 | |||||||||
| Asset-backed securities |
369,103 | 366,827 | 366,827 | |||||||||
| Bonds — foreign |
119,479 | 118,692 | 118,692 | |||||||||
|
|
|
|
|
|
|
|||||||
| Total fixed maturity securities |
6,352,737 | $ | 6,610,368 | 6,610,368 | ||||||||
|
|
|
|
|
|
|
|||||||
| Equity securities |
||||||||||||
| Common stocks — banks, trust and insurance companies |
46,538 | 46,183 | 46,183 | |||||||||
| Common stocks — industrial and miscellaneous |
244,532 | 250,169 | 250,169 | |||||||||
|
|
|
|
|
|
|
|||||||
| Total equity securities |
291,070 | $ | 296,352 | 296,352 | ||||||||
|
|
|
|
|
|
|
|||||||
| Short-term investments |
258,186 | 258,186 | ||||||||||
|
|
|
|
|
|||||||||
| Total investments |
$ | 6,901,993 | $ | 7,164,906 | ||||||||
|
|
|
|
|
|||||||||
S-1
Table of Contents
HCC INSURANCE HOLDINGS, INC.
CONDENSED FINANCIAL INFORMATION OF REGISTRANT
BALANCE SHEETS
(in thousands)
| December 31, | ||||||||
| 2014 | 2013 | |||||||
| ASSETS | ||||||||
| Cash |
$ | 11,647 | $ | 2,206 | ||||
| Fixed maturity securities – available for sale, at fair value (amortized cost: |
750,033 | 518,822 | ||||||
| Equity securities – available for sale, at fair value (cost: 2013 – $134,156) |
- | 157,122 | ||||||
| Short-term investments, at cost (approximates fair value) |
76,759 | 6,498 | ||||||
| Investment in subsidiaries |
3,820,270 | 3,538,542 | ||||||
| Intercompany loans to subsidiaries |
176,002 | 174,280 | ||||||
| Receivable from subsidiaries |
94,989 | 80,946 | ||||||
| Other assets |
12,400 | 9,833 | ||||||
|
|
|
|
|
|||||
| Total assets |
$ | 4,942,100 | $ | 4,488,249 | ||||
|
|
|
|
|
|||||
| LIABILITIES AND SHAREHOLDERS’ EQUITY | ||||||||
| Payable to subsidiaries |
$ | 36,415 | $ | 36,654 | ||||
| Notes payable |
824,251 | 654,098 | ||||||
| Deferred Federal income tax |
16,526 | 18,690 | ||||||
| Accounts payable and accrued liabilities |
161,557 | 104,377 | ||||||
|
|
|
|
|
|||||
| Total liabilities |
1,038,749 | 813,819 | ||||||
| Total shareholders’ equity |
3,903,351 | 3,674,430 | ||||||
|
|
|
|
|
|||||
| Total liabilities and shareholders’ equity |
$ | 4,942,100 | $ | 4,488,249 | ||||
|
|
|
|
|
|||||
See Notes to Condensed Financial Information.
S-2
Table of Contents
SCHEDULE 2
HCC INSURANCE HOLDINGS, INC.
CONDENSED FINANCIAL INFORMATION OF REGISTRANT
STATEMENTS OF EARNINGS
(in thousands)
| Years ended December 31, | ||||||||||||
| 2014 | 2013 | 2012 | ||||||||||
| REVENUE |
||||||||||||
| Equity in earnings of subsidiaries |
$ | 448,762 | $ | 415,408 | $ | 400,294 | ||||||
| Interest income from subsidiaries |
11,562 | 9,101 | 8,858 | |||||||||
| Net investment income |
20,311 | 13,691 | 10,290 | |||||||||
| Net realized investment gain (loss) |
16,746 | 7,691 | (309 | ) | ||||||||
| Other operating income |
- | 46 | 99 | |||||||||
|
|
|
|
|
|
|
|||||||
| Total revenue |
497,381 | 445,937 | 419,232 | |||||||||
|
|
|
|
|
|
|
|||||||
| EXPENSE |
||||||||||||
| Interest expense |
27,948 | 25,804 | 25,132 | |||||||||
| Other operating expense |
8,642 | 6,433 | 7,138 | |||||||||
|
|
|
|
|
|
|
|||||||
| Total expense |
36,590 | 32,237 | 32,270 | |||||||||
|
|
|
|
|
|
|
|||||||
| Earnings before income tax expense |
460,791 | 413,700 | 386,962 | |||||||||
| Income tax expense (benefit) |
2,448 | 6,503 | (4,278 | ) | ||||||||
|
|
|
|
|
|
|
|||||||
| Net earnings |
$ | 458,343 | $ | 407,197 | $ | 391,240 | ||||||
|
|
|
|
|
|
|
|||||||
See Notes to Condensed Financial Information.
S-3
Table of Contents
SCHEDULE 2
HCC INSURANCE HOLDINGS, INC.
CONDENSED FINANCIAL INFORMATION OF REGISTRANT
STATEMENTS OF CASH FLOWS
(in thousands)
| Years ended December 31, | ||||||||||||
| 2014 | 2013 | 2012 | ||||||||||
| Operating activities |
||||||||||||
| Net earnings |
$ | 458,343 | $ | 407,197 | $ | 391,240 | ||||||
| Adjustments to reconcile net earnings to net cash provided by operating activities: |
||||||||||||
| Undistributed net earnings of subsidiaries |
(404,468 | ) | (404,441 | ) | (392,486 | ) | ||||||
| Change in accrued interest receivable on intercompany loans |
(9,190 | ) | (9,097 | ) | (3,154 | ) | ||||||
| Change in accounts payable and accrued liabilities |
41,729 | (13,866 | ) | 23,629 | ||||||||
| (Gain) loss on investments |
(16,746 | ) | (7,691 | ) | 309 | |||||||
| Other, net |
14,907 | 28,555 | 3,947 | |||||||||
|
|
|
|
|
|
|
|||||||
| Cash provided by operating activities |
84,575 | 657 | 23,485 | |||||||||
|
|
|
|
|
|
|
|||||||
| Investing activities |
||||||||||||
| Sales of available for sale fixed maturity securities |
123,447 | 78,350 | 87,099 | |||||||||
| Sales of equity securities |
158,630 | 39,974 | 9,780 | |||||||||
| Sales of other investments |
- | 23,720 | 21,736 | |||||||||
| Maturity or call of available for sale fixed maturity securities |
153,261 | 31,054 | 105,982 | |||||||||
| Cost of available for sale fixed maturity securities acquired |
(187,680 | ) | (20,030 | ) | (6,666 | ) | ||||||
| Cost of equity securities acquired |
(1,533 | ) | (53,723 | ) | (124,710 | ) | ||||||
| Change in short-term investments |
(70,261 | ) | 15,911 | (20,987 | ) | |||||||
| Cash contributions to subsidiaries |
(100,610 | ) | (49,892 | ) | (30,250 | ) | ||||||
| Change in receivable from/payable to subsidiaries |
(10,753 | ) | (18,748 | ) | 776 | |||||||
| Intercompany loans to subsidiaries |
(2,579 | ) | (7,228 | ) | (66,765 | ) | ||||||
| Payments on intercompany loans to subsidiaries |
- | 19,157 | 51,427 | |||||||||
| Payments for purchase of business and other |
(6,043 | ) | - | - | ||||||||
|
|
|
|
|
|
|
|||||||
| Cash provided by investing activities |
55,879 | 58,545 | 27,422 | |||||||||
|
|
|
|
|
|
|
|||||||
| Financing activities |
||||||||||||
| Issuance of notes payable |
- | - | 25,000 | |||||||||
| Payments on notes payable |
- | (25,000 | ) | - | ||||||||
| Advances on line of credit |
275,000 | 180,000 | 185,000 | |||||||||
| Payments on line of credit |
(105,000 | ) | (110,000 | ) | (80,000 | ) | ||||||
| Sale of common stock |
20,237 | 12,908 | 59,838 | |||||||||
| Purchase of common stock |
(224,706 | ) | (47,869 | ) | (173,028 | ) | ||||||
| Dividends paid |
(96,544 | ) | (71,967 | ) | (64,345 | ) | ||||||
|
|
|
|
|
|
|
|||||||
| Cash used by financing activities |
(131,013 | ) | (61,928 | ) | (47,535 | ) | ||||||
|
|
|
|
|
|
|
|||||||
| Net increase (decrease) in cash |
9,441 | (2,726 | ) | 3,372 | ||||||||
| Cash at beginning of year |
2,206 | 4,932 | 1,560 | |||||||||
|
|
|
|
|
|
|
|||||||
| Cash at end of year |
$ | 11,647 | $ | 2,206 | $ | 4,932 | ||||||
|
|
|
|
|
|
|
|||||||
See Notes to Condensed Financial Information.
S-4
Table of Contents
SCHEDULE 2
HCC INSURANCE HOLDINGS, INC.
CONDENSED FINANCIAL INFORMATION OF REGISTRANT
NOTES TO CONDENSED FINANCIAL INFORMATION
| (1) | The accompanying condensed financial information should be read in conjunction with the Consolidated Financial Statements and related Notes of HCC Insurance Holdings, Inc. and Subsidiaries. Investments in subsidiaries are accounted for using the equity method. |
| (2) | Intercompany loans to subsidiaries are demand notes issued primarily to fund the cash portion of acquisitions. They bear interest at a rate set by management, which approximates the interest rate charged for similar debt. At December 31, 2014, the interest rate on intercompany loans was 6.25%. |
| (3) | In 2012, HCC borrowed $25.0 million as an intercompany loan from a subsidiary to pay down outstanding borrowings on its Revolving Loan Facility. This loan was repaid in full, plus interest at 2.45%, in 2013. |
| (4) | Dividends received from subsidiaries were $377.2 million, $328.2 million and $270.3 million in 2014, 2013 and 2012, respectively. The dividends included $332.9 million, $317.2 million and $262.8 million, respectively, of fixed maturity securities plus the related accrued interest. |
S-5
Table of Contents
HCC INSURANCE HOLDINGS, INC. AND SUBSIDIARIES
SUPPLEMENTARY INSURANCE INFORMATION
(in thousands)
| Column A |
Column B | Column C | Column D | Column F | Column G | Column H | Column I | Column J | Column K | |||||||||||||||||||||||||||
| (1) | (2) | (2) | (1) | (1) | (1) | (3) | (1) | |||||||||||||||||||||||||||||
| December 31, | Years ended December 31, | |||||||||||||||||||||||||||||||||||
| Segments |
Deferred policy acquisition costs |
Future policy benefits, losses, claims and loss expenses |
Unearned premiums |
Premium revenue |
Net investment income |
Benefits, claims, losses and settlement expenses |
Amortization of deferred policy acquisition costs |
Other operating expenses |
Premium written |
|||||||||||||||||||||||||||
| 2014 |
||||||||||||||||||||||||||||||||||||
| U.S. Property & Casualty |
$ | 29,815 | $ | 703,653 | $ | 511,218 | $ | 363,998 | $ | - | $ | 154,200 | $ | 28,405 | $ | 88,141 | $ | 380,299 | ||||||||||||||||||
| Professional Liability |
12,335 | 1,756,600 | 295,576 | 351,690 | - | 206,690 | 20,018 | 47,667 | 346,720 | |||||||||||||||||||||||||||
| Accident & Health |
8,692 | 350,187 | 28,937 | 981,219 | - | 696,288 | 85,410 | 70,058 | 992,034 | |||||||||||||||||||||||||||
| U.S. Surety & Credit |
37,106 | 127,470 | 129,831 | 199,764 | - | 42,273 | 69,990 | 42,242 | 204,767 | |||||||||||||||||||||||||||
| International |
38,901 | 643,062 | 233,368 | 426,480 | - | 196,134 | 92,347 | 82,651 | 448,949 | |||||||||||||||||||||||||||
| Investing |
- | - | - | - | 221,620 | - | - | - | - | |||||||||||||||||||||||||||
| Corporate & Other (4) |
(730 | ) | 195,612 | - | 476 | - | 31,250 | (1,500 | ) | 10,324 | 476 | |||||||||||||||||||||||||
|
|
|
|
|
|
|
|
|
|
|
|
|
|
|
|
|
|
|
|||||||||||||||||||
| Total |
$ | 126,119 | $ | 3,776,584 | $ | 1,198,930 | $ | 2,323,627 | $ | 221,620 | $ | 1,326,835 | $ | 294,670 | $ | 341,083 | $ | 2,373,245 | ||||||||||||||||||
|
|
|
|
|
|
|
|
|
|
|
|
|
|
|
|
|
|
|
|||||||||||||||||||
| 2013 |
||||||||||||||||||||||||||||||||||||
| U.S. Property & Casualty |
$ | 26,374 | $ | 665,871 | $ | 473,230 | $ | 367,135 | $ | - | $ | 175,190 | $ | 35,260 | $ | 82,563 | $ | 385,355 | ||||||||||||||||||
| Professional Liability |
12,946 | 1,789,113 | 303,599 | 368,167 | - | 195,429 | 19,010 | 47,381 | 359,509 | |||||||||||||||||||||||||||
| Accident & Health |
3,618 | 314,593 | 18,105 | 883,515 | - | 630,210 | 69,745 | 61,069 | 881,368 | |||||||||||||||||||||||||||
| U.S. Surety & Credit |
35,549 | 112,916 | 125,948 | 194,286 | - | 24,143 | 68,105 | 41,444 | 199,121 | |||||||||||||||||||||||||||
| International |
34,483 | 853,711 | 213,967 | 413,206 | - | 249,199 | 88,048 | 70,737 | 417,039 | |||||||||||||||||||||||||||
| Investing |
- | - | - | - | 220,182 | - | - | - | - | |||||||||||||||||||||||||||
| Corporate & Other (4)(5) |
(800) | 222,419 | - | 12,931 | - | 48,283 | (729 | ) | 32,897 | 12,931 | ||||||||||||||||||||||||||
|
|
|
|
|
|
|
|
|
|
|
|
|
|
|
|
|
|
|
|||||||||||||||||||
| Total |
$ | 112,170 | $ | 3,958,623 | $ | 1,134,849 | $ | 2,239,240 | $ | 220,182 | $ | 1,322,454 | $ | 279,439 | $ | 336,091 | $ | 2,255,323 | ||||||||||||||||||
|
|
|
|
|
|
|
|
|
|
|
|
|
|
|
|
|
|
|
|||||||||||||||||||
| 2012 |
||||||||||||||||||||||||||||||||||||
| U.S. Property & Casualty |
$ | 30,400 | $ | 668,824 | $ | 421,195 | $ | 354,050 | $ | - | $ | 209,286 | $ | 36,289 | $ | 79,694 | $ | 383,938 | ||||||||||||||||||
| Professional Liability |
15,382 | 1,754,824 | 305,315 | 394,687 | - | 229,873 | 25,365 | 41,356 | 378,138 | |||||||||||||||||||||||||||
| Accident & Health |
3,296 | 301,241 | 20,252 | 831,827 | - | 601,076 | 63,559 | 58,671 | 835,008 | |||||||||||||||||||||||||||
| U.S. Surety & Credit |
34,235 | 109,790 | 117,150 | 207,955 | - | 38,535 | 72,327 | 41,292 | 195,904 | |||||||||||||||||||||||||||
| International |
34,789 | 734,779 | 206,044 | 412,853 | - | 189,410 | 83,368 | 63,360 | 419,155 | |||||||||||||||||||||||||||
| Investing |
- | - | - | - | 222,634 | - | - | - | - | |||||||||||||||||||||||||||
| Corporate & Other (4)(5) |
(751 | ) | 257,033 | - | 41,253 | - | 69,894 | 293 | 42,124 | 41,253 | ||||||||||||||||||||||||||
|
|
|
|
|
|
|
|
|
|
|
|
|
|
|
|
|
|
|
|||||||||||||||||||
| Total |
$ | 117,351 | $ | 3,826,491 | $ | 1,069,956 | $ | 2,242,625 | $ | 222,634 | $ | 1,338,074 | $ | 281,201 | $ | 326,497 | $ | 2,253,396 | ||||||||||||||||||
|
|
|
|
|
|
|
|
|
|
|
|
|
|
|
|
|
|
|
|||||||||||||||||||
| (1) | Columns B, F, H, I and K are shown including the effects of reinsurance. |
| (2) | Columns C and D are shown excluding the effect of reinsurance. |
| (3) | Other operating expenses are after all corporate expense allocations have been charged or credited to the individual segments. |
| (4) | Includes internal claims department costs and activity related to Exited Lines. |
| (5) | We revised the amounts in Columns H and J to correctly classify internal claims department costs as benefits, claims, losses and settlement expenses. These costs had been included in other operating expenses. |
Note: Column E is omitted because we have no other policy claims and benefits payable.
S-6
Table of Contents
HCC INSURANCE HOLDINGS, INC. AND SUBSIDIARIES
REINSURANCE
(in thousands)
|
Column A |
Column B | Column C | Column D | Column E | Column F | |||||||||||||||
| Direct amount | Ceded to other companies |
Assumed
from other companies |
Net amount | Percent
of amount assumed to net |
||||||||||||||||
| Year ended December 31, 2014 |
||||||||||||||||||||
| Life insurance in force |
$ | 512,185 | $ | 195,492 | $ | - | $ | 316,693 | — | % | ||||||||||
|
|
|
|
|
|
|
|
|
|
|
|||||||||||
| Earned premium |
||||||||||||||||||||
| Property and liability insurance |
$ | 1,554,031 | $ | 538,021 | $ | 278,663 | $ | 1,294,673 | 22 | % | ||||||||||
| Accident and health insurance |
1,079,402 | 78,681 | 28,233 | 1,028,954 | 3 | % | ||||||||||||||
|
|
|
|
|
|
|
|
|
|||||||||||||
| Total |
$ | 2,633,433 | $ | 616,702 | $ | 306,896 | $ | 2,323,627 | 13 | % | ||||||||||
|
|
|
|
|
|
|
|
|
|
|
|||||||||||
| Year ended December 31, 2013 |
||||||||||||||||||||
| Life insurance in force |
$ | 904,189 | $ | 210,475 | $ | - | $ | 693,714 | — | % | ||||||||||
|
|
|
|
|
|
|
|
|
|
|
|||||||||||
| Earned premium |
||||||||||||||||||||
| Property and liability insurance |
$ | 1,499,179 | $ | 498,794 | $ | 293,256 | $ | 1,293,641 | 23 | % | ||||||||||
| Accident and health insurance |
983,348 | 77,837 | 40,088 | 945,599 | 4 | % | ||||||||||||||
|
|
|
|
|
|
|
|
|
|||||||||||||
| Total |
$ | 2,482,527 | $ | 576,631 | $ | 333,344 | $ | 2,239,240 | 15 | % | ||||||||||
|
|
|
|
|
|
|
|
|
|
|
|||||||||||
| Year ended December 31, 2012 |
||||||||||||||||||||
| Life insurance in force |
$ | 977,492 | $ | 238,389 | $ | - | $ | 739,103 | — | % | ||||||||||
|
|
|
|
|
|
|
|
|
|
|
|||||||||||
| Earned premium |
||||||||||||||||||||
| Property and liability insurance |
$ | 1,483,722 | $ | 446,890 | $ | 282,500 | $ | 1,319,332 | 21 | % | ||||||||||
| Accident and health insurance |
913,034 | 58,852 | 69,111 | 923,293 | 7 | % | ||||||||||||||
|
|
|
|
|
|
|
|
|
|||||||||||||
| Total |
$ | 2,396,756 | $ | 505,742 | $ | 351,611 | $ | 2,242,625 | 16 | % | ||||||||||
|
|
|
|
|
|
|
|
|
|
|
|||||||||||
S-7
Table of Contents
HCC INSURANCE HOLDINGS, INC. AND SUBSIDIARIES
VALUATION AND QUALIFYING ACCOUNTS
(in thousands)
| 2014 | 2013 | 2012 | ||||||||||
| Allowance for doubtful accounts |
||||||||||||
| Balance at beginning of year |
$ | 5,777 | $ | 3,622 | $ | 3,668 | ||||||
| Provision expense |
1,448 | 2,807 | 1,584 | |||||||||
| Amounts written off and other |
(2,140 | ) | (652 | ) | (1,630 | ) | ||||||
|
|
|
|
|
|
|
|||||||
| Balance at end of year |
$ | 5,085 | $ | 5,777 | $ | 3,622 | ||||||
|
|
|
|
|
|
|
|||||||
| Reserve for uncollectible reinsurance |
||||||||||||
| Balance at beginning of year |
$ | 1,500 | $ | 1,500 | $ | 1,875 | ||||||
| Provision recovery |
- | - | (375 | ) | ||||||||
|
|
|
|
|
|
|
|||||||
| Balance at end of year |
$ | 1,500 | $ | 1,500 | $ | 1,500 | ||||||
|
|
|
|
|
|
|
|||||||
S-8