Attached files
| file | filename |
|---|---|
| EX-99.1 - EXHIBIT 99.1 - ANNALY CAPITAL MANAGEMENT INC | a51045885ex99_1.htm |
| 8-K - ANNALY CAPITAL MANAGEMENT, INC. 8-K - ANNALY CAPITAL MANAGEMENT INC | a51045885.htm |
Exhibit 99.2

February 24, 2015 4Q 2014 Stockholder Supplement
1 This news release and our public documents to which we refer contain or incorporate by reference certain forward-looking statements which are based on various assumptions (some of which are beyond our control) and may be identified by reference to a future period or periods or by the use of forward-looking terminology, such as "may," "will," "believe," "expect," "anticipate," "continue," or similar terms or variations on those terms or the negative of those terms. Actual results could differ materially from those set forth in forward-looking statements due to a variety of factors, including, but not limited to, changes in interest rates; changes in the yield curve; changes in prepayment rates; the availability of mortgage-backed securities and other securities for purchase; the availability of financing and, if available, the terms of any financings; changes in the market value of our assets; changes in business conditions and the general economy; our ability to grow the commercial mortgage business; credit risks related to our investments in commercial real estate assets and corporate debt; our ability to consummate any contemplated investment opportunities; changes in government regulations affecting our business; our ability to maintain our qualification as a REIT for federal income tax purposes; our ability to maintain our exemption from registration under the Investment Company Act of 1940, as amended; risks associated with the businesses of our subsidiaries, including the investment advisory business of a wholly-owned subsidiary and the broker-dealer business of a wholly-owned subsidiary. For a discussion of the risks and uncertainties which could cause actual results to differ from those contained in the forward-looking statements, see "Risk Factors" in our most recent Annual Report on Form 10-K and any subsequent Quarterly Reports on Form 10-Q. We do not undertake, and specifically disclaim any obligation, to publicly release the result of any revisions which may be made to any forward-looking statements to reflect the occurrence of anticipated or unanticipated events or circumstances after the date of such statements. Safe Harbor Notice
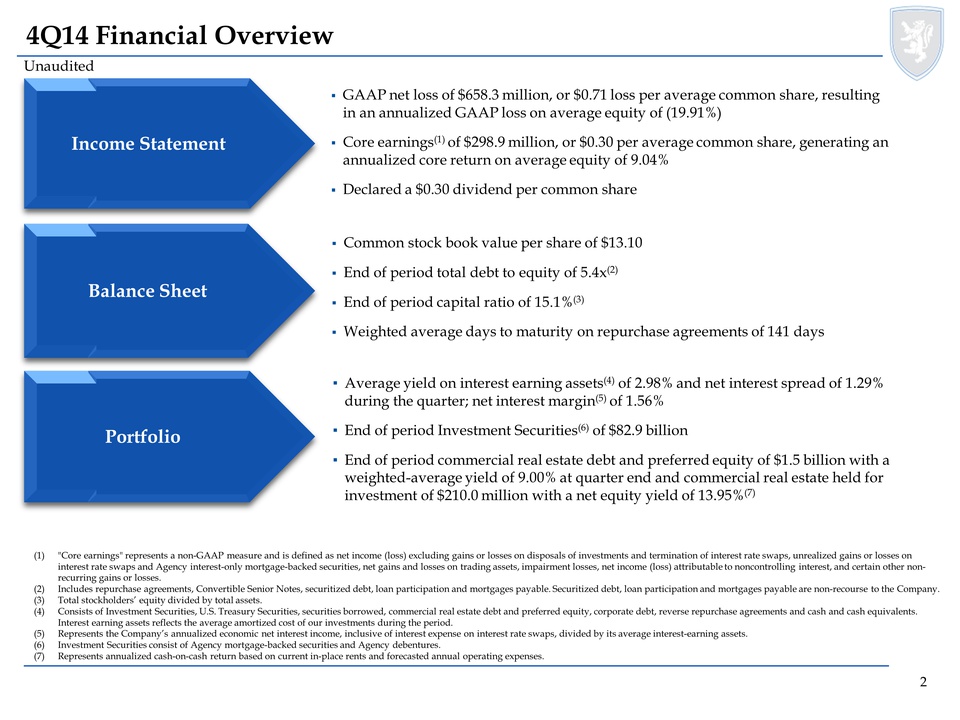
2 (1)"Core earnings" represents a non-GAAP measure and is defined as net income (loss) excluding gains or losses on disposals of investments and termination of interest rate swaps, unrealized gains or losses on interest rate swaps and Agency interest-only mortgage-backed securities, net gains and losses on trading assets, impairment losses, net income (loss) attributable to noncontrolling interest, and certain other non-recurring gains or losses. (2)Includes repurchase agreements, Convertible Senior Notes, securitized debt, loan participation and mortgages payable. Securitized debt, loan participation and mortgages payable are non-recourse to the Company. (3)Total stockholders’ equity divided by total assets. (4)Consists of Investment Securities, U.S. Treasury Securities, securities borrowed, commercial real estate debt and preferred equity, corporate debt, reverse repurchase agreements and cash and cash equivalents. Interest earning assets reflects the average amortized cost of our investments during the period. (5)Represents the Company’s annualized economic net interest income, inclusive of interest expense on interest rate swaps, divided by its average interest-earning assets. (6)Investment Securities consist of Agency mortgage-backed securities and Agency debentures. (7)Represents annualized cash-on-cash return based on current in-place rents and forecasted annual operating expenses. 4Q14 Financial Overview GAAP net loss of $658.3 million, or $0.71 loss per average common share, resulting in an annualized GAAP loss on average equity of (19.91%) Core earnings(1) of $298.9 million, or $0.30 per average common share, generating an annualized core return on average equity of 9.04% Declared a $0.30 dividend per common share Common stock book value per share of $13.10 End of period total debt to equity of 5.4x(2) End of period capital ratio of 15.1%(3) Weighted average days to maturity on repurchase agreements of 141 days ▪Average yield on interest earning assets(4) of 2.98% and net interest spread of 1.29% during the quarter; net interest margin(5) of 1.56% ▪End of period Investment Securities(6) of $82.9 billion ▪End of period commercial real estate debt and preferred equity of $1.5 billion with a weighted-average yield of 9.00% at quarter end and commercial real estate held for investment of $210.0 million with a net equity yield of 13.95%(7) Income Statement Balance Sheet Portfolio Unaudited
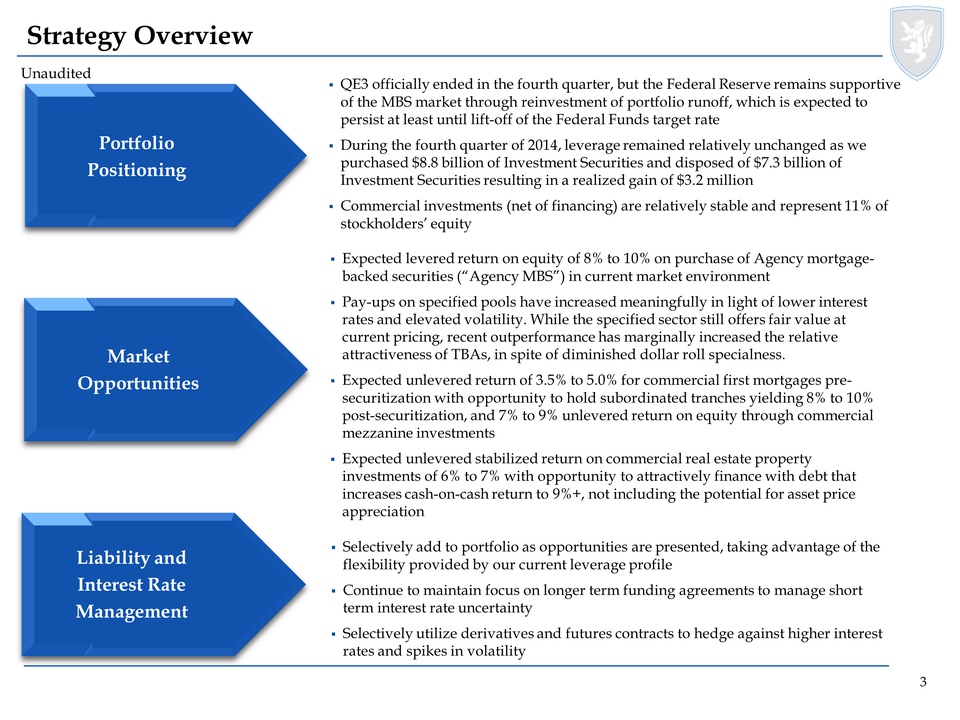
3 Strategy Overview Portfolio Positioning Market Opportunities Liability and Interest Rate Management Unaudited QE3 officially ended in the fourth quarter, but the Federal Reserve remains supportive of the MBS market through reinvestment of portfolio runoff, which is expected to persist at least until lift-off of the Federal Funds target rate During the fourth quarter of 2014, leverage remained relatively unchanged as we purchased $8.8 billion of Investment Securities and disposed of $7.3 billion of Investment Securities resulting in a realized gain of $3.2 million Commercial investments (net of financing) are relatively stable and represent 11% of stockholders’ equity Expected levered return on equity of 8% to 10% on purchase of Agency mortgage-backed securities (“Agency MBS”) in current market environment Pay-ups on specified pools have increased meaningfully in light of lower interest rates and elevated volatility. While the specified sector still offers fair value at current pricing, recent outperformance has marginally increased the relative attractiveness of TBAs, in spite of diminished dollar roll specialness. Expected unlevered return of 3.5% to 5.0% for commercial first mortgages pre-securitization with opportunity to hold subordinated tranches yielding 8% to 10% post-securitization, and 7% to 9% unlevered return on equity through commercial mezzanine investments Expected unlevered stabilized return on commercial real estate property investments of 6% to 7% with opportunity to attractively finance with debt that increases cash-on-cash return to 9%+, not including the potential for asset price appreciation Selectively add to portfolio as opportunities are presented, taking advantage of the flexibility provided by our current leverage profile Continue to maintain focus on longer term funding agreements to manage short term interest rate uncertainty Selectively utilize derivatives and futures contracts to hedge against higher interest rates and spikes in volatility
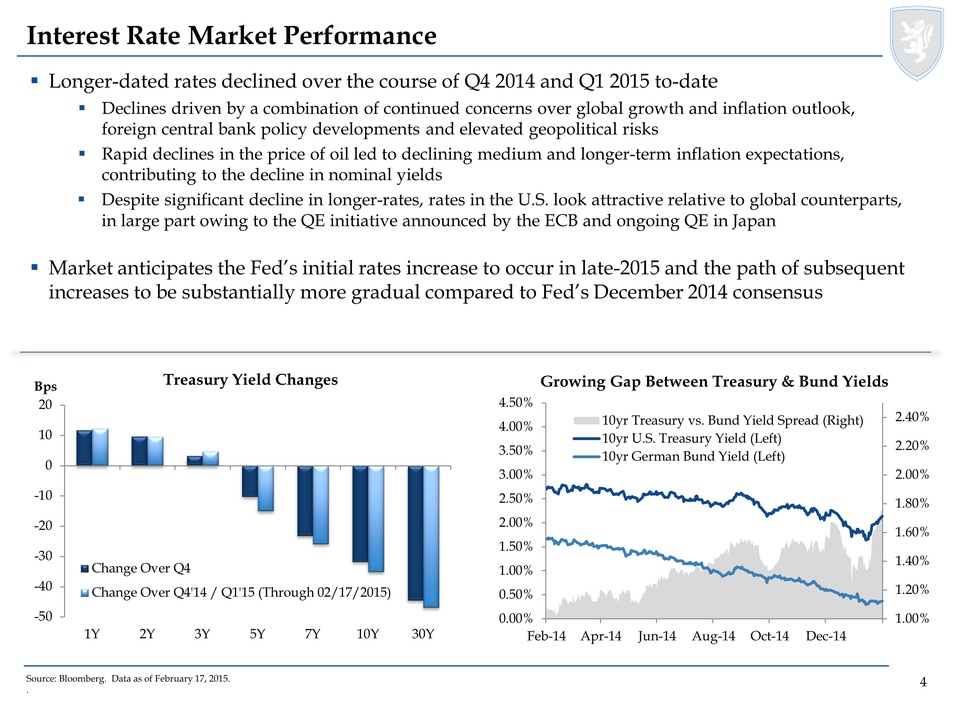
4 Source: Bloomberg. Data as of February 17, 2015. Interest Rate Market Performance Longer-dated rates declined over the course of Q4 2014 and Q1 2015 to-date Declines driven by a combination of continued concerns over global growth and inflation outlook, foreign central bank policy developments and elevated geopolitical risks Rapid declines in the price of oil led to declining medium and longer-term inflation expectations, contributing to the decline in nominal yields Despite significant decline in longer-rates, rates in the U.S. look attractive relative to global counterparts, in large part owing to the QE initiative announced by the ECB and ongoing QE in Japan Market anticipates the Fed’s initial rates increase to occur in late-2015 and the path of subsequent increases to be substantially more gradual compared to Fed’s December 2014 consensus -50 -40 -30 -20 -10 0 10 20 1Y 2Y 3Y 5Y 7Y 10Y 30Y Bps Treasury Yield Changes Change Over Q4 Change Over Q4'14 / Q1'15 (Through 02/17/2015) 1.00% 1.20% 1.40% 1.60% 1.80% 2.00% 2.20% 2.40% 0.00% 0.50 1.00% 1.50% 2.00% 2.50% 3.00% 3.50% 4.00% 4.50% Feb-14 Apr-14 Jun-14 Aug-14 Oct-14 Dec-14 Growing Gap Between Treasury & Bund Yields 10yr Treasury vs. Bund Yield Spread (Right) 10yr U.S. Treasury Yield (Left) 10yr German Bund Yield (Left) 5 5 1.5% 2.0% 2.5% 3.0% 3.5% 4.0% 4.5% -3.00 -2.00 -1.00 0.00 1.00 2.00 3.00 Sep-14 Oct-14 Nov-14 Dec-14 Jan-15 Hundreds $ MBS Hedge-Adjusted Price Performance * 10y Swaps Yield (Right) FN30 3.5% FN30 4.0% FN15 3.0% FN15 3.5% Source: Barclays, JPMorgan, Annaly calculations * MBS relative performance vs. swaps reflects cumulative price performance of a $100 MBS position hedged with a combination of 2y, 5y and 10y interest rate swaps on September 30, 2014. Calculations are based on Barclays’ model partial duration profile. Cumulative performance does not include net coupon earnings. Q1 2015 cumulative performance is through February 17, 2015.
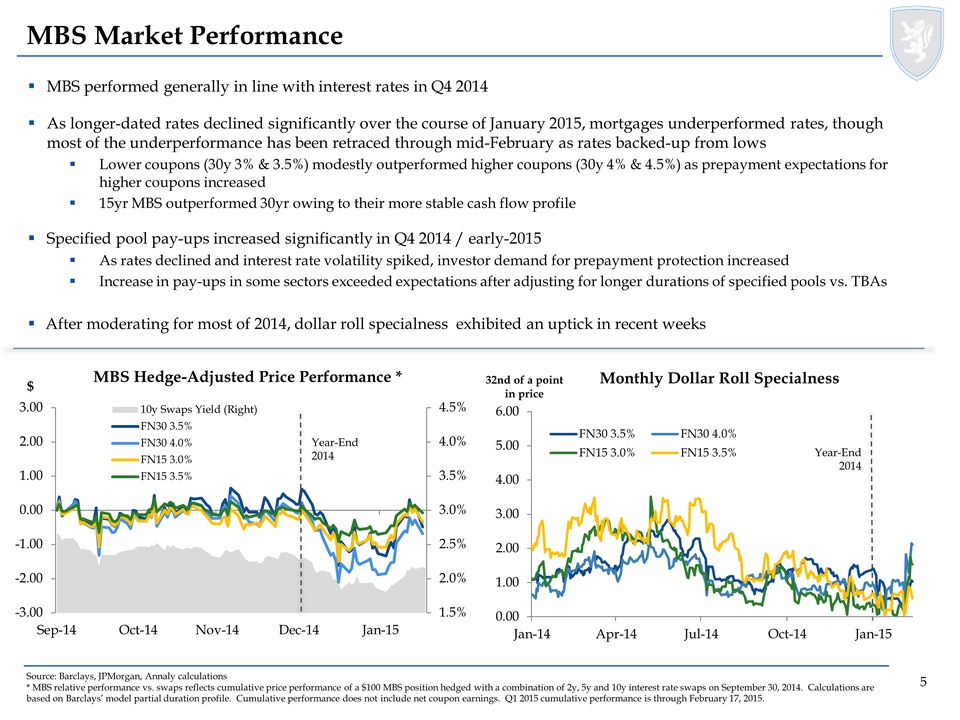
5 MBS Market Performance MBS performed generally in line with interest rates in Q4 2014 As longer-dated rates declined significantly over the course of January 2015, mortgages underperformed rates, though most of the underperformance has been retraced through mid-February as rates backed-up from lows Lower coupons (30y 3% & 3.5%) modestly outperformed higher coupons (30y 4% & 4.5%) as prepayment expectations for higher coupons increased 15yr MBS outperformed 30yr owing to their more stable cash flow profile Specified pool pay-ups increased significantly in Q4 2014 / early-2015 As rates declined and interest rate volatility spiked, investor demand for prepayment protection increased Increase in pay-ups in some sectors exceeded expectations after adjusting for longer durations of specified pools vs. TBAs After moderating for most of 2014, dollar roll specialness exhibited an uptick in recent weeks Year-End 2014 0.00 1.00 2.00 3.00 4.00 5.00 6.00 Jan-14 Apr-14 Jul-14 Oct-14 Jan-15 32nd of a point in price Monthly Dollar Roll Specialness FN30 3.5% FN30 4.0% FN15 3.0% FN15 3.5% Year-End 2014
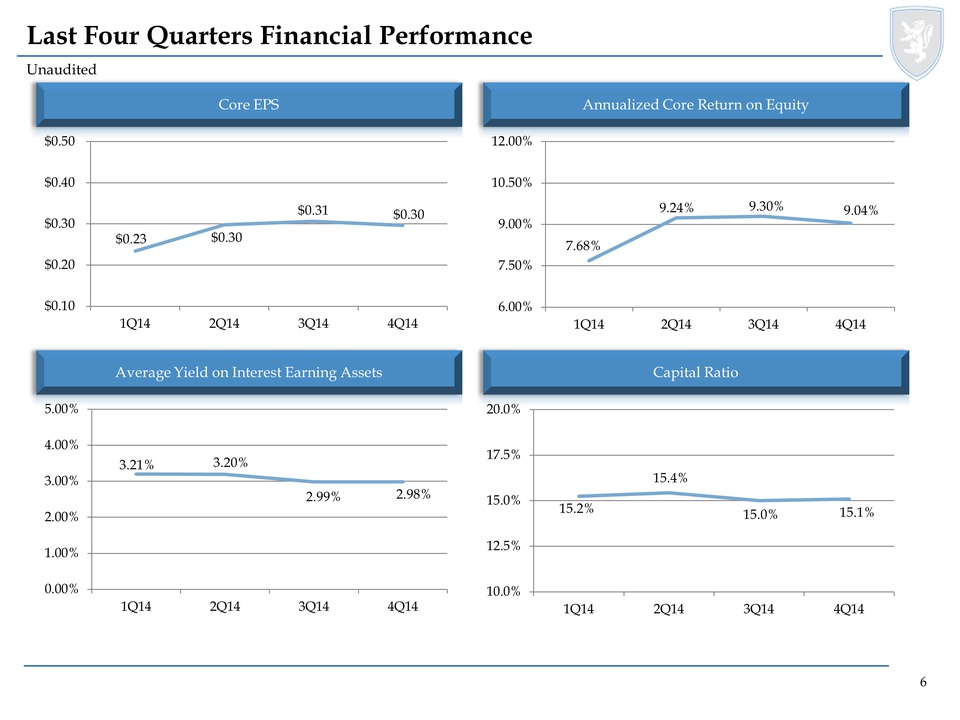
6 Last Four Quarters Financial Performance Unaudited Core EPS Annualized Core Return on Equity Average Yield on Interest Earning Assets Capital Ratio $0.23 $0.30 $0.31 $0.30 $0.10 $0.20 $0.30 $0.40 $0.50 1Q14 2Q144Q14 3.21% 3.20% 2.99% 2.98% 0.00% 1.00% 2.00% 3.00% 4.00% 5.00% 1Q14 2Q14 3Q14 4Q14 15.2% 15.4% 15.0% 15.1% 10.0% 12.5% 15.0% 17.5% 20.0% 1Q14 2Q14 3Q14 4Q14 7.68% 9.24% 9.30% 9.04% 6.00% 7.50% 9.00% 10.50% 12.00% 1Q14 2Q14 3Q14 4Q14
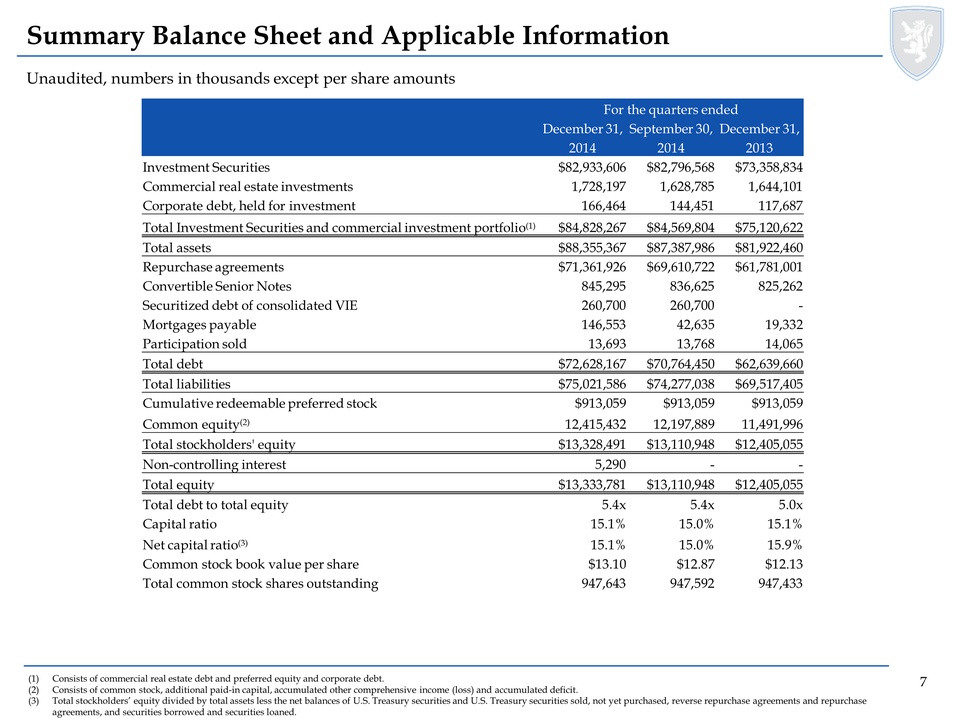
7 7 Unaudited, numbers in thousands except per share amounts Summary Balance Sheet and Applicable Information (1)Consists of commercial real estate debt and preferred equity and corporate debt. (2)Consists of common stock, additional paid-in capital, accumulated other comprehensive income (loss) and accumulated deficit. (3)Total stockholders’ equity divided by total assets less the net balances of U.S. Treasury securities and U.S. Treasury securities sold, not yet purchased, reverse repurchase agreements and repurchase agreements, and securities borrowed and securities loaned. For the quarters ended December 31, September 30, December 31, 2014 2014 2013 Investment Securities $82,933,606 $82,796,568 $73,358,834 Commercial real estate investments 1,728,197 1,628,785 1,644,101 Corporate debt, held for investment 166,464 144,451 117,687 Total Investment Securities and commercial investment portfolio(1) $84,828,267 $84,569,804 $75,120,622 Total assets $88,355,367 $87,387,986 $81,922,460 Repurchase agreements $71,361,926 $69,610,722 $61,781,001 Convertible Senior Notes 845,295 836,625 825,262 Securitized debt of consolidated VIE 260,700 260,700 - Mortgages payable 146,553 42,635 19,332 Participation sold 13,693 13,768 14,065 Total debt $72,628,167 $70,764,450 $62,639,660 Total liabilities $75,021,586 $74,277,038 $69,517,405 Cumulative redeemable preferred stock $913,059 $913,059 $913,059 Common equity(2) 12,415,432 12,197,889 11,491,996 Total stockholders' equity $13,328,491 $13,110,948 $12,405,055 Non-controlling interest 5,290 - - Total equity $13,333,781 $13,110,948 $12,405,055 Total debt to total equity 5.4x 5.4x 5.0x Capital ratio 15.1% 15.0% 15.1% Net capital ratio(3) 15.1% 15.0% 15.9% Common stock book value per share $13.10 $12.87 $12.13 Total common stock shares outstanding 947,643 947,592 947,433
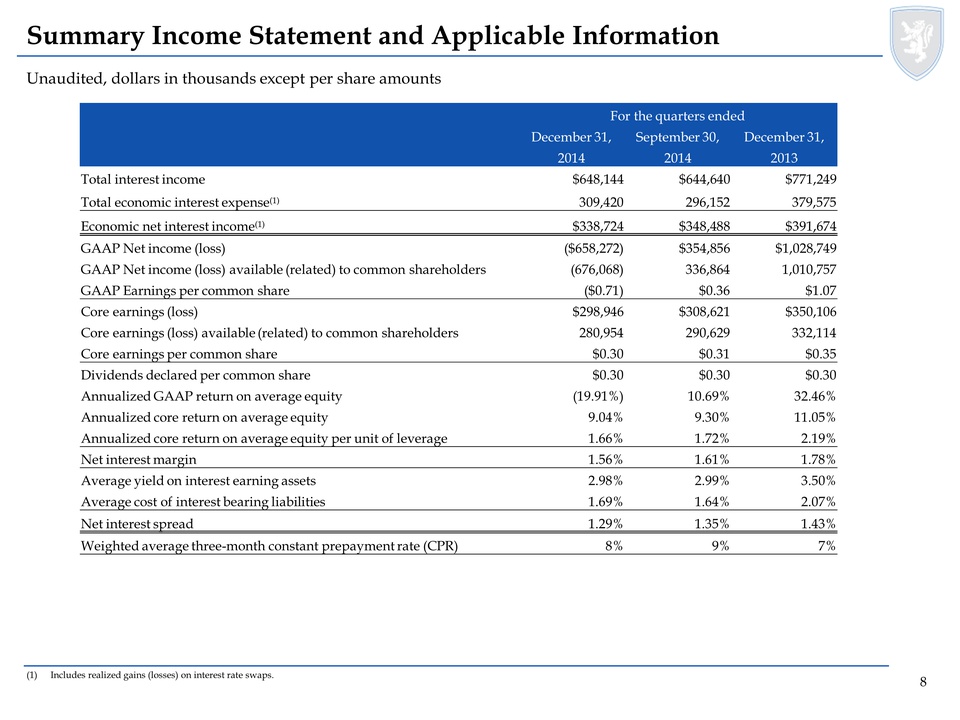
8 8 Unaudited, dollars in thousands except per share amounts Summary Income Statement and Applicable Information (1)Includes realized gains (losses) on interest rate swaps. For the quarters ended December 31, September 30, December 31, 2014 2014 2013 Total interest income $648,144 $644,640 $771,249 Total economic interest expense(1) 309,420 296,152 379,575 Economic net interest income(1) $338,724 $348,488 $391,674 GAAP Net income (loss) ($658,272) $354,856 $1,028,749 GAAP Net income (loss) available (related) to common shareholders (676,068) 336,864 1,010,757 GAAP Earnings per common share ($0.71) $0.36 $1.07 Core earnings (loss) $298,946 $308,621 $350,106 Core earnings (loss) available (related) to common shareholders 280,954 290,629 332,114 Core earnings per common share $0.30 $0.31 $0.35 Dividends declared per common share $0.30 $0.30 $0.30 Annualized GAAP return on average equity (19.91%) 10.69% 32.46% Annualized core return on average equity 9.04% 9.30% 11.05% Annualized core return on average equity per unit of leverage 1.66% 1.72% 2.19% Net interest margin 1.56% 1.61% 1.78% Average yield on interest earning assets 2.98% 2.99% 3.50% Average cost of interest bearing liabilities 1.69% 1.64% 2.07% Net interest spread 1.29% 1.35% 1.43% Weighted average three-month constant prepayment rate (CPR) 8% 9% 7%
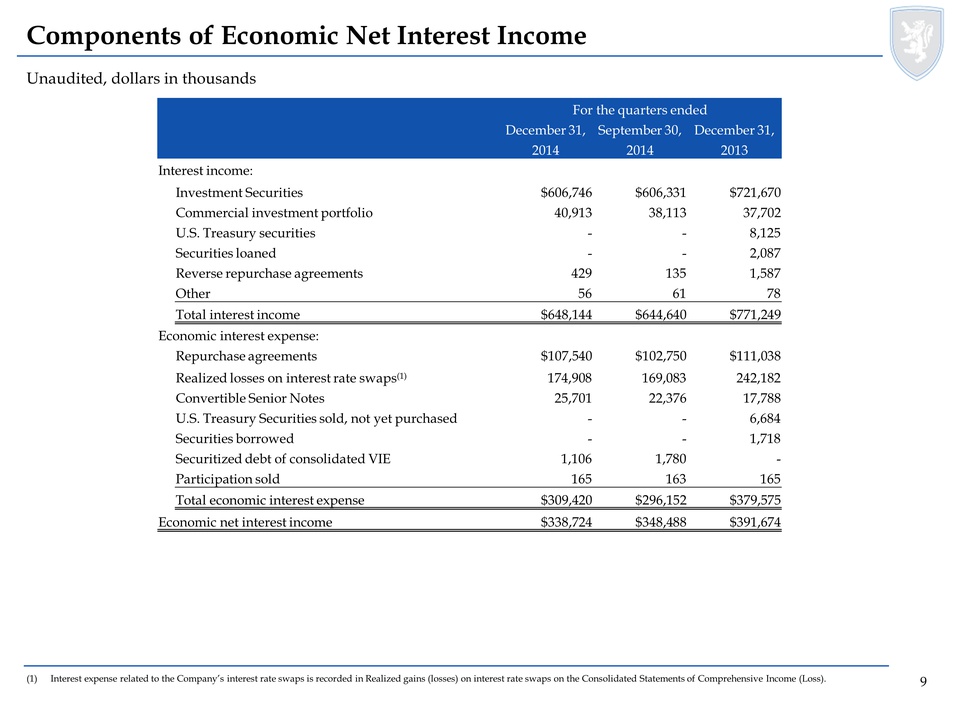
9 Unaudited, dollars in thousands Components of Economic Net Interest Income (1)Interest expense related to the Company’s interest rate swaps is recorded in Realized gains (losses) on interest rate swaps on the Consolidated Statements of Comprehensive Income (Loss). For the quarters ended December 31, September 30, December 31, 2014 2014 2013 Interest income: Investment Securities $606,746 $606,331 $721,670 Commercial investment portfolio 40,913 38,113 37,702 U.S. Treasury securities - - 8,125 Securities loaned - - 2,087 Reverse repurchase agreements 429 135 1,587 Other 56 61 78 Total interest income $648,144 $644,640 $771,249 Economic interest expense: Repurchase agreements $107,540 $102,750 $111,038 Realized losses on interest rate swaps(1) 174,908 169,083 242,182 Convertible Senior Notes 25,701 22,376 17,788 U.S. Treasury Securities sold, not yet purchased - - 6,684 Securities borrowed - - 1,718 Securitized debt of consolidated VIE 1,106 1,780 - Participation sold 165 163 165 Total economic interest expense $309,420 $296,152 $379,575 Economic net interest income $338,724 $348,488 $391,674
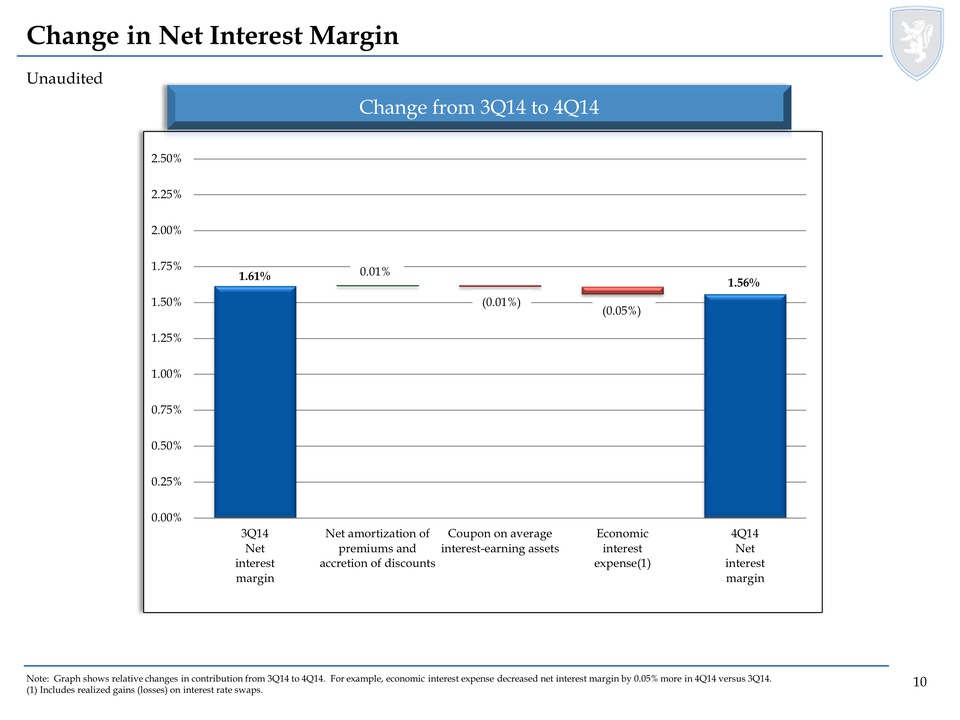
10 Unaudited Change in Net Interest Margin Change from 3Q14 to 4Q14 Note: Graph shows relative changes in contribution from 3Q14 to 4Q14. For example, economic interest expense decreased net interest margin by 0.05% more in 4Q14 versus 3Q14. (1) Includes realized gains (losses) on interest rate swaps. 1.56% 1.61% 0.00% 0.25% 0.50% 0.75% 1.00% 1.25% 1.50% 1.75% 2.00% 2.25% 2.50% 3Q14 Net interest margin Net amortization of premiums and accretion of discounts Coupon on average interest-earning assets Economic interest expense(1) 4Q14 Net interest margin (0.01%) (0.05%) 0.01%
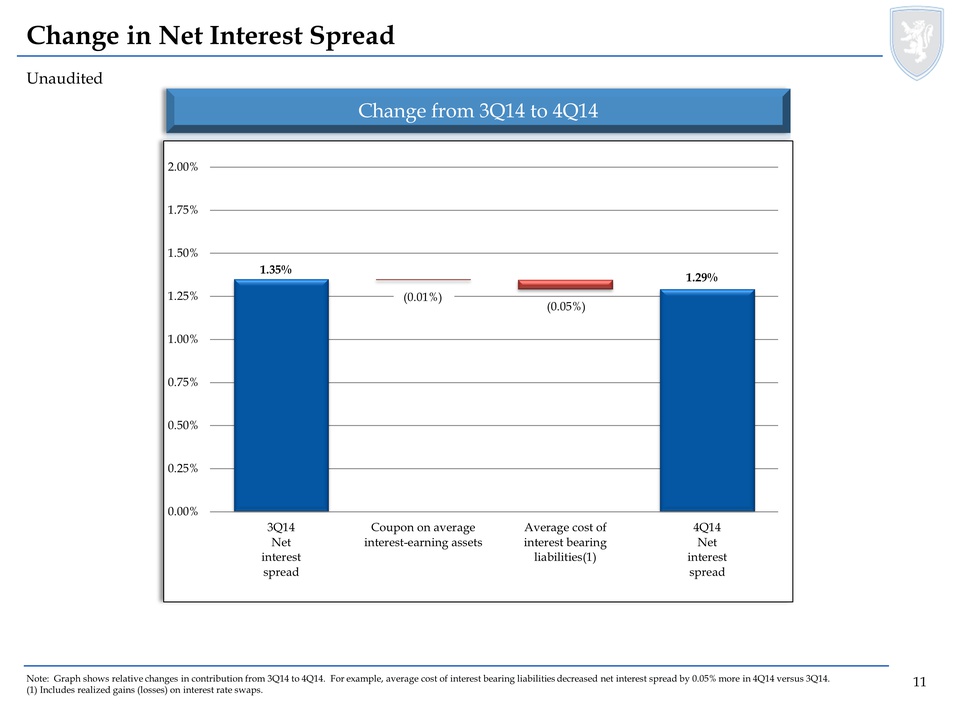
11 Unaudited Change in Net Interest Spread Change from 3Q14 to 4Q14 Note: Graph shows relative changes in contribution from 3Q14 to 4Q14. For example, average cost of interest bearing liabilities decreased net interest spread by 0.05% more in 4Q14 versus 3Q14. (1) Includes realized gains (losses) on interest rate swaps. 1.29% 1.35% 0.00% 0.25% 0.50% 0.75% 1.00% 1.25% 1.50% 1.75% 2.00% 3Q14 Net interest spread Coupon on average interest-earning assets Average cost of interest bearing liabilities(1) 4Q14 Net interest spread (0.01%) (0.05%)
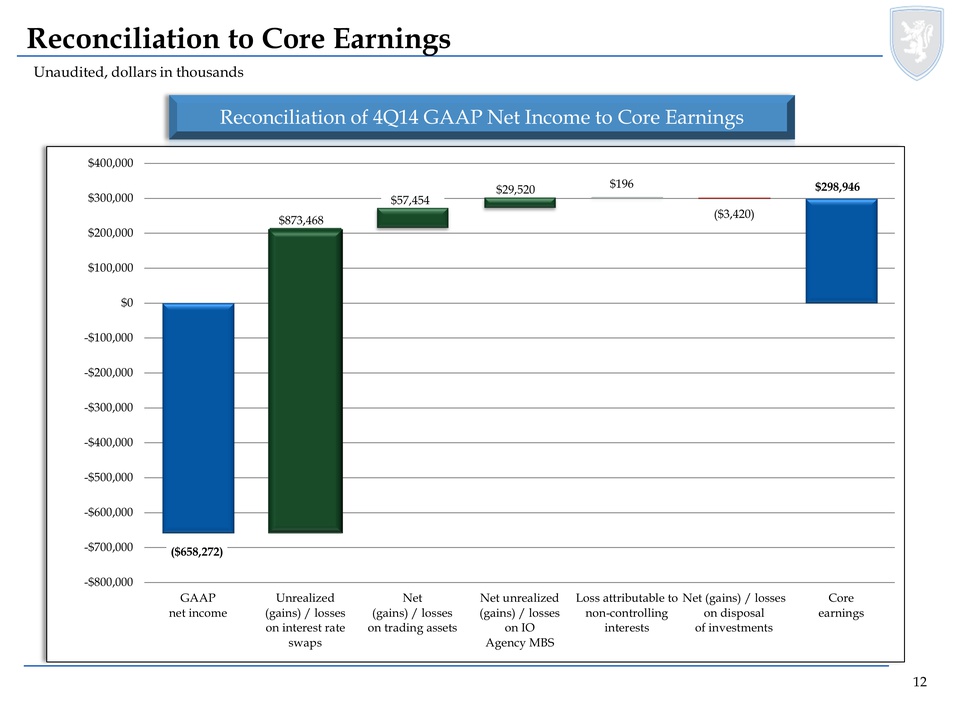
12 Unaudited, dollars in thousands Reconciliation to Core Earnings Reconciliation of 4Q14 GAAP Net Income to Core Earnings $298,946 ($658,272) -$800,000 -$700,000 -$600,000 -$500,000 -$400,000 -$300,000 -$200,000 -$100,000 $0 $100,000 $200,000 $300,000 $400,000 GAAP net income Unrealized (gains) / losses on interest rate swaps Net (gains) / losses on trading assets Net unrealized (gains) / losses on IO Agency MBS Loss attributable to non-controlling interests Net (gains) / losses on disposal of investments Core earnings $29,520 $57,454 $873,468 ($3,420) $196
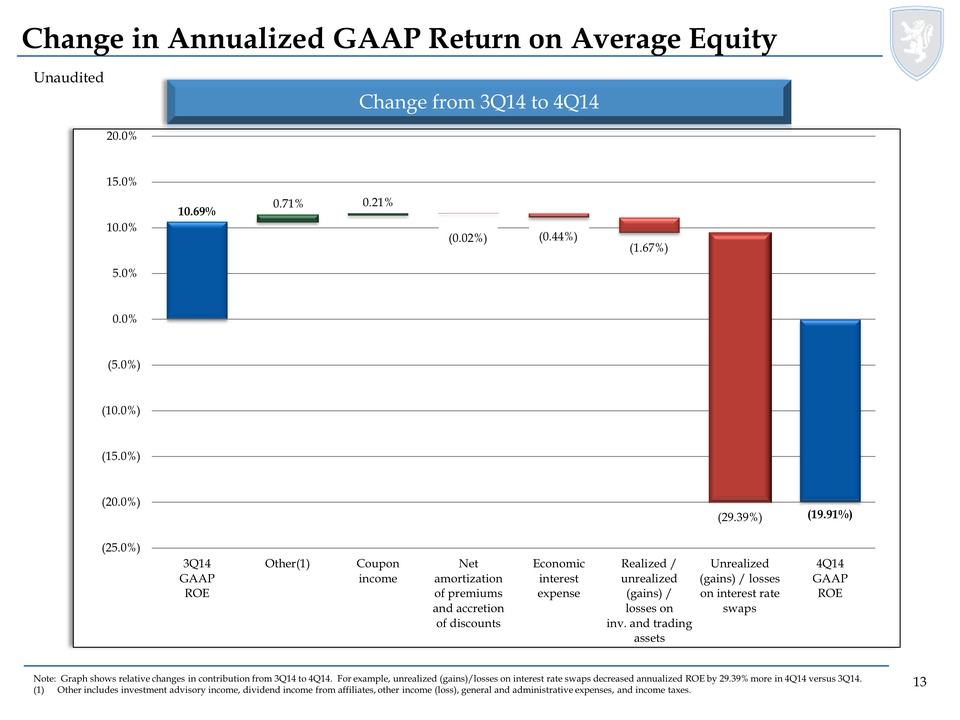
13 Unaudited Change in Annualized GAAP Return on Average Equity Change from 3Q14 to 4Q14 Note: Graph shows relative changes in contribution from 3Q14 to 4Q14. For example, unrealized (gains)/losses on interest rate swaps decreased annualized ROE by 29.39% more in 4Q14 versus 3Q14. (1)Other includes investment advisory income, dividend income from affiliates, other income (loss), general and administrative expenses, and income taxes. (19.91%) 10.69% (25.0%) (20.0%) (15.0%) (10.0%) (5.0%) 0.0% 5.0% 10.0% 15.0% 20.0% 3Q14 GAAP ROE Other(1) Coupon income Net amortization of premiums and accretion of discounts Economic interest expense Realized / unrealized (gains) / losses on inv. and trading assets Unrealized (gains) / losses on interest rate swaps 4Q14 GAAP ROE (1.67%) (0.44%) (0.02%) 0.21% 0.71% (29.39%)
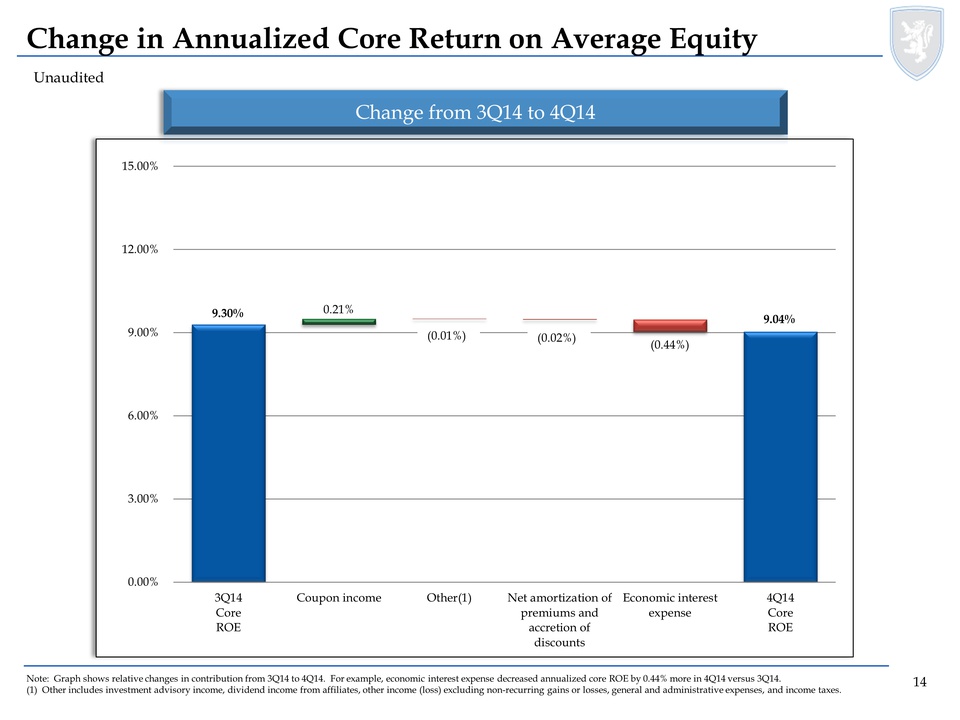
14 Unaudited Change in Annualized Core Return on Average Equity Change from 3Q14 to 4Q14 Note: Graph shows relative changes in contribution from 3Q14 to 4Q14. For example, economic interest expense decreased annualized core ROE by 0.44% more in 4Q14 versus 3Q14. (1) Other includes investment advisory income, dividend income from affiliates, other income (loss) excluding non-recurring gains or losses, general and administrative expenses, and income taxes. 9.04% 9.30% 0.00% 3.00% 6.00% 9.00% 12.00% 15.00% 3Q14 Core ROE Coupon income Other(1) Net amortization of premiums and accretion of discounts Economic interest expense 4Q14 Core ROE 0.21% (0.44%) (0.02%) (0.01%)
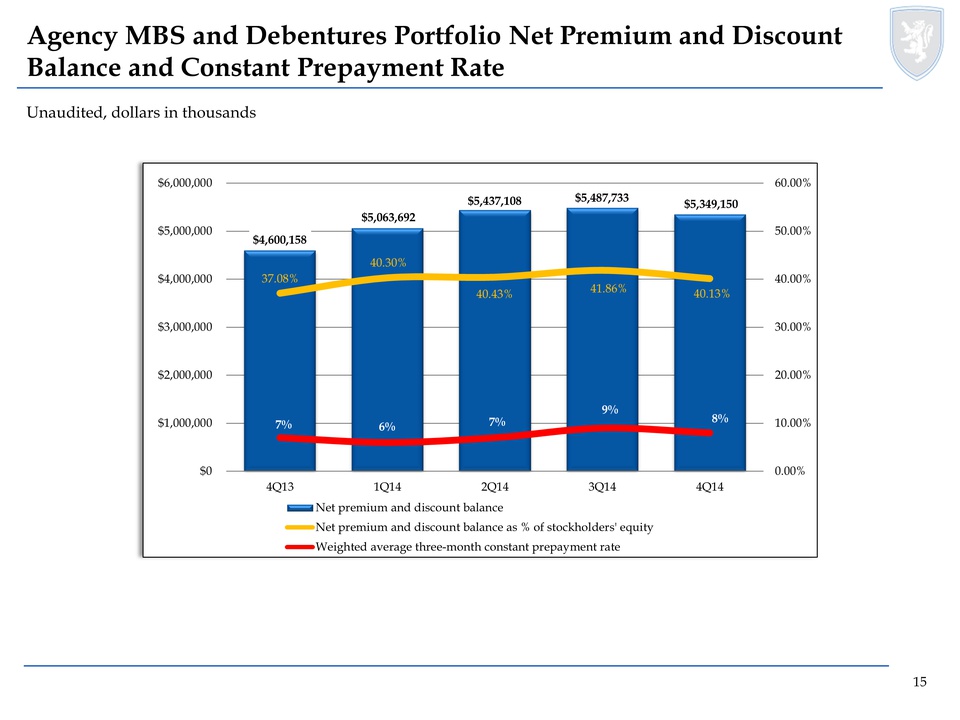
15 Unaudited, dollars in thousands Agency MBS and Debentures Portfolio Net Premium and Discount Balance and Constant Prepayment Rate $4,600,158 $5,063,692 $5,437,108 $5,487,733 $5,349,150 37.08% 40.30% 40.43% 41.86% 40.13% 7% 6% 7% 9% 8% 0.00% 10.00% 20.00% 30.00% 40.00% 50.00% 60.00% $0 $1,000,000 $2,000,000
$3,000,000 $4,000,000 $5,000,000 $6,000,000 4Q13 1Q14 2Q14 3Q14 4Q14 Net premium and discount balance Net premium and discount balance as % of stockholders' equity Weighted average three-month constant prepayment rate
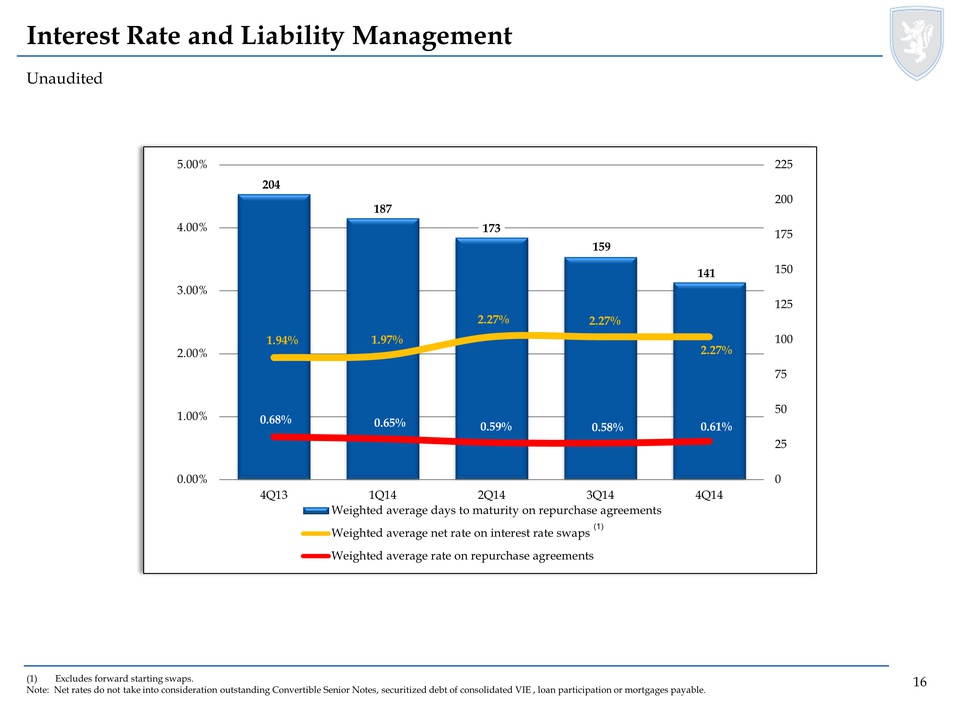
16 Unaudited Interest Rate and Liability Management (1) Excludes forward starting swaps. Note: Net rates do not take into consideration outstanding Convertible Senior Notes, securitized debt of consolidated VIE , loan participation or mortgages payable. (1) 204 187 173 159 141 1.94% 1.97% 2.27% 2.27% 2.27% 0.68% 0.65% 0.59% 0.58% 0.61% 0 25 50 75 100 125 150 175 200 225 0.00% 1.00% 2.00% 3.00% 4.00% 5.00% 4Q13 1Q14 2Q14 3Q14 4Q14 Weighted average days to maturity on repurchase agreements Weighted average net rate on interest rate swaps Weighted average rate on repurchase agreements
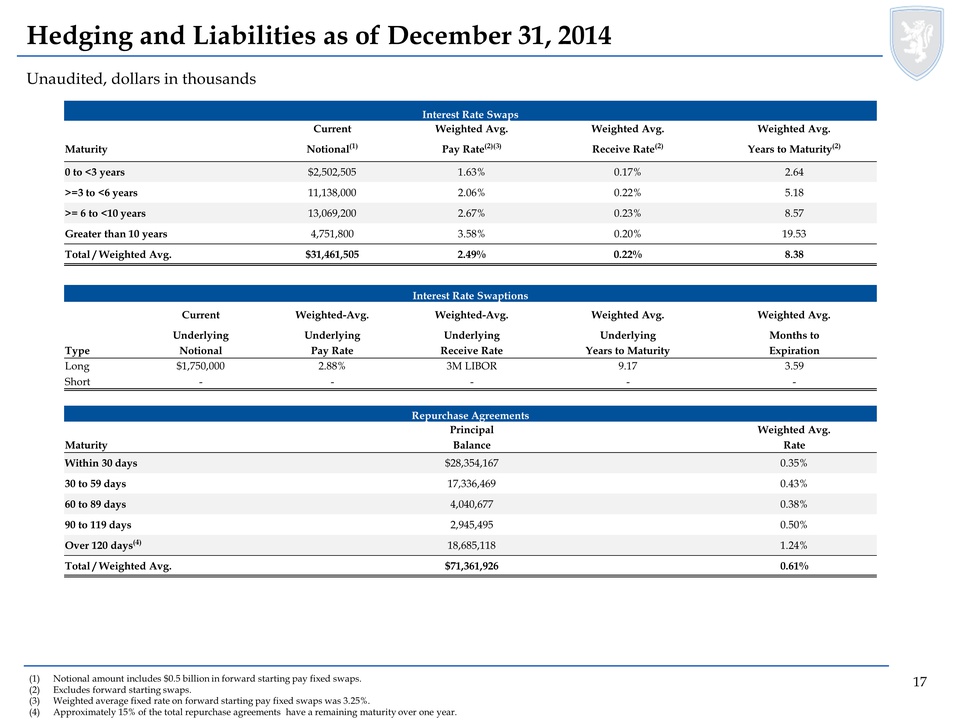
17 Hedging and Liabilities as of December 31, 2014 Unaudited, dollars in thousands (1)Notional amount includes $0.5 billion in forward starting pay fixed swaps. (2)Excludes forward starting swaps. (3)Weighted average fixed rate on forward starting pay fixed swaps was 3.25%. (4)Approximately 15% of the total repurchase agreements have a remaining maturity over one year. Interest Rate Swaps Current Weighted Avg. Weighted Avg. Weighted Avg. Maturity Notional(1) Pay Rate(2)(3) Receive Rate(2) Years to Maturity(2) 0 to <3 years $2,502,505 1.63% 0.17% 2.64 >=3 to <6 years 11,138,000 2.06% 0.22% 5.18 >= 6 to <10 years 13,069,200 2.67% 0.23% 8.57 Greater than 10 years 4,751,800 3.58% 0.20% 19.53 Total / Weighted Avg. $31,461,505 2.49% 0.22% 8.38 Interest Rate Swaptions Current Weighted-Avg. Weighted-Avg. Weighted Avg. Weighted Avg. Underlying Underlying Underlying Underlying Months to Type Notional Pay Rate Receive Rate Years to Maturity Expiration Long $1,750,000 2.88% 3M LIBOR 9.17 3.59 Short - - - - - Repurchase Agreements Principal Weighted Avg. Maturity Balance Rate Within 30 days $28,354,167 0.35% 30 to 59 days 17,336,469 0.43% 60 to 89 days 4,040,677 0.38% 90 to 119 days 2,945,495 0.50% Over 120 days(4) 18,685,118 1.24% Total / Weighted Avg. $71,361,926 0.61%
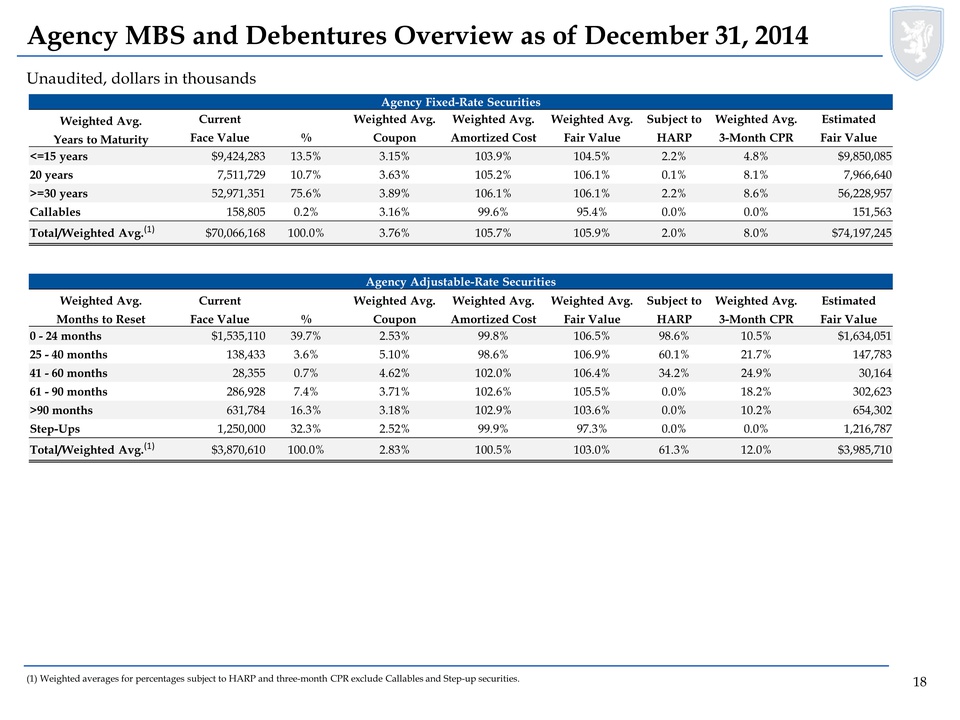
18 Unaudited, dollars in thousands Agency MBS and Debentures Overview as of December 31, 2014 (1) Weighted averages for percentages subject to HARP and three-month CPR exclude Callables and Step-up securities. Agency Fixed-Rate Securities Weighted Avg. Current Weighted Avg. Weighted Avg. Weighted Avg. Subject to Weighted Avg. Estimated Years to Maturity Face Value % Coupon Amortized Cost Fair Value HARP 3-Month CPR Fair Value <=15 years $9,424,283 13.5% 3.15% 103.9% 104.5% 2.2% 4.8% $9,850,085 20 years 7,511,729 10.7% 3.63% 105.2% 106.1% 0.1% 8.1% 7,966,640 >=30 years 52,971,351 75.6% 3.89% 106.1% 106.1% 2.2% 8.6% 56,228,957 Callables 158,805 0.2% 3.16% 99.6% 95.4% 0.0% 0.0% 151,563 Total/Weighted Avg.(1) $70,066,168 100.0% 3.76% 105.7% 105.9% 2.0% 8.0% $74,197,245 Agency Adjustable-Rate Securities Weighted Avg. Current Weighted Avg. Weighted Avg. Weighted Avg. Subject to Weighted Avg. Estimated Months to Reset Face Value % Coupon Amortized Cost Fair Value HARP 3-Month CPR Fair Value 0 - 24 months $1,535,110 39.7% 2.53% 99.8% 106.5% 98.6% 10.5% $1,634,051 25 - 40 months 138,433 3.6% 5.10% 98.6% 106.9% 60.1% 21.7% 147,783 41 - 60 months 28,355 0.7% 4.62% 102.0% 106.4% 34.2% 24.9% 30,164 61 - 90 months 286,928 7.4% 3.71% 102.6% 105.5% 0.0% 18.2% 302,623 >90 months 631,784 16.3% 3.18% 102.9% 103.6% 0.0% 10.2% 654,302 Step-Ups 1,250,000 32.3% 2.52% 99.9% 97.3% 0.0% 0.0% 1,216,787 Total/Weighted Avg.(1) $3,870,610 100.0% 2.83% 100.5% 103.0% 61.3% 12.0% $3,985,710
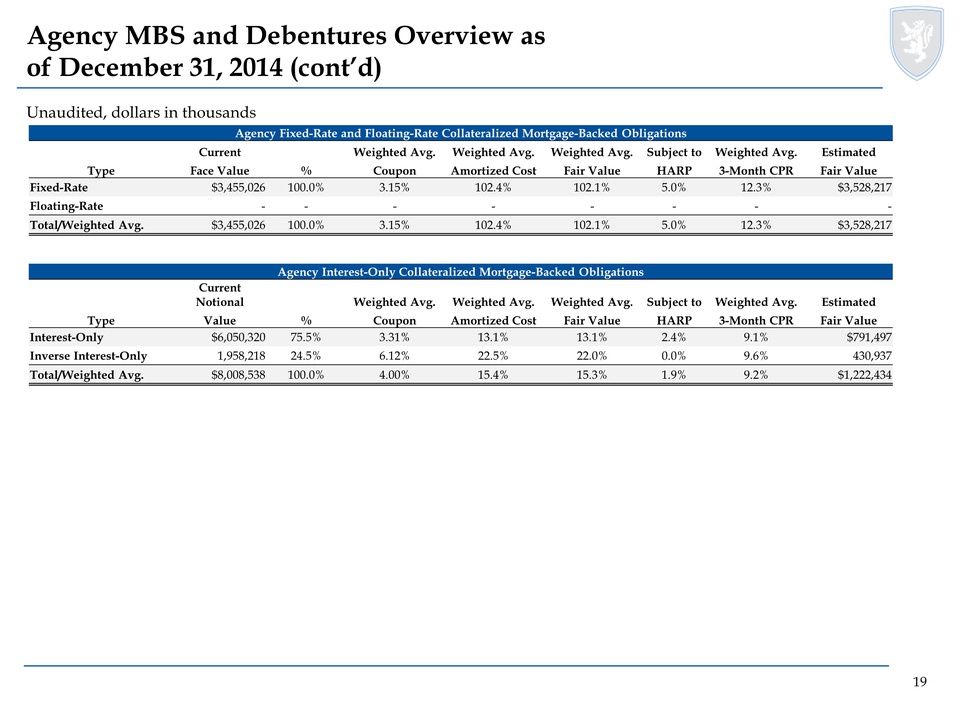
19 Unaudited, dollars in thousands Agency MBS and Debentures Overview as of December 31, 2014 (cont’d) Agency Fixed-Rate and Floating-Rate Collateralized Mortgage-Backed Obligations Current Weighted Avg. Weighted Avg. Weighted Avg. Subject to Weighted Avg. Estimated Type Face Value % Coupon Amortized Cost Fair Value HARP 3-Month CPR Fair Value Fixed-Rate $3,455,026 100.0% 3.15% 102.4% 102.1% 5.0% 12.3% $3,528,217 Floating-Rate - - - - - - - - Total/Weighted Avg. $3,455,026 100.0% 3.15% 102.4% 102.1% 5.0% 12.3% $3,528,217 Agency Interest-Only Collateralized Mortgage-Backed Obligations Current Notional Weighted Avg. Weighted Avg. Weighted Avg. Subject to Weighted Avg. Estimated Type Value % Coupon Amortized Cost Fair Value HARP 3-Month CPR Fair Value Interest-Only $6,050,320 75.5% 3.31% 13.1% 13.1% 2.4% 9.1% $791,497 Inverse Interest-Only 1,958,218 24.5% 6.12% 22.5% 22.0% 0.0% 9.6% 430,937 Total/Weighted Avg. $8,008,538 100.0% 4.00% 15.4% 15.3% 1.9% 9.2% $1,222,434
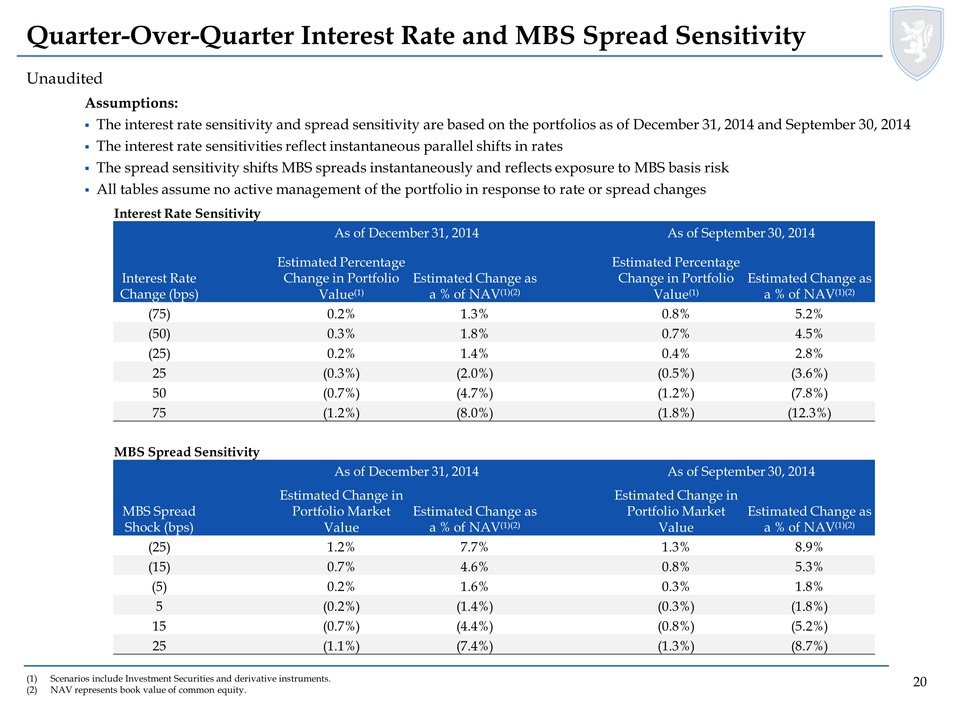
20 Unaudited Quarter-Over-Quarter Interest Rate and MBS Spread Sensitivity (1)Scenarios include Investment Securities and derivative instruments. (2)NAV represents book value of common equity. Assumptions: The interest rate sensitivity and spread sensitivity are based on the portfolios as of December 31, 2014 and September 30, 2014 The interest rate sensitivities reflect instantaneous parallel shifts in rates The spread sensitivity shifts MBS spreads instantaneously and reflects exposure to MBS basis risk All tables assume no active management of the portfolio in response to rate or spread changes Interest Rate Sensitivity As of December 31, 2014 As of September 30, 2014 Interest Rate Change (bps) Estimated Percentage Change in Portfolio Value(1) Estimated Change as a % of NAV(1)(2) Estimated Percentage Change in Portfolio Value(1) Estimated Change as a % of NAV(1)(2) (75) 0.2% 1.3% 0.8% 5.2% (50) 0.3% 1.8% 0.7% 4.5% (25) 0.2% 1.4% 0.4% 2.8% 25 (0.3%) (2.0%) (0.5%) (3.6%) 50 (0.7%) (4.7%) (1.2%) (7.8%) 75 (1.2%) (8.0%) (1.8%) (12.3%) MBS Spread Sensitivity As of December 31, 2014 As of September 30, 2014 MBS Spread Shock (bps) Estimated Change in Portfolio Market Value Estimated Change as a % of NAV(1)(2) Estimated Change in Portfolio Market Value Estimated Change as a % of NAV(1)(2) (25) 1.2% 7.7% 1.3% 8.9% (15) 0.7% 4.6% 0.8% 5.3% (5) 0.2% 1.6% 0.3% 1.8% 5 (0.2%) (1.4%) (0.3%) (1.8%) 15 (0.7%) (4.4%) (0.8%) (5.2%) 25 (1.1%) (7.4%) (1.3%) (8.7%)
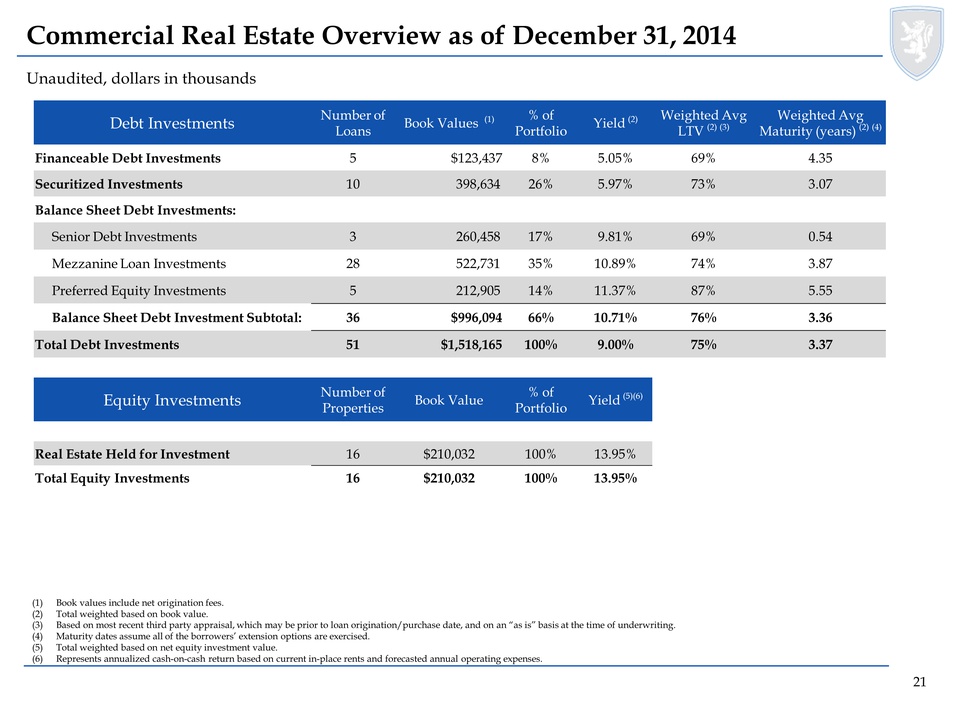
21 Unaudited, dollars in thousands Commercial Real Estate Overview as of December 31, 2014 (1)Book values include net origination fees. (2)Total weighted based on book value. (3)Based on most recent third party appraisal, which may be prior to loan origination/purchase date, and on an “as is” basis at the time of underwriting. (4)Maturity dates assume all of the borrowers’ extension options are exercised. (5)Total weighted based on net equity investment value. (6)Represents annualized cash-on-cash return based on current in-place rents and forecasted annual operating expenses. Debt Investments Number of Loans Book Values (1) % of Portfolio Yield (2) Weighted Avg LTV (2) (3) Weighted Avg Maturity (years) (2) (4) Financeable Debt Investments 5 $123,437 8% 5.05% 69% 4.35 Securitized Investments 10 398,634 26% 5.97% 73% 3.07 Balance Sheet Debt Investments: Senior Debt Investments 3 260,458 17% 9.81% 69% 0.54 Mezzanine Loan Investments 28 522,731 35% 10.89% 74% 3.87 Preferred Equity Investments 5 212,905 14% 11.37% 87% 5.55 Balance Sheet Debt Investment Subtotal: 36 $996,094 66% 10.71% 76% 3.36 Total Debt Investments 51 $1,518,165 100% 9.00% 75% 3.37 Equity Investments Number of Properties Book Value % of Portfolio Yield (5)(6) Real Estate Held for Investment 16 $210,032 100% 13.95% Total Equity Investments 16 $210,032 100% 13.95%
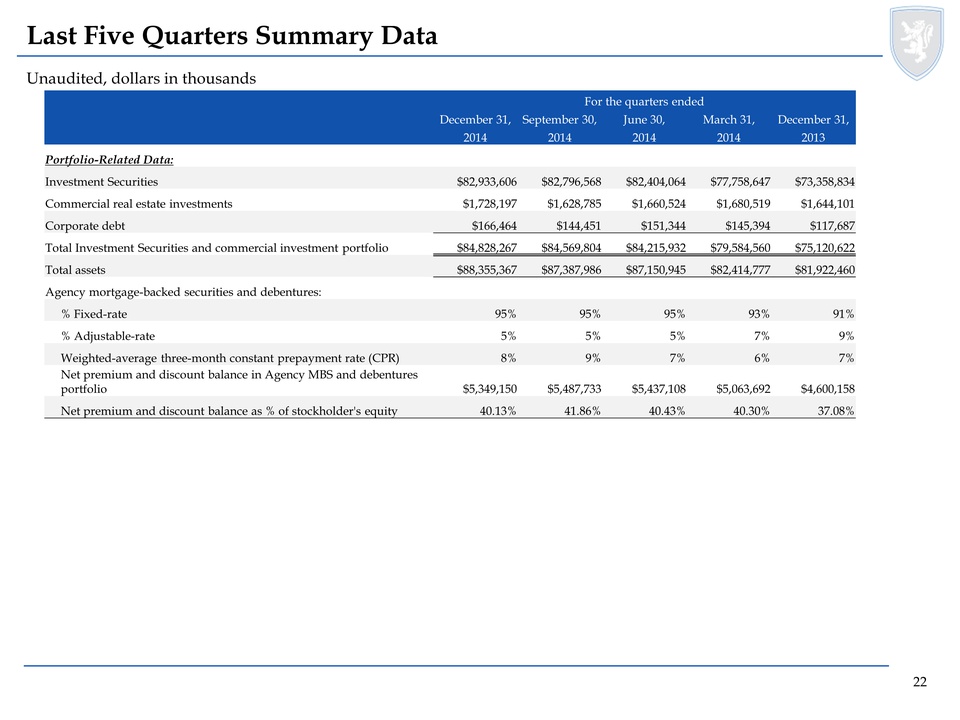
22 Unaudited, dollars in thousands Last Five Quarters Summary Data For the quarters ended December 31, September 30, June 30, March 31, December 31, 2014 2014 2014 2014 2013 Portfolio-Related Data: Investment Securities $82,933,606 $82,796,568 $82,404,064 $77,758,647 $73,358,834 Commercial real estate investments $1,728,197 $1,628,785 $1,660,524 $1,680,519 $1,644,101 Corporate debt $166,464 $144,451 $151,344 $145,394 $117,687 Total Investment Securities and commercial investment portfolio $84,828,267 $84,569,804 $84,215,932 $79,584,560 $75,120,622 Total assets $88,355,367 $87,387,986 $87,150,945 $82,414,777 $81,922,460 Agency mortgage-backed securities and debentures: % Fixed-rate 95% 95% 95% 93% 91% % Adjustable-rate 5% 5% 5% 7% 9% Weighted-average three-month constant prepayment rate (CPR) 8% 9% 7% 6% 7% Net premium and discount balance in Agency MBS and debentures portfolio $5,349,150 $5,487,733 $5,437,108 $5,063,692 $4,600,158 Net premium and discount balance as % of stockholder's equity 40.13% 41.86% 40.43% 40.30% 37.08%
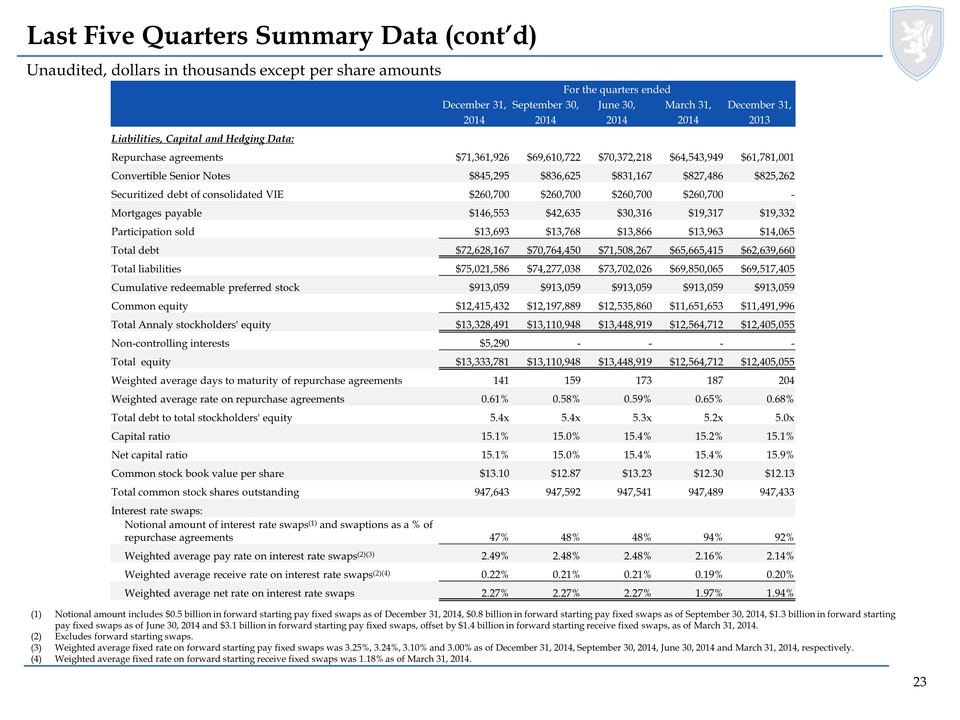
23 Unaudited, dollars in thousands except per share amounts Last Five Quarters Summary Data (cont’d) (1)Notional amount includes $0.5 billion in forward starting pay fixed swaps as of December 31, 2014, $0.8 billion in forward starting pay fixed swaps as of September 30, 2014, $1.3 billion in forward starting pay fixed swaps as of June 30, 2014 and $3.1 billion in forward starting pay fixed swaps, offset by $1.4 billion in forward starting receive fixed swaps, as of March 31, 2014. (2)Excludes forward starting swaps. (3)Weighted average fixed rate on forward starting pay fixed swaps was 3.25%, 3.24%, 3.10% and 3.00% as of December 31, 2014, September 30, 2014, June 30, 2014 and March 31, 2014, respectively. (4)Weighted average fixed rate on forward starting receive fixed swaps was 1.18% as of March 31, 2014. For the quarters ended December 31, September 30, June 30, March 31, December 31, 2014 2014 2014 2014 2013 Liabilities, Capital and Hedging Data: Repurchase agreements $71,361,926 $69,610,722 $70,372,218 $64,543,949 $61,781,001 Convertible Senior Notes $845,295 $836,625 $831,167 $827,486 $825,262 Securitized debt of consolidated VIE $260,700 $260,700 $260,700 $260,700 - Mortgages payable $146,553 $42,635 $30,316 $19,317 $19,332 Participation sold $13,693 $13,768 $13,866 $13,963 $14,065 Total debt $72,628,167 $70,764,450 $71,508,267 $65,665,415 $62,639,660 Total liabilities $75,021,586 $74,277,038 $73,702,026 $69,850,065 $69,517,405 Cumulative redeemable preferred stock $913,059 $913,059 $913,059 $913,059 $913,059 Common equity $12,415,432 $12,197,889 $12,535,860 $11,651,653 $11,491,996 Total Annaly stockholders' equity $13,328,491 $13,110,948 $13,448,919 $12,564,712 $12,405,055 Non-controlling interests $5,290 - - - - Total equity $13,333,781 $13,110,948 $13,448,919 $12,564,712 $12,405,055 Weighted average days to maturity of repurchase agreements 141 159 173 187 204 Weighted average rate on repurchase agreements 0.61% 0.58% 0.59% 0.65% 0.68% Total debt to total stockholders' equity 5.4x 5.4x 5.3x 5.2x 5.0x Capital ratio 15.1% 15.0% 15.4% 15.2% 15.1% Net capital ratio 15.1% 15.0% 15.4% 15.4% 15.9% Common stock book value per share $13.10 $12.87 $13.23 $12.30 $12.13 Total common stock shares outstanding 947,643 947,592 947,541 947,489 947,433 Interest rate swaps: Notional amount of interest rate swaps(1) and swaptions as a % of repurchase agreements 47% 48% 48% 94% 92% Weighted average pay rate on interest rate swaps(2)(3) 2.49% 2.48% 2.48% 2.16% 2.14% Weighted average receive rate on interest rate swaps(2)(4) 0.22% 0.21% 0.21% 0.19% 0.20% Weighted average net rate on interest rate swaps 2.27% 2.27% 2.27% 1.97% 1.94%
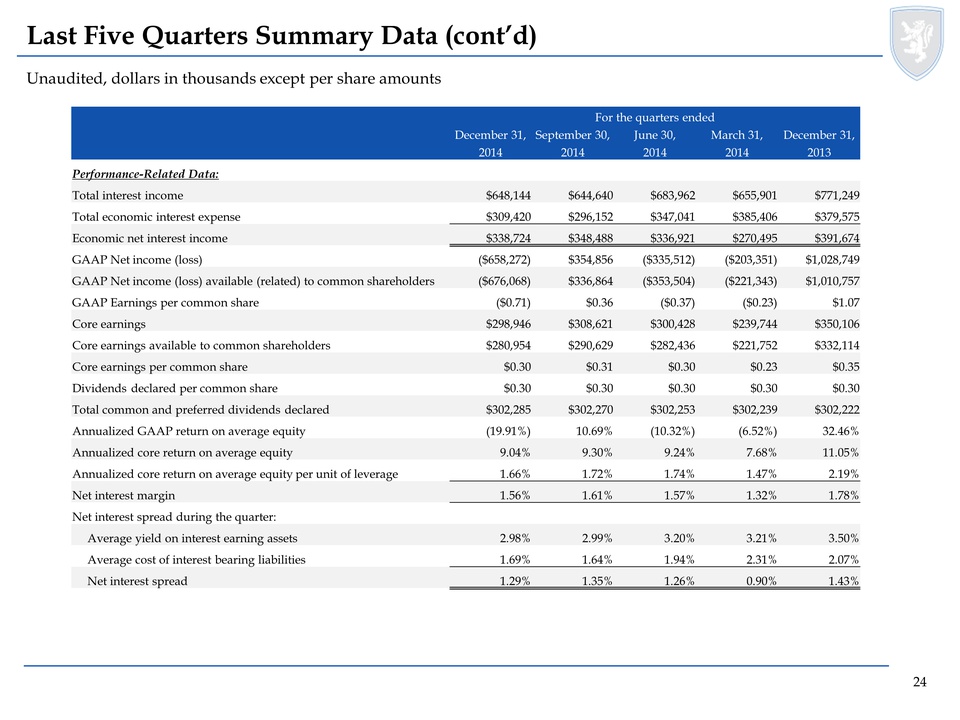
24 Unaudited, dollars in thousands except per share amounts Last Five Quarters Summary Data (cont’d) For the quarters ended December 31, September 30, June 30, March 31, December 31, 2014 2014 2014 2014 2013 Performance-Related Data: Total interest income $648,144 $644,640 $683,962 $655,901 $771,249 Total economic interest expense $309,420 $296,152 $347,041 $385,406 $379,575 Economic net interest income $338,724 $348,488 $336,921 $270,495 $391,674 GAAP Net income (loss) ($658,272) $354,856 ($335,512) ($203,351) $1,028,749 GAAP Net income (loss) available (related) to common shareholders ($676,068) $336,864 ($353,504) ($221,343) $1,010,757 GAAP Earnings per common share ($0.71) $0.36 ($0.37) ($0.23) $1.07 Core earnings $298,946 $308,621 $300,428 $239,744 $350,106 Core earnings available to common shareholders $280,954 $290,629 $282,436 $221,752 $332,114 Core earnings per common share $0.30 $0.31 $0.30 $0.23 $0.35 Dividends declared per common share $0.30 $0.30 $0.30 $0.30 $0.30 Total common and preferred dividends declared $302,285 $302,270 $302,253 $302,239 $302,222 Annualized GAAP return on average equity (19.91%) 10.69% (10.32%) (6.52%) 32.46% Annualized core return on average equity 9.04% 9.30% 9.24% 7.68% 11.05% Annualized core return on average equity per unit of leverage 1.66% 1.72% 1.74% 1.47% 2.19% Net interest margin 1.56% 1.61% 1.57% 1.32% 1.78% Net interest spread during the quarter: Average yield on interest earning assets 2.98% 2.99% 3.20% 3.21% 3.50% Average cost of interest bearing liabilities 1.69% 1.64% 1.94% 2.31% 2.07% Net interest spread 1.29% 1.35% 1.26% 0.90% 1.43%