Attached files
| file | filename |
|---|---|
| 10-K - FORM 10-K - VERIZON COMMUNICATIONS INC | d820819d10k.htm |
| EXCEL - IDEA: XBRL DOCUMENT - VERIZON COMMUNICATIONS INC | Financial_Report.xls |
| EX-31.1 - EXHIBIT 31.1 - VERIZON COMMUNICATIONS INC | d820819dex311.htm |
| EX-12 - EXHIBIT 12 - VERIZON COMMUNICATIONS INC | d820819dex12.htm |
| EX-21 - EXHIBIT 21 - VERIZON COMMUNICATIONS INC | d820819dex21.htm |
| EX-10.Q - EXHIBIT 10Q - VERIZON COMMUNICATIONS INC | d820819dex10q.htm |
| EX-32.2 - EXHIBIT 32.2 - VERIZON COMMUNICATIONS INC | d820819dex322.htm |
| EX-31.2 - EXHIBIT 31.2 - VERIZON COMMUNICATIONS INC | d820819dex312.htm |
| EX-32.1 - EXHIBIT 32.1 - VERIZON COMMUNICATIONS INC | d820819dex321.htm |
| EX-23 - EXHIBIT 23 - VERIZON COMMUNICATIONS INC | d820819dex23.htm |
EXHIBIT 13
| Selected Financial Data Verizon Communications Inc. and Subsidiaries | ||
| (dollars in millions, except per share amounts) | ||||||||||||||||||||
| 2014 | 2013 | 2012 | 2011 | 2010 | ||||||||||||||||
| Results of Operations |
||||||||||||||||||||
| Operating revenues |
$ | 127,079 | $ | 120,550 | $ | 115,846 | $ | 110,875 | $ | 106,565 | ||||||||||
| Operating income |
19,599 | 31,968 | 13,160 | 12,880 | 14,645 | |||||||||||||||
| Net income attributable to Verizon |
9,625 | 11,497 | 875 | 2,404 | 2,549 | |||||||||||||||
| Per common share – basic |
2.42 | 4.01 | .31 | .85 | .90 | |||||||||||||||
| Per common share – diluted |
2.42 | 4.00 | .31 | .85 | .90 | |||||||||||||||
| Cash dividends declared per common share |
2.160 | 2.090 | 2.030 | 1.975 | 1.925 | |||||||||||||||
| Net income attributable to noncontrolling interests |
2,331 | 12,050 | 9,682 | 7,794 | 7,668 | |||||||||||||||
| Financial Position |
||||||||||||||||||||
| Total assets |
$ | 232,708 | $ | 274,098 | $ | 225,222 | $ | 230,461 | $ | 220,005 | ||||||||||
| Debt maturing within one year |
2,735 | 3,933 | 4,369 | 4,849 | 7,542 | |||||||||||||||
| Long-term debt |
110,536 | 89,658 | 47,618 | 50,303 | 45,252 | |||||||||||||||
| Employee benefit obligations |
33,280 | 27,682 | 34,346 | 32,957 | 28,164 | |||||||||||||||
| Noncontrolling interests |
1,378 | 56,580 | 52,376 | 49,938 | 48,343 | |||||||||||||||
| Equity attributable to Verizon |
12,298 | 38,836 | 33,157 | 35,970 | 38,569 | |||||||||||||||
| • | Significant events affecting our historical earnings trends in 2012 through 2014 are described in “Other Items” in the “Management’s Discussion and Analysis of Financial Condition and Results of Operations” section. |
| • | 2011 data includes severance, pension and benefit charges and early debt redemption costs. 2010 data includes severance, pension and benefit charges, merger integration charges, dispositions, Medicare Part D Subsidy charges and other items. |
| Stock Performance Graph |
Comparison of Five-Year Total Return Among Verizon,
S&P 500 Telecommunications Services Index and S&P 500 Stock Index
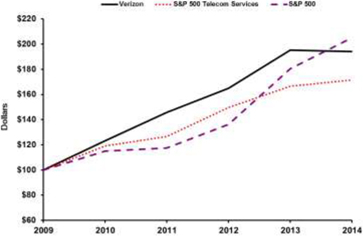
| At December 31, | ||||||||||||||||||||||||
| Data Points in Dollars | 2009 | 2010 | 2011 | 2012 | 2013 | 2014 | ||||||||||||||||||
|
Verizon |
100.0 | 123.1 | 145.7 | 164.8 | 195.3 | 194.2 | ||||||||||||||||||
|
S&P 500 Telecom Services |
100.0 | 119.0 | 126.5 | 149.6 | 166.6 | 171.5 | ||||||||||||||||||
|
S&P 500 |
100.0 | 115.1 | 117.5 | 136.2 | 180.3 | 205.0 | ||||||||||||||||||
The graph compares the cumulative total returns of Verizon, the S&P 500 Telecommunications Services Index, and the S&P 500 Stock Index over a five-year period. It assumes $100 was invested on December 31, 2009 with dividends (including the value of the telephone access line spin-off that occurred in 2010) being reinvested.
| Management’s Discussion and Analysis of Financial Condition and Results of Operations |
| Overview |
Verizon Communications Inc. (Verizon or the Company) is a holding company that, acting through its subsidiaries, is one of the world’s leading providers of communications, information and entertainment products and services to consumers, businesses and governmental agencies. With a presence around the world, we offer voice, data and video services and solutions on our wireless and wireline networks that are designed to meet customers’ demand for mobility, reliable network connectivity, security and control. We have two reportable segments, Wireless and Wireline. Our wireless business, operating as Verizon Wireless, provides voice and data services and equipment sales across the United States using one of the most extensive and reliable wireless networks. Our wireline business provides consumer, business and government customers with communications products and enhanced services, including broadband data and video, corporate networking solutions, data center and cloud services, security and managed network services and local and long distance voice services, and also owns and operates one of the most expansive end-to-end global Internet Protocol (IP) networks. We have a highly skilled, diverse and dedicated workforce of approximately 177,300 employees as of December 31, 2014.
As advances in technology have changed the ways that our customers interact in their personal and professional lives and that businesses operate, we have continued to focus our efforts around higher margin and growing areas of our business: wireless and wireline data and Strategic services, including cloud computing services. Our strategy requires significant capital investments primarily to acquire wireless spectrum, put the spectrum into service, provide additional capacity for growth in our wireless and wireline networks, invest in the fiber optic network that supports our wireless and wireline businesses, maintain our wireless and wireline networks and develop and maintain significant advanced information technology systems and data system capabilities. We believe that steady and consistent investments in networks and platforms will drive innovative products and services and fuel our growth. Our wireless and wireline networks will continue to be the hallmark of our brand, and provide the fundamental strength upon which we build our competitive advantage.
Strategic Transactions
Wireless Transaction
On February 21, 2014, we set the stage for the next phase of our company’s growth when we completed the acquisition of Vodafone Group Plc’s (Vodafone) indirect 45% interest in Cellco Partnership d/b/a Verizon Wireless for aggregate consideration of approximately $130 billion (the Wireless Transaction). The consideration paid was primarily comprised of cash of approximately $58.89 billion and Verizon common stock with a value of approximately $61.3 billion. With full control of Verizon Wireless enhancing our operational efficiency, we believe we are well-positioned to meet the challenges of an increasingly competitive industry. See Note 2 to the consolidated financial statements for additional information.
Spectrum Auction
On January 29, 2015, the Federal Communications Commission (FCC) completed an auction of 65 MHz of spectrum, which it identified as the Advanced Wireless Services (AWS)-3 band. Verizon participated in that auction, and was the high bidder on 181 spectrum licenses, for which we will pay approximately $10.4 billion. During the fourth quarter of 2014, we made a deposit of $0.9 billion related to our participation in this auction. On February 13, 2015, we made a down payment of $1.2 billion for these spectrum licenses. Verizon has submitted an application for these licenses and must complete payment for them in the first quarter of 2015.
Access Line Sale
On February 5, 2015, we announced that we have entered into a definitive agreement with Frontier Communications Corporation (Frontier) pursuant to which Verizon will sell its local exchange business and related landline activities in California, Florida, and Texas, including FiOS Internet and Video customers, switched and special access lines and high-speed Internet service and long distance voice accounts in these three states for approximately $10.5 billion. The transaction, which includes the acquisition by Frontier of the equity interests of Verizon’s incumbent local exchange carriers (ILECs) in California, Florida and Texas, does not involve any assets or liabilities of Verizon Wireless. The assets and liabilities that will be sold are currently included in Verizon’s continuing operations. As part of the transaction, Frontier will assume $0.6 billion of indebtedness from Verizon. The transaction is subject to the satisfaction of certain closing conditions including, among others, receipt of state and federal telecommunications regulatory approvals, and we expect this transaction to close during the first half of 2016.
The transaction will result in Frontier acquiring approximately 1.5 million FiOS Internet subscribers, 1.2 million FiOS Video subscribers and the related ILEC businesses from Verizon. This business generated revenues of approximately $5.4 billion, excluding revenue with affiliates, for Verizon in 2013, which is the most recent year for which audited stand-alone financial statements are currently available.
Tower Monetization Transaction
On February 5, 2015, we announced an agreement with American Tower Corporation (American Tower) pursuant to which American Tower will have the exclusive rights to lease and operate over 11,300 of our wireless towers for an upfront payment of $5.0 billion. Under the terms of the leases, American Tower will have exclusive rights to lease and operate the towers over an average term of approximately 28 years. As part of this transaction, we will also sell 165 towers for $0.1 billion. We will sublease capacity on the towers from American Tower for a minimum of 10 years
at current market rates, with options to renew. As the leases expire, American Tower will have fixed-price purchase options to acquire these towers based on their anticipated fair market values at the end of the lease terms. We plan to account for the upfront payment primarily as prepaid rent and a portion as a financing obligation. This transaction, which is subject to customary closing conditions, is expected to close during the first half of 2015.
Business Overview
Wireless
Demand for our fourth generation (4G) Long Term Evolution (LTE) smartphones and tablets continues to drive growth in our Wireless business. During 2014, Wireless revenue increased $6.6 billion, or 8.2%, compared to 2013 driven by service revenue growth of $3.6 billion, or 5.2%, which does not include recurring equipment installment billings related to Verizon Edge. Also contributing to the increase in Wireless revenue was equipment revenue growth of $2.8 billion, or 35.1%, driven by higher sales of equipment under both the traditional subsidy model and Verizon Edge, a program that enables qualified customers to purchase their devices on an installment payment plan. During 2014, retail postpaid connections increased 5.5% compared to 2013, with smartphones representing 79% of our retail postpaid phone base at December 31, 2014 compared to 70% at December 31, 2013. Also, during 2014, postpaid smartphone activations represented 92% of phones activated compared to 86% in 2013.
We are focusing the capital spending in our Wireless business on adding capacity and density to our 4G LTE network, which is available to over 98% of the U.S. population in more than 500 markets covering approximately 309 million people, including those in areas served by our LTE in Rural America partners. Our 4G LTE network provides higher data throughput performance for data services at a lower cost compared to that provided via third-generation (3G) networks. Approximately 84% of our total data traffic in December 2014 was carried on our 4G LTE network. In May 2014, we announced the deployment of AWS spectrum in our 4G LTE network. This additional bandwidth, which we refer to and brand as XLTE, provides additional network capacity and is currently available in more than 400 markets. Nearly all of the 4G LTE devices Verizon Wireless currently sells can operate on XLTE.
In February 2014, we introduced our More Everything® plans which replaced our Share Everything® plans. These plans feature domestic unlimited voice minutes, unlimited domestic and international text, video and picture messaging, cloud storage and a single data allowance that can be shared among multiple devices connected to the Verizon Wireless network. As of December 31, 2014, More Everything accounts represented approximately 61% of our retail postpaid accounts compared to Share Everything plans representing approximately 46% of our retail postpaid accounts as of December 31, 2013. Verizon Wireless also offers shared data plans for business, with More Everything plans for Small business and Nationwide Business Data Packages and Plans.
Wireline
In our Wireline business, revenues decreased 0.5% during 2014 compared to 2013, primarily due to declines in Global Enterprise Core and Global Wholesale revenues resulting from lower voice services and data networking revenues as well as the contraction of market rates due to competition. To compensate for the shrinking market for traditional voice service, we continue to build our Wireline segment around data, video and advanced business services – areas where demand for reliable high-speed connections is growing. Wireline’s revenues during 2014 included a 2.3% increase in Strategic services revenues, which represented 61% of total Global Enterprise revenues, as compared to 57% of total Global Enterprise revenues during 2013.
Wireline revenues during 2014 also included increases in Consumer retail revenue driven by FiOS services. FiOS represented approximately 76% of Consumer retail revenue during 2014, compared to approximately 71% during 2013. As the penetration of FiOS products increases, we continue to seek ways to increase revenue and further realize operating and capital efficiencies as well as maximize profitability. As more applications are developed for this high-speed service, we expect that FiOS will become a hub for managing multiple home services that will eventually be part of the digital grid, including not just entertainment and communications, but also machine-to-machine communications, such as home monitoring, health monitoring, energy management and utilities management.
We continue to enrich the customer value proposition by creating new and innovative services on our FiOS platform. During 2014, Verizon announced the introduction of FiOS Quantum TV, which provides FiOS video subscribers with new features, including the ability to record up to 12 shows at once and control live TV from any room in their home. This new service is now available everywhere that FiOS TV is offered. With our FiOS Quantum broadband service and certain other data services, our residential and small business customers can achieve symmetrical upload and download speeds of up to 500 megabytes per second, which we refer to as SpeedMatchsm.
Capital Expenditures and Investments
We are investing in wireless networks, high-speed fiber and cloud services to position ourselves at the center of growth trends for the future. During 2014, these investments included capital expenditures of $17.2 billion and acquisitions of wireless licenses of $0.4 billion. See “Cash Flows Used in Investing Activities” and Note 2 to the consolidated financial statements for additional information.
By investing to expand our own capabilities, we are also providing the communities we serve with an efficient, reliable infrastructure for competing in the information economy. We are committed to putting our customers first and being a responsible member of our communities. Guided by this commitment and by our core values of integrity, respect, performance excellence and accountability, we believe we are well-positioned to produce a long-term return for our shareowners, create meaningful work for ourselves and provide lasting value for society.
Trends
In the sections that follow, we provide information about the important aspects of our operations and investments, both at the consolidated and segment levels, and discuss our results of operations, financial position and sources and uses of cash. In addition, we highlight key trends and uncertainties to the extent practicable.
The industries that we operate in are highly competitive, which we expect to continue particularly as traditional, non-traditional and emerging service providers seek increased market share. We believe that our high-quality customer base and superior networks differentiate us from our competitors and enable us to provide enhanced communications experiences to our customers. We believe our focus on the fundamentals of running a good business, including operating excellence and financial discipline, gives us the ability to plan and manage through changing economic and competitive conditions. We will continue to invest for growth, which we believe is the key to creating value for our shareowners.
Connection and Operating Trends
In our Wireless segment, we expect to continue to attract and maintain the loyalty of high-quality retail postpaid customers, capitalizing on demand for data services and bringing our customers new ways of using wireless services in their daily lives. We expect that future connection growth will continue as we introduce new 4G LTE devices, including new smartphones and tablets. We believe these devices will attract and retain higher value retail postpaid connections, contribute to continued increases in the penetration of data services and help us remain competitive with other wireless carriers. However, as a result of the increasing competition within our industry, we expect our churn to increase in 2015. We expect future growth opportunities will be dependent on expanding the penetration of our network services, offering innovative wireless devices for both consumer and business customers and increasing the number of ways that our customers can connect with our network and services.
Service and equipment pricing play an important role in the wireless competitive landscape. As the demand for wireless services continues to grow, wireless service providers are offering service plans that include unlimited voice minutes and text messages and a specific amount of data access in varying megabyte or gigabyte sizes or, in some cases, unlimited data usage at competitive prices. Some wireless service providers also allow customers to rollover unused data allowances to the next billing period and are also offering installment plans that decouple service pricing from equipment pricing and blur the traditional boundary between prepaid and postpaid plans. In 2015, we expect that customers will continue to adopt these installment plans, which also offer discounts on the cost of wireless service. Furthermore, some wireless providers are offering new customers price plans that undercut pricing under the customer’s service plan with its current wireless provider and provide a credit to reimburse early termination fees paid to their former wireless service provider, subject to certain limitations, in addition to promotions targeted specifically to customers of Verizon Wireless. We seek to compete in this area by offering our customers services and equipment that they will regard as the best available value for the price, as well as service plans that meet their wireless service needs.
In our Wireline segment, we have experienced continuing access line losses as customers have disconnected both primary and secondary lines and switched to alternative technologies such as wireless, voice over Internet protocol (VoIP) and cable for voice and data services. We expect to continue to experience access line losses as customers continue to switch to alternate technologies. We also expect Consumer retail revenues to increase, primarily driven by our FiOS services, as we seek to increase our penetration rates within our FiOS service areas.
Despite this challenging environment, we expect that we will be able to grow key aspects of our Wireline segment by providing network reliability, offering product bundles that include broadband Internet access, digital television and local and long distance voice services, offering more robust IP products and service, and accelerating our cloud computing and machine-to-machine strategies. We will also continue to focus on cost efficiencies to attempt to offset adverse impacts from unfavorable economic conditions and competitive pressures.
Operating Revenue
We expect to experience revenue growth in our Wireless segment in 2015, primarily as a result of continued growth in postpaid connections driven by sales of smartphones and tablets, partially offset by declining prices in response to increasing competitive pressure from other wireless carriers. We also expect the activation of devices on Verizon Edge to contribute positively to our Wireless segment revenue and operating income. In 2015, we expect the rate at which customers activate devices on Verizon Edge to increase. As more customers adopt Verizon Edge, we expect equipment and other revenue to be positively impacted, while we expect retail postpaid average revenue per account (ARPA) and service revenue, in each case when considered as a percentage of total revenue, to continue to be negatively impacted. We expect that our future service revenue growth will be substantially derived from an increase in the usage of innovative mobile services in addition to our pricing structure that will encourage customers to continue adding data-enabled devices onto existing accounts. We expect that continued emphasis on increasing smartphone penetration, including continuing to migrate customers from basic phones to smartphones and from 3G devices to 4G LTE devices, in addition to increasing our tablet penetration will positively impact our revenue.
We expect FiOS broadband and video penetration to positively impact our Mass Markets revenue and subscriber base. Although we have recently experienced decelerating revenue growth within our Strategic services business, we expect our Strategic services business to be positively impacted by additional enterprise revenues from application services, such as our cloud, security and other solutions-based services and from continued customer migration of their services to Private IP and other strategic networking services. We believe the trend in these growth areas as well as our offerings in telematics and video streaming will help offset the continuing decline in revenues in our Wireline segment related to retail voice connection losses as a result of technology substitution, as well as the continued decline in our legacy wholesale and enterprise markets. Upon the closing of the sale of our local exchange business and related landline activities in California, Florida and Texas, we expect that our Wireline segment EBITDA margin and operating income margin will decline. Prior to closing this transaction, we expect to undertake initiatives to address our cost structure to mitigate this impact to our margins.
Operating Costs and Expenses
We anticipate our overall wireless operating costs will increase as a result of the expected increase in the volume of smartphone sales, which will result in higher equipment costs. In addition, we expect content costs for our FiOS video service to continue to increase. However, we expect to achieve certain cost efficiencies in 2015 and beyond as data traffic continues to migrate to our lower-cost 4G LTE network and as we continue to streamline our business processes with a focus on improving productivity and increasing profitability.
Capital Expenditures
Our 2015 capital program includes capital to fund advanced networks and services, including 4G LTE and FiOS, the continued expansion of our core networks, including our IP and data center enhancements, and support for our copper-based legacy voice networks and other expenditures to drive operating efficiencies. The level and the timing of the Company’s capital expenditures within these broad categories can vary significantly as a result of a variety of factors outside our control, including, for example, material weather events. We are replacing copper wire with fiber-optic cable which will not alter our capital program but should result in lower maintenance costs in the future. Capital expenditures were $17.2 billion in 2014 and $16.6 billion in 2013. We believe that we have significant discretion over the amount and timing of our capital expenditures on a Company-wide basis as we are not subject to any agreement that would require significant capital expenditures on a designated schedule or upon the occurrence of designated events. We expect capital expenditures in 2015, which will be primarily focused on adding capacity to our 4G LTE network in order to stay ahead of our customers’ increasing data demands, to be in the range of approximately $17.5 billion to $18.0 billion. We also expect our capital expenditures as a percentage of revenue to decline in 2015 from 2014 levels.
Cash Flow from Operations
We create value for our shareowners by investing the cash flows generated by our business in opportunities and transactions that support continued profitable growth, thereby increasing customer satisfaction and usage of our products and services. In addition, we have used our cash flows to maintain and grow our dividend payout to shareowners. Verizon’s Board of Directors increased the Company’s quarterly dividend by 3.8% during 2014, making this the eighth consecutive year in which we have raised our dividend.
Our goal is to use our cash to create long-term value for our shareholders. We will continue to look for investment opportunities that will help us to grow the business. We expect to use our cash to reduce our debt levels in order to return to our pre-Wireless Transaction credit metrics by 2019, invest in the business, including spectrum licenses (see “Cash Flows from Investing Activities”), pay dividends to our shareholders and, when appropriate, buy back shares of our outstanding common stock (see “Cash Flows from Financing Activities”).
| Consolidated Results of Operations |
In this section, we discuss our overall results of operations and highlight items of a non-operational nature that are not included in our segment results. We have two reportable segments, Wireless and Wireline, which we operate and manage as strategic business units and organize by products and services. In “Segment Results of Operations,” we review the performance of our two reportable segments.
On February 21, 2014, we completed the acquisition of Vodafone’s indirect 45% interest in Verizon Wireless. As a result, our results reflect our 55% ownership of Verizon Wireless through the closing of the Wireless Transaction and reflect our full ownership of Verizon Wireless from the closing of the Wireless Transaction through December 31, 2014.
Corporate, eliminations and other includes unallocated corporate expenses such as certain pension and other employee benefit related costs, intersegment eliminations recorded in consolidation, the results of other businesses, such as our investments in unconsolidated businesses, lease financing as well as the historical results of divested operations, other adjustments and gains and losses that are not allocated in assessing segment performance due to their non-operational nature. Although such transactions are excluded from the business segment results, they are included in reported consolidated earnings. Gains and losses that are not individually significant are included in all segment results as these items are included in the chief operating decision maker’s assessment of segment performance. We believe that this presentation assists users of our financial statements in better understanding our results of operations and trends from period to period. Effective January 1, 2014, we have also reclassified the results of certain businesses, such as development stage businesses that support our strategic initiatives, from our Wireline segment to Corporate, eliminations and other. The impact of this reclassification was not material to our consolidated financial statements or our segment results of operations.
On July 1, 2014, our Wireline segment sold a non-strategic business (see “Acquisitions and Divestitures”). Accordingly, the historical Wireline results for these operations, which were not material to our consolidated financial statements or our segment results of operations, have been reclassified to Corporate, eliminations and other to reflect comparable segment operating results. The results of operations related to this divestiture included within Corporate, eliminations and other are as follows:
| (dollars in millions) | ||||||||||||
| Years Ended December 31, | 2014 | 2013 | 2012 | |||||||||
| Impact of Divested Operations |
||||||||||||
| Operating revenues |
$ | 256 | $ | 599 | $ | 835 | ||||||
| Cost of services and sales |
239 | 531 | 756 | |||||||||
| Selling, general and administrative expense |
5 | 25 | 23 | |||||||||
| Consolidated Revenues | ||||||||||||||
| (dollars in millions) | ||||||||||||||||||||||||||||
| Increase/(Decrease) | ||||||||||||||||||||||||||||
| Years Ended December 31, | 2014 | 2013 | 2012 | 2014 vs. 2013 | 2013 vs. 2012 | |||||||||||||||||||||||
| Wireless |
||||||||||||||||||||||||||||
| Service revenue |
$ | 72,630 | $ | 69,033 | $ | 63,733 | $ | 3,597 | 5.2 | % | $ | 5,300 | 8.3 | % | ||||||||||||||
| Equipment and other |
15,016 | 11,990 | 12,135 | 3,026 | 25.2 | (145 | ) | (1.2 | ) | |||||||||||||||||||
|
|
|
|
|
|
|
|||||||||||||||||||||||
| Total |
87,646 | 81,023 | 75,868 | 6,623 | 8.2 | 5,155 | 6.8 | |||||||||||||||||||||
| Wireline |
||||||||||||||||||||||||||||
| Mass Markets |
18,047 | 17,383 | 16,746 | 664 | 3.8 | 637 | 3.8 | |||||||||||||||||||||
| Global Enterprise |
13,684 | 14,182 | 14,577 | (498 | ) | (3.5 | ) | (395 | ) | (2.7 | ) | |||||||||||||||||
| Global Wholesale |
6,222 | 6,594 | 7,094 | (372 | ) | (5.6 | ) | (500 | ) | (7.0 | ) | |||||||||||||||||
| Other |
476 | 465 | 528 | 11 | 2.4 | (63 | ) | (11.9 | ) | |||||||||||||||||||
|
|
|
|
|
|
|
|||||||||||||||||||||||
| Total |
38,429 | 38,624 | 38,945 | (195 | ) | (0.5 | ) | (321 | ) | (0.8 | ) | |||||||||||||||||
| Corporate, eliminations and other |
1,004 | 903 | 1,033 | 101 | 11.2 | (130 | ) | (12.6 | ) | |||||||||||||||||||
|
|
|
|
|
|
|
|||||||||||||||||||||||
| Consolidated Revenues |
$ | 127,079 | $ | 120,550 | $ | 115,846 | $ | 6,529 | 5.4 | $ | 4,704 | 4.1 | ||||||||||||||||
|
|
|
|
|
|
|
|||||||||||||||||||||||
2014 Compared to 2013
The increase in consolidated revenues during 2014 compared to 2013 was primarily due to higher revenues at Wireless, as well as higher Mass Markets revenues driven by FiOS services at our Wireline segment. Partially offsetting these increases were lower Global Enterprise Core and Global Wholesale revenues at our Wireline segment.
Wireless’ revenues increased $6.6 billion, or 8.2%, during 2014 compared to 2013 primarily as a result of growth in service revenue and equipment revenue. The increase in service revenue, which does not include recurring equipment installment billings related to Verizon Edge, during 2014 compared to 2013 was primarily driven by higher retail postpaid service revenue, which increased largely as a result of an increase in retail postpaid connections as well as the continued increase in penetration of 4G LTE smartphones and tablets through our More Everything plans. Equipment and other revenue increased during 2014 compared to 2013 primarily due to an increase in equipment sales under both the traditional subsidy model and Verizon Edge. Retail postpaid connection net additions increased during 2014 compared to 2013 primarily due to an increase in retail postpaid connection gross additions partially offset by an increase in our retail postpaid connection churn rate. Retail postpaid connections per account increased as of December 31, 2014 compared to December 31, 2013 primarily due to the increased penetration of tablets.
Wireline’s revenues decreased $0.2 billion, or 0.5%, during 2014 compared to 2013 primarily as a result of declines in Global Enterprise Core and Global Wholesale, partially offset by higher Mass Markets revenues driven by FiOS services and increased Strategic services revenues within Global Enterprise.
Mass Markets revenues increased $0.7 billion, or 3.8%, during 2014 compared to 2013 primarily due to the expansion of FiOS services (Voice, Internet and Video), including our FiOS Quantum offerings, as well as changes in our pricing strategies, partially offset by the continued decline of local exchange revenues.
Global Enterprise revenues decreased $0.5 billion, or 3.5%, during 2014 compared to 2013 primarily due to lower voice services and data networking revenues, the contraction of market rates due to competition and a decline in Core customer premise equipment revenues. This decrease was partially offset by an increase in Strategic services revenues, primarily due to growth in our application services, such as our cloud and data center offerings and contact center solutions.
Global Wholesale revenues decreased $0.4 billion, or 5.6%, during 2014 compared to 2013 primarily due to a decline in data revenues driven by the continuing demand for high-speed digital data services from fiber-to-the-cell customers upgrading their core data circuits to Ethernet facilities, as well as a decline in traditional voice revenues. During 2014, we also experienced a decline in domestic wholesale connections.
2013 Compared to 2012
The increase in consolidated revenues during 2013 compared to 2012 was primarily due to higher revenues at Wireless, as well as higher Mass Markets revenues driven by FiOS services and increased Strategic services revenues within Global Enterprise at our Wireline segment. Partially offsetting these increases were lower Global Enterprise Core and Global Wholesale revenues at our Wireline segment.
Wireless’ revenues increased $5.2 billion, or 6.8%, during 2013 compared to 2012 due to growth in service revenue. Service revenue increased during 2013 compared to 2012 primarily driven by higher retail postpaid service revenue, which increased largely as a result of an increase in retail postpaid connections as well as the continued increase in penetration of smartphones, tablets and other Internet devices through our Share Everything plans. Retail postpaid connection net additions decreased during 2013 compared to 2012 primarily due to an increase in our retail postpaid connection churn rate, partially offset by an increase in retail postpaid connection gross additions. Retail postpaid connections per account increased as of December 31, 2013 compared to December 31, 2012 primarily due to the increased penetration of tablets and other Internet devices.
Wireline’s revenues decreased $0.3 billion, or 0.8%, during 2013 compared to 2012 primarily driven by declines in Global Enterprise Core and Global Wholesale, partially offset by higher Mass Markets revenues driven by FiOS services and increased Strategic services revenues within Global Enterprise.
Mass Markets revenues increased $0.6 billion, or 3.8%, during 2013 compared to 2012 due to the expansion of FiOS services (Voice, Internet and Video) as well as changes in our pricing strategies, partially offset by the continued decline of local exchange revenues.
Global Enterprise revenues decreased $0.4 billion, or 2.7%, during 2013 compared to 2012 primarily due to a decline in Core customer premise equipment revenues and lower voice services and data networking revenues. This decrease was partially offset by growth in Strategic services revenues, primarily due to an increase in advanced services, such as contact center solutions, IP communications, and our cloud and data center offerings as well as revenue from a telematics services business that we acquired in the third quarter of 2012.
Global Wholesale revenues decreased $0.5 billion, or 7.0%, during 2013 compared to 2012 primarily due to a decline in traditional voice revenues as a result of decreased minutes of use (MOUs) and a decline in domestic wholesale connections, partially offset by continuing demand for high-speed digital data services from fiber-to-the-cell customers upgrading their core data circuits to Ethernet facilities as well as Ethernet migrations from other core customers.
Other revenues decreased during 2013 compared to 2012 primarily due to reduced volumes outside of our network footprint.
| Consolidated Operating Expenses |
|
|
(dollars in millions) |
| ||||||||||||||||||||||||||
| Increase/(Decrease) | ||||||||||||||||||||||||||||
| Years Ended December 31, | 2014 | 2013 | 2012 | 2014 vs. 2013 | 2013 vs. 2012 | |||||||||||||||||||||||
| Cost of services and sales |
$ | 49,931 | $ | 44,887 | $ | 46,275 | $ | 5,044 | 11.2 | % | $ (1,388) | (3.0 | )% | |||||||||||||||
| Selling, general and administrative expense |
41,016 | 27,089 | 39,951 | 13,927 | 51.4 | (12,862) | (32.2 | ) | ||||||||||||||||||||
| Depreciation and amortization expense |
16,533 | 16,606 | 16,460 | (73 | ) | (0.4 | ) | 146 | 0.9 | |||||||||||||||||||
|
|
|
|
|
|
|
|||||||||||||||||||||||
| Consolidated Operating Expenses |
$ | 107,480 | $ | 88,582 | $ | 102,686 | $ | 18,898 | 21.3 | $ (14,104) | (13.7 | ) | ||||||||||||||||
|
|
|
|
|
|
|
|||||||||||||||||||||||
Consolidated operating expenses increased during 2014 primarily due to non-operational charges recorded in 2014 as compared to non-operational credits recorded in 2013 (see “Other Items”) as well as increased operating expenses at Wireless. Consolidated operating expenses decreased during 2013 primarily due to non-operational credits recorded in 2013 as compared to non-operational charges recorded in 2012 (see “Other Items”).
2014 Compared to 2013
Cost of Services and Sales
Cost of services and sales includes the following costs directly attributable to a service or product: salaries and wages, benefits, materials and supplies, content costs, contracted services, network access and transport costs, wireless equipment costs, customer provisioning costs, computer systems support, costs to support our outsourcing contracts and technical facilities and contributions to the Universal Service Fund. Aggregate customer care costs, which include billing and service provisioning, are allocated between Cost of services and sales and Selling, general and administrative expense.
Cost of services and sales increased during 2014 compared to 2013 primarily due to an increase in cost of equipment sales of $5.3 billion at our Wireless segment as a result of an increase in the number of devices sold as well as an increase in the cost per unit.
Selling, General and Administrative Expense
Selling, general and administrative expense includes: salaries and wages and benefits not directly attributable to a service or product, bad debt charges, taxes other than income taxes, advertising and sales commission costs, customer billing, call center and information technology costs, regulatory fees, professional service fees, and rent and utilities for administrative space. Also included are a portion of the aggregate customer care costs as discussed in “Cost of Services and Sales” above.
Selling, general and administrative expense increased during 2014 compared to 2013 primarily due to non-operational charges, primarily severance, pension and benefit charges, recorded in 2014 as compared to non-operational credits, primarily severance, pension and benefit credits, recorded in 2013 (see “Other Items”).
Depreciation and Amortization Expense
Depreciation and amortization expense decreased during 2014 compared to 2013 primarily due to a decrease in net depreciable assets at our Wireline segment, partially offset by an increase in depreciable assets at our Wireless segment.
2013 Compared to 2012
Cost of Services and Sales
Cost of services and sales decreased during 2013 compared to 2012 primarily due to a decrease in cost of equipment sales, decreased data roaming, a decline in cost of data services and a decrease in network connection costs at our Wireless segment, as well as a decrease in costs related to customer premise equipment, a decline in access costs and the net effect of storm-related insurance recoveries at our Wireline segment. Partially offsetting these decreases were higher content costs associated with continued FiOS subscriber growth and programming license fee increases at our Wireline segment, as well as increases in cost of network services at our Wireless segment.
Selling, General and Administrative Expense
Selling, general and administrative expense decreased during 2013 compared to 2012 primarily due to the non-operational credits recorded in 2013 and declines in employee costs at our Wireline segment as well as the non-operational charges recorded in 2012 (see “Other Items”). This decrease was partially offset by higher sales commission expense at our Wireless segment.
Depreciation and Amortization Expense
Depreciation and amortization expense increased during 2013 compared to 2012 primarily due to an increase in net depreciable assets at our Wireless segment and an increase in amortization expense at our Wireline segment. These increases were partially offset by a decline in net depreciable assets at our Wireline segment.
Non-operational (Credits) Charges
Non-operational (credits) charges included in operating expenses (see “Other Items”) were as follows:
| (dollars in millions) | ||||||||||||
| Years Ended December 31, | 2014 | 2013 | 2012 | |||||||||
| Severance, Pension and Benefit (Credits) Charges |
||||||||||||
| Selling, general and administrative expense |
$ | 7,507 | $ | (6,232) | $ | 7,186 | ||||||
| Gain on Spectrum License Transactions |
||||||||||||
| Selling, general and administrative expense |
(707 | ) | (278) | – | ||||||||
| Litigation Settlements |
||||||||||||
| Selling, general and administrative expense |
– | – | 384 | |||||||||
| Other Costs |
||||||||||||
| Cost of services and sales |
27 | – | 40 | |||||||||
| Selling, general and administrative expense |
307 | – | 236 | |||||||||
|
|
|
|||||||||||
| 334 | – | 276 | ||||||||||
|
|
|
|||||||||||
| Total non-operating (credits) charges included in operating expenses |
$ | 7,134 | $ | (6,510) | $ | 7,846 | ||||||
|
|
|
|||||||||||
See “Other Items” for a description of these and other non-operational items.
Consolidated Operating Income and EBITDA
Consolidated earnings before interest, taxes, depreciation and amortization expenses (Consolidated EBITDA) and Consolidated Adjusted EBITDA, which are presented below, are non-GAAP measures and do not purport to be alternatives to operating income as a measure of operating performance. Management believes that these measures are useful to investors and other users of our financial information in evaluating operating profitability on a more variable cost basis as they exclude the depreciation and amortization expense related primarily to capital expenditures and acquisitions that occurred in prior years, as well as in evaluating operating performance in relation to our competitors. Consolidated EBITDA is calculated by adding back interest, taxes, depreciation and amortization expense, equity in earnings of unconsolidated businesses and other income and (expense), net to net income.
Consolidated Adjusted EBITDA is calculated by excluding the effect of non-operational items and the impact of divested operations from the calculation of Consolidated EBITDA. Management believes that this measure provides additional relevant and useful information to investors and other users of our financial data in evaluating the effectiveness of our operations and underlying business trends in a manner that is consistent with management’s evaluation of business performance. See “Other Items” for additional details regarding these non-operational items.
Operating expenses include pension and benefit related credits and/or charges based on actuarial assumptions, including projected discount rates and an estimated return on plan assets. These estimates are updated in the fourth quarter to reflect actual return on plan assets and updated actuarial assumptions. The adjustment has been recognized in the income statement during the fourth quarter or upon a remeasurement event pursuant to our accounting policy for the recognition of actuarial gains/losses.
It is management’s intent to provide non-GAAP financial information to enhance the understanding of Verizon’s GAAP financial information, and it should be considered by the reader in addition to, but not instead of, the financial statements prepared in accordance with GAAP. Each non-GAAP financial measure is presented along with the corresponding GAAP measure so as not to imply that more emphasis should be placed on the non-GAAP measure. The non-GAAP financial information presented may be determined or calculated differently by other companies.
| (dollars in millions) | ||||||||||||
| Years Ended December 31, | 2014 | 2013 | 2012 | |||||||||
| Consolidated Operating Income |
$ | 19,599 | $ | 31,968 | $ | 13,160 | ||||||
| Add Depreciation and amortization expense |
16,533 | 16,606 | 16,460 | |||||||||
|
|
|
|||||||||||
| Consolidated EBITDA |
36,132 | 48,574 | 29,620 | |||||||||
| Add (Less) Non-operating (credits) charges included in operating expenses |
7,134 | (6,510 | ) | 7,846 | ||||||||
| Less Impact of divested operations |
(12 | ) | (43 | ) | (56 | ) | ||||||
|
|
|
|||||||||||
| Consolidated Adjusted EBITDA |
$ | 43,254 | $ | 42,021 | $ | 37,410 | ||||||
|
|
|
|||||||||||
The changes in Consolidated Operating Income, Consolidated EBITDA and Consolidated Adjusted EBITDA in the table above were primarily a result of the factors described in connection with operating revenues and operating expenses.
| Other Consolidated Results |
Equity in Earnings of Unconsolidated Businesses
Equity in earnings of unconsolidated businesses increased $1.6 billion during 2014 compared to the similar period in 2013 primarily due to the gain of $1.9 billion recorded on the sale of our interest in Vodafone Omnitel N.V. (Vodafone Omnitel) during the first quarter of 2014, which was part of the consideration for the Wireless Transaction.
Equity in earnings of unconsolidated businesses decreased $0.2 billion, or 56.2%, in 2013 compared to 2012 primarily due to lower earnings from operations at Vodafone Omnitel. The decrease during 2013 was partially offset by an immaterial gain recorded by Verizon Wireless upon obtaining control of previously unconsolidated wireless partnerships, which were previously accounted for under the equity method and are now consolidated.
Other Income and (Expense), Net
Additional information relating to Other income and (expense), net is as follows:
| (dollars in millions) | ||||||||||||||||||||||||||||
| Increase/(Decrease) | ||||||||||||||||||||||||||||
| Years Ended December 31, | 2014 | 2013 | 2012 | 2014 vs. 2013 | 2013 vs. 2012 | |||||||||||||||||||||||
| Interest income |
$ | 108 | $ | 64 | $ | 57 | $ | 44 | 68.8 | % | $ | 7 | 12.3 | % | ||||||||||||||
| Other, net |
(1,302 | ) | (230 | ) | (1,073 | ) | (1,072 | ) | nm | 843 | (78.6 | ) | ||||||||||||||||
|
|
|
|
|
|
|
|||||||||||||||||||||||
| Total |
$ | (1,194 | ) | $ | (166 | ) | $ | (1,016 | ) | $ | (1,028 | ) | nm | $ | 850 | (83.7 | ) | |||||||||||
|
|
|
|
|
|
|
|||||||||||||||||||||||
nm – not meaningful
Other income and (expense), net changed unfavorably during 2014 compared to the similar period in 2013 primarily due to early debt redemption costs of $1.4 billion incurred in 2014 (see “Other Items”).
Other income and (expense), net changed favorably during 2013 compared to 2012 primarily due to fees of $1.1 billion incurred in 2012 related to the early redemption of debt, partially offset by $0.2 billion of fees incurred during the fourth quarter of 2013 as a result of the termination of a bridge credit agreement upon the effectiveness of a term loan agreement (see “Other Items”).
Interest Expense
| (dollars in millions) | ||||||||||||||||||||||||||||
| Increase/(Decrease) | ||||||||||||||||||||||||||||
| Years Ended December 31, | 2014 | 2013 | 2012 | 2014 vs. 2013 | 2013 vs. 2012 | |||||||||||||||||||||||
| Total interest costs on debt balances |
$ | 5,291 | $ | 3,421 | $ | 2,977 | $ | 1,870 | 54.7 | % | $ | 444 | 14.9 | % | ||||||||||||||
| Less Capitalized interest costs |
376 | 754 | 406 | (378 | ) | (50.1 | ) | 348 | 85.7 | |||||||||||||||||||
|
|
|
|
|
|
|
|||||||||||||||||||||||
| Total |
$ | 4,915 | $ | 2,667 | $ | 2,571 | $ | 2,248 | 84.3 | $ | 96 | 3.7 | ||||||||||||||||
|
|
|
|
|
|
|
|||||||||||||||||||||||
| Average debt outstanding |
$ | 108,461 | $ | 65,959 | $ | 52,949 | ||||||||||||||||||||||
| Effective interest rate |
4.9 | % | 5.2 | % | 5.6 | % | ||||||||||||||||||||||
Total interest costs on debt balances increased during 2014 compared to 2013 primarily due to the issuance of fixed and floating rate notes to finance the Wireless Transaction (see “Acquisitions and Divestitures”) resulting in an increase in average debt and a corresponding increase in interest expense, partially offset by a lower effective interest rate (see “Consolidated Financial Condition”). Capitalized interest costs were lower in 2014 primarily due to a decrease in wireless licenses that are currently under development, which was due to the deployment of AWS licenses for commercial service during 2014.
Total interest costs on debt balances increased during 2013 compared to 2012 primarily due to the issuance of $49.0 billion of fixed and floating rate notes to finance the Wireless Transaction (see “Acquisitions and Divestitures”) resulting in an increase in average debt as well as an incremental increase in interest expense of $0.7 billion, partially offset by a lower effective interest rate (see “Consolidated Financial Condition”). Capitalized interest costs were higher in 2013 primarily due to increases in wireless licenses that are currently under development.
Provision (Benefit) for Income Taxes
| (dollars in millions) | ||||||||||||||||||||||||||||
| Increase/(Decrease) | ||||||||||||||||||||||||||||
| Years Ended December 31, | 2014 | 2013 | 2012 | 2014 vs. 2013 | 2013 vs. 2012 | |||||||||||||||||||||||
| Provision (Benefit) for income taxes |
$ | 3,314 | $ | 5,730 | $ | (660) | $ | (2,416) | (42.2 | )% | $ | 6,390 | nm | |||||||||||||||
| Effective income tax rate |
21.7 | % | 19.6 | % | (6.7) | % | ||||||||||||||||||||||
nm – not meaningful
The effective income tax rate is calculated by dividing the provision for income taxes by income before the provision for income taxes. The effective income tax rate for 2014 was 21.7% compared to 19.6% for 2013. The increase in the effective income tax rate was primarily due to additional income taxes on the incremental income from the Wireless Transaction completed on February 21, 2014 and was partially offset by the utilization of certain tax credits in connection with the Omnitel Transaction in 2014 and the effective income tax rate impact of lower income before income taxes due to severance, pension and benefit charges recorded in 2014 compared to severance, pension and benefit credits recorded in 2013. The decrease in the provision for income taxes was primarily due to lower income before income taxes due to severance, pension and benefit charges recorded in 2014 compared to severance, pension and benefit credits recorded in 2013.
The effective income tax rate for 2013 was 19.6% compared to (6.7)% for 2012. The increase in the effective income tax rate and provision for income taxes was primarily due to higher income before income taxes as a result of severance, pension and benefit credits recorded during 2013 compared to lower income before income taxes as a result of severance, pension and benefit charges as well as early debt redemption costs recorded during 2012.
Our effective income tax rate differed significantly from the statutory federal income tax rate for 2013 and 2012 due to the inclusion of income attributable to Vodafone’s noncontrolling interest in the Verizon Wireless partnership for the full year within our income before the provision for income taxes. In 2013, we recorded a tax provision on income before the provision for income taxes and when we included the income attributable to Vodafone’s noncontrolling interest in the Verizon Wireless partnership in our income before the provision for income taxes it resulted in our effective income tax rate being 13.7 percentage points lower during 2013. In 2012, we recorded a tax benefit on income before the provision for income taxes, which resulted in a negative effective income tax rate. In this circumstance, including the income attributable to Vodafone’s noncontrolling interest in the Verizon Wireless partnership in our income before the provision for income taxes resulted in our negative effective tax rate being 300.3 percentage points higher during 2012.
A reconciliation of the statutory federal income tax rate to the effective income tax rate for each period is included in Note 13 to the consolidated financial statements.
Net Income Attributable to Noncontrolling Interests
| (dollars in millions) | ||||||||||||||||||||||||||||
| Increase/(Decrease) | ||||||||||||||||||||||||||||
| Years Ended December 31, | 2014 | 2013 | 2012 | 2014 vs. 2013 | 2013 vs. 2012 | |||||||||||||||||||||||
| Net income attributable to noncontrolling interests |
$ | 2,331 | $ | 12,050 | $ | 9,682 | $ (9,719 | ) | (80.7 | )% | $ | 2,368 | 24.5 | % | ||||||||||||||
The decrease in Net income attributable to noncontrolling interests during 2014 compared to 2013 was primarily due to the completion of the Wireless Transaction on February 21, 2014. As a result, our results reflect our 55% ownership interest of Verizon Wireless through the closing of the Wireless Transaction and reflect our full ownership of Verizon Wireless for the remainder of the year. The noncontrolling interests that remained after the completion of the Wireless Transaction primarily relate to wireless partnership entities.
The increase in Net income attributable to noncontrolling interests during 2013 compared to 2012 was due to higher earnings in our Verizon Wireless segment, which had a 45% noncontrolling partnership interest attributable to Vodafone as of December 31, 2013.
| Segment Results of Operations |
We have two reportable segments, Wireless and Wireline, which we operate and manage as strategic business units and organize by products and services. We measure and evaluate our reportable segments based on segment operating income. The use of segment operating income is consistent with the chief operating decision maker’s assessment of segment performance.
Segment earnings before interest, taxes, depreciation and amortization (Segment EBITDA), which is presented below, is a non-GAAP measure and does not purport to be an alternative to operating income as a measure of operating performance. Management believes that this measure is useful to investors and other users of our financial information in evaluating operating profitability on a more variable cost basis as it excludes the depreciation and amortization expenses related primarily to capital expenditures and acquisitions that occurred in prior years, as well as in evaluating operating performance in relation to our competitors. Segment EBITDA is calculated by adding back depreciation and amortization expense to segment operating income.
Wireless EBITDA margin is calculated by dividing Wireless EBITDA by total Wireless revenues. Wireless Segment EBITDA service margin, also presented below, is calculated by dividing Wireless Segment EBITDA by Wireless service revenues. Wireless Segment EBITDA service margin utilizes service revenues rather than total revenues. Service revenues primarily exclude equipment revenues in order to reflect the impact of providing service to the wireless customer base on an ongoing basis. Wireline EBITDA margin is calculated by dividing Wireline EBITDA by total Wireline revenues. You can find additional information about our segments in Note 14 to the consolidated financial statements.
| Wireless |
Our Wireless segment is primarily comprised of Cellco Partnership doing business as Verizon Wireless. Cellco Partnership was formed as a joint venture in April 2000 by the combination of the U.S. wireless operations and interests of Verizon and Vodafone. Prior to the completion of the Wireless Transaction, Verizon owned a controlling 55% interest in Verizon Wireless and Vodafone owned the remaining 45%. On February 21, 2014, the Wireless Transaction was completed and Verizon acquired 100% ownership of Verizon Wireless. Verizon Wireless provides wireless communications services across one of the most extensive wireless networks in the United States.
We provide these services and equipment sales to consumer, business and government customers in the United States on a postpaid and prepaid basis. Postpaid connections represent individual lines of service for which a customer is billed in advance a monthly access charge in return for a monthly network service allowance, and usage beyond the allowance is billed monthly in arrears. Our prepaid service enables individuals to obtain wireless services without a long-term contract or credit verification by paying for all services in advance.
All financial results included in the tables below reflect the consolidated results of Verizon Wireless.
Operating Revenues and Selected Operating Statistics
| (dollars in millions, except ARPA) | ||||||||||||||||||||||||||||
| Increase/(Decrease) | ||||||||||||||||||||||||||||
| Years Ended December 31, | 2014 | 2013 | 2012 | 2014 vs. 2013 | 2013 vs. 2012 | |||||||||||||||||||||||
| Retail service |
$ | 69,501 | $ | 66,334 | $ | 61,440 | $ | 3,167 | 4.8 | % | $ | 4,894 | 8.0 | % | ||||||||||||||
| Other service |
3,129 | 2,699 | 2,293 | 430 | 15.9 | 406 | 17.7 | |||||||||||||||||||||
|
|
|
|
|
|
|
|||||||||||||||||||||||
| Service revenue |
72,630 | 69,033 | 63,733 | 3,597 | 5.2 | 5,300 | 8.3 | |||||||||||||||||||||
| Equipment |
10,959 | 8,111 | 8,023 | 2,848 | 35.1 | 88 | 1.1 | |||||||||||||||||||||
| Other |
4,057 | 3,879 | 4,112 | 178 | 4.6 | (233 | ) | (5.7 | ) | |||||||||||||||||||
|
|
|
|
|
|
|
|||||||||||||||||||||||
| Equipment and other |
15,016 | 11,990 | 12,135 | 3,026 | 25.2 | (145 | ) | (1.2 | ) | |||||||||||||||||||
|
|
|
|
|
|
|
|||||||||||||||||||||||
| Total Operating Revenues |
$ | 87,646 | $ | 81,023 | $ | 75,868 | $ | 6,623 | 8.2 | $ | 5,155 | 6.8 | ||||||||||||||||
|
|
|
|
|
|
|
|||||||||||||||||||||||
| Connections (‘000):(1) |
||||||||||||||||||||||||||||
| Retail connections |
108,211 | 102,799 | 98,230 | 5,412 | 5.3 | 4,569 | 4.7 | |||||||||||||||||||||
| Retail postpaid connections |
102,079 | 96,752 | 92,530 | 5,327 | 5.5 | 4,222 | 4.6 | |||||||||||||||||||||
| Net additions in period (‘000):(2) |
||||||||||||||||||||||||||||
| Retail connections |
5,568 | 4,472 | 5,917 | 1,096 | 24.5 | (1,445 | ) | (24.4 | ) | |||||||||||||||||||
| Retail postpaid connections |
5,482 | 4,118 | 5,024 | 1,364 | 33.1 | (906 | ) | (18.0 | ) | |||||||||||||||||||
| Churn Rate: |
||||||||||||||||||||||||||||
| Retail connections |
1.33 | % | 1.27 | % | 1.19 | % | ||||||||||||||||||||||
| Retail postpaid connections |
1.04 | % | 0.97 | % | 0.91 | % | ||||||||||||||||||||||
| Account Statistics: |
||||||||||||||||||||||||||||
| Retail postpaid ARPA |
$ | 159.86 | $ | 153.93 | $ | 144.04 | $ | 5.93 | 3.9 | $ | 9.89 | 6.9 | ||||||||||||||||
| Retail postpaid accounts (‘000)(1) |
35,616 | 35,083 | 35,057 | 533 | 1.5 | 26 | 0.1 | |||||||||||||||||||||
| Retail postpaid connections per account(1) |
2.87 | 2.76 | 2.64 | 0.11 | 4.0 | 0.12 | 4.5 | |||||||||||||||||||||
| (1) | As of end of period |
| (2) | Excluding acquisitions and adjustments |
2014 Compared to 2013
Wireless’ total operating revenues increased by $6.6 billion, or 8.2%, during 2014 compared to 2013 primarily as a result of growth in service revenue and equipment revenue.
Accounts and Connections
Retail (non-wholesale) postpaid accounts primarily represent retail customers under contract with Verizon Wireless that are directly served and managed by Verizon Wireless and use its branded services. Accounts include More Everything plans and corporate accounts, as well as legacy single connection plans and family plans. A single account may include monthly wireless services for a variety of connected devices. Retail connections represent our retail customer device connections. Churn is the rate at which service to connections is terminated.
Retail connections under an account may include: smartphones, basic phones, tablets, LTE Internet (Installed) and other connected devices. Retail postpaid connection net additions increased during 2014 compared to 2013 primarily due to an increase in retail postpaid connection gross additions partially offset by an increase in our retail postpaid connection churn rate. Higher retail postpaid connection gross additions were driven by gross additions of tablets as well as 4G LTE smartphones. During 2014, our retail postpaid connection net additions included approximately 4.2 million tablets as compared to 1.4 million tablets in 2013.
Retail Postpaid Connections per Account
Retail postpaid connections per account is calculated by dividing the total number of retail postpaid connections by the number of retail postpaid accounts as of the end of the period. Retail postpaid connections per account increased 4.0% as of December 31, 2014 compared to December 31, 2013 primarily due to the increased penetration of tablets.
Service Revenue
Service revenue, which does not include recurring equipment installment billings related to Verizon Edge, increased by $3.6 billion, or 5.2%, during 2014 compared to 2013 primarily driven by higher retail postpaid service revenue, which increased largely as a result of an increase in retail postpaid connections as well as the continued increase in penetration of 4G LTE smartphones and tablets through our More Everything plans. The penetration of 4G LTE smartphones was driven by the activation of smartphones by new customers as well as existing customers migrating from basic phones and 3G smartphones to 4G LTE smartphones.
The increase in retail postpaid ARPA (the average revenue per account from retail postpaid accounts), which does not include recurring equipment installment billings related to Verizon Edge, during 2014 compared to 2013 was primarily driven by increases in smartphone penetration and retail postpaid connections per account. As of December 31, 2014, we experienced a 4.0% increase in retail postpaid connections per account compared to 2013, with smartphones representing 79% of our retail postpaid phone base as of December 31, 2014 compared to 70% as of December 31, 2013. The increased penetration in retail postpaid connections per account is primarily due to increases in Internet data devices, which represented 14.1% of our retail postpaid connection base as of December 31, 2014 compared to 10.7% as of December 31, 2013, primarily due to tablet activations. Additionally, during 2014, postpaid smartphone activations represented 92% of phones activated compared to 86% during 2013.
Other service revenue increased during 2014 compared to 2013 due to growth in wholesale connections.
Equipment and Other Revenue
Equipment and other revenue increased during 2014 compared to 2013 primarily due to an increase in equipment sales under both the traditional subsidy model and Verizon Edge.
2013 Compared to 2012
The increase in Wireless’ total operating revenues of $5.2 billion, or 6.8%, during 2013 compared to 2012 was primarily the result of growth in service revenue.
Accounts and Connections
Retail postpaid connection net additions decreased during 2013 compared to 2012 primarily due to an increase in our retail postpaid connection churn rate, partially offset by an increase in retail postpaid connection gross additions.
Retail Postpaid Connections per Account
Retail postpaid connections per account increased 4.5% as of December 31, 2013 compared to December 31, 2012 primarily due to the increased penetration of tablets and other Internet devices.
Service Revenue
Service revenue increased $5.3 billion, or 8.3%, during 2013 compared to 2012 primarily driven by higher retail postpaid service revenue, which increased largely as a result of an increase in retail postpaid connections as well as the continued increase in penetration of smartphones, tablets and other Internet devices through our Share Everything plans. The penetration of smartphones was driven by the activation of smartphones by new customers as well as existing customers migrating from basic phones to smartphones.
The increase in retail postpaid ARPA during 2013 compared to 2012 was primarily driven by increases in smartphone penetration and retail postpaid connections per account. As of December 31, 2013, we experienced a 4.5% increase in retail postpaid connections per account compared to 2012, with smartphones representing 70% of our retail postpaid phone base as of December 31, 2013 compared to 58% as of December 31, 2012. The increased penetration in retail postpaid connections per account is primarily due to increases in Internet data devices, which represented 10.7% of our retail postpaid connection base as of December 31, 2013 compared to 9.3% as of December 31, 2012, primarily due to activations of tablets and other Internet devices. Additionally, during 2013, postpaid smartphone activations represented 86% of phones activated compared to 77% during 2012.
Other service revenue increased during 2013 compared to 2012 due to growth in wholesale connections, partially offset by a decrease in revenue related to third party roaming.
Equipment and Other Revenue
Equipment and other revenue decreased during 2013 compared to 2012 as a decline in regulatory fees was partially offset by an increase in revenue related to upgrade fees.
Operating Expenses
| (dollars in millions) | ||||||||||||||||||||||||||||
| Increase/(Decrease) | ||||||||||||||||||||||||||||
| Years Ended December 31, | 2014 | 2013 | 2012 | 2014 vs. 2013 | 2013 vs. 2012 | |||||||||||||||||||||||
| Cost of services and sales |
$ | 28,825 | $ | 23,648 | $ | 24,490 | $ | 5,177 | 21.9 | % | $ | (842 | ) | (3.4 | )% | |||||||||||||
| Selling, general and administrative expense |
23,602 | 23,176 | 21,650 | 426 | 1.8 | 1,526 | 7.0 | |||||||||||||||||||||
| Depreciation and amortization expense |
8,459 | 8,202 | 7,960 | 257 | 3.1 | 242 | 3.0 | |||||||||||||||||||||
|
|
|
|
|
|
|
|||||||||||||||||||||||
| Total Operating Expenses |
$ | 60,886 | $ | 55,026 | $ | 54,100 | $ | 5,860 | 10.6 | $ | 926 | 1.7 | ||||||||||||||||
|
|
|
|
|
|
|
|||||||||||||||||||||||
Cost of Services and Sales
Cost of services and sales increased during 2014 compared to 2013 primarily due to an increase in cost of equipment sales of $5.3 billion as a result of an increase in the number of devices sold as well as an increase in the cost per unit. The increase in the number of devices sold was driven, in part, by the launch of new devices.
Cost of services and sales decreased during 2013 compared to 2012 primarily due to a decrease in cost of equipment sales of $0.4 billion, which was partially due to a decline in postpaid upgrades, decreased data roaming, a decline in cost of data services and a decrease in network connection costs due to the deployment of Ethernet backhaul facilities primarily targeted at sites upgrading to 4G LTE, partially offset by an increase in cost of network services.
Selling, General and Administrative Expense
Selling, general and administrative expense increased during 2014 compared to 2013 primarily due to a $0.2 billion increase in advertising expense and gains recorded in the first quarter of 2013 related to wireless license exchange agreements, partially offset by a decline in sales commission expense, which was driven by the adoption of Verizon Edge.
Selling, general and administrative expense increased during 2013 compared to 2012 primarily due to higher sales commission expense in our indirect channel. Indirect sales commission expense increased $1.1 billion during 2013 compared to 2012 primarily as a result of increases in indirect gross additions and upgrades, as well as the average commission per unit, as the mix of units continues to shift toward smartphones and more customers activate data services.
Depreciation and Amortization Expense
The increase in depreciation and amortization expense during 2014 compared to 2013, and 2013 compared to 2012, respectively, was primarily driven by an increase in net depreciable assets.
Segment Operating Income and EBITDA
| (dollars in millions) | ||||||||||||||||||||||||||||
| Increase/(Decrease) | ||||||||||||||||||||||||||||
| Years Ended December 31, | 2014 | 2013 | 2012 | 2014 vs. 2013 | 2013 vs. 2012 | |||||||||||||||||||||||
| Segment Operating Income |
$ | 26,760 | $ | 25,997 | $ | 21,768 | $ | 763 | 2.9 | % | $ | 4,229 | 19.4 | % | ||||||||||||||
| Add Depreciation and amortization expense |
8,459 | 8,202 | 7,960 | 257 | 3.1 | 242 | 3.0 | |||||||||||||||||||||
|
|
|
|
|
|
|
|||||||||||||||||||||||
| Segment EBITDA |
$ | 35,219 | $ | 34,199 | $ | 29,728 | $ | 1,020 | 3.0 | $ | 4,471 | 15.0 | ||||||||||||||||
|
|
|
|
|
|
|
|||||||||||||||||||||||
| Segment operating income margin |
30.5 | % | 32.1 | % | 28.7 | % | ||||||||||||||||||||||
| Segment EBITDA margin |
40.2 | % | 42.2 | % | 39.2 | % | ||||||||||||||||||||||
| Segment EBITDA service margin |
48.5 | % | 49.5 | % | 46.6 | % | ||||||||||||||||||||||
The changes in the table above during the periods presented were primarily a result of the factors described in connection with operating revenues and operating expenses.
Non-operational items excluded from Wireless’ Operating income were as follows:
| (dollars in millions) | ||||||||||||
| Years Ended December 31, | 2014 | 2013 | 2012 | |||||||||
| Gain on spectrum license transactions |
$ | (707 | ) | $ | (278 | ) | $ | – | ||||
| Severance, pension and benefit (credits) charges |
86 | (61 | ) | 37 | ||||||||
| Other costs |
109 | – | – | |||||||||
|
|
|
|||||||||||
| $ | (512 | ) | $ | (339 | ) | $ | 37 | |||||
|
|
|
|||||||||||
| Wireline |
Our Wireline segment provides voice, data and video communications products and enhanced services, including broadband video and data, corporate networking solutions, data center and cloud services, security and managed network services and local and long distance voice services. We provide these products and services to consumers in the United States, as well as to carriers, businesses and government customers both in the United States and around the world.
On July 1, 2014, our Wireline segment sold a non-strategic business (see “Acquisitions and Divestitures”). Accordingly, the historical Wireline results for these operations, which were not material to our consolidated financial statements or our segment results of operations, have been reclassified to Corporate, eliminations and other to reflect comparable segment operating results.
Operating Revenues and Selected Operating Statistics
| (dollars in millions) | ||||||||||||||||||||||||||||
| Increase/(Decrease) | ||||||||||||||||||||||||||||
| Years Ended December 31, | 2014 | 2013 | 2012 | 2014 vs. 2013 | 2013 vs. 2012 | |||||||||||||||||||||||
| Consumer retail |
$ | 15,583 | $ | 14,842 | $ | 14,145 | $ | 741 | 5.0 | % | $ | 697 | 4.9 | % | ||||||||||||||
| Small business |
2,464 | 2,541 | 2,601 | (77 | ) | (3.0 | ) | (60 | ) | (2.3 | ) | |||||||||||||||||
|
|
|
|
|
|
|
|||||||||||||||||||||||
| Mass Markets |
18,047 | 17,383 | 16,746 | 664 | 3.8 | 637 | 3.8 | |||||||||||||||||||||
| Strategic services |
8,326 | 8,140 | 7,737 | 186 | 2.3 | 403 | 5.2 | |||||||||||||||||||||
| Core |
5,358 | 6,042 | 6,840 | (684 | ) | (11.3 | ) | (798 | ) | (11.7 | ) | |||||||||||||||||
|
|
|
|
|
|
|
|||||||||||||||||||||||
| Global Enterprise |
13,684 | 14,182 | 14,577 | (498 | ) | (3.5 | ) | (395 | ) | (2.7 | ) | |||||||||||||||||
| Global Wholesale |
6,222 | 6,594 | 7,094 | (372 | ) | (5.6 | ) | (500 | ) | (7.0 | ) | |||||||||||||||||
| Other |
476 | 465 | 528 | 11 | 2.4 | (63 | ) | (11.9 | ) | |||||||||||||||||||
|
|
|
|
|
|
|
|||||||||||||||||||||||
| Total Operating Revenues |
$ | 38,429 | $ | 38,624 | $ | 38,945 | $ | (195 | ) | (0.5 | ) | $ | (321 | ) | (0.8 | ) | ||||||||||||
|
|
|
|
|
|
|
|||||||||||||||||||||||
| Connections (‘000):(1) |
||||||||||||||||||||||||||||
| Total voice connections |
19,795 | 21,085 | 22,503 | (1,290 | ) | (6.1 | ) | (1,418 | ) | (6.3 | ) | |||||||||||||||||
| Total Broadband connections |
9,205 | 9,015 | 8,795 | 190 | 2.1 | 220 | 2.5 | |||||||||||||||||||||
| FiOS Internet subscribers |
6,616 | 6,072 | 5,424 | 544 | 9.0 | 648 | 11.9 | |||||||||||||||||||||
| FiOS Video subscribers |
5,649 | 5,262 | 4,726 | 387 | 7.4 | 536 | 11.3 | |||||||||||||||||||||
| (1) | As of end of period |
Wireline’s revenues decreased $0.2 billion, or 0.5%, during 2014 compared to 2013 primarily driven by declines in Global Enterprise Core and Global Wholesale, partially offset by higher Consumer retail revenues driven by FiOS services and increased Strategic services revenues within Global Enterprise.
Mass Markets
Mass Markets operations provide broadband services (including high-speed Internet, FiOS Internet and FiOS Video services), local exchange (basic service and end-user access) and long distance (including regional toll) voice services to residential and small business subscribers.
2014 Compared to 2013
Mass Markets revenues increased $0.7 billion, or 3.8%, during 2014 compared to 2013 primarily due to the expansion of FiOS services (Voice, Internet and Video), including our FiOS Quantum offerings, as well as changes in our pricing strategies, partially offset by the continued decline of local exchange revenues. FiOS represented approximately 76% of Consumer retail revenue during 2014 compared to approximately 71% during 2013.
During 2014, we grew our subscriber base by 0.5 million FiOS Internet subscribers and by 0.4 million FiOS Video subscribers, while also improving penetration rates within our FiOS service areas. As of December 31, 2014, we achieved penetration rates of 41.1% and 35.8% for FiOS Internet and FiOS Video, respectively, compared to penetration rates of 39.5% and 35.0% for FiOS Internet and FiOS Video, respectively, at December 31, 2013.
The increase in Mass Markets revenues was partially offset by the decline of local exchange revenues primarily due to a 5.5% decline in Consumer retail voice connections resulting primarily from competition and technology substitution with wireless, competing VoIP, and cable telephony services. Total voice connections include traditional switched access lines in service as well as FiOS digital voice connections. There was also a decline in Small business retail voice connections, primarily reflecting competition and a continuing shift to both IP and high-speed circuits.
2013 Compared to 2012
Mass Markets revenues increased $0.6 billion, or 3.8%, during 2013 compared to 2012 primarily due to the expansion of FiOS services (Voice, Internet and Video) as well as changes in our pricing strategies, partially offset by the continued decline of local exchange revenues.
During 2013, we grew our subscriber base by 0.6 million FiOS Internet subscribers and by 0.5 million FiOS Video subscribers, while also consistently improving penetration rates within our FiOS service areas. As of December 31, 2013, we achieved penetration rates of 39.5% and 35.0% for FiOS Internet and FiOS Video, respectively, compared to penetration rates of 37.3% and 33.3% for FiOS Internet and FiOS Video, respectively, at December 31, 2012.
The increase in Mass Markets revenues, driven by FiOS services, was partially offset by the decline of local exchange revenues primarily due to a 5.2% decline in Consumer retail voice connections resulting primarily from competition and technology substitution with wireless, VoIP, broadband and cable services. Total voice connections include traditional switched access lines in service as well as FiOS digital voice connections. There was also a decline in Small business retail voice connections, primarily reflecting competition and a shift to both IP and high-speed circuits.
Global Enterprise
Global Enterprise offers Strategic services and other core communications services to medium and large business customers, multinational corporations and state and federal government customers.
2014 Compared to 2013
Global Enterprise revenues decreased $0.5 billion, or 3.5%, during 2014 compared to 2013 primarily due to a $0.5 billion, or 11.9%, decline related to lower voice services and data networking revenues, which consist of traditional circuit-based services such as frame relay, private line and legacy voice and data services. These core services declined compared to 2013 as customers continued to migrate to next generation IP services. Also contributing to the decrease was the contraction of market rates due to competition and a decline in Core customer premise equipment revenues. This decrease was partially offset by an increase in Strategic services revenues of $0.2 billion, or 2.3%, primarily due to growth in our application services, such as our cloud and data center offerings and contact center solutions.
2013 Compared to 2012
Global Enterprise revenues decreased $0.4 billion, or 2.7%, during 2013 compared to 2012 primarily due to a $0.5 billion, or 27.1%, decline in Core customer premise equipment revenues as well as lower voice services and data networking revenues, which consist of traditional circuit-based services such as frame relay, private line and legacy voice and data services. These core services declined in 2013 compared to 2012 as our customer base continued to migrate to next generation IP services. The decline in customer premise equipment revenues reflected our focus on improving margins by continuing to de-emphasize sales of equipment that are not part of an overall enterprise solutions bundle. This decrease was partially offset by growth in Strategic services revenues, which increased $0.4 billion, or 5.2%, during 2013 compared to 2012 primarily due to growth in advanced services, such as contact center solutions, IP communications and our cloud and data center offerings, as well as revenue from a telematics services business that we acquired in the third quarter of 2012.
Global Wholesale
Global Wholesale provides communications services including data, voice and local dial tone and broadband services primarily to local, long distance and other carriers that use our facilities to provide services to their customers.
2014 Compared to 2013
Global Wholesale revenues decreased $0.4 billion, or 5.6%, during 2014 compared to 2013 primarily due to a decline in data revenues and traditional voice revenues. Data revenue declines were driven by the continuing demand for high-speed digital data services from fiber-to-the-cell customers upgrading their core data circuits to Ethernet facilities. As a result of the customer migrations, at December 31, 2014, the number of core data circuits experienced a 14.2% decline compared to December 31, 2013. The traditional voice revenue declines are primarily due to a decrease in MOUs and the effect of technology substitution. During 2014, we also experienced a 6.2% decline in domestic wholesale connections. Also contributing to the decline in voice revenues is the continuing contraction of market rates due to competition.
2013 Compared to 2012
Global Wholesale revenues decreased $0.5 billion, or 7.0%, during 2013 compared to 2012 primarily due to a decline in traditional voice revenues as a result of decreased MOUs and a 5.2% decline in domestic wholesale connections. The traditional voice product reductions are primarily due to competitors de-emphasizing their local market initiatives coupled with the effect of technology substitution. Also contributing to the decline in voice
revenues is the continuing contraction of market rates due to competition. Partially offsetting the overall decrease in wholesale revenue was a continuing demand for high-speed digital data services from fiber-to-the-cell customers upgrading their core data circuits to Ethernet facilities as well as Ethernet migrations from other core customers. As a result of the customer upgrades, the number of core data circuits experienced an 11.3% decline compared to the similar period in 2012.
Operating Expenses
| (dollars in millions) | ||||||||||||||||||||||||||||
| Increase/(Decrease) | ||||||||||||||||||||||||||||
| Years Ended December 31, | 2014 | 2013 | 2012 | 2014 vs. 2013 | 2013 vs. 2012 | |||||||||||||||||||||||
| Cost of services and sales |
$ | 21,332 | $ | 21,396 | $ | 21,657 | $ | (64 | ) | (0.3 | )% | $ | (261 | ) | (1.2 | )% | ||||||||||||
| Selling, general and administrative expense |
8,180 | 8,571 | 8,860 | (391 | ) | (4.6 | ) | (289 | ) | (3.3 | ) | |||||||||||||||||
| Depreciation and amortization expense |
7,882 | 8,327 | 8,424 | (445 | ) | (5.3 | ) | (97 | ) | (1.2 | ) | |||||||||||||||||
|
|
|
|
|
|
|
|||||||||||||||||||||||
| Total Operating Expenses |
$ | 37,394 | $ | 38,294 | $ | 38,941 | $ | (900 | ) | (2.4 | ) | $ | (647 | ) | (1.7 | ) | ||||||||||||
|
|
|
|
|
|
|
|||||||||||||||||||||||
Cost of Services and Sales
Cost of services and sales decreased slightly during 2014 compared to 2013, primarily due to a decrease in employee costs as a result of reduced headcount and a decline in access costs driven by declines in overall wholesale long distance volumes, which was partially offset by an increase in content costs of $0.4 billion associated with continued FiOS subscriber growth and programming license fee increases.
Cost of services and sales decreased during 2013 compared to 2012, primarily due to a decrease in costs related to customer premise equipment which reflected our focus on improving margins by de-emphasizing sales of equipment that are not part of an overall enterprise solutions bundle, a decline in access costs resulting primarily from declines in overall wholesale long distance volumes and the net effect of storm-related insurance recoveries. These decreases were partially offset by higher content costs associated with continued FiOS subscriber growth and programming license fee increases.
Selling, General and Administrative Expense
Selling, general and administrative expense decreased during 2014 compared to 2013 primarily due to declines in employee costs as a result of reduced headcount, decreased advertising expense and lower transaction and property taxes.
Selling, general and administrative expense decreased during 2013 compared to 2012 primarily due to declines in employee costs, primarily as a result of reduced headcount, and declines in rent expenses, partially offset by higher transaction and property tax expenses.
Depreciation and Amortization Expense
Depreciation and amortization expense decreased during 2014 compared to 2013, as well as 2013 compared to 2012, due to decreases in net depreciable assets.
Segment Operating Income and EBITDA
| (dollars in millions) | ||||||||||||||||||||||||||||
| Increase/(Decrease) | ||||||||||||||||||||||||||||
| Years Ended December 31, | 2014 | 2013 | 2012 | 2014 vs. 2013 | 2013 vs. 2012 | |||||||||||||||||||||||
| Segment Operating Income |
$ | 1,035 | $ | 330 | $ | 4 | $ | 705 | nm | $ | 326 | nm | ||||||||||||||||
| Add Depreciation and amortization expense |
7,882 | 8,327 | 8,424 | (445 | ) | (5.3 | )% | (97 | ) | (1.2 | )% | |||||||||||||||||
|
|
|
|
|
|
|
|||||||||||||||||||||||
| Segment EBITDA |
$ | 8,917 | $ | 8,657 | $ | 8,428 | $ | 260 | 3.0 | $ | 229 | 2.7 | ||||||||||||||||
|
|
|
|
|
|
|
|||||||||||||||||||||||
|
Segment operating income margin |
2.7 | % | 0.9 | % | – | |||||||||||||||||||||||
| Segment EBITDA margin |
23.2 | % | 22.4 | % | 21.6 | % | ||||||||||||||||||||||
nm – not meaningful
The changes in Wireline’s Operating income, Segment EBITDA and Segment EBITDA margin during the periods presented were primarily a result of the factors described in connection with operating revenues and operating expenses.
Non-operational items excluded from Wireline’s Operating income were as follows:
| (dollars in millions) | ||||||||||||
| Years Ended December 31, | 2014 | 2013 | 2012 | |||||||||
| Severance, pension and benefit charges |
$ | 189 | $ | – | $ | – | ||||||
| Impact of divested operations |
(12 | ) | (43 | ) | (56 | ) | ||||||
| Other costs |
137 | – | 56 | |||||||||
|
|
|
|||||||||||
| $ | 314 | $ | (43 | ) | $ | – | ||||||
|
|
|
|||||||||||
| Other Items |
| Severance, Pension and Benefit (Credits) Charges |
During 2014, we recorded net pre-tax severance, pension and benefits charges of approximately $7.5 billion primarily for our pension and postretirement plans in accordance with our accounting policy to recognize actuarial gains and losses in the year in which they occur. The charges were primarily driven by a decrease in our discount rate assumption used to determine the current year liabilities from a weighted-average of 5.0% at December 31, 2013 to a weighted-average of 4.2% at December 31, 2014 ($5.2 billion), a change in mortality assumptions primarily driven by the use of updated actuarial tables (RP-2014 and MP-2014) issued by the Society of Actuaries in October 2014 ($1.8 billion) and revisions to the retirement assumptions for participants and other assumption adjustments, partially offset by the difference between our estimated return on assets of 7.25% and our actual return on assets of 10.5% ($0.6 billion). As part of this charge, we recorded severance costs of $0.5 billion under our existing separation plans.
During 2013, we recorded net pre-tax severance, pension and benefits credits of approximately $6.2 billion primarily for our pension and postretirement plans in accordance with our accounting policy to recognize actuarial gains and losses in the year in which they occur. The credits were primarily driven by an increase in our discount rate assumption used to determine the current year liabilities from a weighted-average of 4.2% at December 31, 2012 to a weighted-average of 5.0% at December 31, 2013 ($4.3 billion), lower than assumed retiree medical costs and other assumption adjustments ($1.4 billion) and the difference between our estimated return on assets of 7.5% at December 31, 2012 and our actual return on assets of 8.6% at December 31, 2013 ($0.5 billion).
During 2012, we recorded net pre-tax severance, pension and benefits charges of approximately $7.2 billion primarily for our pension and postretirement plans in accordance with our accounting policy to recognize actuarial gains and losses in the year in which they occur. The charges were primarily driven by a decrease in our discount rate assumption used to determine the current year liabilities from a weighted-average of 5% at December 31, 2011 to a weighted-average of 4.2% at December 31, 2012 ($5.3 billion) and revisions to the retirement assumptions for participants and other assumption adjustments, partially offset by the difference between our estimated return on assets of 7.5% and our actual return on assets of 10% ($0.7 billion). As part of this charge, we also recorded $1.0 billion related to the annuitization of pension liabilities (see “Employee Benefit Plan Funded Status and Contributions”) as well as severance charges of $0.4 billion.
The Consolidated Adjusted EBITDA non-GAAP measure presented in the Consolidated Operating Income and EBITDA discussion (see “Consolidated Results of Operations”) excludes the severance, pension and benefit (credits) charges presented above.
| Early Debt Redemption and Other Costs |
During March 2014, we recorded net debt redemption costs of $0.9 billion in connection with the early redemption of $1.25 billion aggregate principal amount of Cellco Partnership and Verizon Wireless Capital LLC 8.50% Notes due 2018, and the purchase of the following notes pursuant to the Tender Offer: $0.7 billion of the then outstanding $1.5 billion aggregate principal amount of Verizon 6.10% Notes due 2018, $0.8 billion of the then outstanding $1.5 billion aggregate principal amount of Verizon 5.50% Notes due 2018, $0.6 billion of the then outstanding $1.3 billion aggregate principal amount of Verizon 8.75% Notes due 2018, $0.7 billion of the then outstanding $1.25 billion aggregate principal amount of Verizon 5.55% Notes due 2016, $0.4 billion of the then outstanding $0.75 billion aggregate principal amount of Verizon 5.50% Notes due 2017, $0.6 billion of the then outstanding $1.0 billion aggregate principal amount of Cellco Partnership and Verizon Wireless Capital LLC 8.50% Notes due 2018, $0.2 billion of the then outstanding $0.3 billion aggregate principal amount of Alltel Corporation 7.00% Debentures due 2016 and $0.3 billion of the then outstanding $0.6 billion aggregate principal amount of GTE Corporation 6.84% Debentures due 2018.
See Note 8 to the consolidated financial statements for additional information regarding the Tender Offer.
During the fourth quarter of 2014, we recorded net debt redemption costs of $0.5 billion in connection with the early redemption of $0.5 billion aggregate principal amount of Verizon 4.90% Notes due 2015, $0.6 billion aggregate principal amount of Verizon 5.55% Notes due 2016, $1.3 billion aggregate principal amount of Verizon 3.00% Notes due 2016, $0.4 billion aggregate principal amount of Verizon 5.50% Notes due 2017, $0.7 billion aggregate principal amount of Verizon 8.75% Notes due 2018, $1.0 billion of the then outstanding $3.2 billion aggregate principal amount of Verizon 2.50% Notes due 2016, $0.1 billion aggregate principal amount Alltel Corporation 7.00% Debentures due 2016 and $0.4 billion aggregate principal amount of Cellco Partnership and Verizon Wireless Capital LLC 8.50% Notes due 2018, as well as $0.3 billion of other costs.
During November 2012, we recorded debt redemption costs of $0.8 billion in connection with the purchase of $0.9 billion of the $1.25 billion of 8.95% Verizon Communications Notes due 2039 in a cash tender offer.
During December 2012, we recorded debt redemption costs of $0.3 billion in connection with the early redemption of $0.7 billion of the $2.0 billion of 8.75% Verizon Communications Notes due 2018, $1.0 billion of 4.625% Verizon Virginia LLC Debentures, Series A, due March 2013 and $0.75 billion of 4.35% Verizon Communications Notes due February 2013, as well as $0.3 billion of other costs.
We recognize early debt redemption costs in Other income and (expense), net on our consolidated statements of income.
| Gain on Spectrum License Transactions |
During the second quarter of 2014, we completed license exchange transactions with T-Mobile USA Inc. (T-Mobile USA) to exchange certain AWS and Personal Communication Services (PCS) licenses. The exchange included a number of swaps that we expect will result in more efficient use of the AWS and PCS bands. As a result of these exchanges, we received $0.9 billion of AWS and PCS spectrum licenses at fair value and we recorded an immaterial gain.
During the second quarter of 2014, we completed transactions pursuant to two additional agreements with T-Mobile USA with respect to our remaining 700 MHz A block spectrum licenses. Under one agreement, we sold certain of these licenses to T-Mobile USA in exchange for cash consideration of approximately $2.4 billion, and under the second agreement we exchanged the remainder of our 700 MHz A block spectrum licenses as well as AWS and PCS spectrum licenses for AWS and PCS spectrum licenses. As a result, we received $1.6 billion of AWS and PCS spectrum licenses at fair value and we recorded a pre-tax gain of approximately $0.7 billion in Selling, general and administrative expense on our consolidated statement of income for the year ended December 31, 2014.
During the third quarter of 2013, after receiving the required regulatory approvals, Verizon Wireless sold 39 lower 700 MHz B block spectrum licenses to AT&T in exchange for a payment of $1.9 billion and the transfer by AT&T to Verizon Wireless of AWS (10 MHz) licenses in certain markets in the western United States. Verizon Wireless also sold certain lower 700 MHz B block spectrum licenses to an investment firm for a payment of $0.2 billion. As a result, we received $0.5 billion of AWS licenses at fair value and we recorded a pre-tax gain of approximately $0.3 billion in Selling, general and administrative expense on our consolidated statement of income for the year ended December 31, 2013.
The Consolidated Adjusted EBITDA non-GAAP measure presented in the Consolidated Operating Income and EBITDA discussion (see “Consolidated Results of Operations”) excludes the gains on the spectrum license transactions described above.
| Wireless Transaction Costs |
As a result of the third-party indebtedness incurred to finance the Wireless Transaction, we incurred interest expense of $0.4 billion during 2014 (see “Consolidated Financial Condition”). This amount represents the interest expense incurred prior to the closing of the Wireless Transaction.
During 2013, as a result of the Wireless Transaction, we recorded costs of $0.9 billion primarily for interest expense of $0.7 billion related to the issuance of the new notes, as well as $0.2 billion in fees primarily in connection with the bridge credit agreement (see “Consolidated Financial Condition”).
| Gain on Sale of Omnitel Interest |
As a result of the sale of the Omnitel Interest on February 21, 2014, which was part of the consideration for the Wireless Transaction, we recorded a gain of $1.9 billion in Equity in earnings of unconsolidated businesses on our consolidated statement of income during 2014.
| Impact of Divested Operations |
On July 1, 2014, we sold a non-strategic Wireline business, which provides communications solutions to a variety of government agencies.
The Consolidated Adjusted EBITDA non-GAAP measure presented in the Consolidated Operating Income and EBITDA discussion (see “Consolidated Results of Operations”) excludes the historical financial results of the divested operations described above.
| Litigation Settlements |
In the third quarter of 2012, we settled a number of patent litigation matters, including cases with ActiveVideo Networks Inc. (ActiveVideo) and TiVo Inc. (TiVo). In connection with the settlements with ActiveVideo and TiVo, we recorded a charge of $0.4 billion in the third quarter of 2012 and will pay and recognize over the following six years an additional $0.2 billion.
The Consolidated Adjusted EBITDA non-GAAP measure presented in the Consolidated Operating Income and EBITDA discussion (see “Consolidated Results of Operations”) excludes the litigation settlement costs presented above.
| Consolidated Financial Condition |
| (dollars in millions) | ||||||||||||
| Years Ended December 31, | 2014 | 2013 | 2012 | |||||||||
| Cash Flows Provided By (Used In) |
||||||||||||
| Operating activities |
$ | 30,631 | $ | 38,818 | $ | 31,486 | ||||||
| Investing activities |
(15,856 | ) | (14,833 | ) | (20,502 | ) | ||||||
| Financing activities |
(57,705 | ) | 26,450 | (21,253 | ) | |||||||
|
|
|
|||||||||||
| Increase (Decrease) In Cash and Cash Equivalents |
$ | (42,930 | ) | $ | 50,435 | $ | (10,269 | ) | ||||
|
|
|
|||||||||||
We use the net cash generated from our operations to fund network expansion and modernization, service and repay external financing, pay dividends, invest in new businesses and, when appropriate, buy back shares of our outstanding common stock. Our sources of funds, primarily from operations and, to the extent necessary, from external financing arrangements, are sufficient to meet ongoing operating and investing requirements. The cash portion of the purchase price for the Wireless Transaction was primarily funded by the incurrence of third-party indebtedness (see “Acquisitions and Divestitures”). We expect that our capital spending requirements will continue to be financed primarily through internally generated funds. Debt or equity financing may be needed to fund additional investments or development activities or to maintain an appropriate capital structure to ensure our financial flexibility. Our cash and cash equivalents are primarily held domestically in diversified accounts and are invested to maintain principal and liquidity. Accordingly, we do not have significant exposure to foreign currency fluctuations. See “Market Risk” for additional information regarding our foreign currency risk management strategies.
Our available external financing arrangements include credit available under credit facilities and other bank lines of credit, vendor financing arrangements, issuances of registered debt or equity securities and privately-placed capital market securities. We may also issue short-term debt through an active commercial paper program and have an $8.0 billion credit facility to support such commercial paper issuances.
| Cash Flows Provided By Operating Activities |
Our primary source of funds continues to be cash generated from operations, primarily from our Wireless segment. Net cash provided by operating activities during 2014 decreased by $8.2 billion compared to 2013 primarily due to a $3.7 billion increase in income tax payments due to the incremental pre-tax income attributable to Verizon included in Verizon’s income since the closing of the Wireless Transaction. Also contributing to the decrease was a $2.3 billion increase in interest payments primarily due to the incremental debt needed to fund the Wireless Transaction as well as a $1.5 billion increase in pension contributions. The decrease in Cash flows provided by operating activities was partially offset by an increase in earnings at our Wireless segment.
On February 21, 2014, we completed the Wireless Transaction which provides full access to the cash flows of Verizon Wireless. Having full access to all the cash flows from our wireless business gives us the ability to continue to invest in our networks and spectrum, meet evolving customer requirements for products and services and take advantage of new growth opportunities across our lines of business.
Net cash provided by operating activities during 2013 increased by $7.3 billion compared to 2012 primarily due to higher consolidated earnings, lower pension contributions and improved working capital levels. The increase in net cash provided by operating activities in 2013 was partially offset by net distributions of $0.3 billion received from Vodafone Omnitel in 2012.
| Cash Flows Used In Investing Activities |
Capital Expenditures
Capital expenditures continue to be a primary use of capital resources as they facilitate the introduction of new products and services, enhance responsiveness to competitive challenges and increase the operating efficiency and productivity of our networks.
Capital expenditures, including capitalized software, were as follows:
| (dollars in millions) | ||||||||||||
| Years Ended December 31, | 2014 | 2013 | 2012 | |||||||||
| Wireless |
$ | 10,515 | $ | 9,425 | $ | 8,857 | ||||||
| Wireline |
5,750 | 6,229 | 6,342 | |||||||||
| Other |
926 | 950 | 976 | |||||||||
|
|
|
|||||||||||
| $ | 17,191 | $ | 16,604 | $ | 16,175 | |||||||
|
|
|
|||||||||||
| Total as a percentage of revenue |
13.5 | % | 13.8 | % | 14.0 | % | ||||||
Capital expenditures increased at Wireless in 2014 compared to 2013 in order to increase the capacity of our 4G LTE network. Capital expenditures declined at Wireline as a result of decreased legacy spending requirements.
Capital expenditures increased at Wireless in 2013 compared to 2012 in order to substantially complete the build-out of our 4G LTE network. Capital expenditures declined at Wireline as a result of decreased legacy spending requirements and a decline in spending on our FiOS network.
Acquisitions
During 2014, 2013 and 2012, we invested $0.4 billion, $0.6 billion and $4.3 billion, respectively, in acquisitions of wireless licenses. During 2014, 2013 and 2012, we also invested $0.2 billion, $0.5 billion and $0.9 billion, respectively, in acquisitions of investments and businesses, net of cash acquired.
On January 29, 2015, the FCC completed an auction of 65 MHz of spectrum, which it identified as the AWS-3 band. Verizon participated in that auction, and was the high bidder on 181 spectrum licenses, for which we will pay approximately $10.4 billion. During the fourth quarter of 2014, we made a deposit of $0.9 billion related to our participation in this auction. On February 13, 2015, we made a down payment of $1.2 billion for these spectrum licenses. Verizon has submitted an application for these licenses and must complete payment for them in the first quarter of 2015. During January 2015, we entered into a term loan agreement with a major financial institution, pursuant to which we expect to borrow $6.5 billion to pay for the spectrum licenses. The proceeds from the Tower Monetization Transaction, which we expect to receive in the first half of 2015, will be used to repay the majority of the term loan outstanding. See Note 2 to the consolidated financial statements for additional information regarding the Tower Monetization Transaction and Note 8 to the consolidated financial statements for additional information regarding the term loan agreement.
In February 2014, Verizon acquired a business dedicated to the development of IP television for cash consideration that was not significant.
During the fourth quarter of 2013, Verizon acquired an industry leader in content delivery networks for $0.4 billion. Additionally, we acquired a technology company for cash consideration that was not significant.
During 2012, we paid approximately $4.3 billion to acquire wireless licenses primarily to meet future LTE capacity needs and enable LTE expansion. Additionally, during 2012, we acquired HUGHES Telematics, a provider of telematics services, for $0.6 billion. See Note 2 to the consolidated financial statements for additional information.
Dispositions
During 2014, we received proceeds of $2.4 billion related to spectrum license transactions and $0.1 billion related to the disposition of a non-strategic Wireline business. See Note 2 to the consolidated financial statements for additional information.
During 2013, we completed the sale of 700 MHz lower B block spectrum licenses and as a result, we received proceeds of $2.1 billion.
During 2012, we received $0.4 billion related to the sale of some of our 700 MHz lower A and B block spectrum licenses. We acquired these licenses as part of FCC Auction 73 in 2008.
Other, net
For the year ended December 31, 2014, Other, net included the deposit of $0.9 billion related to our participation in the FCC auction of spectrum in the AWS-3 band.
| Cash Flows Provided by (Used In) Financing Activities |
We seek to maintain a mix of fixed and variable rate debt to lower borrowing costs within reasonable risk parameters and to protect against earnings and cash flow volatility resulting from changes in market conditions. During 2014, 2013 and 2012, net cash provided by (used in) financing activities was $(57.7) billion, $26.5 billion and $(21.3) billion, respectively.
2014
During 2014, our net cash used in financing activities of $57.7 billion was primarily driven by:
| • | $58.9 billion used to partially fund the Wireless Transaction (see Note 2 to the consolidated financial statements); |
| • | $17.7 billion used for repayments of long-term borrowings and capital lease obligations; and |
| • | $7.8 billion used for dividend payments. |
These uses of cash were partially offset by proceeds from long-term borrowings of $31.0 billion.
Proceeds from and Repayments of Long-Term Borrowings
As of December 31, 2014, our total debt increased to $113.3 billion as compared to $93.6 billion at December 31, 2013 primarily as a result of additional debt issued to finance the Wireless Transaction. Since the substantial majority of our total debt portfolio consists of fixed rate indebtedness, changes in interest rates do not have a material effect on our interest payments. Throughout 2014, we accessed the capital markets to optimize the maturity schedule of our debt portfolio and take advantage of lower interest rates, thereby reducing our effective interest rate to 4.9% from 5.2% in 2013. See Note 8 to the consolidated financial statements for additional details regarding our debt activity.
At December 31, 2014, approximately $9.6 billion or 8.5% of the aggregate principal amount of our total debt portfolio consisted of foreign denominated debt, primarily the Euro and British Pound Sterling. We have entered into cross currency swaps in order to fix our future interest and principal payments in U.S. dollars and mitigate the impact of foreign currency transaction gains or losses. See “Market Risk” for additional information.
See “Other Items” for additional information related to the early debt redemption costs incurred in 2014.
Dividends
The Verizon Board of Directors assesses the level of our dividend payments on a periodic basis taking into account such factors as long-term growth opportunities, internal cash requirements and the expectations of our shareowners. During the third quarter of 2014, the Board increased our quarterly dividend payment 3.8% to $.55 per share from $.53 per share in the same period of 2013. This is the eighth consecutive year that Verizon’s Board of Directors has approved a quarterly dividend increase.
As in prior periods, dividend payments were a significant use of capital resources. During 2014, we paid $7.8 billion in dividends compared to $5.9 billion in 2013. The increase is primarily due to the issuance of approximately 1.27 billion additional shares of common stock as a result of the Wireless Transaction.
2013
During 2013, our net cash provided by financing activities of $26.5 billion was primarily driven by proceeds from long-term borrowings of $49.2 billion to fund the Wireless Transaction. This source of cash was partially offset by:
| • | $8.2 billion used for repayments of long-term borrowings and capital lease obligations; |
| • | $5.9 billion used for dividend payments; and |
| • | $3.2 billion used for a special distribution to a noncontrolling interest. |
Proceeds from and Repayments of Long-Term Borrowings
As of December 31, 2013, our total debt increased to $93.6 billion as compared to $52.0 billion at December 31, 2012 primarily as a result of additional debt issued to finance the Wireless Transaction. Since the substantial majority of our total debt portfolio consists of fixed rate indebtedness, changes in interest rates do not have a material effect on our interest payments. See Note 8 to the consolidated financial statements for additional details regarding our debt activity.
Dividends
During the third quarter of 2013, the Board increased our quarterly dividend payment 2.9% to $.53 per share from $.515 per share in the same period of 2012. As in prior periods, dividend payments were a significant use of capital resources.
Special Distributions
In May 2013, the Board of Representatives of Verizon Wireless declared a distribution to its owners, which was paid in the second quarter of 2013 in proportion to their partnership interests on the payment date, in the aggregate amount of $7.0 billion. As a result, Vodafone received a cash payment of $3.15 billion and the remainder of the distribution was received by Verizon.
Other, net
The change in Other, net financing activities during 2013 compared to 2012 was primarily driven by higher distributions to Vodafone, which owned a 45% noncontrolling interest in Verizon Wireless as of December 31, 2013.
2012
During 2012, our net cash used in financing activities of $21.3 billion was primarily driven by:
| • | $8.3 billion used for a special distribution to a noncontrolling interest; |
| • | $6.4 billion used for repayments of long-term borrowings and capital lease obligations; and |
| • | $5.2 billion used for dividend payments. |
These uses of cash were partially offset by proceeds from long-term borrowings of $4.5 billion.
Proceeds from and Repayments of Long-Term Borrowings
As of December 31, 2012, our total debt decreased to $52.0 billion as compared to $55.2 billion at December 31, 2011 primarily as a result of the repayment of long-term borrowings. Since the substantial majority of our total debt portfolio consists of fixed rate indebtedness, changes in interest rates do not have a material effect on our interest payments.
See “Other Items” for additional information related to the early debt redemption costs incurred in 2012.
Other, net
The change in Other, net financing activities during 2012 compared to 2011 was primarily driven by higher distributions to Vodafone, and higher early debt redemption costs (see “Other Items”).
Dividends
During the third quarter of 2012, the Board increased our quarterly dividend payment 3.0% to $.515 per share from $.50 per share in the same period of 2011. As in prior periods, dividend payments were a significant use of capital resources.
Special Distributions
In November 2012, the Board of Representatives of Verizon Wireless declared a distribution to its owners, which was paid in the fourth quarter of 2012 in proportion to their partnership interests on the payment date, in the aggregate amount of $8.5 billion. As a result, Vodafone received a cash payment of $3.8 billion and the remainder of the distribution was received by Verizon.
In July 2011, the Board of Representatives of Verizon Wireless declared a distribution to its owners, which was paid in the first quarter of 2012 in proportion to their partnership interests on the payment date, in the aggregate amount of $10 billion. As a result, Vodafone received a cash payment of $4.5 billion and the remainder of the distribution was received by Verizon.
Credit Facilities
On July 31, 2014, we amended our $6.2 billion credit facility to increase the availability to $8.0 billion and extend the maturity to July 31, 2018. At the same time, we terminated our $2.0 billion 364-day revolving credit agreement. As of December 31, 2014, the unused borrowing capacity under this credit facility was approximately $7.9 billion. The credit facility does not require us to comply with financial covenants or maintain specified credit ratings, and it permits us to borrow even if our business has incurred a material adverse change. We use the credit facility for the issuance of letters of credit and for general corporate purposes.
Common Stock
Common stock has been used from time to time to satisfy some of the funding requirements of employee and shareowner plans, including 18.2 million, 6.9 million and 24.6 million common shares issued from Treasury stock during 2014, 2013 and 2012, respectively, which had aggregate values of $0.7 billion, $0.3 billion and $1.0 billion, respectively.
As a result of the Wireless Transaction, in February 2014, Verizon issued approximately 1.27 billion shares.
On March 7, 2014, the Verizon Board of Directors approved a share buyback program, which authorizes the repurchase of up to 100 million shares of Verizon common stock terminating no later than the close of business on February 28, 2017. The program permits Verizon to repurchase shares over time, with the amount and timing of repurchases depending on market conditions and corporate needs. The Board also determined that no additional shares were to be purchased under the prior program. During 2013, we repurchased $0.2 billion of our common stock under our previous share buyback program. There were no repurchases of common stock during 2014 or 2012.
In addition to the previously authorized three-year share buyback program, in February 2015, the Verizon Board of Directors authorized Verizon to enter into an accelerated share repurchase (ASR) agreement to repurchase $5.0 billion of the Company’s common stock. The total number of shares that Verizon will repurchase under the ASR agreement will be based generally upon the volume-weighted average share price of Verizon’s common stock during the term of the transaction. On February 10, 2015, in exchange for an up-front payment totaling $5.0 billion, Verizon received an initial delivery of 86.2 million shares having a value of approximately $4.25 billion. Final settlement of the transaction under the ASR agreement, including delivery of the remaining shares, if any, that Verizon is entitled to receive, is scheduled to occur in the second quarter of 2015.
Credit Ratings
Verizon’s credit ratings did not change in 2014.
During the third quarter of 2013, Verizon’s credit ratings were downgraded by Moody’s Investors Service (Moody’s), Standard & Poor’s Ratings Services (Standard & Poor’s) and Fitch Ratings (Fitch) as a result of Verizon’s announcement of the agreement to acquire Vodafone’s 45% noncontrolling interest in Verizon Wireless for approximately $130 billion including the incurrence of third-party indebtedness to fund the cash portion of the purchase price for the Wireless Transaction. Moody’s downgraded Verizon’s long-term debt ratings one notch from A3 to Baa1, while Standard & Poor’s lowered its corporate credit rating and senior unsecured debt rating one notch from A- to BBB+ and Fitch lowered its long-term issuer default rating and senior unsecured debt rating one notch from A to A-.
Securities ratings assigned by rating organizations are expressions of opinion and are not recommendations to buy, sell or hold securities. A securities rating is subject to revision or withdrawal at any time by the assigning rating organization. Each rating should be evaluated independently of any other rating.
Covenants
Our credit agreements contain covenants that are typical for large, investment grade companies. These covenants include requirements to pay interest and principal in a timely fashion, pay taxes, maintain insurance with responsible and reputable insurance companies, preserve our corporate existence, keep appropriate books and records of financial transactions, maintain our properties, provide financial and other reports to our lenders, limit pledging and disposition of assets and mergers and consolidations, and other similar covenants. Additionally, our term loan credit agreements require us to maintain a leverage ratio (as such term is defined in those agreements) not in excess of 3.50:1.00 until our credit ratings are equal to or higher than A3 and A-. See Note 8 to the consolidated financial statements for additional details related to our term loan credit agreement.
We and our consolidated subsidiaries are in compliance with all debt covenants.
| Increase (Decrease) In Cash and Cash Equivalents |
Our Cash and cash equivalents at December 31, 2014 totaled $10.6 billion, a $42.9 billion decrease compared to Cash and cash equivalents at December 31, 2013 primarily as a result of the cash payment made to Vodafone as part of the completion of the Wireless Transaction. Our Cash and cash equivalents at December 31, 2013 totaled $53.5 billion, a $50.4 billion increase compared to Cash and cash equivalents at December 31, 2012 primarily as a result of the issuance of $49.0 billion aggregate principal amount of fixed and floating rate notes.
Free Cash Flow
Free cash flow is a non-GAAP financial measure that management believes is useful to investors and other users of Verizon’s financial information in evaluating cash available to pay debt and dividends. Free cash flow is calculated by subtracting capital expenditures from net cash provided by operating activities. The following table reconciles net cash provided by operating activities to Free cash flow:
| (dollars in millions) | ||||||||||||
| Years Ended December 31, | 2014 | 2013 | 2012 | |||||||||
| Net cash provided by operating activities |
$ | 30,631 | $ | 38,818 | $ | 31,486 | ||||||
| Less Capital expenditures (including capitalized software) |
17,191 | 16,604 | 16,175 | |||||||||
|
|
|
|||||||||||
| Free cash flow |
$ | 13,440 | $ | 22,214 | $ | 15,311 | ||||||
|
|
|
|||||||||||
The changes in free cash flow during 2014, 2013 and 2012 were a result of the factors described in connection with net cash provided by operating activities and capital expenditures. On February 21, 2014, we completed the Wireless Transaction which provides full access to the cash flows of Verizon Wireless. The completion of the Wireless Transaction resulted in an increase in income tax payments as well as an increase in interest payments, which reduced our net cash provided by operating activities (see “Cash Flows Provided by Operating Activities”).
| Employee Benefit Plan Funded Status and Contributions |
Pension Annuitization
On October 17, 2012, we, along with our subsidiary Verizon Investment Management Corp., and Fiduciary Counselors Inc., as independent fiduciary of the Verizon Management Pension Plan (the Plan), entered into a definitive purchase agreement with The Prudential Insurance Company of America (Prudential) and Prudential Financial, Inc., pursuant to which the Plan would purchase a single premium group annuity contract from Prudential.
On December 10, 2012, upon issuance of the group annuity contract by Prudential, Prudential irrevocably assumed the obligation to make future annuity payments to approximately 41,000 Verizon management retirees who began receiving pension payments from the Plan prior to January 1, 2010. The amount of each retiree’s annuity payment equals the amount of such individual’s pension benefit. In addition, the group annuity contract is intended to replicate the same rights to future payments, such as survivor benefits, that are currently offered by the Plan.
We contributed approximately $2.6 billion to the Plan between September 1, 2012 and December 31, 2012 in connection with the transaction so that the Plan’s funding percentage would not decrease as a result of the transaction.
Employer Contributions
We operate numerous qualified and nonqualified pension plans and other postretirement benefit plans. These plans primarily relate to our domestic business units. During 2014 and 2013, contributions to our qualified pension plans were $1.5 billion and not material, respectively. During 2012, we contributed $0.9 billion to our qualified pension plans, excluding the pension annuitization discussed above. We also contributed $0.1 billion, $0.1 billion and $0.2 billion to our nonqualified pension plans in 2014, 2013 and 2012, respectively.
In an effort to reduce the risk of our portfolio strategy and better align assets with liabilities, we have adopted a liability driven pension strategy that seeks to better match cash flows from investments with projected benefit payments. We expect that the strategy will reduce the likelihood that assets will decline at a time when liabilities increase (referred to as liability hedging), with the goal to reduce the risk of underfunding to the plan and its participants and beneficiaries, however, we also expect the strategy to result in lower asset returns. Based on this strategy and the funded status of the plans at December 31, 2014, we expect the minimum required qualified pension plan contribution in 2015 to be $0.7 billion. Nonqualified pension contributions are estimated to be approximately $0.1 billion in 2015.
Contributions to our other postretirement benefit plans generally relate to payments for benefits on an as-incurred basis since the other postretirement benefit plans do not have funding requirements similar to the pension plans. We contributed $0.7 billion, $1.4 billion and $1.5 billion to our other postretirement benefit plans in 2014, 2013 and 2012, respectively. Contributions to our other postretirement benefit plans are estimated to be approximately $0.8 billion in 2015.
| Leasing Arrangements |
See Note 7 to the consolidated financial statements for a discussion of leasing arrangements.
| Off Balance Sheet Arrangements and Contractual Obligations |
Contractual Obligations and Commercial Commitments
The following table provides a summary of our contractual obligations and commercial commitments at December 31, 2014. Additional detail about these items is included in the notes to the consolidated financial statements.
| (dollars in millions) | ||||||||||||||||||||
| Payments Due By Period | ||||||||||||||||||||
| Contractual Obligations | Total | Less than 1 year |
1-3 years | 3-5 years | More than 5 years |
|||||||||||||||
| Long-term debt(1) |
$ | 112,417 | $ | 2,239 | $ | 9,807 | $ | 12,524 | $ | 87,847 | ||||||||||
| Capital lease obligations(2) |
516 | 158 | 218 | 93 | 47 | |||||||||||||||
|
|
|
|||||||||||||||||||
| Total long-term debt, including current maturities |
112,933 | 2,397 | 10,025 | 12,617 | 87,894 | |||||||||||||||
| Interest on long-term debt(1) |
87,501 | 5,178 | 10,081 | 9,504 | 62,738 | |||||||||||||||
| Operating leases(2) |
14,403 | 2,499 | 4,205 | 3,029 | 4,670 | |||||||||||||||
| Purchase obligations(3) |
20,991 | 8,421 | 8,503 | 2,544 | 1,523 | |||||||||||||||
| Other long-term liabilities(4) |
2,084 | 1,425 | 659 | – | – | |||||||||||||||
|
|
|
|||||||||||||||||||
| Total contractual obligations |
$ | 237,912 | $ | 19,920 | $ | 33,473 | $ | 27,694 | $ | 156,825 | ||||||||||
|
|
|
|||||||||||||||||||
| (1) | Items included in long-term debt with variable coupon rates are described in Note 8 to the consolidated financial statements. |
| (2) | See Note 7 to the consolidated financial statements. |
| (3) | The purchase obligations reflected above are primarily commitments to purchase programming and network services, equipment, software, handsets and peripherals, and marketing activities, which will be used or sold in the ordinary course of business. These amounts do not represent our entire anticipated purchases in the future, but represent only those items that are the subject of contractual obligations. We also purchase products and services as needed with no firm commitment. For this reason, the amounts presented in this table alone do not provide a reliable indicator of our expected future cash outflows or changes in our expected cash position (see Note 17 to the consolidated financial statements). |
| (4) | Other long-term liabilities include estimated postretirement benefit and qualified pension plan contributions (see Note 12 to the consolidated financial statements). |
We are not able to make a reliable estimate of when the unrecognized tax benefits balance of $1.8 billion and related interest and penalties will be settled with the respective taxing authorities until issues or examinations are further developed (see Note 13 to the consolidated financial statements).
| Guarantees |
We guarantee the debentures and first mortgage bonds of our operating telephone company subsidiaries as well as the debt obligations of GTE Corporation that were issued and outstanding prior to July 1, 2003 (see Note 8 to the consolidated financial statements).
In connection with the execution of agreements for the sale of businesses and investments, Verizon ordinarily provides representations and warranties to the purchasers pertaining to a variety of nonfinancial matters, such as ownership of the securities being sold, as well as financial losses (see Note 17 to the consolidated financial statements).
As of December 31, 2014, letters of credit totaling approximately $0.1 billion, which were executed in the normal course of business and support several financing arrangements and payment obligations to third parties, were outstanding (see Note 17 to the consolidated financial statements).
| Market Risk |
We are exposed to various types of market risk in the normal course of business, including the impact of interest rate changes, foreign currency exchange rate fluctuations, changes in investment, equity and commodity prices and changes in corporate tax rates. We employ risk management strategies, which may include the use of a variety of derivatives including cross currency swaps, foreign currency and prepaid forwards and collars, interest rate swap agreements, commodity swap and forward agreements and interest rate locks. We do not hold derivatives for trading purposes.
It is our general policy to enter into interest rate, foreign currency and other derivative transactions only to the extent necessary to achieve our desired objectives in limiting our exposure to various market risks. Our objectives include maintaining a mix of fixed and variable rate debt to lower borrowing costs within reasonable risk parameters and to protect against earnings and cash flow volatility resulting from changes in market conditions. We do not hedge our market risk exposure in a manner that would completely eliminate the effect of changes in interest rates and foreign exchange rates on our earnings. At December 31, 2014, we posted collateral of approximately $0.6 billion related to derivative contracts under collateral exchange arrangements. While we may be exposed to credit losses due to the nonperformance of our counterparties, we consider the risk remote. As such, we do not expect that our results of operations or financial condition will be materially affected by these risk management strategies.
| Interest Rate Risk |
We are exposed to changes in interest rates, primarily on our short-term debt and the portion of long-term debt that carries floating interest rates. As of December 31, 2014, approximately 86% of the aggregate principal amount of our total debt portfolio consisted of fixed rate indebtedness, including the effect of interest rate swap agreements designated as hedges. The impact of a 100 basis point change in interest rates affecting our floating rate debt would result in a change in annual interest expense, including our interest rate swap agreements that are designated as hedges, of approximately $0.2 billion. The interest rates on substantially all of our existing long-term debt obligations are unaffected by changes to our credit ratings.
The table that follows summarizes the fair values of our long-term debt, including current maturities, and interest rate swap derivatives as of December 31, 2014 and 2013. The table also provides a sensitivity analysis of the estimated fair values of these financial instruments assuming 100-basis-point upward and downward shifts in the yield curve. Our sensitivity analysis does not include the fair values of our commercial paper and bank loans, if any, because they are not significantly affected by changes in market interest rates.
| (dollars in millions) | ||||||||||||
| Long-term debt and related derivatives | Fair Value | Fair Value assuming + 100 basis point shift |
Fair Value assuming - 100 basis point shift |
|||||||||
| At December 31, 2014 |
$ | 126,139 | $ | 115,695 | $ | 138,420 | ||||||
| At December 31, 2013 |
103,103 | 95,497 | 111,910 | |||||||||
Interest Rate Swaps
We enter into domestic interest rate swaps to achieve a targeted mix of fixed and variable rate debt. We principally receive fixed rates and pay variable rates based on LIBOR, resulting in a net increase or decrease to Interest expense. These swaps are designated as fair value hedges and hedge against changes in the fair value of our debt portfolio. We record the interest rate swaps at fair value on our consolidated balance sheets as assets and liabilities.
During the second quarter of 2013, interest rate swaps with a notional value of $1.25 billion matured and the impact to our consolidated financial statements was not material. During the third quarter of 2013, we entered into interest rate swaps with a total notional value of $1.8 billion. At December 31, 2014 and 2013, the fair value of these interest rate swaps was not material. At December 31, 2014, the total notional amount of these interest rate swaps was $1.8 billion. The ineffective portion of these interest rate swaps was not material at December 31, 2014 and 2013.
Forward Interest Rate Swaps
In order to manage our exposure to future interest rate changes, during the fourth quarter of 2013, we entered into forward interest rate swaps with a notional value of $2.0 billion. In March 2014, we settled these forward interest rate swaps and the pre-tax gain was not material. During 2014, we entered into forward interest rate swaps with a total notional value of $4.8 billion. We designated these contracts as cash flow hedges. During the fourth quarter of 2014, we settled $2.8 billion of forward interest rate swaps and the pre-tax loss was not material. The fair value of these contracts was $0.2 billion, which was included within Other liabilities on our consolidated balance sheet, at December 31, 2014 and was not material at December 31, 2013.
| Foreign Currency Translation |
The functional currency for our foreign operations is primarily the local currency. The translation of income statement and balance sheet amounts of our foreign operations into U.S. dollars is recorded as cumulative translation adjustments, which are included in Accumulated other comprehensive income in our consolidated balance sheets. Gains and losses on foreign currency transactions are recorded in the consolidated statements of income in Other income and (expense), net. At December 31, 2014, our primary translation exposure was to the British Pound Sterling and the Euro.
Cross Currency Swaps
Verizon Wireless previously entered into cross currency swaps designated as cash flow hedges to exchange approximately $1.6 billion of British Pound Sterling and Euro-denominated debt into U.S. dollars and to fix our future interest and principal payments in U.S. dollars, as well as to mitigate the impact of foreign currency transaction gains or losses. In June 2014, we settled $0.8 billion of these cross currency swaps and the gains with respect to these swaps were not material.
During the first quarter of 2014, we entered into cross currency swaps designated as cash flow hedges to exchange approximately $5.4 billion of Euro and British Pound Sterling denominated debt into U.S. dollars. During the second quarter of 2014, we entered into cross currency swaps designated as cash flow hedges to exchange approximately $1.2 billion of British Pound Sterling denominated debt into U.S. dollars. During the fourth quarter of 2014, we entered into cross currency swaps designated as cash flow hedges to exchange approximately $3.0 billion of Euro denominated debt into U.S. dollars and to fix our future interest and principal payments in U.S. dollars. Each of these cross currency swaps was entered into in order to mitigate the impact of foreign currency transaction gains or losses.
A portion of the gains and losses recognized in Other comprehensive income was reclassified to Other income and (expense), net to offset the related pre-tax foreign currency transaction gain or loss on the underlying debt obligations. The fair value of the outstanding swaps was $0.6 billion, which was primarily included within Other liabilities on our consolidated balance sheet, at December 31, 2014 and was not material at December 31, 2013. During 2014 and 2013, a pre-tax loss of $0.1 billion and an immaterial pre-tax gain, respectively, were recognized in Other comprehensive income with respect to these swaps.
| Critical Accounting Estimates and Recently Issued Accounting Standards |
| Critical Accounting Estimates |
A summary of the critical accounting estimates used in preparing our financial statements is as follows:
| • | Wireless licenses and Goodwill are a significant component of our consolidated assets. Both our wireless licenses and goodwill are treated as indefinite-lived intangible assets and, therefore are not amortized, but rather are tested for impairment annually in the fourth fiscal quarter, unless there are events or changes in circumstances during an interim period that indicate these assets may not be recoverable. We believe our estimates and assumptions are reasonable and represent appropriate marketplace considerations as of the valuation date. We do not believe that reasonably likely adverse changes in our assumptions and estimates would result in an impairment charge as of our latest impairment testing date. However, if there is a substantial and sustained adverse decline in our operating profitability, we may have impairment charges in future years. Any such impairment charge could be material to our results of operations and financial condition. |
Wireless Licenses
The carrying value of our wireless licenses was approximately $75.3 billion as of December 31, 2014. We aggregate our wireless licenses into one single unit of accounting, as we utilize our wireless licenses on an integrated basis as part of our nationwide wireless network. Our wireless licenses provide us with the exclusive right to utilize certain radio frequency spectrum to provide wireless communication services. There are currently no legal, regulatory, contractual, competitive, economic or other factors that limit the useful life of our wireless licenses. In 2014 and 2013, we performed a qualitative impairment assessment to determine whether it is more likely than not that the fair value of our wireless licenses was less than the carrying amount. As part of our assessment we considered several qualitative factors including the business enterprise value of Wireless, macroeconomic conditions (including changes in interest rates and discount rates), industry and market considerations (including industry revenue and EBITDA margin projections), the projected financial performance of Wireless, as well as other factors. Based on our assessment in 2014 and 2013, we qualitatively concluded that it was more likely than not that the fair value of our wireless licenses significantly exceeded their carrying value and therefore, did not result in an impairment.
In 2012, our quantitative impairment test consisted of comparing the estimated fair value of our wireless licenses to the aggregated carrying amount as of the test date. If the estimated fair value of our wireless licenses was less than the aggregated carrying amount of the wireless licenses then an impairment charge would have been recognized. Our annual quantitative impairment test for 2012 indicated that the fair value significantly exceeded the carrying value and, therefore, did not result in an impairment.
In 2012, using a quantitative assessment, we estimated the fair value of our wireless licenses using a direct income based valuation approach. This approach uses a discounted cash flow analysis to estimate what a marketplace participant would be willing to pay to purchase the aggregated wireless licenses as of the valuation date. As a result, we were required to make significant estimates about future cash flows specifically associated with our wireless licenses, an appropriate discount rate based on the risk associated with those estimated cash flows and assumed terminal value and growth rates. We considered current and expected future economic conditions, current and expected availability of wireless network technology and infrastructure and related equipment and the costs thereof as well as other relevant factors in estimating future cash flows. The discount rate represented our estimate of the weighted-average cost of capital (WACC), or expected return, that a marketplace participant would have required as of the valuation date. We developed the discount rate based on our consideration of the cost of debt and equity of a group of guideline companies as of the valuation date. Accordingly, our discount rate incorporated our estimate of the expected
return a marketplace participant would have required as of the valuation date, including the risk premium associated with the current and expected economic conditions as of the valuation date. The terminal value growth rate represented our estimate of the marketplace’s long-term growth rate.
Goodwill
At December 31, 2014, the balance of our goodwill was approximately $24.6 billion, of which $18.4 billion was in our Wireless segment and $6.2 billion was in our Wireline segment. Determining whether an impairment has occurred requires the determination of fair value of each respective reporting unit. Our operating segments, Wireless and Wireline, are deemed to be our reporting units for purposes of goodwill impairment testing. The fair value of Wireless significantly exceeded its carrying value and the fair value of Wireline exceeded its carrying value. Accordingly, our annual impairment tests for 2014, 2013 and 2012 did not result in an impairment.
The fair value of the reporting unit is calculated using a market approach and a discounted cash flow method. The market approach includes the use of comparative multiples to corroborate discounted cash flow results. The discounted cash flow method is based on the present value of two components—projected cash flows and a terminal value. The terminal value represents the expected normalized future cash flows of the reporting unit beyond the cash flows from the discrete projection period. The fair value of the reporting unit is calculated based on the sum of the present value of the cash flows from the discrete period and the present value of the terminal value. The estimated cash flows are discounted using a rate that represents our WACC.
| • | We maintain benefit plans for most of our employees, including, for certain employees, pension and other postretirement benefit plans. At December 31, 2014, in the aggregate, pension plan benefit obligations exceeded the fair value of pension plan assets, which will result in higher future pension plan expense. Other postretirement benefit plans have larger benefit obligations than plan assets, resulting in expense. Significant benefit plan assumptions, including the discount rate used, the long-term rate of return on plan assets and health care trend rates are periodically updated and impact the amount of benefit plan income, expense, assets and obligations. A sensitivity analysis of the impact of changes in these assumptions on the benefit obligations and expense (income) recorded, as well as on the funded status due to an increase or a decrease in the actual versus expected return on plan assets as of December 31, 2014 and for the year then ended pertaining to Verizon’s pension and postretirement benefit plans is provided in the table below. |
| (dollars in millions) | Percentage point change |
Increase (decrease) at December 31, 2014* |
||||||
| Pension plans discount rate |
+0.50 | $ | (1,375 | ) | ||||
| -0.50 | 1,526 | |||||||
| Rate of return on pension plan assets |
+1.00 | (163 | ) | |||||
| -1.00 | 163 | |||||||
| Postretirement plans discount rate |
+0.50 | (1,838 | ) | |||||
| -0.50 | 2,081 | |||||||
| Rate of return on postretirement plan assets |
+1.00 | (29 | ) | |||||
| -1.00 | 29 | |||||||
| Health care trend rates |
+1.00 | 3,760 | ||||||
| -1.00 | (3,023 | ) | ||||||
| * | In determining its pension and other postretirement obligation, the Company used a weighted-average discount rate of 4.2%. The rate was selected to approximate the composite interest rates available on a selection of high-quality bonds available in the market at December 31, 2014. The bonds selected had maturities that coincided with the time periods during which benefits payments are expected to occur, were non-callable and available in sufficient quantities to ensure marketability (at least $0.3 billion par outstanding). |
| • | Our current and deferred income taxes, and associated valuation allowances, are impacted by events and transactions arising in the normal course of business as well as in connection with the adoption of new accounting standards, changes in tax laws and rates, acquisitions and dispositions of businesses and non-recurring items. As a global commercial enterprise, our income tax rate and the classification of income taxes can be affected by many factors, including estimates of the timing and realization of deferred income tax assets and the timing and amount of income tax payments. We account for tax benefits taken or expected to be taken in our tax returns in accordance with the accounting standard relating to the uncertainty in income taxes, which requires the use of a two-step approach for recognizing and measuring tax benefits taken or expected to be taken in a tax return. We review and adjust our liability for unrecognized tax benefits based on our best judgment given the facts, circumstances, and information available at each reporting date. To the extent that the final outcome of these tax positions is different than the amounts recorded, such differences may impact income tax expense and actual tax payments. We recognize any interest and penalties accrued related to unrecognized tax benefits in income tax expense. Actual tax payments may materially differ from estimated liabilities as a result of changes in tax laws as well as unanticipated transactions impacting related income tax balances. |
| • | Our Plant, property and equipment balance represents a significant component of our consolidated assets. We record Plant, property and equipment at cost. We depreciate Plant, property and equipment on a straight-line basis over the estimated useful life of the assets. We expect that a one-year increase in estimated useful lives of our Plant, property and equipment would result in a decrease to our 2014 depreciation expense of $2.7 billion and that a one-year decrease would result in an increase of approximately $5.2 billion in our 2014 depreciation expense. |
| Recently Issued Accounting Standards |
See Note 1 to the consolidated financial statements for a discussion of recently issued accounting standard updates not yet adopted as of December 31, 2014.
| Acquisitions and Divestitures |
Wireless
Wireless Transaction
On February 21, 2014, we completed the Wireless Transaction for aggregate consideration of approximately $130 billion. The consideration paid was primarily comprised of cash of approximately $58.89 billion, Verizon common stock with a value of approximately $61.3 billion and other consideration.
Omnitel Transaction
On February 21, 2014, Verizon and Vodafone also consummated the sale of the Omnitel Interest (the Omnitel Transaction) by a subsidiary of Verizon to a subsidiary of Vodafone in connection with the Wireless Transaction pursuant to a separate share purchase agreement. As a result, during 2014, we recognized a pre-tax gain of $1.9 billion on the disposal of the Omnitel interest.
See Note 2 to the consolidated financial statements for additional information regarding the Wireless Transaction.
Spectrum License Transactions
On January 29, 2015, the FCC completed an auction of 65 MHz of spectrum, which it identified as the AWS-3 band. Verizon participated in that auction, and was the high bidder on 181 spectrum licenses, for which we will pay approximately $10.4 billion. During the fourth quarter of 2014, we made a deposit of $0.9 billion related to our participation in this auction. On February 13, 2015, we made a down payment of $1.2 billion for these spectrum licenses. Verizon has submitted an application for these licenses and must complete payment for them in the first quarter of 2015.
From time to time, we enter into agreements to buy, sell or exchange spectrum licenses. We believe these spectrum license transactions have allowed us to continue to enhance the reliability of our network while also resulting in a more efficient use of spectrum. See Note 2 to the consolidated financial statements for additional details regarding our spectrum license transactions.
Tower Monetization Transaction
On February 5, 2015, we announced an agreement with American Tower pursuant to which American Tower will have the exclusive right to lease, acquire or otherwise operate and manage many of our wireless towers for an upfront payment of $5.1 billion, which also includes payment for the sale of 165 towers. See Note 2 to the consolidated financial statements for additional information.
Wireline
During July 2014, Verizon sold a non-strategic Wireline business for cash consideration that was not significant. Additionally, during July 2012, we acquired HUGHES Telematics for approximately $12 per share in cash for a total acquisition price of $0.6 billion. The acquisition has accelerated our ability to bring more telematics offerings to market for existing and new customers. See Note 2 to the consolidated financial statements for additional information.
On February 5, 2015, we announced that we have entered into a definitive agreement with Frontier pursuant to which Verizon will sell its local exchange business and related landline activities in California, Florida, and Texas, including FiOS Internet and Video customers, switched and special access lines and high-speed Internet service and long distance voice accounts in these three states for approximately $10.5 billion. See Note 2 to the consolidated financial statements for additional information.
Other
During the fourth quarter of 2014, Redbox Instant by Verizon, a venture between Verizon and Redbox Automated Retail, LLC (Redbox), a wholly-owned subsidiary of Outerwall Inc., ceased providing service to its customers. In accordance with an agreement between the parties, Redbox withdrew from the venture on October 20, 2014 and Verizon wound down and dissolved the venture during the fourth quarter of 2014. As a result of the termination of the venture, we recorded a pre-tax loss of $0.1 billion in the fourth quarter of 2014.
During February 2014, Verizon acquired a business dedicated to the development of IP television for cash consideration that was not significant.
During the fourth quarter of 2013, Verizon acquired an industry leader in content delivery networks for $0.4 billion.
See Note 2 to the consolidated financial statements for additional information.
| Cautionary Statement Concerning Forward-Looking Statements |
In this report we have made forward-looking statements. These statements are based on our estimates and assumptions and are subject to risks and uncertainties. Forward-looking statements include the information concerning our possible or assumed future results of operations. Forward-looking statements also include those preceded or followed by the words “anticipates,” “believes,” “estimates,” “hopes” or similar expressions. For those statements, we claim the protection of the safe harbor for forward-looking statements contained in the Private Securities Litigation Reform Act of 1995.
The following important factors, along with those discussed elsewhere in this report and in other filings with the Securities and Exchange Commission (SEC), could affect future results and could cause those results to differ materially from those expressed in the forward-looking statements:
| • | adverse conditions in the U.S. and international economies; |
| • | the effects of competition in the markets in which we operate; |
| • | material changes in technology or technology substitution; |
| • | disruption of our key suppliers’ provisioning of products or services; |
| • | changes in the regulatory environment in which we operate, including any increase in restrictions on our ability to operate our networks; |
| • | breaches of network or information technology security, natural disasters, terrorist attacks or acts of war or significant litigation and any resulting financial impact not covered by insurance; |
| • | our high level of indebtedness; |
| • | an adverse change in the ratings afforded our debt securities by nationally accredited ratings organizations or adverse conditions in the credit markets affecting the cost, including interest rates, and/or availability of further financing; |
| • | material adverse changes in labor matters, including labor negotiations, and any resulting financial and/or operational impact; |
| • | significant increases in benefit plan costs or lower investment returns on plan assets; |
| • | changes in tax laws or treaties, or in their interpretation; |
| • | changes in accounting assumptions that regulatory agencies, including the SEC, may require or that result from changes in the accounting rules or their application, which could result in an impact on earnings; and |
| • | the inability to implement our business strategies. |
| Report of Management on Internal Control Over Financial Reporting |
We, the management of Verizon Communications Inc., are responsible for establishing and maintaining adequate internal control over financial reporting of the company. Management has evaluated internal control over financial reporting of the company using the criteria for effective internal control established in Internal Control–Integrated Framework issued by the Committee of Sponsoring Organizations of the Treadway Commission in 2013.
Management has assessed the effectiveness of the company’s internal control over financial reporting as of December 31, 2014. Based on this assessment, we believe that the internal control over financial reporting of the company is effective as of December 31, 2014. In connection with this assessment, there were no material weaknesses in the company’s internal control over financial reporting identified by management.
The company’s financial statements included in this Annual Report have been audited by Ernst & Young LLP, independent registered public accounting firm. Ernst & Young LLP has also provided an attestation report on the company’s internal control over financial reporting.
| /s/ Lowell C. McAdam |
| Lowell C. McAdam |
| Chairman and Chief Executive Officer |
| /s/ Francis J. Shammo |
| Francis J. Shammo |
| Executive Vice President and Chief Financial Officer |
| /s/ Anthony T. Skiadas |
| Anthony T. Skiadas |
| Senior Vice President and Controller |
| Report of Independent Registered Public Accounting Firm on Internal Control Over Financial Reporting |
To The Board of Directors and Shareowners of Verizon Communications Inc.:
We have audited Verizon Communications Inc. and subsidiaries’ (Verizon) internal control over financial reporting as of December 31, 2014, based on criteria established in Internal Control–Integrated Framework issued by the Committee of Sponsoring Organizations of the Treadway Commission (2013 framework) (the COSO criteria). Verizon’s management is responsible for maintaining effective internal control over financial reporting, and for its assessment of the effectiveness of internal control over financial reporting included in the accompanying Report of Management on Internal Control Over Financial Reporting. Our responsibility is to express an opinion on the company’s internal control over financial reporting based on our audit.
We conducted our audit in accordance with the standards of the Public Company Accounting Oversight Board (United States). Those standards require that we plan and perform the audit to obtain reasonable assurance about whether effective internal control over financial reporting was maintained in all material respects. Our audit included obtaining an understanding of internal control over financial reporting, assessing the risk that a material weakness exists, testing and evaluating the design and operating effectiveness of internal control based on the assessed risk, and performing such other procedures as we considered necessary in the circumstances. We believe that our audit provides a reasonable basis for our opinion.
A company’s internal control over financial reporting is a process designed to provide reasonable assurance regarding the reliability of financial reporting and the preparation of financial statements for external purposes in accordance with generally accepted accounting principles. A company’s internal control over financial reporting includes those policies and procedures that (1) pertain to the maintenance of records that, in reasonable detail, accurately and fairly reflect the transactions and dispositions of the assets of the company; (2) provide reasonable assurance that transactions are recorded as necessary to permit preparation of financial statements in accordance with generally accepted accounting principles, and that receipts and expenditures of the company are being made only in accordance with authorizations of management and directors of the company; and (3) provide reasonable assurance regarding prevention or timely detection of unauthorized acquisition, use, or disposition of the company’s assets that could have a material effect on the financial statements.
Because of its inherent limitations, internal control over financial reporting may not prevent or detect misstatements. Also, projections of any evaluation of effectiveness to future periods are subject to the risk that controls may become inadequate because of changes in conditions, or that the degree of compliance with the policies or procedures may deteriorate.
In our opinion, Verizon maintained, in all material respects, effective internal control over financial reporting as of December 31, 2014, based on the COSO criteria.
We also have audited, in accordance with the standards of the Public Company Accounting Oversight Board (United States), the consolidated balance sheets of Verizon as of December 31, 2014 and 2013, and the related consolidated statements of income, comprehensive income, cash flows and changes in equity for each of the three years in the period ended December 31, 2014 and our report dated February 23, 2015 expressed an unqualified opinion thereon.
| /s/ Ernst & Young LLP |
| Ernst & Young LLP |
| New York, New York |
| February 23, 2015 |
| Report of Independent Registered Public Accounting Firm |
To The Board of Directors and Shareowners of Verizon Communications Inc.:
We have audited the accompanying consolidated balance sheets of Verizon Communications Inc. and subsidiaries (Verizon) as of December 31, 2014 and 2013, and the related consolidated statements of income, comprehensive income, cash flows and changes in equity for each of the three years in the period ended December 31, 2014. These financial statements are the responsibility of Verizon’s management. Our responsibility is to express an opinion on these financial statements based on our audits.
We conducted our audits in accordance with the standards of the Public Company Accounting Oversight Board (United States). Those standards require that we plan and perform the audit to obtain reasonable assurance about whether the financial statements are free of material misstatement. An audit includes examining, on a test basis, evidence supporting the amounts and disclosures in the financial statements. An audit also includes assessing the accounting principles used and significant estimates made by management, as well as evaluating the overall financial statement presentation. We believe that our audits provide a reasonable basis for our opinion.
In our opinion, the financial statements referred to above present fairly, in all material respects, the consolidated financial position of Verizon at December 31, 2014 and 2013, and the consolidated results of its operations and its cash flows for each of the three years in the period ended December 31, 2014, in conformity with U.S. generally accepted accounting principles.
We also have audited, in accordance with the standards of the Public Company Accounting Oversight Board (United States), Verizon’s internal control over financial reporting as of December 31, 2014, based on criteria established in Internal Control–Integrated Framework issued by the Committee of Sponsoring Organizations of the Treadway Commission (2013 framework) and our report dated February 23, 2015 expressed an unqualified opinion thereon.
| /s/ Ernst & Young LLP |
| Ernst & Young LLP |
| New York, New York |
| February 23, 2015 |
| Consolidated Statements of Income Verizon Communications Inc. and Subsidiaries |
| (dollars in millions, except per share amounts) | ||||||||||||
| Years Ended December 31, | 2014 | 2013 | 2012 | |||||||||
| Operating Revenues |
$ | 127,079 | $ | 120,550 | $ | 115,846 | ||||||
| Operating Expenses |
||||||||||||
| Cost of services and sales (exclusive of items shown below) |
49,931 | 44,887 | 46,275 | |||||||||
| Selling, general and administrative expense |
41,016 | 27,089 | 39,951 | |||||||||
| Depreciation and amortization expense |
16,533 | 16,606 | 16,460 | |||||||||
|
|
|
|||||||||||
| Total Operating Expenses |
107,480 | 88,582 | 102,686 | |||||||||
| Operating Income |
19,599 | 31,968 | 13,160 | |||||||||
| Equity in earnings of unconsolidated businesses |
1,780 | 142 | 324 | |||||||||
| Other income and (expense), net |
(1,194) | (166) | (1,016) | |||||||||
| Interest expense |
(4,915) | (2,667) | (2,571) | |||||||||
|
|
|
|||||||||||
| Income Before (Provision) Benefit For Income Taxes |
15,270 | 29,277 | 9,897 | |||||||||
| (Provision) Benefit for income taxes |
(3,314) | (5,730) | 660 | |||||||||
|
|
|
|||||||||||
| Net Income |
$ | 11,956 | $ | 23,547 | $ | 10,557 | ||||||
|
|
|
|||||||||||
| Net income attributable to noncontrolling interests |
$ | 2,331 | $ | 12,050 | $ | 9,682 | ||||||
| Net income attributable to Verizon |
9,625 | 11,497 | 875 | |||||||||
|
|
|
|||||||||||
| Net Income |
$ | 11,956 | $ | 23,547 | $ | 10,557 | ||||||
|
|
|
|||||||||||
| Basic Earnings Per Common Share |
||||||||||||
| Net income attributable to Verizon |
$ | 2.42 | $ | 4.01 | $ | .31 | ||||||
| Weighted-average shares outstanding (in millions) |
3,974 | 2,866 | 2,853 | |||||||||
| Diluted Earnings Per Common Share |
||||||||||||
| Net income attributable to Verizon |
$ | 2.42 | $ | 4.00 | $ | .31 | ||||||
| Weighted-average shares outstanding (in millions) |
3,981 | 2,874 | 2,862 | |||||||||
See Notes to Consolidated Financial Statements
| Consolidated Statements of Comprehensive Income Verizon Communications Inc. and Subsidiaries |
| (dollars in millions) | ||||||||||||
| Years Ended December 31, | 2014 | 2013 | 2012 | |||||||||
| Net Income |
$ | 11,956 | $ | 23,547 | $ | 10,557 | ||||||
| Other Comprehensive Income, net of taxes |
||||||||||||
| Foreign currency translation adjustments |
(1,199 | ) | 60 | 69 | ||||||||
| Unrealized gain (loss) on cash flow hedges |
(197 | ) | 25 | (68 | ) | |||||||
| Unrealized gain (loss) on marketable securities |
(5 | ) | 16 | 29 | ||||||||
| Defined benefit pension and postretirement plans |
154 | 22 | 936 | |||||||||
|
|
|
|||||||||||
| Other comprehensive income (loss) attributable to Verizon |
(1,247 | ) | 123 | 966 | ||||||||
| Other comprehensive income (loss) attributable to noncontrolling interests |
(23 | ) | (15 | ) | 10 | |||||||
|
|
|
|||||||||||
| Total Comprehensive Income |
$ | 10,686 | $ | 23,655 | $ | 11,533 | ||||||
|
|
|
|||||||||||
| Comprehensive income attributable to noncontrolling interests |
2,308 | 12,035 | 9,692 | |||||||||
| Comprehensive income attributable to Verizon |
8,378 | 11,620 | 1,841 | |||||||||
|
|
|
|||||||||||
| Total Comprehensive Income |
$ | 10,686 | $ | 23,655 | $ | 11,533 | ||||||
|
|
|
|||||||||||
See Notes to Consolidated Financial Statements
| Consolidated Balance Sheets Verizon Communications Inc. and Subsidiaries |
| (dollars in millions, except per share amounts) | ||||||||
| At December 31, | 2014 | 2013 | ||||||
| Assets |
||||||||
| Current assets |
||||||||
| Cash and cash equivalents |
$ | 10,598 | $ | 53,528 | ||||
| Short-term investments |
555 | 601 | ||||||
| Accounts receivable, net of allowances of $739 and $645 |
13,993 | 12,439 | ||||||
| Inventories |
1,153 | 1,020 | ||||||
| Prepaid expenses and other |
3,324 | 3,406 | ||||||
|
|
|
|||||||
| Total current assets |
29,623 | 70,994 | ||||||
|
|
|
|||||||
| Plant, property and equipment |
230,508 | 220,865 | ||||||
| Less accumulated depreciation |
140,561 | 131,909 | ||||||
|
|
|
|||||||
| 89,947 | 88,956 | |||||||
|
|
|
|||||||
| Investments in unconsolidated businesses |
802 | 3,432 | ||||||
| Wireless licenses |
75,341 | 75,747 | ||||||
| Goodwill |
24,639 | 24,634 | ||||||
| Other intangible assets, net |
5,728 | 5,800 | ||||||
| Other assets |
6,628 | 4,535 | ||||||
|
|
|
|||||||
| Total assets |
$ | 232,708 | $ | 274,098 | ||||
|
|
|
|||||||
| Liabilities and Equity |
||||||||
| Current liabilities |
||||||||
| Debt maturing within one year |
$ | 2,735 | $ | 3,933 | ||||
| Accounts payable and accrued liabilities |
16,680 | 16,453 | ||||||
| Other |
8,649 | 6,664 | ||||||
|
|
|
|||||||
| Total current liabilities |
28,064 | 27,050 | ||||||
|
|
|
|||||||
| Long-term debt |
110,536 | 89,658 | ||||||
| Employee benefit obligations |
33,280 | 27,682 | ||||||
| Deferred income taxes |
41,578 | 28,639 | ||||||
| Other liabilities |
5,574 | 5,653 | ||||||
| Equity |
||||||||
| Series preferred stock ($.10 par value; none issued) |
– | – | ||||||
| Common stock ($.10 par value; 4,242,374,240 and 2,967,610,119 shares issued in each period, respectively) |
424 | 297 | ||||||
| Contributed capital |
11,155 | 37,939 | ||||||
| Reinvested earnings |
2,447 | 1,782 | ||||||
| Accumulated other comprehensive income |
1,111 | 2,358 | ||||||
| Common stock in treasury, at cost |
(3,263 | ) | (3,961) | |||||
| Deferred compensation – employee stock ownership plans and other |
424 | 421 | ||||||
| Noncontrolling interests |
1,378 | 56,580 | ||||||
|
|
|
|||||||
| Total equity |
13,676 | 95,416 | ||||||
|
|
|
|||||||
| Total liabilities and equity |
$ | 232,708 | $ | 274,098 | ||||
|
|
|
|||||||
See Notes to Consolidated Financial Statements
| Consolidated Statements of Cash Flows Verizon Communications Inc. and Subsidiaries |
| (dollars in millions) | ||||||||||||
| Years Ended December 31, | 2014 | 2013 | 2012 | |||||||||
| Cash Flows from Operating Activities |
||||||||||||
| Net Income |
$ | 11,956 | $ | 23,547 | $ | 10,557 | ||||||
| Adjustments to reconcile net income to net cash provided by operating activities: |
||||||||||||
| Depreciation and amortization expense |
16,533 | 16,606 | 16,460 | |||||||||
| Employee retirement benefits |
8,130 | (5,052 | ) | 8,198 | ||||||||
| Deferred income taxes |
(92 | ) | 5,785 | (952) | ||||||||
| Provision for uncollectible accounts |
1,095 | 993 | 972 | |||||||||
| Equity in earnings of unconsolidated businesses, net of dividends received |
(1,743 | ) | (102 | ) | 77 | |||||||
| Changes in current assets and liabilities, net of effects from acquisition/disposition of businesses |
||||||||||||
| Accounts receivable |
(2,745 | ) | (843 | ) | (1,717) | |||||||
| Inventories |
(132 | ) | 56 | (136) | ||||||||
| Other assets |
(695 | ) | (143 | ) | 306 | |||||||
| Accounts payable and accrued liabilities |
1,412 | 925 | 1,144 | |||||||||
| Other, net |
(3,088 | ) | (2,954 | ) | (3,423) | |||||||
|
|
|
|||||||||||
| Net cash provided by operating activities |
30,631 | 38,818 | 31,486 | |||||||||
|
|
|
|||||||||||
| Cash Flows from Investing Activities |
||||||||||||
| Capital expenditures (including capitalized software) |
(17,191 | ) | (16,604 | ) | (16,175) | |||||||
| Acquisitions of investments and businesses, net of cash acquired |
(182 | ) | (494 | ) | (913) | |||||||
| Acquisitions of wireless licenses |
(354 | ) | (580 | ) | (4,298) | |||||||
| Proceeds from dispositions of wireless licenses |
2,367 | 2,111 | 363 | |||||||||
| Proceeds from dispositions of businesses |
120 | – | – | |||||||||
| Other, net |
(616 | ) | 734 | 521 | ||||||||
|
|
|
|||||||||||
| Net cash used in investing activities |
(15,856 | ) | (14,833 | ) | (20,502) | |||||||
|
|
|
|||||||||||
| Cash Flows from Financing Activities |
||||||||||||
| Proceeds from long-term borrowings |
30,967 | 49,166 | 4,489 | |||||||||
| Repayments of long-term borrowings and capital lease obligations |
(17,669 | ) | (8,163 | ) | (6,403) | |||||||
| Decrease in short-term obligations, excluding current maturities |
(475 | ) | (142 | ) | (1,437) | |||||||
| Dividends paid |
(7,803 | ) | (5,936 | ) | (5,230) | |||||||
| Proceeds from sale of common stock |
34 | 85 | 315 | |||||||||
| Purchase of common stock for treasury |
– | (153 | ) | – | ||||||||
| Special distribution to noncontrolling interest |
– | (3,150 | ) | (8,325) | ||||||||
| Acquisition of noncontrolling interest |
(58,886 | ) | – | – | ||||||||
| Other, net |
(3,873 | ) | (5,257 | ) | (4,662) | |||||||
|
|
|
|||||||||||
| Net cash provided by (used in) financing activities |
(57,705 | ) | 26,450 | (21,253) | ||||||||
|
|
|
|||||||||||
| Increase (decrease) in cash and cash equivalents |
(42,930 | ) | 50,435 | (10,269) | ||||||||
| Cash and cash equivalents, beginning of period |
53,528 | 3,093 | 13,362 | |||||||||
|
|
|
|||||||||||
| Cash and cash equivalents, end of period |
$ | 10,598 | $ | 53,528 | $ | 3,093 | ||||||
|
|
|
|||||||||||
See Notes to Consolidated Financial Statements
| Consolidated Statements of Changes in Equity Verizon Communications Inc. and Subsidiaries |
| (dollars in millions, except per share amounts, and shares in thousands) | ||||||||||||||||||||||||
| Years Ended December 31, | 2014 | 2013 | 2012 | |||||||||||||||||||||
| Shares | Amount | Shares | Amount | Shares | Amount | |||||||||||||||||||
|
|
|
|||||||||||||||||||||||
| Common Stock |
||||||||||||||||||||||||
| Balance at beginning of year |
2,967,610 | $ | 297 | 2,967,610 | $ | 297 | 2,967,610 | $ | 297 | |||||||||||||||
| Common shares issued (Note 2) |
1,274,764 | 127 | – | – | – | – | ||||||||||||||||||
|
|
|
|||||||||||||||||||||||
| Balance at end of year |
4,242,374 | 424 | 2,967,610 | 297 | 2,967,610 | 297 | ||||||||||||||||||
|
|
|
|||||||||||||||||||||||
| Contributed Capital |
||||||||||||||||||||||||
| Balance at beginning of year |
37,939 | 37,990 | 37,919 | |||||||||||||||||||||
| Acquisition of noncontrolling interest (Note 2) |
(26,898 | ) | – | – | ||||||||||||||||||||
| Other |
114 | (51 | ) | 71 | ||||||||||||||||||||
|
|
|
|||||||||||||||||||||||
| Balance at end of year |
11,155 | 37,939 | 37,990 | |||||||||||||||||||||
|
|
|
|||||||||||||||||||||||
| Reinvested Earnings (Accumulated Deficit) |
||||||||||||||||||||||||
| Balance at beginning of year |
1,782 | (3,734 | ) | 1,179 | ||||||||||||||||||||
| Net income attributable to Verizon |
9,625 | 11,497 | 875 | |||||||||||||||||||||
| Dividends declared ($2.16, $2.09, $2.03) per share |
(8,960 | ) | (5,981 | ) | (5,788) | |||||||||||||||||||
|
|
|
|||||||||||||||||||||||
| Balance at end of year |
2,447 | 1,782 | (3,734) | |||||||||||||||||||||
|
|
|
|||||||||||||||||||||||
| Accumulated Other Comprehensive Income |
||||||||||||||||||||||||
| Balance at beginning of year attributable to Verizon |
2,358 | 2,235 | 1,269 | |||||||||||||||||||||
| Foreign currency translation adjustments |
(1,199 | ) | 60 | 69 | ||||||||||||||||||||
| Unrealized gains (losses) on cash flow hedges |
(197 | ) | 25 | (68) | ||||||||||||||||||||
| Unrealized gains (losses) on marketable securities |
(5 | ) | 16 | 29 | ||||||||||||||||||||
| Defined benefit pension and postretirement plans |
154 | 22 | 936 | |||||||||||||||||||||
|
|
|
|||||||||||||||||||||||
| Other comprehensive income (loss) |
(1,247 | ) | 123 | 966 | ||||||||||||||||||||
|
|
|
|||||||||||||||||||||||
| Balance at end of year attributable to Verizon |
1,111 | 2,358 | 2,235 | |||||||||||||||||||||
|
|
|
|||||||||||||||||||||||
| Treasury Stock |
||||||||||||||||||||||||
| Balance at beginning of year |
(105,610 | ) | (3,961 | ) | (109,041 | ) | (4,071 | ) | (133,594 | ) | (5,002) | |||||||||||||
| Shares purchased |
– | – | (3,500 | ) | (153 | ) | – | – | ||||||||||||||||
| Employee plans (Note 16) |
14,132 | 541 | 6,835 | 260 | 11,434 | 433 | ||||||||||||||||||
| Shareowner plans (Note 16) |
4,105 | 157 | 96 | 3 | 13,119 | 498 | ||||||||||||||||||
| Other |
(37 | ) | – | – | – | – | – | |||||||||||||||||
|
|
|
|||||||||||||||||||||||
| Balance at end of year |
(87,410 | ) | (3,263 | ) | (105,610 | ) | (3,961 | ) | (109,041 | ) | (4,071) | |||||||||||||
|
|
|
|||||||||||||||||||||||
| Deferred Compensation-ESOPs and Other |
||||||||||||||||||||||||
| Balance at beginning of year |
421 | 440 | 308 | |||||||||||||||||||||
| Restricted stock equity grant |
166 | 152 | 196 | |||||||||||||||||||||
| Amortization |
(163 | ) | (171 | ) | (64) | |||||||||||||||||||
|
|
|
|||||||||||||||||||||||
| Balance at end of year |
424 | 421 | 440 | |||||||||||||||||||||
|
|
|
|||||||||||||||||||||||
| Noncontrolling Interests |
||||||||||||||||||||||||
| Balance at beginning of year |
56,580 | 52,376 | 49,938 | |||||||||||||||||||||
| Acquisition of noncontrolling interest (Note 2) |
(55,960 | ) | – | – | ||||||||||||||||||||
| Net income attributable to noncontrolling interests |
2,331 | 12,050 | 9,682 | |||||||||||||||||||||
| Other comprehensive income (loss) |
(23 | ) | (15 | ) | 10 | |||||||||||||||||||
|
|
|
|||||||||||||||||||||||
| Total comprehensive income (loss) |
2,308 | 12,035 | 9,692 | |||||||||||||||||||||
|
|
|
|||||||||||||||||||||||
| Distributions and other |
(1,550 | ) | (7,831 | ) | (7,254) | |||||||||||||||||||
|
|
|
|||||||||||||||||||||||
| Balance at end of year |
1,378 | 56,580 | 52,376 | |||||||||||||||||||||
|
|
|
|||||||||||||||||||||||
| Total Equity |
$ | 13,676 | $ | 95,416 | $ | 85,533 | ||||||||||||||||||
|
|
|
|||||||||||||||||||||||
See Notes to Consolidated Financial Statements
| Notes to Consolidated Financial Statements Verizon Communications Inc. and Subsidiaries |
Note 1
| Description of Business and Summary of Significant Accounting Policies |
Description of Business
Verizon Communications Inc. (Verizon or the Company) is a holding company that, acting through its subsidiaries, is one of the world’s leading providers of communications, information and entertainment products and services to consumers, businesses and governmental agencies with a presence around the world. We have two reportable segments, Wireless and Wireline. For further information concerning our business segments, see Note 14.
The Wireless segment provides wireless communications products and services across one of the most extensive and reliable wireless networks in the United States (U.S.) and has the largest fourth-generation (4G) Long-Term Evolution (LTE) technology and third-generation (3G) networks of any U.S. wireless service provider.
The Wireline segment provides voice, data and video communications products and enhanced services, including broadband video and data, corporate networking solutions, data center and cloud services, security and managed network services and local and long distance voice services. We provide these products and services to consumers in the United States, as well as to carriers, businesses and government customers both in the United States and around the world.
Consolidation
The method of accounting applied to investments, whether consolidated, equity or cost, involves an evaluation of all significant terms of the investments that explicitly grant or suggest evidence of control or influence over the operations of the investee. The consolidated financial statements include our controlled subsidiaries. For controlled subsidiaries that are not wholly-owned, the noncontrolling interests are included in Net income and Total equity. Investments in businesses which we do not control, but have the ability to exercise significant influence over operating and financial policies, are accounted for using the equity method. Investments in which we do not have the ability to exercise significant influence over operating and financial policies are accounted for under the cost method. Equity and cost method investments are included in Investments in unconsolidated businesses in our consolidated balance sheets. Certain of our cost method investments are classified as available-for-sale securities and adjusted to fair value pursuant to the accounting standard related to debt and equity securities. All significant intercompany accounts and transactions have been eliminated.
Basis of Presentation
We have reclassified certain prior year amounts to conform to the current year presentation.
Use of Estimates
We prepare our financial statements using U.S. generally accepted accounting principles (GAAP), which require management to make estimates and assumptions that affect reported amounts and disclosures. Actual results could differ from those estimates.
Examples of significant estimates include: the allowance for doubtful accounts, the recoverability of plant, property and equipment, the recoverability of intangible assets and other long-lived assets, unbilled revenues, fair values of financial instruments, unrecognized tax benefits, valuation allowances on tax assets, accrued expenses, pension and postretirement benefit assumptions, contingencies and allocation of purchase prices in connection with business combinations.
Revenue Recognition
Multiple Deliverable Arrangements
In both our Wireless and Wireline segments, we offer products and services to our customers through bundled arrangements. These arrangements involve multiple deliverables which may include products, services, or a combination of products and services.
Wireless
Our Wireless segment earns revenue primarily by providing access to and usage of its network. In general, access revenue is billed one month in advance and recognized when earned. Usage revenue is generally billed in arrears and recognized when service is rendered. Equipment sales revenue associated with the sale of wireless handsets and accessories is generally recognized when the products are delivered to and accepted by the customer, as this is considered to be a separate earnings process from providing wireless services. For agreements involving the resale of third-party services in which we are considered the primary obligor in the arrangements, we record the revenue gross at the time of the sale. For equipment sales, we generally subsidize the cost of wireless devices for plans under our traditional subsidy model. The amount of this subsidy is generally contingent on the arrangement and terms selected by the customer. In multiple deliverable arrangements which involve the sale of equipment and a service contract, the equipment revenue is recognized up to the amount collected when the wireless device is sold.
In addition to the traditional subsidy model for equipment sales, we offer new and existing customers the option to participate in Verizon Edge, a program that provides eligible wireless customers with the ability to pay for handsets under an equipment installment plan. Under the Verizon Edge program, customers have the right to upgrade their handset after a minimum of 30 days, subject to certain conditions, including making a stated portion of the required device payments, trading in their handset in good working condition and signing a new contract with Verizon. Upon upgrade, the outstanding balance of the equipment installment plan is exchanged for the used handset. This trade-in right is accounted for as a guarantee obligation.
Verizon Edge is a multiple-element arrangement typically consisting of the trade-in right, handset and monthly wireless service. At the inception of the arrangement, the amount allocable to the delivered units of accounting is limited to the amount that is not contingent upon the delivery of the monthly wireless service (the noncontingent amount). The full amount of the trade-in right’s fair value (not an allocated value) will be recognized as the guarantee liability and the remaining allocable consideration will be allocated to the handset. The value of the guarantee liability effectively results in a reduction to revenue recognized for the sale of the handset. The guarantee liability is measured at fair value upon initial recognition based on assumptions lacking observable pricing inputs including the probability and timing of the customer upgrading to a new phone, the customer’s estimated remaining installment balance at the time of trade-in and the estimated fair value of the phone at the time of trade-in and therefore is classified within Level 3 of the fair value hierarchy. When the customer trades-in their used phone, the handset received is recorded to inventory and measured as the difference between the remaining equipment installment plan balance at the time of trade-in and the guarantee liability. As a result of changes in the Verizon Edge program during 2014, and corresponding changes in related assumptions, the guarantee liability associated with Verizon Edge agreements under the current program is not material. The guarantee liability may increase after initial recognition as a result of changes in facts or assumptions and we will account for any increase in the guarantee liability with a corresponding decrease to revenue. The subsequent derecognition of the guarantee liability occurs when the guarantor is released from risk, which will occur at the earlier of the time the trade-in right is exercised or expires.
Wireline
Our Wireline segment earns revenue based upon usage of its network and facilities and contract fees. In general, fixed monthly fees for voice, video, data and certain other services are billed one month in advance and recognized when earned. Revenue from services that are not fixed in amount and are based on usage is generally billed in arrears and recognized when service is rendered.
We sell each of the services offered in bundled arrangements (i.e., voice, video and data), as well as separately; therefore each product or service has a standalone selling price. For these arrangements, revenue is allocated to each deliverable using a relative selling price method. Under this method, arrangement consideration is allocated to each separate deliverable based on our standalone selling price for each product or service. These services include FiOS services, individually or in bundles, and High Speed Internet.
When we bundle equipment with maintenance and monitoring services, we recognize equipment revenue when the equipment is installed in accordance with contractual specifications and ready for the customer’s use. The maintenance and monitoring services are recognized monthly over the term of the contract as we provide the services.
Installation-related fees, along with the associated costs up to but not exceeding these fees, are deferred and amortized over the estimated customer relationship period.
For each of our segments, we report taxes imposed by governmental authorities on revenue-producing transactions between us and our customers on a net basis.
Maintenance and Repairs
We charge the cost of maintenance and repairs, including the cost of replacing minor items not constituting substantial betterments, principally to Cost of services and sales as these costs are incurred.
Advertising Costs
Costs for advertising products and services as well as other promotional and sponsorship costs are charged to Selling, general and administrative expense in the periods in which they are incurred (see Note 16).
Earnings Per Common Share
Basic earnings per common share are based on the weighted-average number of shares outstanding during the period. Where appropriate, diluted earnings per common share include the dilutive effect of shares issuable under our stock-based compensation plans.
There were a total of approximately 7 million, 8 million and 9 million outstanding dilutive securities, primarily consisting of restricted stock units, included in the computation of diluted earnings per common share for the years ended December 31, 2014, 2013 and 2012, respectively. Outstanding options to purchase shares that were not included in the computation of diluted earnings per common share, because to do so would have been anti-dilutive for the period, were not significant for the years ended December 31, 2014, 2013 and 2012, respectively.
On January 28, 2014, at a special meeting of our shareholders, we received shareholder approval to increase our authorized shares of common stock by 2 billion shares to an aggregate of 6.25 billion authorized shares of common stock. On February 4, 2014, this authorization became effective. On February 21, 2014, we issued approximately 1.27 billion shares of common stock upon completing the acquisition of Vodafone Group Plc’s indirect 45% interest in Cellco Partnership d/b/a Verizon Wireless. See Note 2 for additional information.
Cash and Cash Equivalents
We consider all highly liquid investments with a maturity of 90 days or less when purchased to be cash equivalents. Cash equivalents are stated at cost, which approximates quoted market value and include amounts held in money market funds.
Marketable Securities
We have investments in marketable securities, which are considered “available-for-sale” under the provisions of the accounting standard for certain debt and equity securities, and are included in the accompanying consolidated balance sheets in Short-term investments, Investments in unconsolidated businesses or Other assets. We continually evaluate our investments in marketable securities for impairment due to declines in market value considered to be other-than-temporary. That evaluation includes, in addition to persistent, declining stock prices, general economic and company-specific evaluations. In the event of a determination that a decline in market value is other-than-temporary, a charge to earnings is recorded for the loss, and a new cost basis in the investment is established.
Inventories
Inventory consists of wireless and wireline equipment held for sale, which is carried at the lower of cost (determined principally on either an average cost or first-in, first-out basis) or market.
Plant and Depreciation
We record plant, property and equipment at cost. Plant, property and equipment of wireline and wireless operations are generally depreciated on a straight-line basis.
Leasehold improvements are amortized over the shorter of the estimated life of the improvement or the remaining term of the related lease, calculated from the time the asset was placed in service.
When the depreciable assets of our wireline and wireless operations are retired or otherwise disposed of, the related cost and accumulated depreciation are deducted from the plant accounts, and any gains or losses on disposition are recognized in income.
We capitalize and depreciate network software purchased or developed along with related plant assets. We also capitalize interest associated with the acquisition or construction of network-related assets. Capitalized interest is reported as a reduction in interest expense and depreciated as part of the cost of the network-related assets.
In connection with our ongoing review of the estimated remaining average useful lives of plant, property and equipment at our wireline and wireless operations, we determined that changes were necessary to the remaining estimated useful lives of certain assets as a result of technology upgrades, enhancements, and planned retirements. These changes resulted in an increase in depreciation expense of $0.6 billion in 2014. While the timing and extent of current deployment plans are subject to ongoing analysis and modification, we believe the current estimates of useful lives are reasonable.
Computer Software Costs
We capitalize the cost of internal-use network and non-network software that has a useful life in excess of one year. Subsequent additions, modifications or upgrades to internal-use network and non-network software are capitalized only to the extent that they allow the software to perform a task it previously did not perform. Planning, software maintenance and training costs are expensed in the period in which they are incurred. Also, we capitalize interest associated with the development of internal-use network and non-network software. Capitalized non-network internal-use software costs are amortized using the straight-line method over a period of 3 to 7 years and are included in Other intangible assets, net in our consolidated balance sheets. For a discussion of our impairment policy for capitalized software costs, see “Goodwill and Other Intangible Assets” below. Also, see Note 3 for additional detail of internal-use non-network software reflected in our consolidated balance sheets.
Goodwill and Other Intangible Assets
Goodwill
Goodwill is the excess of the acquisition cost of businesses over the fair value of the identifiable net assets acquired. Impairment testing for goodwill is performed annually in the fourth fiscal quarter or more frequently if impairment indicators are present. The Company has the option to perform a qualitative assessment to determine if the fair value of the entity is less than its carrying value. However, the Company may elect to perform an
impairment test even if no indications of a potential impairment exist. The impairment test for goodwill uses a two-step approach, which is performed at the reporting unit level. We have determined that in our case, the reporting units are our operating segments since that is the lowest level at which discrete, reliable financial and cash flow information is available. Step one compares the fair value of the reporting unit (calculated using a market approach and/or a discounted cash flow method) to its carrying value. If the carrying value exceeds the fair value, there is a potential impairment and step two must be performed. Step two compares the carrying value of the reporting unit’s goodwill to its implied fair value (i.e., fair value of reporting unit less the fair value of the unit’s assets and liabilities, including identifiable intangible assets). If the implied fair value of goodwill is less than the carrying amount of goodwill, an impairment is recognized.
Intangible Assets Not Subject to Amortization
A significant portion of our intangible assets are wireless licenses that provide our wireless operations with the exclusive right to utilize designated radio frequency spectrum to provide wireless communication services. While licenses are issued for only a fixed time, generally ten years, such licenses are subject to renewal by the Federal Communications Commission (FCC). License renewals have occurred routinely and at nominal cost. Moreover, we have determined that there are currently no legal, regulatory, contractual, competitive, economic or other factors that limit the useful life of our wireless licenses. As a result, we treat the wireless licenses as an indefinite-lived intangible asset. We reevaluate the useful life determination for wireless licenses each year to determine whether events and circumstances continue to support an indefinite useful life.
We test our wireless licenses for potential impairment annually. In 2014 and 2013, we performed a qualitative assessment to determine whether it is more likely than not that the fair value of our wireless licenses was less than the carrying amount. As part of our assessment, we considered several qualitative factors including the business enterprise value of Wireless, macroeconomic conditions (including changes in interest rates and discount rates), industry and market considerations (including industry revenue and EBITDA (Earnings before interest, taxes, depreciation and amortization) margin projections), the projected financial performance of Wireless, as well as other factors. The most recent quantitative assessment of our wireless licenses occurred in 2012. Our quantitative assessment consisted of comparing the estimated fair value of our wireless licenses to the aggregated carrying amount as of the test date. Using the quantitative assessment, we evaluated our licenses on an aggregate basis using a direct value approach. The direct value approach estimates fair value using a discounted cash flow analysis to estimate what a marketplace participant would be willing to pay to purchase the aggregated wireless licenses as of the valuation date. If the fair value of the aggregated wireless licenses is less than the aggregated carrying amount of the licenses, an impairment is recognized.
Interest expense incurred while qualifying activities are performed to ready wireless licenses for their intended use is capitalized as part of wireless licenses. The capitalization period ends when the development is discontinued or substantially complete and the license is ready for its intended use.
Intangible Assets Subject to Amortization and Long-Lived Assets
Our intangible assets that do not have indefinite lives (primarily customer lists and non-network internal-use software) are amortized over their estimated useful lives. All of our intangible assets subject to amortization and long-lived assets are reviewed for impairment whenever events or changes in circumstances indicate that the carrying amount of the asset may not be recoverable. If any indications were present, we would test for recoverability by comparing the carrying amount of the asset group to the net undiscounted cash flows expected to be generated from the asset group. If those net undiscounted cash flows do not exceed the carrying amount, we would perform the next step, which is to determine the fair value of the asset and record an impairment, if any. We reevaluate the useful life determinations for these intangible assets each year to determine whether events and circumstances warrant a revision in their remaining useful lives.
For information related to the carrying amount of goodwill by segment, wireless licenses and other intangible assets, as well as the major components and average useful lives of our other acquired intangible assets, see Note 3.
Fair Value Measurements
Fair value of financial and non-financial assets and liabilities is defined as an exit price, representing the amount that would be received to sell an asset or paid to transfer a liability in an orderly transaction between market participants. The three-tier hierarchy for inputs used in measuring fair value, which prioritizes the inputs used in the methodologies of measuring fair value for assets and liabilities, is as follows:
Level 1—Quoted prices in active markets for identical assets or liabilities
Level 2—Observable inputs other than quoted prices in active markets for identical assets and liabilities
Level 3—No observable pricing inputs in the market
Financial assets and financial liabilities are classified in their entirety based on the lowest level of input that is significant to the fair value measurements. Our assessment of the significance of a particular input to the fair value measurements requires judgment, and may affect the valuation of the assets and liabilities being measured and their placement within the fair value hierarchy.
Income Taxes
Our effective tax rate is based on pre-tax income, statutory tax rates, tax laws and regulations and tax planning strategies available to us in the various jurisdictions in which we operate.
Deferred income taxes are provided for temporary differences in the bases between financial statement and income tax assets and liabilities. Deferred income taxes are recalculated annually at tax rates then in effect. We record valuation allowances to reduce our deferred tax assets to the amount that is more likely than not to be realized.
We use a two-step approach for recognizing and measuring tax benefits taken or expected to be taken in a tax return. The first step is recognition: we determine whether it is more likely than not that a tax position will be sustained upon examination, including resolution of any related appeals or litigation processes, based on the technical merits of the position. In evaluating whether a tax position has met the more-likely-than-not recognition threshold, we presume that the position will be examined by the appropriate taxing authority that has full knowledge of all relevant information. The second step is measurement: a tax position that meets the more-likely-than-not recognition threshold is measured to determine the amount of benefit to recognize in the financial statements. The tax position is measured at the largest amount of benefit that is greater than 50 percent likely of being realized upon ultimate settlement. Differences between tax positions taken in a tax return and amounts recognized in the financial statements will generally result in one or more of the following: an increase in a liability for income taxes payable, a reduction of an income tax refund receivable, a reduction in a deferred tax asset, or an increase in a deferred tax liability.
The accounting standard relating to income taxes generated by leveraged lease transactions requires that changes in the projected timing of income tax cash flows generated by a leveraged lease transaction be recognized as a gain or loss in the year in which the change occurs.
Significant management judgment is required in evaluating our tax positions and in determining our effective tax rate.
Stock-Based Compensation
We measure and recognize compensation expense for all stock-based compensation awards made to employees and directors based on estimated fair values. See Note 11 for further details.
Foreign Currency Translation
The functional currency of our foreign operations is generally the local currency. For these foreign entities, we translate income statement amounts at average exchange rates for the period, and we translate assets and liabilities at end-of-period exchange rates. We record these translation adjustments in Accumulated other comprehensive income, a separate component of Equity, in our consolidated balance sheets. We report exchange gains and losses on intercompany foreign currency transactions of a long-term nature in Accumulated other comprehensive income. Other exchange gains and losses are reported in income.
Employee Benefit Plans
Pension and postretirement health care and life insurance benefits earned during the year as well as interest on projected benefit obligations are accrued currently. Prior service costs and credits resulting from changes in plan benefits are generally amortized over the average remaining service period of the employees expected to receive benefits. Expected return on plan assets is determined by applying the return on assets assumption to the actual fair value of plan assets. Actuarial gains and losses are recognized in operating results in the year in which they occur. These gains and losses are measured annually as of December 31 or upon a remeasurement event. Verizon management employees no longer earn pension benefits or earn service towards the company retiree medical subsidy (see Note 12).
We recognize a pension or a postretirement plan’s funded status as either an asset or liability on the consolidated balance sheets. Also, we measure any unrecognized prior service costs and credits that arise during the period as a component of Accumulated other comprehensive income, net of applicable income tax.
Derivative Instruments
We have entered into derivative transactions primarily to manage our exposure to fluctuations in foreign currency exchange rates, interest rates, equity and commodity prices. We employ risk management strategies, which may include the use of a variety of derivatives including cross currency swaps, foreign currency and prepaid forwards and collars, interest rate and commodity swap agreements and interest rate locks. We do not hold derivatives for trading purposes.
We measure all derivatives, including derivatives embedded in other financial instruments, at fair value and recognize them as either assets or liabilities on our consolidated balance sheets. Our derivative instruments are valued primarily using models based on readily observable market parameters for all substantial terms of our derivative contracts and thus are classified as Level 2. Changes in the fair values of derivative instruments not qualifying as hedges or any ineffective portion of hedges are recognized in earnings in the current period. Changes in the fair values of derivative instruments used effectively as fair value hedges are recognized in earnings, along with changes in the fair value of the hedged item. Changes in the fair value of the effective portions of cash flow hedges are reported in Other comprehensive income (loss) and recognized in earnings when the hedged item is recognized in earnings.
Recently Adopted Accounting Standards
During the first quarter of 2014, we adopted the accounting standard update relating to the presentation of an unrecognized tax benefit when a net operating loss carryforward, a similar tax loss, or a tax credit carryforward exists. The standard update provides that a liability related to an
unrecognized tax benefit should be offset against same jurisdiction deferred tax assets for a net operating loss carryforward, a similar tax loss, or a tax credit carryforward if such settlement is required or expected in the event the uncertain tax position is disallowed. The adoption of this standard update did not have a significant impact on our consolidated financial statements.
Recently Issued Accounting Standards
In April 2014, the accounting standard update related to the reporting of discontinued operations and disclosures of disposals of components of an entity was issued. This standard update changes the criteria for reporting discontinued operations and enhances convergence of the reporting requirements for discontinued operations. As a result of this standard update, a disposal of a component of an entity or a group of components of an entity is required to be reported in discontinued operations if the disposal represents a strategic shift that has, or will have, a major effect on an entity’s operations and financial results. We will adopt this standard update during the first quarter of 2015. We are currently evaluating the impact that this standard update will have on our consolidated financial statements.
In May 2014, the accounting standard update related to the recognition of revenue from contracts with customers was issued. This standard update clarifies the principles for recognizing revenue and develops a common revenue standard for U.S. GAAP and International Financial Reporting Standards. The standard update intends to provide a more robust framework for addressing revenue issues; improve comparability of revenue recognition practices across entities, industries, jurisdictions, and capital markets; and provide more useful information to users of financial statements through improved disclosure requirements. Upon adoption of this standard update, we expect that the allocation and timing of revenue recognition will be impacted. We expect to adopt this standard update during the first quarter of 2017.
There are two adoption methods available for implementation of the standard update related to the recognition of revenue from contracts with customers. Under one method, the guidance is applied retrospectively to contracts for each reporting period presented, subject to allowable practical expedients. Under the other method, the guidance is applied to contracts not completed as of the date of initial application, recognizing the cumulative effect of the change as an adjustment to the beginning balance of retained earnings, and also requires additional disclosures comparing the results to the previous guidance. We are currently evaluating these adoption methods and the impact that this standard update will have on our consolidated financial statements.
In June 2014, the accounting standard update related to the accounting for share-based payments when the terms of an award provide that a performance target could be achieved after the requisite service period was issued. The standard update resolves the diverse accounting treatment for these share-based payments by requiring that a performance target that affects vesting and that could be achieved after the requisite service period be treated as a performance condition. The requisite service period ends when the employee can cease rendering service and still be eligible to vest in the award if the performance target is achieved. We will adopt this standard update during the first quarter of 2016. The adoption of this standard update is not expected to have a significant impact on our consolidated financial statements.
In January 2015, the accounting standard update related to the reporting of extraordinary and unusual items was issued. This standard update eliminates the concept of extraordinary items from U.S. GAAP as part of an initiative to reduce complexity in accounting standards while maintaining or improving the usefulness of the information provided to the users of the financial statements. The presentation and disclosure guidance for items that are unusual in nature or occur infrequently will be retained and expanded to include items that are both unusual in nature and infrequent in occurrence. This standard update is effective as of the first quarter of 2016; however, earlier adoption is permitted.
Note 2
| Acquisitions and Divestitures |
Wireless
Wireless Transaction
On September 2, 2013, Verizon entered into a stock purchase agreement (the Stock Purchase Agreement) with Vodafone Group Plc (Vodafone) and Vodafone 4 Limited (Seller), pursuant to which Verizon agreed to acquire Vodafone’s indirect 45% interest in Cellco Partnership d/b/a Verizon Wireless (the Partnership, and such interest, the Vodafone Interest) for aggregate consideration of approximately $130 billion.
On February 21, 2014, pursuant to the terms and subject to the conditions set forth in the Stock Purchase Agreement, Verizon acquired (the Wireless Transaction) from Seller all of the issued and outstanding capital stock (the Transferred Shares) of Vodafone Americas Finance 1 Inc., a subsidiary of Seller (VF1 Inc.), which indirectly through certain subsidiaries (together with VF1 Inc., the Purchased Entities) owned the Vodafone Interest. In consideration for the Transferred Shares, upon completion of the Wireless Transaction, Verizon (i) paid approximately $58.89 billion in cash, (ii) issued approximately 1.27 billion shares of Verizon’s common stock, par value $0.10 per share (the Stock Consideration), which was valued at approximately $61.3 billion at the closing of the Wireless Transaction, (iii) issued senior unsecured Verizon notes in an aggregate principal amount of $5.0 billion (the Verizon Notes), (iv) sold Verizon’s indirectly owned 23.1% interest in Vodafone Omnitel N.V. (Omnitel, and such interest, the Omnitel Interest), valued at $3.5 billion and (v) provided other consideration, which included the assumption of preferred stock valued at approximately $1.7 billion. The total cash paid to Vodafone and the other costs of the Wireless Transaction, including financing, legal and bank fees, were financed through the incurrence of third-party indebtedness. See Note 8 for additional information.
In accordance with the accounting standard on consolidation, a change in a parent’s ownership interest while the parent retains a controlling financial interest in its subsidiary is accounted for as an equity transaction and remeasurement of assets and liabilities of previously controlled and consolidated subsidiaries is not permitted. As a result, we accounted for the Wireless Transaction by adjusting the carrying amount of the noncontrolling interest to reflect the change in Verizon’s ownership interest in the Partnership. Any difference between the fair value of the consideration paid and the amount by which the noncontrolling interest is adjusted has been recognized in equity attributable to Verizon.
Omnitel Transaction
On February 21, 2014, Verizon and Vodafone also consummated the sale of the Omnitel Interest (the Omnitel Transaction) by a subsidiary of Verizon to a subsidiary of Vodafone in connection with the Wireless Transaction pursuant to a separate share purchase agreement. As a result, during 2014, we recognized a pre-tax gain of $1.9 billion on the disposal of the Omnitel interest in Equity in earnings of unconsolidated businesses on our consolidated statement of income.
Verizon Notes (Non-Cash Transaction)
The Verizon Notes were issued pursuant to Verizon’s existing indenture. The Verizon Notes were issued in two separate series, with $2.5 billion due February 21, 2022 (the eight-year Verizon Notes) and $2.5 billion due February 21, 2025 (the eleven-year Verizon Notes). The Verizon Notes bear interest at a floating rate, which will be reset quarterly, with interest payable quarterly in arrears, beginning May 21, 2014. The eight-year Verizon notes bear interest at a floating rate equal to three-month London Interbank Offered Rate (LIBOR), plus 1.222%, and the eleven-year Verizon notes bear interest at a floating rate equal to three-month LIBOR, plus 1.372%. The indenture that governs the Verizon Notes contains certain negative covenants, including a negative pledge covenant and a merger or similar transaction covenant, affirmative covenants and events of default that are customary for companies maintaining an investment grade credit rating. An event of default for either series of the Verizon Notes may result in acceleration of the entire principal amount of all debt securities of that series. Beginning two years after the closing of the Wireless Transaction, Verizon may redeem all or any portion of the outstanding Verizon Notes held by Vodafone or any of its affiliates for a redemption price of 100% of the principal amount plus accrued and unpaid interest. The Verizon Notes may only be transferred by Vodafone to third parties in specified amounts during specified periods, commencing January 1, 2017. Any Verizon Notes held by third parties will not be redeemable by Verizon prior to their maturity dates. Verizon has agreed to file a registration statement with respect to the Verizon Notes at least three months prior to the Verizon Notes becoming transferable.
Other Consideration (Non-Cash Transaction)
Included in the other consideration provided to Vodafone is the indirect assumption of long-term obligations with respect to 5.143% Class D and Class E cumulative preferred stock (Preferred Stock) issued by one of the Purchased Entities. Both the Class D shares (825,000 shares outstanding) and Class E shares (825,000 shares outstanding) are mandatorily redeemable in April 2020 at $1,000 per share plus any accrued and unpaid dividends. Dividends accrue at 5.143% per annum and will be treated as interest expense. Both the Class D and Class E shares have been classified as liability instruments and were recorded at fair value as determined at the closing of the Wireless Transaction.
Deferred Tax Liabilities
Certain deferred taxes directly attributable to the Wireless Transaction have been calculated based on an analysis of taxes attributable to the difference between the tax basis of the investment in the noncontrolling interest that is assumed compared to Verizon’s book basis. As a result, Verizon recorded a deferred tax liability of approximately $13.5 billion.
Spectrum License Transactions
Since 2012, we have entered into several strategic spectrum transactions including:
| • | During the third quarter of 2012, after receiving the required regulatory approvals, Verizon Wireless completed the following previously announced transactions in which we acquired wireless spectrum that will be used to deploy additional 4G LTE capacity: |
| ¡ | Verizon Wireless acquired Advanced Wireless Services (AWS) spectrum in separate transactions with SpectrumCo and Cox TMI Wireless, LLC for which it paid an aggregate of $3.9 billion. Verizon Wireless has also recorded a liability of $0.4 billion related to a three-year service obligation to SpectrumCo’s members pursuant to commercial agreements executed concurrently with the SpectrumCo transaction. |
| ¡ | Verizon Wireless completed license purchase and exchange transactions with Leap Wireless, Savary Island Wireless, which is majority owned by Leap Wireless, and a subsidiary of T-Mobile USA, Inc. (T-Mobile USA). As a result of these transactions, Verizon Wireless received an aggregate $2.6 billion of AWS and Personal Communication Services (PCS) licenses at fair value and net cash proceeds of $0.2 billion, transferred certain AWS licenses to T-Mobile USA and a 700 megahertz (MHz) lower A block license to Leap Wireless, and recorded an immaterial gain. |
| • | During the first quarter of 2013, we completed license exchange transactions with T-Mobile License LLC and Cricket License Company, LLC, a subsidiary of Leap Wireless, to exchange certain AWS licenses. These non-cash exchanges included a number of intra-market swaps that we expect will enable Verizon Wireless to make more efficient use of the AWS band. As a result of these exchanges, we received an aggregate $0.5 billion of AWS licenses at fair value and recorded an immaterial gain. |
| • | During the third quarter of 2013, after receiving the required regulatory approvals, Verizon Wireless sold 39 lower 700 MHz B block spectrum licenses to AT&T Inc. (AT&T) in exchange for a payment of $1.9 billion and the transfer by AT&T to Verizon Wireless of AWS (10 MHz) licenses in certain markets in the western United States. Verizon Wireless also sold certain lower 700 MHz B block spectrum licenses to an investment firm for a payment of $0.2 billion. As a result, we received $0.5 billion of AWS licenses at fair value and we recorded a pre-tax gain of approximately $0.3 billion in Selling, general and administrative expense on our consolidated statement of income for the year ended December 31, 2013. |
| • | During the second quarter of 2014, we completed license exchange transactions with T-Mobile USA to exchange certain AWS and PCS licenses. The exchange included a number of swaps that we expect will result in more efficient use of the AWS and PCS bands. As a result of these exchanges, we received $0.9 billion of AWS and PCS spectrum licenses at fair value and we recorded an immaterial gain. |
| • | During the second quarter of 2014, we completed transactions pursuant to two additional agreements with T-Mobile USA with respect to our remaining 700 MHz A block spectrum licenses. Under one agreement, we sold certain of these licenses to T-Mobile USA in exchange for cash consideration of approximately $2.4 billion, and under the second agreement we exchanged the remainder of our 700 MHz A block spectrum licenses as well as AWS and PCS spectrum licenses for AWS and PCS spectrum licenses. As a result, we received $1.6 billion of AWS and PCS spectrum licenses at fair value and we recorded a pre-tax gain of approximately $0.7 billion in Selling, general and administrative expense on our consolidated statement of income for the year ended December 31, 2014. |
| • | During the third quarter of 2014, we entered into a license exchange agreement with affiliates of AT&T Inc. to exchange certain AWS and PCS spectrum licenses. This non-cash exchange was completed in January 2015 at which time we recorded an immaterial gain. |
| • | On January 29, 2015, the FCC completed an auction of 65 MHz of spectrum, which it identified as the AWS-3 band. Verizon participated in that auction, and was the high bidder on 181 spectrum licenses, for which we will pay approximately $10.4 billion. During the fourth quarter of 2014, we made a deposit of $0.9 billion related to our participation in this auction. On February 13, 2015, we made a down payment of $1.2 billion for these spectrum licenses. Verizon has submitted an application for these licenses and must complete payment for them in the first quarter of 2015. |
Tower Monetization Transaction
On February 5, 2015, we announced an agreement with American Tower Corporation (American Tower) pursuant to which American Tower will have the exclusive rights to lease and operate over 11,300 of our wireless towers for an upfront payment of $5.0 billion. Under the terms of the leases, American Tower will have exclusive rights to lease and operate the towers over an average term of approximately 28 years. As part of this transaction, we will also sell 165 towers for $0.1 billion. We will sublease capacity on the towers from American Tower for a minimum of 10 years at current market rates, with options to renew. As the leases expire, American Tower will have fixed-price purchase options to acquire these towers based on their anticipated fair market values at the end of the lease terms. We plan to account for the upfront payment primarily as prepaid rent and a portion as a financing obligation. This transaction, which is subject to customary closing conditions, is expected to close during the first half of 2015.
Other
During 2014 and 2013, we acquired various other wireless licenses and markets for cash consideration that was not significant. Additionally, during 2013, we obtained control of previously unconsolidated wireless partnerships, which were previously accounted for under the equity method and are now consolidated, which resulted in an immaterial gain. In 2013, we recorded $0.2 billion of goodwill as a result of these transactions.
During 2012, we acquired various other wireless licenses and markets for cash consideration that was not significant and recorded $0.2 billion of goodwill as a result of these transactions.
Wireline
Access Line Sale
On February 5, 2015, we announced that we have entered into a definitive agreement with Frontier Communications Corporation (Frontier) pursuant to which Verizon will sell its local exchange business and related landline activities in California, Florida, and Texas, including FiOS Internet and Video customers, switched and special access lines and high-speed Internet service and long distance voice accounts in these three states for approximately $10.5 billion. The transaction, which includes the acquisition by Frontier of the equity interests of Verizon’s incumbent local exchange carriers (ILECs) in California, Florida and Texas, does not involve any assets or liabilities of Verizon Wireless. The assets and liabilities that will be sold are currently included in Verizon’s continuing operations. As part of the transaction, Frontier will assume $0.6 billion of indebtedness from Verizon. The transaction is subject to the satisfaction of certain closing conditions including, among others, receipt of state and federal telecommunications regulatory approvals, and we expect this transaction to close during the first half of 2016.
The transaction will result in Frontier acquiring approximately 1.5 million FiOS Internet subscribers, 1.2 million FiOS Video subscribers and the related ILEC businesses from Verizon. This business generated revenues of approximately $5.4 billion, excluding revenue with affiliates, for Verizon in 2013, which is the most recent year for which audited stand-alone financial statements are currently available.
HUGHES Telematics, Inc.
During July 2012, we acquired HUGHES Telematics, Inc. (HUGHES Telematics) for approximately $12 per share in cash for a total acquisition price of $0.6 billion. As a result of the transaction, HUGHES Telematics became a wholly-owned subsidiary of Verizon. The consolidated financial statements include the results of HUGHES Telematics’ operations from the date the acquisition closed. Upon closing, we recorded approximately $0.6 billion of goodwill, $0.1 billion of other intangibles, and assumed the debt obligations of HUGHES Telematics, which were approximately $0.1 billion as of the date of acquisition, and which were repaid by Verizon. Had this acquisition been completed on January 1, 2012, the results of the acquired operations of HUGHES Telematics would not have had a significant impact on the consolidated net income attributable to Verizon. The acquisition has accelerated our ability to bring more telematics offerings to market for existing and new customers.
The acquisition of HUGHES Telematics was accounted for as a business combination under the acquisition method. The cost of the acquisition was allocated to the assets and liabilities acquired based on their fair values as of the close of the acquisition, with the excess amount being recorded as goodwill.
Other
On July 1, 2014, we sold a non-strategic Wireline business, which provides communications solutions to a variety of government agencies for net cash proceeds of $0.1 billion and recorded an immaterial gain.
Other
On October 7, 2014, Redbox Instant by Verizon, a venture between Verizon and Redbox Automated Retail, LLC (Redbox), a wholly-owned subsidiary of Outerwall Inc., ceased providing service to its customers. In accordance with an agreement between the parties, Redbox withdrew from the venture on October 20, 2014 and Verizon wound down and dissolved the venture during the fourth quarter of 2014. As a result of the termination of the venture, we recorded a pre-tax loss of $0.1 billion in the fourth quarter of 2014.
During February 2014, Verizon acquired a business dedicated to the development of Internet Protocol (IP) television for cash consideration that was not significant.
During the fourth quarter of 2013, Verizon acquired an industry leader in content delivery networks for $0.4 billion. Upon closing, we recorded $0.3 billion of goodwill. Additionally, we acquired a technology company for cash consideration that was not significant. The consolidated financial statements include the results of the operations of each of these acquisitions from the date each acquisition closed.
Note 3
| Wireless Licenses, Goodwill and Other Intangible Assets |
Wireless Licenses
Changes in the carrying amount of Wireless licenses are as follows:
| (dollars in millions) | ||||
| Balance at January 1, 2013 |
$ | 77,744 | ||
| Acquisitions (Note 2) |
579 | |||
| Dispositions (Note 2) |
(2,361 | ) | ||
| Capitalized interest on wireless licenses |
566 | |||
| Reclassifications, adjustments and other |
(781 | ) | ||
|
|
|
|||
| Balance at December 31, 2013 |
$ | 75,747 | ||
| Acquisitions (Note 2) |
444 | |||
| Dispositions (Note 2) |
(1,978 | ) | ||
| Capitalized interest on wireless licenses |
167 | |||
| Reclassifications, adjustments and other |
961 | |||
|
|
|
|||
| Balance at December 31, 2014 |
$ | 75,341 | ||
|
|
|
|||
Reclassifications, adjustments and other includes the exchanges of wireless licenses in 2014 and 2013 as well as $0.3 and $0.9 billion of Wireless licenses that are classified as held for sale and included in Prepaid expenses and other on our consolidated balance sheets at December 31, 2014 and 2013, respectively. See Note 2 for additional details.
At December 31, 2014 and 2013, approximately $0.4 billion and $7.7 billion, respectively, of wireless licenses were under development for commercial service for which we were capitalizing interest costs. The decline is primarily due to the deployment of AWS licenses for commercial service during 2014.
The average remaining renewal period of our wireless license portfolio was 4.7 years as of December 31, 2014. See Note 1 for additional details.
Goodwill
Changes in the carrying amount of Goodwill are as follows:
| (dollars in millions) | ||||||||||||
| Wireless | Wireline | Total | ||||||||||
| Balance at January 1, 2013 |
$ | 18,172 | $ | 5,967 | $ | 24,139 | ||||||
| Acquisitions (Note 2) |
204 | 291 | 495 | |||||||||
|
|
|
|||||||||||
| Balance at December 31, 2013 |
$ | 18,376 | $ | 6,258 | $ | 24,634 | ||||||
| Acquisitions (Note 2) |
15 | 40 | 55 | |||||||||
| Dispositions (Note 2) |
– | (38 | ) | (38 | ) | |||||||
| Reclassifications, adjustments and other |
(1 | ) | (11 | ) | (12 | ) | ||||||
|
|
|
|||||||||||
| Balance at December 31, 2014 |
$ | 18,390 | $ | 6,249 | $ | 24,639 | ||||||
|
|
|
|||||||||||
The increase in Goodwill at Wireless at December 31, 2013 was primarily due to obtaining control of previously unconsolidated wireless partnerships, which were previously accounted for under the equity method and are now consolidated. This resulted in an immaterial gain recorded during the year ended December 31, 2013. The increase in Goodwill at Wireline at December 31, 2013 was primarily due to the acquisition of a provider of content delivery networks.
Other Intangible Assets
The following table displays the composition of Other intangible assets, net:
| (dollars in millions) | ||||||||||||||||||||||||
| 2014 | 2013 | |||||||||||||||||||||||
| At December 31, | Gross Amount |
Accumulated Amortization |
Net Amount |
Gross Amount |
Accumulated Amortization |
Net Amount |
||||||||||||||||||
| Customer lists (5 to 13 years) |
$ | 3,618 | $ | (2,924 | ) | $ | 694 | $ | 3,639 | $ | (2,660 | ) | $ | 979 | ||||||||||
| Non-network internal-use software (3 to 7 years) |
13,194 | (8,462 | ) | 4,732 | 11,770 | (7,317 | ) | 4,453 | ||||||||||||||||
| Other (2 to 25 years) |
670 | (368 | ) | 302 | 691 | (323 | ) | 368 | ||||||||||||||||
|
|
|
|||||||||||||||||||||||
| Total |
$ | 17,482 | $ | (11,754 | ) | $ | 5,728 | $ | 16,100 | $ | (10,300 | ) | $ | 5,800 | ||||||||||
|
|
|
|||||||||||||||||||||||
The amortization expense for Other intangible assets was as follows:
| Years | (dollars in millions) | |||
| 2014 |
$ | 1,567 | ||
| 2013 |
1,587 | |||
| 2012 |
1,540 | |||
Estimated annual amortization expense for Other intangible assets is as follows:
| Years | (dollars in millions) | |||
| 2015 |
$ | 1,428 | ||
| 2016 |
1,193 | |||
| 2017 |
1,008 | |||
| 2018 |
843 | |||
| 2019 |
613 | |||
Note 4
| Plant, Property and Equipment |
The following table displays the details of Plant, property and equipment, which is stated at cost:
| (dollars in millions) | ||||||||||
| At December 31, | Lives (years) | 2014 | 2013 | |||||||
| Land |
– | $ | 763 | $ | 819 | |||||
| Buildings and equipment |
15-45 | 25,209 | 23,857 | |||||||
| Central office and other network equipment |
3-15 | 129,619 | 121,594 | |||||||
| Cable, poles and conduit |
11-50 | 54,797 | 55,240 | |||||||
| Leasehold improvements |
5-20 | 6,374 | 5,877 | |||||||
| Work in progress |
– | 4,580 | 4,176 | |||||||
| Furniture, vehicles and other |
3-20 | 9,166 | 9,302 | |||||||
|
|
|
|||||||||
| 230,508 | 220,865 | |||||||||
| Less accumulated depreciation |
140,561 | 131,909 | ||||||||
|
|
|
|||||||||
| Total |
$ | 89,947 | $ | 88,956 | ||||||
|
|
|
|||||||||
Note 5
| Investments in Unconsolidated Businesses |
Our investments in unconsolidated businesses are comprised of the following:
| (dollars in millions) | ||||||||||||
| At December 31, | Ownership | 2014 | 2013 | |||||||||
| Equity Investees |
||||||||||||
| Vodafone Omnitel(1) |
– | $ | – | $ | 2,511 | |||||||
| Other |
Various | 677 | 818 | |||||||||
|
|
|
|||||||||||
| Total equity investees |
677 | 3,329 | ||||||||||
| Cost Investees |
Various | 125 | 103 | |||||||||
|
|
|
|||||||||||
| Total investments in unconsolidated businesses |
$ | 802 | $ | 3,432 | ||||||||
|
|
|
|||||||||||
| (1) | Prior to the completion of the Wireless Transaction on February 21, 2014, Verizon held a 23.1% ownership interest in Vodafone Omnitel. |
Dividends and repatriations of foreign earnings received from these investees were not significant in 2014 and 2013 and $0.4 billion in 2012. See Note 13 regarding undistributed earnings of our foreign subsidiaries.
Equity Method Investments
Vodafone Omnitel
Vodafone Omnitel N.V. (Vodafone Omnitel) is one of the largest wireless communications companies in Italy. As part of the consideration of the Wireless Transaction, a subsidiary of Verizon sold its entire ownership interest in Vodafone Omnitel to a subsidiary of Vodafone on February 21, 2014. See Note 2 for additional information. At December 31, 2013, our investment in Vodafone Omnitel included goodwill of $1.1 billion.
Other Equity Investees
The remaining investments include wireless partnerships in the U.S., limited partnership investments in entities that invest in affordable housing projects and other smaller domestic and international investments.
Summarized Financial Information
Summarized financial information for our equity investees is as follows:
Balance Sheet
| (dollars in millions | ) | |||
| At December 31, | 2013 | |||
| Current assets |
$ | 3,983 | ||
| Noncurrent assets |
7,748 | |||
|
|
|
|||
| Total assets |
$ | 11,731 | ||
|
|
|
|||
| Current liabilities |
$ | 4,692 | ||
| Noncurrent liabilities |
5 | |||
| Equity |
7,034 | |||
|
|
|
|||
| Total liabilities and equity |
$ | 11,731 | ||
|
|
|
|||
Income Statement
| (dollars in millions) | ||||||||
| Years Ended December 31, | 2013 | 2012 | ||||||
| Net revenue |
$ | 8,984 | $ | 10,825 | ||||
| Operating income |
1,632 | 2,823 | ||||||
| Net income |
925 | 1,679 | ||||||
The financial information for our equity method investees in 2014, including Vodafone Omnitel through the closing of the Wireless Transaction in February 2014, was not significant and therefore is not reflected in the tables above.
Note 6
| Noncontrolling Interests |
Noncontrolling interests in equity of subsidiaries were as follows:
| (dollars in millions) | ||||||||
| At December 31, | 2014 | 2013 | ||||||
| Verizon Wireless |
$ | – | $ | 55,465 | ||||
| Wireless partnerships and other |
1,378 | 1,115 | ||||||
|
|
|
|||||||
| $ | 1,378 | $ | 56,580 | |||||
|
|
|
|||||||
Wireless Joint Venture
Our Wireless segment is primarily comprised of Cellco Partnership doing business as Verizon Wireless (Verizon Wireless). Cellco Partnership was formed as a joint venture in April 2000 by the combination of the U.S. wireless operations and interests of Verizon and Vodafone. On February 21, 2014, Verizon completed the Wireless Transaction and acquired 100% ownership of Verizon Wireless. See Note 2 for additional information.
Special Distributions
In May 2013, the Board of Representatives of Verizon Wireless declared a distribution to its owners, which was paid in the second quarter of 2013 in proportion to their partnership interests on the payment date, in the aggregate amount of $7.0 billion. As a result, Vodafone received a cash payment of $3.15 billion and the remainder of the distribution was received by Verizon.
In November 2012, the Board of Representatives of Verizon Wireless declared a distribution to its owners, which was paid in the fourth quarter of 2012 in proportion to their partnership interests on the payment date, in the aggregate amount of $8.5 billion. As a result, Vodafone received a cash payment of $3.8 billion and the remainder of the distribution was received by Verizon.
In July 2011, the Board of Representatives of Verizon Wireless declared a distribution to its owners, which was paid in the first quarter of 2012 in proportion to their partnership interests on the payment date, in the aggregate amount of $10 billion. As a result, Vodafone received a cash payment of $4.5 billion and the remainder of the distribution was received by Verizon.
Note 7
| Leasing Arrangements |
As Lessor
We are the lessor in leveraged and direct financing lease agreements for commercial aircraft and power generating facilities, which comprise the majority of our leasing portfolio along with telecommunications equipment, commercial real estate property and other equipment. These leases have remaining terms of up to 36 years as of December 31, 2014. In addition, we lease space on certain of our cell towers to other wireless carriers. Minimum lease payments receivable represent unpaid rentals, less principal and interest on third-party nonrecourse debt relating to leveraged lease transactions. Since we have no general liability for this debt, which is secured by a senior security interest in the leased equipment and rentals, the related principal and interest have been offset against the minimum lease payments receivable in accordance with U.S. GAAP. All recourse debt is reflected in our consolidated balance sheets.
At each reporting period, we monitor the credit quality of the various lessees in our portfolios. Regarding the leveraged lease portfolio, external credit reports are used where available and where not available we use internally developed indicators. These indicators or internal credit risk grades factor historic loss experience, the value of the underlying collateral, delinquency trends, and industry and general economic conditions. The credit quality of our lessees varies from AAA to CCC+. For each reporting period, the leveraged leases within the portfolio are reviewed for indicators of impairment where it is probable the rent due according to the contractual terms of the lease will not be collected. All significant accounts, individually or in the aggregate, are current and none are classified as impaired.
Finance lease receivables, which are included in Prepaid expenses and other and Other assets in our consolidated balance sheets, are comprised of the following:
| (dollars in millions) | ||||||||||||||||||||||||
| At December 31, | 2014 | 2013 | ||||||||||||||||||||||
| Leveraged Leases |
Direct Finance Leases |
Total | Leveraged Leases |
Direct Finance Leases |
Total | |||||||||||||||||||
|
|
|
|||||||||||||||||||||||
| Minimum lease payments receivable |
$ | 1,095 | $ | 8 | $ | 1,103 | $ | 1,069 | $ | 16 | $ | 1,085 | ||||||||||||
| Estimated residual value |
600 | 2 | 602 | 780 | 5 | 785 | ||||||||||||||||||
| Unearned income |
(535 | ) | (2 | ) | (537 | ) | (589 | ) | (4 | ) | (593 | ) | ||||||||||||
|
|
|
|||||||||||||||||||||||
| Total |
$ | 1,160 | $ | 8 | $ | 1,168 | $ | 1,260 | $ | 17 | $ | 1,277 | ||||||||||||
|
|
|
|
|
|||||||||||||||||||||
| Allowance for doubtful accounts |
(78 | ) | (90 | ) | ||||||||||||||||||||
|
|
|
|
|
|||||||||||||||||||||
| Finance lease receivables, net |
$ | 1,090 | $ | 1,187 | ||||||||||||||||||||
|
|
|
|
|
|||||||||||||||||||||
| Prepaid expenses and other |
$ | 4 | $ | 5 | ||||||||||||||||||||
| Other assets |
1,086 | 1,182 | ||||||||||||||||||||||
|
|
|
|
|
|||||||||||||||||||||
| $ | 1,090 | $ | 1,187 | |||||||||||||||||||||
|
|
|
|
|
|||||||||||||||||||||
Accumulated deferred taxes arising from leveraged leases, which are included in Deferred income taxes, amounted to $0.9 billion at December 31, 2014 and $1.0 billion at December 31, 2013.
The future minimum lease payments to be received from noncancelable capital leases (direct financing and leveraged leases), net of nonrecourse loan payments related to leveraged leases and allowances for doubtful accounts, along with expected receipts relating to operating leases for the periods shown at December 31, 2014, are as follows:
| (dollars in millions) | ||||||||
| Years | Capital Leases | Operating Leases | ||||||
| 2015 |
$ | 46 | $ | 196 | ||||
| 2016 |
115 | 168 | ||||||
| 2017 |
39 | 76 | ||||||
| 2018 |
57 | 51 | ||||||
| 2019 |
44 | 19 | ||||||
| Thereafter |
802 | 20 | ||||||
|
|
|
|||||||
| Total |
$ | 1,103 | $ | 530 | ||||
|
|
|
|||||||
As Lessee
We lease certain facilities and equipment for use in our operations under both capital and operating leases. Total rent expense under operating leases amounted to $2.7 billion in 2014, $2.6 billion in 2013 and $2.5 billion in 2012, respectively.
On February 5, 2015, we announced an agreement with American Tower pursuant to which American Tower will have the exclusive rights to lease and operate over 11,300 of our wireless towers for an upfront payment of $5.0 billion. We will sublease capacity on the towers from American Tower for a minimum of 10 years at current market rates, with options to renew. Under this agreement, we expect to make minimum future lease payments of approximately $2.8 billion. See Note 2 for additional information.
Amortization of capital leases is included in Depreciation and amortization expense in the consolidated statements of income. Capital lease amounts included in Plant, property and equipment are as follows:
| (dollars in millions) | ||||||||
| At December 31, | 2014 | 2013 | ||||||
| Capital leases |
$ | 319 | $ | 353 | ||||
| Less accumulated amortization |
171 | 188 | ||||||
|
|
|
|||||||
| Total |
$ | 148 | $ | 165 | ||||
|
|
|
|||||||
The aggregate minimum rental commitments under noncancelable leases for the periods shown at December 31, 2014, are as follows:
| (dollars in millions) | ||||||||
| Years | Capital Leases | Operating Leases | ||||||
| 2015 |
$ | 181 | $ | 2,499 | ||||
| 2016 |
137 | 2,245 | ||||||
| 2017 |
113 | 1,960 | ||||||
| 2018 |
68 | 1,660 | ||||||
| 2019 |
39 | 1,369 | ||||||
| Thereafter |
60 | 4,670 | ||||||
|
|
|
|||||||
| Total minimum rental commitments |
598 | $ | 14,403 | |||||
|
|
|
|||||||
| Less interest and executory costs |
82 | |||||||
|
|
|
|||||||
| Present value of minimum lease payments |
516 | |||||||
| Less current installments |
158 | |||||||
|
|
|
|||||||
| Long-term obligation at December 31, 2014 | $ | 358 | ||||||
|
|
|
|||||||
Note 8
| Debt |
Changes to debt during 2014 are as follows:
| (dollars in millions) | ||||||||||||
| Debt Maturing within One Year |
Long-term Debt |
Total | ||||||||||
| Balance at January 1, 2014 |
$ | 3,933 | $ | 89,658 | $ | 93,591 | ||||||
| Proceeds from long-term borrowings |
– | 30,967 | 30,967 | |||||||||
| Verizon Notes |
– | 5,000 | 5,000 | |||||||||
| Preferred Stock (Mandatorily Redeemable) |
– | 1,650 | 1,650 | |||||||||
| Repayments of long-term borrowings and capital leases obligations |
(4,022 | ) | (13,647 | ) | (17,669 | ) | ||||||
| Decrease in short-term obligations, excluding current maturities |
(475 | ) | – | (475 | ) | |||||||
| Reclassifications of long-term debt |
2,739 | (2,739 | ) | – | ||||||||
| Other |
560 | (353 | ) | 207 | ||||||||
|
|
|
|||||||||||
| Balance at December 31, 2014 |
$ | 2,735 | $ | 110,536 | $ | 113,271 | ||||||
|
|
|
|||||||||||
Debt maturing within one year is as follows:
| (dollars in millions) | ||||||||
| At December 31, | 2014 | 2013 | ||||||
| Long-term debt maturing within one year |
$ | 2,397 | $ | 3,486 | ||||
| Short-term notes payable |
319 | – | ||||||
| Commercial paper and other |
19 | 447 | ||||||
|
|
|
|||||||
| Total debt maturing within one year |
$ | 2,735 | $ | 3,933 | ||||
|
|
|
|||||||
The weighted-average interest rate for our commercial paper outstanding was 0.4% and 0.2% at December 31, 2014 and 2013, respectively.
Credit Facilities
On July 31, 2014, we amended our $6.2 billion credit facility to increase the availability to $8.0 billion and extend the maturity to July 31, 2018. At the same time, we terminated our $2.0 billion 364-day revolving credit agreement. As of December 31, 2014, the unused borrowing capacity under this credit facility was approximately $7.9 billion. The credit facility does not require us to comply with financial covenants or maintain specified credit ratings, and it permits us to borrow even if our business has incurred a material adverse change. We use the credit facility for the issuance of letters of credit and for general corporate purposes.
Long-Term Debt
Outstanding long-term debt obligations are as follows:
| (dollars in millions) | ||||||||||||||
| At December 31, | Interest Rates % | Maturities | 2014 | 2013 | ||||||||||
| Verizon Communications–notes payable and other |
0.30 – 3.85 | 2015 – 2042 | $ | 27,617 | $ | 20,416 | ||||||||
| 4.15 – 5.50 | 2018 – 2054 | 40,701 | 20,226 | |||||||||||
| 5.85 – 6.90 | 2018 – 2054 | 24,341 | 31,965 | |||||||||||
| 7.35 – 8.95 | 2018 – 2039 | 2,264 | 5,023 | |||||||||||
| Floating | 2015 – 2025 | 14,600 | 5,500 | |||||||||||
| Verizon Wireless–notes payable and other |
8.75 – 8.88 | 2015 – 2018 | 676 | 3,931 | ||||||||||
| Verizon Wireless–Alltel assumed notes |
6.80 – 7.88 | 2029 – 2032 | 686 | 1,300 | ||||||||||
| Telephone subsidiaries—debentures |
5.13 – 6.86 | 2027 – 2033 | 1,075 | 1,075 | ||||||||||
| 7.38 – 7.88 | 2022 – 2032 | 1,099 | 1,099 | |||||||||||
| 8.00 – 8.75 | 2019 – 2031 | 880 | 880 | |||||||||||
| Other subsidiaries—debentures and other |
6.84 – 8.75 | 2018 – 2028 | 1,432 | 1,700 | ||||||||||
| Capital lease obligations (average rate of 4.0% and 8.1% in 2014 and 2013, respectively) |
516 | 293 | ||||||||||||
| Unamortized discount, net of premium |
(2,954 | ) | (264) | |||||||||||
|
|
|
|||||||||||||
| Total long-term debt, including current maturities |
112,933 | 93,144 | ||||||||||||
| Less long-term debt maturing within one year |
2,397 | 3,486 | ||||||||||||
|
|
|
|||||||||||||
| Total long-term debt |
$ | 110,536 | $ | 89,658 | ||||||||||
|
|
|
|||||||||||||
2014
During February 2014, we issued €1.75 billion aggregate principal amount of 2.375% Notes due 2022, €1.25 billion aggregate principal amount of 3.25% Notes due 2026 and £0.85 billion aggregate principal amount of 4.75% Notes due 2034. The issuance of these Notes resulted in cash proceeds of approximately $5.4 billion, net of discounts and issuance costs. The net proceeds were used, in part, to finance the Wireless Transaction. Net proceeds not used to finance the Wireless Transaction were used for general corporate purposes. Also, during February 2014, we issued $0.5 billion aggregate principal amount of 5.90% Notes due 2054 resulting in cash proceeds of approximately $0.5 billion, net of discounts and issuance costs. The net proceeds were used for general corporate purposes.
During March 2014, we issued $4.5 billion aggregate principal amount of fixed and floating rate notes resulting in cash proceeds of approximately $4.5 billion, net of discounts and issuance costs. The issuances consisted of the following: $0.5 billion aggregate principal amount Floating Rate Notes due 2019 that bear interest at a rate equal to three-month LIBOR plus 0.77% which rate will be reset quarterly, $0.5 billion aggregate principal amount of 2.55% Notes due 2019, $1.0 billion aggregate principal amount of 3.45% Notes due 2021, $1.25 billion aggregate principal amount of 4.15% Notes due 2024 and $1.25 billion aggregate principal amount of 5.05% Notes due 2034. During March 2014, the net proceeds were used to purchase notes in the Tender Offer described below.
Also, during March 2014, $1.0 billion of LIBOR plus 0.61% Verizon Communications Notes and $1.5 billion of 1.95% Verizon Communications Notes matured and were repaid.
During September 2014, we issued $0.9 billion aggregate principal amount of 4.8% Notes due 2044. The issuance of these Notes resulted in cash proceeds of approximately $0.9 billion, net of discounts and issuance costs. The net proceeds were used for general corporate purposes. Also, during September 2014, we redeemed $0.8 billion aggregate principal amount of Verizon 1.25% Notes due November 2014 and recorded an immaterial amount of early debt redemption costs.
During October 2014, we issued $6.5 billion aggregate principal amount of fixed rate notes. The issuance of these notes resulted in cash proceeds of approximately $6.4 billion, net of discounts and issuance costs and after reimbursement of certain expenses. The issuance consisted of the following: $1.5 billion aggregate principal amount of 3.00% Notes due 2021, $2.5 billion aggregate principal amount of 3.50% Notes due 2024, and $2.5 billion aggregate principal amount of 4.40% Notes due 2034. The net proceeds from the issuance was used to redeem (i) in whole the following series of outstanding notes which were called for early redemption in November 2014 (collectively, November Early Debt Redemption): $0.5 billion aggregate principal amount of Verizon Communications 4.90% Notes due 2015 at 103.7% of the principal amount of such notes, $0.6 billion aggregate principal amount of Verizon Communications 5.55% Notes due 2016 at 106.3% of the principal amount of such notes, $1.3 billion
aggregate principal amount of Verizon Communications 3.00% Notes due 2016 at 103.4% of the principal amount of such notes, $0.4 billion aggregate principal amount of Verizon Communications 5.50% Notes due 2017 at 110.5% of the principal amount of such notes, $0.7 billion aggregate principal amount of Verizon Communications 8.75% Notes due 2018 at 125.2% of the principal amount of such notes, $0.1 billion aggregate principal amount of Alltel Corporation 7.00% Debentures due 2016 at 108.7% of the principal amount of such notes and $0.4 billion aggregate principal amount of Cellco Partnership and Verizon Wireless Capital LLC 8.50% Notes due 2018 at 124.5% of the principal amount of such notes; and (ii) $1.0 billion aggregate principal amount of Verizon Communications 2.50% Notes due 2016 at 103.0% of the principal amount of such notes. Proceeds not used for the redemption of these notes will be used for general corporate purposes. Any accrued and unpaid interest was paid to the date of redemption (see “Early Debt Redemption and Other Costs”).
During December 2014, we issued €1.4 billion aggregate principal amount of 1.625% Notes due 2024 and €1.0 billion aggregate principal amount of 2.625% Notes due 2031. The issuance of these Notes resulted in cash proceeds of approximately $3.0 billion, net of discounts and issuance costs and after reimbursement of certain expenses. The net proceeds were used for general corporate purposes.
Verizon Notes (Non-Cash Transaction)
During February 2014, in connection with the Wireless Transaction, we issued $5.0 billion aggregate principal amount of floating rate notes. The Verizon Notes were issued in two separate series, with $2.5 billion due February 21, 2022 and $2.5 billion due February 21, 2025. The Verizon Notes bear interest at a floating rate, which will be reset quarterly, with interest payable quarterly in arrears, beginning May 21, 2014 (see Note 2). The eight-year Verizon notes bear interest at a floating rate equal to three-month LIBOR, plus 1.222%, and the eleven-year Verizon notes bear interest at a floating rate equal to three-month LIBOR, plus 1.372%.
Preferred Stock (Non-Cash Transaction)
As a result of the Wireless Transaction, we assumed long-term obligations with respect to 5.143% Class D and Class E cumulative Preferred Stock issued by one of the Purchased Entities. Both the Class D shares (825,000 shares outstanding) and Class E shares (825,000 shares outstanding) are mandatorily redeemable in April 2020 at $1,000 per share plus any accrued and unpaid dividends. Dividends accrue at 5.143% per annum and will be treated as interest expense. Both the Class D and Class E shares have been classified as liability instruments and were recorded at fair value as determined at the closing of the Wireless Transaction.
Term Loan Agreements
During February 2014, we drew $6.6 billion pursuant to a term loan agreement, which was entered into during October 2013, with a group of major financial institutions to finance, in part, the Wireless Transaction. $3.3 billion of the loans under the term loan agreement had a maturity of three years (the 3-Year Loans) and $3.3 billion of the loans under the term loan agreement had a maturity of five years (the 5-Year Loans). The 5-Year Loans provide for the partial amortization of principal during the last two years that they are outstanding. Loans under the term loan agreement bear interest at floating rates. The term loan agreement contains certain negative covenants, including a negative pledge covenant, a merger or similar transaction covenant and an accounting changes covenant, affirmative covenants and events of default that are customary for companies maintaining an investment grade credit rating. In addition, the term loan agreement requires us to maintain a leverage ratio (as defined in the term loan agreement) not in excess of 3.50:1.00, until our credit ratings are equal to or higher than A3 and A- at Moody’s Investors Service and Standard & Poor’s Ratings Services, respectively.
During June 2014, we issued $3.3 billion aggregate principal amount of fixed and floating rate notes resulting in cash proceeds of approximately $3.3 billion, net of discounts and issuance costs. The issuances consisted of the following: $1.3 billion aggregate principal amount of Floating Rate Notes due 2017 that will bear interest at a rate equal to three-month LIBOR plus 0.40% which will be reset quarterly and $2.0 billion aggregate principal amount of 1.35% Notes due 2017. We used the net proceeds from the offering of these notes to repay the 3-Year Loans on June 12, 2014.
During July 2014, we amended the term loan agreement, settled the outstanding $3.3 billion of 5-Year Loans and borrowed $3.3 billion of new loans. The new loans mature in July 2019, bear interest at a lower interest rate and require lower amortization payments in 2017 and 2018. In connection with the transaction, which primarily settled on a net basis, we recorded approximately $0.5 billion of proceeds from long-term borrowings and of repayments of long-term borrowings, respectively.
During January 2015, we entered into a term loan agreement with a major financial institution, pursuant to which we can borrow up to $6.5 billion for general corporate purposes, including the acquisition of spectrum licenses. Borrowings under the term loan agreement mature in March 2016, with a partial mandatory prepayment required in June 2015. The term loan agreement contains certain negative covenants, including a negative pledge covenant, a merger or similar transaction covenant and an accounting changes covenant, affirmative covenants and events of default that are customary for companies maintaining an investment grade credit rating. In addition, the term loan agreement requires us to maintain a leverage ratio (as defined in the term loan agreement) not in excess of 3.50:1.00, until our credit ratings are equal to or higher than A3 and A- at Moody’s Investors Service and Standard & Poor’s Ratings Services, respectively.
Tender Offer
On March 10, 2014, we announced the commencement of a tender offer (the Tender Offer) to purchase for cash any and all of the series of notes listed in the following table:
| (dollars in millions, except for Purchase Price) | Interest Rate |
Maturity | Principal Amount Outstanding |
Purchase Price (1) |
Principal Amount Purchased |
|||||||||||||||
| Verizon Communications |
6.10 | % | 2018 | $ | 1,500 | $ | 1,170.07 | $ | 748 | |||||||||||
| 5.50 | % | 2018 | 1,500 | 1,146.91 | 763 | |||||||||||||||
| 8.75 | % | 2018 | 1,300 | 1,288.35 | 564 | |||||||||||||||
| 5.55 | % | 2016 | 1,250 | 1,093.62 | 652 | |||||||||||||||
| 5.50 | % | 2017 | 750 | 1,133.22 | 353 | |||||||||||||||
| Cellco Partnership and Verizon Wireless Capital LLC |
8.50 | % | 2018 | 1,000 | 1,279.63 | 619 | ||||||||||||||
| Alltel Corporation |
7.00 | % | 2016 | 300 | 1,125.26 | 157 | ||||||||||||||
| GTE Corporation |
6.84 | % | 2018 | 600 | 1,196.85 | 266 | ||||||||||||||
|
|
|
|||||||||||||||||||
| $ | 4,122 | |||||||||||||||||||
|
|
|
|||||||||||||||||||
| (1) | Per $1,000 principal amount of notes |
The Tender Offer for each series of notes was subject to a financing condition, which was either satisfied or waived with respect to all series. The Tender Offer expired on March 17, 2014 and settled on March 19, 2014. In addition to the purchase price, any accrued and unpaid interest on the purchased notes was paid to the date of purchase. During March 2014, we recorded early debt redemption costs in connection with the Tender Offer (see “Early Debt Redemption and Other Costs”).
May Exchange Offer
On May 29, 2014, we announced the commencement of a private exchange offer (the May Exchange Offer) to exchange up to all Cellco Partnership and Verizon Wireless Capital LLC’s £0.6 billion outstanding aggregate principal amount of 8.875% Notes due 2018 (the 2018 Old Notes) for Verizon’s new sterling-denominated Notes due 2024 (the New Notes) and an amount of cash. This exchange offer has been accounted for as a modification of debt. In connection with the May Exchange Offer, which expired on June 25, 2014, we issued £0.7 billion aggregate principal of New Notes and made a cash payment of £22 million in exchange for £0.6 billion aggregate principal amount of tendered 2018 Old Notes. The New Notes bear interest at a rate of 4.073% per annum.
Concurrent with the issuance of the New Notes, we entered into cross currency swaps to fix our future interest and principal payments in U.S. dollars (see Note 10).
July Exchange Offers
On July 23, 2014, we announced the commencement of eleven separate private offers to exchange (the July Exchange Offers) specified series of outstanding Notes issued by Verizon and Alltel Corporation (collectively, the Old Notes) for new Notes to be issued by Verizon. The July Exchange Offers have been accounted for as a modification of debt. On August 21, 2014, Verizon issued $3.3 billion aggregate principal amount of 2.625% Notes due 2020 (the 2020 New Notes), $4.5 billion aggregate principal amount of 4.862% Notes due 2046 (the 2046 New Notes) and $5.5 billion aggregate principal amount of 5.012% Notes due 2054 (the 2054 New Notes) in satisfaction of the exchange offer consideration on tendered Old Notes (not including accrued and unpaid interest on the Old Notes). The following tables list the series of Old Notes included in the July Exchange Offers and the principal amount of each such series accepted by Verizon for exchange.
The table below lists the series of Old Notes included in the July Exchange Offers for the 2020 New Notes:
| (dollars in millions) | Interest Rate |
Maturity | Principal Amount Outstanding |
Principal Amount Accepted For Exchange |
||||||||||||
| Verizon Communications |
3.65 | % | 2018 | $ | 4,750 | $ | 2,052 | |||||||||
| 2.50 | % | 2016 | 4,250 | 1,068 | ||||||||||||
|
|
|
|||||||||||||||
| $ | 3,120 | |||||||||||||||
|
|
|
|||||||||||||||
The table below lists the series of Old Notes included in the July Exchange Offers for the 2046 New Notes:
| (dollars in millions) | Interest Rate |
Maturity | Principal Amount Outstanding |
Principal Amount Accepted For Exchange |
||||||||||||
| Verizon Communications |
6.40 | % | 2033 | $ | 6,000 | $ | 1,645 | |||||||||
| 7.75 | % | 2030 | 2,000 | 794 | ||||||||||||
| 7.35 | % | 2039 | 1,000 | 520 | ||||||||||||
| 7.75 | % | 2032 | 400 | 149 | ||||||||||||
| Alltel Corporation |
7.875 | % | 2032 | 700 | 248 | |||||||||||
| 6.80 | % | 2029 | 300 | 65 | ||||||||||||
|
|
|
|||||||||||||||
| $ | 3,421 | |||||||||||||||
|
|
|
|||||||||||||||
The table below lists the series of Old Notes included in the July Exchange Offers for the 2054 New Notes:
| (dollars in millions) | Interest Rate |
Maturity | Principal Amount Outstanding |
Principal Amount Accepted For Exchange |
||||||||||||
| Verizon Communications |
6.55 | % | 2043 | $ | 15,000 | $ | 4,330 | |||||||||
| 6.40 | % | 2038 | 1,750 | – | ||||||||||||
| 6.90 | % | 2038 | 1,250 | – | ||||||||||||
|
|
|
|||||||||||||||
| $ | 4,330 | |||||||||||||||
|
|
|
|||||||||||||||
2013
During March 2013, we issued $0.5 billion aggregate principal amount of floating rate Notes due 2015 in a private placement resulting in cash proceeds of approximately $0.5 billion, net of discounts and issuance costs. The proceeds were used for the repayment of commercial paper.
During April 2013, $1.25 billion of 5.25% Verizon Communications Notes matured and were repaid. In addition, during June 2013, $0.5 billion of 4.375% Verizon Communications Notes matured and were repaid.
During September 2013, in connection with the Wireless Transaction, we issued $49.0 billion aggregate principal amount of fixed and floating rate notes resulting in cash proceeds of approximately $48.7 billion, net of discounts and issuance costs. The issuances consisted of the following: $2.25 billion aggregate principal amount of floating rate Notes due 2016 that bear interest at a rate equal to three-month LIBOR plus 1.53% which rate will be reset quarterly, $1.75 billion aggregate principal amount of floating rate Notes due 2018 that bear interest at a rate equal to three-month LIBOR plus 1.75% which rate will be reset quarterly, $4.25 billion aggregate principal amount of 2.50% Notes due 2016, $4.75 billion aggregate principal amount of 3.65% Notes due 2018, $4.0 billion aggregate principal amount of 4.50% Notes due 2020, $11.0 billion aggregate principal amount of 5.15% Notes due 2023, $6.0 billion aggregate principal amount of 6.40% Notes due 2033 and $15.0 billion aggregate principal amount of 6.55% Notes due 2043 (collectively, the new notes). The proceeds of the new notes were used to finance, in part, the Wireless Transaction and to pay related fees and expenses. As a result of the issuance of the new notes, we incurred interest expense related to the Wireless Transaction of $0.7 billion during 2013.
Bridge Credit Agreement
During September 2013, we entered into a $61.0 billion bridge credit agreement with a group of major financial institutions. The credit agreement provided us with the ability to borrow up to $61.0 billion to finance, in part, the Wireless Transaction and to pay related transaction costs. Following the September 2013 issuance of notes, borrowing availability under the bridge credit agreement was reduced to $12.0 billion. Following the effectiveness of the term loan agreement in October 2013, the bridge credit agreement was terminated in accordance with its terms and as such, the related fees of $0.2 billion were recognized in Other income and (expense), net during the fourth quarter of 2013.
Verizon Wireless – Notes Payable and Other
Verizon Wireless Capital LLC, a wholly-owned subsidiary of Verizon Wireless, is a limited liability company formed under the laws of Delaware on December 7, 2001 as a special purpose finance subsidiary to facilitate the offering of debt securities of Verizon Wireless by acting as co-issuer. Other than the financing activities as a co-issuer of Verizon Wireless indebtedness, Verizon Wireless Capital LLC has no material assets, operations or revenues. Verizon Wireless is jointly and severally liable with Verizon Wireless Capital LLC for co-issued notes.
2014
In addition to the retirements of debt securities in connection with the Tender Offer, the May Exchange Offer, the July Exchange Offers and the November Early Debt Redemption, as noted above, during March 2014, Verizon Wireless redeemed $1.25 billion aggregate principal amount of the Cellco Partnership and Verizon Wireless Capital LLC 8.50% Notes due 2018 at 127.135% of the principal amount of such notes, plus accrued and unpaid interest (see “Early Debt Redemption and Other Costs”).
2013
During November 2013, $1.25 billion of 7.375% Verizon Wireless Notes and $0.2 billion of 6.50% Verizon Wireless Notes matured and were repaid. Also during November 2013, Verizon Wireless redeemed $3.5 billion of 5.55% Notes, due February 1, 2014 at a redemption price of 101% of the principal amount of the notes. Any accrued and unpaid interest was paid to the date of redemption.
Telephone and Other Subsidiary Debt
2014
During 2014, a series of notes held by GTE Corporation were included in the Tender Offer described above.
2013
During May 2013, $0.1 billion of 7.0% Verizon New York Inc. Debentures matured and were repaid. During June 2013, $0.1 billion of 7.0% Verizon New York Inc. Debentures matured and were repaid. In addition, during June 2013, we redeemed $0.25 billion of 7.15% Verizon Maryland LLC Debentures, due May 2023 at a redemption price of 100% of the principal amount of the debentures. During October 2013, $0.3 billion of 4.75% Verizon New England Inc. Debentures matured and were repaid. During November 2013, we redeemed $0.3 billion of 6.70% Verizon New York Inc. Debentures, due November 2023 at a redemption price of 100% of the principal amount of the debentures. During December 2013, we redeemed $0.2 billion of 7.0% Verizon New York Inc. Debentures, due December 2033 at a redemption price of 100% of the principal amount of the debentures and $20 million of 7.0% Verizon Delaware LLC Debentures, due December 2023 at a redemption price of 100% of the principal amount of the debentures. Any accrued and unpaid interest was paid to the date of redemption.
Early Debt Redemption and Other Costs
During March 2014, we recorded net debt redemption costs of $0.9 billion in connection with the early redemption of $1.25 billion aggregate principal amount of Cellco Partnership and Verizon Wireless Capital LLC 8.50% Notes due 2018, and the purchase of the following notes pursuant to the Tender Offer: $0.7 billion of the then outstanding $1.5 billion aggregate principal amount of Verizon 6.10% Notes due 2018, $0.8 billion of the then outstanding $1.5 billion aggregate principal amount of Verizon 5.50% Notes due 2018, $0.6 billion of the then outstanding $1.3 billion aggregate principal amount of Verizon 8.75% Notes due 2018, $0.7 billion of the then outstanding $1.25 billion aggregate principal amount of Verizon 5.55% Notes due 2016, $0.4 billion of the then outstanding $0.75 billion aggregate principal amount of Verizon 5.50% Notes due 2017, $0.6 billion of the then outstanding $1.0 billion aggregate principal amount of Cellco Partnership and Verizon Wireless Capital LLC 8.50% Notes due 2018, $0.2 billion of the then outstanding $0.3 billion aggregate principal amount of Alltel Corporation 7.00% Debentures due 2016 and $0.3 billion of the then outstanding $0.6 billion aggregate principal amount of GTE Corporation 6.84% Debentures due 2018.
During the fourth quarter of 2014, we recorded net debt redemption costs of $0.5 billion in connection with the early redemption of $0.5 billion aggregate principal amount of Verizon 4.90% Notes due 2015, $0.6 billion aggregate principal amount of Verizon 5.55% Notes due 2016, $1.3 billion aggregate principal amount of Verizon 3.00% Notes due 2016, $0.4 billion aggregate principal amount of Verizon 5.50% Notes due 2017, $0.7 billion aggregate principal amount of Verizon 8.75% Notes due 2018, $1.0 billion of the then outstanding $3.2 billion aggregate principal amount of Verizon 2.50% Notes due 2016, $0.1 billion aggregate principal amount Alltel Corporation 7.00% Debentures due 2016 and $0.4 billion aggregate principal amount of Cellco Partnership and Verizon Wireless Capital LLC 8.50% Notes due 2018, as well as $0.3 billion of other costs.
We recognize early debt redemption costs in Other income and (expense), net on our consolidated statements of income.
Additional Financing Activities (Non-Cash Transaction)
During 2014 and 2013, we financed, primarily through vendor financing arrangements, the purchase of approximately $0.7 billion and $0.1 billion, respectively, of long-lived assets, consisting primarily of network equipment. At December 31, 2014, $0.7 billion of these financing arrangements remained outstanding. These purchases are non-cash financing activities and therefore not reflected within Capital expenditures on our consolidated statements of cash flows.
Guarantees
We guarantee the debentures and first mortgage bonds of our operating telephone company subsidiaries. As of December 31, 2014, $3.1 billion aggregate principal amount of these obligations remained outstanding. Each guarantee will remain in place for the life of the obligation unless terminated pursuant to its terms, including the operating telephone company no longer being a wholly-owned subsidiary of Verizon.
We also guarantee the debt obligations of GTE Corporation that were issued and outstanding prior to July 1, 2003. As of December 31, 2014, $1.4 billion aggregate principal amount of these obligations remain outstanding.
Debt Covenants
We and our consolidated subsidiaries are in compliance with all of our debt covenants.
Maturities of Long-Term Debt
Maturities of long-term debt outstanding at December 31, 2014 are as follows:
| Years | (dollars in millions) | |||
| 2015 |
$ | 2,397 | ||
| 2016 |
6,114 | |||
| 2017 |
3,911 | |||
| 2018 |
6,529 | |||
| 2019 |
6,088 | |||
| Thereafter |
87,894 | |||
Note 9
| Wireless Equipment Installment Plans |
We offer new and existing customers the option to participate in Verizon Edge, a program that provides eligible wireless customers with the ability to pay for their handset over a period of time (an equipment installment plan) and the right to upgrade their handset after a minimum of 30 days, subject to certain conditions, including making a stated portion of the required device payments, trading in their handset in good working condition and signing a new contract with Verizon. The gross guarantee liability related to this program, which was approximately $0.7 billion at December 31, 2014 and was not material at December 31, 2013, was primarily included in Other current liabilities on our consolidated balance sheets.
At the time of sale, we impute risk adjusted interest on the receivables associated with Verizon Edge. We record the imputed interest as a reduction to the related accounts receivable. Interest income, which is included within Other income and (expense), net on our consolidated statements of income, is recognized over the financed installment term.
We assess the collectability of our Verizon Edge receivables based upon a variety of factors, including the credit quality of the customer base, payment trends and other qualitative factors. The current portion of our receivables related to Verizon Edge included in Accounts receivable was $2.3 billion at December 31, 2014 and was not material at December 31, 2013. The long-term portion of the equipment installment plan receivables included in Other assets was $1.2 billion at December 31, 2014 and was not material at December 31, 2013.
The credit profiles of our customers with a Verizon Edge plan are similar to those of our customers with a traditional subsidized plan. Customers with a credit profile which carries a higher risk are required to make a down payment for equipment financed through Verizon Edge.
Note 10
| Fair Value Measurements and Financial Instruments |
Recurring Fair Value Measurements
The following table presents the balances of assets and liabilities measured at fair value on a recurring basis as of December 31, 2014:
| (dollars in millions) | ||||||||||||||||
| Level 1(1) | Level 2(2) | Level 3(3) | Total | |||||||||||||
| Assets: |
||||||||||||||||
| Short-term investments: |
||||||||||||||||
| Equity securities |
$ | 295 | $ | – | $ | – | $ | 295 | ||||||||
| Fixed income securities |
– | 260 | – | 260 | ||||||||||||
| Other assets: |
||||||||||||||||
| Fixed income securities |
250 | 893 | – | 1,143 | ||||||||||||
| Interest rate swaps |
– | 72 | – | 72 | ||||||||||||
| Cross currency swaps |
– | 6 | – | 6 | ||||||||||||
|
|
|
|||||||||||||||
| Total |
$ | 545 | $ | 1,231 | $ | – | $ | 1,776 | ||||||||
|
|
|
|||||||||||||||
| Liabilities: |
||||||||||||||||
| Other current liabilities: |
||||||||||||||||
| Cross currency swaps and other |
$ | – | $ | 74 | $ | – | $ | 74 | ||||||||
| Other liabilities: |
||||||||||||||||
| Forward interest rate swaps |
– | 216 | – | 216 | ||||||||||||
| Cross currency swaps |
– | 528 | – | 528 | ||||||||||||
|
|
|
|||||||||||||||
| Total |
$ | – | $ | 818 | $ | – | $ | 818 | ||||||||
|
|
|
|||||||||||||||
| (1) | quoted prices in active markets for identical assets or liabilities |
| (2) | observable inputs other than quoted prices in active markets for identical assets and liabilities |
| (3) | no observable pricing inputs in the market |
Equity securities consist of investments in common stock of domestic and international corporations measured using quoted prices in active markets.
Fixed income securities consist primarily of investments in municipal bonds as well as U.S. Treasury securities. We use quoted prices in active markets for our U.S. Treasury securities, therefore these securities are classified as Level 1. For all other fixed income securities that do not have quoted prices in active markets, we use alternative matrix pricing resulting in these debt securities being classified as Level 2.
Derivative contracts are valued using models based on readily observable market parameters for all substantial terms of our derivative contracts and thus are classified within Level 2. We use mid-market pricing for fair value measurements of our derivative instruments. Our derivative instruments are recorded on a gross basis.
We recognize transfers between levels of the fair value hierarchy as of the end of the reporting period. There were no transfers within the fair value hierarchy during 2014.
Fair Value of Short-term and Long-term Debt
The fair value of our debt is determined using various methods, including quoted prices for identical terms and maturities, which is a Level 1 measurement, as well as quoted prices for similar terms and maturities in inactive markets and future cash flows discounted at current rates, which are Level 2 measurements. The fair value of our short-term and long-term debt, excluding capital leases, was as follows:
| (dollars in millions) | ||||||||||||||||
| At December 31, | 2014 | 2013 | ||||||||||||||
| Carrying Amount |
Fair Value | Carrying Amount |
Fair Value | |||||||||||||
| Short- and long-term debt, excluding capital leases |
$ | 112,755 | $ | 126,549 | $ | 93,298 | $ | 103,527 | ||||||||
Derivative Instruments
Interest Rate Swaps
We enter into domestic interest rate swaps to achieve a targeted mix of fixed and variable rate debt. We principally receive fixed rates and pay variable rates based on LIBOR, resulting in a net increase or decrease to Interest expense. These swaps are designated as fair value hedges and hedge against changes in the fair value of our debt portfolio. We record the interest rate swaps at fair value on our consolidated balance sheets as assets and liabilities.
During the second quarter of 2013, interest rate swaps with a notional value of $1.25 billion matured and the impact to our consolidated financial statements was not material. During the third quarter of 2013, we entered into interest rate swaps with a total notional value of $1.8 billion. At December 31, 2014 and 2013, the fair value of these interest rate swaps was not material. At December 31, 2014, the total notional amount of these interest rate swaps was $1.8 billion. The ineffective portion of these interest rate swaps was not material at December 31, 2014 and 2013.
Forward Interest Rate Swaps
In order to manage our exposure to future interest rate changes, during the fourth quarter of 2013, we entered into forward interest rate swaps with a notional value of $2.0 billion. In March 2014, we settled these forward interest rate swaps and the pre-tax gain was not material. During 2014, we entered into forward interest rate swaps with a total notional value of $4.8 billion. We designated these contracts as cash flow hedges. During the fourth quarter of 2014, we settled $2.8 billion of forward interest rate swaps and the pre-tax loss was not material. The fair value of these contracts was $0.2 billion, which was included within Other liabilities on our consolidated balance sheet, at December 31, 2014 and was not material at December 31, 2013.
Cross Currency Swaps
Verizon Wireless previously entered into cross currency swaps designated as cash flow hedges to exchange approximately $1.6 billion of British Pound Sterling and Euro-denominated debt into U.S. dollars and to fix our future interest and principal payments in U.S. dollars, as well as to mitigate the impact of foreign currency transaction gains or losses. In June 2014, we settled $0.8 billion of these cross currency swaps and the gains with respect to these swaps were not material.
During the first quarter of 2014, we entered into cross currency swaps designated as cash flow hedges to exchange approximately $5.4 billion of Euro and British Pound Sterling denominated debt into U.S. dollars. During the second quarter of 2014, we entered into cross currency swaps designated as cash flow hedges to exchange approximately $1.2 billion of British Pound Sterling denominated debt into U.S. dollars. During the fourth quarter of 2014, we entered into cross currency swaps designated as cash flow hedges to exchange approximately $3.0 billion of Euro denominated debt into U.S. dollars and to fix our future interest and principal payments in U.S. dollars. Each of these cross currency swaps was entered into in order to mitigate the impact of foreign currency transaction gains or losses.
A portion of the gains and losses recognized in Other comprehensive income was reclassified to Other income and (expense), net to offset the related pre-tax foreign currency transaction gain or loss on the underlying debt obligations. The fair value of the outstanding swaps was $0.6 billion, which was primarily included within Other liabilities on our consolidated balance sheet, at December 31, 2014 and was not material at December 31, 2013. During 2014 and 2013, a pre-tax loss of $0.1 billion and an immaterial pre-tax gain, respectively, were recognized in Other comprehensive income with respect to these swaps.
Concentrations of Credit Risk
Financial instruments that subject us to concentrations of credit risk consist primarily of temporary cash investments, short-term and long-term investments, trade receivables, certain notes receivable, including lease receivables, and derivative contracts. Our policy is to deposit our temporary cash investments with major financial institutions. Counterparties to our derivative contracts are also major financial institutions with whom we have negotiated derivatives agreements (ISDA master agreement) and credit support annex agreements which provide rules for collateral exchange. We generally apply collateralized arrangements with our counterparties for uncleared derivatives to mitigate credit risk. At December 31, 2014, we posted collateral of approximately $0.6 billion related to derivative contracts under collateral exchange arrangements, which were recorded as Prepaid expenses and other in our consolidated balance sheet. At December 31, 2013, we held an immaterial amount of collateral related to derivative contracts under collateral exchange arrangements, which were recorded as Accounts payable and accrued liabilities in our consolidated balance sheet. We may enter into swaps on an uncollateralized basis in certain circumstances. While we may be exposed to credit losses due to the nonperformance of our counterparties, we consider the risk remote and do not expect the settlement of these transactions to have a material effect on our results of operations or financial condition.
Nonrecurring Fair Value Measurements
The Company measures certain assets and liabilities at fair value on a nonrecurring basis. During the fourth quarter of 2014, certain long-lived assets met the criteria to be classified as held for sale. At that time, the fair value of these long-lived assets was measured, resulting in expected disposal losses of $0.1 billion. The fair value of these assets held for sale was measured with the assistance of third-party appraisals and other estimates of fair value, which used market approach techniques as part of the analysis. The fair value measurement was categorized as Level 3, as significant unobservable inputs were used in the valuation. The expected disposal losses, which represented the difference between the fair value less cost to sell and the carrying amount of the assets held for sale, were included in Selling, general and administrative expenses.
Note 11
| Stock-Based Compensation |
Verizon Communications Long-Term Incentive Plan
The Verizon Communications Inc. Long-Term Incentive Plan (the Plan) permits the granting of stock options, stock appreciation rights, restricted stock, restricted stock units, performance shares, performance stock units and other awards. The maximum number of shares available for awards from the Plan is 119.6 million shares.
Restricted Stock Units
The Plan provides for grants of Restricted Stock Units (RSUs) that generally vest at the end of the third year after the grant. The RSUs are classified as equity awards because the RSUs will be paid in Verizon common stock upon vesting. The RSU equity awards are measured using the grant date fair value of Verizon common stock and are not remeasured at the end of each reporting period. Dividend equivalent units are also paid to participants at the time the RSU award is paid, and in the same proportion as the RSU award.
Performance Stock Units
The Plan also provides for grants of Performance Stock Units (PSUs) that generally vest at the end of the third year after the grant. As defined by the Plan, the Human Resources Committee of the Board of Directors determines the number of PSUs a participant earns based on the extent to which the corresponding performance goals have been achieved over the three-year performance cycle. The PSUs are classified as liability awards because the PSU awards are paid in cash upon vesting. The PSU award liability is measured at its fair value at the end of each reporting period and, therefore, will fluctuate based on the price of Verizon common stock as well as performance relative to the targets. Dividend equivalent units are also paid to participants at the time that the PSU award is determined and paid, and in the same proportion as the PSU award. The granted and cancelled activity for the PSU award includes adjustments for the performance goals achieved.
The following table summarizes Verizon’s Restricted Stock Unit and Performance Stock Unit activity:
| (shares in thousands) | Restricted Stock Units |
Performance Stock Units |
||||||
| Outstanding January 1, 2012 |
19,836 | 27,614 | ||||||
| Granted |
6,350 | 20,537 | ||||||
| Payments |
(7,369 | ) | (8,499 | ) | ||||
| Cancelled/Forfeited |
(148 | ) | (189 | ) | ||||
|
|
|
|||||||
| Outstanding December 31, 2012 |
18,669 | 39,463 | ||||||
| Granted |
4,950 | 7,470 | ||||||
| Payments |
(7,246 | ) | (22,703 | ) | ||||
| Cancelled/Forfeited |
(180 | ) | (506 | ) | ||||
|
|
|
|||||||
| Outstanding December 31, 2013 |
16,193 | 23,724 | ||||||
| Granted |
5,278 | 7,359 | ||||||
| Payments |
(6,202 | ) | (9,153 | ) | ||||
| Cancelled/Forfeited |
(262 | ) | (1,964 | ) | ||||
|
|
|
|||||||
| Outstanding December 31, 2014 |
15,007 | 19,966 | ||||||
|
|
|
|||||||
As of December 31, 2014, unrecognized compensation expense related to the unvested portion of Verizon’s RSUs and PSUs was approximately $0.4 billion and is expected to be recognized over approximately two years.
The RSUs granted in 2014 and 2013 have weighted-average grant date fair values of $47.23 and $47.96 per unit, respectively. During 2014, 2013 and 2012, we paid $0.6 billion, $1.1 billion and $0.6 billion, respectively, to settle RSUs and PSUs classified as liability awards.
Verizon Wireless’ Long-Term Incentive Plan
The Verizon Wireless Long-Term Incentive Plan (the Wireless Plan) provided compensation opportunities to eligible employees of Verizon Wireless (the Partnership). Under the Wireless Plan, Value Appreciation Rights (VARs) were granted to eligible employees. We have not granted new VARs since 2004. As of December 31, 2014, there are no VARs that remain outstanding.
Stock-Based Compensation Expense
After-tax compensation expense for stock-based compensation related to RSUs, PSUs, and VARs described above included in Net income attributable to Verizon was $0.3 billion, $0.4 billion and $0.7 billion for 2014, 2013 and 2012, respectively.
Stock Options
The Plan provides for grants of stock options to participants at an option price per share of no less than 100% of the fair market value of Verizon common stock on the date of grant. Each grant has a 10-year life, vesting equally over a three-year period, starting at the date of the grant. We have not granted new stock options since 2004. As of December 31, 2014, there are no stock options that remain outstanding.
Note 12
|
Employee Benefits |
We maintain non-contributory defined benefit pension plans for many of our employees. In addition, we maintain postretirement health care and life insurance plans for our retirees and their dependents, which are both contributory and non-contributory, and include a limit on our share of the cost for certain recent and future retirees. In accordance with our accounting policy for pension and other postretirement benefits, operating expenses include pension and benefit related credits and/or charges based on actuarial assumptions, including projected discount rates and an estimated return on plan assets. These estimates are updated in the fourth quarter to reflect actual return on plan assets and updated actuarial assumptions. The adjustment is recognized in the income statement during the fourth quarter or upon a remeasurement event pursuant to our accounting policy for the recognition of actuarial gains and losses.
Pension and Other Postretirement Benefits
Pension and other postretirement benefits for many of our employees are subject to collective bargaining agreements. Modifications in benefits have been bargained from time to time, and we may also periodically amend the benefits in the management plans. The following tables summarize benefit costs, as well as the benefit obligations, plan assets, funded status and rate assumptions associated with pension and postretirement health care and life insurance benefit plans.
Obligations and Funded Status
| (dollars in millions) | ||||||||||||||||
| Pension | Health Care and Life | |||||||||||||||
| At December 31, | 2014 | 2013 | 2014 | 2013 | ||||||||||||
| Change in Benefit Obligations |
||||||||||||||||
| Beginning of year |
$ | 23,032 | $ | 26,773 | $ | 23,042 | $ | 26,844 | ||||||||
| Service cost |
327 | 395 | 258 | 318 | ||||||||||||
| Interest cost |
1,035 | 1,002 | 1,107 | 1,095 | ||||||||||||
| Plan amendments |
(89 | ) | (149 | ) | (412 | ) | (119 | ) | ||||||||
| Actuarial (gain) loss, net |
2,977 | (2,327 | ) | 4,645 | (3,576 | ) | ||||||||||
| Benefits paid |
(1,566 | ) | (1,777 | ) | (1,543 | ) | (1,520 | ) | ||||||||
| Curtailment and termination benefits |
11 | 4 | – | – | ||||||||||||
| Settlements paid |
(407 | ) | (889 | ) | – | – | ||||||||||
|
|
|
|||||||||||||||
| End of year |
$ | 25,320 | $ | 23,032 | $ | 27,097 | $ | 23,042 | ||||||||
|
|
|
|||||||||||||||
| Change in Plan Assets |
||||||||||||||||
| Beginning of year |
$ | 17,111 | $ | 18,282 | $ | 3,053 | $ | 2,657 | ||||||||
| Actual return on plan assets |
1,778 | 1,388 | 193 | 556 | ||||||||||||
| Company contributions |
1,632 | 107 | 732 | 1,360 | ||||||||||||
| Benefits paid |
(1,566 | ) | (1,777 | ) | (1,543 | ) | (1,520 | ) | ||||||||
| Settlements paid |
(407 | ) | (889 | ) | – | – | ||||||||||
|
|
|
|||||||||||||||
| End of year |
$ | 18,548 | $ | 17,111 | $ | 2,435 | $ | 3,053 | ||||||||
|
|
|
|||||||||||||||
| Funded Status |
||||||||||||||||
|
|
|
|||||||||||||||
| End of year |
$ | (6,772 | ) | $ | (5,921 | ) | $ | (24,662 | ) | $ | (19,989 | ) | ||||
|
|
|
|||||||||||||||
| (dollars in millions) | ||||||||||||||||
| Pension | Health Care and Life | |||||||||||||||
| At December 31, | 2014 | 2013 | 2014 | 2013 | ||||||||||||
| Amounts recognized on the balance sheet |
||||||||||||||||
| Noncurrent assets |
$ | 337 | $ | 339 | $ | – | $ | – | ||||||||
| Current liabilities |
(122 | ) | (137 | ) | (528 | ) | (710 | ) | ||||||||
| Noncurrent liabilities |
(6,987 | ) | (6,123 | ) | (24,134 | ) | (19,279 | ) | ||||||||
|
|
|
|||||||||||||||
| Total |
$ | (6,772 | ) | $ | (5,921 | ) | $ | (24,662 | ) | $ | (19,989 | ) | ||||
|
|
|
|||||||||||||||
| Amounts recognized in Accumulated Other |
||||||||||||||||
| Prior Service Benefit (Cost) |
$ | (56 | ) | $ | 25 | $ | (2,280 | ) | $ | (2,120 | ) | |||||
|
|
|
|||||||||||||||
| Total |
$ | (56 | ) | $ | 25 | $ | (2,280 | ) | $ | (2,120 | ) | |||||
|
|
|
|||||||||||||||
Beginning in 2013, as a result of federal health care reform, Verizon no longer files for the Retiree Drug Subsidy (RDS) and instead contracts with a Medicare Part D plan on a group basis to provide prescription drug benefits to Medicare eligible retirees.
The accumulated benefit obligation for all defined benefit pension plans was $25.3 billion and $22.9 billion at December 31, 2014 and 2013, respectively.
Information for pension plans with an accumulated benefit obligation in excess of plan assets follows:
| (dollars in millions) | ||||||||
| At December 31, | 2014 | 2013 | ||||||
| Projected benefit obligation |
$ | 24,919 | $ | 22,610 | ||||
| Accumulated benefit obligation |
24,851 | 22,492 | ||||||
| Fair value of plan assets |
17,810 | 16,350 | ||||||
Net Periodic Cost
The following table summarizes the benefit (income) cost related to our pension and postretirement health care and life insurance plans:
| (dollars in millions) | ||||||||||||||||||||||||
| Pension | Health Care and Life | |||||||||||||||||||||||
| Years Ended December 31, | 2014 | 2013 | 2012 | 2014 | 2013 | 2012 | ||||||||||||||||||
| Service cost |
$ | 327 | $ | 395 | $ | 358 | $ | 258 | $ | 318 | $ | 359 | ||||||||||||
| Amortization of prior service cost (credit) |
(8 | ) | 6 | (1 | ) | (253 | ) | (247) | (89 | ) | ||||||||||||||
| Expected return on plan assets |
(1,181 | ) | (1,245 | ) | (1,795 | ) | (161 | ) | (143) | (171 | ) | |||||||||||||
| Interest cost |
1,035 | 1,002 | 1,449 | 1,107 | 1,095 | 1,284 | ||||||||||||||||||
| Remeasurement (gain) loss, net |
2,380 | (2,470 | ) | 5,542 | 4,615 | (3,989) | 1,262 | |||||||||||||||||
|
|
|
|||||||||||||||||||||||
| Net periodic benefit (income) cost |
2,553 | (2,312 | ) | 5,553 | 5,566 | (2,966) | 2,645 | |||||||||||||||||
| Curtailment and termination benefits |
11 | 4 | – | – | – | – | ||||||||||||||||||
|
|
|
|||||||||||||||||||||||
| Total |
$ | 2,564 | $ | (2,308 | ) | $ | 5,553 | $ | 5,566 | $ | (2,966) | $ | 2,645 | |||||||||||
|
|
|
|||||||||||||||||||||||
Other pre-tax changes in plan assets and benefit obligations recognized in other comprehensive (income) loss are as follows:
| (dollars in millions) | ||||||||||||||||
| Pension | Health Care and Life | |||||||||||||||
| At December 31, | 2014 | 2013 | 2014 | 2013 | ||||||||||||
| Prior service cost |
$ | (89 | ) | $ | (149 | ) | $ | (413 | ) | $ | (119 | ) | ||||
| Reversal of amortization items |
||||||||||||||||
| Prior service cost |
8 | (6 | ) | 253 | 247 | |||||||||||
|
|
|
|||||||||||||||
| Total recognized in other comprehensive (income) loss (pre-tax) |
$ | (81 | ) | $ | (155 | ) | $ | (160 | ) | $ | 128 | |||||
|
|
|
|||||||||||||||
The estimated prior service cost for the defined benefit pension plans that will be amortized from Accumulated other comprehensive income (loss) into net periodic benefit (income) cost over the next fiscal year is not significant. The estimated prior service cost for the defined benefit postretirement plans that will be amortized from Accumulated other comprehensive income into net periodic benefit (income) cost over the next fiscal year is $0.3 billion.
Assumptions
The weighted-average assumptions used in determining benefit obligations follow:
| Pension | Health Care and Life | |||||||||||||||
| At December 31, | 2014 | 2013 | 2014 | 2013 | ||||||||||||
| Discount Rate |
4.20 | % | 5.00 | % | 4.20 | % | 5.00 | % | ||||||||
| Rate of compensation increases |
3.00 | 3.00 | N/A | N/A | ||||||||||||
The weighted-average assumptions used in determining net periodic cost follow:
| Pension | Health Care and Life | |||||||||||||||||||||||
| At December 31, | 2014 | 2013 | 2012 | 2014 | 2013 | 2012 | ||||||||||||||||||
| Discount Rate |
5.00 | % | 4.20 | % | 5.00 | % | 5.00 | % | 4.20 | % | 5.00 | % | ||||||||||||
| Expected return on plan assets |
7.25 | 7.50 | 7.50 | 5.50 | 5.60 | 7.00 | ||||||||||||||||||
| Rate of compensation increases |
3.00 | 3.00 | 3.00 | N/A | N/A | N/A | ||||||||||||||||||
In order to project the long-term target investment return for the total portfolio, estimates are prepared for the total return of each major asset class over the subsequent 10-year period. Those estimates are based on a combination of factors including the current market interest rates and valuation levels, consensus earnings expectations and historical long-term risk premiums. To determine the aggregate return for the pension trust, the projected return of each individual asset class is then weighted according to the allocation to that investment area in the trust’s long-term asset allocation policy.
The assumed health care cost trend rates follow:
| Health Care and Life | ||||||||||||
| At December 31, | 2014 | 2013 | 2012 | |||||||||
| Healthcare cost trend rate assumed for next year |
6.50 | % | 6.50 | % | 7.00 | % | ||||||
| Rate to which cost trend rate gradually declines |
4.75 | 4.75 | 5.00 | |||||||||
| Year the rate reaches the level it is assumed to remain thereafter |
2022 | 2020 | 2016 | |||||||||
A one-percentage point change in the assumed health care cost trend rate would have the following effects:
| (dollars in millions) | ||||||||
| One-Percentage Point | Increase | Decrease | ||||||
| Effect on 2014 service and interest cost |
$ | 193 | $ | (155 | ) | |||
| Effect on postretirement benefit obligation as of December 31, 2014 |
3,760 | (3,023 | ) | |||||
Plan Assets
The company’s overall investment strategy is to achieve a mix of assets which allows us to meet projected benefit payments while taking into consideration risk and return. While target allocation percentages will vary over time, the current target allocation for plan assets is designed so that 70% of the assets have the objective of achieving a return in excess of the growth in liabilities (comprised of public equities, private equities, real estate, hedge funds and emerging debt) and 30% of the assets are invested as liability hedging assets (where cash flows from investments better match projected benefit payments, typically longer duration fixed income). This allocation will shift as funded status improves to a higher allocation of liability hedging assets. Target policies will be revisited periodically to ensure they are in line with fund objectives. Both active and passive management approaches are used depending on perceived market efficiencies and various other factors. Due to our diversification and risk control processes, there are no significant concentrations of risk, in terms of sector, industry, geography or company names.
Pension and healthcare and life plans assets do not include significant amounts of Verizon common stock.
Pension Plans
The fair values for the pension plans by asset category at December 31, 2014 are as follows:
| (dollars in millions) | ||||||||||||||||
| Asset Category | Total | Level 1 | Level 2 | Level 3 | ||||||||||||
| Cash and cash equivalents |
$ | 1,983 | $ | 1,814 | $ | 169 | $ | – | ||||||||
| Equity securities |
4,339 | 2,952 | 1,277 | 110 | ||||||||||||
| Fixed income securities |
||||||||||||||||
| U.S. Treasuries and agencies |
1,257 | 830 | 427 | – | ||||||||||||
| Corporate bonds |
2,882 | 264 | 2,506 | 112 | ||||||||||||
| International bonds |
582 | 39 | 524 | 19 | ||||||||||||
| Other |
3 | – | 3 | – | ||||||||||||
| Real estate |
1,792 | – | – | 1,792 | ||||||||||||
| Other |
||||||||||||||||
| Private equity |
3,748 | – | 204 | 3,544 | ||||||||||||
| Hedge funds |
1,962 | – | 1,164 | 798 | ||||||||||||
|
|
|
|||||||||||||||
| Total |
$ | 18,548 | $ | 5,899 | $ | 6,274 | $ | 6,375 | ||||||||
|
|
|
|||||||||||||||
The fair values for the pension plans by asset category at December 31, 2013 are as follows:
| (dollars in millions) | ||||||||||||||||
| Asset Category | Total | Level 1 | Level 2 | Level 3 | ||||||||||||
| Cash and cash equivalents |
$ | 968 | $ | 881 | $ | 87 | $ | – | ||||||||
| Equity securities |
4,200 | 3,300 | 900 | – | ||||||||||||
| Fixed income securities |
||||||||||||||||
| U.S. Treasuries and agencies |
1,097 | 691 | 406 | – | ||||||||||||
| Corporate bonds |
2,953 | 212 | 2,579 | 162 | ||||||||||||
| International bonds |
364 | 51 | 313 | – | ||||||||||||
| Other |
3 | – | 3 | – | ||||||||||||
| Real estate |
1,784 | – | – | 1,784 | ||||||||||||
| Other |
||||||||||||||||
| Private equity |
3,942 | – | – | 3,942 | ||||||||||||
| Hedge funds |
1,800 | – | 604 | 1,196 | ||||||||||||
|
|
|
|||||||||||||||
| Total |
$ | 17,111 | $ | 5,135 | $ | 4,892 | $ | 7,084 | ||||||||
|
|
|
|||||||||||||||
The following is a reconciliation of the beginning and ending balance of pension plan assets that are measured at fair value using significant unobservable inputs:
| (dollars in millions) | ||||||||||||||||||||||||||||
| Equity Securities |
Corporate Bonds |
International Bonds |
Real Estate |
Private Equity |
Hedge Funds |
Total | ||||||||||||||||||||||
| Balance at January 1, 2013 |
$ | – | $ | 196 | $ | – | $ | 2,018 | $ | 5,039 | $ | 558 | $ | 7,811 | ||||||||||||||
| Actual gain on plan assets |
– | 12 | – | 81 | 674 | 84 | 851 | |||||||||||||||||||||
| Purchases and sales |
– | (13 | ) | – | (315 | ) | (1,732 | ) | (124 | ) | (2,184 | ) | ||||||||||||||||
| Transfers in (out) |
– | (33 | ) | – | – | (39 | ) | 678 | 606 | |||||||||||||||||||
|
|
|
|||||||||||||||||||||||||||
| Balance at December 31, 2013 |
$ | – | $ | 162 | $ | – | $ | 1,784 | $ | 3,942 | $ | 1,196 | $ | 7,084 | ||||||||||||||
| Actual gain (loss) on plan assets |
(1 | ) | 5 | – | 42 | 73 | 33 | 152 | ||||||||||||||||||||
| Purchases and sales |
106 | (50 | ) | 8 | (34 | ) | (471 | ) | 144 | (297 | ) | |||||||||||||||||
| Transfers in (out) |
5 | (5 | ) | 11 | – | – | (575 | ) | (564 | ) | ||||||||||||||||||
|
|
|
|||||||||||||||||||||||||||
| Balance at December 31, 2014 |
$ | 110 | $ | 112 | $ | 19 | $ | 1,792 | $ | 3,544 | $ | 798 | $ | 6,375 | ||||||||||||||
|
|
|
|||||||||||||||||||||||||||
Health Care and Life Plans
The fair values for the other postretirement benefit plans by asset category at December 31, 2014 are as follows:
| (dollars in millions) | ||||||||||||||||
| Asset Category | Total | Level 1 | Level 2 | Level 3 | ||||||||||||
| Cash and cash equivalents |
$ | 208 | $ | 6 | $ | 202 | $ | – | ||||||||
| Equity securities |
1,434 | 1,172 | 262 | – | ||||||||||||
| Fixed income securities |
||||||||||||||||
| U.S. Treasuries and agencies |
105 | 98 | 7 | – | ||||||||||||
| Corporate bonds |
461 | 119 | 296 | 46 | ||||||||||||
| International bonds |
111 | 14 | 97 | – | ||||||||||||
| Other |
116 | – | 116 | – | ||||||||||||
|
|
|
|||||||||||||||
| Total |
$ | 2,435 | $ | 1,409 | $ | 980 | $ | 46 | ||||||||
|
|
|
|||||||||||||||
|
The fair values for the other postretirement benefit plans by asset category at December 31, 2013 are as follows:
|
|
|||||||||||||||
| (dollars in millions) | ||||||||||||||||
| Asset Category | Total | Level 1 | Level 2 | Level 3 | ||||||||||||
| Cash and cash equivalents |
$ | 237 | $ | 12 | $ | 225 | $ | – | ||||||||
| Equity securities |
2,178 | 1,324 | 854 | – | ||||||||||||
| Fixed income securities |
||||||||||||||||
| U.S. Treasuries and agencies |
121 | 94 | 27 | – | ||||||||||||
| Corporate bonds |
252 | 45 | 207 | – | ||||||||||||
| International bonds |
104 | 18 | 86 | – | ||||||||||||
| Other |
161 | 40 | 121 | – | ||||||||||||
|
|
|
|||||||||||||||
| Total |
$ | 3,053 | $ | 1,533 | $ | 1,520 | $ | – | ||||||||
|
|
|
|||||||||||||||
The following is a reconciliation of the beginning and ending balance of the other postretirement benefit plans assets that are measured at fair value using significant unobservable inputs:
| Corporate Bonds |
Total | |||||||
| Balance at December 31, 2013 |
$ | – | $ | – | ||||
| Actual gain on plan assets |
1 | 1 | ||||||
| Purchases and sales |
45 | 45 | ||||||
|
|
|
|||||||
| Balance at December 31, 2014 |
$ | 46 | $ | 46 | ||||
|
|
|
|||||||
The following are general descriptions of asset categories, as well as the valuation methodologies and inputs used to determine the fair value of each major category of assets.
Cash and cash equivalents include short-term investment funds, primarily in diversified portfolios of investment grade money market instruments and are valued using quoted market prices or other valuation methods, and thus are classified within Level 1 or Level 2.
Equity securities are investments in common stock of domestic and international corporations in a variety of industry sectors, and are valued primarily using quoted market prices or other valuation methods, and thus are classified within Level 1 or Level 2.
Fixed income securities include U.S. Treasuries and agencies, debt obligations of foreign governments and domestic and foreign corporations. Fixed income also includes investments in collateralized mortgage obligations, mortgage backed securities and interest rate swaps. The fair value of fixed income securities is based on observable prices for identical or comparable assets, adjusted using benchmark curves, sector grouping, matrix pricing, broker/dealer quotes and issuer spreads, and thus is classified within Level 1 or Level 2.
Real estate investments include those in limited partnerships that invest in various commercial and residential real estate projects both domestically and internationally. The fair values of real estate assets are typically determined by using income and/or cost approaches or a comparable sales approach, taking into consideration discount and capitalization rates, financial conditions, local market conditions and the status of the capital markets, and thus are classified within Level 3.
Private equity investments include those in limited partnerships that invest in operating companies that are not publicly traded on a stock exchange. Investment strategies in private equity include leveraged buyouts, venture capital, distressed investments and investments in natural resources. These investments are valued using inputs such as trading multiples of comparable public securities, merger and acquisition activity and pricing data from the most recent equity financing taking into consideration illiquidity, and thus are classified within Level 3.
Hedge fund investments include those seeking to maximize absolute returns using a broad range of strategies to enhance returns and provide additional diversification. The fair values of hedge funds are estimated using net asset value per share (NAV) of the investments. Verizon has the ability to redeem these investments at NAV within the near term and thus are classified within Level 2. Investments that cannot be redeemed in the near term are classified within Level 3.
Employer Contributions
In 2014, we contributed $1.5 billion to our qualified pension plans, $0.1 billion to our nonqualified pension plans and $0.7 billion to our other postretirement benefit plans. We anticipate a minimum contribution of $0.7 billion to our qualified pension plans in 2015. Nonqualified pension plans contributions are estimated to be $0.1 billion and contributions to our other postretirement benefit plans are estimated to be $0.8 billion in 2015.
Estimated Future Benefit Payments
The benefit payments to retirees are expected to be paid as follows:
| (dollars in millions) | ||||||||
| Year | Pension Benefits | Health Care and Life | ||||||
| 2015 |
$ | 2,855 | $ | 1,481 | ||||
| 2016 |
2,024 | 1,456 | ||||||
| 2017 |
1,937 | 1,452 | ||||||
| 2018 |
1,427 | 1,436 | ||||||
| 2019 |
1,396 | 1,398 | ||||||
| 2020-2024 |
6,890 | 6,996 | ||||||
Savings Plan and Employee Stock Ownership Plans
We maintain four leveraged employee stock ownership plans (ESOP). We match a certain percentage of eligible employee contributions to the savings plans with shares of our common stock from this ESOP. At December 31, 2014, the number of allocated shares of common stock in this ESOP was 61 million. There were no unallocated shares of common stock in this ESOP at December 31, 2014. All leveraged ESOP shares are included in earnings per share computations.
Total savings plan costs were $0.9 billion in 2014, $1.0 billion in 2013 and $0.7 billion in 2012.
Pension Annuitization
On October 17, 2012, we, along with our subsidiary Verizon Investment Management Corp., and Fiduciary Counselors Inc., as independent fiduciary of the Verizon Management Pension Plan (the Plan), entered into a definitive purchase agreement with The Prudential Insurance Company of America (Prudential) and Prudential Financial, Inc., pursuant to which the Plan would purchase a single premium group annuity contract from Prudential.
On December 10, 2012, upon issuance of the group annuity contract by Prudential, Prudential irrevocably assumed the obligation to make future annuity payments to approximately 41,000 Verizon management retirees who began receiving pension payments from the Plan prior to January 1, 2010. The amount of each retiree’s annuity payment equals the amount of such individual’s pension benefit. In addition, the group annuity contract is intended to replicate the same rights to future payments, such as survivor benefits, that are currently offered by the Plan.
We contributed approximately $2.6 billion to the Plan between September 1, 2012 and December 31, 2012 in connection with the transaction so that the Plan’s funding percentage would not decrease as a result of the transaction.
Severance Benefits
The following table provides an analysis of our actuarially determined severance liability recorded in accordance with the accounting standard regarding employers’ accounting for postemployment benefits:
| (dollars in millions) | ||||||||||||||||||||
| Year | Beginning of Year | Charged to Expense |
Payments | Other | End of Year | |||||||||||||||
| 2012 |
$ | 1,113 | $ | 396 | $ | (531 | ) | $ | 32 | $ | 1,010 | |||||||||
| 2013 |
1,010 | 134 | (381 | ) | (6 | ) | 757 | |||||||||||||
| 2014 |
757 | 531 | (406 | ) | (7 | ) | 875 | |||||||||||||
Severance, Pension and Benefit (Credits) Charges
During 2014, we recorded net pre-tax severance, pension and benefits charges of approximately $7.5 billion primarily for our pension and postretirement plans in accordance with our accounting policy to recognize actuarial gains and losses in the year in which they occur. The charges were primarily driven by a decrease in our discount rate assumption used to determine the current year liabilities from a weighted-average of 5.0% at December 31, 2013 to a weighted-average of 4.2% at December 31, 2014 ($5.2 billion), a change in mortality assumptions primarily driven by the use of updated actuarial tables (RP-2014 and MP-2014) issued by the Society of Actuaries in October 2014 ($1.8 billion) and revisions to the
retirement assumptions for participants and other assumption adjustments, partially offset by the difference between our estimated return on assets of 7.25% and our actual return on assets of 10.5% ($0.6 billion). As part of this charge, we recorded severance costs of $0.5 billion under our existing separation plans.
During 2013, we recorded net pre-tax severance, pension and benefits credits of approximately $6.2 billion primarily for our pension and postretirement plans in accordance with our accounting policy to recognize actuarial gains and losses in the year in which they occur. The credits were primarily driven by an increase in our discount rate assumption used to determine the current year liabilities from a weighted-average of 4.2% at December 31, 2012 to a weighted-average of 5.0% at December 31, 2013 ($4.3 billion), lower than assumed retiree medical costs and other assumption adjustments ($1.4 billion) and the difference between our estimated return on assets of 7.5% at December 31, 2012 and our actual return on assets of 8.6% at December 31, 2013 ($0.5 billion).
During 2012, we recorded net pre-tax severance, pension and benefits charges of approximately $7.2 billion primarily for our pension and postretirement plans in accordance with our accounting policy to recognize actuarial gains and losses in the year in which they occur. The charges were primarily driven by a decrease in our discount rate assumption used to determine the current year liabilities from a weighted-average of 5% at December 31, 2011 to a weighted-average of 4.2% at December 31, 2012 ($5.3 billion) and revisions to the retirement assumptions for participants and other assumption adjustments, partially offset by the difference between our estimated return on assets of 7.5% and our actual return on assets of 10% ($0.7 billion). As part of this charge, we also recorded $1.0 billion related to the annuitization of pension liabilities, as described above, as well as severance charges of $0.4 billion.
Note 13
| Taxes |
The components of income before (provision) benefit for income taxes are as follows:
| (dollars in millions) | ||||||||||||
| Years Ended December 31, | 2014 | 2013 | 2012 | |||||||||
| Domestic |
$ | 12,992 | $ | 28,833 | $ | 9,316 | ||||||
| Foreign |
2,278 | 444 | 581 | |||||||||
|
|
|
|||||||||||
| Total |
$ | 15,270 | $ | 29,277 | $ | 9,897 | ||||||
|
|
|
|||||||||||
The components of the provision (benefit) for income taxes are as follows:
| (dollars in millions) | ||||||||||||
| Years Ended December 31, | 2014 | 2013 | 2012 | |||||||||
| Current |
||||||||||||
| Federal |
$ | 2,657 | $ | (197 | ) | $ | 223 | |||||
| Foreign |
81 | (59 | ) | (45 | ) | |||||||
| State and Local |
668 | 201 | 114 | |||||||||
|
|
|
|||||||||||
| Total |
3,406 | (55 | ) | 292 | ||||||||
|
|
|
|||||||||||
| Deferred |
||||||||||||
| Federal |
(51 | ) | 5,060 | (559 | ) | |||||||
| Foreign |
(9 | ) | 8 | 10 | ||||||||
| State and Local |
(32 | ) | 717 | (403 | ) | |||||||
|
|
|
|||||||||||
| Total |
(92 | ) | 5,785 | (952 | ) | |||||||
|
|
|
|||||||||||
| Total income tax provision (benefit) |
$ | 3,314 | $ | 5,730 | $ | (660 | ) | |||||
|
|
|
|||||||||||
The following table shows the principal reasons for the difference between the effective income tax rate and the statutory federal income tax rate:
| Years Ended December 31, | 2014 | 2013 | 2012 | |||||||||
| Statutory federal income tax rate |
35.0 | % | 35.0 | % | 35.0 | % | ||||||
| State and local income tax rate, net of federal tax benefits |
2.7 | 2.1 | (1.9 | ) | ||||||||
| Affordable housing credit |
(1.0 | ) | (0.6 | ) | (1.9 | ) | ||||||
| Employee benefits including ESOP dividend |
(0.7 | ) | (0.4 | ) | (1.1 | ) | ||||||
| Disposition of Omnitel Interest |
(5.9 | ) | – | – | ||||||||
| Noncontrolling interests |
(5.0 | ) | (14.3 | ) | (33.7 | ) | ||||||
| Other, net |
(3.4 | ) | (2.2 | ) | (3.1 | ) | ||||||
|
|
|
|||||||||||
| Effective income tax rate |
21.7 | % | 19.6 | % | (6.7 | )% | ||||||
|
|
|
|||||||||||
The effective income tax rate for 2014 was 21.7% compared to 19.6% for 2013. The increase in the effective income tax rate was primarily due to additional income taxes on the incremental income from the Wireless Transaction completed on February 21, 2014 and was partially offset by the utilization of certain tax credits in connection with the Omnitel Transaction in 2014 and the effective income tax rate impact of lower income before income taxes due to severance, pension and benefit charges recorded in 2014 compared to severance, pension and benefit credits recorded in 2013. The decrease in the provision for income taxes was primarily due to lower income before income taxes due to severance, pension and benefit charges recorded in 2014 compared to severance, pension and benefit credits recorded in 2013.
The effective income tax rate for 2013 was 19.6% compared to (6.7)% for 2012. The increase in the effective income tax rate and provision for income taxes was primarily due to higher income before income taxes as a result of severance, pension and benefit credits recorded during 2013 compared to lower income before income taxes as a result of severance, pension and benefit charges as well as early debt redemption costs recorded during 2012.
The amounts of cash taxes paid are as follows:
| (dollars in millions) | ||||||||||||
| Years Ended December 31, | 2014 | 2013 | 2012 | |||||||||
| Income taxes, net of amounts refunded |
$ | 4,093 | $ | 422 | $ | 351 | ||||||
| Employment taxes |
1,290 | 1,282 | 1,308 | |||||||||
| Property and other taxes |
1,797 | 2,082 | 1,727 | |||||||||
|
|
|
|||||||||||
| Total |
$ | 7,180 | $ | 3,786 | $ | 3,386 | ||||||
|
|
|
|||||||||||
Deferred taxes arise because of differences in the book and tax bases of certain assets and liabilities. The presentation of significant components of deferred tax assets and liabilities is updated to reflect the Wireless Transaction. Significant components of deferred tax assets and liabilities are as follows:
| (dollars in millions) | ||||||||
| At December 31, | 2014 | 2013 | ||||||
| Employee benefits |
$ | 13,350 | $ | 10,413 | ||||
| Tax loss and credit carry forwards |
2,255 | 2,912 | ||||||
| Other – assets |
2,247 | 1,783 | ||||||
|
|
|
|||||||
| 17,852 | 15,108 | |||||||
| Valuation allowances |
(1,841 | ) | (1,685 | ) | ||||
|
|
|
|||||||
| Deferred tax assets |
16,011 | 13,423 | ||||||
|
|
|
|||||||
| Spectrum and other intangible amortization |
28,283 | 18,280 | ||||||
| Depreciation |
23,423 | 18,913 | ||||||
| Other – liabilities |
5,754 | 4,315 | ||||||
|
|
|
|||||||
| Deferred tax liabilities |
57,460 | 41,508 | ||||||
|
|
|
|||||||
| Net deferred tax liability |
$ | 41,449 | $ | 28,085 | ||||
|
|
|
|||||||
At December 31, 2014, undistributed earnings of our foreign subsidiaries indefinitely invested outside the United States amounted to approximately $1.3 billion. The majority of Verizon’s cash flow is generated from domestic operations and we are not dependent on foreign cash or earnings to meet our funding requirements, nor do we intend to repatriate these undistributed foreign earnings to fund U.S. operations. Furthermore, a portion of these undistributed earnings represent amounts that legally must be kept in reserve in accordance with certain foreign jurisdictional requirements and are unavailable for distribution or repatriation. As a result, we have not provided U.S. deferred taxes on these undistributed earnings because we intend that they will remain indefinitely reinvested outside of the United States and therefore unavailable for use in funding U.S. operations. Determination of the amount of unrecognized deferred taxes related to these undistributed earnings is not practicable.
At December 31, 2014, we had net after-tax loss and credit carry forwards for income tax purposes of approximately $2.3 billion. Of these net after-tax loss and credit carry forwards, approximately $1.8 billion will expire between 2015 and 2034 and approximately $0.5 billion may be carried forward indefinitely.
During 2014, the valuation allowance increased approximately $0.2 billion. The balance of the valuation allowance at December 31, 2014 and the 2014 activity is primarily related to state and foreign tax losses.
Unrecognized Tax Benefits
A reconciliation of the beginning and ending balance of unrecognized tax benefits is as follows:
| (dollars in millions) | ||||||||||||
| 2014 | 2013 | 2012 | ||||||||||
| Balance at January 1, |
$ | 2,130 | $ | 2,943 | $ | 3,078 | ||||||
| Additions based on tax positions related to the current year |
80 | 116 | 131 | |||||||||
| Additions for tax positions of prior years |
627 | 250 | 92 | |||||||||
| Reductions for tax positions of prior years |
(278 | ) | (801 | ) | (415 | ) | ||||||
| Settlements |
(239 | ) | (210 | ) | 100 | |||||||
| Lapses of statutes of limitations |
(497 | ) | (168 | ) | (43 | ) | ||||||
|
|
|
|||||||||||
| Balance at December 31, |
$ | 1,823 | $ | 2,130 | $ | 2,943 | ||||||
|
|
|
|||||||||||
Included in the total unrecognized tax benefits at December 31, 2014, 2013 and 2012 is $1.3 billion, $1.4 billion and $2.1 billion, respectively, that if recognized, would favorably affect the effective income tax rate.
We recognized the following net after-tax benefits related to interest and penalties in the provision for income taxes:
| Years Ended December 31, | (dollars in millions) | |||
| 2014 |
$ | 92 | ||
| 2013 |
33 | |||
| 2012 |
82 | |||
The after-tax accruals for the payment of interest and penalties in the consolidated balance sheets are as follows:
| At December 31, | (dollars in millions) | |||
| 2014 |
$ | 169 | ||
| 2013 |
274 | |||
The decrease in unrecognized tax benefits was primarily due to the resolution of issues with the Internal Revenue Service (IRS) involving tax years 2007 through 2009, and was partially offset by an increase in unrecognized tax benefits related to the Wireless Transaction. The uncertain tax benefits related to the Wireless Transaction concern pre-acquisition tax controversies and are the subject of an indemnity from Vodafone for which a corresponding indemnity asset has been established.
Verizon and/or its subsidiaries file income tax returns in the U.S. federal jurisdiction, and various state, local and foreign jurisdictions. As a large taxpayer, we are under audit by the IRS and multiple state and foreign jurisdictions for various open tax years. The IRS is currently examining the Company’s U.S. income tax returns for tax years 2010-2012 and Cellco Partnership’s U.S. income tax returns for tax years 2012-2013. Significant tax controversies are ongoing in Massachusetts for tax years as early as 2001. The amount of the liability for unrecognized tax benefits will change in the next twelve months due to the expiration of the statute of limitations in various jurisdictions and it is reasonably possible that various current tax examinations will conclude or require reevaluations of the Company’s tax positions during this period. An estimate of the range of the possible change cannot be made until these tax matters are further developed or resolved.
Note 14
| Segment Information |
Reportable Segments
We have two reportable segments, which we operate and manage as strategic business units and organize by products and services. We measure and evaluate our reportable segments based on segment operating income, consistent with the chief operating decision maker’s assessment of segment performance.
Corporate, eliminations and other includes unallocated corporate expenses, intersegment eliminations recorded in consolidation, the results of other businesses, such as our investments in unconsolidated businesses, pension and other employee benefit related costs, lease financing, as well as the historical results of divested operations, other adjustments and gains and losses that are not allocated in assessing segment performance due to their non-operational nature. Although such transactions are excluded from the business segment results, they are included in reported consolidated earnings. Gains and losses that are not individually significant are included in all segment results as these items are included in the chief operating decision maker’s assessment of segment performance. Effective January 1, 2014, we have also reclassified the results of certain businesses, such as development stage businesses that support our strategic initiatives, from our Wireline segment to Corporate, eliminations and other. The impact of this reclassification was not material to our consolidated financial statements or our segment results of operations.
On July 1, 2014, our Wireline segment sold a non-strategic business (see Note 2). Accordingly, the historical Wireline results for these operations have been reclassified to Corporate, eliminations and other to reflect comparable segment operating results.
The reconciliation of segment operating revenues and expenses to consolidated operating revenues and expenses below also includes those items of a non-operational nature. We exclude from segment results the effects of certain items that management does not consider in assessing segment performance, primarily because of their non-operational nature.
We have adjusted prior period consolidated and segment information, where applicable, to conform to current year presentation.
Our segments and their principal activities consist of the following:
| Segment | Description | |
| Wireless |
Wireless’ communications products and services include wireless voice and data services and equipment sales, which are provided to consumer, business and government customers across the United States. | |
| Wireline |
Wireline’s voice, data and video communications products and enhanced services include broadband video and data, corporate networking solutions, data center and cloud services, security and managed network services and local and long distance voice services. We provide these products and services to consumers in the United States, as well as to carriers, businesses and government customers both in the United States and around the world. | |
The following table provides operating financial information for our two reportable segments:
| (dollars in millions) | ||||||||||||
| 2014 | Wireless | Wireline | Total Segments | |||||||||
| External Operating Revenues |
||||||||||||
| Retail service |
$ | 69,451 | $ | – | $ | 69,451 | ||||||
| Other service |
3,104 | – | 3,104 | |||||||||
|
|
|
|||||||||||
| Service revenue |
72,555 | – | 72,555 | |||||||||
| Equipment |
10,957 | – | 10,957 | |||||||||
| Other |
4,021 | – | 4,021 | |||||||||
| Consumer retail |
– | 15,583 | 15,583 | |||||||||
| Small business |
– | 2,464 | 2,464 | |||||||||
|
|
|
|||||||||||
| Mass Markets |
– | 18,047 | 18,047 | |||||||||
| Strategic services |
– | 8,318 | 8,318 | |||||||||
| Core |
– | 5,355 | 5,355 | |||||||||
|
|
|
|||||||||||
| Global Enterprise |
– | 13,673 | 13,673 | |||||||||
| Global Wholesale |
– | 5,240 | 5,240 | |||||||||
| Other |
– | 462 | 462 | |||||||||
| Intersegment revenues |
113 | 1,007 | 1,120 | |||||||||
|
|
|
|||||||||||
| Total operating revenues |
87,646 | 38,429 | 126,075 | |||||||||
| Cost of services and sales |
28,825 | 21,332 | 50,157 | |||||||||
| Selling, general and administrative expense |
23,602 | 8,180 | 31,782 | |||||||||
| Depreciation and amortization expense |
8,459 | 7,882 | 16,341 | |||||||||
|
|
|
|||||||||||
| Total operating expenses |
60,886 | 37,394 | 98,280 | |||||||||
|
|
|
|||||||||||
| Operating income |
$ | 26,760 | $ | 1,035 | $ | 27,795 | ||||||
|
|
|
|||||||||||
| Assets |
$ | 160,385 | $ | 76,673 | $ | 237,058 | ||||||
| Plant, property and equipment, net |
38,276 | 50,318 | 88,594 | |||||||||
| Capital expenditures |
10,515 | 5,750 | 16,265 | |||||||||
| (dollars in millions) | ||||||||||||
| 2013 | Wireless | Wireline | Total Segments | |||||||||
| External Operating Revenues |
||||||||||||
| Retail service |
$ | 66,282 | $ | – | $ | 66,282 | ||||||
| Other service |
2,691 | – | 2,691 | |||||||||
|
|
|
|||||||||||
| Service revenue |
68,973 | – | 68,973 | |||||||||
| Equipment |
8,096 | – | 8,096 | |||||||||
| Other |
3,851 | – | 3,851 | |||||||||
| Consumer retail |
– | 14,842 | 14,842 | |||||||||
| Small business |
– | 2,537 | 2,537 | |||||||||
|
|
|
|||||||||||
| Mass Markets |
– | 17,379 | 17,379 | |||||||||
| Strategic services |
– | 8,129 | 8,129 | |||||||||
| Core |
– | 6,028 | 6,028 | |||||||||
|
|
|
|||||||||||
| Global Enterprise |
– | 14,157 | 14,157 | |||||||||
| Global Wholesale |
– | 5,583 | 5,583 | |||||||||
| Other |
– | 442 | 442 | |||||||||
| Intersegment revenues |
103 | 1,063 | 1,166 | |||||||||
|
|
|
|||||||||||
| Total operating revenues |
81,023 | 38,624 | 119,647 | |||||||||
| Cost of services and sales |
23,648 | 21,396 | 45,044 | |||||||||
| Selling, general and administrative expense |
23,176 | 8,571 | 31,747 | |||||||||
| Depreciation and amortization expense |
8,202 | 8,327 | 16,529 | |||||||||
|
|
|
|||||||||||
| Total operating expenses |
55,026 | 38,294 | 93,320 | |||||||||
|
|
|
|||||||||||
| Operating income |
$ | 25,997 | $ | 330 | $ | 26,327 | ||||||
|
|
|
|||||||||||
| Assets |
$ | 146,429 | $ | 84,573 | $ | 231,002 | ||||||
| Plant, property and equipment, net |
35,932 | 51,885 | 87,817 | |||||||||
| Capital expenditures |
9,425 | 6,229 | 15,654 | |||||||||
| (dollars in millions) | ||||||||||||
| 2012 | Wireless | Wireline | Total Segments | |||||||||
| External Operating Revenues |
||||||||||||
| Retail service |
$ | 61,383 | $ | – | $ | 61,383 | ||||||
| Other service |
2,290 | – | 2,290 | |||||||||
|
|
|
|||||||||||
| Service revenue |
63,673 | – | 63,673 | |||||||||
| Equipment |
8,010 | – | 8,010 | |||||||||
| Other |
4,096 | – | 4,096 | |||||||||
| Consumer retail |
– | 14,145 | 14,145 | |||||||||
| Small business |
– | 2,589 | 2,589 | |||||||||
|
|
|
|||||||||||
| Mass Markets |
– | 16,734 | 16,734 | |||||||||
| Strategic services |
– | 7,737 | 7,737 | |||||||||
| Core |
– | 6,833 | 6,833 | |||||||||
|
|
|
|||||||||||
| Global Enterprise |
– | 14,570 | 14,570 | |||||||||
| Global Wholesale |
– | 6,031 | 6,031 | |||||||||
| Other |
– | 498 | 498 | |||||||||
| Intersegment revenues |
89 | 1,112 | 1,201 | |||||||||
|
|
|
|||||||||||
| Total operating revenues |
75,868 | 38,945 | 114,813 | |||||||||
| Cost of services and sales |
24,490 | 21,657 | 46,147 | |||||||||
| Selling, general and administrative expense |
21,650 | 8,860 | 30,510 | |||||||||
| Depreciation and amortization expense |
7,960 | 8,424 | 16,384 | |||||||||
|
|
|
|||||||||||
| Total operating expenses |
54,100 | 38,941 | 93,041 | |||||||||
|
|
|
|||||||||||
| Operating income |
$ | 21,768 | $ | 4 | $ | 21,772 | ||||||
|
|
|
|||||||||||
| Assets |
$ | 142,485 | $ | 84,815 | $ | 227,300 | ||||||
| Plant, property and equipment, net |
34,545 | 52,911 | 87,456 | |||||||||
| Capital expenditures |
8,857 | 6,342 | 15,199 | |||||||||
Reconciliation to Consolidated Financial Information
A reconciliation of the segment operating revenues to consolidated operating revenues is as follows:
| (dollars in millions) | ||||||||||||
| Years Ended December 31, | 2014 | 2013 | 2012 | |||||||||
| Operating Revenues |
||||||||||||
| Total reportable segments |
$ | 126,075 | $ | 119,647 | $ | 114,813 | ||||||
| Reconciling items: |
||||||||||||
| Impact of divested operations (Note 2) |
256 | 599 | 835 | |||||||||
| Corporate, eliminations and other |
748 | 304 | 198 | |||||||||
|
|
|
|||||||||||
| Consolidated operating revenues |
$ | 127,079 | $ | 120,550 | $ | 115,846 | ||||||
|
|
|
|||||||||||
A reconciliation of the total of the reportable segments’ operating income to consolidated Income before (provision) benefit for income taxes is as follows:
| (dollars in millions) | ||||||||||||
| Years Ended December 31, | 2014 | 2013 | 2012 | |||||||||
| Operating Income |
||||||||||||
| Total segment operating income |
$ | 27,795 | $ | 26,327 | $ | 21,772 | ||||||
| Severance, pension and benefit credits (charges) (Note 12) |
(7,507 | ) | 6,232 | (7,186 | ) | |||||||
| Gain on spectrum license transactions (Note 2) |
707 | 278 | – | |||||||||
| Litigation settlements (Note 17) |
– | – | (384 | ) | ||||||||
| Impact of divested operations (Note 2) |
12 | 43 | 56 | |||||||||
| Other costs |
(334 | ) | – | (276 | ) | |||||||
| Corporate, eliminations and other |
(1,074 | ) | (912 | ) | (822 | ) | ||||||
|
|
|
|||||||||||
| Consolidated operating income |
19,599 | 31,968 | 13,160 | |||||||||
| Equity in earnings of unconsolidated businesses |
1,780 | 142 | 324 | |||||||||
| Other income and (expense), net |
(1,194 | ) | (166 | ) | (1,016 | ) | ||||||
| Interest expense |
(4,915 | ) | (2,667 | ) | (2,571 | ) | ||||||
|
|
|
|||||||||||
| Income Before (Provision) Benefit for Income Taxes |
$ | 15,270 | $ | 29,277 | $ | 9,897 | ||||||
|
|
|
|||||||||||
A reconciliation of the total of the reportable segments’ assets to consolidated assets is as follows:
| (dollars in millions) | ||||||||
| At December 31, | 2014 | 2013 | ||||||
| Assets |
||||||||
| Total reportable segments |
$ | 237,058 | $ | 231,002 | ||||
| Corporate, eliminations and other |
(4,350 | ) | 43,096 | |||||
|
|
|
|||||||
| Total consolidated |
$ | 232,708 | $ | 274,098 | ||||
|
|
|
|||||||
Corporate, eliminations and other at December 31, 2013 is primarily comprised of cash and cash equivalents which were used to complete the Wireless Transaction on February 21, 2014.
We generally account for intersegment sales of products and services and asset transfers at current market prices. No single customer accounted for more than 10% of our total operating revenues during the years ended December 31, 2014, 2013 and 2012. International operating revenues and long-lived assets are not significant.
Note 15
| Comprehensive Income |
Comprehensive income consists of net income and other gains and losses affecting equity that, under U.S. GAAP, are excluded from net income. Significant changes in the components of Other comprehensive income, net of provision for income taxes are described below.
Accumulated Other Comprehensive Income
The changes in the balances of Accumulated other comprehensive income by component are as follows:
| (dollars in millions) | Foreign currency translation adjustments |
Unrealized loss on cash flow hedges |
Unrealized loss on |
Defined benefit pension and |
Total | |||||||||||||||
| Balance at January 1, 2014 |
$ | 853 | $ | 113 | $ | 117 | $ | 1,275 | $ | 2,358 | ||||||||||
| Other comprehensive income (loss) |
(288 | ) | (89 | ) | 14 | – | (363 | ) | ||||||||||||
| Amounts reclassified to net income |
(911 | ) | (108 | ) | (19 | ) | 154 | (884 | ) | |||||||||||
|
|
|
|||||||||||||||||||
| Net other comprehensive income (loss) |
(1,199 | ) | (197 | ) | (5 | ) | 154 | (1,247 | ) | |||||||||||
|
|
|
|||||||||||||||||||
| Balance at December 31, 2014 |
$ | (346 | ) | $ | (84 | ) | $ | 112 | $ | 1,429 | $ | 1,111 | ||||||||
|
|
|
|||||||||||||||||||
The amounts presented above in net other comprehensive income (loss) are net of taxes and noncontrolling interests, which are not significant. For the year ended December 31, 2014, the amounts reclassified to net income related to foreign currency translation adjustments are included in Equity in earnings of unconsolidated businesses on our consolidated statement of income and are a result of the completion of the Omnitel transaction. See Note 2 for additional details. For the year ended December 31, 2014, the amounts reclassified to net income related to defined benefit pension and postretirement plans in the table above are included in Cost of services and sales and Selling, general and administrative expense on our consolidated statement of income. For the year ended December 31, 2014, all other amounts reclassified to net income in the table above are included in Other income and (expense), net on our consolidated statement of income.
Foreign Currency Translation Adjustments
The change in Foreign currency translation adjustments during 2014 was primarily a result of the completion of the Omnitel transaction. The change in Foreign currency translation adjustments during 2013 and 2012 was primarily related to our investment in Vodafone Omnitel N.V. which was driven by the movements of the U.S. dollar against the Euro.
Net Unrealized Gains (Losses) on Cash Flow Hedges
During 2014, 2013 and 2012, Unrealized gains (losses) on cash flow hedges included in Other comprehensive income (loss) attributable to noncontrolling interests, primarily reflect activity related to cross currency swaps (see Note 10). Reclassification adjustments for gains (losses) realized in net income were not significant.
Net Unrealized Gains (Losses) on Marketable Securities
During 2014, 2013 and 2012, reclassification adjustments on marketable securities for gains (losses) realized in net income were not significant.
Defined Benefit Pension and Postretirement Plans
The change in Defined benefit pension and postretirement plans at December 31, 2014 and 2013, respectively, was not significant.
Note 16
| Additional Financial Information |
The tables that follow provide additional financial information related to our consolidated financial statements:
Income Statement Information
| (dollars in millions) | ||||||||||||
| Years Ended December 31, | 2014 | 2013 | 2012 | |||||||||
| Depreciation expense |
$ | 14,966 | $ | 15,019 | $ | 14,920 | ||||||
| Interest costs on debt balances |
5,291 | 3,421 | 2,977 | |||||||||
| Capitalized interest costs |
(376 | ) | (754 | ) | (406 | ) | ||||||
| Advertising expense |
2,526 | 2,438 | 2,381 | |||||||||
Balance Sheet Information
| (dollars in millions) | ||||||||
| At December 31, | 2014 | 2013 | ||||||
| Accounts Payable and Accrued Liabilities |
||||||||
| Accounts payable |
$ | 5,598 | $ | 4,954 | ||||
| Accrued expenses |
4,016 | 3,954 | ||||||
| Accrued vacation, salaries and wages |
4,131 | 4,790 | ||||||
| Interest payable |
1,478 | 1,199 | ||||||
| Taxes payable |
1,457 | 1,556 | ||||||
|
|
|
|||||||
| $ | 16,680 | $ | 16,453 | |||||
|
|
|
|||||||
| Other Current Liabilities |
||||||||
| Advance billings and customer deposits |
$ | 3,125 | $ | 2,829 | ||||
| Dividends payable |
2,307 | 1,539 | ||||||
| Other |
3,217 | 2,296 | ||||||
|
|
|
|||||||
| $ | 8,649 | $ | 6,664 | |||||
|
|
|
|||||||
Cash Flow Information
| (dollars in millions) | ||||||||||||
| Years Ended December 31, | 2014 | 2013 | 2012 | |||||||||
| Cash Paid |
||||||||||||
| Interest, net of amounts capitalized |
$ | 4,429 | $ | 2,122 | $ | 1,971 | ||||||
Common stock has been used from time to time to satisfy some of the funding requirements of employee and shareowner plans, including 18.2 million common shares issued from Treasury stock during the year ended December 31, 2014, which had an aggregate value of $0.7 billion.
In addition to the previously authorized three-year share buyback program, in February 2015, the Verizon Board of Directors authorized Verizon to enter into an accelerated share repurchase (ASR) agreement to repurchase $5.0 billion of the Company’s common stock. The total number of shares that Verizon will repurchase under the ASR agreement will be based generally upon the volume-weighted average share price of Verizon’s common stock during the term of the transaction. On February 10, 2015, in exchange for an up-front payment totaling $5.0 billion, Verizon received an initial delivery of 86.2 million shares having a value of approximately $4.25 billion. Final settlement of the transaction under the ASR agreement, including delivery of the remaining shares, if any, that Verizon is entitled to receive, is scheduled to occur in the second quarter of 2015.
Note 17
| Commitments and Contingencies |
In the ordinary course of business Verizon is involved in various commercial litigation and regulatory proceedings at the state and federal level. Where it is determined, in consultation with counsel based on litigation and settlement risks, that a loss is probable and estimable in a given matter, the Company establishes an accrual. In none of the currently pending matters is the amount of accrual material. An estimate of the reasonably possible loss or range of loss in excess of the amounts already accrued cannot be made at this time due to various factors typical in contested proceedings, including (1) uncertain damage theories and demands; (2) a less than complete factual record; (3) uncertainty concerning legal theories and their resolution by courts or regulators; and (4) the unpredictable nature of the opposing party and its demands. We continuously monitor these proceedings as they develop and adjust any accrual or disclosure as needed. We do not expect that the ultimate resolution of any pending regulatory or legal matter in future periods, including the Hicksville matter described below, will have a material effect on our financial condition, but it could have a material effect on our results of operations for a given reporting period.
Reserves have been established to cover environmental matters relating to discontinued businesses and past telecommunications activities. These reserves include funds to address contamination at the site of a former Sylvania facility in Hicksville NY, which had processed nuclear fuel rods in the 1950s and 1960s. In September 2005, the Army Corps of Engineers (ACE) accepted the site into its Formerly Utilized Sites Remedial Action Program. As a result, the ACE has taken primary responsibility for addressing the contamination at the site. An adjustment to the reserves may be made after a cost allocation is conducted with respect to the past and future expenses of all of the parties. Adjustments to the environmental reserve may also be made based upon the actual conditions found at other sites requiring remediation.
Verizon is currently involved in approximately 70 federal district court actions alleging that Verizon is infringing various patents. Most of these cases are brought by non-practicing entities and effectively seek only monetary damages; a small number are brought by companies that have sold products and seek injunctive relief as well. These cases have progressed to various stages and a small number may go to trial in the coming 12 months if they are not otherwise resolved. In the third quarter of 2012, we settled a number of patent litigation matters, including cases with ActiveVideo Networks Inc. (ActiveVideo) and TiVo Inc. (TiVo). In connection with the settlements with ActiveVideo and TiVo, we recorded a charge of $0.4 billion in the third quarter of 2012 and will pay and recognize over the following six years an additional $0.2 billion.
In connection with the execution of agreements for the sales of businesses and investments, Verizon ordinarily provides representations and warranties to the purchasers pertaining to a variety of nonfinancial matters, such as ownership of the securities being sold, as well as indemnity from certain financial losses. From time to time, counterparties may make claims under these provisions, and Verizon will seek to defend against those claims and resolve them in the ordinary course of business.
Subsequent to the sale of Verizon Information Services Canada in 2004, we continue to provide a guarantee to publish directories, which was issued when the directory business was purchased in 2001 and had a 30-year term (before extensions). The preexisting guarantee continues, without modification, despite the subsequent sale of Verizon Information Services Canada and the spin-off of our domestic print and Internet yellow pages directories business. The possible financial impact of the guarantee, which is not expected to be adverse, cannot be reasonably estimated as a variety of the potential outcomes available under the guarantee result in costs and revenues or benefits that may offset each other. We do not believe performance under the guarantee is likely.
As of December 31, 2014, letters of credit totaling approximately $0.1 billion, which were executed in the normal course of business and support several financing arrangements and payment obligations to third parties, were outstanding.
We have several commitments primarily to purchase programming and network services, equipment, software, handsets and peripherals, and marketing activities, which will be used or sold in the ordinary course of business, from a variety of suppliers totaling $21.0 billion. Of this total amount, $8.4 billion is attributable to 2015, $8.5 billion is attributable to 2016 through 2017, $2.5 billion is attributable to 2018 through 2019 and $1.6 billion is attributable to years thereafter. These amounts do not represent our entire anticipated purchases in the future, but represent only those items that are the subject of contractual obligations. Our commitments are generally determined based on the noncancelable quantities or termination amounts. Purchases against our commitments for 2014 totaled approximately $21.0 billion. Since the commitments to purchase programming services from television networks and broadcast stations have no minimum volume requirement, we estimated our obligation based on number of subscribers at December 31, 2014, and applicable rates stipulated in the contracts in effect at that time. We also purchase products and services as needed with no firm commitment.
Note 18
| Quarterly Financial Information (Unaudited) |
| (dollars in millions, except per share amounts) | ||||||||||||||||||||||||
| Net Income (Loss) attributable to Verizon(1) | ||||||||||||||||||||||||
| Quarter Ended | Operating Revenues |
Operating Income (Loss) |
Amount | Per Share- Basic |
Per Share- Diluted |
Net Income (Loss) |
||||||||||||||||||
| 2014 |
||||||||||||||||||||||||
| March 31 |
$ | 30,818 | $ | 7,160 | $ | 3,947 | $ | 1.15 | $ | 1.15 | $ | 5,986 | ||||||||||||
| June 30 |
31,483 | 7,685 | 4,214 | 1.02 | 1.01 | 4,324 | ||||||||||||||||||
| September 30 |
31,586 | 6,890 | 3,695 | .89 | .89 | 3,794 | ||||||||||||||||||
| December 31 |
33,192 | (2,136 | ) | (2,231 | ) | (.54 | ) | (.54 | ) | (2,148) | ||||||||||||||
| 2013 |
||||||||||||||||||||||||
| March 31 |
$ | 29,420 | $ | 6,222 | $ | 1,952 | $ | .68 | $ | .68 | $ | 4,855 | ||||||||||||
| June 30 |
29,786 | 6,555 | 2,246 | .78 | .78 | 5,198 | ||||||||||||||||||
| September 30 |
30,279 | 7,128 | 2,232 | .78 | .78 | 5,578 | ||||||||||||||||||
| December 31 |
31,065 | 12,063 | 5,067 | 1.77 | 1.76 | 7,916 | ||||||||||||||||||
| • | Results of operations for the first quarter of 2014 include after-tax-credits attributable to Verizon of $1.9 billion related to the sale of its entire ownership interest in Vodafone Omnitel, as well as after-tax costs attributable to Verizon of $0.6 billion related to early debt redemptions and $0.3 billion related to the Wireless Transaction. |
| • | Results of operations for the second quarter of 2014 include after-tax credits attributable to Verizon of $0.4 billion related to a gain on spectrum license transactions. |
| • | Results of operations for the fourth quarter of 2014 include after-tax charges attributable to Verizon of $4.7 billion related to severance, pension and benefit charges, as well as after-tax costs attributable to Verizon of $0.5 billion related to early debt redemption and other costs. |
| • | Results of operations for the second quarter of 2013 include after-tax credits attributable to Verizon of $0.1 billion related to a pension remeasurement. |
| • | Results of operations for the third quarter of 2013 include immaterial after-tax credits attributable to Verizon related to a gain on a spectrum license transaction, as well as immaterial after-tax costs attributable to Verizon related to the Wireless Transaction. |
| • | Results of operations for the fourth quarter of 2013 include after-tax credits attributable to Verizon of $3.7 billion related to severance, pension and benefit credits, as well as after-tax costs attributable to Verizon of $0.5 billion related to the Wireless Transaction. |
| (1) | Net income (loss) attributable to Verizon per common share is computed independently for each quarter and the sum of the quarters may not equal the annual amount. |