Attached files
| file | filename |
|---|---|
| EX-99.1 - EX-99.1 - ARMSTRONG WORLD INDUSTRIES INC | d875284dex991.htm |
| EX-99.2 - EX-99.2 - ARMSTRONG WORLD INDUSTRIES INC | d875284dex992.htm |
| 8-K - FORM 8-K - ARMSTRONG WORLD INDUSTRIES INC | d875284d8k.htm |
| EX-99.3 - EX-99.3 - ARMSTRONG WORLD INDUSTRIES INC | d875284dex993.htm |
 Armstrong
World Industries
Investor
Presentation
February 23, 2015
Exhibit 99.4 |
 Our
disclosures
in
this
presentation,
including
without
limitation,
those
relating
to
future
financial
results
guidance
and
the
separation
of
our
flooring
business
from
our
building
products
business,
and
in
our
other
public
documents
and
comments
contain
forward-looking
statements
within
the
meaning
of
the
Private
Securities
Litigation
Reform
Act.
Those
statements
provide
our
future
expectations
or
forecasts
and
can
be
identified
by
our
use
of
words
such
as
"anticipate,"
"estimate,"
"expect,"
"project,"
"intend,"
"plan,"
"believe,"
"outlook,"
"target,"
"predict,"
"may,"
"will,"
"would,"
"could,"
"should,"
"seek,"
and
other
words
or
phrases
of
similar
meaning
in
connection
with
any
discussion
of
future
operating
or
financial
performance
or
the
separation
of
our
businesses.
Forward-looking
statements,
by
their
nature,
address
matters
that
are
uncertain
and
involve
risks
because
they
relate
to
events
and
depend
on
circumstances
that
may
or
may
not
occur
in
the
future.
A
more
detailed
discussion
of
the
risks
and
uncertainties
that
may
affect
our
ability
to
achieve
the
projected
performance
is
included
in
the
“Risk
Factors”
and
“Management’s
Discussion
and
Analysis”
sections
of
our
recent
reports
on
Forms
10-K
and
10-Q
filed
with
the
SEC.
As
a
result,
our
actual
results
may
differ
materially
from
our
expected
results
and
from
those
expressed
in
our
forward-looking
statements.
Forward-looking
statements
speak
only
as
of
the
date
they
are
made.
We
undertake
no
obligation
to
update
any
forward-looking
statements
beyond
what
is
required
under
applicable
securities
law.
The
information
in
this
presentation
is
only effective
as
of
the
date
given,
February
23,
2015,
and
is
subject
to
change.
Any
distribution
of
this
presentation
after
February 23,
2015
is
not
intended
and
will
not
be
construed
as
updating
or
confirming
such
information.
In
addition,
we
will
be
referring
to
“non-GAAP
financial
measures”
within
the
meaning
of
SEC
Regulation
G.
A
reconciliation
of
the
differences
between
these
measures
with
the
most
directly
comparable
financial
measures
calculated
in
accordance
with
GAAP
are
can
be
found
in
our
SEC
filings
and
on
the
Investor
Relations
section
of
our
website
at
www.armstrong.com.
Armstrong
competes
globally
in
many
diverse
markets.
References
to
"market"
or
"share"
data
are
simply
estimations
based
on
a
combination
of
internal
and
external
sources
and
assumptions.
They
are
intended
only
to
assist
discussion
of
the
relative
performance
of
product
segments
and
categories
for
marketing
and
related
purposes.
No
conclusion
has
been
reached
or
should
be
reached
regarding
a
"product
market,"
a
"geographic
market"
or
“market
share,”
as
such
terms
may
be
used
or
defined
for
any
economic,
legal
or
other
purpose.
Safe Harbor Statement |
 Basis
of Presentation Explanation •
When reporting our financial results within this presentation, we make several
adjustments. Management uses the non-GAAP measures below in managing the
business and believes the adjustments provide meaningful comparisons of
operating performance between periods. As reported results will be footnoted
throughout the presentation. •
We report in comparable dollars to remove
the effects of currency translation on the P&L.
The budgeted exchange rate for 2014 was
used for all currency translations in 2014 and
prior years. Guidance is presented using the
2015 budgeted exchange rate for the year.
•
We remove the impact of discrete expenses
and income. Examples include plant
closures, restructuring actions, and other
large
unusual
items.
We
also
remove
the
non-cash
impact
of
our
U.S.
Pension
Plan.
•
Taxes for normalized Net Income and EPS
are calculated using a constant 39% for 2014
results and 2015 guidance, which are based
on the expected full year historical tax rate.
All
figures
throughout
the
presentation
are
in
$
millions
unless
otherwise
noted.
Figures
may
not
add
due to rounding.
Comparable
Dollars
Other
Adjustments
Net Sales
Yes
No
Gross Profit
Yes
Yes
SG&A Expense
Yes
Yes
Equity Earnings
Yes
Yes
Operating Income
Yes
Yes
Net Income
Yes
Yes
Cash Flow
No
No
Return on Capital
Yes
Yes
EBITDA
Yes
Yes
What Items Are Adjusted |
 Investment Highlights
Diversified $2.5 billion global building products company
with leading positions in most key markets and products
Driving value creation through:
–
Recovery in North America
•
U.S. Commercial is our most profitable business
with
35-45% incremental margins
–
Growth in International Markets
•
Emerging market investments and
recovery in developed markets
–
Leveraging innovation to drive profitable growth
•
Focus on design, environmental leadership, installation
and application enhancements
•
New product benefits to drive improved mix
Focused on creating shareholder value |
 Global Business
Overview |
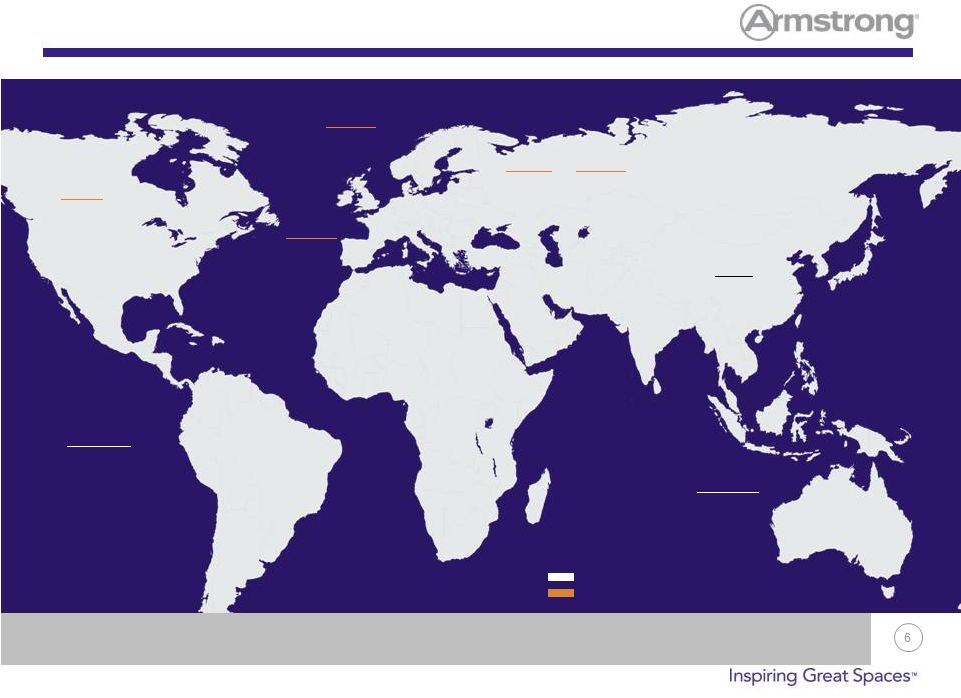 Armstrong’s Global Manufacturing Footprint
AUSTRALIA
Braeside
St. Helens, OR
Marietta, PA
Pensacola, FL
Somerset, KY
West Plains, MO
Jackson, MS
Vicksburg, MS
Millwood, WV
Hilliard, OH
Macon, GA
Beech Creek, PA
Titusville, PA
Lancaster, PA
Stillwater, OK
Jackson, TN
Oneida, TN
Beverly, WV
Warren, AR
South Gate, CA
Kankakee, IL
USA
Montreal
CANADA
Team Valley
Stafford
UK
Rankwell
AUSTRIA
Pontarlier
FRANCE
Munster
GERMANY
Wujiang*
Shanghai
CHINA
Ceilings has #1 share position in most geographies
Flooring has leading share positions in most geographies
* Two commercial flooring plants are also located in Wujiang
-
Flooring Plant
-
Ceilings Plant |
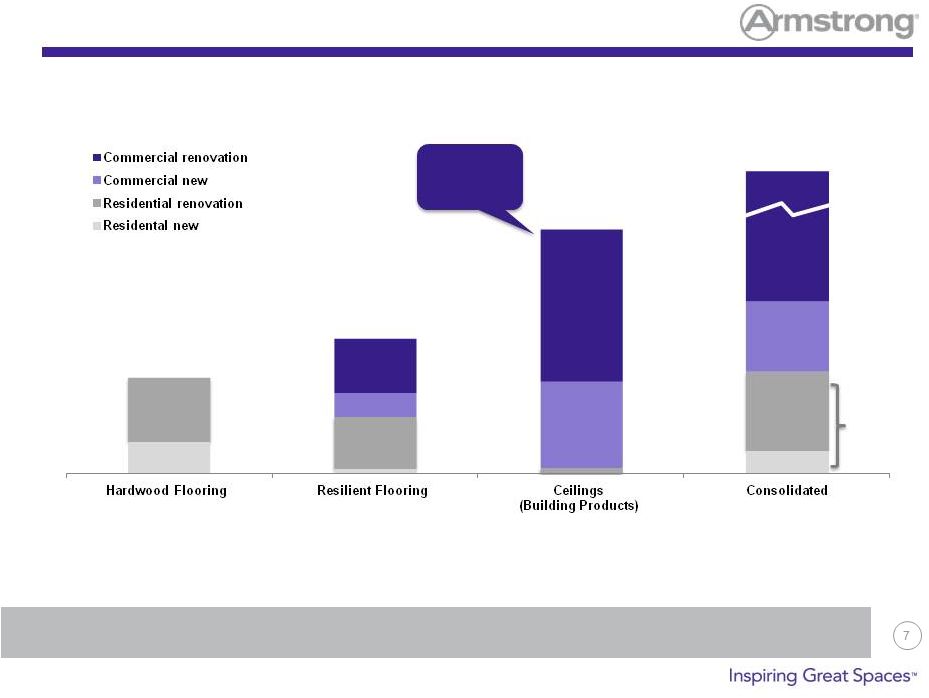 2014
Business Segment and End-Use Profile Diversified revenue profile across
products and end-use applications $715
$510
$1,290
$2,515
45%
20%
25%
10%
60%
35%
5%
65%
35%
40%
5%
40%
15%
North
America
Renovation in
Americas is
~80% |
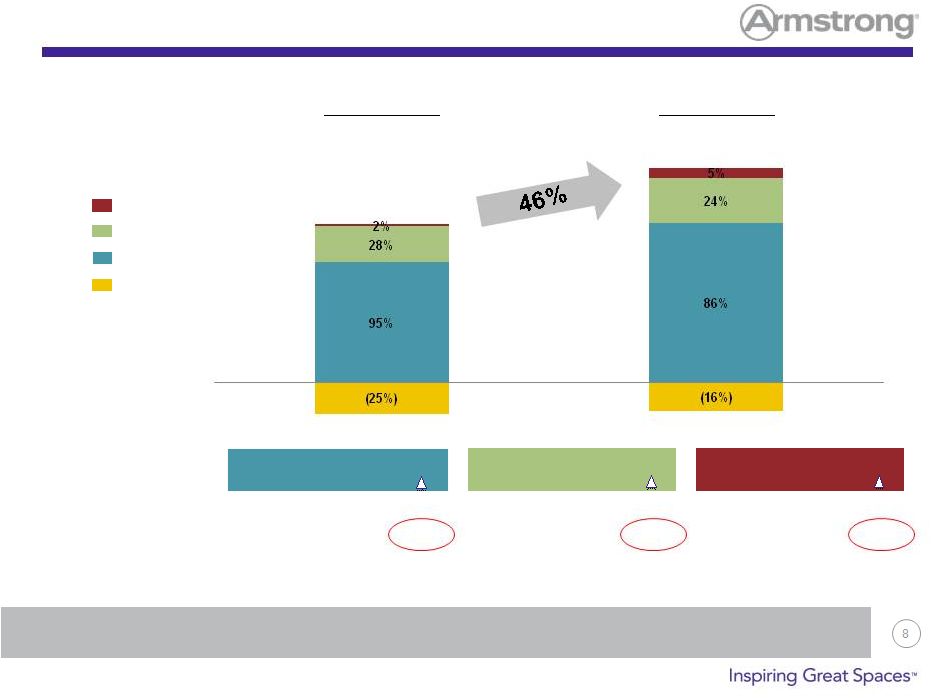 EBITDA
Performance EBITDA growth in all businesses despite challenging macro
environment 2010 EBITDA
2014 EBITDA
$384M
$263M
Worldwide Ceilings
Worldwide Resilient
Wood
2010
2014
2010
2014
2010
2014
Sales
$1.1B
$1.3B
14.1%
$735M
$715M
(2.6%)
$480M
$510M
6.4%
EBITDA as % of Sales
22%
26%
+ 350 bps
10%
13%
+ 290 bps
1%
4%
+ 320 bps
Worldwide Ceilings
Worldwide Resilient
Wood
Corporate |
 •
North American plants located in key
distribution areas
Over 20 plants in North America –
aids
in distribution, recycling of product and
customer relationships
•
Ability to capitalize on increased volume
Current plants are running at ~70%
capacity utilization; can support increase
in volume
A 10% increase in volume would require an
increase in production workforce by ~2%
35% –
45% incremental margins
•
Enormous base of existing installations
creates ability to leverage annuity stream
Positioned for a North American Commercial Recovery
Our most profitable market –
recovery drives strong earnings growth |
 •
Emerging markets growth investments
Completed three plants in China; 2
commercial flooring plants and mineral
fiber ceilings plant with co-located metal
manufacturing capability
Completed mineral fiber ceilings plant in
Russia
•
Global manufacturing footprint we need
for the coming years is in place
Remain confident on benefits of growth
in key markets, but timing uncertain
•
We have remained agile to market conditions
Ability to redeploy assets based on
regional opportunities
Positioned for Global Growth |
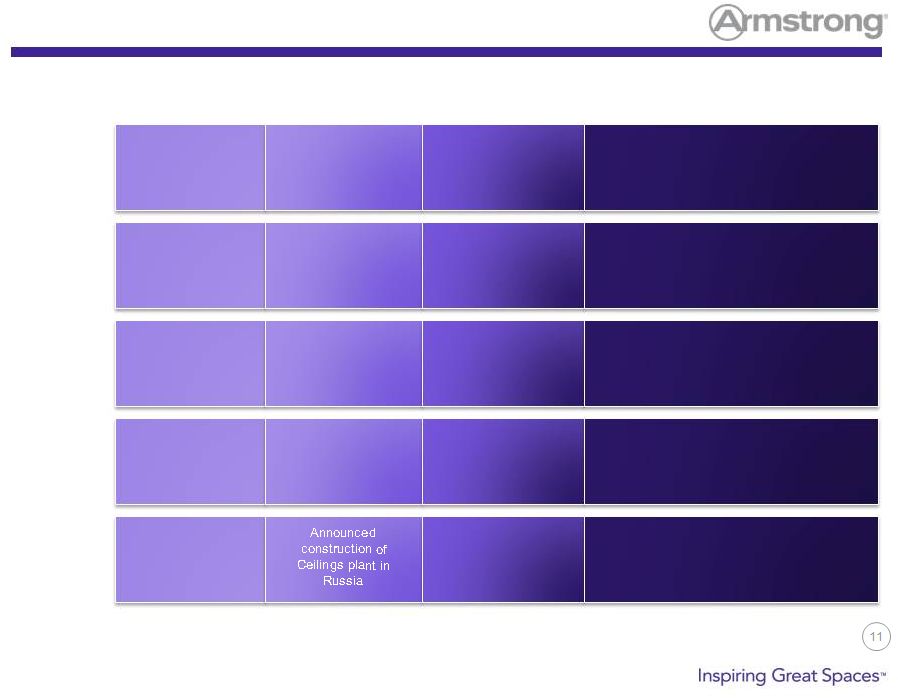 Historic Milestones
Cost
Management
Initiatives*
Capital
Market
Activity
Organic
Investment
Portfolio
Management
Management
2010
2011
2012
2013
2014
New CEO and CFO
Leverage recap
and $800M
special dividend
$500M special
dividend
Announced $150M
cost
out initiative
Cost
out
initiative
raised
to
$165M
and
then
$185M
Cost out initiative
concluded > $200M
in 2012
Simplex ceilings
acquisition
(Architectural
Specialties)
Divestiture of
Cabinets and
Patriot flooring
distribution
businesses
Announced organic
investment in emerging
markets –
began construction of 3
plants in China
New global
Ceilings CEO
New CFO and global Flooring CEO
Both internal promotions
Delivered $50M in manufacturing
productivity in 2013 and 2014 combined
Growth through focus on innovation,
product adjacencies and design.
Exited European Flooring business in
December of 2014
Completed 3 plants in China
Completed Russia plant in early 2015
Announced North American LVT
manufacturing investment with expected
completion in 2015
Repurchased
~5M shares ($260M)
in third quarter of 2013
* Discrete cost out program spanning 2010 through 2012 included Cabinets and
European Flooring business |
 12
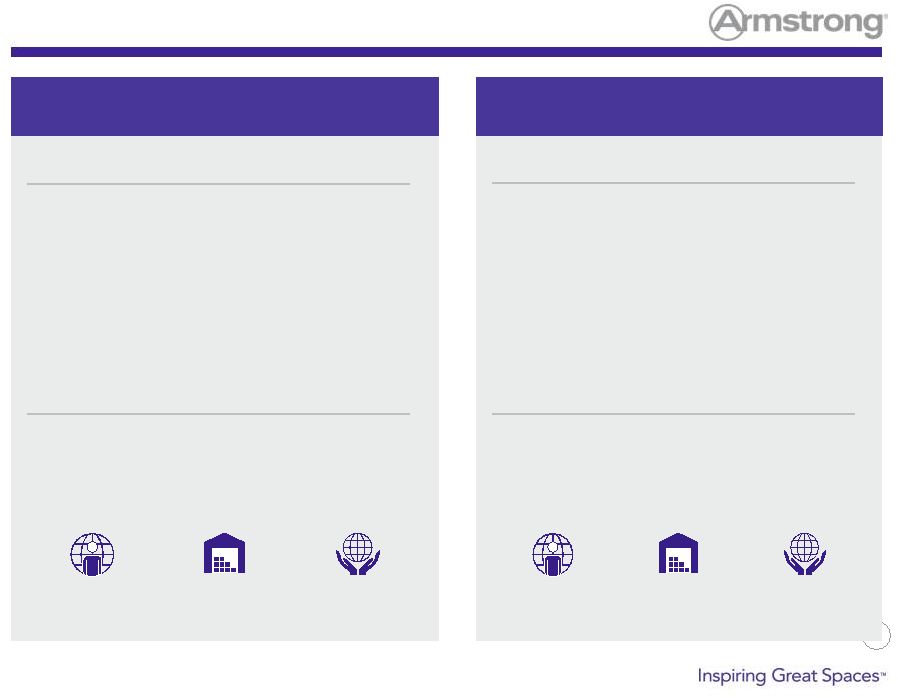
Creating Two Independent Industry Leaders
[Armstrong World Industries]
•
Global commercial suspended ceiling solutions provider
•
#1 market position in all major geographies
•
Poised to deliver margin expansion driven by recovery in
North American commercial
•
Recently completed investments in expanded sales and
manufacturing capabilities
•
Attractive opportunities for enhanced growth and margins,
including emerging markets
•
23 year WAVE JV delivered $68M of cash dividends and
$65M of equity earnings in 2014
Vic Grizzle
Chief Executive Officer
Key Statistics (2014 Year End)
$1.3B (95/5)
Revenue
(% Commercial vs. Residential)
$330M
*
Adjusted EBITDA
~3,400
Team Members
Worldwide
22
Manufacturing Facilities
in 8
Countries
†
100+
Countries Have Armstrong
Ceilings
[Armstrong Flooring ]
•
Dedicated hard surface flooring products designer and
manufacturer
•
Substantial margin expansion, driven by mix and
operating leverage
•
Positioned to benefit from expected recovery in North
American commercial
•
Significant growth opportunity in Asia
•
Well-positioned for both residential and non-residential
cyclical recoveries
Don Maier
Chief Executive Officer
Key Statistics (2014 Year End)
$1.2B (35/65)
Revenue
(% Commercial vs. Residential)
$114M
*
Adjusted EBITDA
~3,600
Team Members
Worldwide
17
Manufacturing Facilities
in 3
Countries
8,000,000+
Annual Visitors to
Global Websites
*Does not include unallocated corporate expense of $60 million
†
Including the WAVE JV |
 •
Final approval of Armstrong’s Board of Directors
•
Receipt of opinion of counsel regarding the tax-free nature of the
separation •
Effectiveness of a Form S-1 filing with the Securities and Exchange
Commission
Principal
Closing
Conditions
Separation Details
•
Expected tax-free spin-off of AFP to current AWI shareholders
•
Expected completion in the first quarter of 2016, subject to customary
conditions
Structure and
Timing
•
Separation Management Office (SMO) to lead transition planning
•
Expect to enter into intercompany agreements for certain shared services
Transition
Management |
          Operational
•
Little overlap, no significant
synergies from operating as
combined entity
•
Enhances ability to address
unique customer needs
•
Greater opportunity to build
stronger and more intimate
customer relationships
Enhanced Opportunities To Create Value
Strategic
•
Increases flexibility to
pursue domestic and
international growth
opportunities
•
Sharpens focus on distinct
strategic priorities and
distribution channels
•
Closer alignment of
compensation/incentives to
performance
Financial
•
Optimized capital
structures to match
different risk and cash
flow profiles
•
Direct access to capital
markets to fund growth
agendas
•
Allows investors to better
assess each business on
its own merits
Two Companies With Distinct Operating Models, Market Dynamics, Capital
Needs and Distribution Channels, With Minimal Overlap And Synergies
|
 •
Protect
and
grow
our
North American businesses
•
Optimize
our
portfolio
through
ongoing evaluation of strategic
opportunities by business, by
geography and across the company
•
Build
on
our
core
competency
of
driving specifications in the architect
and designer communities while working
with our distribution partners to create
and enhance value
•
Pursue
growth
in
key
international
and emerging markets
•
Seek
adjacent
opportunities
to
expand
our product line and geographic reach
Armstrong’s Business Priorities |
 Armstrong
Ceilings
Overview |
 Global Ceilings Revenue and Product Mix
Commercially oriented business with diverse end-use applications
Sales by End-use Segment
Office
Retail
Education
Healthcare
Segment
% of Business
Office
30% -
40%
Retail
15% -
25%
Education
15% -
25%
Transportation /
Other
10% -
20%
Healthcare
5% -
15%
(1) Consists of wood, metal and other alternative material ceilings manufactured or
sourced by the company |
 •
Seamless customer relationship –
customers buy an Armstrong ceiling system
•
ROIC >100%
•
Over $290 million in cash dividends
to Armstrong from 2011 to 2014
•
8 Manufacturing plants in 5 countries
•
Products and services help drive
specifications and deliver efficiency
to contractors
WAVE –
Armstrong/Worthington 23 Year JV
Integral to Armstrong Ceiling business success |
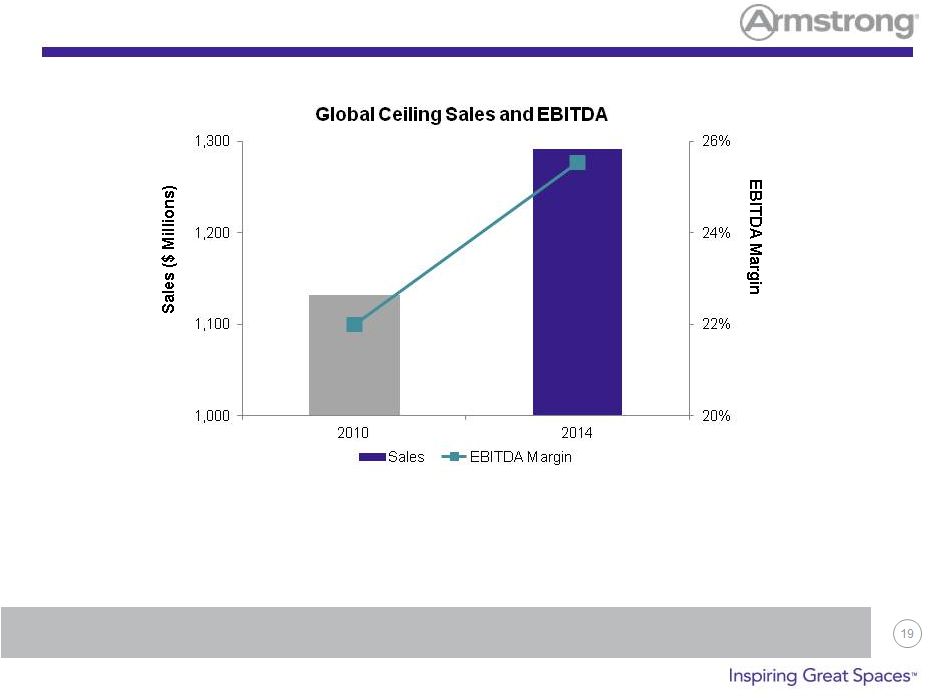 Sales and margin growth despite market challenges
•
Sales up 14% despite flat global volumes
•
EBITDA margins up 350 bps –
price, mix, earnings from WAVE and cost improvement
Global Ceiling Sales and EBITDA |
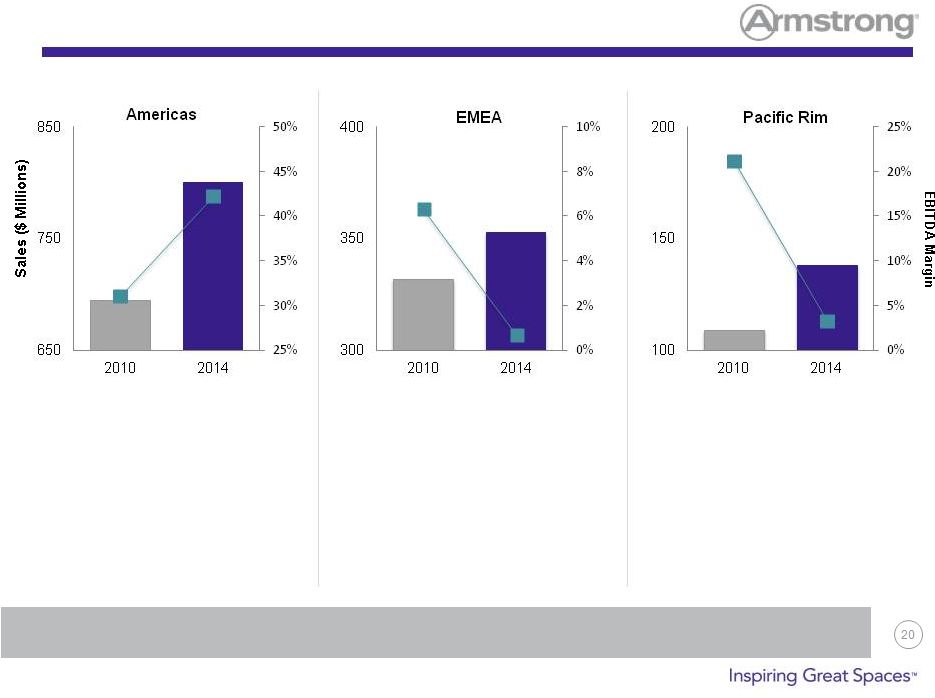 Regional Mix
Global improvements led by North America
•
~20% sales growth in UK,
Russia and Middle East
•
Offset by market contraction
in Continental Europe
•
Significant Russia plant
start-up investment during
2014
•
Sales +15% despite
lower volumes
•
EBITDA margin expands
1100 bps –
price, mix,
manufacturing productivity,
WAVE earnings
•
Growth in India and China
offset Australia market
decline
•
Completed China plant
including metal capability in
2013 and 2014
•
Capacity in place to serve
future growth in region |
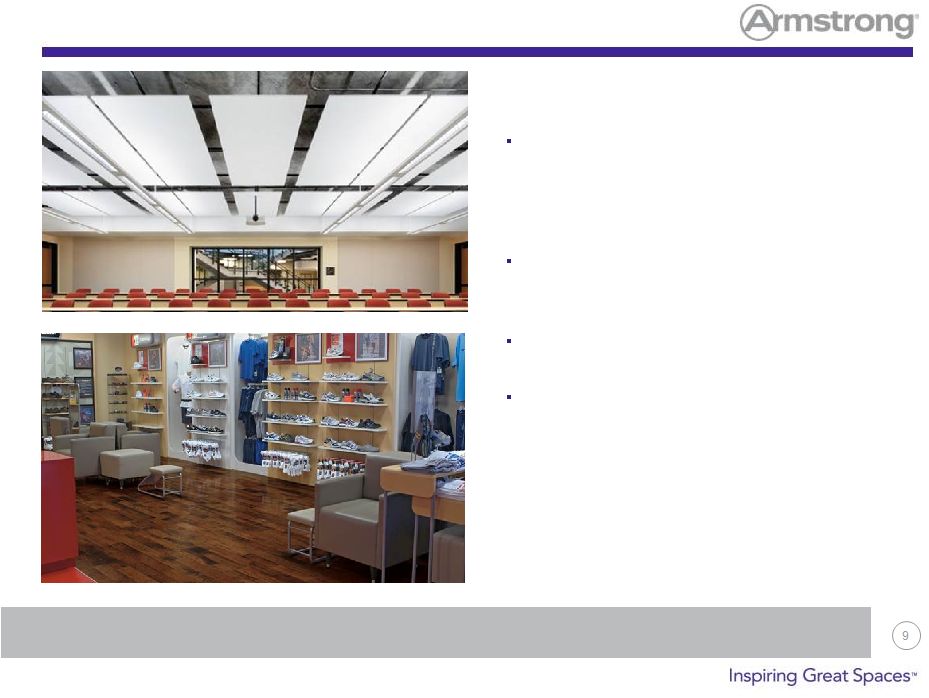
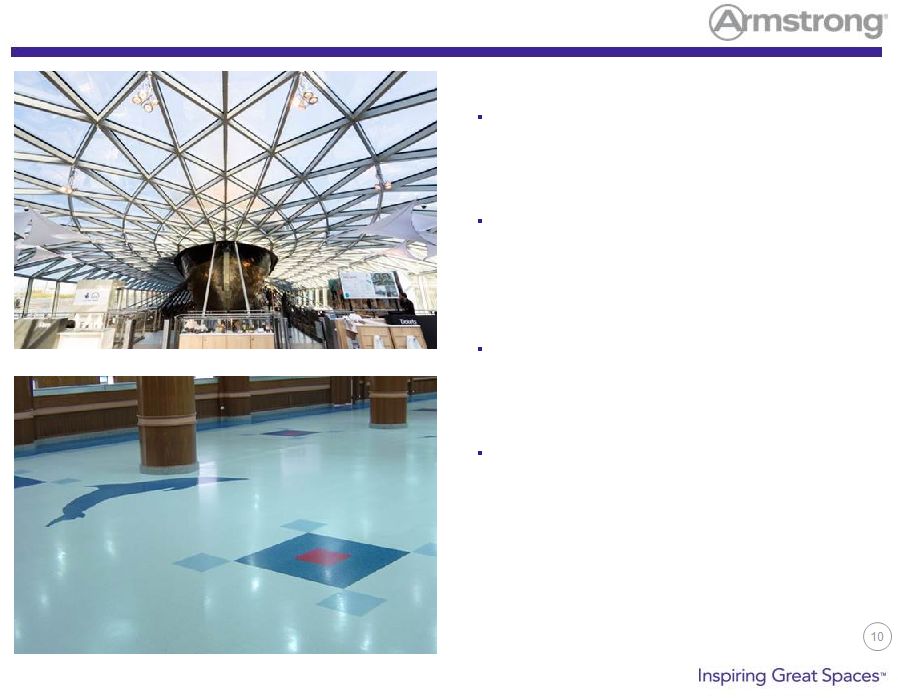
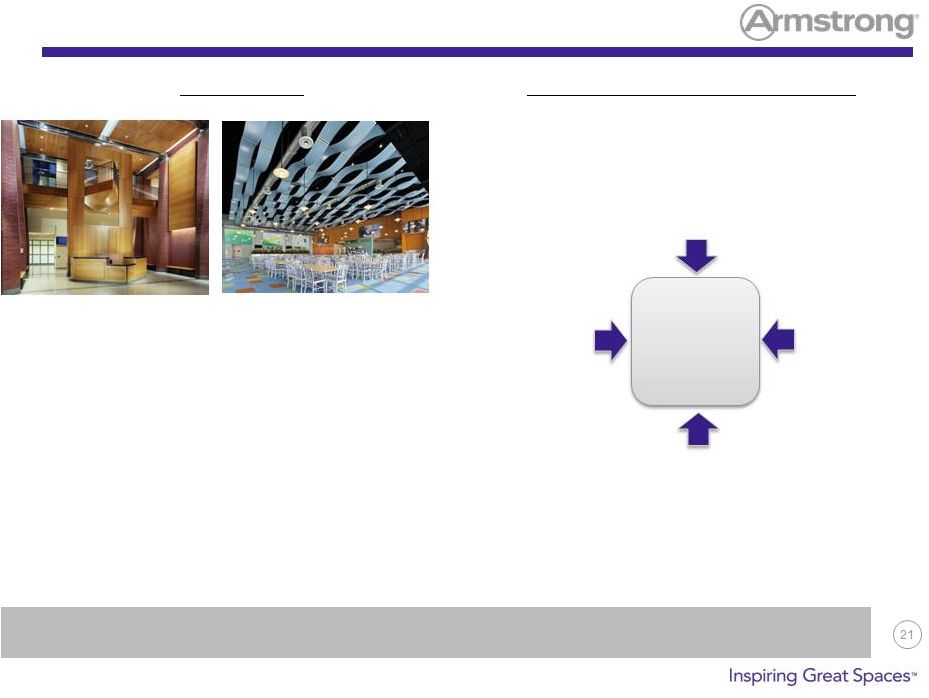 Architectural Specialties (AS) Overview
Enhancing our value to core customers in a differentiated way
•
Specialty ceiling systems targeted at customer
need for a design-oriented aesthetic
•
Same customer as mineral fiber ceilings,
often combined on the same project
•
Many different materials and product forms
•
Lower volume, higher price, sometimes
involving custom design and engineering
What Is AS?
What Makes Armstrong Unique?
Global
footprint
to support
global projects
Broadest portfolio of
on-trend specialty ceiling
solutions in the world
Consistently
high level
of quality
A “high
touch”
service
model
Easiest
To Do
Business
With |
 The
AS Financial Equation An attractive ROIC-accretive global growth
engine within the ceilings segment
Big Penetration
Opportunity
Attractive Stand-Alone
Economics
Total Ceilings
Portfolio Synergies
•
$2B
market
opportunity
•
Highly
incremental
–
fragmented regional
competition
•
High incremental
margins
•
Lower fixed asset
intensity = high ROIC
•
Unique multi-product
specifications
•
Customer loyalty
driver
•
“Pull-through”
effect
on core mineral fiber
ceilings |
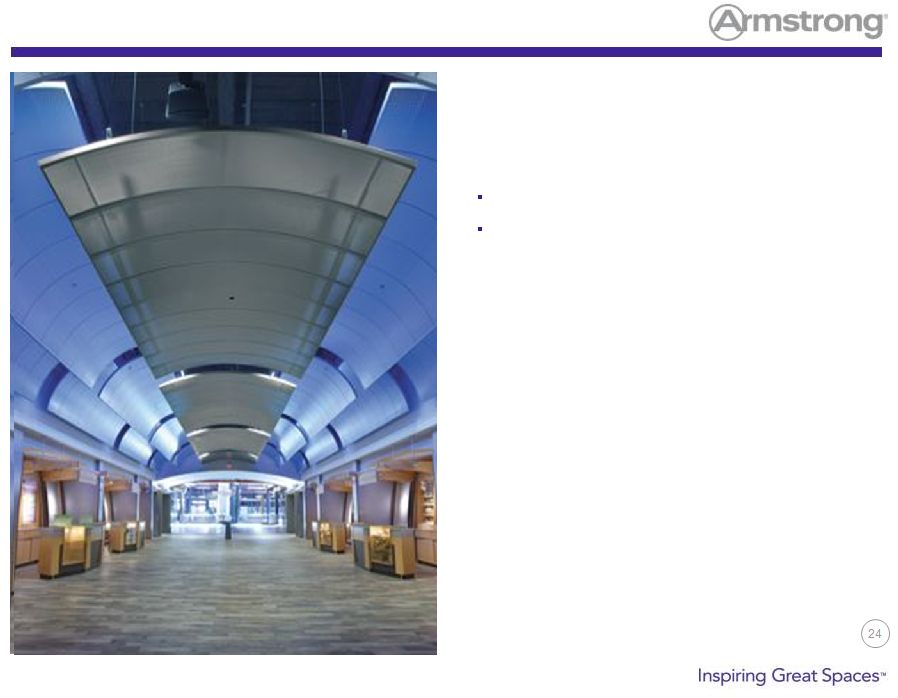
 “Freedom Tower”
-
Conde Nast
Recently won the ceilings supply for
Conde Nast, an anchor tenant for this
iconic building, taking 25% of the floors
Why Armstrong:
•
Only company able to combine our
acoustical tile, Architectural Specialties
and grid solutions to effectively meet
customer’s challenging needs
•
Provided design services to enable a
unique visual
•
Ability to support a compressed
construction schedule
Case Study: One World Trade Center |
 •
Leverage global reach and scale
•
Win specification game
Multi-product offering …
1-stop shopping
Supported with design services
•
Remodel opportunity
•
Prepared for demand uptick
Global Ceilings Summary |
 Armstrong
Flooring
Overview |
 Global Flooring Revenue Mix
Balanced exposure to Residential and Commercial recovery
Commercial
35%
Residential
65%
Total Business
Remodel
70%
New
30%
Remodel
75%
New
25%
Commercial
Residential
Office 10% -
20%
Retail 15% -
25%
Education 20% -
30%
Healthcare 20% -
30%
Other 10% -
20%
Commercial Sales by End-Use Segment |
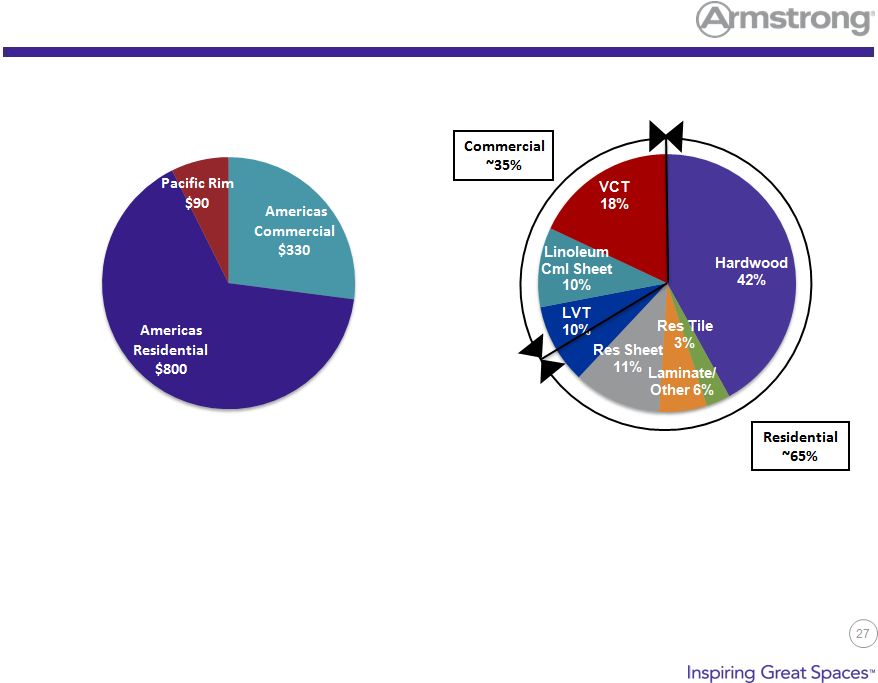 •
> 90% of sales in North America –
the core earnings driver of the business
•
Mix of Commercial and Residential in North America
•
Residential is a North American business –
business outside of North
America is all Commercial
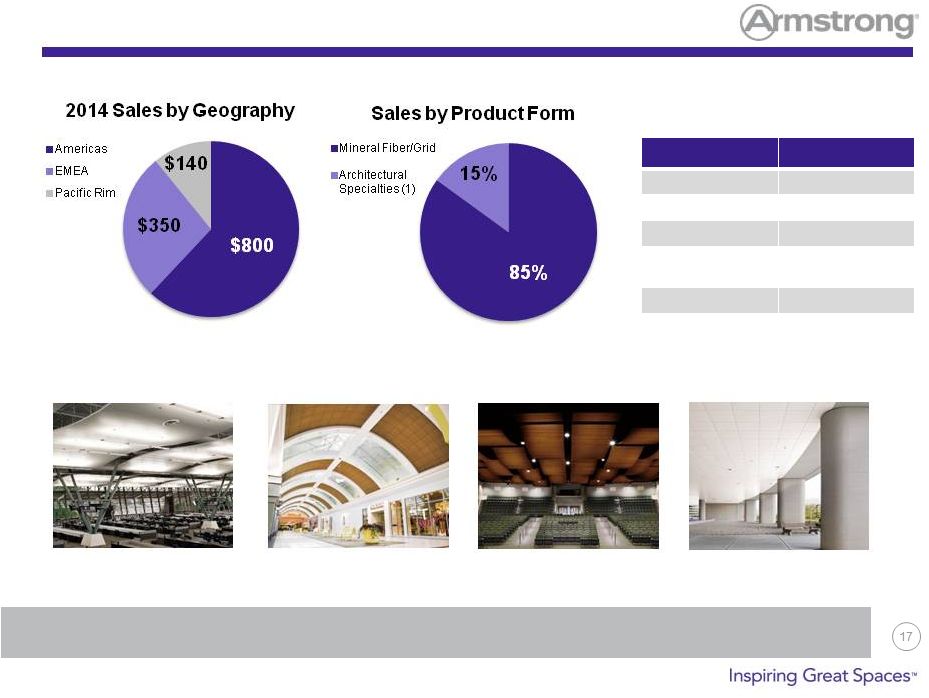
Geographic and Product Mix
2014 Sales by Geography
Total = $1.2B
2014 Sales by Product |
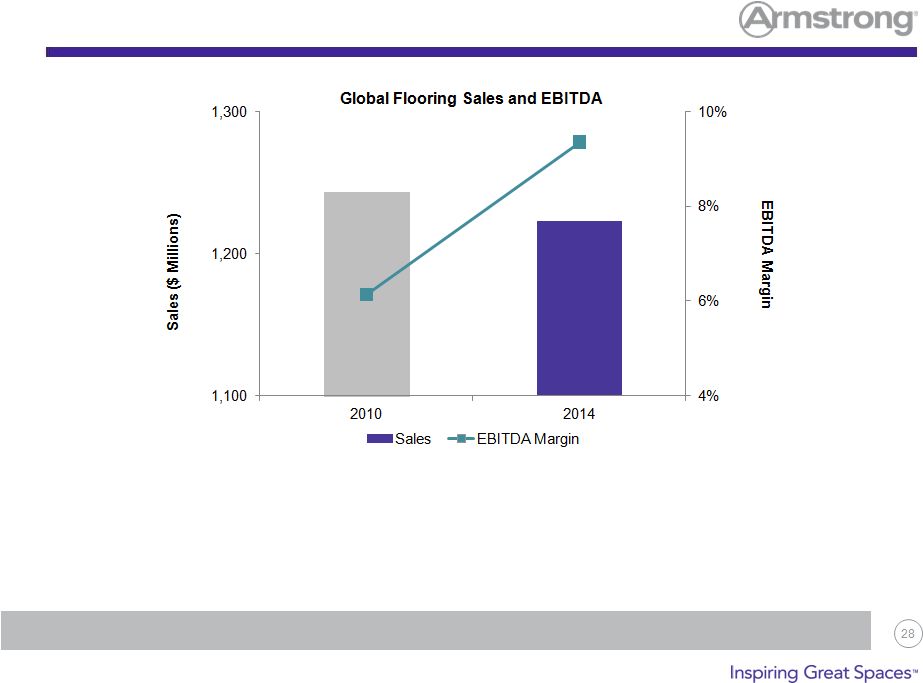 •
Sales down <2% due to volume declines and divestiture of the Patriot
distribution business •
EBITDA margins improve 320 bps despite volume declines and investments in
China Global Flooring Total Sales and EBITDA
Remixing the portfolio to higher margin products |
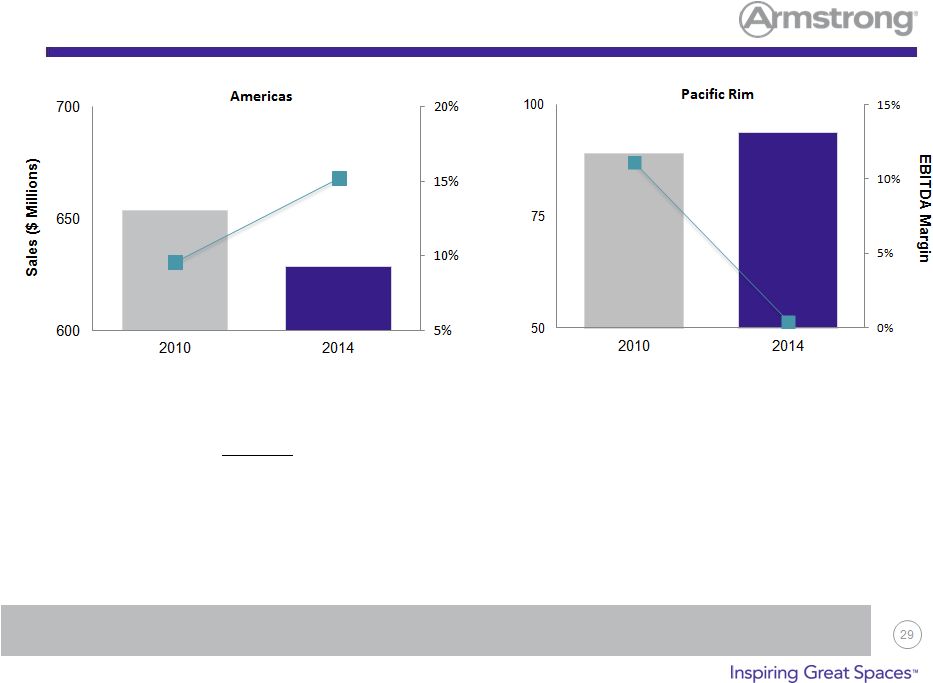 Resilient Flooring
North American performance drives segment profit growth
•
Sales down <4% despite double digit
volume declines
•
Margins
expand
560
bps
despite
negative volume leverage
(manufacturing productivity, mix and
price all improve)
•
Sales are up 5% as weakness
in Australia is offset by growth in
China
•
EBITDA margins impacted by plant
/ commercial investment in China
and Australian weakness |
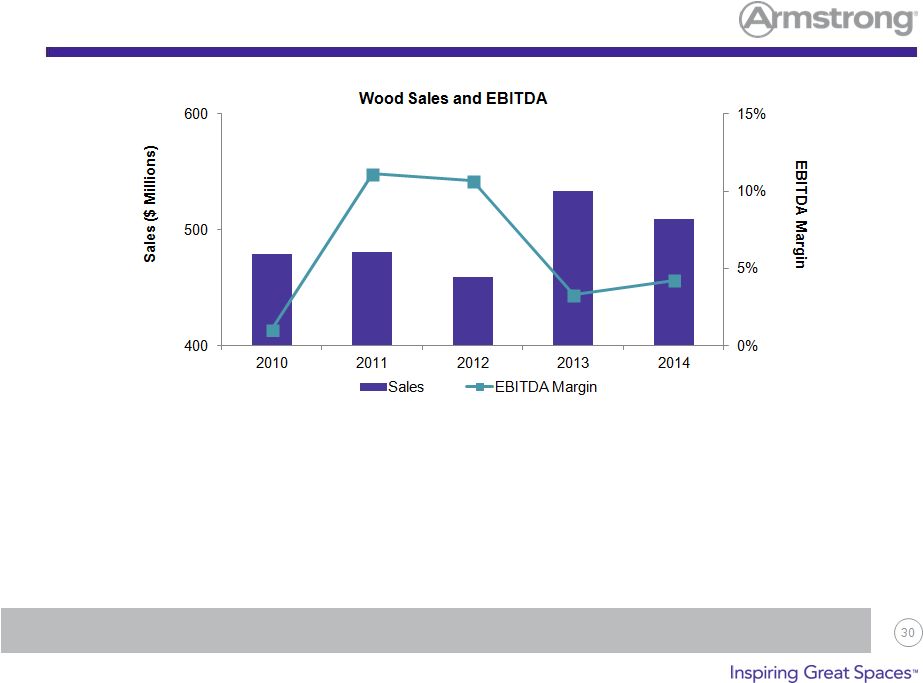 Wood
– A Cyclical Business
Focusing on higher mix products and channels
•
Leadership share in North America
•
At trough volumes in 2011 and 2012, EBITDA margins were +10% and
ROIC was ~8%
•
Nearly $80M in commodity inflation in the last two years
|
 Our
Strategy Residential Flooring
Extend leadership share and
returns
Where To Play:
•
Significantly increase share in fast-growing LVT
•
Protect our leading share position in Sheet Vinyl
•
Expand accessories and floor care solutions
Commercial Flooring
Where To Play:
•
Win in the Healthcare, Education and Retail sectors
•
Dramatically increase share in fast-growing LVT
•
Protect our leading share position in VCT in
North America
Protect leadership share and
margins |
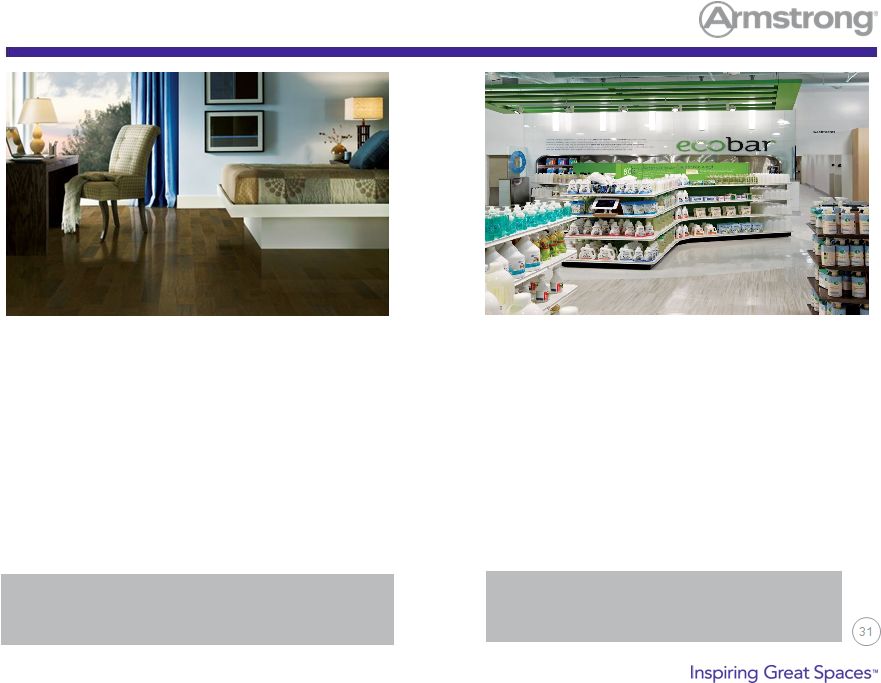
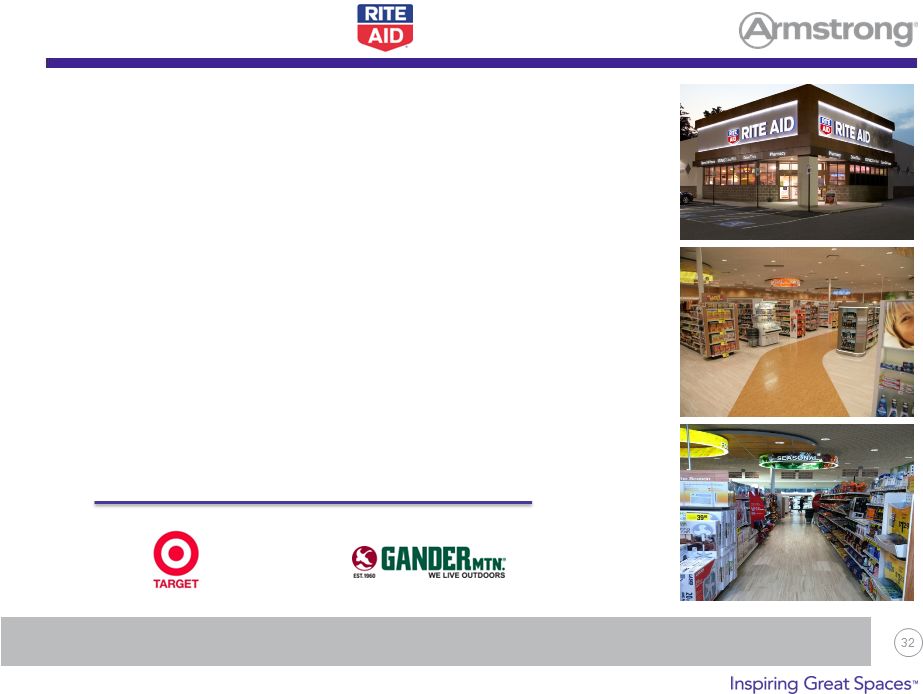 Retail Case Study –
Why Armstrong
Product Solutions •
Design Leadership •
Brand Recognition
•
LVT in all stores / BBT in most stores
•
Bamboo & striated visual
•
Environmental statement (bio-based tiles)
•
Local access, fast installation and easy to maintain
Partnership
Consultative •
Service •
Reliability
•
2012: Striations bio-based tile as a prototype
•
2013: Over 420 stores refurbished
•
2014:
460 locations refurbished (continued expansion 2015)
Sector: Refresh drives traffic –
likely source of pent up demand |
 •
Resilient flooring in North America is a
valuable franchise with strong returns and
significant incremental margins
•
Focusing on higher mix/margin products and
channels
•
Growth opportunities in the Pacific Rim
•
Better utilizing our global footprint to lower
costs and speed innovation
•
Exited unprofitable flooring business in
Europe
Armstrong Flooring –
Summary |
 Growth through
Innovation |
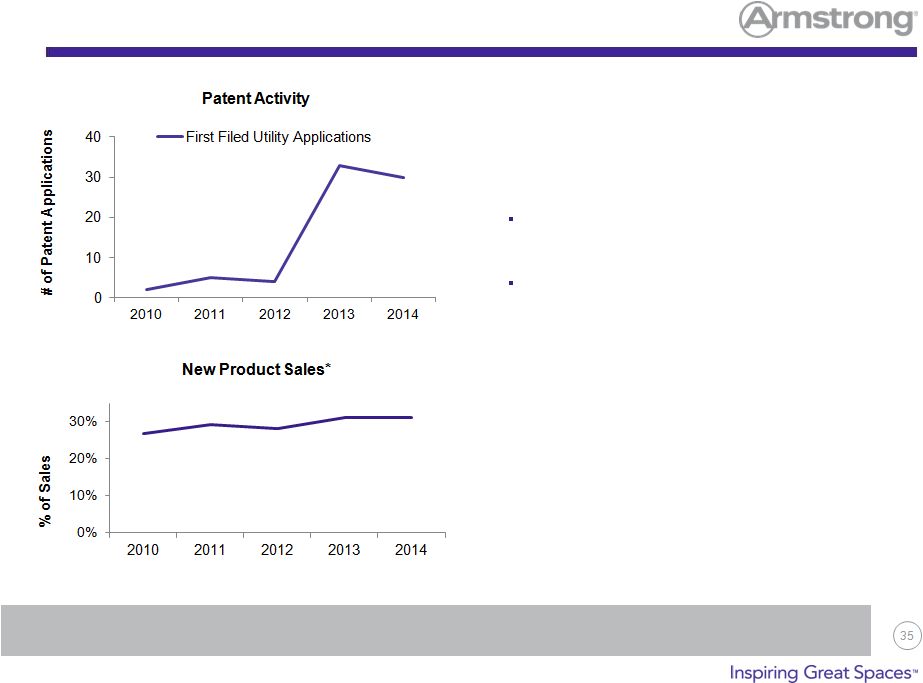 •
Dynamic strategy driven by customer needs
•
Deploying new product development, R&D,
and technical resources globally to the
highest value creation opportunities
Development of global and multi-
generational product platforms
Patent applications increased more than
5x since 2010
•
Differentiation that is valued by customers =
higher margins
•
Innovation is not limited to just new products
but extends to “how”
we do business
Renewed Focus on Innovation
Innovation efforts accelerating
* Metric based on % of total sales for products introduced in the last five years.
|
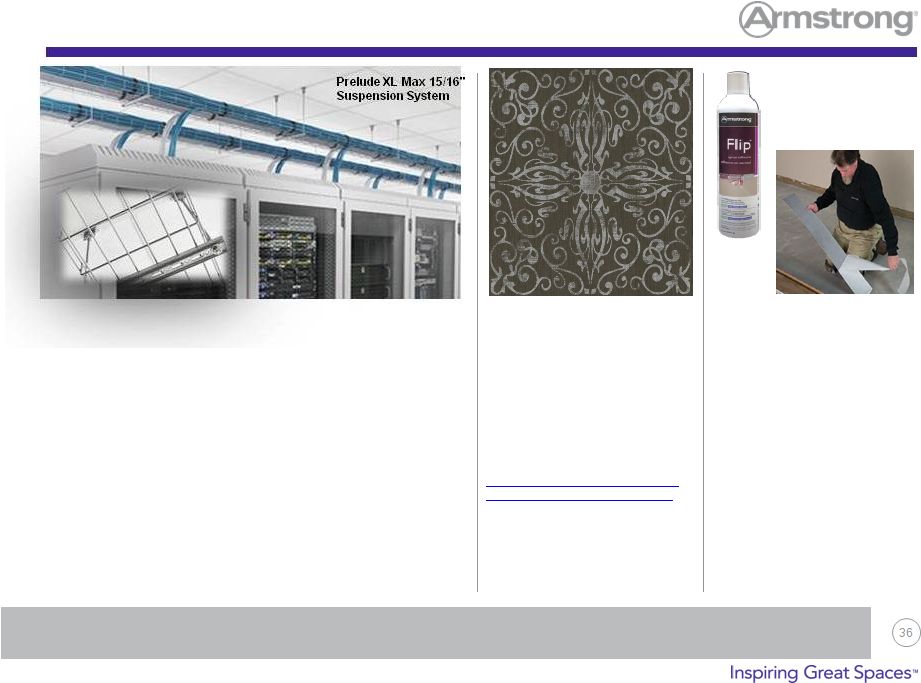 Inspiring Great Spaces through Leadership in Product Innovation
Complete Data Center Ceiling Systems
Prelude XL Max 15/16" Suspension System
Now Supports point loads up to 200 lbs. using 3/8" threaded rod
and integrated hanging clips to provide:
•
Flexible and reconfigurable overhead cable tray and
electrical distribution to meet client needs without a
separate strut channel system.
•
Eliminates unsightly threaded rod penetrations through the
ceiling plane for improved access and aesthetics.
•
Eliminates ceiling penetrations to help minimize unwanted
air infiltration
•
30-Year Limited System Warranty
Custom
colors
available
to
coordinate
with
Ultima®
Create!™
ceiling panels
FLIP™
is a hand-held spray
adhesive. This innovative
flooring spray adhesive allows
contractors and installers to turn
a small room in less time,
returning the area to a functional
revenue-generating space
quicker.
FasTak™
& iset™
are factory
applied adhesive systems for
residential and commercial LVT
NATURAL CREATIONS®
ArborArt®
•
EarthCuts®
•
Mystix®
Luxury Vinyl Tile (LVT)
Natural Creations collection of luxury
vinyl tile was awarded ADEX Gold
for Design Excellence. Natural
Creations offers traditional, rustic
and exotic wood-looks in ArborArt,
EarthCuts and contemporary design
trends in Mystix.
Natural Creations®
Luxury Vinyl Tile
with the I-Set™
Installation System
from Armstrong Commercial
Flooring has also been recognized
by Design Journal and Archinterious
as one of the best products of 2014.
Innovations in installation and design that inspire customers
•
Immediate occupancy,
no wet glue
•
Fast & easy install, repair,
and replace |
 Ultima / Optima
Fissured / Cortega
Acoustics (NRC)
Light Reflect
Recycle Content
Anti Mold/Mildew
Warranty
0.70 / 0.90
0.90
86% / 71%
Yes
30 Years
Acoustics (NRC)
Light Reflect
Recycle Content
Anti Mold/Mildew
Warranty
0.55
0.81 / 0.82
41%
No
1 Year
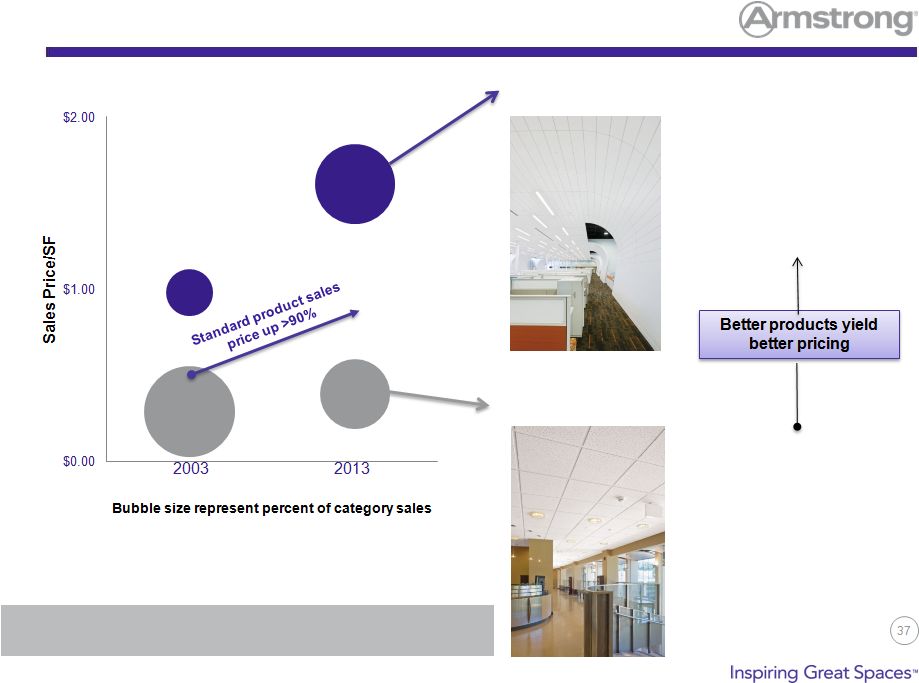
Mix Evolution -
Ceilings Americas
Innovation enables gains in price and mix |
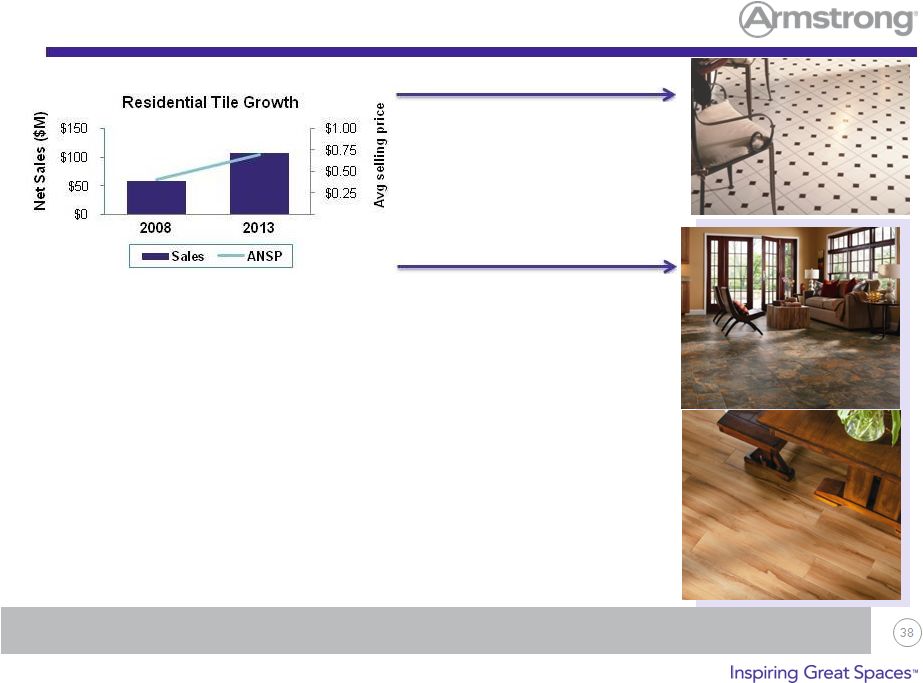 •
Sales CAGR ~5x volume
growth during this time
period
•
Direct Margin $’s grew at a
CAGR of >33%
Mix Revolution -
Residential Floor Tile
Innovation
led
growth
driving
“mix
up”
within
the
category
and
improved
profitability
Alterna -
Allegheny Slate
–
Copper Mountain
Luxe with FasTak –
Groveland -
Natural
•
Growth driven by category expansion, product innovation and new
introductions:
•
Alterna, groutable engineered stone tile utilizes proprietary technology to
mimic the detail, texture and variation of natural stone
•
Luxury vinyl plank offerings such as Luxe, Natural Living, Natural
Personality
•
Present & Future Growth
•
Alterna features multiple sizes and wall installation
•
LVT domestic production enables Armstrong to expand offering and
increase speed to market
•
New innovations in installation (FasTak) and evolution of design
establish
Armstrong as the market leader
Standard residential tile
offering in 2008
From:
To: |
 Financial
Summary |
 •
Positioned to benefit from North American
commercial recovery
•
Capture growth in established international
and emerging markets
•
Maintain a strong balance sheet
Focused on Value Creation
ROIC focused |
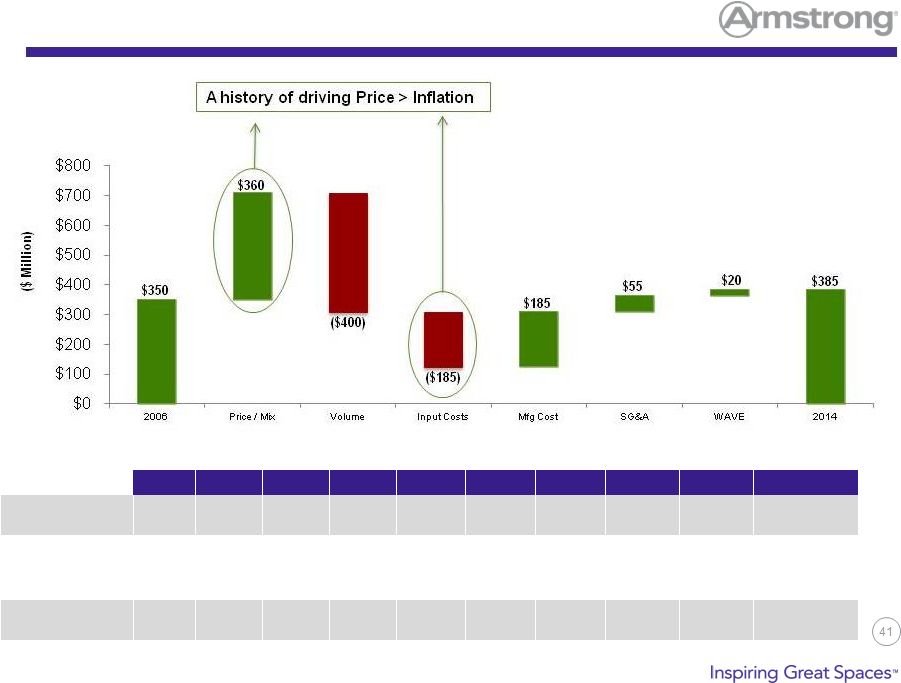 Adjusted EBITDA History
2006
2007
2008
2009
2010
2011
2012
2013
2014
2015 Est.
Sales
$2.94B
$2.97B
$2.81B
$2.35B
$2.34B
$2.43B
$2.40B
$2.51B
$2.52B
$2.53 -
$2.63B
Non-cash U.S.
Pension impact
($50M)
($59M)
($63M)
($58M)
($51M)
($26M)
($12M)
($2M)
$1M
$22 -
$28M
Adjusted EBITDA
$350M
$379M
$349M
$261M
$263M
$349M
$391M
$372M
$384M
$350 -
$390M
EBITDA as % of
Sales
11.9%
12.8%
12.4%
11.1%
11.2%
14.4%
16.3%
14.8%
15.3%
~14.4% |
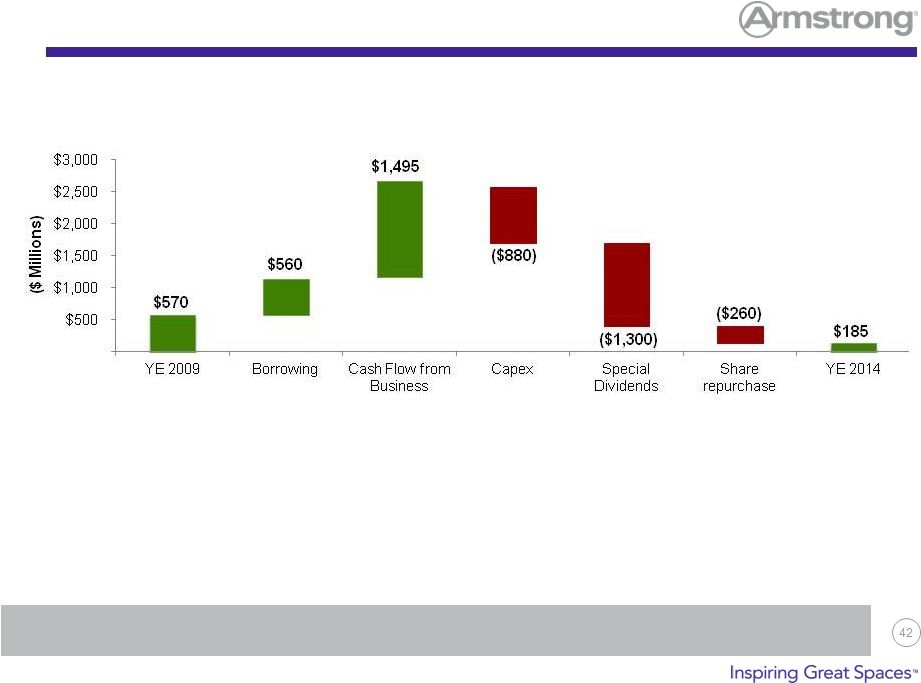 Cash
Flow History Significant cash investments and returns to shareholders
•
Created and maintained an efficient balance sheet
•
Cash generation aided by low cash tax rate from Chapter 11 Net Operating Loss (NOL)
carry-forward •
Prioritized investments in capital expenditures to drive global growth
•
Completed construction of 3 China plants, Russia plant and mineral wool plant with
LVT plant underway
•
Returned surplus cash via special dividends and share repurchase
|
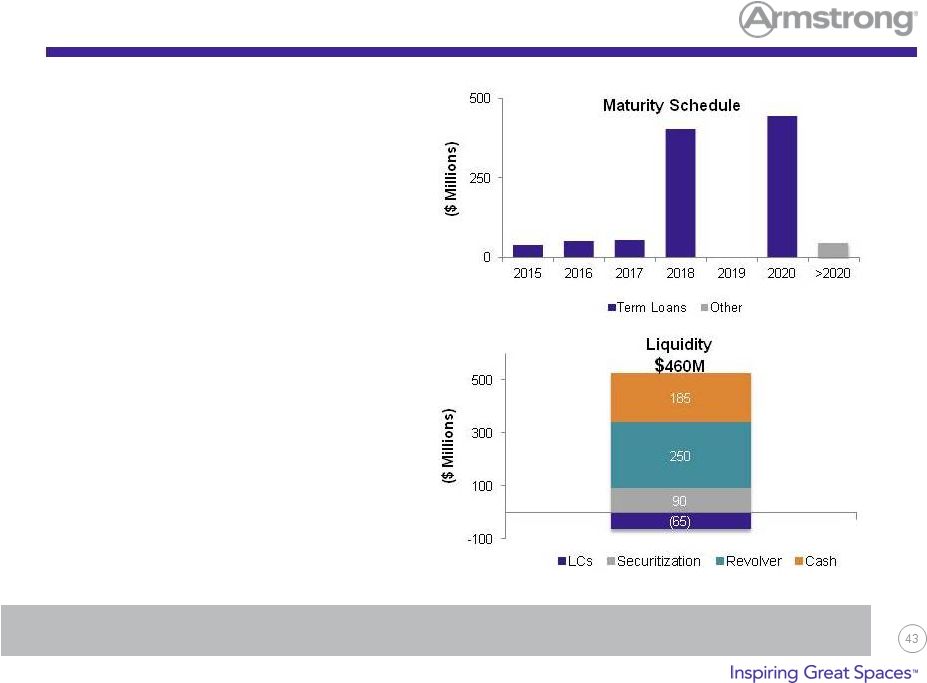 Well-positioned and efficient balance sheet
Balance Sheet –
12/31/14
Net Debt
$860M
LTM EBITDA
$384M
Leverage
2.2x
•
No significant maturities until 2018
•
Considerable covenant headroom
•
Sufficient liquidity
•
Well funded US pension plan;
no contributions in >20 years
Current Leverage |
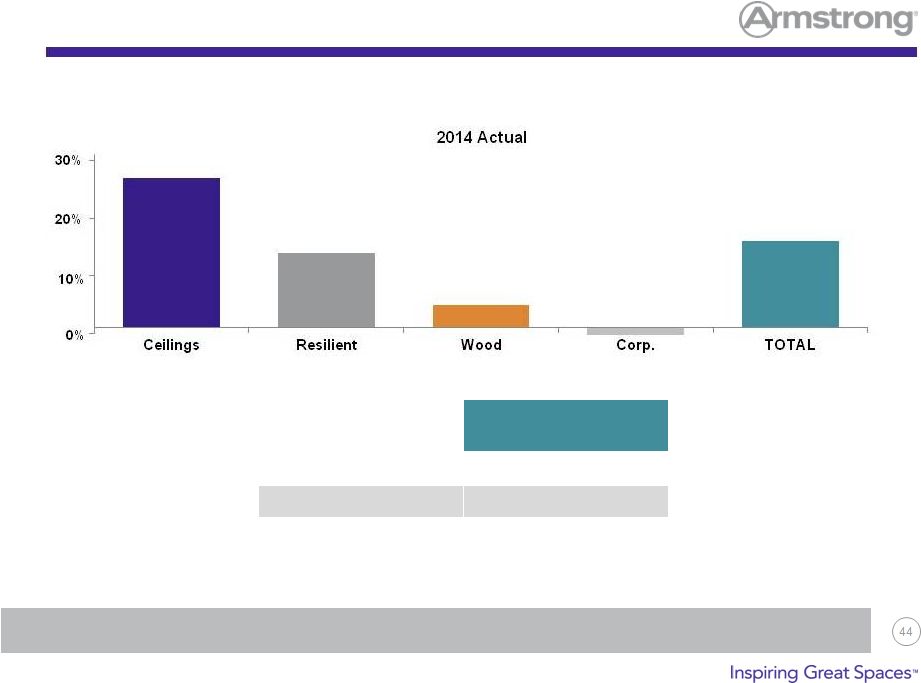 Path
to Growth – Adjusted EBITDA margin
Incremental margins on additional volume can drive margin improvement
Margin on
Incremental Volume
Ceilings
30% -
45%
Resilient
20% -
35%
Wood
20% -
30% |
 Investment Highlights
Diversified $2.5 billion global building products company
with leading positions in most key markets and products
Driving value creation through:
–
Recovery in North America
•
U.S. Commercial is our most profitable business
with
35-45% incremental margins
–
Growth in International Markets
•
Emerging market investments and
recovery in developed markets
–
Leveraging innovation to drive profitable growth
•
Focus on design, environmental leadership, installation
and application enhancements
•
New product benefits to drive improved mix
Focused on creating shareholder value |
 Financial
Overview
Appendix |
 EBITDA Bridge –
Full Year 2014 vs. Prior Year |
 2015 Estimate Range
(1)
2014
(2)
Variance
Net Sales
(3)
2,525
to
2,625
2,515
0%
to
4%
Operating Income
(4)
230
to
270
271
(15%)
to
(1%)
EBITDA
350
to
390
389
(10%)
to
0%
Earnings Per Share
(5)
$2.05
to
$2.45
$2.38
(14%)
to
3%
(1)
Guidance is presented using 2015 budgeted foreign exchange rates
(2)
2014 results are presented using 2015 budgeted foreign exchange rates
(3)
2015 and 2014 net sales include the impact of foreign exchange
(4)
As reported Operating Income: $175 -
$215 million in 2015 and $239 million 2014
(5)
As reported earnings per share: $1.25 -
$1.60
in 2015 and $1.83 in 2014
Key Metrics –
Guidance 2015 |
 2015
Financial Outlook Sales
(1)
$1,300-$1,350 million; EBITDA $335-$360 million
Sales
(1)
$1,225-$1,275 million; EBITDA $80-$100 million
EBITDA ($65) –
($70)
$45 -
$55 million; Adjusted long-term ETR of ~39%
(2)
$125 -
$150 million
Non-cash:
$22 -
$28 million US pension expense
Cash:
$20 -
$40 million transaction costs
ABP Segment
AFP
Segment
Cash Taxes/ETR
Capital Spending
Exclusions from EBITDA
(1)
Net sales include foreign exchange impact
(2)
As reported ETR of 47% for 2015
Corporate Segment |
 Full
Year Adjusted EBITDA to Reported Net Income 2014
2013
V
EBITDA–
Adjusted
$384
$372
$12
Depreciation and Amortization
(118)
(103)
(15)
Operating Income –
Adjusted
$266
$269
($3)
Non-cash impact of U.S. pension
1
(2)
3
Foreign Exchange Movements
(1)
(2)
1
Impairments
13
-
13
Cost Reduction Initiatives
14
7
7
Operating Income –
As Reported
$239
$266
($27)
Interest/Other (Expense)
(54)
(67)
13
EBT
$185
$199
($14)
Tax (Expense)
(83)
(72)
(11)
Net Income
$102
$127
($25) |
 Management Team |
 Matthew J. Espe, Chief Executive Officer and
President In July 2010, Matthew J. Espe was appointed CEO of
Armstrong World Industries, Inc., in Lancaster, Pennsylvania.
Matt brings 30 years of experience in sales, marketing, distribution and
management with global manufacturing businesses to Armstrong. In his
previous role at Ricoh Americas Corporation, a subsidiary of Ricoh Company,
Ltd., he served as chairman and CEO. Prior, he was chairman and CEO of IKON Office Solutions, Inc.,
a $4 billion office equipment distributor and services provider with 24,000
employees. Ricoh acquired IKON in 2008. Before joining IKON in 2002, Matt
was president and CEO of GE Lighting. In a career that spanned 22 years there,
he managed multiple business units as well as functions including sales,
marketing, distribution and manufacturing. Along with a wealth of
experience, he also brings a finely-tuned global perspective, having led businesses in Europe,
Asia and North America.
Matt is a former director of Unisys Corporation and Graphic Packaging, Inc. He
currently serves on the advisory board
at
the
College
of
Business
and
Economics
at
the
University
of
Idaho
and
on
the
advisory
council
for
Drexel
University's Lebow College of Business, Center for Corporate Governance.
Additionally, Matt is a member of the National Association of Corporate
Directors (NACD) and the Wall Street Journal CEO Council. He graduated from
the University of Idaho with a bachelor's degree in marketing, and received his
MBA from Whittier College. David S. Schulz is senior vice president and CFO
of Armstrong World Industries, Inc., in Lancaster, Pennsylvania.
Mr. Schulz joined Armstrong in 2011 as vice president, finance for Armstrong
Building Products. Prior, he served as CFO of Procter & Gamble
Company’s Americas snacks division, and from 2008 to 2009 as
the
finance
director
for
the
Coffee
business
unit
of
the
J.M.
Smucker
Co.
following
the
merger
of
P&G’s Folgers Coffee Co. with Smucker. His experience covers a wide range
of finance leadership positions encompassing operational finance, planning
and analysis, mergers and acquisitions, and financial reporting. Well known
as a strong business partner, Mr. Schulz actively engages with other
functions to drive improvement. Prior to joining Procter & Gamble, Mr.
Schulz was an officer in the United States Marine Corps.
He
earned
his
bachelor’s
degree
in
finance
from
Villanova
University
in
1987
and
a
master’s
degree
in management from the U.S. Naval Postgraduate School in 1993.
David S. Schulz, Senior Vice President and Chief Financial
Officer |
 Don
Maier, Executive Vice President, CEO Armstrong
Floor Products Worldwide Victor Grizzle,
Executive Vice President, CEO Armstrong Building Products
Victor
“Vic”
Grizzle
is
executive
vice
president
and
CEO,
Armstrong
Building
Products,
in
Lancaster,
Pennsylvania.
Mr. Grizzle has 23 years of experience in process improvement, sales, marketing
and global business leadership. He comes to Armstrong from Valmont
Industries, a $2 billion global leader of infrastructure support structures for utility,
telecom and lighting markets, and manufacturer of mechanized irrigation equipment
for large scale farming, where he was
group
president
of
Global
Structures,
Coatings
and
Tubing
since
2005.
Prior
to
Valmont,
Mr.
Grizzle
was
president of the commercial power division of EaglePicher Corporation, a $700
million diversified manufacturer and marketer of advanced technology and
industrial products for space, defense, automotive, filtration, pharmaceutical,
environmental
and
commercial
applications.
Before
that,
he
spent
16
years
at
General
Electric
Corporation.
Mr. Grizzle graduated from California Polytechnic University with a Bachelor of
Science in Mechanical Engineering. Don Maier is the EVP & CEO of
Armstrong Floor Products. He joined Armstrong in January 2010 and was
most recently the senior vice president, Global Operations.
Don came to Armstrong from TPG Capital Advisors, the global buyout group of TPG, a
private investment firm. Prior, he held a steady progression of roles at
Hillenbrand Industries, beginning in 1987 as a manufacturing and product
engineer for subsidiary Batesville Casket Company, and later moving from
product development and marketing leadership roles to vice president, Manufacturing
and Operations. In 2002, he became vice president, Strategy and Business
Development, for a larger Hillenbrand subsidiary, Hill-Rom, a $1.5
billion leading global producer of health care equipment, technology and workflow IT
systems. In 2003, he became vice president and general manager, and in 2005 he was
named senior vice president –
North America. In that role, he had P&L responsibility for a $1.4 billion
business with a $325 million operating budget and $90 million capital
budget. Don is a member of the board of directors of the National Association
of Manufacturers. He holds a bachelor’s degree in Industrial Systems
Engineering from The Ohio State University in Columbus, Ohio, and an MBA,
with a concentration in Marketing, from Xavier University in Cincinnati, Ohio. |
 Thomas J. Waters, Vice President Treasury & Investor Relations
Thomas J. Waters is Vice President, Treasury and Investor
Relations of Armstrong World Industries, Inc. Mr.
Waters
joined
Armstrong
in
1998
as
Manager,
Capital
Markets.
Since
then
he
has
held
the
positions
of Director of Investor Relations, General Manager of Finance and IT for Building
Products Europe, General Manager
Financial
Planning
and
Analysis
for
North
American
Floor
Products.
He
was
named
Treasurer
in
2008, and added investor relations responsibilities in 2010.
Prior to Armstrong, Mr. Waters worked for American Airlines in Dallas, TX in both
Treasury and Operational Finance roles.
Mr. Waters earned a BA from Binghamton University, and a MBA from the Walter A.
Haas School of Business at the University of California, Berkeley.
Kristy Olshan is Investor Relations Manager of Armstrong World Industries, Inc.,
in Lancaster, Pennsylvania.
Mrs. Olshan became Investor Relations Manager in December of 2010 and has
responsibility for managing all external investor communications. Mrs.
Olshan joined Armstrong in November of 2008 as External Reporting Manager.
Prior to Armstrong, Mrs. Olshan spent over 5 years in public accounting as
an auditor and advisor to clients in the construction engineering, banking,
utility, and manufacturing industries with a focus on SEC reporting and
Sarbanes-Oxley compliance. Mrs. Olshan is also a Certified Public
Accountant and member of the AICPA. She previously served on the board
as Treasurer of the York Hospital Auxiliary, a Wellspan affiliated non-profit
organization. Mrs. Olshan earned a bachelor of science
with dual degrees in Business Administration and Accounting, and an MBA from
York College of Pennsylvania. Kristy Olshan, Investor
Relations Manager |
 Investor Relations Contact Information
Kristy Olshan, CPA, MBA
Investor Relations Manager
Armstrong World Industries
2500 Columbia Avenue
Lancaster, PA
17604
P: 717-396-6354
F: 717-396-6128
E: ksolshan@armstrong.com
Thomas J. Waters
VP, Treasury and Investor Relations
Armstrong World Industries
2500 Columbia Avenue
Lancaster, PA
17604
P: (717) 396-6354
F: (717) 396-6136
E: tjwaters@armstrong.com |