Attached files
| file | filename |
|---|---|
| EX-99.1 - EX-99.1 - ARMSTRONG WORLD INDUSTRIES INC | d875284dex991.htm |
| EX-99.2 - EX-99.2 - ARMSTRONG WORLD INDUSTRIES INC | d875284dex992.htm |
| EX-99.4 - EX-99.4 - ARMSTRONG WORLD INDUSTRIES INC | d875284dex994.htm |
| 8-K - FORM 8-K - ARMSTRONG WORLD INDUSTRIES INC | d875284d8k.htm |
 Earnings Call
Presentation
4
th
Quarter 2014
February 23, 2015
Exhibit 99.3 |
 2
Our disclosures in this presentation, including without limitation, those relating
to future financial results guidance and the separation of our flooring
business from our building products business, and in our other public
documents and comments contain forward-looking statements within the meaning of the Private
Securities Litigation Reform Act. Those statements provide our future
expectations or forecasts and can be identified
by
our
use
of
words
such
as
"anticipate,"
"estimate,"
"expect,"
"project,"
"intend,"
"plan,"
"believe,"
"outlook,"
"target,"
"predict,"
"may,"
"will,"
"would,"
"could,"
"should,"
"seek,"
and
other
words
or
phrases
of
similar meaning in connection with any discussion of future operating or financial
performance or the separation of our businesses. Forward-looking
statements, by their nature, address matters that are uncertain and involve
risks because they relate to events and depend on circumstances that may or may not
occur in the future. As a result, our actual results may differ
materially from our expected results and from those expressed in our
forward-looking
statements.
A
more
detailed
discussion
of
the
risks
and
uncertainties
that
may
affect
our
ability
to
achieve
the
projected
performance
is
included
in
the
“Risk
Factors”
and
“Management’s
Discussion
and
Analysis”
sections of our reports on Forms 10-K and 10-Q filed with the SEC.
Forward-looking statements speak only as of the date they are
made. We undertake no obligation to update any forward-looking statements
beyond what is required under applicable securities law.
In
addition,
we
will
be
referring
to
non-GAAP
financial
measures
within
the
meaning
of
SEC
Regulation
G.
A
reconciliation of the differences between these measures with the most directly
comparable financial measures calculated in accordance with GAAP are
included within this presentation and available on the Investor
Relations
page
of
our
website
at
www.armstrong.com.
The guidance in this presentation is only effective as of the date given, February
23, 2015, and will not be updated or affirmed unless and until we publicly
announce updated or affirmed guidance. Safe Harbor Statement
|
 3
All
figures
throughout
the
presentation
are
in
$
millions
unless
otherwise
noted.
Figures
may
not
add
due
to
rounding.
•
When reporting our financial results within this presentation, we make several
adjustments. Management uses the non-GAAP measures below in managing the
business and believes the adjustments provide meaningful comparisons of
operating performance between periods. As reported results will be
footnoted throughout the presentation. Basis of Presentation
Explanation •
We report in comparable dollars to remove
the effects of currency translation on the
P&L. The budgeted exchange rate for 2014
is used for all currency translations in 2014
and prior years. Guidance is presented using
the 2015 budgeted exchange rate for the
year.
•
We remove the impact of discrete expenses
and income. Examples include plant
closures, restructuring actions, and other
large unusual items. We also remove the
non-cash
impact
of
our
U.S.
Pension
Plan.
•
Taxes for normalized Net Income and EPS
are calculated using a constant 39% for 2015
guidance, and 2014 and 2013 results, which
are based on the expected full year historical
tax rate.
What Items Are Adjusted
Comparable
Dollars
Other
Adjustments
Net Sales
Yes
No
Gross Profit
Yes
Yes
SG&A Expense
Yes
Yes
Equity Earnings
Yes
Yes
Operating Income
Yes
Yes
Net Income
Yes
Yes
Cash Flow
No
No
Return on Capital
Yes
Yes
EBITDA
Yes
Yes |
 4
•
Flooring business separation
announcement
•
Review of fourth quarter
and full year 2014 results
•
2015 Outlook
Agenda |
 5
Creating Two Independent Industry Leaders
[Armstrong World Industries]
•
Global commercial suspended ceiling solutions provider
•
#1 market position in all major geographies
•
Poised to deliver margin expansion driven by recovery in
North American commercial
•
Recently completed investments in expanded sales and
manufacturing capabilities
•
Attractive opportunities for enhanced growth and margins,
including emerging markets
•
23 year WAVE JV delivered $68M of cash dividends and
$65M of equity earnings in 2014
Vic Grizzle
Chief Executive Officer
Key Statistics (2014 Year End)
$1.3B (95/5)
Revenue
(% Commercial vs. Residential)
$330M
*
Adjusted EBITDA
~3,400
Team Members
Worldwide
22
Manufacturing Facilities
in
8
Countries
†
100+
Countries Have Armstrong
Ceilings
[Armstrong Flooring ]
•
Dedicated hard surface flooring products designer and
manufacturer
•
Substantial margin expansion, driven by mix and
operating leverage
•
Positioned to benefit from expected recovery in North
American commercial
•
Significant growth opportunity in Asia
•
Well-positioned for both residential and non-residential
cyclical recoveries
Don Maier
Chief Executive Officer
Key Statistics (2014 Year End)
$1.2B (35/65)
Revenue
(% Commercial vs. Residential)
$114M
*
Adjusted EBITDA
~3,600
Team Members
Worldwide
17
Manufacturing Facilities
in 3
Countries
8,000,000+
Annual Visitors to
Global Websites
*
Does not include unallocated corporate expense of $60 million
†Including the WAVE JV |
 6
•
Final approval of Armstrong’s Board of Directors
•
Receipt of opinion of counsel regarding the tax-free nature of the
separation •
Effectiveness of a Form S-1 filing with the Securities and Exchange
Commission
Principal
Closing
Conditions
Separation Details
•
Expected tax-free spin-off of AFP to current AWI shareholders
•
Expected completion in the first quarter of 2016, subject to customary
conditions
Structure and
Timing
•
Separation Management Office (SMO) to lead transition planning
•
Expect to enter into intercompany agreements for certain shared services
Transition
Management |
 7
Enhanced Opportunities To Create Value
Two Companies With Distinct Operating Models, Market Dynamics, Capital
Needs and Distribution Channels, With Minimal Overlap and Synergies
Strategic
•
Increases flexibility to
pursue domestic and
international growth
opportunities
•
Sharpens focus on distinct
strategic priorities and
distribution channels
•
Closer alignment of
compensation/incentives to
performance
Operational
•
Little overlap, no significant
synergies from operating as
combined entity
•
Enhances ability to address
unique customer needs
•
Greater opportunity to build
stronger and more intimate
customer relationships
Financial
•
Optimized capital
structures to match
different risk and cash
flow profiles
•
Direct access to capital
markets to fund growth
agendas
•
Allows investors to better
assess each business on
its own merits |
 8
Outlook
Positioning both businesses to succeed as independent companies
Both businesses more profitable in 2016
[Armstrong World
Industries] •
Volumes grow for the first time since 2008
•
Another solid year in the Americas
•
Profit growth in Europe, but challenges from
Russia and the Ruble
•
Growth continues in the Pacific Rim
[Armstrong Flooring
•
North America commercial up low single digits, Residential new and R&R both
up •
UK and Middle East improve, offset by soft Euro-zone and challenging
Russia •
China up except for high-end office, India strong, Australia mixed
•
Overall emerging markets challenged
Economic
Conditions
•
2015 is a year of investment in North America
•
Especially in the residential sector
•
Recapture volumes, reinvigorate products and
set the stage for 2016
•
LVT and Somerset investments come on-line in
2015 |
 9
Financial Review
Financial Review |
 10
European Flooring Exit –
2014 Guidance Impact
•
European Flooring Business
•
Announced decision to exit European flooring business in Q4 2014
•
Treated as discontinued operation starting in Q4 2014 and removed from historical
presentation within continuing operations
•
Results had previously been included in the Resilient segment
Q4 2014
FY 2014
October sales guidance
$610 -
$650 million
$2,680 -
$2,720 million
October EBITDA guidance
$55 -
$75 million
$355 -
$375 million
Estimated European Flooring sales
$50 million
$210 million
Estimated European Flooring EBITDA
($5) million
($10) million
Implied Guidance ranges excluding European Flooring
Sales
$560 -
$600M
$2,470 -
$2,510
EBITDA
$60 -
$80M
$365 -
$385 |
 11
Key Metrics –
Fourth Quarter 2014
2014
2013
Variance
Net Sales
(1)
$595
$610
(2.5%)
Operating
Income
(2)
47
44
7.3%
% of Sales
8.0%
7.2%
80 bps
EBITDA
78
72
8.3%
% of Sales
13.2%
11.8%
140 bps
Earnings
Per
Share
(3)
$0.38
$0.35
6.9%
Free Cash Flow
49
(7)
768%
Net Debt
857
954
(97)
ROIC
(4)
7.7%
9.8%
(210 bps)
(1)
As reported Net Sales: $587 million in 2014 and $615 million in 2013
(2)
As reported Operating Income: $36 million in 2014 and $43 million in 2013
(3)
As reported EPS: $0.19 in 2014 and $0.42 in 2013
(4)
Unadjusted |
 12
Fourth Quarter 2014 vs. PY–
Adjusted EBITDA to Reported Net Income
2014
2013
V
EBITDA–
Adjusted
$78
$72
$6
Depreciation and Amortization
(31)
(28)
(3)
Operating
Income
–
Adjusted
$47
$44
$3
Non-cash impact of U.S. pension
-
(1)
1
Foreign Exchange Movements
(1)
-
(1)
Impairment
10
-
10
Cost Reduction Initiatives
2
2
-
Operating
Income
–
As
Reported
$36
$43
($7)
Interest/Other (Expense)
(12)
(12)
-
EBT
$24
$31
($7)
Tax (Expense)
(13)
(8)
(5)
Net Income
$11
$23
($12) |
 13
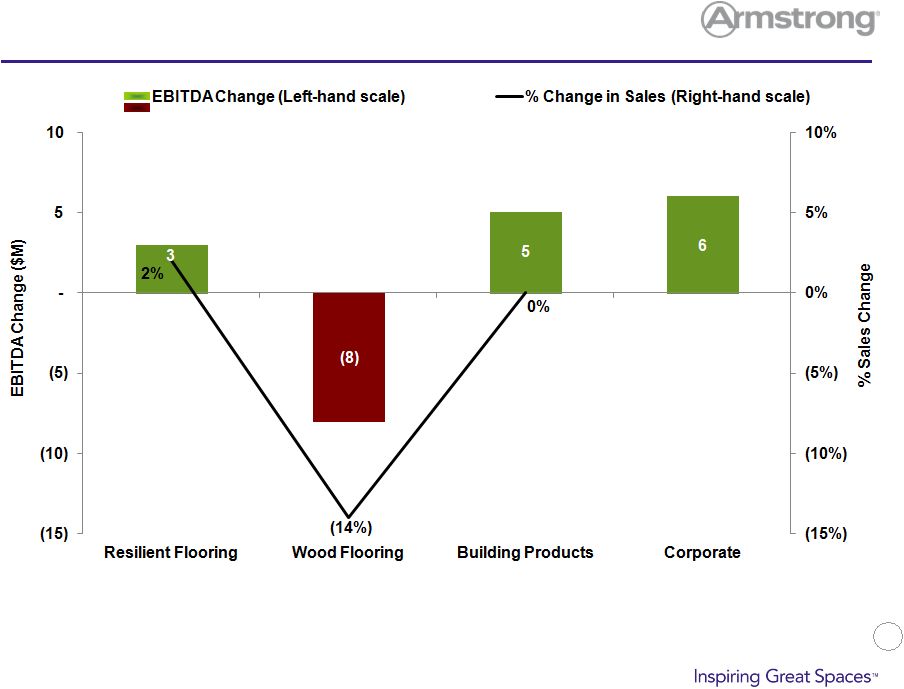
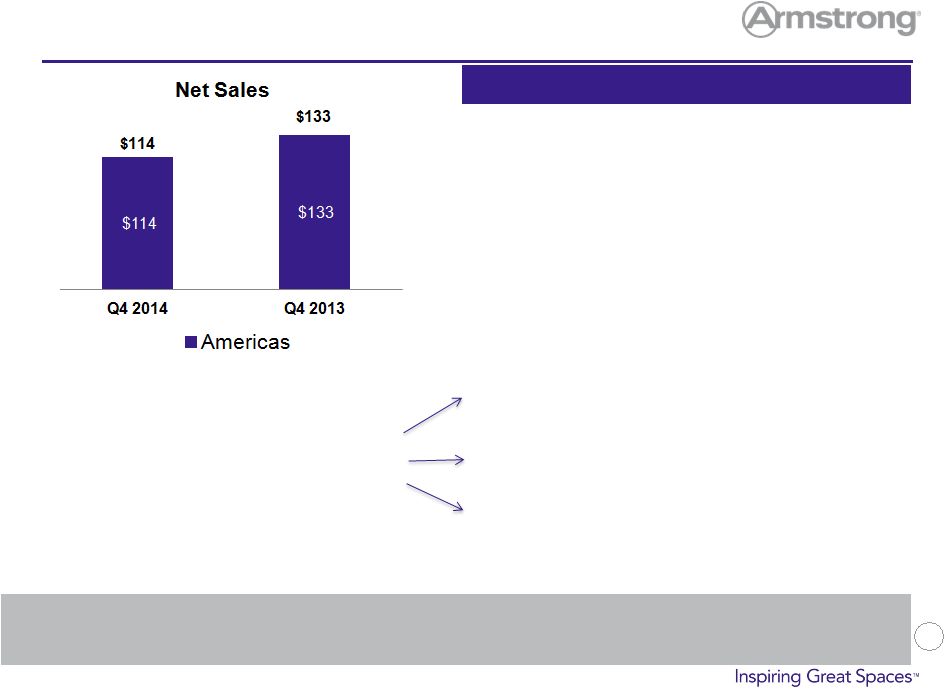
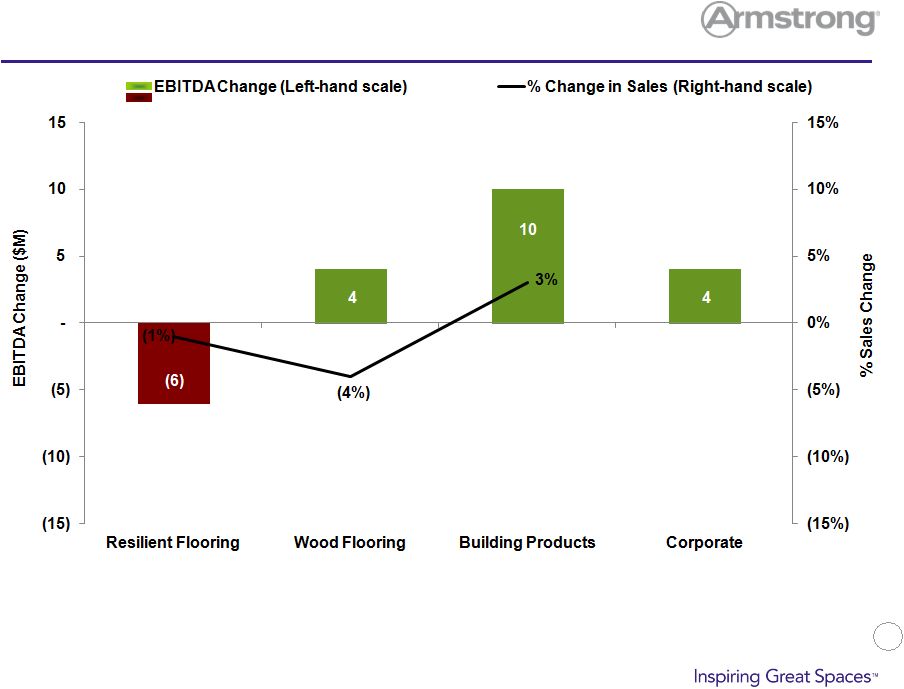
Fourth Quarter Sales and EBITDA by Segment –
2014 vs. Prior Year |
 14
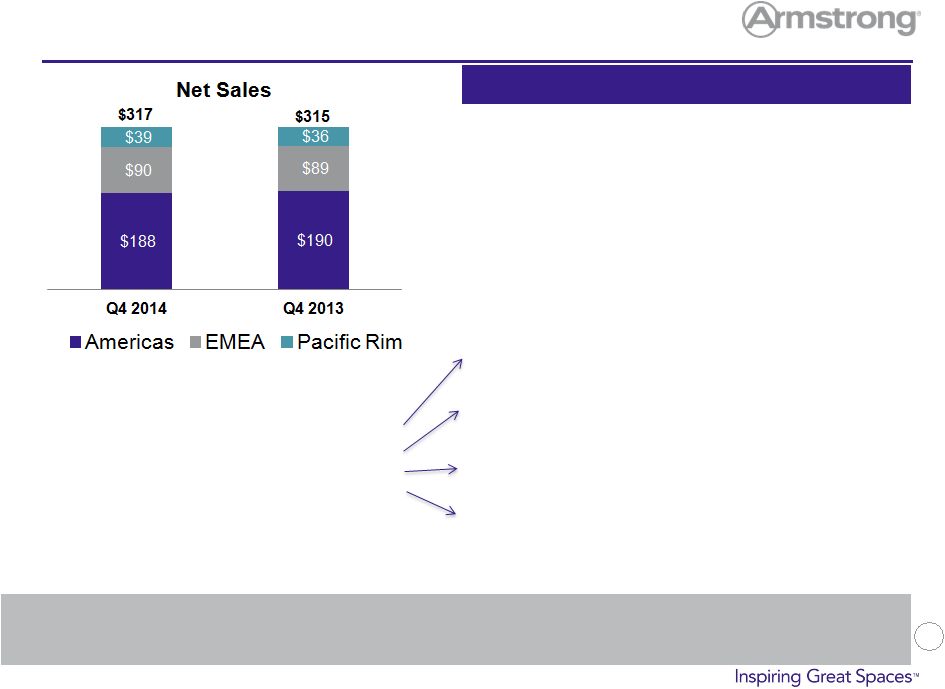
•
Sales increased slightly over a strong base period
(sales were up over 9% in the fourth quarter of 2013).
Price and mix both improved and were only partially
offset by lower volumes, primarily in the Americas.
•
Soft year-on-year retail activity driven by Lowes load-in
in 2013
•
Reflects impact of price increases announced earlier in
year and continued strong mix performance.
•
Driven by lower volumes in the Americas.
•
Strong productivity in the Americas more than offset
increased costs associated with Russia plant
construction and higher input costs.
•
Lower SG&A spending in the Americas and Pacific Rim
Building Products Fourth Quarter Results
Margin improvement demonstrates strong operating leverage as adjusted EBITDA
improved 7% despite volume declines and higher plant construction and input
costs Key Highlights
Q4 2013 Adjusted EBITDA
$ 68M
Price & Mix
8
Volume
(9)
Manufacturing & Input Costs
4
SG&A
2
Q4 2014 Adjusted EBITDA
$ 73M |
 15
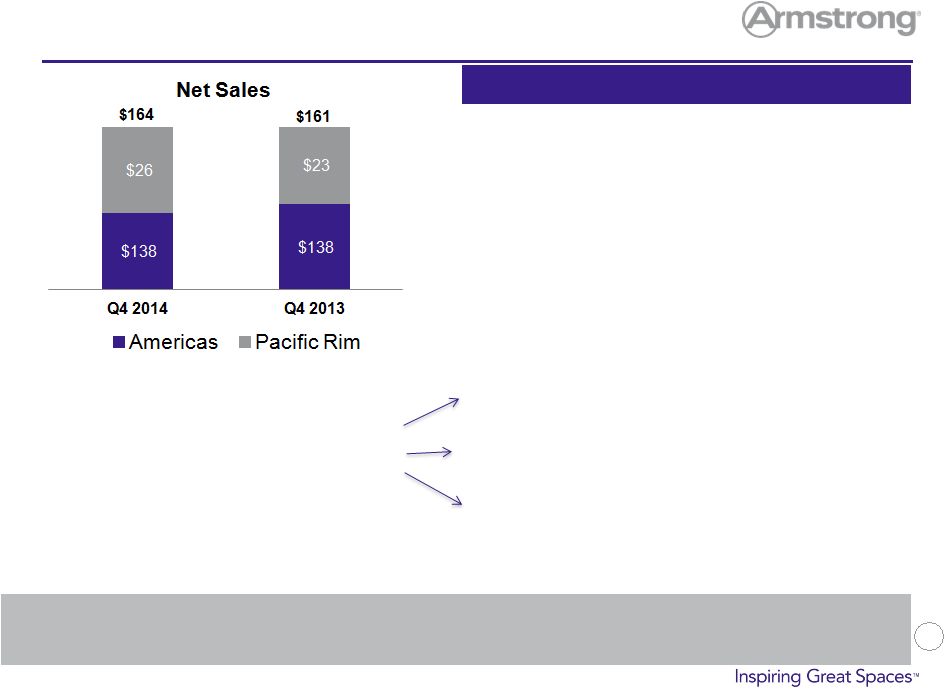
•
Sales increased slightly as strength in the Pacific Rim
offset lower volumes in the Americas. Mix
improvements in the Americas offset the lower
volumes.
•
With commercialization of the two plants in China
completed, volumes in China were up over 30%.
•
Driven by positive mix performance in the Americas
and Pacific Rim.
•
Double digit volume growth in the Pacific Rim was
more than offset by lower volumes in the Americas.
•
Strong productivity offset input cost inflation
Resilient Fourth Quarter Results
Improved results in the Pacific Rim and strong global productivity drove margin
improvement
Key Highlights
Q4 2013 Adjusted EBITDA
$ 18M
Price & Mix
1
Volume
(1)
Manufacturing & Input Costs
3
Q4 2014 Adjusted EBITDA
$ 21M |
 16
•
Sales declined 15% despite improvements in price and
mix as pricing actions by competitors resulted in lower
volumes.
•
The comparison was impacted by a strong base period
(sales were up over 20% in the fourth quarter of 2013).
•
Reflects impact of price increases announced earlier in
the year as a result of higher lumber costs and
continued mix improvements.
•
Lower volumes driven by share loss at opening price
points.
•
Continued increases year on year in lumber costs.
Wood Fourth Quarter Results
Despite improved price and mix performance, sales and margins decline due to
lower volumes and continued elevated lumber pricing
Key Highlights
Q4 2013 Adjusted EBITDA
$ 4M
Price & Mix
9
Volume
(10)
Manufacturing & Input Costs
(6)
SG&A
(1)
Q4 2014 Adjusted EBITDA
$ (4M) |
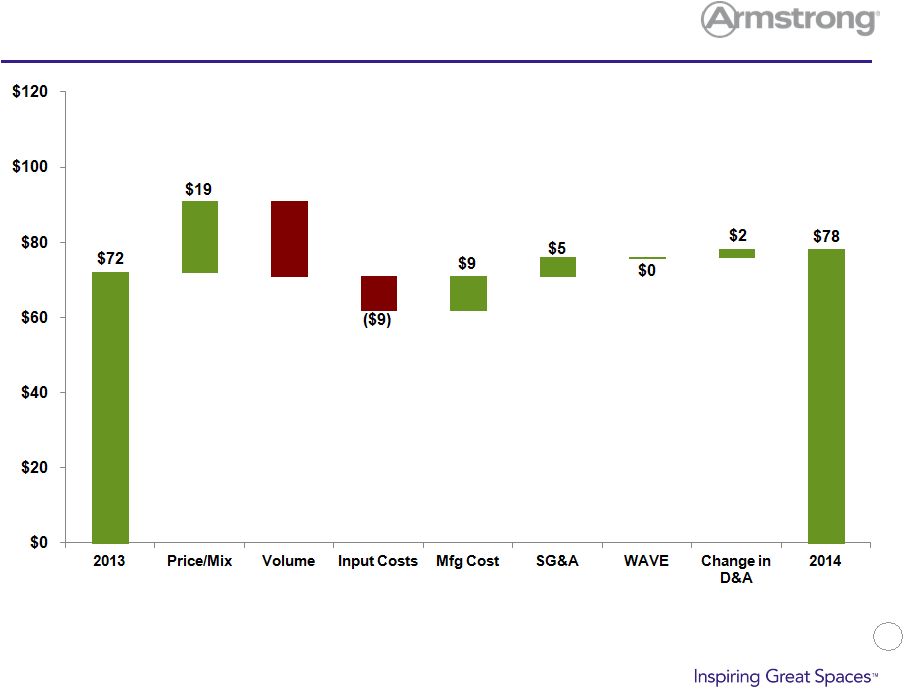 17
EBITDA Bridge –
Fourth Quarter 2014 vs. Prior Year
($20) |
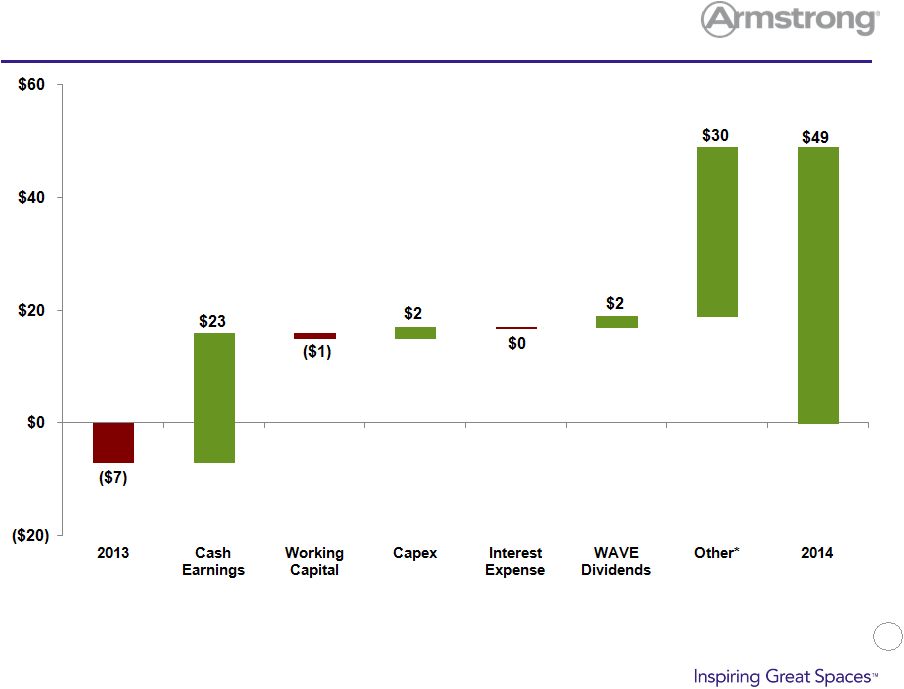 18
Free
Cash
Flow
–
Fourth
Quarter
2014
vs.
Prior
Year
* Includes $24 million associated with the closing of intercompany loan hedges
|
 19
Key Metrics –
Full Year 2014
2014
2013
Variance
Net
Sales
(1)
$2,515
$2,508
0.3%
Operating
Income
(2)
266
269
(1.3%)
% of Sales
10.6%
10.7%
(10 bps)
EBITDA
384
372
3.2%
% of Sales
15.3%
14.8%
50 bps
Earnings
Per
Share
(3)
$2.32
$2.11
10.1%
Free Cash Flow
64
68
(6.3%)
(1)
As
reported
Net
Sales:
$2,515
million
in
2014
and
$2,527
million
in
2013
(2)
As reported Operating Income: $239 million in 2014 and $266 million in 2013
(3)
As reported EPS: $1.83 in 2014 and $2.17 in 2013 |
 20
Full Year Sales and EBITDA by Segment –
2014 vs. Prior Year |
 21
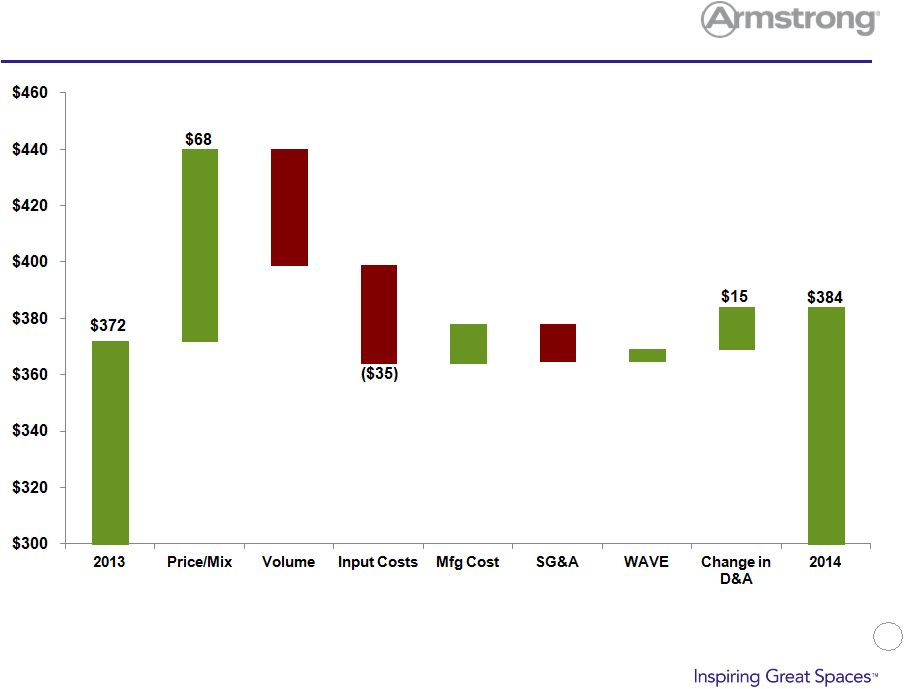
EBITDA Bridge –
Full Year 2014 vs. Prior Year
($13)
($41)
$4
$14 |
 22
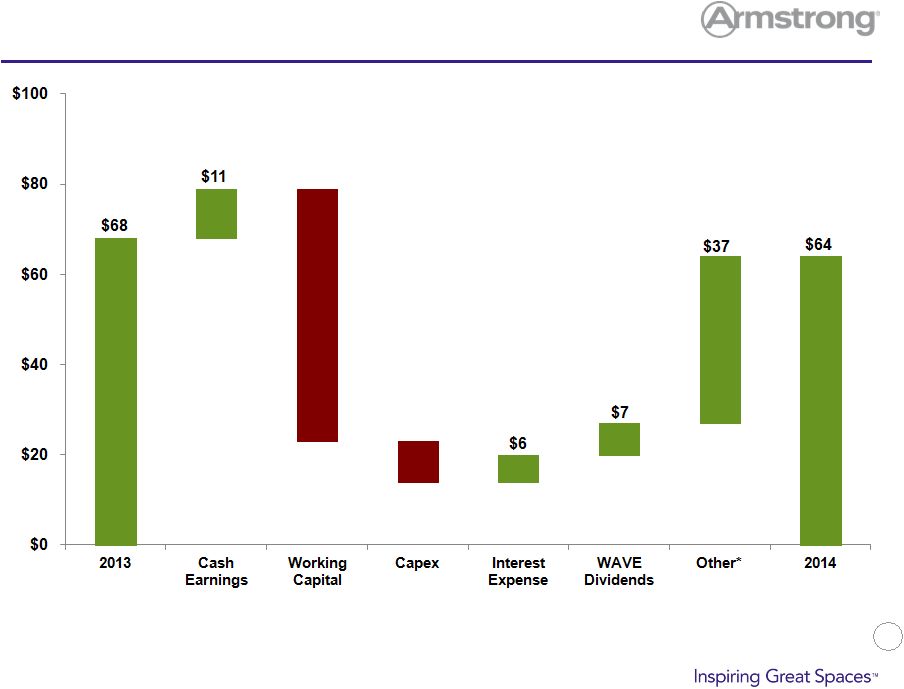
Free
Cash
Flow
–
Full
Year
2014
vs.
Prior
Year
($56)
($9)
* Includes $29 million associated with the closing of intercompany loan hedges
|
 23
2015 Estimate Range
(1)
2014
(2)
Variance
Net Sales
(3)
2,525
to
2,625
2,515
0%
to
4%
Operating Income
(4)
230
to
270
271
(15%)
to
(1%)
EBITDA
350
to
390
389
(10%)
to
0%
Earnings Per Share
(5)
$2.05
to
$2.45
$2.38
(14%)
to
3%
(1)
Guidance is presented using 2015 budgeted foreign exchange rates
(2)
2014 results are presented using 2015 budgeted foreign exchange rates
(3)
2015 and 2014 net sales include the impact of foreign exchange
(4)
As reported Operating Income: $175 -
$215 million in 2015 and $239 million 2014
(5)
As reported earnings per share: $1.25 -
$1.60
in 2015 and $1.83 in 2014
Key Metrics –
Guidance 2015 |
 24
2015 Financial Outlook
Sales
(1)
$1,300-$1,350 million; EBITDA $335-$360 million
Sales
(1)
$1,225-$1,275 million; EBITDA $80-$100 million
EBITDA ($65) –
($70)
$45 -
$55 million; Adjusted long-term ETR of ~39%
(2)
$125 -
$150 million
Non-cash:
$22 -
$28 million US pension expense
Cash:
$20 -
$40 million transaction costs
ABP Segment
AFP
Segment
Cash Taxes/ETR
Capital Spending
Exclusions from EBITDA
(1)
Net sales include foreign exchange impact
(2)
As reported ETR of 47% for 2015
Corporate Segment |
 25
Appendix |
 26
Full Year 2014 vs. Prior Year –
Adjusted EBITDA to Reported Net Income
2014
2013
V
EBITDA–
Adjusted
$384
$372
$12
Depreciation and Amortization
(118)
(103)
(15)
Operating
Income
–
Adjusted
$266
$269
($3)
Non-cash impact of U.S. pension
1
(2)
3
Foreign Exchange Movements
(1)
(2)
1
Impairments
13
-
13
Cost Reduction Initiatives
14
7
7
Operating
Income
–
As
Reported
$239
$266
($27)
Interest/Other (Expense)
(54)
(67)
13
EBT
$185
$199
($14)
Tax (Expense)
(83)
(72)
(11)
Net Income
$102
$127
($25) |
 27
Consolidated Results
Fourth Quarter
2014
Reported
Comparability
(1)
Adjustments
FX
(2)
Adj
2014
Adjusted
2013
Reported
Comparability
(1)
Adjustments
FX
(2)
Adj
2013
Adjusted
Net Sales
587
-
8
595
615
-
(5)
610
Operating
Income
36
12
(1)
47
43
1
-
44
EPS
$0.19
$0.20
($0.01)
$0.38
$0.42
($0.07)
-
$0.35
Full Year
2014
Reported
Comparability
(1)
Adjustments
FX
(2)
Adj
2014
Adjusted
2013
Reported
Comparability
(1)
Adjustments
FX
(2)
Adj
2013
Adjusted
Net Sales
2,515
-
-
2,515
2,527
-
(19)
2,508
Operating
Income
239
28
(1)
266
266
5
(2)
269
EPS
$1.83
$0.50
($0.01)
$2.32
$2.17
($0.04)
($0.02)
$2.11
(1)
See earnings press release and 10-K for additional detail on comparability
adjustments (2)
Eliminates impact of foreign exchange movements |
 28
Segment Operating Income (Loss)
Fourth Quarter
2014
Reported
Comparability
(1)
Adjustments
2014
Adjusted
2013
Reported
Comparability
(1)
Adjustments
2013
Adjusted
Building Products
55
-
55
52
1
53
Resilient Flooring
16
(1)
15
10
1
11
Wood Flooring
(19)
12
(7)
0
-
0
Unallocated Corporate
(Expense) Income
(16)
-
(16)
(19)
(1)
(20)
Full Year
2014
Reported
Comparability
(1)
Adjustments
2014
Adjusted
2013
Reported
Comparability
(1)
Adjustments
2013
Adjusted
Building Products
265
(2)
263
263
-
263
Resilient Flooring
61
5
66
70
3
73
Wood Flooring
(2)
(15)
23
8
6
-
6
Unallocated Corporate
(Expense) Income
(72)
1
(71)
(73)
-
(73)
(1)
Eliminates impact of foreign exchange movements and non-recurring items; see
earnings press release and 10-K for additional detail. (2)
Includes a $1 million gain in the second quarter of 2014 related
to a refund of previously paid duties on imports of engineered wood flooring
|
 29
Cash Flow
Fourth Quarter
Full Year
($ millions)
2014
2013
2014
2013
Net cash from operations
$98
$52
$209
$214
Net cash (used for) investing
(52)
(59)
(149)
(146)
Add back (subtract) adjustments to reconcile to
free cash flow
Net cash effect from deconsolidation of
European Flooring business
4
-
4
-
Other
(1)
-
-
-
Free Cash Flow
$49
($7)
$64
$68
Cash flow includes cash flows attributable to the European flooring business
|