Attached files
| file | filename |
|---|---|
| EX-99 - EX-99 - PUBLIC SERVICE ENTERPRISE GROUP INC | d875794dex99.htm |
| 8-K - FORM 8-K - PUBLIC SERVICE ENTERPRISE GROUP INC | d875794d8k.htm |
 Public Service Enterprise Group
PSEG Earnings Conference Call
4 Quarter & Year-end 2014
February 20, 2015
EXHIBIT 99.1
th |
| 1
Forward-Looking Statement
Certain of the matters discussed in this report about our and our subsidiaries'
future performance, including, without limitation, future revenues, earnings, strategies, prospects, consequences
and all other statements that are not purely historical constitute
“forward-looking statements” within the meaning of the Private Securities Litigation Reform Act of 1995. Such forward-looking
statements are subject to risks and uncertainties, which could cause actual
results to differ materially from those anticipated. Such statements are based on management's beliefs as well as
assumptions made by and information currently available to management. When
used herein, the words “anticipate,” “intend,” “estimate,” “believe,” “expect,” “plan,” “should,” “hypothetical,”
“potential,” “forecast,” “project,” variations of
such words and similar expressions are intended to identify forward-looking statements. Factors that may cause actual results to differ are often
presented with the forward-looking statements themselves. Other factors
that could cause actual results to differ materially from those contemplated in any forward-looking statements made
by us herein are discussed in filings we make with the United States Securities
and Exchange Commission (SEC), including our Annual Report on Form 10-K and subsequent reports on Form
10-Q and Form 8-K and available on our website: http://www.pseg.com.
These factors include, but are not limited to: •
adverse changes in the demand for or the price of the capacity and energy that
we sell into wholesale electricity markets, •
adverse changes in energy industry law, policies and regulation, including
market structures and transmission planning, •
any inability of our transmission and distribution businesses to obtain
adequate and timely rate relief and regulatory approvals from federal and state regulators,
•
changes in federal and state environmental regulations and enforcement that
could increase our costs or limit our operations, •
changes in nuclear regulation and/or general developments in the nuclear power
industry, including various impacts from any accidents or incidents experienced at our
facilities or by others in the industry, that could limit operations of our
nuclear generating units, •
actions or activities at one of our nuclear units located on a multi-unit
site that might adversely affect our ability to continue to operate that unit or other units located at
the same site,
•
any inability to manage our energy obligations, available supply and risks,
•
adverse outcomes of any legal, regulatory or other proceeding, settlement,
investigation or claim applicable to us and/or the energy industry,
•
any deterioration in our credit quality or the credit quality of our
counterparties, •
availability of capital and credit at commercially reasonable terms and
conditions and our ability to meet cash needs, •
changes in the cost of, or interruption in the supply of, fuel and other
commodities necessary to the operation of our generating units, •
delays in receipt of necessary permits and approvals for our
construction and development activities, •
delays or unforeseen cost escalations in our construction and development
activities, •
any inability to achieve, or continue to sustain, our expected levels of
operating performance, •
any equipment failures, accidents, severe weather events or other incidents
that impact our ability to provide safe and reliable service to our customers, and any inability
to obtain sufficient insurance coverage or recover proceeds of insurance with
respect to such events, •
acts of terrorism, cybersecurity attacks or intrusions that could adversely
impact our businesses, •
increases in competition in energy supply markets as well as for transmission
projects, •
any inability to realize anticipated tax benefits or retain tax credits,
•
challenges associated with recruitment and/or retention of a qualified
workforce, •
adverse performance of our decommissioning and defined benefit plan trust fund
investments and changes in funding requirements, •
changes in technology, such as distributed generation and micro grids, and
greater reliance on these technologies, and •
changes in customer behaviors, including increases in energy efficiency,
net-metering and demand response. All of the forward-looking statements made in this report are qualified by
these cautionary statements and we cannot assure you that the results or developments anticipated by management
will be realized or even if realized, will have the expected consequences to,
or effects on, us or our business prospects, financial condition or results of operations. Readers are cautioned not to
place undue reliance on these forward-looking statements in making any
investment decision. Forward-looking statements made in this report apply only as of the date of this report. While we
may elect to update forward-looking statements from time to time, we
specifically disclaim any obligation to do so, even if internal estimates change, unless otherwise required by applicable
securities laws.
The forward-looking statements contained in this report are intended to
qualify for the safe harbor provisions of Section 27A of the Securities Act of 1933, as amended, and Section 21E of the
Securities Exchange Act of 1934, as amended. |
 2
GAAP Disclaimer
PSEG presents Operating Earnings in addition to its Net Income reported in
accordance with accounting principles generally accepted in the United
States (GAAP). Operating Earnings is a non-GAAP financial measure that
differs from Net Income because it excludes gains or losses associated with
Nuclear Decommissioning Trust (NDT), Mark-to-Market (MTM) accounting,
and other material one-time items. PSEG presents Operating Earnings
because management believes that it is appropriate for investors
to
consider results excluding these items in addition to the results reported in
accordance with GAAP. PSEG believes that the non-GAAP financial
measure of Operating Earnings provides a consistent and comparable
measure of performance of its businesses to help shareholders understand
performance trends. This information is not
intended to be viewed as an
alternative to GAAP information. The last slide in this presentation includes
a list of items excluded from Net Income to reconcile to Operating Earnings,
with a reference to that slide included on each of the slides where the
non- GAAP information appears.
These
materials
and
other
financial
releases
can
be
found
on
the
pseg.com
website
under the investor tab, or at http://investor.pseg.com/
|
 PSEG
2014 Q4 and Full Year Review
Ralph Izzo
Chairman, President and Chief Executive Officer |
 4
Q4 Earnings Summary
$ millions (except EPS)
2014
2013
Operating Earnings
$ 247
$ 248
Reconciling Items, Net of Tax
229
(48)
Net Income
$ 476
$ 200
EPS from Operating Earnings*
$ 0.49
$ 0.49
Quarter ended December 31
* See Slide 32 for Items excluded from Net Income to reconcile to Operating
Earnings. |
 5
Full-year Earnings Summary –
EPS exceeded guidance
$ millions (except EPS)
2014
2013
Operating Earnings
$ 1,400
$ 1,309
Reconciling Items, Net of Tax
118
(66)
Net Income
$ 1,518
$ 1,243
EPS from Operating Earnings*
$ 2.76
$ 2.58
Twelve Months ended December 31
* See Slide 32 for Items excluded from Net Income to reconcile to Operating
Earnings. |
 6
PSEG –
2014 Highlights
Strong 2014 financial performance –
exceeded upper end of guidance
Achieved operating earnings of $2.76 per share, up 7% compared to $2.58
per share in 2013
PSE&G
achieved
double-digit
growth
in
earnings,
adding
to
5
years
of
18%
compound
annual growth
PSEG Power’s operating earnings exceeded the high end of guidance
Continued operational excellence
PSE&G’s control of O&M supported results
Power generation up 1.3% for the year led by record CCGT production and
strong Hope Creek performance
PSE&G recognized for the 13
**
consecutive year as the Mid-Atlantic region’s
most reliable electric utility
Disciplined capital investment –
producing results
Transmission projects in construction –
on schedule and on budget
Energy Strong investments underway –
gas mains replacement prioritized
Power announced a new $100-$120 million investment in the PennEast
Pipeline Filed Energy Efficiency II extension with NJBPU ($100 million)
th |
 PSEG
Annual Dividend – Increased 5.4%
PSEG Annual Dividend Rate
*INDICATED ANNUAL PSEG COMMON DIVIDEND RATE PER SHARE.
**2015 PAYOUT RATIO REFLECTS THE INDICATED ANNUAL DIVIDEND RATE DIVIDED BY THE
MIDPOINT OF 2015 OPERATING EARNINGS GUIDANCE OF $2.75-2.95 PER SHARE.
7
Payout
Ratio
63%
66%
43%
44%
43%
44%
50%
58%
56%
54%
55%**
An improved rate of growth in the dividend, building on a
long history of returning cash to the shareholder |
 8
$2.75 -
$2.95E
PSEG 2015 Earnings Guidance –
Anticipates Another Year of Growth
$2.58
* See Slide 32 for Items excluded from Net Income to reconcile to Operating
Earnings. E = Estimate.
$2.76
2015 guidance reflects continued increased level of investment,
and assumes normal weather and unit operations |
 PSEG
2014 Q4 Operating Company Review
Caroline Dorsa
EVP and Chief Financial Officer |
 10
Q4 Operating Earnings by Subsidiary
Operating Earnings
Earnings per Share
$ millions (except EPS)
2014
2013
2014
2013
PSE&G
$ 160
$ 144
$ 0.32
$ 0.29
PSEG Power
91
115
0.18
0.23
PSEG Enterprise/Other
(4)
(11)
(0.01)
(0.03)
Operating Earnings*
$ 247
$ 248
$ 0.49
$ 0.49
Quarter ended December 31
* See Slide 32 for Items excluded from Net Income to reconcile to Operating
Earnings. |
 11
$0.49
0.03
0.02
$0.49
(0.05)
0.00
0.10
0.20
0.30
0.40
0.50
0.60
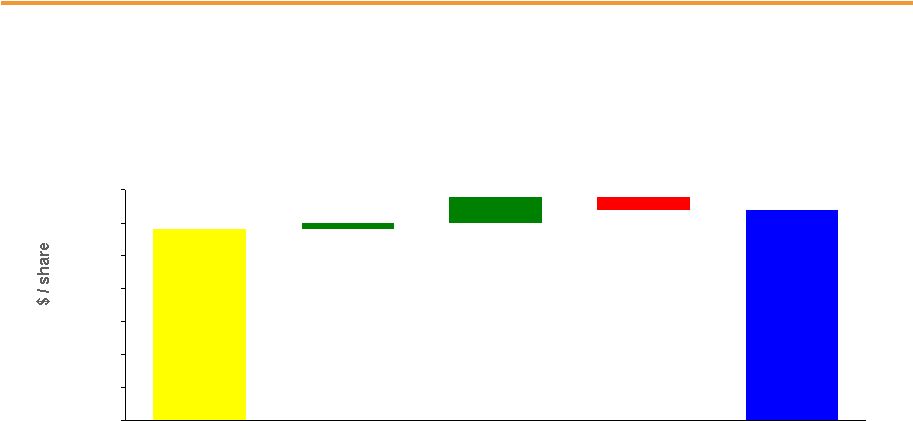
PSEG EPS Reconciliation –
Q4 2014 versus Q4 2013
Capacity (0.09)
Re-Contracting
and Market
Pricing 0.01
O&M 0.05
D&A and
Other (0.02)
Transmission 0.02
O&M (Distribution) 0.04
Gas Volume
& Demand 0.01
Electric Volume
& Demand (0.01)
Weather (0.01)
Taxes and
Other (0.02)
Q4 2014
Operating
Earnings*
Q4 2013
Operating
Earnings*
PSEG Power**
PSE&G**
PSEG
Enterprise/
Other
*
See
Slide
32
for
Items
excluded
from
Net
Income
to
reconcile
to
Operating
Earnings.
** Prior quarter results for reconciling items may not add to year-to-date
(YTD) totals due to rounding. Taxes
and
Other |
 12
Strong
Full-year
Operating
Earnings
Delivered
–
Up
7%
Operating Earnings
Earnings per Share
$ millions (except EPS)
2014
2013
2014
2013
PSE&G
$ 725
$ 612
$ 1.43
$ 1.21
PSEG Power
642
710
1.27
1.40
PSEG Enterprise/Other
33
(13)
0.06
(0.03)
Operating Earnings*
$ 1,400
$ 1,309
$ 2.76
$ 2.58
Twelve Months ended
December 31
•See Slide 32 for Items excluded from Net Income to reconcile to Operating
Earnings. |
 13
$2.58
0.22
0.09
$2.76
(0.13)
0.00
0.50
1.00
1.50
2.00
2.50
3.00
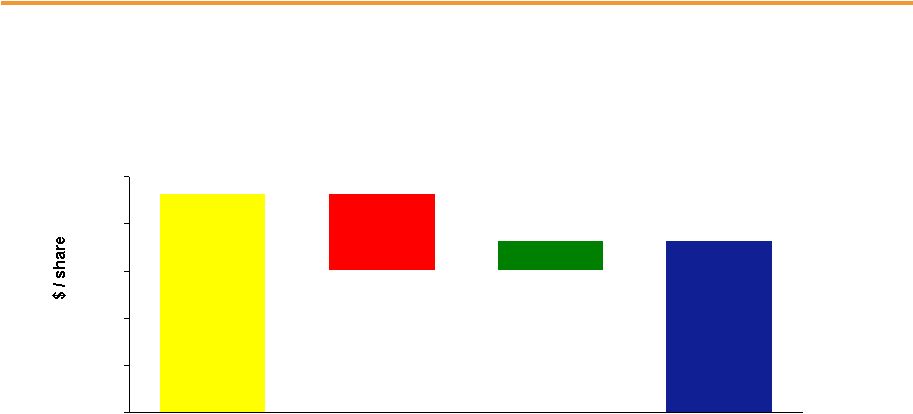
PSEG EPS Reconciliation –
Full-year 2014 versus
Full-year 2013
Capacity (0.04)
Re-Contracting
and Market
Pricing (0.10)
O&M 0.02
D&A and
Other (0.01)
Transmission 0.11
Gas Volume
& Demand 0.03
Weather (0.02)
O&M (Distribution)
0.08
Lower Interest 0.02
2014
Operating
Earnings*
2013
Operating
Earnings*
PSEG Power**
PSE&G**
PSEG
Enterprise/
Other
Taxes 0.04
PSEG
Long Island 0.02
Other 0.03
*
See
Slide
32
for
Items
excluded
from
Net
Income
to
reconcile
to
Operating
Earnings.
** Prior quarter results for reconciling items may not add to year-to-date
(YTD) totals due to rounding. |
 PSE&G
2014 Q4 Review |
 15
PSE&G –
Q4 Earnings Summary
$ millions (except EPS)
Q4 2014
Q4 2013
Variance
Operating Revenues
$ 1,531
$ 1,571
$ (40)
Operating Expenses
Energy Costs
631
633
(2)
Operation & Maintenance
368
435
(67)
Depreciation & Amortization
224
214
10
Taxes Other than Income Taxes
-
18
(18)
Total Operating Expenses
1,223
1,300
(77)
Operating Earnings / Net Income
$ 160
$ 144
$ 16
EPS from Operating Earnings
$ 0.32
$ 0.29
$ 0.03 |
 $0.29
0.01
0.04
$0.32
(0.02)
0.00
0.05
0.10
0.15
0.20
0.25
0.30
0.35
16
PSE&G EPS Reconciliation –
Q4 2014
versus Q4 2013
Q4 2014
Operating
Earnings
Q4 2013
Operating
Earnings
Transmission
Margin 0.02
Gas Volume &
Demand 0.01
Electric Volume &
Demand (0.01)
Weather (0.01)
O&M
(Distribution)
Taxes
and Other
Prior quarter results for reconciling items may not add to year-to-date
(YTD) totals due to rounding. |
 17
PSE&G –
Q4 Operating Highlights
Construction of major transmission lines continues on schedule and on budget
FERC approved formula rate revenue increase of $182 million, effective January 1,
2015 Energy Efficiency extension filing pending at NJBPU
PSE&G extended BGSS gas rate credits through March 2015; this winter’s
total PSE&G bill credit is ~$210, or a 31% savings for the average gas
customer (Nov 2014-Mar 2015) PSE&G recognized for the 13
**
year as the Mid-Atlantic region’s most reliable electric utility
PSE&G ranks “Highest in Customer Satisfaction with Large Business Electric
Service and Business Natural Gas Service in the East”
according to a 2015 J.D. Power study
Operations
Regulatory and Market
Environment
PSE&G earned its authorized return in 2014
Financial
Q4 weather was warmer than both Q4 2013 and normal: Heating degree days were
4.2% lower than Q4 ‘13 and 0.7% lower than normal
Gas sales were up 1% for Q4 and up 3.1% for the year on a weather normalized
basis Electric sales were down 2.3% in Q4 but up 0.3% for the year on a
weather adjusted basis th |
 PSEG
Power 2014 Q4 Review |
 19
PSEG Power –
Q4 EPS Summary
$ millions (except EPS)
Q4 2014
Q4 2013
Variance
Operating Revenues
$ 1,610
$ 1,245
$ 365
Operating Earnings
91
115
(24)
Pro Forma Adjustments,
Net of Tax**
229
(48)
277
Net Income
$ 320
$ 67
$ 253
EPS from Operating Earnings*
$ 0.18
$ 0.23
$ (0.05)
* See Slide 32 for Items excluded from Net Income to reconcile to Operating
Earnings. **Includes the financial impact from Mark-to-Market
positions with forward delivery months. |
 20
$0.23
0.03
$0.18
(0.08)
0.00
0.05
0.10
0.15
0.20
0.25
Lower Capacity (0.09)
Re-Contracting
and Market
Pricing 0.01
PSEG Power EPS Reconciliation –
Q4 2014 versus Q4 2013
Q4 2014
Operating
Earnings*
Q4 2013
Operating
Earnings*
Lower O&M
0.05
D&A and
Other (0.02)
* See Slide 32 for Items excluded from Net Income to reconcile to Operating
Earnings. |
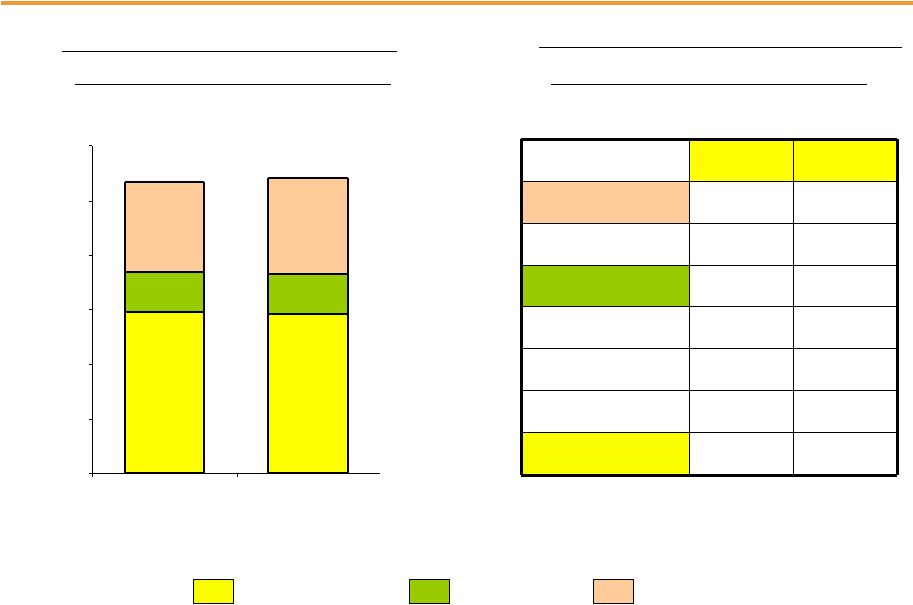
 21
PSEG Power –
Q4 Generation Measures –
Volume %
6,712
6,956
1,797
1,266
3,962
4,637
0
7,500
15,000
2013
2014
Quarter ended December 31
Total Nuclear
Total Coal*
Oil & Natural Gas
* Includes figures for Pumped Storage. Includes Hudson and Mercer when run on gas.
PSEG Power –
Generation (GWh)
12,471
12,859
Quarter ended December 31
PSEG Power –
Capacity Factors (%)
2013
2014
Combined Cycle
PJM and NY
53.1%
59.9%
Coal*
NJ (Coal/Gas)
3.2%
0.7%
PA
87.3%
68.4%
CT
29.1%
13.8%
Nuclear
81.7%
84.5% |
 22
PSEG
Power
–
Full-Year
Generation
Measures
–
Volume
%
29,495
29,108
7,323
7,361
16,640
17,693
0
10,000
20,000
30,000
40,000
50,000
60,000
2013
2014
Twelve months ended December 31
Total Nuclear
Total Coal*
Oil & Natural Gas
* Includes figures for Pumped Storage. Includes Hudson and Mercer when run on
gas. PSEG Power –
Generation (GWh)
53,458
54,162
Twelve months ended December 31
PSEG Power –
Capacity Factors (%)
2013
2014
Combined Cycle
PJM and NY
56.0%
56.0%
Coal*
NJ (Coal/Gas)
11.3%
14.0%
PA
81.4%
75.7%
CT
19.7%
23.7%
Nuclear
90.3%
89.3% |
 23
PSEG Power –
Fuel Costs
Quarter ended December 31
($ millions)
2013
2014
Coal
47.3
38.8
Oil & Gas
134.9
134.2
Total Fossil
182.2
173.0
Nuclear
53.6
48.5
Total Fuel Cost
235.8
221.5
Total Generation
(GWh)
12,471
12,859
$ / MWh
18.91
17.23
PSEG Power –
Fuel Costs
Twelve months ended
December 31
($ millions)
2013
2014
Coal
188.7
208.5
Oil & Gas
618.8
757.7
Total Fossil
807.5
966.2
Nuclear
220.2
210.4
Total Fuel Cost
1,027.7
1,176.6
Total Generation
(GWh)
53,458
54,162
$ / MWh
19.22
21.72 |
 24
PSEG Power –
Q4 2014 Gross Margin Performance
$0
$10
$20
$30
$40
$50
$60
2012
2013
2014
$0
$10
$20
$30
$40
$50
$60
2012
2013
2014
$46
Quarter ended
December 31
Twelve Months ended
December 31
$45
Lower capacity pricing in second half of 2014
Lower quarter-over-quarter market prices influenced by warmer than
normal weather
Access to Marcellus gas continues to provide fuel cost savings
Regional Performance
Region
Q4 Gross
Margin ($M)
Q4 2014 Performance
PJM
$452
Lower capacity prices, lower market
pricing and higher generation output
New
England
$14
Lower generation and lower market
pricing
New York
$14
Higher generation and lower market
pricing
PSEG Power Gross Margin ($/MWh)
$46
$47
$37
$42 |
 25
Full Requirements Component
Capacity Markets/RPM
Growing Renewable Energy/Transmission
Component for Market Risk
Market Perspective –
2015 BGS Auction Results
…
reflects a 2.2% increase over the prior year
driven primarily by transmission and green costs
Note: BGS prices reflect PSE&G Zone; results from the 2013-2015 auctions
will be the new blended prices beginning June 1, 2015. Three-Year
Average Round the Clock
PJM West Forward
Energy Price
Capacity
Load shape
Transmission
Congestion
Ancillary services
Risk premium
Green
2011
2012
2013
2014
2015
$97.39
$94.30
~ $48
~ $46
~ $53
$83.88
~
$59
$92.18
$45
-
$47
$37
-
$38
$39
-
$40
$38
-
$39
$37
-
$38
~ $62
$99.54 |
 26
Hedging Update…
Contracted Energy*
* Hedge percentages and prices as of February 12, 2015. Revenues of full
requirement load deals based on contract price, including renewable energy credits, ancillary, and transmission
components
but
excluding
capacity.
Hedges
include
positions
with
MTM
accounting
treatment
and
options.
2015
2016
2017
Volume TWh
36
36
36
Base Load
% Hedged
100%
80-85%
40-45%
(Nuclear and Base Load Coal)
Price $/MWh
$52
$52
$52
Volume TWh
21
19
19
Intermediate Coal, Combined
% Hedged
40-45%
0%
0%
Cycle, Peaking
Price $/MWh
$52
$52
$52
Volume TWh
55-57
55-57
55-57
Total
% Hedged
75-80%
50-55%
25-30%
Price $/MWh
$52
$52
$52 |
 27
PSEG Power –
Q4 2014 Operating Highlights
Q4 output up 3.1% over Q4 2013; YTD generation up 1.3% to 54.2 TWh
Nuclear
capacity
factor
of
84.5%
for
Q4,
completed
refuelings
at
Salem
1
and
Peach
Bottom
2
For 2014, nuclear capacity factor was 89.3%; Hope Creek at 100% capacity factor in
Q4 and 97.9% for the year –
the 2
nd
best run in its history
CCGT fleet set an all-time production record of 16.5 TWh in 2014; Bergen 1
& 2 and Linden 1 also set generation records for the year
Operations
Regulatory and Market
Environment
Financial
2015 BGS auction priced higher at $99.54/MWh vs.
$97.39/MWh in 2014 and $92.18 in 2013 –
for the PSE&G contract
2015 anticipated base load output hedged at an average price of $52/MWh vs.
2014 average hedge price of $48/MWh
2015 BGS load projected at 11 TWhs
Power markets adjusting to heightened volatility, winter peak demand, less
liquidity PJM’s Capacity Performance Proposal filed at the FERC;
decision expected April 2015 Power’s total
debt as a percentage of capitalization at year-end was 31%
Power’s FFO/Debt was 59% at December 31 |
 PSEG |
 29
PSEG Financial Highlights
Introducing 2015 operating earnings guidance of $2.75 -
$2.95 per share
Focused on maintaining operating efficiency and customer reliability
PSE&G expected to contribute over 50% of 2015 operating earnings
Energy Strong Infrastructure Spend
BPU authorized $1.22 billion for system resiliency improvements over
2014-2017 Gas mains replacement prioritized in 2014; ~$350
million capital spend expected to be
completed in 2015
Executing existing transmission capital spending program on schedule
and pursuing new RTEP, FERC 1000, and 345 kV projects
Financial position remains strong:
Positive cash from Power and increasing cash flow from operations at PSE&G
supports dividend growth and funds capital spending program without the need
to issue equity Debt as a percentage of capitalization was 42%
at December 31
Increased common dividend 5.4% to indicative annual rate of $1.56 per share
Increasing regulated earnings mix supports growing dividend
|
 30
PSEG 2015 Operating Earnings Guidance -
By Subsidiary
$ millions (except EPS)
2015E
2014
2013
PSE&G
$735 -
$775
$725
$612
PSEG Power
$620 -
$680
$642
$710
PSEG Enterprise/Other
$40 -
$45
$33
$(13)
Operating Earnings*
$1,395 -
$1,500
$1,400
$1,309
Earnings per Share
$2.75 -
$2.95E
$2.76
$2.58
* See Slide 32 for Items excluded from Net Income to reconcile to Operating
Earnings. E = Estimate. Anticipates Another Year of Growth
|
 PSEG
Liquidity as of December 31, 2014 31 |
 Items
Excluded from Net income to Reconcile to Operating Earnings Please see Slide 2
for an explanation of PSEG’s use of Operating Earnings as a non-GAAP financial measure
and how it differs from Net Income.
32
2014
2013
2014
2013
Earnings Impact ($ Millions)
Operating Earnings
247
$
248
$
1,400
$
1,309
$
Gain (Loss) on Nuclear Decommissioning Trust (NDT)
Fund Related Activity (PSEG Power)
28
11
68
40
Gain (Loss) on Mark-to-Market (MTM)
(a)
(PSEG Power)
204
(52)
66
(74)
Storm O&M, net of insurance recoveries (PSEG Power)
(3)
(7)
(16)
(32)
Net Income
476
$
200
$
1,518
$
1,243
$
Fully Diluted Average Shares Outstanding (in Millions)
508
508
508
508
Per Share Impact (Diluted)
Operating Earnings
0.49
$
0.49
$
2.76
$
2.58
$
Gain (Loss) on NDT Fund Related Activity (PSEG Power)
0.05
0.02
0.13
0.08
Gain (Loss) on MTM
(a)
(PSEG Power)
0.40
(0.11)
0.13
(0.14)
Storm O&M, net of insurance recoveries (PSEG Power)
-
(0.01)
(0.03)
(0.07)
Net Income
0.94
$
0.39
$
2.99
$
2.45
$
(a) Includes the financial impact from positions with forward delivery months.
PUBLIC SERVICE ENTERPRISE GROUP INCORPORATED
Reconciling Items, net of tax
Three Months Ended
Year Ended
December 31,
December 31,
(Unaudited) |