Attached files
| file | filename |
|---|---|
| EX-99.1 - EX-99.1 - PUBLIC SERVICE ENTERPRISE GROUP INC | d875794dex991.htm |
| 8-K - FORM 8-K - PUBLIC SERVICE ENTERPRISE GROUP INC | d875794d8k.htm |
Exhibit 99

|
Investor News | NYSE: PEG |
For further information, contact:
| Ø Kathleen A. Lally, Vice President – Investor Relations |
Phone: 973-430-6565 | |||
|
Ø Carlotta Chan, Manager - Investor Relations |
Phone: 973-430-6596 |
PSEG ANNOUNCES 2014 RESULTS
$2.99 NET INCOME PER SHARE
Operating Earnings of $2.76 Per Share Exceeds Guidance of $2.60 - $2.75 Per Share
Company Provides 2015 Guidance of $2.75 - $2.95 Per Share
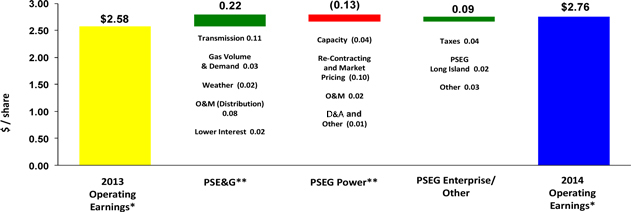
(February 20, 2015 – Newark, NJ) Public Service Enterprise Group (PSEG) reported today 2014 Net Income of $1,518 million or $2.99 per share as compared to Net Income of $1,243 million, or $2.45 per share for 2013. Operating Earnings for the year 2014 were $1,400 million or $2.76 per share compared to 2013 Operating Earnings of $1,309 million or $2.58 per share.
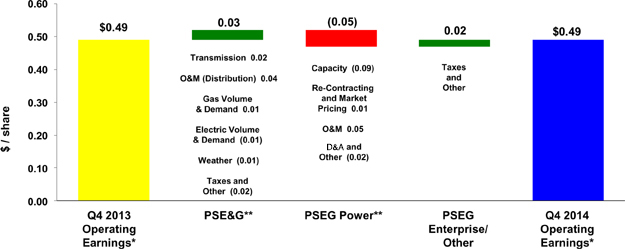
PSEG also reported Net Income for the fourth quarter of 2014 of $476 million, or $0.94 per share. This compares to fourth quarter 2013 Net Income of $200 million, or $0.39 per share. Operating Earnings for the fourth quarter of 2014 were $247 million, or $0.49 per share compared to fourth quarter 2013 Operating Earnings of $248 million, or $0.49 per share.
“We are delighted with our results. Our strategy has transformed our business mix and resulted in continued growth in earnings. PSEG reported operating earnings for 2014 above the upper end of guidance,” said Ralph Izzo, chairman, president and chief executive officer. “Our financial performance is a direct result from disciplined capital allocation. We are seeing the benefits of an expanded capital program contributing to double-digit earnings growth from our regulated company, PSE&G, which has grown to represent 52% of 2014’s operating earnings while Power’s successful management of its gas supply arrangements supported better than anticipated earnings. Our utility customers have benefited from improvements in reliability and our ability to pass along savings in gas costs. Our Board’s recent decision to meaningfully increase the common dividend by 5.4% to the indicative annual level of $1.56 per share is an expression of confidence in our outlook, the continued growth of our utility and an acknowledgment of our strong financial position.”
PSEG believes that the non-GAAP financial measure of “Operating Earnings” provides a consistent and comparable measure of performance of its businesses to help shareholders understand performance trends. Operating Earnings exclude the impact of gains/(losses) associated with Nuclear Decommissioning Trust (NDT) investments and Mark-To-Market (MTM) accounting as well as other material one-time items. The table below provides a reconciliation of PSEG’s Net Income to Operating Earnings (a non-GAAP measure) for the full year and fourth quarter. See Attachment 12 for a complete list of items excluded from Net Income in the determination of Operating Earnings.
PSEG CONSOLIDATED EARNINGS (unaudited)
Full-Year Comparative Results
2014 and 2013
| Income | Diluted Earnings | |||||||||||||||
| ($ millions) | Per Share | |||||||||||||||
| 2014 | 2013 | 2014 | 2013 | |||||||||||||
| Operating Earnings |
$ | 1,400 | $ | 1,309 | $ | 2.76 | $ | 2.58 | ||||||||
| Reconciling Items |
118 | (66 | ) | 0.23 | (0.13 | ) | ||||||||||
|
|
|
|
|
|
|
|
|
|||||||||
| Net Income |
$ | 1,518 | $ | 1,243 | $ | 2.99 | $ | 2.45 | ||||||||
|
|
|
|
|
|
|
|
|
|||||||||
| Avg. Shares | 508M | 508M | ||||||||||||||
PSEG CONSOLIDATED EARNINGS (unaudited)
Fourth Quarter Comparative Results
2014 and 2013
| Income | Diluted Earnings | |||||||||||||||
| ($ millions) | Per Share | |||||||||||||||
| 2014 | 2013 | 2014 | 2013 | |||||||||||||
| Operating Earnings |
$ | 247 | $ | 248 | $ | 0.49 | $ | 0.49 | ||||||||
| Reconciling Items |
229 | (48 | ) | 0.45 | (0.10 | ) | ||||||||||
|
|
|
|
|
|
|
|
|
|||||||||
| Net Income |
$ | 476 | $ | 200 | $ | 0.94 | $ | 0.39 | ||||||||
|
|
|
|
|
|
|
|
|
|||||||||
| Avg. Shares | 508M | 508M | ||||||||||||||
“Our core strategy – focused on operational excellence, financial strength and disciplined investment – is expected to yield a third year of growth in operating earnings over the coming year.” Izzo continued, “For 2015, we are initiating Operating Earnings guidance of $2.75 - $2.95 per share. The hard work and dedication of the men and women of PSEG have been a major factor in our success and provide me with confidence in our ability to achieve our goals.”
The following table outlines PSEG’s 2014 operating earnings by subsidiary and expectations for 2015.
2015 Guidance and 2014 Operating Earnings
($ millions, except EPS)
| 2015E | 2014A | |||||||
| PSE&G |
$ | 735 - $775 | $ | 725 | ||||
| PSEG Power |
$ | 620 - $680 | $ | 642 | ||||
| PSEG Enterprise/Other |
$ | 40 - $45 | $ | 33 | ||||
| Operating Earnings |
$ | 1,395 - $1,500 | $ | 1,400 | ||||
| Earnings Per Share |
$ | 2.75 - $2.95 | $ | 2.76 | ||||
E = Estimate
Operating Earnings Review and Outlook by Operating Subsidiary
See Attachments 6 and 7 for detail regarding the quarter-over-quarter and year-over-year earnings reconciliations for each of PSEG’s businesses.
PSE&G
PSE&G reported operating earnings of $160 million ($0.32 per share) for the fourth quarter bringing full year operating earnings to $725 million ($1.43 per share). On a comparative basis, PSE&G reported operating earnings of $144 million ($0.29 per share) and $612 million ($1.21 per share) for the fourth quarter and full year 2013, respectively.
PSE&G’s earnings in the fourth quarter benefited from a reduction in operating expenses and a return on its expanded infrastructure capital program which more than offset the impact of mild weather on sales. PSE&G’s successful management of its investment program allowed it to earn its authorized return for the full year as it maintained its focus on satisfying the needs of customers.
PSE&G’s investment in transmission infrastructure increased quarter-over-quarter earnings by $0.02 per share. The transmission earnings improvement in the fourth quarter was less than the increase experienced during the first three quarters of the year, and reflects the impact on rate base from an expansion of bonus depreciation at the end of the year. Tight control of operating expenses and lower pension costs together resulted in a quarter-over-quarter increase in earnings of $0.04 per share. A continued improvement in gas volume and demand – which improved quarter-over-quarter earnings by $0.01 per share – was offset by a similar decline in electric volume and demand. Weather, which was mild relative to conditions experienced in the prior year, reduced earnings comparisons by $0.01 per share. Earnings were reduced by $0.02 per share due to the absence of a tax-related change which benefited earnings in the prior year’s fourth quarter.
Economic conditions continue to exhibit signs of improvement in the service area. On a weather-normalized basis, gas deliveries are estimated to have increased 1% in the quarter and 3.1% for the year. Demand continues to benefit not only from the improvement in the economy and but also from lower commodity prices. On a weather-normalized basis, electric sales are estimated to have declined by 2.3% in the fourth quarter and increased by 0.3% for the year. The decline in the quarter is impacted by a number of winter storms at the end of 2013 that increased residential consumption, and decreases in demand this quarter from large customers. The increase for the year is indicative of improving economic conditions partially offset by continued customer conservation.
PSE&G announced that it would provide its residential gas customers with a credit against their bill for the months of February and March. The credit is an extension of the bill credits PSE&G provided its residential customers for gas usage in November, December and January. With these credits, a typical residential customer would experience savings on their bill over the five months of approximately $210, or about 31%.
An increase in revenue of $182 million under PSE&G’s transmission formula rate went into effect on January 1, 2015. The increase in revenue will provide PSE&G with recovery of and a return on its forecast of transmission related capital expenditures through the year. Each year, transmission revenues are adjusted to reflect an update of data that was estimated in the formula rate filing. The adjustment for 2015 will include the impact of the extension of bonus
depreciation, which was enacted after the formula rate filing was made, and is estimated to reduce our 2015 revenue increase as filed by approximately $21 million. PSE&G’s investment in transmission grew to $4.5 billion at the end of 2014 to represent 39% of the company’s consolidated rate base of $11.4 billion.
PSE&G’s operating earnings for 2015 are forecast at $735 million - $775 million. Operating earnings will be influenced by an increase in transmission revenues and construction activity associated with the Energy Strong capital program approved in 2014.
PSEG Power
PSEG Power reported operating earnings of $91 million ($0.18 per share) for the fourth quarter of 2014, bringing full year operating earnings to $642 million ($1.27 per share). On a comparative basis, PSEG Power reported operating earnings of $115 million ($0.23 per share) and $710 million ($1.40 per share) for the fourth quarter and full year 2013, respectively.
PSEG Power’s operating earnings in the fourth quarter were influenced by the known decline in capacity revenues, lower market prices for energy offset by the monetization of its gas supply position and a reduction in operation and maintenance expense.
A decline in average PJM capacity prices to $166/MW-day from $244/MW-day on June 1, 2014 reduced Power’s quarter-over-quarter earnings by $0.09 per share. A decline in the average price received on energy hedges and lower market prices were more than offset by strong margins on gas sales to increase Power’s quarter-over-quarter earnings comparisons by $0.01 per share. Operation and maintenance (O&M) expenditures were lower than levels experienced in the year-ago period, which was heavily influenced by outage related work. A decline in O&M improved quarter-over-quarter earnings comparisons by $0.05 per share. Higher levels of depreciation and interest expense along with miscellaneous items combined to reduce quarterly earnings comparisons by $0.02 per share.
Power’s output increased 3.1% in the quarter from year-ago levels. For the year, output increased 1.3% to 54.2 TWh. The fleet’s flexibility in response to volatile markets was demonstrated in the quarter and throughout the year as 2014’s output represented the third highest level in the fleet’s history as a merchant producer. The nuclear fleet produced 29.1 TWh (54% of total generation) operating at an average capacity factor during the year of 89.3%. Hope Creek experienced its second best year operating at a 97.9% capacity factor which partially offset the impact of an extended refueling outage at Salem 2. The market is rewarding efficient combined cycle gas units. The gas-fired combined cycle fleet (CCGTs) set a generation record during the year. The fleet produced 16.5 TWh (30% of total generation) during the year with record levels of output from the Bergen Station and Linden 1. The coal fleet produced 7.4 TWh (14% of total generation). The peaking fleet’s responsiveness during the abnormally cold weather experienced early in the year led to full year production of 1.2 TWh (2% of total generation).
Power is forecasting an improvement in output for 2015 to 55 – 57 TWh. The improvement – largely at nuclear – takes into consideration the Peach Bottom uprate and a forecast increase in output at the Salem station. Following completion of the Basic Generation Service auction in New Jersey in early February 2015, Power enters the year with 100% of its baseload generation hedged. Approximately 75% – 80% of anticipated annual production is hedged at an average price of $52 per MWh which compares with average hedge prices in 2014 of $48 per MWh. Power has hedged approximately 50% – 55% of its forecast generation in 2016 of 55 – 57 TWh
at an average price of $52 per MWh. For 2017, Power has hedged 25% – 30% of forecast production of 55 – 57 TWh at an average price of $52 per MWh. Power assumes BGS volumes will represent approximately 11.5 TWh in each of 2015 and 2016 – consistent with 2014’s deliveries under the BGS contract.
Power’s operating earnings for 2015 are forecast at $620 - $680 million. Results for the full year will be affected by a decline in capacity revenues, an increase in the average price received on energy hedges, Power’s role as agent for LIPA’s generation portfolio, and a modest increase in operation and maintenance expense.
PSEG Enterprise/Other
PSEG Enterprise/Other reported a loss in operating earnings for the fourth quarter of $4 million ($0.01 per share) compared to an operating earnings loss of $11 million ($0.03 per share) for the fourth quarter of 2013. The results for the fourth quarter brought the full year 2014 for PSEG Enterprise/Other to $33 million ($0.06 per share) versus Operating Earnings loss in 2013 of $13 million ($0.03 per share).
The difference in operating results quarter-over-quarter primarily reflects the absence of tax payments and other items in the fourth quarter of 2013. For the year, the operating contract for PSEG Long Island contributed $0.02 per share to earnings, in line with expectations.
For 2015, operating earnings for PSEG Enterprise/Other are forecast to be $40 - $45 million. Results will be influenced by contractual payments associated with the operation of PSEG Long Island, and income on the lease portfolio including the renegotiation and extension of the lease on the Grand Gulf nuclear generating facility.
Forward Looking Statement
Certain of the matters discussed in this report about our and our subsidiaries’ future performance, including, without limitation, future revenues, earnings, strategies, prospects, consequences and all other statements that are not purely historical constitute “forward-looking statements” within the meaning of the Private Securities Litigation Reform Act of 1995. Such forward-looking statements are subject to risks and uncertainties, which could cause actual results to differ materially from those anticipated. Such statements are based on management’s beliefs as well as assumptions made by and information currently available to management. When used herein, the words “anticipate,” “intend,” “estimate,” “believe,” “expect,” “plan,” “should,” “hypothetical,” “potential,” “forecast,” “project,” variations of such words and similar expressions are intended to identify forward-looking statements. Factors that may cause actual results to differ are often presented with the forward-looking statements themselves. Other factors that could cause actual results to differ materially from those contemplated in any forward-looking statements made by us herein are discussed in filings we make with the United States Securities and Exchange Commission (SEC), including our Annual Report on Form 10-K and subsequent reports on Form 10-Q and Form 8-K and available on our website: http://www.pseg.com. These factors include, but are not limited to:
| • | adverse changes in the demand for or the price of the capacity and energy that we sell into wholesale electricity markets, |
| • | adverse changes in energy industry law, policies and regulation, including market structures and transmission planning, |
| • | any inability of our transmission and distribution businesses to obtain adequate and timely rate relief and regulatory approvals from federal and state regulators, |
| • | changes in federal and state environmental regulations and enforcement that could increase our costs or limit our operations, |
| • | changes in nuclear regulation and/or general developments in the nuclear power industry, including various impacts from any accidents or incidents experienced at our facilities or by others in the industry, that could limit operations of our nuclear generating units, |
| • | actions or activities at one of our nuclear units located on a multi-unit site that might adversely affect our ability to continue to operate that unit or other units located at the same site, |
| • | any inability to manage our energy obligations, available supply and risks, |
| • | adverse outcomes of any legal, regulatory or other proceeding, settlement, investigation or claim applicable to us and/or the energy industry, |
| • | any deterioration in our credit quality or the credit quality of our counterparties, |
| • | availability of capital and credit at commercially reasonable terms and conditions and our ability to meet cash needs, |
| • | changes in the cost of, or interruption in the supply of, fuel and other commodities necessary to the operation of our generating units, |
| • | delays in receipt of necessary permits and approvals for our construction and development activities, |
| • | delays or unforeseen cost escalations in our construction and development activities, |
| • | any inability to achieve, or continue to sustain, our expected levels of operating performance, |
| • | any equipment failures, accidents, severe weather events or other incidents that impact our ability to provide safe and reliable service to our customers, and any inability to obtain sufficient insurance coverage or recover proceeds of insurance with respect to such events, |
| • | acts of terrorism, cybersecurity attacks or intrusions that could adversely impact our businesses, |
| • | increases in competition in energy supply markets as well as for transmission projects, |
| • | any inability to realize anticipated tax benefits or retain tax credits, |
| • | challenges associated with recruitment and/or retention of a qualified workforce, |
| • | adverse performance of our decommissioning and defined benefit plan trust fund investments and changes in funding requirements, |
| • | changes in technology, such as distributed generation and micro grids, and greater reliance on these technologies, and |
| • | changes in customer behaviors, including increases in energy efficiency, net-metering and demand response. |
All of the forward-looking statements made in this report are qualified by these cautionary statements and we cannot assure you that the results or developments anticipated by management will be realized or even if realized, will have the expected consequences to, or effects on, us or our business prospects, financial condition or results of operations. Readers are cautioned not to place undue reliance on these forward-looking statements in making any investment decision. Forward-looking statements made in this report apply only as of the date of this report. While we may elect to update forward-looking statements from time to time, we specifically disclaim any obligation to do so, even if internal estimates change, unless otherwise required by applicable securities laws. The forward-looking statements contained in this report are intended to qualify for the safe harbor provisions of Section 27A of the Securities Act of 1933, as amended, and Section 21E of the Securities Exchange Act of 1934, as amended.
Attachment 1
PUBLIC SERVICE ENTERPRISE GROUP INCORPORATED
Operating Earnings and Per Share Results by Subsidiary
(Unaudited)
| Three Months Ended December 31, |
Year-Ended December 31, |
|||||||||||||||
| 2014 | 2013 | 2014 | 2013 | |||||||||||||
| Earnings Results ($ Millions) | ||||||||||||||||
| PSE&G |
$ | 160 | $ | 144 | $ | 725 | $ | 612 | ||||||||
| PSEG Power |
91 | 115 | 642 | 710 | ||||||||||||
| PSEG Enterprise/Other |
(4 | ) | (11 | ) | 33 | (13 | ) | |||||||||
|
|
|
|
|
|
|
|
|
|||||||||
| Operating Earnings |
$ | 247 | $ | 248 | $ | 1,400 | $ | 1,309 | ||||||||
|
|
|
|
|
|
|
|
|
|||||||||
| Reconciling Items(a) |
229 | (48 | ) | 118 | (66 | ) | ||||||||||
|
|
|
|
|
|
|
|
|
|||||||||
| Net Income |
$ | 476 | $ | 200 | $ | 1,518 | $ | 1,243 | ||||||||
|
|
|
|
|
|
|
|
|
|||||||||
| Fully Diluted Average Shares Outstanding (in Millions) |
508 | 508 | 508 | 508 | ||||||||||||
|
|
|
|
|
|
|
|
|
|||||||||
| Per Share Results (Diluted) | ||||||||||||||||
| PSE&G |
$ | 0.32 | $ | 0.29 | $ | 1.43 | $ | 1.21 | ||||||||
| PSEG Power |
0.18 | 0.23 | 1.27 | 1.40 | ||||||||||||
| PSEG Enterprise/Other |
(0.01 | ) | (0.03 | ) | 0.06 | (0.03 | ) | |||||||||
|
|
|
|
|
|
|
|
|
|||||||||
| Operating Earnings |
$ | 0.49 | $ | 0.49 | $ | 2.76 | $ | 2.58 | ||||||||
|
|
|
|
|
|
|
|
|
|||||||||
| Reconciling Items(a) |
0.45 | (0.10 | ) | 0.23 | (0.13 | ) | ||||||||||
|
|
|
|
|
|
|
|
|
|||||||||
| Net Income |
$ | 0.94 | $ | 0.39 | $ | 2.99 | $ | 2.45 | ||||||||
|
|
|
|
|
|
|
|
|
|||||||||
| (a) | See Attachment 12 for details of items excluded from Net Income to compute Operating Earnings. |
Attachment 2
PUBLIC SERVICE ENTERPRISE GROUP INCORPORATED
Consolidating Statements of Operations
(Unaudited, $ Millions)
| Three Months Ended December 31, 2014 | ||||||||||||||||
| PSEG | PSEG Enterprise/ Other (a) |
PSE&G | PSEG Power |
|||||||||||||
| OPERATING REVENUES |
$ | 2,773 | $ | (368 | ) | $ | 1,531 | $ | 1,610 | |||||||
| OPERATING EXPENSES |
||||||||||||||||
| Energy Costs |
878 | (464 | ) | 631 | 711 | |||||||||||
| Operation and Maintenance |
780 | 97 | 368 | 315 | ||||||||||||
| Depreciation and Amortization |
308 | 7 | 224 | 77 | ||||||||||||
|
|
|
|
|
|
|
|
|
|||||||||
| Total Operating Expenses |
1,966 | (360 | ) | 1,223 | 1,103 | |||||||||||
|
|
|
|
|
|
|
|
|
|||||||||
| OPERATING INCOME |
807 | (8 | ) | 308 | 507 | |||||||||||
| Income from Equity Method Investments |
3 | — | — | 3 | ||||||||||||
| Other Income and (Deductions) |
75 | (2 | ) | 17 | 60 | |||||||||||
| Other Than Temporary Impairments |
(6 | ) | — | — | (6 | ) | ||||||||||
| Interest Expense |
(98 | ) | 3 | (71 | ) | (30 | ) | |||||||||
|
|
|
|
|
|
|
|
|
|||||||||
| INCOME BEFORE INCOME TAXES |
781 | (7 | ) | 254 | 534 | |||||||||||
| Income Tax Benefit (Expense) |
(305 | ) | 3 | (94 | ) | (214 | ) | |||||||||
|
|
|
|
|
|
|
|
|
|||||||||
| NET INCOME |
$ | 476 | $ | (4 | ) | $ | 160 | $ | 320 | |||||||
|
|
|
|
|
|
|
|
|
|||||||||
| OPERATING EARNINGS |
$ | 247 | $ | (4 | ) | $ | 160 | $ | 91 | |||||||
| Reconciling Items Excluded from Net Income (b) |
229 | — | — | 229 | ||||||||||||
|
|
|
|
|
|
|
|
|
|||||||||
| NET INCOME |
$ | 476 | $ | (4 | ) | $ | 160 | $ | 320 | |||||||
|
|
|
|
|
|
|
|
|
|||||||||
| Three Months Ended December 31, 2013 | ||||||||||||||||
| PSEG | PSEG Enterprise/ Other (a) |
PSE&G | PSEG Power |
|||||||||||||
| OPERATING REVENUES |
$ | 2,318 | $ | (498 | ) | $ | 1,571 | $ | 1,245 | |||||||
| OPERATING EXPENSES |
||||||||||||||||
| Energy Costs |
825 | (519 | ) | 633 | 711 | |||||||||||
| Operation and Maintenance |
818 | 27 | 435 | 356 | ||||||||||||
| Depreciation and Amortization |
292 | 7 | 214 | 71 | ||||||||||||
| Taxes Other Than Income Taxes |
18 | — | 18 | — | ||||||||||||
|
|
|
|
|
|
|
|
|
|||||||||
| Total Operating Expenses |
1,953 | (485 | ) | 1,300 | 1,138 | |||||||||||
|
|
|
|
|
|
|
|
|
|||||||||
| OPERATING INCOME |
365 | (13 | ) | 271 | 107 | |||||||||||
| Income from Equity Method Investments |
2 | (2 | ) | — | 4 | |||||||||||
| Other Income and (Deductions) |
41 | 1 | 13 | 27 | ||||||||||||
| Other Than Temporary Impairments |
(5 | ) | — | — | (5 | ) | ||||||||||
| Interest Expense |
(99 | ) | 2 | (70 | ) | (31 | ) | |||||||||
|
|
|
|
|
|
|
|
|
|||||||||
| INCOME BEFORE INCOME TAXES |
304 | (12 | ) | 214 | 102 | |||||||||||
| Income Tax Benefit (Expense) |
(104 | ) | 1 | (70 | ) | (35 | ) | |||||||||
|
|
|
|
|
|
|
|
|
|||||||||
| NET INCOME |
$ | 200 | $ | (11 | ) | $ | 144 | $ | 67 | |||||||
|
|
|
|
|
|
|
|
|
|||||||||
| OPERATING EARNINGS |
$ | 248 | $ | (11 | ) | $ | 144 | $ | 115 | |||||||
| Reconciling Items Excluded from Net Income (b) |
(48 | ) | — | — | (48 | ) | ||||||||||
|
|
|
|
|
|
|
|
|
|||||||||
| NET INCOME |
$ | 200 | $ | (11 | ) | $ | 144 | $ | 67 | |||||||
|
|
|
|
|
|
|
|
|
|||||||||
| (a) | Includes activities at Energy Holdings, PSEG Long Island and the Parent as well as intercompany eliminations. |
| (b) | See Attachment 12 for details of items excluded from Net Income to compute Operating Earnings. |
Attachment 3
PUBLIC SERVICE ENTERPRISE GROUP INCORPORATED
Consolidating Statements of Operations
(Unaudited, $ Millions)
| Year-Ended December 31, 2014 | ||||||||||||||||
| PSEG | PSEG Enterprise/ Other (a) |
PSE&G | PSEG Power |
|||||||||||||
| OPERATING REVENUES |
$ | 10,886 | $ | (1,314 | ) | $ | 6,766 | $ | 5,434 | |||||||
| OPERATING EXPENSES |
||||||||||||||||
| Energy Costs |
3,886 | (1,770 | ) | 2,909 | 2,747 | |||||||||||
| Operation and Maintenance |
3,150 | 406 | 1,558 | 1,186 | ||||||||||||
| Depreciation and Amortization |
1,227 | 29 | 906 | 292 | ||||||||||||
|
|
|
|
|
|
|
|
|
|||||||||
| Total Operating Expenses |
8,263 | (1,335 | ) | 5,373 | 4,225 | |||||||||||
|
|
|
|
|
|
|
|
|
|||||||||
| OPERATING INCOME |
2,623 | 21 | 1,393 | 1,209 | ||||||||||||
| Income from Equity Method Investments |
13 | (1 | ) | — | 14 | |||||||||||
| Other Income and (Deductions) |
229 | 1 | 58 | 170 | ||||||||||||
| Other Than Temporary Impairments |
(20 | ) | — | — | (20 | ) | ||||||||||
| Interest Expense |
(389 | ) | 10 | (277 | ) | (122 | ) | |||||||||
|
|
|
|
|
|
|
|
|
|||||||||
| INCOME BEFORE INCOME TAXES |
2,456 | 31 | 1,174 | 1,251 | ||||||||||||
| Income Tax Benefit (Expense) |
(938 | ) | 2 | (449 | ) | (491 | ) | |||||||||
|
|
|
|
|
|
|
|
|
|||||||||
| NET INCOME |
$ | 1,518 | $ | 33 | $ | 725 | $ | 760 | ||||||||
|
|
|
|
|
|
|
|
|
|||||||||
| OPERATING EARNINGS |
$ | 1,400 | $ | 33 | $ | 725 | $ | 642 | ||||||||
| Reconciling Items Excluded from Net Income (b) |
118 | — | — | 118 | ||||||||||||
|
|
|
|
|
|
|
|
|
|||||||||
| NET INCOME |
$ | 1,518 | $ | 33 | $ | 725 | $ | 760 | ||||||||
|
|
|
|
|
|
|
|
|
|||||||||
| Year-Ended December 31, 2013 | ||||||||||||||||
| PSEG | PSEG Enterprise/ Other (a) |
PSE&G | PSEG Power |
|||||||||||||
| OPERATING REVENUES |
$ | 9,968 | $ | (1,750 | ) | $ | 6,655 | $ | 5,063 | |||||||
| OPERATING EXPENSES |
||||||||||||||||
| Energy Costs |
3,536 | (1,801 | ) | 2,841 | 2,496 | |||||||||||
| Operation and Maintenance |
2,887 | 24 | 1,639 | 1,224 | ||||||||||||
| Depreciation and Amortization |
1,178 | 33 | 872 | 273 | ||||||||||||
| Taxes Other Than Income Taxes |
68 | — | 68 | — | ||||||||||||
|
|
|
|
|
|
|
|
|
|||||||||
| Total Operating Expenses |
7,669 | (1,744 | ) | 5,420 | 3,993 | |||||||||||
|
|
|
|
|
|
|
|
|
|||||||||
| OPERATING INCOME |
2,299 | (6 | ) | 1,235 | 1,070 | |||||||||||
| Income from Equity Method Investments |
11 | (5 | ) | — | 16 | |||||||||||
| Other Income and (Deductions) |
159 | 3 | 51 | 105 | ||||||||||||
| Other Than Temporary Impairments |
(12 | ) | — | — | (12 | ) | ||||||||||
| Interest Expense |
(402 | ) | 7 | (293 | ) | (116 | ) | |||||||||
|
|
|
|
|
|
|
|
|
|||||||||
| INCOME BEFORE INCOME TAXES |
2,055 | (1 | ) | 993 | 1,063 | |||||||||||
| Income Tax Benefit (Expense) |
(812 | ) | (12 | ) | (381 | ) | (419 | ) | ||||||||
|
|
|
|
|
|
|
|
|
|||||||||
| NET INCOME |
$ | 1,243 | $ | (13 | ) | $ | 612 | $ | 644 | |||||||
|
|
|
|
|
|
|
|
|
|||||||||
| OPERATING EARNINGS |
$ | 1,309 | $ | (13 | ) | $ | 612 | $ | 710 | |||||||
| Reconciling Items Excluded from Net Income (b) |
(66 | ) | — | — | (66 | ) | ||||||||||
|
|
|
|
|
|
|
|
|
|||||||||
| NET INCOME |
$ | 1,243 | $ | (13 | ) | $ | 612 | $ | 644 | |||||||
|
|
|
|
|
|
|
|
|
|||||||||
| (a) | Includes activities at Energy Holdings, PSEG Long Island and the Parent as well as intercompany eliminations. |
| (b) | See Attachment 12 for details of items excluded from Net Income to compute Operating Earnings. |
Attachment 4
PUBLIC SERVICE ENTERPRISE GROUP INCORPORATED
Capitalization Schedule
(Unaudited, $ Millions)
| December 31, 2014 |
December 31, 2013 |
|||||||
| DEBT |
||||||||
| Long-Term Debt |
$ | 8,869 | $ | 8,131 | ||||
| Securitization Debt |
259 | 496 | ||||||
| Project Level, Non-Recourse Debt |
16 | 16 | ||||||
|
|
|
|
|
|||||
| Total Debt |
9,144 | 8,643 | ||||||
| STOCKHOLDERS’ EQUITY |
||||||||
| Common Stock |
4,876 | 4,861 | ||||||
| Treasury Stock |
(635 | ) | (615 | ) | ||||
| Retained Earnings |
8,227 | 7,457 | ||||||
| Accumulated Other Comprehensive Loss |
(283 | ) | (95 | ) | ||||
|
|
|
|
|
|||||
| Total Common Stockholders’ Equity |
12,185 | 11,608 | ||||||
| Noncontrolling Interests—Equity Investments |
1 | 1 | ||||||
|
|
|
|
|
|||||
| Total Equity |
12,186 | 11,609 | ||||||
|
|
|
|
|
|||||
| Total Capitalization |
$ | 21,330 | $ | 20,252 | ||||
|
|
|
|
|
|||||
Attachment 5
PUBLIC SERVICE ENTERPRISE GROUP INCORPORATED
CONDENSED CONSOLIDATED STATEMENTS OF CASH FLOWS
(Unaudited, $ Millions)
| Year-Ended December 31, | ||||||||
| 2014 | 2013 | |||||||
| CASH FLOWS FROM OPERATING ACTIVITIES |
||||||||
| Net Income |
$ | 1,518 | $ | 1,243 | ||||
| Adjustments to Reconcile Net Income to Net Cash Flows From Operating Activities |
1,642 | 1,915 | ||||||
|
|
|
|
|
|||||
| NET CASH PROVIDED BY OPERATING ACTIVITIES |
3,160 | 3,158 | ||||||
|
|
|
|
|
|||||
| NET CASH USED IN INVESTING ACTIVITIES |
(2,892 | ) | (2,801 | ) | ||||
|
|
|
|
|
|||||
| NET CASH USED IN FINANCING ACTIVITIES |
(359 | ) | (243 | ) | ||||
|
|
|
|
|
|||||
| Net Change in Cash and Cash Equivalents |
(91 | ) | 114 | |||||
| Cash and Cash Equivalents at Beginning of Period |
493 | 379 | ||||||
|
|
|
|
|
|||||
| Cash and Cash Equivalents at End of Period |
$ | 402 | $ | 493 | ||||
|
|
|
|
|
|||||
Attachment 6
PUBLIC SERVICE ENTERPRISE GROUP INCORPORATED
Quarter-over-Quarter EPS Reconciliation
December 31, 2014 vs. December 31, 2013
(Unaudited)
| * | See Attachment 12 for Items excluded from Net Income to reconcile to Operating Earnings. |
| ** | Prior quarter results for reconciling items may not add to year-to-date (YTD) totals due to rounding. |
Attachment 7
PUBLIC SERVICE ENTERPRISE GROUP INCORPORATED
Year-over-Year EPS Reconciliation
December 31, 2014 vs. December 31, 2013
(Unaudited)
| * | See Attachment 12 for Items excluded from Net Income to reconcile to Operating Earnings. |
| ** | Prior quarter results for reconciling items may not add to year-to-date (YTD) totals due to rounding. |
Attachment 8
PSEG POWER LLC
Generation Measures*
(Unaudited)
| GWhr Breakdown | GWhr Breakdown | |||||||||||||||
| Three Months Ended December 31, |
Year-End December 31, |
|||||||||||||||
| 2014 | 2013 | 2014 | 2013 | |||||||||||||
| Nuclear—NJ |
5,069 | 4,463 | 19,722 | 20,098 | ||||||||||||
| Nuclear—PA |
1,887 | 2,249 | 9,386 | 9,397 | ||||||||||||
|
|
|
|
|
|
|
|
|
|||||||||
| Total Nuclear |
6,956 | 6,712 | 29,108 | 29,495 | ||||||||||||
| Fossil—Coal/Natural Gas—NJ** |
(19 | ) | 55 | 1,421 | 1,141 | |||||||||||
| Fossil—Coal—PA |
1,163 | 1,485 | 5,108 | 5,491 | ||||||||||||
| Fossil—Coal—CT |
122 | 257 | 832 | 691 | ||||||||||||
|
|
|
|
|
|
|
|
|
|||||||||
| Total Coal |
1,266 | 1,797 | 7,361 | 7,323 | ||||||||||||
| Fossil—Oil & Natural Gas—NJ |
3,503 | 2,999 | 12,922 | 12,579 | ||||||||||||
| Fossil—Oil & Natural Gas—NY |
1,129 | 932 | 4,527 | 3,952 | ||||||||||||
| Fossil—Oil & Natural Gas—CT |
5 | 31 | 244 | 109 | ||||||||||||
|
|
|
|
|
|
|
|
|
|||||||||
| Total Oil & Natural Gas |
4,637 | 3,962 | 17,693 | 16,640 | ||||||||||||
|
|
|
|
|
|
|
|
|
|||||||||
| 12,859 | 12,471 | 54,162 | 53,458 | |||||||||||||
|
|
|
|
|
|
|
|
|
|||||||||
| % Generation by Fuel Type | % Generation by Fuel Type | |||||||||||||||
| Three Months Ended December 31, |
Year-End December 31, |
|||||||||||||||
| 2014 | 2013 | 2014 | 2013 | |||||||||||||
| Nuclear—NJ |
39 | % | 36 | % | 37 | % | 38 | % | ||||||||
| Nuclear—PA |
15 | % | 18 | % | 17 | % | 17 | % | ||||||||
|
|
|
|
|
|
|
|
|
|||||||||
| Total Nuclear |
54 | % | 54 | % | 54 | % | 55 | % | ||||||||
| Fossil—Coal/Natural Gas—NJ** |
0 | % | 0 | % | 3 | % | 2 | % | ||||||||
| Fossil—Coal—PA |
9 | % | 12 | % | 9 | % | 11 | % | ||||||||
| Fossil—Coal—CT |
1 | % | 2 | % | 2 | % | 1 | % | ||||||||
|
|
|
|
|
|
|
|
|
|||||||||
| Total Coal |
10 | % | 14 | % | 14 | % | 14 | % | ||||||||
| Fossil—Oil & Natural Gas—NJ |
27 | % | 24 | % | 24 | % | 24 | % | ||||||||
| Fossil—Oil & Natural Gas—NY |
9 | % | 8 | % | 8 | % | 7 | % | ||||||||
| Fossil—Oil & Natural Gas—CT |
0 | % | 0 | % | 0 | % | 0 | % | ||||||||
|
|
|
|
|
|
|
|
|
|||||||||
| Total Oil & Natural Gas |
36 | % | 32 | % | 32 | % | 31 | % | ||||||||
|
|
|
|
|
|
|
|
|
|||||||||
| 100 | % | 100 | % | 100 | % | 100 | % | |||||||||
|
|
|
|
|
|
|
|
|
|||||||||
| * | Excludes Solar and Kalaeloa |
| ** | Includes Pumped Storage. Pumped Storage accounted for <1% of total generation for the three months and twelve months ended December 31, 2014 and 2013. Also includes natural gas fuel switching intervals. |
Attachment 9
PUBLIC SERVICE ELECTRIC & GAS COMPANY
Retail Sales and Revenues
(Unaudited)
December 31, 2014
Electric Sales and Revenues
| Three Months Ended |
Change vs. 2013 |
Year Ended |
Change vs. 2013 |
|||||||||||||
| Sales (millions kWh) |
||||||||||||||||
| Residential |
2,804 | -5.3 | % | 13,081 | -3.0 | % | ||||||||||
| Commercial & Industrial |
6,404 | -2.6 | % | 27,329 | -0.5 | % | ||||||||||
| Street Lighting |
95 | -3.3 | % | 327 | -0.9 | % | ||||||||||
| Interdepartmental |
2 | -0.1 | % | 10 | 2.5 | % | ||||||||||
|
|
|
|
|
|||||||||||||
| Total |
9,305 | -3.5 | % | 40,747 | -1.3 | % | ||||||||||
|
|
|
|
|
|||||||||||||
| Revenue (in millions) |
||||||||||||||||
| Residential |
$ | 435 | -4.2 | % | $ | 2,055 | -1.3 | % | ||||||||
| Commercial & Industrial |
419 | -4.1 | % | 2,052 | 1.0 | % | ||||||||||
| Street Lighting |
18 | -3.3 | % | 69 | -1.6 | % | ||||||||||
| Other Operating Revenues* |
125 | 18.9 | % | 508 | 19.5 | % | ||||||||||
|
|
|
|
|
|||||||||||||
| Total |
$ | 996 | -1.7 | % | $ | 4,684 | 1.7 | % | ||||||||
|
|
|
|
|
|||||||||||||
| Three Months Ended |
Change vs. 2013 |
Year Ended |
Change vs. 2013 |
|||||||||||||
| Weather Data |
||||||||||||||||
| THI Hours—Actual |
245 | -57.6 | % | 13,764 | -21.7 | % | ||||||||||
| THI Hours—Normal |
301 | 16,073 | ||||||||||||||
| * | Primarily sales of Non-Utility Generator energy to PJM and Transmission related revenues. |
Attachment 10
PUBLIC SERVICE ELECTRIC & GAS COMPANY
Retail Sales and Revenues
(Unaudited)
December 31, 2014
Gas Sold and Transported
| Three Months Ended |
Change vs. 2013 |
Year Ended |
Change vs. 2013 |
|||||||||||||
| Sales (millions therms)* |
||||||||||||||||
| Firm Sales |
||||||||||||||||
| Residential Sales |
444 | -2.8 | % | 1,573 | 9.1 | % | ||||||||||
| Commercial & Industrial |
284 | -0.9 | % | 1,055 | 8.6 | % | ||||||||||
|
|
|
|
|
|||||||||||||
| Total Firm Sales |
728 | -2.1 | % | 2,628 | 8.9 | % | ||||||||||
|
|
|
|
|
|||||||||||||
| Non-Firm Sales |
||||||||||||||||
| Commercial & Industrial |
639 | 20.6 | % | 2,467 | 76.3 | % | ||||||||||
|
|
|
|
|
|||||||||||||
| Total Non-Firm Sales |
639 | 2,467 | ||||||||||||||
|
|
|
|
|
|||||||||||||
| Total Sales |
1,367 | 7.3 | % | 5,095 | 33.6 | % | ||||||||||
|
|
|
|
|
|||||||||||||
| Revenue ($ millions) |
||||||||||||||||
| Residential Sales—Firm |
$ | 83 | -12.9 | % | $ | 491 | -8.4 | % | ||||||||
| Commercial & Industrial—Firm Sales |
81 | 9.7 | % | 314 | 28.1 | % | ||||||||||
| Non-Firm Sales |
8 | -19.8 | % | 41 | -3.2 | % | ||||||||||
| Other Operating Revenues** |
44 | -3.0 | % | 172 | 1.4 | % | ||||||||||
|
|
|
|
|
|||||||||||||
| Total |
$ | 216 | -3.9 | % | $ | 1,018 | 2.5 | % | ||||||||
|
|
|
|
|
|||||||||||||
| Gas Transported |
$ | 319 | -4.0 | % | $ | 1,064 | 0.9 | % | ||||||||
| Three Months Ended |
Change vs. 2013 |
Year Ended |
Change vs. 2013 |
|||||||||||||
| Weather Data |
||||||||||||||||
| Degree Days—Actual |
1,607 | -4.2 | % | 5,078 | 5.9 | % | ||||||||||
| Degree Days—Normal |
1,617 | 4,653 | ||||||||||||||
| * | CSG rate included in non-firm sales |
| ** | Primarily Appliance Service. |
Attachment 11
PUBLIC SERVICE ENTERPRISE GROUP INCORPORATED
Statistical Measures
(Unaudited)
| Three Months Ended December 31, |
Year Ended December 31, |
|||||||||||||||
| 2014 | 2013 | 2014 | 2013 | |||||||||||||
| Weighted Average Common Shares Outstanding (millions) |
||||||||||||||||
| Basic |
506 | 506 | 506 | 506 | ||||||||||||
| Diluted |
508 | 508 | 508 | 508 | ||||||||||||
| Stock Price at End of Period |
$ | 41.41 | $ | 32.04 | ||||||||||||
| Dividends Paid per Share of Common Stock |
$ | 0.37 | $ | 0.36 | $ | 1.48 | $ | 1.44 | ||||||||
| Dividend Payout Ratio* |
53.6 | % | 55.8 | % | ||||||||||||
| Dividend Yield |
3.6 | % | 4.5 | % | ||||||||||||
| Price/Earnings Ratio* |
15.0 | 12.4 | ||||||||||||||
| Rate of Return on Average Common Equity* |
11.8 | % | 11.8 | % | ||||||||||||
| Book Value per Common Share |
$ | 24.09 | $ | 22.95 | ||||||||||||
| Market Price as a Percent of Book Value |
172 | % | 140 | % | ||||||||||||
| Total Shareholder Return |
12.2 | % | -1.6 | % | 34.4 | % | 9.4 | % | ||||||||
| * | Calculation based on Operating Earnings for the 12 month period ended. |
Attachment 12
PUBLIC SERVICE ENTERPRISE GROUP INCORPORATED
| Reconciling Items, net of tax | Three Months Ended December 31, |
Year Ended December 31, |
||||||||||||||
| 2014 | 2013 | 2014 | 2013 | |||||||||||||
| (Unaudited) | ||||||||||||||||
| Earnings Impact ($ Millions) | ||||||||||||||||
| Operating Earnings |
$ | 247 | $ | 248 | $ | 1,400 | $ | 1,309 | ||||||||
| Gain (Loss) on Nuclear Decommissioning Trust (NDT) Fund Related Activity (PSEG Power) |
28 | 11 | 68 | 40 | ||||||||||||
| Gain (Loss) on Mark-to-Market (MTM)(a) (PSEG Power) |
204 | (52 | ) | 66 | (74 | ) | ||||||||||
| Storm O&M, net of insurance recoveries (PSEG Power) |
(3 | ) | (7 | ) | (16 | ) | (32 | ) | ||||||||
|
|
|
|
|
|
|
|
|
|||||||||
| Net Income |
$ | 476 | $ | 200 | $ | 1,518 | $ | 1,243 | ||||||||
|
|
|
|
|
|
|
|
|
|||||||||
| Fully Diluted Average Shares Outstanding (in Millions) |
508 | 508 | 508 | 508 | ||||||||||||
|
|
|
|
|
|
|
|
|
|||||||||
| Per Share Impact (Diluted) | ||||||||||||||||
| Operating Earnings |
$ | 0.49 | $ | 0.49 | $ | 2.76 | $ | 2.58 | ||||||||
| Gain (Loss) on NDT Fund Related Activity (PSEG Power) |
0.05 | 0.02 | 0.13 | 0.08 | ||||||||||||
| Gain (Loss) on MTM(a) (PSEG Power) |
0.40 | (0.11 | ) | 0.13 | (0.14 | ) | ||||||||||
| Storm O&M, net of insurance recoveries (PSEG Power) |
— | (0.01 | ) | (0.03 | ) | (0.07 | ) | |||||||||
|
|
|
|
|
|
|
|
|
|||||||||
| Net Income |
$ | 0.94 | $ | 0.39 | $ | 2.99 | $ | 2.45 | ||||||||
|
|
|
|
|
|
|
|
|
|||||||||
(a) Includes the financial impact from positions with forward delivery months.