Attached files
| file | filename |
|---|---|
| 8-K - NEWMONT MINING CORPORATION 8-K - NEWMONT Corp /DE/ | a51043821.htm |
| EX-99.1 - EXHIBIT 99.1 - NEWMONT Corp /DE/ | a51043821ex99_1.htm |
Exhibit 99.2
Newmont Reports Reserves and Resources with Notable Additions at Growth Projects
DENVER--(BUSINESS WIRE)--February 19, 2015--Newmont Mining Corporation (NYSE: NEM) (“Newmont” or “the Company”) reported gold reserves of 82.2 million ounces and copper reserves of 7.9 billion pounds for 2014.
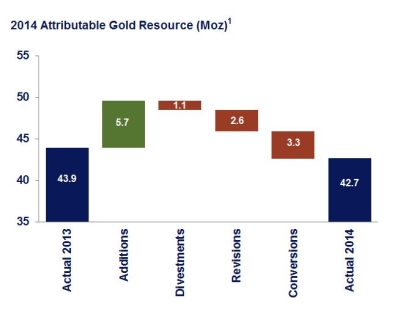
Notable gold reserve additions for the year include 0.7 million ounces at Tanami, 0.2 million ounces at Long Canyon and 0.4 million equity ounces at Merian. The Carlin trend continues to show promising upside, as the Carlin Portals and Leeville collectively added 0.7 million ounces. Overall gold reserve grades were unchanged from the prior year; however, combined project reserve additions were at a grade that exceeded our portfolio’s average. Gold resource additions1 include 1.0 million ounces from Tanami, 1.1 million ounces from Carlin Portals and Leeville, 0.9 million ounces from Apensu Underground, and 0.6 million ounces from Long Canyon. (See graphs in photos one and two.)
|
|
|
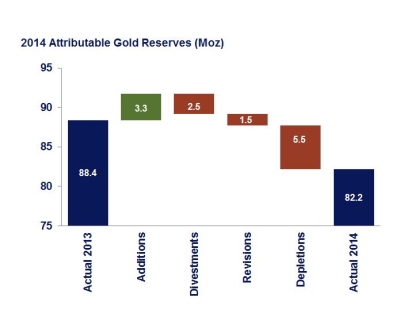
Newmont reported 82.2 million ounces of attributable gold reserves, 26.7 million ounces of attributable Measured and Indicated gold resources and 16 million ounces attributable Inferred gold resources. Attributable gold reserves were reduced by a net 6.2 million ounces or 7% from the prior year. Of this reduction, 2.5 million ounces or nearly 40% is due to asset divestitures. Depletion of 5.5 million ounces was partially offset by additions of 3.3 million ounces.
Attributable gold resources were reduced by 1.2 million ounces or 3% from the prior year. New additions of 5.7 million ounces were offset by conversions of 3.3 million ounces, revisions due to mine plan changes of 2.6 million ounces and divestments of 1.1 million ounces. Excluding divestments, attributable gold resources were essentially flat year over year. Gold reserves and resources were calculated at $1,300 per ounce, and $1,400 per ounce, respectively, unchanged from 2013.
Newmont also reported 7.9 billion pounds of attributable copper reserves, 7.3 billion pounds of attributable Measured and Indicated copper resources and 1.7 billion pounds attributable Inferred copper resources. Copper reserves were unchanged from 2013 except for depletion and minor positive revisions, while copper resources were reduced from 2013 primarily due to revisions due to mine plan changes at Phoenix. Copper reserves and resources were calculated at $3.00 per pound, and $3.50 per pound, respectively, unchanged from 2013.
Attributable Proven and Probable silver reserves for 2014 were 144 million ounces. Attributable Measured and Indicated silver resources for 2014 were 47 million ounces, with additional Inferred silver resources of 19 million ounces. Silver reserves and resources were calculated using prices of $20.00 and $25.00 per ounce, respectively.
1 Includes measured, indicated and inferred resources
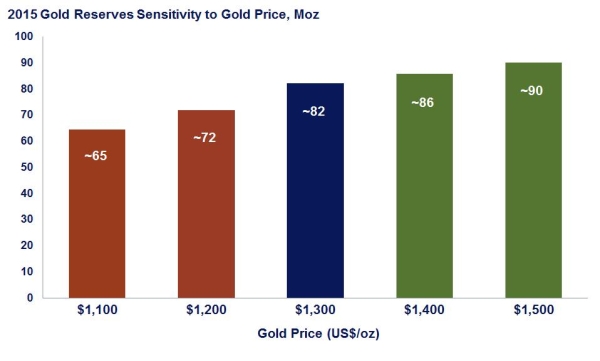
Gold Reserve Sensitivity
A $100 increase in gold price would result in an approximate 4% increase in gold reserves while a $100 decrease in gold price would result in an approximate 13% decrease in gold reserves. (See graph in photo three.)
For additional details on Newmont’s reported Gold, Copper and Silver Mineral Reserves and Resources, please refer to the tables at the end of this release.
Exploration Planned Activity
Newmont’s 2015 attributable exploration budget is $195 million, with about 35% North America and 20% to South America, and the balance split between Asia Pacific, Africa and other locations. Of the total attributable exploration budget approximately 80% is expected to be focused on near mine and brownfields exploration activities, with the balance targeted on greenfields programs.
Reserve and Resource Tables
Proven and Probable reserves are based on extensive drilling, sampling, mine modeling and metallurgical testing from which we determine economic feasibility. Metal price assumptions follow SEC guidance not to exceed a three year trailing average. The price sensitivity of reserves depends upon several factors including grade, metallurgical recovery, operating cost, waste-to-ore ratio and ore type. Metallurgical recovery rates vary depending on the metallurgical properties of each deposit and the production process used. The reserve tables included in this release list the average metallurgical recovery rate for each deposit, which takes into account the assumed processing methods. The cut-off grade, or lowest grade of mineralized material considered economic to process, varies with material type, price, metallurgical recoveries, operating costs and co- or by-product credits. The Proven and Probable reserve figures presented herein are estimates based on information available at the time of calculation. No assurance can be given that the indicated levels of recovery of gold and copper will be realized. Ounces of gold and silver or pounds of copper included in the proven and probable reserves are those contained prior to losses during metallurgical treatment. Reserve estimates may require revision based on actual production. Market fluctuations in the price of gold or copper, as well as increased production costs or reduced metallurgical recovery rates, could render certain proven and probable reserves containing relatively lower grades of mineralization uneconomic to exploit and might result in a reduction of reserves.
The Measured, Indicated, and Inferred resource figures presented herein are estimates based on information available at the time of calculation and are exclusive of reserves. A “Mineral Resource” is a concentration or occurrence of solid material of economic interest in or on the Earth’s crust in such form, grade, or quality and quantity that there are reasonable prospects for eventual economic extraction. The location, quantity, grade or quality, continuity and other geological characteristics of a Mineral Resource are known, estimated or interpreted from specific geological evidence and knowledge, including sampling. Mineral Resources are sub-divided, in order of increasing geological confidence, into Inferred, Indicated and Measured categories. Ounces of gold and silver or pounds of copper included in the Measured, Indicated and Inferred resources are those contained prior to losses during metallurgical treatment. Market fluctuations in the price of gold and copper, as well as increased production costs or reduced metallurgical recovery rates, could change future estimates of resources. Please refer to the reserves and resources note at the end of the release.
We publish reserves and resources annually, and will recalculate reserves and resources at year-end 2015, taking into account metal prices, changes, if any, in future production and capital costs, mine designs, model changes, divestments and depletion as well as any acquisitions and additions during 2015.
|
Attributable Proven, Probable, and Combined Gold Reserves(1), U.S. Units |
|||||||||||||||||||||||||||||||||||||||||||
| December 31, 2014 | December 31, 2013 | ||||||||||||||||||||||||||||||||||||||||||
| Deposits/Districts | Proven Reserves | Probable Reserves | Proven and Probable Reserves |
Metallurgical
Recovery |
Proven + Probable Reserves | ||||||||||||||||||||||||||||||||||||||
|
Newmont |
Tonnage | Grade | Gold | Tonnage | Grade | Gold | Tonnage | Grade | Gold | Tonnage | Grade | Gold | |||||||||||||||||||||||||||||||
|
(x1000 |
(oz/ton) |
(x1000 |
(x1000 |
(oz/ton) |
(x1000 |
(x1000 |
(oz/ton) |
(x1000 |
(x1000 |
(oz/ton) |
(x1000 |
||||||||||||||||||||||||||||||||
| North America | |||||||||||||||||||||||||||||||||||||||||||
| Carlin Open Pits, Nevada | 100% | 69,800 | 0.055 | 3,830 | 174,500 | 0.030 | 5,260 | 244,300 | 0.037 | 9,090 | 78% | 271,600 | 0.036 | 9,730 | |||||||||||||||||||||||||||||
| Carlin Underground, Nevada | 100% | 17,500 | 0.263 | 4,610 | 5,800 | 0.243 | 1,420 | 23,300 | 0.258 | 6,030 | 84% | 23,900 | 0.252 | 6,010 | |||||||||||||||||||||||||||||
| Carlin In-Process, Nevada(5) | 100% | 20,200 | 0.014 | 290 | - | - | 20,200 | 0.014 | 290 | 59% | 19,100 | 0.019 | 360 | ||||||||||||||||||||||||||||||
| Carlin Stockpiles, Nevada(6) | 100% | 26,800 | 0.058 | 1,550 | - | - | 26,800 | 0.058 | 1,550 | 80% | 30,700 | 0.055 | 1,680 | ||||||||||||||||||||||||||||||
| Total Carlin, Nevada | 134,300 | 0.076 | 10,280 | 180,300 | 0.037 | 6,680 | 314,600 | 0.054 | 16,960 | 80% | 345,300 | 0.051 | 17,780 | ||||||||||||||||||||||||||||||
| Phoenix, Nevada | 100% | 19,200 | 0.019 | 370 | 303,500 | 0.017 | 5,140 | 322,700 | 0.017 | 5,510 | 72% | 335,800 | 0.017 | 5,660 | |||||||||||||||||||||||||||||
| Phoenix Stockpiles, Nevada(6) | 100% | - | - | 3,300 | 0.027 | 90 | 3,300 | 0.027 | 90 | 77% | 3,400 | 0.028 | 90 | ||||||||||||||||||||||||||||||
| Lone Tree In-Process, Nevada(5) | 100% | 1,600 | 0.005 | 10 | - | - | 1,600 | 0.005 | 10 | 25% | 2,000 | 0.005 | 10 | ||||||||||||||||||||||||||||||
| Lone Tree Stockpiles, Nevada(6) | 100% | 500 | 0.017 | 10 | - | - | 500 | 0.017 | 10 | 25% | 4,200 | 0.017 | 70 | ||||||||||||||||||||||||||||||
| Total Phoenix, Nevada | 21,300 | 0.018 | 390 | 306,800 | 0.017 | 5,230 | 328,100 | 0.017 | 5,620 | 71% | 345,400 | 0.017 | 5,830 | ||||||||||||||||||||||||||||||
| Twin Creeks, Nevada | 100% | 5,400 | 0.118 | 640 | 28,200 | 0.054 | 1,510 | 33,600 | 0.064 | 2,150 | 74% | 39,400 | 0.060 | 2,360 | |||||||||||||||||||||||||||||
| Turquoise Ridge, Nevada(4) | 25% | 1,700 | 0.507 | 860 | 1,300 | 0.475 | 630 | 3,000 | 0.493 | 1,490 | 92% | 3,300 | 0.517 | 1,690 | |||||||||||||||||||||||||||||
| Midas, Nevada (2) | 100% | - | - | - | - | - | - | - | 250 | 0.093 | 30 | ||||||||||||||||||||||||||||||||
| Twin Creeks In-Process, Nevada(5) | 100% | 2,200 | 0.011 | 20 | - | - | 2,200 | 0.011 | 20 | 70% | 1,300 | 0.018 | 20 | ||||||||||||||||||||||||||||||
| Twin Creeks Stockpiles, Nevada(6) | 100% | 36,100 | 0.065 | 2,340 | - | - | 36,100 | 0.065 | 2,340 | 67% | 33,900 | 0.067 | 2,280 | ||||||||||||||||||||||||||||||
| Total Twin Creeks, Nevada | 45,400 | 0.085 | 3,860 | 29,500 | 0.072 | 2,140 | 74,900 | 0.080 | 6,000 | 75% | 78,150 | 0.082 | 6,380 | ||||||||||||||||||||||||||||||
| Long Canyon, Nevada (3) | 100% | - | - | 18,400 | 0.067 | 1,230 | 18,400 | 0.067 | 1,230 | 76% | 15,700 | 0.065 | 1,010 | ||||||||||||||||||||||||||||||
| La Herradura, Mexico(2) | 44% | - | - | - | - | - | - | - | 109,400 | 0.020 | 2,180 | ||||||||||||||||||||||||||||||||
| TOTAL NORTH AMERICA | 201,000 | 0.072 | 14,530 | 535,000 | 0.029 | 15,280 | 736,000 | 0.040 | 29,810 | 77% | 893,950 | 0.037 | 33,180 | ||||||||||||||||||||||||||||||
| South America | |||||||||||||||||||||||||||||||||||||||||||
| Conga, Peru(3) | 51.35% | - | - | 303,400 | 0.021 | 6,460 | 303,400 | 0.021 | 6,460 | 75% | 303,400 | 0.021 | 6,460 | ||||||||||||||||||||||||||||||
| Yanacocha Open Pits | 51.35% | 17,600 | 0.023 | 410 | 70,100 | 0.019 | 1,310 | 87,700 | 0.020 | 1,720 | 70% | 94,800 | 0.024 | 2,290 | |||||||||||||||||||||||||||||
| Yanacocha In-Process(5) | 51.35% | 12,800 | 0.021 | 270 | - | - | 12,800 | 0.021 | 270 | 67% | 9,100 | 0.020 | 190 | ||||||||||||||||||||||||||||||
| Yanacocha Stockpiles (6) | 51.35% | 8,700 | 0.058 | 500 | - | - | 8,700 | 0.058 | 500 | 67% | 8,800 | 0.054 | 480 | ||||||||||||||||||||||||||||||
| Total Yanacocha, Peru | 39,100 | 0.030 | 1,180 | 70,100 | 0.019 | 1,310 | 109,200 | 0.023 | 2,490 | 69% | 112,700 | 0.026 | 2,960 | ||||||||||||||||||||||||||||||
| La Zanja, Peru (7) | 46.94% | 2,200 | 0.021 | 50 | 3,600 | 0.020 | 70 | 5,800 | 0.021 | 120 | 66% | 8,700 | 0.021 | 170 | |||||||||||||||||||||||||||||
| Merian, Suriname (8) | 75% | - | - | 104,700 | 0.034 | 3,610 | 104,700 | 0.034 | 3,610 | 93% | 95,500 | 0.035 | 3,390 | ||||||||||||||||||||||||||||||
| TOTAL SOUTH AMERICA | 41,300 | 0.030 | 1,230 | 481,800 | 0.024 | 11,450 | 523,100 | 0.024 | 12,680 | 79% | 520,300 | 0.025 | 12,980 | ||||||||||||||||||||||||||||||
| Australia/New Zealand | |||||||||||||||||||||||||||||||||||||||||||
| Boddington, Western Australia | 100% | 115,800 | 0.021 | 2,440 | 418,300 | 0.020 | 8,550 | 534,100 | 0.021 | 10,990 | 81% | 616,100 | 0.020 | 12,590 | |||||||||||||||||||||||||||||
| Boddington Stockpiles | 100% | 26,400 | 0.016 | 430 | 58,200 | 0.013 | 750 | 84,600 | 0.014 | 1,180 | 79% | 69,800 | 0.014 | 980 | |||||||||||||||||||||||||||||
| Total Boddington, Western Australia | 142,200 | 0.020 | 2,870 | 476,500 | 0.020 | 9,300 | 618,700 | 0.020 | 12,170 | 81% | 685,900 | 0.020 | 13,570 | ||||||||||||||||||||||||||||||
| Duketon, Western Australia(9) | 19.45% | 2,300 | 0.033 | 80 | 12,800 | 0.030 | 380 | 15,100 | 0.030 | 460 | 91% | 13,200 | 0.040 | 530 | |||||||||||||||||||||||||||||
| Jundee, Western Australia(2) | 100% | - | - | - | - | - | - | - | 3,300 | 0.124 | 410 | ||||||||||||||||||||||||||||||||
| Kalgoorlie Open Pit and Underground | 50% | 9,300 | 0.058 | 540 | 27,400 | 0.056 | 1,540 | 36,700 | 0.057 | 2,080 | 85% | 41,500 | 0.057 | 2,350 | |||||||||||||||||||||||||||||
| Kalgoorlie Stockpiles(6) | 50% | 61,400 | 0.023 | 1,400 | - | - | 61,400 | 0.023 | 1,400 | 76% | 59,700 | 0.023 | 1,370 | ||||||||||||||||||||||||||||||
| Total Kalgoorlie, Western Australia | 70,700 | 0.027 | 1,940 | 27,400 | 0.056 | 1,540 | 98,100 | 0.035 | 3,480 | 81% | 101,200 | 0.037 | 3,720 | ||||||||||||||||||||||||||||||
| Tanami, Northern Territory | 100% | 6,000 | 0.178 | 1,070 | 13,600 | 0.165 | 2,240 | 19,600 | 0.169 | 3,310 | 94% | 17,800 | 0.169 | 3,010 | |||||||||||||||||||||||||||||
| Waihi, New Zealand | 100% | - | - | 2,200 | 0.161 | 360 | 2,200 | 0.161 | 360 | 89% | 2,200 | 0.098 | 220 | ||||||||||||||||||||||||||||||
| TOTAL AUSTRALIA NEW ZEALAND | 221,200 | 0.027 | 5,960 | 532,500 | 0.026 | 13,820 | 753,700 | 0.026 | 19,780 | 84% | 823,600 | 0.026 | 21,460 | ||||||||||||||||||||||||||||||
| Indonesia | |||||||||||||||||||||||||||||||||||||||||||
| Batu Hijau Open Pit (10) | 48.5% | 150,100 | 0.015 | 2,320 | 71,100 | 0.008 | 540 | 221,200 | 0.013 | 2,860 | 76% | 263,100 | 0.011 | 3,000 | |||||||||||||||||||||||||||||
| Batu Hijau Stockpiles (6)(10) | 48.5% | - | - | 157,900 | 0.003 | 480 | 157,900 | 0.003 | 480 | 66% | 138,200 | 0.003 | 430 | ||||||||||||||||||||||||||||||
| TOTAL INDONESIA | 150,100 | 0.015 | 2,320 | 229,000 | 0.004 | 1,020 | 379,100 | 0.009 | 3,340 | 74% | 401,300 | 0.009 | 3,430 | ||||||||||||||||||||||||||||||
| Africa | |||||||||||||||||||||||||||||||||||||||||||
| Ahafo Open Pits(11) | 100% | 10,700 | 0.061 | 650 | 122,000 | 0.060 | 7,280 | 132,700 | 0.060 | 7,930 | 88% | 134,800 | 0.062 | 8,330 | |||||||||||||||||||||||||||||
| Ahafo Underground (3) | 100% | - | - | - | 4,900 | 0.129 | 630 | 4,900 | 0.129 | 630 | 91% | 4,900 | 0.129 | 630 | |||||||||||||||||||||||||||||
| Ahafo Stockpiles(6) | 100% | 43,100 | 0.031 | 1,350 | - | - | 43,100 | 0.031 | 1,350 | 86% | 37,300 | 0.031 | 1,160 | ||||||||||||||||||||||||||||||
| Total Ahafo, Ghana | 53,800 | 0.037 | 2,000 | 126,900 | 0.062 | 7,910 | 180,700 | 0.055 | 9,910 | 88% | 177,000 | 0.057 | 10,120 | ||||||||||||||||||||||||||||||
| Akyem Open Pit | 100% | 28,400 | 0.052 | 1,470 | 97,300 | 0.048 | 4,720 | 125,700 | 0.049 | 6,190 | 88% | 137,800 | 0.049 | 6,810 | |||||||||||||||||||||||||||||
| Akyem Stockpiles (6) | 100% | 8,500 | 0.057 | 480 | - | - | 8,500 | 0.057 | 480 | 90% | 5,500 | 0.068 | 370 | ||||||||||||||||||||||||||||||
| Total, Akyem, Ghana (12) | 36,900 | 0.053 | 1,950 | 97,300 | 0.048 | 4,720 | 134,200 | 0.050 | 6,670 | 88% | 143,300 | 0.050 | 7,180 | ||||||||||||||||||||||||||||||
| TOTAL AFRICA | 90,700 | 0.044 | 3,950 | 224,200 | 0.056 | 12,630 | 314,900 | 0.053 | 16,580 | 88% | 320,300 | 0.054 | 17,300 | ||||||||||||||||||||||||||||||
| TOTAL NEWMONT WORLDWIDE | 704,300 | 0.040 | 27,990 | 2,002,500 | 0.027 | 54,200 | 2,706,800 | 0.030 | 82,190 | 81% | 2,959,450 | 0.030 | 88,350 | ||||||||||||||||||||||||||||||
|
(1) 2014 reserves are calculated at a gold price of $1,300, A$1,415 or NZ$1,735 per ounce unless otherwise noted. 2013 reserves were calculated at a gold price of $1,300, A$1,415 or NZ$1,675 per ounce unless otherwise noted. Tonnage amounts have been rounded to the nearest 100,000 unless they are less than 50,000. (2) Midas sold to Klondex Mines on February 11, 2014. Jundee sold to Northern Star Resources on July 1, 2014. Stake in La Herradura sold to Fresnillo plc on October 7, 2014. Values in the table above are as of December 31, 2014. (3) Project is currently undeveloped. (4) Reserve estimates provided by Barrick, the operator of the Turquoise Ridge Joint Venture. (5) In-process material is the material on leach pads at the end of the year from which gold remains to be recovered. (6) Stockpiles are comprised primarily of material that has been set aside to allow processing of higher grade material in the mills. Stockpiles increase or decrease depending on current mine plans. (7) Reserve estimates were provided by Buenaventura, the operator of the La Zanja project. (8) Project is under construction, percentage reflects Newmont’s interest as of December 31, 2014. Newmont’s ownership as of December 31, 2013 was 80%. (9) Reserve estimates provided by Regis Resources Ltd., in which Newmont holds a 19.45% interest. (10) Percentage reflects Newmont’s economic interest as of December 31, 2014. (11) Includes undeveloped reserves at 7 pits totaling 3.2 million ounces. (12) Project reached commercial production in November 2013. |
|||||||||||||||||||||||||||||||||||||||||||
| Attributable Proven, Probable, and Combined Gold Reserves(1), Metric Units | |||||||||||||||||||||||||||||||||||||||||||
| December 31, 2014 | December 31, 2013 | ||||||||||||||||||||||||||||||||||||||||||
| Deposits/Districts | Proven Reserves | Probable Reserves | Proven and Probable Reserves |
Metallurgical
Recovery |
Proven + Probable Reserves | ||||||||||||||||||||||||||||||||||||||
|
Newmont |
Tonnage | Grade | Gold | Tonnage | Grade | Gold | Tonnage | Grade | Gold | Tonnage | Grade | Gold | |||||||||||||||||||||||||||||||
|
(x1000 |
(g/tonne) |
(x1000 |
(x1000 |
(g/tonne) |
(x1000 |
(x1000 |
(g/tonne) |
(x1000 |
(x1000 |
(g/tonne) |
(x1000 |
||||||||||||||||||||||||||||||||
| North America | |||||||||||||||||||||||||||||||||||||||||||
| Carlin Open Pits, Nevada | 100% | 63,400 | 1.88 | 3,830 | 158,300 | 1.03 | 5,260 | 221,700 | 1.27 | 9,090 | 78% | 246,300 | 1.23 | 9,730 | |||||||||||||||||||||||||||||
| Carlin Underground, Nevada | 100% | 15,900 | 9.02 | 4,610 | 5,300 | 8.33 | 1,420 | 21,200 | 8.84 | 6,030 | 84% | 21,600 | 8.63 | 6,010 | |||||||||||||||||||||||||||||
| Carlin In-Process, Nevada(5) | 100% | 18,320 | 0.49 | 290 | - | - | 18,320 | 0.49 | 290 | 59% | 17,300 | 0.65 | 360 | ||||||||||||||||||||||||||||||
| Carlin Stockpiles, Nevada(6) | 100% | 24,360 | 1.98 | 1,550 | - | - | 24,360 | 1.98 | 1,550 | 80% | 27,800 | 1.88 | 1,680 | ||||||||||||||||||||||||||||||
| Total Carlin, Nevada | 121,980 | 2.62 | 10,280 | 163,600 | 1.27 | 6,680 | 285,580 | 1.85 | 16,960 | 80% | 313,000 | 1.77 | 17,780 | ||||||||||||||||||||||||||||||
| Phoenix, Nevada | 100% | 17,400 | 0.65 | 370 | 275,400 | 0.58 | 5,140 | 292,800 | 0.58 | 5,510 | 72% | 304,600 | 0.58 | 5,660 | |||||||||||||||||||||||||||||
| Phoenix Stockpiles, Nevada(6) | 100% | - | - | 3,000 | 0.93 | 90 | 3,000 | 0.93 | 90 | 77% | 3,100 | 0.95 | 90 | ||||||||||||||||||||||||||||||
| Lone Tree In-Process, Nevada(5) | 100% | 1,500 | 0.17 | 10 | - | - | 1,500 | 0.17 | 10 | 25% | 1,800 | 0.17 | 10 | ||||||||||||||||||||||||||||||
| Lone Tree Stockpiles, Nevada(6) | 100% | 500 | 0.58 | 10 | - | - | 500 | 0.58 | 10 | 25% | 3,800 | 0.58 | 70 | ||||||||||||||||||||||||||||||
| Total Phoenix, Nevada | 19,400 | 0.61 | 390 | 278,400 | 0.58 | 5,230 | 297,800 | 0.59 | 5,620 | 71% | 313,300 | 0.58 | 5,830 | ||||||||||||||||||||||||||||||
| Twin Creeks, Nevada | 100% | 4,900 | 4.04 | 640 | 25,600 | 1.84 | 1,510 | 30,500 | 2.19 | 2,150 | 74% | 35,700 | 2.05 | 2,360 | |||||||||||||||||||||||||||||
| Turquoise Ridge, Nevada(4) | 25% | 1,500 | 17.39 | 860 | 1,200 | 16.29 | 630 | 2,700 | 16.91 | 1,490 | 92% | 3,000 | 17.73 | 1,690 | |||||||||||||||||||||||||||||
| Midas, Nevada (2) | 100% | - | - | - | - | - | - | 240 | 3.19 | 30 | |||||||||||||||||||||||||||||||||
| Twin Creeks In-Process, Nevada(5) | 100% | 2,000 | 0.38 | 20 | - | - | 2,000 | 0.38 | 20 | 70% | 1,200 | 0.62 | 20 | ||||||||||||||||||||||||||||||
| Twin Creeks Stockpiles, Nevada(6) | 100% | 32,800 | 2.22 | 2,340 | - | - | 32,800 | 2.22 | 2,340 | 67% | 30,800 | 2.30 | 2,280 | ||||||||||||||||||||||||||||||
| Total Twin Creeks, Nevada | 41,200 | 2.91 | 3,860 | 26,800 | 2.48 | 2,140 | 68,000 | 2.74 | 6,000 | 75% | 70,940 | 2.80 | 6,380 | ||||||||||||||||||||||||||||||
| Long Canyon, Nevada (3) | 100% | - | - | 16,700 | 2.29 | 1,230 | 16,700 | 2.29 | 1,230 | 76% | 14,200 | 2.22 | 1,010 | ||||||||||||||||||||||||||||||
| La Herradura, Mexico | 44% | - | - | - | - | - | - | 99,200 | 0.68 | 2,180 | |||||||||||||||||||||||||||||||||
| TOTAL NORTH AMERICA | 182,580 | 2.47 | 14,530 | 485,500 | 0.98 | 15,280 | 668,080 | 1.39 | 29,810 | 77% | 810,640 | 1.27 | 33,180 | ||||||||||||||||||||||||||||||
| South America | |||||||||||||||||||||||||||||||||||||||||||
| Conga, Peru(3) | 51.35% | - | - | 275,200 | 0.73 | 6,460 | 275,200 | 0.73 | 6,460 | 75% | 275,200 | 0.73 | 6,460 | ||||||||||||||||||||||||||||||
| Yanacocha Open Pits | 51.35% | 16,000 | 0.80 | 410 | 63,600 | 0.64 | 1,310 | 79,600 | 0.67 | 1,720 | 70% | 85,900 | 0.83 | 2,290 | |||||||||||||||||||||||||||||
| Yanacocha In-Process(5) | 51.35% | 11,600 | 0.72 | 270 | - | - | 11,600 | 0.72 | 270 | 67% | 8,300 | 0.70 | 190 | ||||||||||||||||||||||||||||||
| Yanacocha Stockpiles (6) | 51.35% | 7,900 | 1.98 | 500 | - | - | 7,900 | 1.98 | 500 | 67% | 8,000 | 1.86 | 480 | ||||||||||||||||||||||||||||||
| Total Yanacocha, Peru | 35,500 | 1.03 | 1,180 | 63,600 | 0.64 | 1,310 | 99,100 | 0.78 | 2,490 | 69% | 102,200 | 0.90 | 2,960 | ||||||||||||||||||||||||||||||
| La Zanja, Peru (7) | 46.94% | 2,000 | 0.73 | 50 | 3,300 | 0.69 | 70 | 5,300 | 0.70 | 120 | 66% | 7,900 | 0.70 | 170 | |||||||||||||||||||||||||||||
| Merian, Suriname (8) | 75% | - | - | 95,000 | 1.18 | 3,610 | 95,000 | 1.18 | 3,610 | 93% | 86,600 | 1.22 | 3,390 | ||||||||||||||||||||||||||||||
| TOTAL SOUTH AMERICA | 37,500 | 1.02 | 1,230 | 437,100 | 0.82 | 11,450 | 474,600 | 0.83 | 12,680 | 79% | 471,900 | 0.86 | 12,980 | ||||||||||||||||||||||||||||||
| Australia/New Zealand | |||||||||||||||||||||||||||||||||||||||||||
| Boddington, Western Australia | 100% | 105,100 | 0.72 | 2,440 | 379,500 | 0.70 | 8,550 | 484,600 | 0.71 | 10,990 | 81% | 559,000 | 0.70 | 12,590 | |||||||||||||||||||||||||||||
| Boddington Stockpiles(6) | 100% | 24,000 | 0.56 | 430 | 52,800 | 0.44 | 750 | 76,800 | 0.48 | 1,180 | 79% | 63,300 | 0.48 | 980 | |||||||||||||||||||||||||||||
| Total Boddington, Western Australia | 129,100 | 0.69 | 2,870 | 432,300 | 0.67 | 9,300 | 561,400 | 0.67 | 12,170 | 81% | 622,300 | 0.68 | 13,570 | ||||||||||||||||||||||||||||||
| Duketon, Western Australia(9) | 19.45% | 2,100 | 1.13 | 80 | 11,600 | 1.01 | 380 | 13,700 | 1.03 | 460 | 91% | 12,000 | 1.38 | 530 | |||||||||||||||||||||||||||||
| Jundee, Western Australia | 100% | - | - | - | - | - | - | - | 3,000 | 4.26 | 410 | ||||||||||||||||||||||||||||||||
| Kalgoorlie Open Pit and Underground | 50% | 8,400 | 1.99 | 540 | 24,900 | 1.93 | 1,540 | 33,300 | 1.94 | 2,080 | 85% | 37,600 | 1.94 | 2,350 | |||||||||||||||||||||||||||||
| Kalgoorlie Stockpiles(6) | 50% | 55,700 | 0.78 | 1,400 | - | - | 55,700 | 0.78 | 1,400 | 76% | 54,200 | 0.79 | 1,370 | ||||||||||||||||||||||||||||||
| Total Kalgoorlie, Western Australia | 64,100 | 0.94 | 1,940 | 24,900 | 1.93 | 1,540 | 89,000 | 1.22 | 3,480 | 81% | 91,800 | 1.26 | 3,720 | ||||||||||||||||||||||||||||||
| Tanami, Northern Territory | 100% | 5,400 | 6.12 | 1,070 | 12,300 | 5.66 | 2,240 | 17,700 | 5.80 | 3,310 | 94% | 16,200 | 5.81 | 3,010 | |||||||||||||||||||||||||||||
| Waihi, New Zealand | 100% | - | - | 2,000 | 5.52 | 360 | 2,000 | 5.52 | 360 | 89% | 2,000 | 3.36 | 220 | ||||||||||||||||||||||||||||||
| TOTAL AUSTRALIA NEW ZEALAND | 200,700 | 0.92 | 5,960 | 483,100 | 0.89 | 13,820 | 683,800 | 0.90 | 19,780 | 84% | 747,300 | 0.89 | 21,460 | ||||||||||||||||||||||||||||||
| Indonesia | |||||||||||||||||||||||||||||||||||||||||||
| Batu Hijau Open Pit (10) | 48.5% | 136,100 | 0.53 | 2,320 | 64,500 | 0.26 | 540 | 200,600 | 0.44 | 2,860 | 76% | 238,700 | 0.39 | 3,000 | |||||||||||||||||||||||||||||
| Batu Hijau Stockpiles (6)(10) | 48.5% | - | - | 143,200 | 0.10 | 480 | 143,200 | 0.10 | 480 | 66% | 125,300 | 0.11 | 430 | ||||||||||||||||||||||||||||||
| TOTAL INDONESIA | 136,100 | 0.53 | 2,320 | 207,700 | 0.15 | 1,020 | 343,800 | 0.30 | 3,340 | 74% | 364,000 | 0.29 | 3,430 | ||||||||||||||||||||||||||||||
| Africa | |||||||||||||||||||||||||||||||||||||||||||
| Ahafo Open Pits(11) | 100% | 9,700 | 2.08 | 650 | 110,600 | 2.05 | 7,280 | 120,300 | 2.05 | 7,930 | 88% | 122,300 | 2.12 | 8,330 | |||||||||||||||||||||||||||||
| Ahafo Underground (3) | 100% | - | - | 4,400 | 4.43 | 630 | 4,400 | 4.43 | 630 | 91% | 4,400 | 4.43 | 630 | ||||||||||||||||||||||||||||||
| Ahafo Stockpiles(6) | 100% | 39,100 | 1.07 | 1,350 | - | - | 39,100 | 1.07 | 1,350 | 86% | 33,800 | 1.07 | 1,160 | ||||||||||||||||||||||||||||||
| Total Ahafo, Ghana | 48,800 | 1.27 | 2,000 | 115,000 | 2.14 | 7,910 | 163,800 | 1.88 | 9,910 | 88% | 160,500 | 1.96 | 10,120 | ||||||||||||||||||||||||||||||
| Akyem Open Pit | 100% | 25,800 | 1.77 | 1,470 | 88,300 | 1.66 | 4,720 | 114,100 | 1.69 | 6,190 | 88% | 125,000 | 1.69 | 6,810 | |||||||||||||||||||||||||||||
| Akyem Stockpiles (6) | 100% | 7,700 | 1.94 | 480 | - | - | 7,700 | 1.94 | 480 | 90% | 5,000 | 2.32 | 370 | ||||||||||||||||||||||||||||||
| Total, Akyem, Ghana (12) | 33,500 | 1.81 | 1,950 | 88,300 | 1.66 | 4,720 | 121,800 | 1.70 | 6,670 | 88% | 130,000 | 1.72 | 7,180 | ||||||||||||||||||||||||||||||
| TOTAL AFRICA | 82,300 | 1.49 | 3,950 | 203,300 | 1.93 | 12,630 | 285,600 | 1.80 | 16,580 | 88% | 290,500 | 1.85 | 17,300 | ||||||||||||||||||||||||||||||
| TOTAL NEWMONT WORLDWIDE | 639,180 | 1.36 | 27,990 | 1,816,700 | 0.93 | 54,200 | 2,455,880 | 1.04 | 82,190 | 81% | 2,684,340 | 1.02 | 88,350 | ||||||||||||||||||||||||||||||
|
See Footnotes under Gold Reserves U.S. units table. |
|||||||||||||||||||||||||||||||||||||||||||
| Attributable Gold Mineral Resources(1)(2) - December 31, 2014, U.S. Units | |||||||||||||||||||||||||||||||||||||||
| Gold Measured Resource | Gold Indicated Resource |
Gold Measured + Indicated |
Gold Inferred Resource | ||||||||||||||||||||||||||||||||||||
| Deposits/Districts | Newmont Share | Tonnage | Grade | Au | Tonnage | Grade | Au | Tonnage | Grade | Au | Tonnage | Grade | Au | ||||||||||||||||||||||||||
|
(x1000 |
(oz/ton) |
(x1000 |
(x1000 |
(oz/ton) |
(x1000 |
(x1000 |
(oz/ton) |
(x1000 |
(x1000 |
(oz/ton) |
(x1000 |
||||||||||||||||||||||||||||
| North America | |||||||||||||||||||||||||||||||||||||||
| Carlin Trend Open Pit, Nevada | 100% | 27,700 | 0.035 | 970 | 54,200 | 0.023 | 1,260 | 81,900 | 0.027 | 2,230 | 11,100 | 0.019 | 210 | ||||||||||||||||||||||||||
| Carlin Trend Underground, Nevada | 100% | 700 | 0.143 | 100 | 2,200 | 0.264 | 570 | 2,900 | 0.235 | 670 | 3,200 | 0.251 | 800 | ||||||||||||||||||||||||||
| Total Carlin, Nevada | 28,400 | 0.037 | 1,070 | 56,400 | 0.033 | 1,830 | 84,800 | 0.034 | 2,900 | 14,300 | 0.071 | 1,010 | |||||||||||||||||||||||||||
| Phoenix, Nevada | 100% | 1,600 | 0.020 | 30 | 47,900 | 0.018 | 890 | 49,500 | 0.019 | 920 | 40,100 | 0.015 | 600 | ||||||||||||||||||||||||||
| Lone Tree Complex, Nevada | 100% | - | - | 2,200 | 0.023 | 50 | 2,200 | 0.023 | 50 | 5,500 | 0.016 | 90 | |||||||||||||||||||||||||||
| Buffalo Valley, Nevada | 70% | - | - | 15,500 | 0.019 | 290 | 15,500 | 0.019 | 290 | 400 | 0.011 | - | |||||||||||||||||||||||||||
| Phoenix Stockpiles, Nevada(6) | 100% | - | - | - | - | - | - | 2,300 | 0.043 | 100 | |||||||||||||||||||||||||||||
| Total Phoenix, Nevada | 1,600 | 0.020 | 30 | 65,600 | 0.019 | 1,230 | 67,200 | 0.019 | 1,260 | 48,300 | 0.016 | 790 | |||||||||||||||||||||||||||
| Twin Creeks, Nevada | 100% | 8,800 | 0.071 | 630 | 29,700 | 0.055 | 1,630 | 38,500 | 0.059 | 2,260 | 1,300 | 0.024 | 30 | ||||||||||||||||||||||||||
| Sandman, Nevada | 100% | - | - | 1,300 | 0.036 | 50 | 1,300 | 0.036 | 50 | 1,100 | 0.054 | 60 | |||||||||||||||||||||||||||
| Turquoise Ridge, Nevada (5) | 25% | 700 | 0.511 | 370 | 400 | 0.450 | 160 | 1,100 | 0.490 | 530 | 800 | 0.530 | 400 | ||||||||||||||||||||||||||
| Twin Creeks Stockpiles, Nevada(6) | 100% | 5,900 | 0.061 | 360 | - | - | 5,900 | 0.061 | 360 | - | - | ||||||||||||||||||||||||||||
| Total Twin Creeks, Nevada | 15,400 | 0.088 | 1,360 | 31,400 | 0.059 | 1,840 | 46,800 | 0.068 | 3,200 | 3,200 | 0.153 | 490 | |||||||||||||||||||||||||||
| Long Canyon, Nevada(3) | 100% | 100 | 0.075 | 10 | 4,800 | 0.101 | 480 | 4,900 | 0.101 | 490 | 20,300 | 0.087 | 1,750 | ||||||||||||||||||||||||||
| Total North America | 45,500 | 0.054 | 2,470 | 158,200 | 0.034 | 5,380 | 203,700 | 0.039 | 7,850 | 86,100 | 0.047 | 4,040 | |||||||||||||||||||||||||||
| South America | |||||||||||||||||||||||||||||||||||||||
| Conga, Peru(3) | 51.35% | - | - | - | 89,300 | 0.012 | 1,030 | 89,300 | 0.012 | 1,030 | 130,500 | 0.011 | 1,480 | ||||||||||||||||||||||||||
| Yanacocha, Peru | 51.35% | 1,300 | 0.036 | 50 | 44,800 | 0.015 | 680 | 46,100 | 0.016 | 730 | 112,000 | 0.024 | 2,640 | ||||||||||||||||||||||||||
| La Zanja, Peru (7) | 46.94% | 300 | 0.012 | - | 600 | 0.012 | 10 | 900 | 0.012 | 10 | 700 | 0.022 | 20 | ||||||||||||||||||||||||||
| Merian, Suriname(9) | 75% | 2,400 | 0.018 | 40 | 18,700 | 0.027 | 510 | 21,100 | 0.026 | 550 | 29,700 | 0.029 | 870 | ||||||||||||||||||||||||||
| Total South America | 4,000 | 0.023 | 90 | 153,400 | 0.015 | 2,230 | 157,400 | 0.015 | 2,320 | 272,900 | 0.018 | 5,010 | |||||||||||||||||||||||||||
| Australia/ New Zealand | |||||||||||||||||||||||||||||||||||||||
| Boddington, Western Australia | 100% | 10,800 | 0.013 | 140 | 139,400 | 0.015 | 2,120 | 150,200 | 0.015 | 2,260 | 5,200 | 0.017 | 90 | ||||||||||||||||||||||||||
| Duketon, Western Australia(8) | 19.45% | 800 | 0.032 | 20 | 15,200 | 0.026 | 400 | 16,000 | 0.026 | 420 | 7,100 | 0.030 | 210 | ||||||||||||||||||||||||||
| Kalgoorlie, Western Australia | 50% | 6,000 | 0.043 | 260 | 20,100 | 0.044 | 890 | 26,100 | 0.044 | 1,150 | 700 | 0.066 | 40 | ||||||||||||||||||||||||||
| McPhilliamys, New South Wales(8) | 19.45% | - | - | 14,800 | 0.027 | 410 | 14,800 | 0.027 | 410 | 800 | 0.029 | 20 | |||||||||||||||||||||||||||
| Tanami, Northern Territory | 100% | 500 | 0.166 | 90 | 2,900 | 0.164 | 480 | 3,400 | 0.164 | 570 | 10,100 | 0.174 | 1,760 | ||||||||||||||||||||||||||
| Waihi, New Zealand | 100% | - | - | - | - | - | - | 100 | 0.317 | 40 | |||||||||||||||||||||||||||||
| Total Australia/ New Zealand | 18,100 | 0.028 | 510 | 192,400 | 0.022 | 4,300 | 210,500 | 0.023 | 4,810 | 24,000 | 0.090 | 2,160 | |||||||||||||||||||||||||||
| Indonesia | |||||||||||||||||||||||||||||||||||||||
| Batu Hijau, Indonesia(9) | 48.5% | 35,600 | 0.012 | 420 | 112,100 | 0.007 | 830 | 147,700 | 0.008 | 1,250 | 13,800 | 0.002 | 30 | ||||||||||||||||||||||||||
| Elang, Indonesia(3)(9) | 48.5% | - | - | 789,200 | 0.010 | 8,140 | 789,200 | 0.010 | 8,140 | 200,600 | 0.007 | 1,420 | |||||||||||||||||||||||||||
| Total Indonesia | 35,600 | 0.012 | 420 | 901,300 | 0.010 | 8,970 | 936,900 | 0.010 | 9,390 | 214,400 | 0.007 | 1,450 | |||||||||||||||||||||||||||
| Africa | |||||||||||||||||||||||||||||||||||||||
| Ahafo, Ghana | 100.0% | 6,100 | 0.048 | 290 | 48,100 | 0.041 | 1,990 | 54,200 | 0.042 | 2,280 | 22,000 | 0.047 | 1,040 | ||||||||||||||||||||||||||
| Ahafo Underground | 100.0% | - | - | - | - | - | - | - | 16,000 | 0.135 | 2,160 | ||||||||||||||||||||||||||||
| Total Ahafo | 6,100 | 0.048 | 290 | 48,100 | 0.041 | 1,990 | 54,200 | 0.042 | 2,280 | 38,100 | 0.084 | 3,200 | |||||||||||||||||||||||||||
| Akyem, Ghana | 100.0% | 1,100 | 0.020 | 20 | 3,900 | 0.016 | 60 | 5,000 | 0.016 | 80 | 3,100 | 0.031 | 100 | ||||||||||||||||||||||||||
| Total Africa | 7,200 | 0.043 | 310 | 52,000 | 0.040 | 2,050 | 59,200 | 0.040 | 2,360 | 41,200 | 0.080 | 3,300 | |||||||||||||||||||||||||||
| TOTAL NEWMONT WORLDWIDE | 110,400 | 0.034 | 3,800 | 1,457,300 | 0.016 | 22,930 | 1,567,700 | 0.017 | 26,730 | 638,600 | 0.025 | 15,960 | |||||||||||||||||||||||||||
|
(1) Resources are reported exclusive of reserves. (2) Resources are calculated at a gold price of $1,400, A$1,475 or NZ$1,795 per ounce unless otherwise noted. 2013 Resources were calculated at a gold price of $1,400, A$1,475 or NZ$1,700 per ounce unless otherwise noted. Tonnage amounts have been rounded to the nearest 100,000, and ounces have been rounded to the nearest 10,000. (3) Project is currently undeveloped. (4) Measured and Indicated Resources (combined) are equivalent to Mineralized Material disclosed in Newmont’s 10-K filing. (5) Resource estimates provided by Barrick, the operator of the Turquoise Ridge Joint Venture. (6) Stockpiles are comprised primarily of material that has been set aside to allow processing of higher grade material in the mills. (7) Resource estimates provided by Buenaventura, the operator of the La Zanja project. (8) Resource estimates provided by Regis Resources Ltd., in which Newmont holds a 19.45% interest. (9) Percentage reflects Newmont’s economic interest as of December 31, 2014. |
|||||||||||||||||||||||||||||||||||||||
| Attributable Gold Mineral Resources(1)(2) - December 31, 2014, Metric units | |||||||||||||||||||||||||||||||||||||||
| Gold Measured Resource | Gold Indicated Resource |
Gold Measured + Indicated |
Gold Inferred Resource | ||||||||||||||||||||||||||||||||||||
| Deposits/Districts |
Newmont |
Tonnage | Grade | Au | Tonnage | Grade | Au | Tonnage | Grade | Au | Tonnage | Grade | Au | ||||||||||||||||||||||||||
|
(x1000 |
(g/tonne) |
(x1000 |
(x1000 |
(g/tonne) |
(x1000 |
(x1000 |
(g/tonne) |
(x1000 |
(x1000 |
(g/tonne) |
(x1000 |
||||||||||||||||||||||||||||
| North America | |||||||||||||||||||||||||||||||||||||||
| Carlin Trend Open Pit, Nevada | 100% | 25,100 | 1.19 | 970 | 49,100 | 0.80 | 1,260 | 74,200 | 0.93 | 2,230 | 10,100 | 0.66 | 210 | ||||||||||||||||||||||||||
| Carlin Trend Underground, Nevada | 100% | 600 | 4.89 | 100 | 2,000 | 9.04 | 570 | 2,600 | 8.07 | 670 | 2,900 | 8.61 | 800 | ||||||||||||||||||||||||||
| Total Carlin, Nevada | 25,700 | 1.28 | 1,070 | 51,100 | 1.12 | 1,830 | 76,800 | 1.17 | 2,900 | 13,000 | 2.43 | 1,010 | |||||||||||||||||||||||||||
| Phoenix, Nevada | 100% | 1,400 | 0.69 | 30 | 43,500 | 0.63 | 890 | 44,900 | 0.64 | 920 | 36,300 | 0.52 | 600 | ||||||||||||||||||||||||||
| Lone Tree Complex, Nevada | 100% | - | - | 2,000 | 0.79 | 50 | 2,000 | 0.79 | 50 | 5,000 | 0.55 | 90 | |||||||||||||||||||||||||||
| Buffalo Valley, Nevada | 70% | - | - | 14,100 | 0.65 | 290 | 14,100 | 0.65 | 290 | 400 | 0.38 | - | |||||||||||||||||||||||||||
| Phoenix Stockpiles, Nevada(6) | 100% | - | - | - | - | - | - | 2,100 | 1.48 | 100 | |||||||||||||||||||||||||||||
| Total Phoenix, Nevada | 1,400 | 0.69 | 30 | 59,600 | 0.64 | 1,230 | 61,000 | 0.64 | 1,260 | 43,800 | 0.57 | 790 | |||||||||||||||||||||||||||
| Twin Creeks, Nevada | 100% | 8,000 | 2.44 | 630 | 26,900 | 1.88 | 1,630 | 34,900 | 2.01 | 2,260 | 1,200 | 0.83 | 30 | ||||||||||||||||||||||||||
| Sandman, Nevada | 100% | - | - | 1,200 | 1.23 | 50 | 1,200 | 1.23 | 50 | 1,000 | 1.85 | 60 | |||||||||||||||||||||||||||
| Turquoise Ridge, Nevada (5) | 25% | 700 | 17.51 | 370 | 300 | 15.42 | 160 | 1,000 | 16.81 | 530 | 700 | 18.17 | 400 | ||||||||||||||||||||||||||
| Twin Creeks Stockpiles, Nevada(6) | 100% | 5,400 | 2.08 | 360 | - | - | 5,400 | 2.08 | 360 | - | - | ||||||||||||||||||||||||||||
| Total Twin Creeks, Nevada | 14,100 | 3.01 | 1,360 | 28,400 | 2.01 | 1,840 | 42,500 | 2.34 | 3,200 | 2,900 | 5.24 | 490 | |||||||||||||||||||||||||||
| Long Canyon, Nevada(3) | 100% | 100 | 2.58 | 10 | 4,300 | 3.48 | 480 | 4,400 | 3.46 | 490 | 18,400 | 2.97 | 1,750 | ||||||||||||||||||||||||||
| Total North America | 41,300 | 1.85 | 2,470 | 143,400 | 1.17 | 5,380 | 184,700 | 1.32 | 7,850 | 78,100 | 1.61 | 4,040 | |||||||||||||||||||||||||||
| South America | |||||||||||||||||||||||||||||||||||||||
| Conga, Peru(3) | 51.35% | - | - | - | 81,000 | 0.40 | 1,030 | 81,000 | 0.40 | 1,030 | 118,400 | 0.39 | 1,480 | ||||||||||||||||||||||||||
| Yanacocha, Peru | 51.35% | 1,200 | 1.24 | 50 | 40,600 | 0.52 | 680 | 41,800 | 0.54 | 730 | 101,600 | 0.81 | 2,640 | ||||||||||||||||||||||||||
| La Zanja, Peru (7) | 46.94% | 200 | 0.40 | - | 500 | 0.41 | 10 | 700 | 0.41 | 10 | 600 | 0.77 | 20 | ||||||||||||||||||||||||||
| Merian, Suriname(9) | 75% | 2,200 | 0.60 | 40 | 16,900 | 0.93 | 510 | 19,100 | 0.89 | 550 | 27,000 | 1.00 | 870 | ||||||||||||||||||||||||||
| Total South America | 3,600 | 0.80 | 90 | 139,000 | 0.50 | 2,230 | 142,600 | 0.50 | 2,320 | 247,600 | 0.63 | 5,010 | |||||||||||||||||||||||||||
| Australia/New Zealand | |||||||||||||||||||||||||||||||||||||||
| Boddington, Western Australia | 100% | 9,800 | 0.46 | 140 | 126,400 | 0.52 | 2,120 | 136,200 | 0.52 | 2,260 | 4,800 | 0.57 | 90 | ||||||||||||||||||||||||||
| Duketon, Western Australia(8) | 19.45% | 700 | 1.11 | 20 | 13,800 | 0.90 | 400 | 14,500 | 0.91 | 420 | 6,500 | 1.03 | 210 | ||||||||||||||||||||||||||
| Kalgoorlie, Western Australia | 50% | 5,400 | 1.48 | 260 | 18,200 | 1.52 | 890 | 23,600 | 1.51 | 1,150 | 600 | 2.27 | 40 | ||||||||||||||||||||||||||
| McPhilliamys, New South Wales(8) | 19.45% | - | - | 13,500 | 0.94 | 410 | 13,500 | 0.94 | 410 | 800 | 0.98 | 20 | |||||||||||||||||||||||||||
| Tanami, Northern Territory | 100% | 500 | 5.68 | 90 | 2,700 | 5.62 | 480 | 3,200 | 5.63 | 570 | 9,200 | 5.97 | 1,760 | ||||||||||||||||||||||||||
| Waihi, New Zealand | 100% | - | - | - | - | - | - | 100 | 10.86 | 40 | |||||||||||||||||||||||||||||
| Total Australia/New Zealand | 16,400 | 0.98 | 510 | 174,600 | 0.76 | 4,300 | 191,000 | 0.78 | 4,810 | 22,000 | 3.08 | 2,160 | |||||||||||||||||||||||||||
| Indonesia | |||||||||||||||||||||||||||||||||||||||
| Batu Hijau, Indonesia(9) | 48.5% | 32,300 | 0.40 | 420 | 101,700 | 0.25 | 830 | 134,000 | 0.29 | 1,250 | 12,500 | 0.09 | 30 | ||||||||||||||||||||||||||
| Elang, Indonesia(3)(9) | 48.5% | - | - | 715,900 | 0.35 | 8,140 | 715,900 | 0.35 | 8,140 | 182,000 | 0.24 | 1,420 | |||||||||||||||||||||||||||
| Total Indonesia | 32,300 | 0.40 | 420 | 817,600 | 0.34 | 8,970 | 849,900 | 0.34 | 9,390 | 194,500 | 0.23 | 1,450 | |||||||||||||||||||||||||||
| Africa | |||||||||||||||||||||||||||||||||||||||
| Ahafo, Ghana | 100.0% | 5,500 | 1.64 | 290 | 43,600 | 1.42 | 1,990 | 49,100 | 1.45 | 2,280 | 20,000 | 1.61 | 1,040 | ||||||||||||||||||||||||||
| Ahafo Underground | 100.0% | - | - | - | - | - | - | 14,500 | 4.63 | 2,160 | |||||||||||||||||||||||||||||
| Total Ahafo | 100.0% | 5,500 | 1.64 | 290 | 43,600 | 1.42 | 1,990 | 49,100 | 1.45 | 2,280 | 34,500 | 2.88 | 3,200 | ||||||||||||||||||||||||||
| Akyem, Ghana | 100.0% | 1,000 | 0.56 | 20 | 3,500 | 0.56 | 60 | 4,500 | 0.56 | 80 | 2,800 | 1.07 | 100 | ||||||||||||||||||||||||||
| Total Africa | 6,500 | 1.47 | 310 | 47,100 | 1.36 | 2,050 | 53,600 | 1.37 | 2,360 | 37,300 | 2.75 | 3,300 | |||||||||||||||||||||||||||
| TOTAL NEWMONT WORLDWIDE | 100,100 | 1.18 | 3,800 | 1,321,700 | 0.54 | 22,930 | 1,421,800 | 0.58 | 26,730 | 579,500 | 0.86 | 15,960 | |||||||||||||||||||||||||||
|
See footnotes in Gold Resources U.S. units table. |
|||||||||||||||||||||||||||||||||||||||
| Attributable Copper Reserves(1) U.S. Units | |||||||||||||||||||||||||||||||||||||||||||
| December 31, 2014 | December 31, 2013 | ||||||||||||||||||||||||||||||||||||||||||
| Proven Reserves | Probable Reserves | Proven + Probable Reserves | Proven + Probable Reserve | ||||||||||||||||||||||||||||||||||||||||
| Deposits/Districts |
Newmont |
Tonnage | Grade | Copper | Tonnage | Grade | Copper | Tonnage | Grade | Copper |
Metallurgical |
Tonnage | Grade | Copper | |||||||||||||||||||||||||||||
| (x1000 tons) | (Cu%) | (million pounds) | (x1000 tons) | (Cu%) | (million pounds) | (x1000 tons) | (Cu%) | (million pounds) |
|
(x1000 tons) | (Cu%) | (million pounds) | |||||||||||||||||||||||||||||||
| North America | |||||||||||||||||||||||||||||||||||||||||||
| Phoenix, Nevada | 100% | 19,200 | 0.15% | 60 | 305,700 | 0.14% | 880 | 324,900 | 0.14% | 940 | 58% | 339,100 | 0.14% | 940 | |||||||||||||||||||||||||||||
| Phoenix Copper Leach, Nevada | 100% | 12,600 | 0.18% | 50 | 199,100 | 0.19% | 740 | 211,700 | 0.19% | 790 | 52% | 160,800 | 0.22% | 710 | |||||||||||||||||||||||||||||
| TOTAL NORTH AMERICA | 31,800 | 0.16% | 110 | 504,800 | 0.16% | 1,620 | 536,600 | 0.16% | 1,730 | 55% | 499,900 | 0.17% | 1,650 | ||||||||||||||||||||||||||||||
| South America | |||||||||||||||||||||||||||||||||||||||||||
| Conga, Peru(2) | 51.35% | - | - | 303,400 | 0.28% | 1,690 | 303,400 | 0.28% | 1,690 | 85% | 303,400 | 0.28% | 1,690 | ||||||||||||||||||||||||||||||
| TOTAL SOUTH AMERICA | - | - | 303,400 | 0.28% | 1,690 | 303,400 | 0.28% | 1,690 | 85% | 303,400 | 0.28% | 1,690 | |||||||||||||||||||||||||||||||
| Australia/New Zealand | |||||||||||||||||||||||||||||||||||||||||||
| Boddington | 100% | 115,800 | 0.09% | 210 | 418,300 | 0.12% | 1,010 | 534,100 | 0.11% | 1,220 | 77% | 616,100 | 0.11% | 1,370 | |||||||||||||||||||||||||||||
| Boddington Stockpiles(3) | 100% | 26,400 | 0.09% | 50 | 58,200 | 0.08% | 90 | 84,600 | 0.08% | 140 | 72% | 69,800 | 0.08% | 120 | |||||||||||||||||||||||||||||
| TOTAL AUSTRALIA/NEW ZEALAND | 142,200 | 0.09% | 260 | 476,500 | 0.12% | 1,100 | 618,700 | 0.11% | 1,360 | 76% | 685,900 | 0.11% | 1,490 | ||||||||||||||||||||||||||||||
| Indonesia | |||||||||||||||||||||||||||||||||||||||||||
| Batu Hijau(4) | 48.5% | 150,100 | 0.51% | 1,540 | 71,100 | 0.39% | 550 | 221,200 | 0.47% | 2,090 | 78% | 263,100 | 0.45% | 2,380 | |||||||||||||||||||||||||||||
| Batu Hijau Stockpiles(3)(4) | 48.5% | - | - | 157,900 | 0.33% | 1,060 | 157,900 | 0.33% | 1,060 | 60% | 138,200 | 0.33% | 920 | ||||||||||||||||||||||||||||||
| TOTAL INDONESIA | 150,100 | 0.51% | 1,540 | 229,000 | 0.35% | 1,610 | 379,100 | 0.41% | 3,150 | 72% | 401,300 | 0.41% | 3,300 | ||||||||||||||||||||||||||||||
| TOTAL NEWMONT WORLDWIDE | 324,100 | 0.29% | 1,910 | 1,513,700 | 0.20% | 6,020 | 1,837,800 | 0.22% | 7,930 | 72% | 1,890,500 | 0.22% | 8,130 | ||||||||||||||||||||||||||||||
|
(1) Reserves are calculated at a price of $3.00 or A$3.25 per pound copper price unless otherwise noted. 2013 Reserves were calculated at $3.00 or A$3.25 per pound copper price unless otherwise noted. Tonnage amounts have been rounded to the nearest 100,000, and pounds have been rounded to the nearest 10 million. (2) Project is undeveloped. (3) Stockpiles are comprised primarily of material that has been set aside to allow processing of higher grade material. Stockpiles increase or decrease depending on current mine plans. (4) Percentage reflects Newmont’s economic interest as of December 31, 2014. |
|||||||||||||||||||||||||||||||||||||||||||
| Attributable Copper Reserves(1) Metric Units | |||||||||||||||||||||||||||||||||||||||||||
| December 31, 2014 | December 31, 2013 | ||||||||||||||||||||||||||||||||||||||||||
| Proven Reserves | Probable Reserves | Proven + Probable Reserves | Proven + Probable Reserve | ||||||||||||||||||||||||||||||||||||||||
| Deposits/Districts |
Newmont |
Tonnage | Grade | Copper | Tonnage | Grade | Copper | Tonnage | Grade | Copper |
Metallurgical |
Tonnage | Grade | Copper | |||||||||||||||||||||||||||||
|
(x1000 |
(Cu%) | (Tonnes) |
(x1000 |
(Cu%) | (Tonnes) |
(x1000 |
(Cu%) | (Tonnes) |
|
(x1000 |
(Cu%) | (Tonnes) | |||||||||||||||||||||||||||||||
| North America | |||||||||||||||||||||||||||||||||||||||||||
| Phoenix, Nevada | 100% | 17,400 | 0.15% | 25,500 | 277,300 | 0.14% | 397,400 | 294,700 | 0.14% | 422,900 | 58% | 307,600 | 0.14% | 428,730 | |||||||||||||||||||||||||||||
| Phoenix Copper Leach, Nevada | 100% | 11,400 | 0.18% | 20,450 | 180,600 | 0.19% | 336,990 | 192,000 | 0.19% | 357,440 | 52% | 145,900 | 0.22% | 320,040 | |||||||||||||||||||||||||||||
| TOTAL NORTH AMERICA | 28,800 | 0.16% | 45,950 | 457,900 | 0.16% | 734,390 | 486,700 | 0.16% | 780,340 | 55% | 453,500 | 0.17% | 748,770 | ||||||||||||||||||||||||||||||
| South America | |||||||||||||||||||||||||||||||||||||||||||
| Conga, Peru(2) | 51.35% | - | - | 275,200 | 0.28% | 767,420 | 275,200 | 0.28% | 767,420 | 85% | 275,200 | 0.28% | 767,420 | ||||||||||||||||||||||||||||||
| TOTAL SOUTH AMERICA | - | - | 275,200 | 0.28% | 767,420 | 275,200 | 0.28% | 767,420 | 85% | 275,200 | 0.28% | 767,420 | |||||||||||||||||||||||||||||||
| Australia/New Zealand | |||||||||||||||||||||||||||||||||||||||||||
| Boddington | 100% | 105,100 | 0.09% | 94,590 | 379,500 | 0.12% | 459,150 | 484,600 | 0.11% | 553,740 | 77% | 559,000 | 0.11% | 624,430 | |||||||||||||||||||||||||||||
| Boddington Stockpiles(3) | 100% | 24,000 | 0.09% | 21,600 | 52,800 | 0.08% | 42,070 | 76,800 | 0.08% | 63,670 | 72% | 63,300 | 0.08% | 53,220 | |||||||||||||||||||||||||||||
| TOTAL AUSTRALIA/NEW ZEALAND | 129,100 | 0.09% | 116,190 | 432,300 | 0.12% | 501,220 | 561,400 | 0.11% | 617,410 | 76% | 622,300 | 0.11% | 677,650 | ||||||||||||||||||||||||||||||
| Indonesia | |||||||||||||||||||||||||||||||||||||||||||
| Batu Hijau(4) | 48.5% | 136,100 | 0.51% | 698,390 | 64,500 | 0.39% | 248,660 | 200,600 | 0.47% | 947,050 | 78% | 238,700 | 0.45% | 1,081,140 | |||||||||||||||||||||||||||||
| Batu Hijau Stockpiles(3)(4) | 48.5% | - | - | 143,200 | 0.33% | 479,200 | 143,200 | 0.33% | 479,200 | 60% | 125,300 | 0.33% | 417,690 | ||||||||||||||||||||||||||||||
| TOTAL INDONESIA | 136,100 | 0.51% | 698,390 | 207,700 | 0.35% | 727,860 | 343,800 | 0.41% | 1,426,250 | 72% | 364,000 | 0.41% | 1,498,830 | ||||||||||||||||||||||||||||||
| TOTAL NEWMONT WORLDWIDE | 294,000 | 0.29% | 860,530 | 1,373,100 | 0.20% | 2,730,890 | 1,667,100 | 0.22% | 3,591,420 | 72% | 1,715,000 | 0.22% | 3,692,670 | ||||||||||||||||||||||||||||||
|
See footnotes under Copper Reserves U.S. units table. |
|||||||||||||||||||||||||||||||||||||||||||
| Attributable Copper Mineral Resources(1)(2) U.S. Units | |||||||||||||||||||||||||||||||||||||||
| December 31, 2014 | |||||||||||||||||||||||||||||||||||||||
| Measured Resources | Indicated Resources | Measured + Indicated Resources(3) | Inferred Resources | ||||||||||||||||||||||||||||||||||||
| Deposits/Districts |
Newmont |
Tonnage | Grade | Copper | Tonnage | Grade | Copper | Tonnage | Grade | Copper | Tonnage | Grade | Copper | ||||||||||||||||||||||||||
|
(x1000 |
(Cu%) |
(million |
|
(Cu%) |
(million |
(x1000 |
(Cu%) |
(million |
(x1000 |
(Cu%) |
(million |
||||||||||||||||||||||||||||
| North America | |||||||||||||||||||||||||||||||||||||||
| Phoenix, Nevada | 100% | 1,600 | 0.12 | % | 4 | 47,900 | 0.12 | % | 110 | 49,500 | 0.12 | % | 114 | 42,400 | 0.13 | % | 110 | ||||||||||||||||||||||
| Phoenix Copper Leach, Nevada | 100% | 1,200 | 0.14 | % | 3 | 38,400 | 0.14 | % | 100 | 39,600 | 0.14 | % | 103 | 27,300 | 0.15 | % | 80 | ||||||||||||||||||||||
| TOTAL NORTH AMERICA | 2,800 | 0.13 | % | 7 | 86,300 | 0.13 | % | 210 | 89,100 | 0.13 | % | 217 | 69,700 | 0.13 | % | 190 | |||||||||||||||||||||||
| South America | |||||||||||||||||||||||||||||||||||||||
| Conga, Peru(5) | 51.35% | - | - | 89,300 | 0.19 | % | 350 | 89,300 | 0.19 | % | 350 | 130,500 | 0.19 | % | 490 | ||||||||||||||||||||||||
| TOTAL SOUTH AMERICA | - | - | 89,300 | 0.19 | % | 350 | 89,300 | 0.19 | % | 350 | 130,500 | 0.19 | % | 490 | |||||||||||||||||||||||||
| Australia/New Zealand | |||||||||||||||||||||||||||||||||||||||
| Boddington, Western Australia | 100% | 10,800 | 0.08 | % | 20 | 139,400 | 0.11 | % | 310 | 150,200 | 0.11 | % | 330 | 5,200 | 0.14 | % | 10 | ||||||||||||||||||||||
| TOTAL AUSTRALIA/NEW ZEALAND | 10,800 | 0.08 | % | 20 | 139,400 | 0.11 | % | 310 | 150,200 | 0.11 | % | 330 | 5,200 | 0.14 | % | 10 | |||||||||||||||||||||||
| Indonesia | |||||||||||||||||||||||||||||||||||||||
| Batu Hijau, Indonesia(4) | 48.5% | 35,600 | 0.38 | % | 270 | 112,100 | 0.35 | % | 790 | 147,700 | 0.36 | % | 1,060 | 13,800 | 0.31 | % | 80 | ||||||||||||||||||||||
| Elang, Indonesia(4)(5) | 48.5% | - | 0.00 | % | - | 789,200 | 0.34 | % | 5,310 | 789,200 | 0.34 | % | 5,310 | 200,600 | 0.24 | % | 970 | ||||||||||||||||||||||
| TOTAL INDONESIA | 35,600 | 0.38 | % | 270 | 901,300 | 0.34 | % | 6,100 | 936,900 | 0.34 | % | 6,370 | 214,400 | 0.25 | % | 1,050 | |||||||||||||||||||||||
| TOTAL NEWMONT WORLDWIDE | 49,200 | 0.30 | % | 297 | 1,216,300 | 0.29 | % | 6,970 | 1,265,500 | 0.29 | % | 7,267 | 419,800 | 0.21 | % | 1,740 | |||||||||||||||||||||||
|
(1) Resources are reported exclusive of reserves. (2) Resources are calculated at a copper price of $3.50 or A$3.70 per pound unless otherwise noted. 2013 Resources were calculated at a copper price of $3.50 or A$3.70 per pound unless otherwise noted. Tonnage amounts have been rounded to the nearest 100,000, and pounds have been rounded to the nearest 10 million, with the exception of Phoenix, Nevada. (3) Measured and Indicated Resources (combined) are equivalent to Mineralized Material disclosed in Newmont’s Form 10-K filing. (4) Percentage reflects Newmont’s economic interest as of December 31, 2014. (5) Project is undeveloped. |
|||||||||||||||||||||||||||||||||||||||
| Attributable Copper Mineral Resources(1)(2) Metric Units | |||||||||||||||||||||||||||||||||||||||
| December 31, 2014 | |||||||||||||||||||||||||||||||||||||||
| Measured Resources | Indicated Resources | Measured + Indicated Resources(3) | Inferred Resources | ||||||||||||||||||||||||||||||||||||
| Deposits/Districts |
Newmont |
Tonnage | Grade | Copper | Tonnage | Grade | Copper | Tonnage | Grade | Copper | Tonnage | Grade | Copper | ||||||||||||||||||||||||||
|
(x1000 |
(Cu%) | (tonnes) |
(x1000 |
(Cu%) | (tonnes) |
(x1000 |
(Cu%) | (tonnes) |
(x1000 |
(Cu%) | (tonnes) | ||||||||||||||||||||||||||||
| North America | |||||||||||||||||||||||||||||||||||||||
| Phoenix, Nevada | 100% | 1,400 | 0.12 | % | 1,690 | 43,500 | 0.12 | % | 51,280 | 44,900 | 0.12 | % | 52,970 | 38,500 | 0.13 | % | 48,900 | ||||||||||||||||||||||
| Phoenix Copper Leach, Nevada | 100% | 1,100 | 0.14 | % | 1,510 | 34,800 | 0.14 | % | 47,150 | 35,900 | 0.14 | % | 48,660 | 24,800 | 0.15 | % | 36,090 | ||||||||||||||||||||||
| TOTAL NORTH AMERICA | 2,500 | 0.13 | % | 3,200 | 78,300 | 0.13 | % | 98,430 | 80,800 | 0.13 | % | 101,630 | 63,300 | 0.13 | % | 84,990 | |||||||||||||||||||||||
| South America | |||||||||||||||||||||||||||||||||||||||
| Conga, Peru(5) | 51.35% | - | - | 81,000 | 0.19 | % | 156,960 | 81,000 | 0.19 | % | 156,960 | 118,400 | 0.19 | % | 221,030 | ||||||||||||||||||||||||
| TOTAL SOUTH AMERICA | - | - | 81,000 | 0.19 | % | 156,960 | 81,000 | 0.19 | % | 156,960 | 118,400 | 0.19 | % | 221,030 | |||||||||||||||||||||||||
| Australia/New Zealand | |||||||||||||||||||||||||||||||||||||||
| Boddington, Western Australia | 100% | 9,800 | 0.08 | % | 8,020 | 126,400 | 0.11 | % | 139,250 | 136,200 | 0.11 | % | 147,270 | 4,800 | 0.14 | % | 6,590 | ||||||||||||||||||||||
| TOTAL AUSTRALIA/NEW ZEALAND | 9,800 | 0.08 | % | 8,020 | 126,400 | 0.11 | % | 139,250 | 136,200 | 0.11 | % | 147,270 | 4,800 | 0.14 | % | 6,590 | |||||||||||||||||||||||
| Indonesia | |||||||||||||||||||||||||||||||||||||||
| Batu Hijau, Indonesia(4) | 48.5% | 32,300 | 0.38 | % | 121,990 | 101,700 | 0.35 | % | 358,230 | 134,000 | 0.36 | % | 480,220 | 12,500 | 0.31 | % | 38,480 | ||||||||||||||||||||||
| Elang, Indonesia(4) | 48.5% | - | 0.00 | % | - | 715,900 | 0.34 | % | 2,408,370 | 715,900 | 0.34 | % | 2,408,370 | 182,000 | 0.24 | % | 439,250 | ||||||||||||||||||||||
| TOTAL INDONESIA | 32,300 | 0.38 | % | 121,990 | 817,600 | 0.34 | % | 2,766,600 | 849,900 | 0.34 | % | 2,888,590 | 194,500 | 0.25 | % | 477,730 | |||||||||||||||||||||||
| TOTAL NEWMONT WORLDWIDE | 44,600 | 0.30 | % | 133,210 | 1,103,300 | 0.29 | % | 3,161,240 | 1,147,900 | 0.29 | % | 3,294,450 | 381,000 | 0.21 | % | 790,340 | |||||||||||||||||||||||
|
See footnotes under Copper Resources U.S. units table. |
|||||||||||||||||||||||||||||||||||||||
| Attributable Proven, Probable, and Combined Silver Reserves(1) U.S. Units | |||||||||||||||||||||||||||||||||||||||||||
| December 31, 2014 | December 31, 2013 | ||||||||||||||||||||||||||||||||||||||||||
| Deposits/Districts | Proven Reserves | Probable Reserves | Proven and Probable Reserves |
Metallurgical |
Proven and Probable Reserves | ||||||||||||||||||||||||||||||||||||||
|
Newmont |
Tonnage | Grade | Silver | Tonnage | Grade | Silver | Tonnage | Grade | Silver | Tonnage | Grade | Silver | |||||||||||||||||||||||||||||||
|
(x1000 |
(oz/ton) |
(x1000 |
(x1000 |
(oz/ton) |
(x1000 |
(x1000 |
(oz/ton) |
(x1000 |
(x1000 |
(oz/ton) |
(x1000 |
||||||||||||||||||||||||||||||||
| North America | |||||||||||||||||||||||||||||||||||||||||||
| Midas, Nevada (5) | 100% | - | - | - | - | - | - | - | 250 | 11.48 | 2,820 | ||||||||||||||||||||||||||||||||
| Phoenix, Nevada | 100% | 19,200 | 0.25 | 4,860 | 305,700 | 0.24 | 73,740 | 324,900 | 0.24 | 78,600 | 34% | 339,100 | 0.24 | 80,280 | |||||||||||||||||||||||||||||
| TOTAL NORTH AMERICA | 19,200 | 0.25 | 4,860 | 305,700 | 0.24 | 73,740 | 324,900 | 0.24 | 78,600 | 34% | 339,350 | 0.24 | 83,100 | ||||||||||||||||||||||||||||||
| South America | |||||||||||||||||||||||||||||||||||||||||||
| Conga, Peru(6) | 51.35% | - | - | 303,400 | 0.06 | 19,400 | 303,400 | 0.06 | 19,400 | 70% | 303,400 | 0.06 | 19,400 | ||||||||||||||||||||||||||||||
| Yanacocha Open Pits, Peru | 51.35% | 16,100 | 0.37 | 5,930 | 69,300 | 0.12 | 8,330 | 85,400 | 0.17 | 14,260 | 19% | 90,400 | 0.13 | 11,310 | |||||||||||||||||||||||||||||
| Yanacocha In-Process(2) | 51.35% | - | - | 43,200 | 0.23 | 10,110 | 43,200 | 0.23 | 10,110 | 2% | 66,300 | 0.25 | 16,850 | ||||||||||||||||||||||||||||||
| Yanacocha Stockpiles(3) | 51.35% | 8,700 | 1.15 | 10,010 | - | - | 8,700 | 1.15 | 10,010 | 30% | 8,800 | 1.21 | 10,660 | ||||||||||||||||||||||||||||||
| Total Yanacocha, Peru | 51.35% | 24,800 | 0.64 | 15,940 | 112,500 | 0.16 | 18,440 | 137,300 | 0.25 | 34,380 | 17% | 165,500 | 0.23 | 38,820 | |||||||||||||||||||||||||||||
| TOTAL SOUTH AMERICA | 24,800 | 0.64 | 15,940 | 415,900 | 0.09 | 37,840 | 440,700 | 0.12 | 53,780 | 36% | 468,900 | 0.12 | 58,220 | ||||||||||||||||||||||||||||||
| Indonesia | |||||||||||||||||||||||||||||||||||||||||||
| Batu Hijau Open Pit(4) | 48.5% | 150,100 | 0.04 | 6,740 | 71,100 | 0.03 | 2,020 | 221,200 | 0.04 | 8,760 | 81% | 263,100 | 0.04 | 9,540 | |||||||||||||||||||||||||||||
| Batu Hijau Stockpiles(3)(4) | 48.5% | - | - | 157,900 | 0.02 | 2,430 | 157,900 | 0.02 | 2,430 | 68% | 138,200 | 0.02 | 2,110 | ||||||||||||||||||||||||||||||
| TOTAL INDONESIA | 150,100 | 0.04 | 6,740 | 229,000 | 0.02 | 4,450 | 379,100 | 0.03 | 11,190 | 78% | 401,300 | 0.03 | 11,650 | ||||||||||||||||||||||||||||||
| TOTAL NEWMONT WORLDWIDE | 194,100 | 0.14 | 27,540 | 950,600 | 0.12 | 116,030 | 1,144,700 | 0.13 | 143,570 | 38% | 1,209,550 | 0.13 | 152,970 | ||||||||||||||||||||||||||||||
|
(1) Reserves are calculated at a silver price of $20.00 per ounce unless otherwise noted. 2013 Reserves were calculated at a silver price of $20.00 per ounce unless otherwise noted. Tonnage amounts have been rounded to the nearest 100,000, unless they are less than 50,000, and silver ounces have been rounded to the nearest 10,000. (2) In-process material is the material on leach pads at the end of each year from which gold and silver remains to be recovered. (3) Stockpiles are comprised primarily of material that has been set aside to allow processing of higher grade material in the mills. (4) Percentage reflects Newmont’s economic interest as of December 31, 2014. (5) Property sold to Klondex Mines on February 11, 2014. Values in the table above are as of December 31, 2014. (6) Project is undeveloped. |
|||||||||||||||||||||||||||||||||||||||||||
| Attributable Proven, Probable, and Combined Silver Reserves(1) Metric Units | |||||||||||||||||||||||||||||||||||||||||||
| December 31, 2014 | December 31, 2013 | ||||||||||||||||||||||||||||||||||||||||||
| Deposits/Districts | Proven Reserves | Probable Reserves | Proven and Probable Reserves | Metallurgical Recovery | Proven and Probable Reserves | ||||||||||||||||||||||||||||||||||||||
|
Newmont |
Tonnage | Grade | Silver | Tonnage | Grade | Silver | Tonnage | Grade | Silver | Tonnage | Grade | Silver | |||||||||||||||||||||||||||||||
| (x1000 tonnes) | (g/tonne) | (x1000 ozs) | (x1000 tonnes) | (g/tonne) | (x1000 ozs) | (x1000 tonnes) | (g/tonne) | (x1000 ozs) | (x1000 tonnes) | (g/tonne) | (x1000 ozs) | ||||||||||||||||||||||||||||||||
| North America | |||||||||||||||||||||||||||||||||||||||||||
| Midas, Nevada (5) | 100% | - | - | - | - | - | - | - | 240 | 393.5 | 2,820 | ||||||||||||||||||||||||||||||||
| Phoenix, Nevada | 100% | 17,400 | 8.7 | 4,860 | 277,300 | 8.3 | 73,740 | 294,700 | 8.3 | 78,600 | 34% | 307,600 | 8.1 | 80,280 | |||||||||||||||||||||||||||||
| TOTAL NORTH AMERICA | 17,400 | 8.7 | 4,860 | 277,300 | 8.3 | 73,740 | 294,700 | 8.3 | 78,600 | 34% | 307,840 | 8.4 | 83,100 | ||||||||||||||||||||||||||||||
| South America | |||||||||||||||||||||||||||||||||||||||||||
| Conga, Peru(6) | 51.35% | - | - | 275,200 | 2.2 | 19,400 | 275,200 | 2.2 | 19,400 | 70% | 275,200 | 2.2 | 19,400 | ||||||||||||||||||||||||||||||
| Yanacocha Open Pits, Peru | 51.35% | 14,600 | 12.6 | 5,930 | 62,900 | 4.1 | 8,330 | 77,500 | 5.7 | 14,260 | 19% | 82,000 | 4.3 | 11,310 | |||||||||||||||||||||||||||||
| Yanacocha In-Process(2) | 51.35% | - | - | 39,200 | 8.0 | 10,110 | 39,200 | 8.0 | 10,110 | 2% | 60,200 | 8.7 | 16,850 | ||||||||||||||||||||||||||||||
| Yanacocha Stockpiles(3) | 51.35% | 7,900 | 39.4 | 10,010 | - | - | 7,900 | 39.4 | 10,010 | 30% | 8,000 | 41.3 | 10,660 | ||||||||||||||||||||||||||||||
| Total Yanacocha, Peru | 22,500 | 22.0 | 15,940 | 102,100 | 5.6 | 18,440 | 124,600 | 8.6 | 34,380 | 17% | 150,200 | 8.0 | 38,820 | ||||||||||||||||||||||||||||||
| TOTAL SOUTH AMERICA | 22,500 | 22.0 | 15,940 | 377,300 | 3.1 | 37,840 | 399,800 | 4.2 | 53,780 | 36% | 425,400 | 4.3 | 58,220 | ||||||||||||||||||||||||||||||
| Indonesia | |||||||||||||||||||||||||||||||||||||||||||
| Batu Hijau Open Pit(4) | 48.5% | 136,100 | 1.5 | 6,740 | 64,500 | 1.0 | 2,020 | 200,600 | 1.4 | 8,760 | 81% | 238,700 | 1.2 | 9,540 | |||||||||||||||||||||||||||||
| Batu Hijau Stockpiles(3)(4) | 48.5% | - | - | 143,200 | 0.5 | 2,430 | 143,200 | 0.5 | 2,430 | 68% | 125,300 | 0.5 | 2,110 | ||||||||||||||||||||||||||||||
| TOTAL INDONESIA | 136,100 | 1.5 | 6,740 | 207,700 | 0.7 | 4,450 | 343,800 | 1.0 | 11,190 | 78% | 364,000 | 1.0 | 11,650 | ||||||||||||||||||||||||||||||
| TOTAL NEWMONT WORLDWIDE | 176,000 | 4.9 | 27,540 | 862,300 | 4.2 | 116,030 | 1,038,300 | 4.3 | 143,570 | 38% | 1,097,240 | 4.3 | 152,970 | ||||||||||||||||||||||||||||||
|
See Footnotes under Silver Reserves U.S. units table. |
|||||||||||||||||||||||||||||||||||||||||||
| Attributable Silver Mineral Resources(1)(2) U.S. Units | |||||||||||||||||||||||||||||||||||||||
| December 31, 2014 | |||||||||||||||||||||||||||||||||||||||
| Deposits/Districts | Measured Resources | Indicated Resources | Measured + Indicated Resources(3) | Inferred Resources | |||||||||||||||||||||||||||||||||||
|
Newmont |
Tonnage | Grade | Ag | Tonnage | Grade | Ag | Tonnage | Grade | Ag | Tonnage | Grade | Ag | |||||||||||||||||||||||||||
|
(x1000 |
(oz/ton) |
(x1000 |
(x1000 |
(oz/ton) |
(x1000 |
(x1000 |
(oz/ton) |
(x1000 |
(x1000 |
(oz/ton) |
(x1000 |
||||||||||||||||||||||||||||
| North America | |||||||||||||||||||||||||||||||||||||||
| Sandman, Nevada | 100% | - | - | 1,300 | 0.20 | 300 | 1,300 | 0.20 | 300 | 1,100 | 0.12 | 100 | |||||||||||||||||||||||||||
| Phoenix, Nevada | 100% | 1,600 | 0.22 | 300 | 47,900 | 0.22 | 10,600 | 49,500 | 0.22 | 10,900 | 40,100 | 0.23 | 9,300 | ||||||||||||||||||||||||||
| Phoenix Stockpiles, Nevada(4) | 100% | - | - | - | - | - | - | 2,300 | 0.09 | 200 | |||||||||||||||||||||||||||||
| TOTAL NORTH AMERICA | 1,600 | 0.22 | 300 | 49,200 | 0.22 | 10,900 | 50,800 | 0.22 | 11,200 | 43,500 | 0.22 | 9,600 | |||||||||||||||||||||||||||
| South America | |||||||||||||||||||||||||||||||||||||||
| Conga, Peru(6) | 51.35% | - | - | 89,300 | 0.05 | 4,200 | 89,300 | 0.05 | 4,200 | 99,100 | 0.03 | 3,300 | |||||||||||||||||||||||||||
| Yanacocha, Peru | 51.35% | 800 | 0.45 | 400 | 14,700 | 0.25 | 3,700 | 15,500 | 0.26 | 4,100 | 2,200 | 0.19 | 400 | ||||||||||||||||||||||||||
| TOTAL SOUTH AMERICA | 800 | 0.45 | 400 | 104,000 | 0.08 | 7,900 | 104,800 | 0.08 | 8,300 | 101,300 | 0.04 | 3,700 | |||||||||||||||||||||||||||
| Indonesia | |||||||||||||||||||||||||||||||||||||||
| Batu Hijau, Indonesia(5) | 48.5% | 35,600 | 0.03 | 1,200 | 112,100 | 0.03 | 3,000 | 147,700 | 0.03 | 4,200 | 13,800 | 0.02 | 300 | ||||||||||||||||||||||||||
| Elang, Indonesia(5)(6) | 48.5% | - | - | 789,200 | 0.03 | 23,200 | 789,200 | 0.03 | 23,200 | 200,600 | 0.03 | 5,000 | |||||||||||||||||||||||||||
| TOTAL INDONESIA | 35,600 | 0.03 | 1,200 | 901,300 | 0.03 | 26,200 | 936,900 | 0.03 | 27,400 | 214,400 | 0.02 | 5,300 | |||||||||||||||||||||||||||
| TOTAL NEWMONT WORLDWIDE | 38,000 | 0.05 | 1,900 | 1,054,500 | 0.04 | 45,000 | 1,092,500 | 0.04 | 46,900 | 359,200 | 0.05 | 18,600 | |||||||||||||||||||||||||||
|
(1) Resources are reported exclusive of reserves. (2) Resources are calculated at a silver price of $25.00 per ounce unless otherwise noted. 2013 Resources were calculated at a silver price of $25.00 per ounce unless otherwise noted. Tonnage amounts have been rounded to the nearest 100,000. (3) Measured and Indicated Resources (combined) are equivalent to Mineralized Material disclosed in Newmont’s Form 10-K filing. (4) Stockpiles are comprised primarily of material that has been set aside to allow processing of higher grade material in the mills. Stockpiles increase or decrease depending on current mine plans. (5) Percentage reflects Newmont’s economic interest as of December 31, 2014. (6) Project is undeveloped. |
|||||||||||||||||||||||||||||||||||||||
| Attributable Silver Mineral Resources(1)(2) Metric Units | |||||||||||||||||||||||||||||||||||||||
| December 31, 2014 | |||||||||||||||||||||||||||||||||||||||
| Deposits/Districts | Measured Resources | Indicated Resources |
Measured + Indicated Resources(3) |
Inferred Resources | |||||||||||||||||||||||||||||||||||
|
Newmont |
Tonnage | Grade | Ag | Tonnage | Grade | Ag | Tonnage | Grade | Ag | Tonnage | Grade | Ag | |||||||||||||||||||||||||||
|
(x1000 |
(g/tonne) |
(x1000 |
(x1000 |
(g/tonne) |
(x1000 |
(x1000 |
(g/tonne) |
(x1000 |
(x1000 |
(g/tonne) |
(x1000 |
||||||||||||||||||||||||||||
| North America | |||||||||||||||||||||||||||||||||||||||
| Sandman, Nevada | 100% | - | - | 1,200 | 6.8 | 300 | 1,200 | 6.8 | 300 | 1,000 | 4.1 | 100 | |||||||||||||||||||||||||||
| Phoenix, Nevada | 100% | 1,400 | 7.7 | 300 | 43,500 | 7.6 | 10,600 | 44,900 | 7.6 | 10,900 | 36,300 | 8.0 | 9,300 | ||||||||||||||||||||||||||
| Phoenix Stockpiles, Nevada(4) | 100% | - | - | - | - | - | - | 2,100 | 3.1 | 200 | |||||||||||||||||||||||||||||
| TOTAL NORTH AMERICA | 1,400 | 7.7 | 300 | 44,700 | 7.6 | 10,900 | 46,100 | 7.6 | 11,200 | 39,400 | 7.6 | 9,600 | |||||||||||||||||||||||||||
| South America | |||||||||||||||||||||||||||||||||||||||
| Conga, Peru(6) | 51.35% | - | - | 81,000 | 1.6 | 4,200 | 81,000 | 1.6 | 4,200 | 89,900 | 1.1 | 3,300 | |||||||||||||||||||||||||||
| Yanacocha, Peru | 51.35% | 700 | 15.5 | 400 | 13,300 | 8.6 | 3,700 | 14,000 | 8.9 | 4,100 | 2,000 | 6.6 | 400 | ||||||||||||||||||||||||||
| TOTAL SOUTH AMERICA | 700 | 15.5 | 400 | 94,300 | 2.6 | 7,900 | 95,000 | 2.7 | 8,300 | 91,900 | 1.2 | 3,700 | |||||||||||||||||||||||||||
| Indonesia | |||||||||||||||||||||||||||||||||||||||
| Batu Hijau, Indonesia(5) | 48.5% | 32,300 | 1.1 | 1,200 | 101,700 | 0.9 | 3,000 | 134,000 | 1.0 | 4,200 | 12,500 | 0.6 | 300 | ||||||||||||||||||||||||||
| Elang, Indonesia(5)(6) | 48.5% | - | - | 715,900 | 1.0 | 23,200 | 715,900 | 1.0 | 23,200 | 182,000 | 0.9 | 5,000 | |||||||||||||||||||||||||||
| TOTAL INDONESIA | 32,300 | 1.1 | 1,200 | 817,600 | 1.0 | 26,200 | 849,900 | 1.0 | 27,400 | 194,500 | 0.8 | 5,300 | |||||||||||||||||||||||||||
| TOTAL NEWMONT WORLDWIDE | 34,400 | 1.7 | 1,900 | 956,600 | 1.5 | 45,000 | 991,000 | 1.5 | 46,900 | 325,800 | 1.8 | 18,600 | |||||||||||||||||||||||||||
|
See Footnotes under Silver Resources U.S. units table. |
|||||||||||||||||||||||||||||||||||||||
Cautionary Statement regarding Reserves and Resources:
The “reserves” disclosed in this release have been prepared in compliance with Industry Guide 7 published by the SEC. As used in this news release, the term “reserve” means that part of a mineral deposit that can be economically and legally extracted or produced at the time of the reserve determination. The term “economically,” as used in this definition, means that profitable extraction or production has been established or analytically demonstrated in a feasibility study to be viable and justifiable under reasonable investment and market assumptions. The term “legally,” as used in this definition, does not imply that all permits needed for mining and processing have been obtained or that other legal issues have been completely resolved. However, for a reserve to exist, Newmont must have a justifiable expectation, based on applicable laws and regulations, that issuance of permits or resolution of legal issues necessary for mining and processing at a particular deposit will be accomplished in the ordinary course and in a timeframe consistent with Newmont’s current mine plans. Reserves in this news release are aggregated from the Proven and Probable classes.
The terms “resources” and “Measured, Indicated and Inferred resources” are used in this news release. Investors are advised that the SEC does not recognize these terms. Newmont has determined that such “resources” would be substantively the same as those prepared using the Guidelines established by the Society of Mining, Metallurgy and Exploration (SME) and defined as “Mineral Resource”. Estimates of resources are subject to further exploration and development, are subject to additional risks, and no assurance can be given that they will eventually convert to future reserves. Inferred Resources, in particular, have a great amount of uncertainty as to their existence and their economic and legal feasibility. Investors are cautioned not to assume that any part or all of the Inferred Resource exists, or is economically or legally mineable. Also, disclosure of contained ounces is permitted under the SME Guideline and other regulatory guidelines, such as Canada’s NI 43-101 and Australia’s JORC. However, the SEC generally requires mineral resource information in SEC-filed documents to be reported only as in-place tonnage and grade. Investors are reminded that even if significant mineralization is discovered and converted to reserves, during the time necessary to ultimately move such mineralization to production the economic feasibility of production may change. See the Company’s Annual Report for the “Proven and Probable Reserve” and “Mineralized Material” tables prepared in compliance with the SEC’s Industry Guide 7, available at http://www.newmont.com/our-investors/financial-reporting/sec-filings and on www.sec.gov. Investors are reminded that the tables presented in the Annual Report are estimates as of December 31, 2014 and were presented on an attributable basis reflecting the Company’s ownership interest at such time.
Cautionary Statement Regarding Forward Looking Statements:
This release contains “forward-looking statements” within the meaning of Section 27A of the Securities Act of 1933, as amended, and Section 21E of the Securities Exchange Act of 1934, as amended, which are intended to be covered by the safe harbor created by such sections and other applicable laws. Such forward-looking statements may include, without limitation, estimates and expectations of future exploration expenditures and activities. Where the Company expresses or implies an expectation or belief as to future events or results, such expectation or belief is expressed in good faith and believed to have a reasonable basis. However, such statements are subject to risks, uncertainties and other factors, which could cause actual results to differ materially from future results expressed or implied by the “forward-looking statements”. For a discussion of such risks relating to our business and other factors, see the Company’s Form 10-K, filed on February 19, 2015, with the Securities and Exchange Commission under the headings “Risk Factors” and “Forward-Looking Statements.” The Company does not undertake any obligation to release publicly revisions to any “forward-looking statement,” including, without limitation, outlook, to reflect events or circumstances after the date of this news release, or to reflect the occurrence of unanticipated events, except as may be required under applicable securities laws. Investors should not assume that any lack of update to a previously issued “forward-looking statement” constitutes a reaffirmation of that statement. Continued reliance on “forward-looking statements” is at investors' own risk.
CONTACT:
Newmont Mining Corporation
Investor Contacts
Meredith
Bandy, 303-837-5143
meredith.bandy@newmont.com
or
Matt
Eichmann, 303-837-5287
matt.eichmann@newmont.com
or
Media
Contact:
Omar Jabara, 303-837-5114
omar.jabara@newmont.com