Attached files
| file | filename |
|---|---|
| EXCEL - IDEA: XBRL DOCUMENT - FIRST FINANCIAL BANKSHARES INC | Financial_Report.xls |
| EX-31.2 - EX-31.2 - FIRST FINANCIAL BANKSHARES INC | d857917dex312.htm |
| EX-21.1 - EX-21.1 - FIRST FINANCIAL BANKSHARES INC | d857917dex211.htm |
| EX-23.1 - EX-23.1 - FIRST FINANCIAL BANKSHARES INC | d857917dex231.htm |
| EX-32.1 - EX-32.1 - FIRST FINANCIAL BANKSHARES INC | d857917dex321.htm |
| EX-31.1 - EX-31.1 - FIRST FINANCIAL BANKSHARES INC | d857917dex311.htm |
| EX-32.2 - EX-32.2 - FIRST FINANCIAL BANKSHARES INC | d857917dex322.htm |
Table of Contents
UNITED STATES
SECURITIES AND EXCHANGE COMMISSION
Washington, D.C. 20549
FORM 10-K
| x | ANNUAL REPORT PURSUANT TO SECTION 13 OR 15(d) OF THE SECURITIES EXCHANGE ACT OF 1934 |
For the fiscal year ended December 31, 2014
Commission file number 0-7674
First Financial Bankshares, Inc.
(Exact Name of Registrant as Specified in Its Charter)
| Texas | 75-0944023 | |
| (State or Other Jurisdiction of Incorporation or Organization) |
(I.R.S. Employer Identification No.) |
| 400 Pine Street, Abilene, Texas | 79601 | |
| (Address of Principal Executive Offices) | (Zip Code) |
Registrant’s telephone number, including area code: (325) 627-7155
Securities registered pursuant to Section 12(b) of the Act:
| Title of Class |
Name of Exchange on Which Registered | |
| Common Stock, par value $0.01 per share | Nasdaq Global Select Market |
Securities registered pursuant to Section 12(g) of the Act:
None
Indicate by check mark if the registrant is a well-known seasoned issuer, as defined in Rule 405 of the Securities Act. Yes x No ¨
Indicate by check mark if the registrant is not required to file reports pursuant to Section 13 or Section 15(d) of the Act. Yes ¨ No x
Indicate by check mark whether the registrant (1) has filed all reports required to be filed by Section 13 or 15(d) of the Securities Exchange Act of 1934 during the preceding 12 months (or for such shorter period that the registrant was required to file such reports), and (2) has been subject to such filing requirements for the past 90 days. Yes x No ¨
Indicate by check mark whether the registrant has submitted electronically and posted on its corporate Website, if any, every Interactive Data File required to be submitted and posted pursuant to Rule 405 of Regulation S-T during the preceding 12 months (or for such shorter period that the registrant was required to submit and post such files). Yes x No ¨
Indicate by check mark if disclosure of delinquent filers pursuant to Item 405 of Regulation S-K is not contained herein, and will not be contained, to the best of registrant’s knowledge, in definitive proxy or information statements incorporated by reference in Part III of this Form 10-K or any amendment to this Form 10-K. ¨
Indicate by check mark whether the registrant is a large accelerated filer, an accelerated filer, a non-accelerated filer, or a smaller reporting company.
| Large accelerated filer | x | Accelerated filer | ¨ | |||
| Non-accelerated filer | ¨ | Smaller reporting company | ¨ | |||
Indicate by check mark whether the registrant is a shell company (as defined in Rule 12b-2 of the Act). Yes ¨ No x
As of June 30, 2014, the last business day of the registrant’s most recently completed second fiscal quarter, the aggregate market value of the registrant’s voting and non-voting common stock held by non-affiliates was $1.92 billion.
As of February 20, 2015, there were 64,128,797 shares of common stock outstanding.
Documents Incorporated by Reference
Certain information called for by Part III is incorporated by reference to the proxy statement for our 2015 annual meeting of shareholders, which will be filed with the Securities and Exchange Commission not later than 120 days after December 31, 2014.
Table of Contents
| Page | ||||||||
| 1 | ||||||||
| PART I | ||||||||
| ITEM 1. | 2 | |||||||
| ITEM 1A. | 18 | |||||||
| ITEM 1B. | 29 | |||||||
| ITEM 2. | 29 | |||||||
| ITEM 3. | 29 | |||||||
| ITEM 4. | 29 | |||||||
| PART II | ||||||||
| ITEM 5. | 30 | |||||||
| ITEM 6. | 32 | |||||||
| ITEM 7. | Management’s Discussion and Analysis of Financial Condition and Results of Operations |
33 | ||||||
| ITEM 7A. | 48 | |||||||
| ITEM 8. | 48 | |||||||
| ITEM 9. | Changes in and Disagreements with Accountants on Accounting and Financial Disclosure |
50 | ||||||
| ITEM 9A. | 50 | |||||||
| ITEM 9B. | 52 | |||||||
| PART III | ||||||||
| ITEM 10. | 53 | |||||||
| ITEM 11. | 53 | |||||||
| ITEM 12. | Security Ownership of Certain Beneficial Owners and Management and Related Stockholder Matters |
53 | ||||||
| ITEM 13. | Certain Relationships and Related Transactions, and Director Independence |
53 | ||||||
| ITEM 14. | 53 | |||||||
| PART IV | ||||||||
| ITEM 15. | 54 | |||||||
| SIGNATURES | 55 | |||||||
| EXHIBITS INDEX | 57 | |||||||
i
Table of Contents
CAUTIONARY STATEMENT REGARDING
FORWARD-LOOKING STATEMENTS
This Form 10-K contains certain forward-looking statements within the meaning of Section 27A of the Securities Act of 1933 and Section 21E of the Securities Exchange Act of 1934. When used in this Form 10-K, words such as “anticipate,” “believe,” “estimate,” “expect,” “intend,” “predict,” “project,” and similar expressions, as they relate to us or our management, identify forward-looking statements. These forward-looking statements are based on information currently available to our management. Actual results could differ materially from those contemplated by the forward-looking statements as a result of certain factors, including, but not limited, to those listed in “Item 1A-Risk Factors” and the following:
| • | general economic conditions, including our local, state and national real estate markets and employment trends; |
| • | volatility and disruption in national and international financial markets; |
| • | government intervention in the U. S. financial system including the effects of recent legislative, tax, accounting and regulatory actions and reforms, including the Dodd-Frank Wall Street Reform and Consumer Protection Act (the “Dodd-Frank Act”), the Jumpstart Our Business Startups Act, the Consumer Financial Protection Bureau and the capital ratios of Basel III as adopted by the federal banking authorities; |
| • | political instability; |
| • | the ability of the federal government to address the national economy and the fiscal cliff; |
| • | competition from other financial institutions and financial holding companies; |
| • | the effects of and changes in trade, monetary and fiscal policies and laws, including interest rate policies of the Board of Governors of the Federal Reserve System (“the Federal Reserve Board”); |
| • | changes in the demand for loans; |
| • | fluctuations in the value of collateral securing our loan portfolio and in the level of the allowance for loan losses; |
| • | the accuracy of our estimates of future loan losses; |
| • | the accuracy of our estimates and assumptions regarding the performance of our securities portfolio; |
| • | soundness of other financial institutions with which we have transactions; |
| • | inflation, interest rate, market and monetary fluctuations; |
| • | changes in consumer spending, borrowing and savings habits; |
| • | our ability to attract deposits; |
| • | changes in our liquidity position; |
| • | changes in the reliability of our vendors, internal control system or information systems; |
| • | our ability to attract and retain qualified employees; |
| • | acquisitions and integration of acquired businesses; |
1
Table of Contents
| • | the possible impairment of goodwill associated with our acquisitions; |
| • | consequences of continued bank mergers and acquisitions in our market area, resulting in fewer but much larger and stronger competitors; |
| • | expansion of our operations, including branch openings, new product offerings and expansion into new markets; |
| • | changes in our compensation and benefit plans; and |
| • | acts of God or of war or terrorism. |
Such forward-looking statements reflect the current views of our management with respect to future events and are subject to these and other risks, uncertainties and assumptions relating to our operations, results of operations, growth strategy and liquidity. All subsequent written and oral forward-looking statements attributable to us or persons acting on our behalf are expressly qualified in their entirety by this paragraph. We undertake no obligation to publicly update or otherwise revise any forward-looking statements, whether as a result of new information, future events or otherwise (except as required by law).
PART I
| ITEM 1. | BUSINESS |
General
First Financial Bankshares, Inc., a Texas corporation (the “Company”), is a financial holding company registered under the Bank Holding Company Act of 1956, as amended, or BHCA. As such, we are supervised by the Federal Reserve Board, as well as several other bank regulators. We were formed as a bank holding company in 1956 under the original name F & M Operating Company, but our banking operations date back to 1890, when Farmers and Merchants National Bank opened for business in Abilene, Texas. Up to December 30, 2012, we owned eleven separately chartered banks, a trust company, a technology operating company, and an insurance agency, all organized and located in Texas. Effective December 30, 2012, we consolidated our eleven bank charters into our Abilene bank charter, First Financial Bank, National Association, to reduce certain operating costs and to make our our technology and compliance operations more efficient. In addition, on May 31, 2013, we acquired Orange Savings Bank, SSB and merged Orange Savings Bank, SSB with and into our subsidiary bank. As of December 31, 2014, our subsidiaries are:
| • | First Financial Bank, National Association, Abilene, Texas; |
| • | First Technology Services, Inc., Abilene, Texas; |
| • | First Financial Trust & Asset Management Company, National Association, Abilene, Texas; and |
| • | First Financial Insurance Agency, Inc., Abilene, Texas. |
Through our subsidiaries, we conduct a full-service commercial banking business. Our banking centers are located primarily in Central, North Central, Southeast and West Texas. As of December 31, 2014, we had 62 financial centers across Texas, with eleven locations in Abilene, three locations in San Angelo and Weatherford, two locations in Cleburne, Stephenville, and Granbury, and one location each in Acton, Albany, Aledo, Alvarado, Beaumont, Boyd, Bridgeport, Brock, Burleson, Cisco, Clyde, Decatur, Eastland, Fort Worth, Glen Rose, Grapevine, Hereford, Huntsville, Keller, Lubbock, Mauriceville, Merkel, Midlothian, Mineral Wells, Moran, New Waverly, Newton, Odessa, Orange, Port Arthur, Ranger, Rising Star, Roby, Southlake, Sweetwater, Trent, Trophy Club, Vidor, Waxahachie, and Willow Park, all in Texas.
Even though we operate in a growing number of Texas markets, we continue to believe that decisions are best made at the local level. Although we consolidated our bank charters into one charter, we continue to operate as twelve bank regions (effective May 31, 2013, we added our twelfth region in Orange, Texas) with local advisory
2
Table of Contents
boards of directors, local bank region presidents and local decision-making. We have consolidated many of the backroom operations, such as investment securities, accounting, check processing, technology and employee benefits, which improves our efficiency and frees management of our bank regions to concentrate on serving the banking needs of their local communities. We call this our “one bank, twelve regions” concept.
In the past, we have chosen to keep our Company focused on the State of Texas, one of the nation’s largest, fastest-growing and most economically diverse states. With approximately 26.5 million residents, Texas has more people than any other state except California. The population of Texas grew 20.1% from 2003-2013 according to the U.S. Census Bureau. Many of the communities in which we operate are also experiencing positive growth as shown below:
Population Growth 2003-2013*
These economies include dynamic centers of higher education, agriculture, wind energy and natural resources, retail, military, healthcare, tourism, retirement living, manufacturing and distribution.
We believe our community approach to doing business works best for us in small and mid-size markets, where we can play a prominent role in the economic, civic and cultural life of the community. Our goal is to serve these communities well and to experience growth as these markets continue to expand. In many instances, banking competition is less intense in smaller markets, making it easier for us to operate rationally and attract and retain high-caliber employees who prefer not only our community-banker concept but the high quality of life in smaller cities.
Over the years, we have grown in three ways: by growing internally, by opening new branch locations and by acquiring other banks. Since 1997, we have completed twelve bank acquisitions and have increased our total assets from $1.57 billion to $5.85 billion. We have also established a trust and asset management company and a technology services company, both of which operate as subsidiaries of First Financial Bankshares, Inc. Looking ahead, we intend to continue to grow organically by better serving the needs of our customers and putting them first in all of our decisions. We continually look for new branch locations, so we can provide more convenient service to our customers, and we are actively pursuing acquisition opportunities by calling on banks that we are interested in possibly acquiring.
When targeting a bank for acquisition, the subject bank generally needs to be located in the type of community that fits our profile, which is well managed and profitable. We like growing communities with good amenities – schools, infrastructure, commerce and lifestyle. We prefer non-metropolitan markets, either around Dallas/Fort Worth, Houston, San Antonio or Austin or along the Interstate 35, 45, 10 and 20 corridors in Texas. We might also consider the acquisition of banks in East Texas or the Texas Hill Country area. Banks between $100 million and $1.0 billion in asset size fit our “sweet spot” for acquisition, but we will consider banks that are larger or smaller, or that are in other areas of Texas if we believe they would be a good fit for our Company.
Information on our revenues, profits and losses and total assets appears in “Management’s Discussion and Analysis of Financial Condition and Results of Operations” contained in Item 7 hereof.
First Financial Bankshares, Inc.
We provide management, technical resources and policy direction to our subsidiaries, which enable them to improve or expand their services while continuing their local activity and identity. Each of our subsidiaries operates under the day-to-day management of its own board of directors and officers, including advisory boards of directors for our bank regions. We provide resources and policy direction in, among other things, the following areas:
| • | asset and liability management; |
| • | investments; |
3
Table of Contents
| • | accounting; |
| • | budgeting; |
| • | training; |
| • | marketing; |
| • | planning; |
| • | risk management; |
| • | loan review; |
| • | human resources; |
| • | insurance; |
| • | capitalization; |
| • | regulatory compliance; and |
| • | internal audit. |
In particular, we assist our subsidiaries with, among other things, decisions concerning major capital expenditures, employee fringe benefits, including retirement plans and group medical coverage, dividend policies, and appointment of officers and directors, including advisory directors, and their compensation. We also perform, through corporate staff groups or by outsourcing to third parties, internal audits, compliance oversight and loan reviews of our subsidiaries. We provide advice and specialized services for our bank regions related to lending, investing, purchasing, advertising, public relations, and computer services.
We evaluate various potential financial institution acquisition opportunities and approve potential locations for new branch offices. We anticipate that funding for any acquisitions or expansions would be provided from our existing cash balances, available dividends from our subsidiaries, utilization of available lines of credit and future debt or equity offerings.
Services Offered by Our Subsidiaries
Our subsidiary bank is a separate legal entity that operates under the day-to-day management of its board of directors and officers. Our twelve bank regions operating under our subsidiary bank each have separate advisory boards that make recommendations and provide assistance to regional management of the bank regarding the operations of their respective region. Each of our bank regions provides general commercial banking services, which include accepting and holding checking, savings and time deposits, making loans, automated teller machines, drive-in and night deposit services, safe deposit facilities, remote deposit capture, internet banking, mobile banking, payroll cards, transmitting funds, and performing other customary commercial banking services. We also conduct full service trust activities through First Financial Trust & Asset Management Company, National Association, our trust company. Through our trust company, we offer personal trust services, which include the administration of estates, testamentary trusts, revocable and irrevocable trusts and agency accounts. We also administer all types of retirement and employee benefit accounts, which include 401(k) profit sharing plans and IRAs. In addition, we provide securities brokerage services through arrangements with an unrelated third party in our Abilene, San Angelo, Cleburne, Stephenville, Eastland and Weatherford banking regions.
Competition
Commercial banking in Texas is highly competitive, and because we hold less than 1% of the state’s deposits, we represent only a minor segment of the industry. To succeed in this industry, we believe that we must have the capability to compete effectively in the areas of (1) interest rates paid or charged; (2) scope of services offered; and (3) prices charged for such services. Our bank regions compete in their respective service areas against highly competitive banks, thrifts, savings and loan associations, small loan companies, credit unions, mortgage companies, insurance companies, and brokerage firms, all of which are engaged in providing financial products and services and some of which are larger than us in terms of capital, resources and personnel.
4
Table of Contents
Our business does not depend on any single customer or any few customers, and the loss of any one would not have a materially adverse effect upon our business. Although we have a broad base of customers that are not related to us, our customers also occasionally include our officers and directors, as well as other entities with which we are affiliated. Through our bank regions we may make loans to our officers and directors, and entities with which we are affiliated, in the ordinary course of business. We make these loans on substantially the same terms, including interest rates and collateral, as those prevailing at the time for comparable transactions with other persons. Loans to our directors, officers and their affiliates are also subject to numerous restrictions under federal and state banking laws, which we describe in greater detail below, under the heading “Supervision and Regulation – Loans to Directors, Executive Officers and Principal Shareholders.”
Employees
Including all of our subsidiaries, we employed approximately 1,140 full-time equivalent employees at December 31, 2014. Our management believes that our employee relations have been and will continue to be good.
Supervision and Regulation
Both federal and state laws extensively regulate bank holding companies, financial holding companies and banks. These laws (and the regulations promulgated thereunder) are primarily intended to protect depositors and the deposit insurance fund (the “DIF”) of the Federal Deposit Insurance Corporation, or the FDIC. The following information describes particular laws and regulatory provisions relating to financial holding companies and banks. This discussion is qualified in its entirety by reference to the particular laws and regulatory provisions. A change in any of these laws or regulations may have a material effect on our business and the business of our subsidiaries.
Bank Holding Companies and Financial Holding Companies
Historically, the activities of bank holding companies were limited to the business of banking and activities closely related or incidental to banking. Bank holding companies were generally prohibited from acquiring control of any company that was not a bank and from engaging in any business other than the business of banking or managing and controlling banks. The Gramm-Leach-Bliley Act, which took effect on March 12, 2000, dismantled many Depression-era restrictions against affiliations between banking, securities and insurance firms by permitting bank holding companies to engage in a broader range of financial activities, so long as certain safeguards are observed. Specifically, bank holding companies may elect to become “financial holding companies” that may affiliate with securities firms and insurance companies and engage in other activities that are financial in nature or incidental to a financial activity. Thus, with the enactment of the Gramm-Leach-Bliley Act, banks, security firms and insurance companies find it easier to acquire or affiliate with each other and cross-sell financial products. The Gramm-Leach-Bliley Act permits a single financial services organization to offer a more complete array of financial products and services than historically was permitted.
A financial holding company is essentially a bank holding company with significantly expanded powers. Under the Gramm-Leach-Bliley Act, in addition to traditional lending activities, the following activities are among those that are deemed “financial in nature” for financial holding companies: securities underwriting, dealing in or making a market in securities, sponsoring mutual funds and investment companies, insurance underwriting and agency activities, activities which the Federal Reserve Board determines to be closely related to banking, and certain merchant banking activities.
We elected to become a financial holding company in September 2001. As a financial holding company, we have very broad discretion to affiliate with securities firms and insurance companies, make merchant banking investments, and engage in other activities that the Federal Reserve Board has deemed financial in nature. In order to continue as a financial holding company, we must continue to be well-capitalized, well-managed and maintain compliance with the Community Reinvestment Act. Depending on the types of financial activities that we may elect to engage in, under the Gramm-Leach-Bliley Act’s functional regulation principles, we may become subject to supervision by additional government agencies. The election to be treated as a financial holding company increases our ability to offer financial products and services that historically we were either unable to provide or were only able to provide on a limited basis. As a result, we will face increased competition in the markets for any new
5
Table of Contents
financial products and services that we may offer. Likewise, an increased amount of consolidation among banks and securities firms or banks and insurance firms could result in a growing number of large financial institutions that could compete aggressively with us.
Mergers and Acquisitions
We generally must obtain approval from the banking regulators before we can acquire other financial institutions. We may not engage in certain acquisitions if we are undercapitalized. Furthermore, the BHCA provides that the Federal Reserve Board cannot approve any acquisition, merger or consolidation that may substantially lessen competition in the banking industry, create a monopoly in any section of the country, or be a restraint of trade. However, the Federal Reserve Board may approve such a transaction if the convenience and needs of the community clearly outweigh any anti-competitive effects. Specifically, the Federal Reserve Board would consider, among other factors, the expected benefits to the public (greater convenience, increased competition, greater efficiency, etc.) against the risks of possible adverse effects (undue concentration of resources, decreased or unfair competition, conflicts of interest, unsound banking practices, etc.).
Under the BHCA, the Company must obtain the prior approval of the Federal Reserve Board, or acting under delegated authority, the Federal Reserve Bank of Dallas before (1) acquiring direct or indirect ownership or control of any class of voting securities of any bank or bank holding company if, after the acquisition, the Company would directly or indirectly own or control 5% or more of the class; (2) acquiring all or substantially all of the assets of another bank or bank holding company; or (3) merging or consolidating with another bank holding company.
The Change in Bank Control Act of 1978, as amended, or the CIBCA, and the related regulations of the Federal Reserve Board require any person or groups of persons acting in concert (except for companies required to make application under the BHCA), to file a written notice with the Federal Reserve Board before the person or group acquires control of the Company. The CIBCA defines “control” as the direct or indirect power to vote 25% or more of any class of voting securities or to direct the management or policies of a bank holding company or an insured bank. A rebuttable presumption of control arises under the CIBCA where a person or group controls 10% or more, but less than 25%, of a class of the voting stock of a company or insured bank which is a reporting company under the Securities Exchange Act of 1934, as amended, such as the Company, or such ownership interest is greater than the ownership interest held by any other person or group.
Banks
Federal and state laws and regulations that govern banks have the effect of, among other things, regulating the scope of business, investments, cash reserves, the purpose and nature of loans, the maximum interest rate chargeable on loans, the amount of dividends declared, and required capitalization ratios.
National Banking Associations. Banks organized as national banking associations under the National Bank Act are subject to regulation and examination by the Office of the Comptroller of the Currency, or OCC. Effective December 30, 2012, we consolidated our eleven bank charters into one, that being our Abilene charter. As a result, the OCC now supervises, regulates and regularly examines the following subsidiaries:
| • | First Financial Bank, National Association, Abilene, Texas; |
| • | First Financial Trust & Asset Management Company, National Association; and |
| • | First Technology Services, Inc. |
The OCC’s supervision and regulation of banks is primarily intended to protect the interests of depositors. The National Bank Act:
| • | requires each national banking association to maintain reserves against deposits; |
| • | restricts the nature and amount of loans that may be made and the interest that may be charged; and |
| • | restricts investments and other activities. |
6
Table of Contents
State Banks. Banks that are organized as state banks under Texas law are subject to regulation and examination by the Texas Department of Banking (the “Banking Department”). Prior to December 30, 2012, the Banking Department regulated, supervised and regularly examined our two subsidiary state banks, First Financial Bank, Hereford and First Financial Bank, Huntsville. The Banking Department’s supervision and regulation of banks is primarily designed to protect the interests of depositors. Texas law:
| • | restricts the nature and amount of loans that may be made and the interest that may be charged; and |
| • | restricts investments and other activities. |
State banks are also subject to regulation by either the FDIC or the Federal Reserve Board. First Financial Bank, Hereford and First Financial Bank, Huntsville were non-member banks of the Federal Reserve, and as such their federal regulator was the FDIC and were subject to most of the federal laws described below.
Deposit Insurance Coverage and Assessments
Our subsidiary bank is a member of the FDIC. Through the DIF, the FDIC provides deposit insurance protection that covers all deposit accounts in FDIC-insured depository institutions up to applicable limits (currently, $250,000 per depositor).
Our subsidiary bank must pay assessments to the FDIC under a risk-based assessment system for this federal deposit insurance protection. FDIC-insured depository institutions that are members of the Bank Insurance Fund pay insurance premiums at rates based on their risk classification. Institutions assigned to higher risk classifications (i.e., institutions that pose a greater risk of loss to the DIF) pay assessments at higher rates than institutions assigned to lower risk classifications. An institution’s risk classification is assigned based on its capital levels and the level of supervisory concern the institution poses to bank regulators. As of December 31, 2014, the assessment rate for our subsidiary bank was at the lowest risk-based premium available, which was 5.00% of the assessment base per annum.
In addition, the FDIC can impose special assessments to cover shortages in the DIF. The FDIC required insured depository institutions to prepay on December 30, 2009 their estimated quarterly assessments for 2010, 2011 and 2012, including a three basis point increase in premium rates for 2011 and 2012. (The three basis point increase was later cancelled under the Restoration Plan described below.) The Company’s prepayment amount on December 31, 2009 totaled $11.60 million in the aggregate and was expensed based on quarterly assessment calculations. In June 2013, the unused portion of our prepaid assessment totaling $3.72 million was refunded by FDIC to our subsidiary bank.
In October 2010, the FDIC adopted a new Restoration Plan for the DIF to ensure that the fund reserve ratio reaches 1.35% by September 30, 2020, as required by the Dodd-Frank Act. Under the Restoration Plan, the FDIC did not institute the uniform three-basis point increase in assessment rates scheduled to take place on January 1, 2011 and maintained the current schedule of assessment rates for all depository institutions. At least semi-annually, the FDIC will update its loss and income projections for the DIF and, if needed, will increase or decrease assessment rates, following notice-and-comment rulemaking, if required. The Dodd-Frank Act also eliminated the requirement that the FDIC pay dividends to insured depository institutions when the reserve ratio exceeds certain thresholds. The Dodd-Frank Act requires the FDIC to offset the effect of increasing the reserve ratio on institutions with total consolidated assets of less than $10 billion, such as the Company.
As required by the Dodd-Frank Act, the FDIC also revised the deposit insurance assessment system, effective April 1, 2011, to base assessments on the average total consolidated assets of insured depository institutions during the assessment period, less the average tangible equity of the institution during the assessment period as opposed to solely bank deposits at an institution. This base assessment change necessitated that the FDIC adjust the assessment rates to ensure that the revenue collected under the new assessment system will approximately equal that under the existing assessment system.
Under the Financial Institutions Reform, Recovery, and Enforcement Act of 1989, or FIRREA, an FDIC-insured depository institution can be held liable for any losses incurred by the FDIC in connection with (1) the “default” of one of its FDIC-insured subsidiaries or (2) any assistance provided by the FDIC to one of its FDIC-receivers, and “in danger of default” is defined generally as the existence of certain conditions indicating that a default is likely to occur in the absence of regulatory assistance.
7
Table of Contents
The FDIC is also empowered to regulate interest rates paid by insured banks. Approval of the FDIC is also required before an insured bank retires any part of its common or preferred stock, or any capital notes or debentures.
Payment of Dividends
We are a legal entity separate and distinct from our banking and other subsidiaries. We receive most of our revenue from dividends paid to us by our bank and trust company subsidiaries. Described below are some of the laws and regulations that apply when either we or our subsidiaries pay or paid dividends.
The Federal Reserve Board, the OCC and the FDIC have issued policy statements that recommend that bank holding companies and insured banks should generally only pay dividends to the extent net income is sufficient to cover both cash dividends and a rate of earnings retention consistent with capital needs, asset quality and overall financial condition. Further, the Federal Reserve Board’s policy provides that bank holding companies should not maintain a level of cash dividends that undermines the bank holding company’s ability to serve as a source of strength to its banking subsidiaries. In addition, the Federal Reserve Board has indicated that each bank holding company should carefully review its dividend policy, and has discouraged payment ratios that are at maximum allowable levels, which is the maximum dividend amount that may be issued and allow the company to still maintain its target Tier 1 capital ratio, unless both asset quality and capital are very strong.
To pay dividends, our subsidiaries must maintain adequate capital above regulatory guidelines. Under federal law, our subsidiary bank cannot pay a dividend if, after paying the dividend, the bank would be “undercapitalized.” In addition, if the FDIC believes that a bank under its jurisdiction is engaged in, or is about to engage in, an unsafe or unsound practice (which, depending on the financial condition of the bank, could include the payment of dividends), the FDIC may require, after notice and hearing, that such bank cease and desist from the unsafe practice. The FDIC and the OCC have each indicated paying dividends that deplete a bank’s capital base to an inadequate level would be an unsafe and unsound banking practice.
National banks are required by federal law to obtain the prior approval of the OCC in order to declare and pay dividends if the total of all dividends declared in any calendar year would exceed the total of (1) such bank’s net profits (as defined and interpreted by regulation) for that year plus (2) its retained net profits (as defined and interpreted by regulation) for the preceding two calendar years, less any required transfers to surplus. In addition, these banks may only pay dividends to the extent that retained net profits (including the portion transferred to surplus) exceed bad debts (as defined by regulation). Prior to December 30, 2012, First Financial Bank, Hereford and First Financial Bank, Huntsville, as Texas state banking associations, could not pay a dividend that would reduce its capital and surplus without the prior approval of the Banking Department.
Our subsidiaries paid aggregate dividends of approximately $34.00 million in 2014 and approximately $64.20 million in 2013. Under the dividend restrictions discussed above, as of December 31, 2014, our subsidiaries could have declared in the aggregate additional dividends of approximately $93.16 million from retained net profits, without obtaining regulatory approvals.
Affiliate Transactions
The Federal Reserve Act, the FDIA and the rules adopted under these statutes restrict the extent to which we can borrow or otherwise obtain credit from, or engage in certain other transactions with, our subsidiaries. These laws regulate “covered transactions” between insured depository institutions and their subsidiaries, on the one hand, and their nondepository affiliates, on the other hand. The Dodd-Frank Act expanded the definition of affiliate to make any investment fund, including a mutual fund, for which a depository institution or its affiliates serve as investment advisor an affiliate of the depository institution. “Covered transactions” include a loan or extension of credit to a nondepository affiliate, a purchase of securities issued by such an affiliate, a purchase of assets from such an affiliate (unless otherwise exempted by the Federal Reserve Board), an acceptance of securities issued by such an affiliate as collateral for a loan, and an issuance of a guarantee, acceptance, or letter of credit for the benefit of such an affiliate. The Dodd-Frank Act extended the limitations to derivative transactions, repurchase agreements and
8
Table of Contents
securities lending and borrowing transactions that create credit exposure to an affiliate or an insider. The “covered transactions” that an insured depository institution and its subsidiaries are permitted to engage in with their nondepository affiliates are limited to the following amounts: (1) in the case of any one such affiliate, the aggregate amount of “covered transactions” cannot exceed ten percent of the capital stock and the surplus of the insured depository institution; and (2) in the case of all affiliates, the aggregate amount of “covered transactions” cannot exceed twenty percent of the capital stock and surplus of the insured depository institution. In addition, extensions of credit that constitute “covered transactions” must be collateralized in prescribed amounts. Further, a bank holding company and its subsidiaries are prohibited from engaging in certain tie-in arrangements in connection with any extension of credit, lease or sale of property or furnishing of services. Finally, when we and our subsidiaries conduct transactions internally among us, we are required to do so at arm’s length.
Loans to Directors, Executive Officers and Principal Shareholders
The authority of our subsidiary bank to extend credit to our directors, executive officers and principal shareholders, including their immediate family members, corporations and other entities that they control, is subject to substantial restrictions and requirements under Sections 22(g) and 22(h) of the Federal Reserve Act and Regulation O promulgated thereunder, as well as the Sarbanes-Oxley Act of 2002. These statutes and regulations impose specific limits on the amount of loans our subsidiary bank may make to directors and other insiders, and specified approval procedures must be followed in making loans that exceed certain amounts. In addition, all loans our subsidiary bank makes to directors and other insiders must satisfy the following requirements:
| • | the loans must be made on substantially the same terms, including interest rates and collateral, as those prevailing at the time for comparable transactions with persons not affiliated with us or our subsidiary bank; |
| • | the subsidiary bank must follow credit underwriting procedures at least as stringent as those applicable to comparable transactions with persons who are not affiliated with us or our subsidiary bank; and |
| • | the loans must not involve a greater than normal risk of non-payment or include other features not favorable to our subsidiary bank. |
Furthermore, our subsidiary bank must periodically report all loans made to directors and other insiders to the bank regulators, and these loans are closely scrutinized by the regulators for compliance with Sections 22(g) and 22(h) of the Federal Reserve Act and Regulation O. Each loan to directors or other insiders must be pre-approved by the bank’s board of directors with the interested director abstaining from voting.
Capital
Bank Holding Companies and Financial Holding Companies. The Federal Reserve Board has adopted risk-based capital guidelines for bank holding companies and financial holding companies. Under these guidelines, specific categories of assets are assigned different risk weights, based generally on the perceived risk of the asset. These risk weights are multiplied by corresponding asset balances to determine a “risk-weighted” asset base. The ratio of total capital to risk weighted assets (including certain off-balance-sheet activities, such as standby letters of credit) must be a minimum of eight percent. At least half of the total capital is to be composed of common shareholders’ equity, minority interests in the equity accounts of consolidated subsidiaries and a limited amount of perpetual preferred stock, less goodwill, which is collectively referred to as Tier 1 Capital. The remainder of total capital may consist of subordinated debt, other preferred stock and a limited amount of loan loss reserves. These guidelines will change over the next several years as the new Basel III rules are implemented. See “New Capital Adequacy Requirements under Basel III” below.
In addition, the Federal Reserve Board has established minimum leverage ratio guidelines for bank holding companies and financial holding companies. Bank holding companies and financial holding companies that meet certain specified criteria, including having the highest regulatory rating, must maintain a minimum Tier 1 Capital leverage ratio (Tier 1 Capital to average assets for the current quarter, less goodwill) of three percent. Bank holding companies and financial holding companies that do not have the highest regulatory rating will generally be required to maintain a higher Tier 1 Capital leverage ratio of three percent plus an additional cushion of 100 to 200 basis
9
Table of Contents
points. The guidelines also provide that bank holding companies and financial holding companies experiencing internal growth or making acquisitions will be expected to maintain strong capital positions. Such strong capital positions must be kept substantially above the minimum supervisory levels without significant reliance on intangible assets (e.g., goodwill and core deposit intangibles). As of December 31, 2014, our capital ratios were as follows: (1) Tier 1 Capital to Risk-Weighted Assets Ratio, 16.05%; (2) Total Capital to Risk-Weighted Assets Ratio, 17.16%; and (3) Tier 1 Capital Leverage Ratio, 9.89%.
Banks. The Federal Deposit Insurance Corporation Improvement Act of 1991, or FDICIA, established five capital tiers with respect to depository institutions: “well-capitalized,” “adequately capitalized,” “undercapitalized,” “significantly undercapitalized,” and “critically undercapitalized.” A depository institution’s capital tier will depend upon where its capital levels are in relation to various relevant capital measures, including (1) risk-based capital measures, (2) a leverage ratio capital measure and (3) certain other factors. Regulations establishing the specific capital tiers provide that a “well-capitalized” institution will have a total risk-based capital ratio of ten percent or greater, a Tier 1 risk-based capital ratio of six percent or greater, and a Tier 1 leverage ratio of five percent or greater, and not be subject to any written regulatory enforcement agreement, order, capital directive or prompt corrective action derivative. For an institution to be “adequately capitalized,” it will have a total risk-based capital ratio of eight percent or greater, a Tier 1 risk-based capital ratio of four percent or greater, and a Tier 1 leverage ratio of four percent or greater (in some cases three percent). For an institution to be “undercapitalized,” it will have a total risk-based capital ratio that is less than eight percent, a Tier 1 risk-based capital ratio less than four percent or a Tier 1 leverage ratio less than four percent (or a leverage ratio less than three percent if the institution’s composite rating is 1 in its most recent report of examination, subject to appropriate federal banking agency guidelines). For an institution to be “significantly undercapitalized,” it will have a total risk-based capital ratio less than six percent, a Tier 1 risk-based capital ratio less than three percent, or a Tier 1 leverage ratio less than three percent. For an institution to be “critically undercapitalized,” it will have a ratio of tangible equity to total assets equal to or less than two percent. FDICIA requires federal banking agencies to take “prompt corrective action” against depository institutions that do not meet minimum capital requirements. The various regulatory agencies, including the OCC, have adopted substantially similar regulations that define the five categories identified by FDICIA, using the total risk-based capital, Tier 1 risk based capital and Tier 1 leverage ratios as relevant capital measures. Under current regulations, our subsidiary bank was “well capitalized” as of December 31, 2014.
The Dodd-Frank Act requires the FDIC to establish minimum leverage and risk-based capital requirements to apply to insured depository institutions. The Dodd-Frank Act additionally requires capital requirements to be countercyclical so that the required amount of capital increases in times of economic expansion and decreases in times of economic contraction, consistent with safety and soundness practices.
FDICIA generally prohibits a depository institution from making any capital distribution (including payment of a dividend) or paying any management fee to its holding company if the depository institution would thereafter be “undercapitalized.” An “undercapitalized” institution must develop a capital restoration plan and its parent holding company must guarantee that institution’s compliance with such plan. The liability of the parent holding company under any such guarantee is limited to the lesser of five percent of the institution’s assets at the time it became “undercapitalized” or the amount needed to bring the institution into compliance with all capital standards. Furthermore, in the event of the bankruptcy of the parent holding company, such guarantee would take priority over the parent’s general unsecured creditors. If a depository institution fails to submit an acceptable capital restoration plan, it shall be treated as if it is “significantly undercapitalized.” “Significantly undercapitalized” depository institutions may be subject to a number of requirements and restrictions, including orders to sell sufficient voting stock to become “adequately capitalized,” requirements to reduce total assets, and cessation of receipt of deposits from correspondent banks. “Critically undercapitalized” institutions are subject to the appointment of a receiver or conservator. Finally, FDICIA requires the various regulatory agencies to set forth certain standards that do not relate to capital. Such standards relate to the safety and soundness of operations and management and to asset quality and executive compensation, and permit regulatory action against a financial institution that does not meet such standards.
If an insured bank fails to meet its capital guidelines, it may be subject to a variety of other enforcement remedies, including a prohibition on the taking of brokered deposits and the termination of deposit insurance by the FDIC. Bank regulators continue to indicate their desire to raise capital requirements beyond their current levels.
10
Table of Contents
In addition to FDICIA capital standards, Texas-chartered banks must also comply with the capital requirements imposed by the Banking Department. Neither the Texas Finance Code nor its regulations specify any minimum capital-to-assets ratio that must be maintained by a Texas-chartered bank. Instead, the Banking Department determines the appropriate ratio on a bank by bank basis, considering factors such as the nature of a bank’s business, its total revenue, and the bank’s total assets. Prior to December 30, 2012, our two Texas-chartered banks exceeded the minimum ratios applied to them.
New Capital Adequacy Requirements Under Basel III
On July 2, 2013, the Federal Reserve Board, and on July 9, 2013, the FDIC and OCC, adopted a final rule that implements the Basel III changes to the international regulatory capital framework, referred to as the “Basel III Rules.” The Basel III Rules apply to both depository institutions and (subject to certain exceptions not applicable to the Company) their holding companies. Although parts of the Basel III Rules apply only to large, complex financial institutions, substantial portions of the Basel III Rules apply to the Company and our subsidiary bank. The Basel III Rules include requirements contemplated by the Dodd-Frank Act as well as certain standards initially adopted by the Basel Committee on Banking Supervision in December 2010.
The Basel III Rules include new risk-based and leverage capital ratio requirements which refine the definition of what constitutes “capital” for purposes of calculating those ratios. The minimum capital level requirements applicable to the Company and our subsidiary bank under the Basel III Rules are: (i) a new common equity Tier 1 risk-based capital ratio of 4.5%; (ii) a Tier 1 risk-based capital ratio of 6% (increased from 4%); (iii) a total risk-based capital ratio of 8% (unchanged from current rules); and (iv) a Tier 1 leverage ratio of 4% for all institutions. Common equity Tier 1 capital will consist of retained earnings and common stock instruments, subject to certain adjustments.
The Basel III Rules will also establish a “capital conservation buffer” of 2.5% above the new regulatory minimum risk-based capital requirements. The conservation buffer, when added to the capital requirements, will result in the following minimum ratios: (i) a common equity Tier 1 risk-based capital ratio of 7.0%, (ii) a Tier 1 risk-based capital ratio of 8.5%, and (iii) a total risk-based capital ratio of 10.5%. The new capital conservation buffer requirement is to be phased in beginning in January 2016 at 0.625% of risk-weighted assets and will increase by that amount each year until fully implemented in January 2019. An institution would be subject to limitations on certain activities including payment of dividends, share repurchases and discretionary bonuses to executive officers if its capital level is below the buffer amount.
The Basel III Rules also revise the prompt corrective action framework, which is designed to place restrictions on insured depository institutions, including our subsidiary bank, if their capital levels do not meet certain thresholds. These revisions are to be effective January 1, 2015. The prompt corrective action rules will be modified to include a common equity Tier 1 capital component and to increase certain other capital requirements for the various thresholds. For example, under the proposed prompt corrective action rules, insured depository institutions will be required to meet the following capital levels in order to qualify as “well capitalized:” (i) a new common equity Tier 1 risk-based capital ratio of 6.5%; (ii) a Tier 1 risk-based capital ratio of 8% (increased from 6%); (iii) a total risk-based capital ratio of 10% (unchanged from current rules); and (iv) a Tier 1 leverage ratio of 5% (unchanged from current rules).
The Basel III Rules set forth certain changes in the methods of calculating certain risk-weighted assets, which in turn will affect the calculation of risk based ratios. Under the Basel III Rules, higher or more sensitive risk weights would be assigned to various categories of assets, including, certain credit facilities that finance the acquisition, development or construction of real property, certain exposures or credits that are 90 days past due or on nonaccrual, foreign exposures and certain corporate exposures. In addition, the Basel III Rules include (i) alternative standards of credit worthiness consistent with the Dodd-Frank Act; (ii) greater recognition of collateral and guarantees; and (iii) revised capital treatment for derivatives and repo-style transactions.
In addition, the final rule includes certain exemptions to address concerns about the regulatory burden on community banks. For example, banking organizations with less than $15 billion in consolidated assets as of December 31, 2009 are permitted to include in Tier 1 capital trust preferred securities and cumulative perpetual preferred stock issued and included in Tier 1 capital prior to May 19, 2010 on a permanent basis, without any phase
11
Table of Contents
out. Community banks may also elect on a one time basis in their March 31, 2015 quarterly financial filings with the appropriate federal regulator to opt-out out of the requirement to include most accumulated other comprehensive income (“AOCI”) components in the calculation of CET1 capital and, in effect, retain the AOCI treatment under the current capital rules. Under the Final Capital Rule, the Company may make a one-time, permanent election to continue to exclude accumulated other comprehensive income from capital. If the Company does not make this election, unrealized gains and losses would be included in the calculation of its regulatory capital. The Company expects to make this election in their March 31, 2015 quarterly financial filings. Overall, the rule provides some important concessions for smaller, less complex financial institutions.
The Basel III Rules generally become effective beginning January 1, 2015. The conservation buffer will be phased in beginning in 2016 and will take full effect on January 1, 2019. Certain calculations under the Basel III Rules will also have phase-in periods. The Company must comply with the final Basel III Rules beginning on January 1, 2015.
Our Support of Our Subsidiaries
Under Federal Reserve Board policy, we are expected to commit resources to act as a source of strength to support each of our subsidiaries. The Dodd-Frank Act codified this policy as a statutory requirement. This support may be required at times when, absent such Federal Reserve Board policy, we would not otherwise be required to provide it. In addition, any loans we make to our subsidiaries would be subordinate in right of payment to deposits and to other indebtedness of our subsidiaries. In the event of a bank holding company’s bankruptcy, any commitment by the bank holding company to a federal bank regulatory agency to maintain the capital of a subsidiary bank will be assumed by the bankruptcy trustee and be subject to a priority of payment.
Under the Federal Deposit Insurance Act, in the event of a loss suffered or anticipated by the FDIC (either as a result of the default of a banking subsidiary or related to FDIC assistance provided to a subsidiary in danger of default) our other subsidiaries may be assessed for the FDIC’s loss.
Safe and Sound Banking Practices.
Bank holding companies are not permitted to engage in unsafe and unsound banking practices. The Federal Reserve Board’s Regulation Y, for example, generally requires a holding company to give the Federal Reserve Board prior notice of any redemption or repurchase of its own equity securities, if the consideration to be paid, together with the consideration paid for any repurchases or redemptions in the preceding year, is equal to 10% or more of the bank holding company’s consolidated net worth. The Federal Reserve Board may oppose the transaction if it believes that the transaction would constitute an unsafe or unsound practice or would violate any law or regulation. Depending upon the circumstances, the Federal Reserve Board could take the position that paying a dividend would constitute an unsafe or unsound banking practice.
The Federal Reserve Board has broad authority to prohibit activities of bank holding companies and their nonbanking subsidiaries which represent unsafe and unsound banking practices or which constitute violations of laws or regulations, and can assess civil money penalties for certain activities conducted on a knowing and reckless basis, if those activities caused a substantial loss to a depository institution. The penalties can be as high as $1.0 million for each day the activity continues.
Interstate Banking and Branching
Effective June 1, 1997, the Riegle-Neal Interstate Banking and Branching Efficiency Act of 1994 amended the Federal Deposit Insurance Act and certain other statutes to permit state and national banks with different home states to merge across state lines, with approval of the appropriate federal banking agency, unless the home state of a participating bank had passed legislation prior to May 31, 1997 expressly prohibiting interstate mergers. Under the Riegle-Neal Act amendments, once a state or national bank has established branches in a state, that bank may establish and acquire additional branches at any location in the state at which any bank involved in the interstate merger transaction could have established or acquired branches under applicable federal or state law. If a state opts out of interstate branching within the specified time period, no bank in any other state may establish a branch in the state which has opted out, whether through an acquisition or de novo.
12
Table of Contents
However, under the Dodd-Frank Act, the national branching requirements have been relaxed and national banks and state banks are able to establish branches in any state if that state would permit the establishment of the branch by a state bank chartered in that state.
The Federal Deposit Insurance Act, or FDIA, requires that the FDIC review (1) any merger or consolidation by or with an insured bank, or (2) any establishment of branches by an insured bank. Additionally, the Banking Department accepts applications for interstate merger and branching transactions, subject to certain limitations on ages of the banks to be acquired and the total amount of deposits within the state a bank or financial holding company may control. Since our primary service area is Texas, we do not expect that the ability to operate in other states will have any material impact on our growth strategy. We may, however, face increased competition from out-of-state banks that branch or make acquisitions in our primary markets in Texas.
Community Reinvestment Act of 1977
The Community Reinvestment Act of 1977, or CRA, subjects a bank to regulatory assessment to determine if the institution meets the credit needs of its entire community, including low- and moderate-income neighborhoods served by the bank, and to take that determination into account in its evaluation of any application made by such bank for, among other things, approval of the acquisition or establishment of a branch or other depository facility, an office relocation, a merger, or the acquisition of shares of capital stock of another financial institution. The regulatory authority prepares a written evaluation of an institution’s record of meeting the credit needs of its entire community and assigns a rating. These ratings are “Outstanding,” “Satisfactory,” “Needs Improvement” and “Substantial Non-Compliance.” Institutions with ratings lower than “Satisfactory” may be restricted from engaging in the aforementioned activities. We believe our subsidiary bank has taken and takes significant actions to comply with the CRA, and received a “satisfactory” rating in its most recent review by federal regulators with respect to its compliance with the CRA.
Monitoring and Reporting Suspicious Activity
Under the Bank Secrecy Act, or BSA, we are required to monitor and report unusual or suspicious account activity that might signify money laundering, tax evasion or other criminal activities, as well as transactions involving the transfer or withdrawal of amounts in excess of prescribed limits. The BSA is sometimes referred to as an “anti-money laundering” law (“AML”). Several AML acts, including provisions in Title III of the USA PATRIOT Act of 2001, have been enacted up to the present to amend the BSA. Under the USA PATRIOT Act, financial institutions are subject to prohibitions against specified financial transactions and account relationships as well as enhanced due diligence and “know your customer” standards in their dealings with financial institutions and foreign customers. For example, the enhanced due diligence policies, procedures and controls generally require financial institutions to take reasonable steps:
| • | to conduct enhanced scrutiny of account relationships to guard against money laundering and report any suspicious transaction; |
| • | to ascertain the identity of the nominal and beneficial owners of, and the source of funds deposited into, each account as needed to guard against money laundering and report any suspicious transactions; |
| • | to ascertain for any foreign bank, the shares of which are not publicly traded, the identity of the owners of the foreign bank, and the nature and extent of the ownership interest of each such owner; and |
| • | to ascertain whether any foreign bank provides correspondent accounts to other foreign banks and, if so, the identity of those foreign banks and related due diligence information. |
Under the USA PATRIOT Act, financial institutions are also required to establish anti-money laundering programs. The USA PATRIOT Act sets forth minimum standards for these programs, including:
| • | the development of internal policies, procedures, and controls; |
13
Table of Contents
| • | the designation of a compliance officer; |
| • | an ongoing employee training program; and |
| • | an independent audit function to test the programs. |
In addition, under the USA PATRIOT Act, the Secretary of the U.S. Department of the Treasury, or Treasury, has adopted rules addressing a number of related issues, including increasing the cooperation and information sharing between financial institutions, regulators, and law enforcement authorities regarding individuals, entities and organizations engaged in, or reasonably suspected based on credible evidence of engaging in, terrorist acts or money laundering activities. Any financial institution complying with these rules will not be deemed to violate the privacy provisions of the Gramm-Leach-Bliley Act that are discussed below. Finally, under the regulations of the Office of Foreign Asset Control, or OFAC, we are required to monitor and block transactions with certain “specially designated nationals” who OFAC has determined pose a risk to U.S. national security.
Incentive Compensation
In June 2010, the Federal Reserve Board, OCC and FDIC issued comprehensive final guidance on incentive compensation policies intended to ensure that the incentive compensation policies of banking organizations do not undermine the safety and soundness of such organizations by encouraging excessive risk-taking. The guidance, which covers all employees that have the ability to materially affect the risk profile of an organization, either individually or as part of a group, is based upon the key principles that a banking organization’s incentive compensation arrangements should (i) provide incentives that do not encourage risk-taking beyond the organization’s ability to effectively identify and manage risks, (ii) be compatible with effective internal controls and risk management, and (iii) be supported by strong corporate governance, including active and effective oversight by the organization’s board of directors.
The Federal Reserve Board will review, as part of the regular, risk-focused examination process, the incentive compensation arrangements of banking organizations, such as the Company, that are not “large, complex banking organizations.” These reviews will be tailored to each organization based on the scope and complexity of the organization’s activities and the prevalence of incentive compensation arrangements. The findings of the supervisory initiatives will be included in reports of examination. Deficiencies will be incorporated into the organization’s supervisory ratings, which can affect the organization’s ability to make acquisitions and take other actions. Enforcement actions may be taken against a banking organization if its incentive compensation arrangements, or related risk-management control or governance processes, pose a risk to the organization’s safety and soundness and the organization is not taking prompt and effective measures to correct the deficiencies.
In addition, Section 956 of the Dodd-Frank Act required certain regulators (including the FDIC, SEC and Federal Reserve Board) to adopt requirements or guidelines prohibiting excessive compensation. On April 14, 2011, these regulators published a joint proposed rulemaking to implement Section 956 of the Dodd-Frank Act for depository institutions, their holding companies and various other financial institutions with $1 billion or more in assets. The proposed rule would (i) prohibit incentive-based compensation arrangements for covered persons that would encourage inappropriate risks by providing excess compensation; (ii) prohibit incentive-based compensation arrangements for covered persons that would expose the institution to inappropriate risks by providing compensation that could lead to a material financial loss; (iii) require policies and procedures for incentive-based compensation arrangements that are commensurate with the size and complexity of the institutions; and (iv) require annual reports on incentive compensation structures to the institution’s appropriate federal regulator. The comment period to the proposed rule ended on March 31, 2011. As of the date of this document, the final rule has not yet been published by these regulators.
In addition, the Dodd-Frank Act requires publicly traded companies to give stockholders a non-binding vote on executive compensation at their first annual meeting taking place six months after the date of enactment and at least every three years thereafter and on so-called “golden parachute” payments in connection with approvals of mergers and acquisitions unless previously voted on by shareholders. The new legislation also authorizes the Securities and Exchange Commission (“SEC”) to promulgate rules that would allow stockholders to nominate their own candidates
14
Table of Contents
using a company’s proxy materials. Additionally, the Dodd-Frank Act directs the federal banking regulators to promulgate rules prohibiting excessive compensation paid to executives of depository institutions and their holding companies with assets in excess of $1.0 billion, regardless of whether the company is publicly traded or not. The Dodd-Frank Act gives the SEC authority to prohibit broker discretionary voting on elections of directors and executive compensation matters.
Consumer Laws and Regulations
We are also subject to certain consumer laws and regulations that are designed to protect consumers in transactions with banks. While the following list is not exhaustive, these laws and regulations include the Truth in Lending Act, the Truth in Savings Act, the Electronic Funds Transfer Act, the Expedited Funds Availability Act, the Equal Credit Opportunity Act, The Fair and Accurate Credit Transactions Act, The Real Estate Settlement Procedures Act and the Fair Housing Act, among others. These laws and regulations, among other things, prohibit discrimination on the basis of race, gender or other designated characteristics and mandate various disclosure requirements and regulate the manner in which financial institutions must deal with customers when taking deposits or making loans to such customers. These and other laws also limit finance charges or other fees or charges earned in our activities. We must comply with the applicable provisions of these consumer protection laws and regulations as part of our ongoing customer relations.
Consumer Financial Protection Bureau
The Dodd-Frank Act creates a new, independent federal agency called the Consumer Financial Protection Bureau (“CFPB”), which is granted broad rulemaking, supervisory and enforcement powers under various federal consumer financial protection laws, including the Equal Credit Opportunity Act, Truth in Lending Act, Real Estate Settlement Procedures Act, Fair Credit Reporting Act, Fair Debt Collection Act, the Consumer Financial Privacy provisions of the Gramm-Leach-Bliley Act and certain other statutes. The CFPB has examination and primary enforcement authority with respect to depository institutions with $10 billion or more in assets. Smaller institutions are subject to rules promulgated by the CFPB but continue to be examined and supervised by federal banking regulators for consumer compliance purposes. The CFPB has authority to prevent unfair, deceptive or abusive practices in connection with the offering of consumer financial products. The Dodd-Frank Act permits states to adopt consumer protection laws and standards that are more stringent than those adopted at the federal level and, in certain circumstances, permits the state attorney general to enforce compliance with both the state and federal laws and regulations.
The CFPB has already finalized rules relating to, among other things, remittance transfers under the Electronic Fund Transfer Act, which requires companies to provide consumers with certain disclosures before the consumer pays for a remittance transfer. These new rules became effective in October 2013. The CFPB has also amended certain rules under Regulation C relating to home mortgage disclosure to reflect a change in the asset-size exemption threshold for depository institutions based on the annual percentage change in the Consumer Price Index for Urban Wage Earners and Clerical Workers. In addition, on January 10, 2013, the CFPB released its final “Ability-to-Repay/Qualified Mortgage” rules, which amend the Truth in Lending Act (Regulation Z). Regulation Z currently prohibits a creditor from making a higher-priced mortgage loan without regard to the consumer’s ability to repay the loan. The final rule implements sections 1411 and 1412 of the Dodd-Frank Act, which generally require creditors to make a reasonable, good faith determination of a consumer’s ability to repay any consumer credit transaction secured by a dwelling (excluding an open-end credit plan, timeshare plan, reverse mortgage, or temporary loan) and establishes certain protections from liability under this requirement for “qualified mortgages.” The final rule also implements section 1414 of the Dodd-Frank Act, which limits prepayment penalties. Finally, the final rule requires creditors to retain evidence of compliance with the rule for three years after a covered loan is consummated. This rule became effective January 10, 2014.
Technology Risk Management and Consumer Privacy
State and federal banking regulators have issued various policy statements emphasizing the importance of technology risk management and supervision in evaluating the safety and soundness of depository institutions with respect to banks that contract with outside vendors to provide data processing and core banking functions. The use of technology-related products, services, delivery channels and processes exposes a bank to various risks,
15
Table of Contents
particularly operational, privacy, security, strategic, reputation and compliance risk. Banks are generally expected to prudently manage technology-related risks as part of their comprehensive risk management policies by identifying, measuring, monitoring and controlling risks associated with the use of technology.
Under Section 501 of the Gramm-Leach-Bliley Act, the federal banking agencies have established appropriate standards for financial institutions regarding the implementation of safeguards to ensure the security and confidentiality of customer records and information, protection against any anticipated threats or hazards to the security or integrity of such records and protection against unauthorized access to or use of such records or information in a way that could result in substantial harm or inconvenience to a customer. Among other matters, the rules require each bank to implement a comprehensive written information security program that includes administrative, technical and physical safeguards relating to customer information.
Under the Gramm-Leach-Bliley Act, a financial institution must also provide its customers with a notice of privacy policies and practices. Section 502 prohibits a financial institution from disclosing nonpublic personal information about a customer to nonaffiliated third parties unless the institution satisfies various notice and opt-out requirements and the customer has not elected to opt out of the disclosure. Under Section 504, the agencies are authorized to issue regulations as necessary to implement notice requirements and restrictions on a financial institution’s ability to disclose nonpublic personal information about customers to nonaffiliated third parties. Under the final rule the regulators adopted, all banks must develop initial and annual privacy notices which describe in general terms the bank’s information sharing practices. Banks that share nonpublic personal information about customers with nonaffiliated third parties must also provide customers with an opt-out notice and a reasonable period of time for the customer to opt out of any such disclosure (with certain exceptions). Limitations are placed on the extent to which a bank can disclose an account number or access code for credit card, deposit or transaction accounts to any nonaffiliated third party for use in marketing.
Concentrated Commercial Real Estate Lending Regulations
The federal banking agencies, including the FDIC, have promulgated guidance governing financial institutions with concentrations in commercial real estate lending. The guidance provides that a bank has a concentration in commercial real estate lending if (i) total reported loans for construction, land development, and other land represent 100% or more of total capital or (ii) total reported loans secured by multifamily and non-farm residential properties and loans for construction, land development, and other land represent 300% or more of total capital and the bank’s commercial real estate loan portfolio has increased 50% or more during the prior 36 months. Owner occupied loans are excluded from this second category. If a concentration is present, management must employ heightened risk management practices that address the following key elements: including board and management oversight and strategic planning, portfolio management, development of underwriting standards, risk assessment and monitoring through market analysis and stress testing, and maintenance of increased capital levels as needed to support the level of commercial real estate lending.
UDAP and UDAAP
Recently, banking regulatory agencies have increasingly used a general consumer protection statute to address “unethical” or otherwise “bad” business practices that may not necessarily fall directly under the purview of a specific banking or consumer finance law. The law of choice for enforcement against such business practices has been Section 5 of the Federal Trade Commission Act, referred to as the FTC Act, which is the primary federal law that prohibits unfair or deceptive acts or practices, referred to as UDAP, and unfair methods of competition in or affecting commerce. “Unjustified consumer injury” is the principal focus of the FTC Act. Prior to the Dodd-Frank Act, there was little formal guidance to provide insight to the parameters for compliance with UDAP laws and regulations. However, UDAP laws and regulations have been expanded under the Dodd-Frank Act to apply to “unfair, deceptive or abusive acts or practices,” referred to as UDAAP, which have been delegated to the CFPB for supervision. The CFPB has published its first Supervision and Examination Manual that addresses compliance with and the examination of UDAAP.
16
Table of Contents
Monetary Policy
Banks are affected by the credit policies of monetary authorities, including the Federal Reserve Board, that affect the national supply of credit. The Federal Reserve Board regulates the supply of credit in order to influence general economic conditions, primarily through open market operations in United States government obligations, varying the discount rate on financial institution borrowings, varying reserve requirements against financial institution deposits, and restricting certain borrowings by financial institutions and their subsidiaries. The monetary policies of the Federal Reserve Board have had a significant effect on the operating results of banks in the past and are expected to continue to do so in the future.
Enforcement Powers of Federal Banking Agencies
The Federal Reserve and other state and federal banking agencies and regulators have broad enforcement powers, including the power to terminate deposit insurance, issue cease-and-desist orders, impose substantial fines and other civil and criminal penalties and appoint a conservator or receiver. Our failure to comply with applicable laws, regulations and other regulatory pronouncements could subject us, as well as our officers and directors, to administrative sanctions and potentially substantial civil penalties.
Regulatory Reform and Legislation
From time to time, various legislative and regulatory initiatives are introduced in Congress and state legislatures, as well as by regulatory agencies. Such initiatives may include proposals to expand or contract the powers of bank holding companies and depository institutions or proposals to substantially change the financial institution regulatory system. Such legislation could change banking statutes and the operating environment of the Company in substantial and unpredictable ways. If enacted, such legislation could increase or decrease the cost of doing business, limit or expand permissible activities or affect the competitive balance among banks, savings associations, credit unions, and other financial institutions. The Company cannot predict whether any such legislation will be enacted, and, if enacted, the effect that it, or any implementing regulations, would have on the financial condition or results of operations of the Company. A change in statutes, regulations or regulatory policies applicable to the Company or our subsidiaries could have a material effect on the Company’s business, financial condition and results of operations.
Dodd-Frank Wall Street Reform and Consumer Protection Act
The Dodd-Frank Act, which was enacted in July 2010, effected a fundamental restructuring of federal banking regulation. In addition to those provisions discussed above, among the Dodd-Frank Act provisions that have affected us are the following:
| • | creation of a new Financial Stability Oversight Council to identify systemic risks in the financial system and gives federal regulators new authority to take control of and liquidate financial firms; |
| • | elimination of the federal statutory prohibition against the payment of interest on business checking accounts; |
| • | prohibition on state-chartered banks engaging in derivatives transactions unless the loans to one borrower of the state in which the bank is chartered takes into consideration credit exposure to derivative transactions. For this purpose, derivative transactions include any contract, agreement, swap, warrant, note or option that is based in whole or in part on the value of, any interest in, or any quantitative measure or the occurrence of any event relating to, one or more commodity securities, currencies, interest or other rates, indices or other assets; |
| • | requirement that the amount of any interchange fee charged by a debit card issuer with respect to a debit card transaction must be reasonable and proportional to the cost incurred by the issuer. On June 29, 2011, the Federal Reserve Board set the interchange rate cap at $0.24 per transaction. While the restrictions on interchange fees do not apply to banks that, together with their affiliates, have assets of less than $10 billion, the rule could affect the competitiveness of debit cards issued by smaller banks; and |
| • | restrictions under the Volcker Rule of the Company’s ability to engage in proprietary trading and to invest in, sponsor and engage in certain types of transactions with certain private funds. The Company has until July 15, 2015 to fully conform to the Volcker Rules restrictions. |
17
Table of Contents
Many of the Dodd-Frank Act’s provisions are still subject to the final rulemaking by federal banking agencies, and the implication of the Dodd-Frank Act for the Company’s business will depend to a large extent on how such rules are adopted and implemented. The Company’s management continues to review actively the provisions of the Dodd–Frank Act and assess its probable impact on its business, financial condition, and results of operations.
Available Information
We file annual, quarterly and current reports, proxy statements and other information with the SEC. You may read and copy any document we file at the SEC’s Public Reference Room at 100 F Street, N.E., Washington, D.C. 20549. Please call the SEC at 1-800-SEC-0330 for further information on the public reference room. Our SEC filings are also available to the public at the SEC’s web site at http://www.sec.gov. Our web site is http://www.ffin.com. You may also obtain copies of our annual, quarterly and special reports, proxy statements and certain other information filed with the SEC, as well as amendments thereto, free of charge from our web site. These documents are posted to our web site after we have filed them with the SEC. Our corporate governance guidelines, including our code of conduct applicable to all our employees, officers and directors, as well as the charters of our audit and nominating committees, are available at www.ffin.com. The foregoing information is also available in print to any shareholder who requests it. Except as explicitly provided, information on any web site is not incorporated into this Form 10-K or our other securities filings and is not a part of them.
| ITEM 1A. | RISK FACTORS |
Our business, financial condition, operating results and cash flows can be impacted by a number of factors, including but not limited to those set forth below, any one of which could cause our actual results to vary materially from recent results or from our anticipated future results and other forward-looking statements that we make from time to time in our news releases, annual reports and other written communications, as well as oral forward-looking statements, and other statements made from time to time by our representatives.
Our business faces unpredictable economic conditions, which could have an adverse effect on us.
General economic conditions impact the banking industry. The credit quality of our loan portfolio necessarily reflects, among other things, the general economic conditions in the areas in which we conduct our business. Our continued financial success depends somewhat on factors beyond our control, including:
| • | general economic conditions, including national and local real estate markets and the price of oil and gas; |
| • | the supply of and demand for investable funds; |
| • | demand for loans and access to credit; |
| • | interest rates; and |
| • | federal, state and local laws affecting these matters. |
Any substantial deterioration in any of the foregoing conditions could have a material adverse effect on our financial condition, results of operations and liquidity, which would likely adversely affect the market price of our common stock.
18
Table of Contents
Our business is concentrated in Texas and a downturn in the economy of Texas may adversely affect our business.
Our network of bank regions is concentrated in Texas, primarily in the Central, North Central, Southeast and Western regions of the state. Most of our customers and revenue are derived from this area. These economies include dynamic centers of higher education, agriculture, energy and natural resources, retail, military, healthcare, tourism, retirement living, manufacturing and distribution. Because we generally do not derive revenue or customers from other parts of the state or nation, our business and operations are dependent on economic conditions in our Texas markets. Any significant decline in one or more segments of the local economies could adversely affect our business, revenue, operations and properties.
In 2014 and continuing in early 2015, the price of oil and gas declined significantly resulting in uncertainty about the Texas economy. While we consider our direct exposure to the oil and gas industry to be not significant at approximately 3.00% of total loans as of December 31, 2014, should the price of oil and gas decline further and/or remain at the current low price for an extended period, the general economic conditions in our Texas markets could be negatively affected, which could have a material adverse affect on our business, financial condition and results of operations.
In our business, we must effectively manage our credit risk.
As a lender, we are exposed to the risk that our loan customers may not repay their loans according to the terms of these loans and the collateral securing the payment of these loans may be insufficient to fully compensate us for the outstanding balance of the loan plus the costs to dispose of the collateral. We may experience significant loan losses, which could have a material adverse effect on our operating results and financial condition. Management makes various assumptions and judgments about the collectibility of our loan portfolio, including the diversification by industry of our commercial loan portfolio, the amount of nonperforming loans and related collateral, the volume, growth and composition of our loan portfolio, the effects on the loan portfolio of current economic indicators and their probable impact on borrowers and the evaluation of our loan portfolio through our internal loan review process and other relevant factors.
We maintain an allowance for credit losses, which is an allowance established through a provision for loan losses charged to expense that represents management’s best estimate of probable losses inherent in our loan portfolio. Additional credit losses will likely occur in the future and may occur at a rate greater than we have experienced to date. In determining the amount of the allowance, we rely on an analysis of our loan portfolio, our experience and our evaluation of general economic conditions. If our assumptions prove to be incorrect, our current allowance may not be sufficient and adjustments may be necessary to allow for different economic conditions or adverse developments in our loan portfolio. Material additions to the allowance could materially decrease our net income.
In addition, banking regulators periodically review our allowance for credit losses and may require us to increase our provision for credit losses or recognize further charge-offs, based on judgments different than those of our management. Any increase in our allowance for credit losses or charge-offs as required by these regulatory agencies could have a material negative effect on our operating results, financial condition and liquidity.
Extended drought conditions, severe weather and natural disasters could significantly impact the Company’s business.
Extended drought conditions, severe weather and natural disasters and other adverse external events could have a significant impact on the Company’s ability to conduct business. In addition, such events could affect the stability of the Company’s deposit base, impair the ability of borrowers to repay outstanding loans, impair the value of collateral securing loans, cause significant property damage, result in loss of revenue and/or cause the Company to incur additional expenses. The occurrence of any such event in the future could have a material adverse effect on the Company’s business, which in turn, could have a material adverse effect on the Company’s business, financial condition and result of operations.
19
Table of Contents
Changes in economic conditions could cause an increase in delinquencies and non-performing assets, including loan charge-offs, which could depress our net income and growth.
Our loan portfolio includes many real estate secured loans, demand for which may decrease during economic downturns as a result of, among other things, an increase in unemployment, a decrease in real estate values and, a slowdown in housing. If we see negative economic conditions develop in the United States as a whole or in the portions of Texas that we serve, we could experience higher delinquencies and loan charge-offs, which would reduce our net income and adversely affect our financial condition. Furthermore, to the extent that real estate collateral is obtained through foreclosure, the costs of holding and marketing the real estate collateral, as well as the ultimate values obtained from disposition, could reduce our earnings and adversely affect our financial condition.
The value of real estate collateral may fluctuate significantly resulting in an under-collateralized loan portfolio.
The market value of real estate, particularly real estate held for investment, can fluctuate significantly in a short period of time as a result of market conditions in the geographic area in which the real estate is located. If the value of the real estate serving as collateral for our loan portfolio were to decline materially, a significant part of our loan portfolio could become under-collateralized. If the loans that are collateralized by real estate become troubled during a time when market conditions are declining or have declined, then, in the event of foreclosure, we may not be able to realize the amount of collateral that we anticipated at the time of originating the loan. This could have a material adverse effect on our provision for loan losses and our operating results and financial condition.
New lines of business or new products and services may subject the Company to additional risks.
From time to time, the Company may implement new lines of business or offer new products and services within existing lines of business. There are substantial risks and uncertainties associated with these efforts, particularly in instances where the markets are not fully developed. In developing and marketing new lines of business and/or products and services the Company may invest significant time and resources. External factors, such as compliance with regulations, competitive alternatives, and shifting market preferences, may also impact the successful implementation of a new line of business or a new product or service. If we are unable to successfully manage these risks in the development and implementation of new lines of business or new products or services, it could have a material adverse effect on the Company’s business, financial condition and result of operations.
We are subject to environmental liability risk associated with lending activities.
A significant portion of our loan portfolio is secured by real property. During the ordinary course of business, we may foreclose on and take title to properties securing certain loans. In doing so, there is a risk that hazardous or toxic substances could be found on these properties. If hazardous or toxic substances are found, we may be liable for remediation costs, as well as for personal injury and property damage. Environmental laws may require us to incur substantial expenses and may materially reduce the affected property’s value or limit our ability to use or sell the affected property. In addition, future laws or more stringent interpretations or enforcement policies with respect to existing laws may increase our exposure to environmental liability. Environmental reviews of real property before initiating foreclosure actions may not be sufficient to detect all potential environmental hazards. The remediation costs and any other financial liabilities associated with an environmental hazard could have a material adverse effect on our business, financial condition and results of operations.
We depend on the accuracy and completeness of information about customers and counterparties.
In deciding whether to extend credit or enter into other transactions, we must rely on information furnished by or on behalf of customers and counterparties, including financial statements, credit reports and other financial information. We also rely on representations of those customers, counterparties or other third parties, such as independent auditors, as to the accuracy and completeness of that information. Reliance on inaccurate or misleading financial statements, credit reports or other financial information could have a material adverse impact on our business, financial condition and results of operations.
20
Table of Contents
The repeal of prohibitions on paying interest on demand deposits could increase our interest expense.
Effective July 2011, all federal prohibitions on financial institutions paying interest on demand deposit accounts were repealed as part of the Dodd-Frank Act. As a result, some financial institutions have commenced and are considering offering interest on demand deposits to compete for customers. Our interest expense could increase and our net interest margin could decrease if we begin offering interest on demand deposits to maintain current customers or attract new customers, which could have a material adverse effect on our financial condition and results of operations.
We do business with other financial institutions that could experience financial difficulty.
We do business through the purchase and sale of Federal funds, check clearing and through the purchase and sale of loan participations with other financial institutions. Because these financial institutions have many risks, as do we, we could be adversely affected should one of these financial institutions experience significant financial difficulties or fail to comply with our agreements with them.
If we are unable to continue to originate residential real estate loans and sell them into the secondary market for a profit, our earnings could decrease.
We derive a portion of our noninterest income from the origination of residential real estate loans and the subsequent sale of such loans into the secondary market. If we are unable to continue to originate and sell residential real estate loans at historical or greater levels, our residential real estate loan volume would decrease, which could decrease our earnings. A rising interest rate environment, general economic conditions or other factors beyond our control could adversely affect our ability to originate residential real estate loans. We also are experiencing an increase in regulations and compliance requirements related to mortgage loan originations necessitating technology upgrades and other changes. If new regulations continue to increase and we are unable to make technology upgrades, our ability to originate mortgage loans will be reduced or eliminated. Additionally, we sell a large portion of our residential real estate loans to third party investors, and rising interest rates could negatively affect our ability to generate suitable profits on the sale of such loans. If interest rates increase after we originate the loans, our ability to market those loans is impaired as the profitability on the loans decreases. These fluctuations can have an adverse effect on the revenue we generate from residential real estate loans and in certain instances, could result in a loss on the sale of the loans.
Further, for the mortgage loans we sell in the secondary market, the mortgage loan sales contracts contain indemnification clauses should the loans default, generally in the first sixty to ninety days, or if documentation is determined not to be in compliance with regulations. While the Company’s historic losses as a result of these indemnities have been insignificant, we could be required to repurchase the mortgage loans or reimburse the purchaser of our loans for losses incurred. Both of these situations could have an adverse effect on the profitability of our mortgage loan activities and negatively impact our net income.
We may need to raise additional capital and such funds may not be available when needed.
We may need to raise additional capital in the future to provide us with sufficient capital resources to meet our commitments and business needs, particularly if our asset quality or earnings were to deteriorate significantly. Our ability to raise additional capital, if needed, will depend on, among other things, conditions in the capital and financial markets at that time, which are outside of our control, and our financial performance. Economic conditions and the loss of confidence in financial institutions may increase our cost of funding and limit access to certain customary sources of capital, other financial institution borrowings and borrowings from the discount window of the Federal Reserve. Any occurrence that may limit our access to the capital markets, such as a decline in the confidence of other financial institutions, or counterparties participating in the capital markets, may adversely affect our costs and our ability to raise capital. An inability to raise additional capital on acceptable terms when needed could have a materially adverse effect on our financial condition and results of operations.
We may be subject to more stringent capital and liquidity requirements which would adversely affect our net income and future growth.
On July 2, 2013, the Federal Reserve Board, and on July 9, 2013, the FDIC and OCC, adopted a final rule that implements the Basel III changes to the international regulatory capital framework and revises the U.S. risk-based and leverage capital requirements for U.S. banking organizations to strengthen identified areas of weakness in capital rules and to address relevant provisions of the Dodd-Frank Act.
21
Table of Contents
The final rule establishes a stricter regulatory capital framework that requires banking organizations to hold more and higher-quality capital to act as a financial cushion to absorb losses and help banking organizations better withstand periods of financial stress. The final rule increases capital ratios for all banking organizations and introduces a “capital conservation buffer” which is in addition to each capital ratio. If a banking organization dips into its capital conservation buffer, it may be restricted in its ability to pay dividends and discretionary bonus payments to its executive officers. The final rule assigns a higher risk weight (150%) to exposures that are more than 90 days past due or are on nonaccrual status and to certain commercial real estate facilities that finance the acquisition, development or construction of real property. The final rule also requires unrealized gains and losses on certain “available-for-sale” securities holdings to be included for purposes of calculating regulatory capital requirements unless a one-time opt-out is exercised. We have the one-time option in the first quarter of 2015 to permanently opt-out of the inclusion of accumulated other comprehensive income in our capital calculation. The Company is considering whether to opt-out in order to reduce the impact of market volatility on our regulatory capital levels. The final rule also includes changes in what constitutes regulatory capital, some of which are subject to a two-year transition period. These changes include the phasing-out of certain instruments as qualifying capital. In addition, Tier 2 capital is no longer limited to the amount of Tier 1 capital included in total capital. Mortgage servicing rights, certain deferred tax assets and investments in unconsolidated subsidiaries over designated percentages of common stock will be required to be deducted from capital, subject to a two-year transition period.
The final rule becomes effective for us on January 1, 2015. We have conducted a pro forma analysis of the application of these new capital requirements as of December 31, 2014 and have determined that we meet all of these new requirements, including the full capital conservation buffer, as if these new requirements had been in effect on that date.
Although we currently cannot predict the specific impact and long-term effects that Basel III will have on our Company and the banking industry more generally, the Company will be required to maintain higher regulatory capital levels which could impact our operations, net income and ability to grow. Furthermore, the Company’s failure to comply with the minimum capital requirements could result in our regulators taking formal or informal actions against us which could restrict our future growth or operations.
The trust wealth management fees we receive may decrease as a result of poor investment performance, in either relative or absolute terms, which could decrease our revenues and net earnings.
Our trust company subsidiary derives its revenues primarily from investment management fees based on assets under management. Our ability to maintain or increase assets under management is subject to a number of factors, including investors’ perception of our past performance, in either relative or absolute terms, market and economic conditions, including changes in oil and gas prices, and competition from investment management companies. Financial markets are affected by many factors, all of which are beyond our control, including general economic conditions, including changes in oil and gas prices; securities market conditions; the level and volatility of interest rates and equity prices; competitive conditions; liquidity of global markets; international and regional political conditions; regulatory and legislative developments; monetary and fiscal policy; investor sentiment; availability and cost of capital; technological changes and events; outcome of legal proceedings; changes in currency values; inflation; credit ratings; and the size, volume and timing of transactions. A decline in the fair value of the assets under management, caused by a decline in general economic conditions, would decrease our wealth management fee income.
Investment performance is one of the most important factors in retaining existing clients and competing for new wealth management clients. Poor investment performance could reduce our revenues and impair our growth in the following ways:
| • | existing clients may withdraw funds from our wealth management business in favor of better performing products; |
| • | asset-based management fees could decline from a decrease in assets under management; |
22
Table of Contents
| • | our ability to attract funds from existing and new clients might diminish; and |
| • | our wealth managers and investment advisors may depart, to join a competitor or otherwise. |
Even when market conditions are generally favorable, our investment performance may be adversely affected by the investment style of our wealth management and investment advisors and the particular investments that they make. To the extent our future investment performance is perceived to be poor in either relative or absolute terms, the revenues and profitability of our wealth management business will likely be reduced and our ability to attract new clients will likely be impaired. As such, fluctuations in the equity and debt markets can have a direct impact upon our net earnings.
Certain of our investment advisory and wealth management contracts are subject to termination on short notice, and termination of a significant number of investment advisory contracts could have a material adverse impact on our revenue.
Certain of our investment advisory and wealth management clients can terminate, with little or no notice, their relationships with us, reduce their aggregate assets under management, or shift their funds to other types of accounts with different rate structures for any number of reasons, including investment performance, changes in prevailing interest rates, inflation, changes in investment preferences of clients, changes in our reputation in the marketplace, change in management or control of clients, loss of key investment management personnel and financial market performance. We cannot be certain that our trust company subsidiary will be able to retain all of its clients. If its clients terminate their investment advisory and wealth management contracts, our trust company subsidiary, and consequently we, could lose a substantial portion of our revenues.
We are subject to possible claims and litigation pertaining to fiduciary responsibility.
From time to time, customers could make claims and take legal action pertaining to our performance of our fiduciary responsibilities. Whether customer claims and legal action related to our performance of our fiduciary responsibilities are founded or unfounded, if such claims and legal actions are not resolved in a manner favorable to us, they may result in significant financial liability and/or adversely affect our market perception of our products and services as well as impact customer demand for those products and services. Any financial liability or reputation damage could have a material adverse effect on our business, which, in turn, could have a material adverse effect on our financial condition and results of operations.
Our business is subject to significant government regulation.
We operate in a highly regulated environment and are subject to supervision and regulation by a number of governmental regulatory agencies, including the Texas Department of Banking, the Federal Reserve Board, the OCC, and the FDIC. Regulations adopted by these agencies, which are generally intended to provide protection for depositors and customers rather than for the benefit of shareholders, govern a comprehensive range of matters relating to ownership and control of our shares, our acquisition of other companies and businesses, permissible activities for us to engage in, maintenance of adequate capital levels and other aspects of our operations. The bank regulatory agencies possess broad authority to prevent or remedy unsafe or unsound practices or violations of law.
The Dodd-Frank Act, enacted in July 2010, instituted major changes to the banking and financial institutions regulatory regimes in light of the recent performance of and government intervention in the financial services sector. Other changes to statues, regulations or regulatory policies, including changes in interpretation or implementation of statutes, regulations or policies, could affect the Company in substantial and unpredictable ways. Such changes could subject the Company to reduced revenues, additional costs, limit the types of financial services and products the Company may offer and/or increase the ability of non-banks to offer competing financial services and products, among other things. Failure to comply with laws, regulations or policies could result in sanctions by regulatory agencies, civil money penalties and/or reputation damage, which could have a material adverse effect on the Company’s business, financial condition and results of operations. Additionally, the banking regulations could prohibit and significantly delay the Company’s acquisition of other financial institutions.
23
Table of Contents
Included in the Dodd-Frank Act are, for example, changes related to interchange fees and overdraft services. While the changes for interchange fees that can be charged for electronic debit transactions by payment card issuers relate only to banks with assets greater than $10 billion, concern exists that the regulations will also impact our Company. Beginning in the third quarter of 2010, we were prohibited from charging customers fees for paying overdrafts on automated teller machine and debit card transactions, unless the consumer opts in. We continue to monitor the impact of these new regulations and other developments on our service charge revenue.
Our FDIC insurance assessments could increase substantially resulting in higher operating costs.
We have historically paid the lowest premium rate available due to our sound financial position. Should the number of bank failures increase, FDIC premiums could increase or additional special assessments could be imposed. These increased premiums would have an adverse effect on our net income and results of operations.
We compete with many larger financial institutions which have substantially greater financial resources than we have.
Competition among financial institutions in Texas is intense. We compete with other bank holding companies, state and national commercial banks, savings and loan associations, consumer financial companies, credit unions, securities brokers, insurance companies, mortgage banking companies, money market mutual funds, asset-based non-bank lenders and other financial institutions. Many of these competitors have substantially greater financial resources, larger lending limits, larger branch networks and less regulatory oversight than we do, and are able to offer a broader range of products and services than we can. Failure to compete effectively for deposit, loan and other banking customers in our markets could cause us to lose market share, slow our growth rate and may have an adverse effect on our financial condition, results of operations and liquidity.
We are subject to interest rate risk.
Our profitability is dependent to a large extent on our net interest income, which is the difference between interest income we earn as a result of interest paid to us on loans and investments and interest we pay to third parties such as our depositors and those from whom we borrow funds. Like most financial institutions, we are highly sensitive to many factors that are beyond our control, including general economic conditions and policies of various governmental and regulatory agencies and, in particular, the Federal Reserve Board. Changes in monetary policy, including changes in interest rates, could influence not only the interest we receive on loans and securities and the amount of interest we pay on deposits and borrowings, but such changes could also affect (i) our ability to originate loans and obtain deposits, (ii) the fair value of our financial assets and liabilities, and (iii) the average duration of the Company’s securities portfolio. If the interest rates paid on deposits and other borrowings increase at a faster rate than the interest rates received on loans and investments, our net interest income, and earnings, could be adversely affected. Earnings could also be adversely affected if the interest rates received on loans and investments fall more quickly than the interest rates paid on deposits and other borrowings.
Although we have implemented strategies which we believe reduce the potential effects of adverse changes in interest rates on our results of operations, these strategies may not always be successful. In addition, any substantial and prolonged increase in market interest rates could reduce our customers’ desire to borrow money from us or adversely affect their ability to repay their outstanding loans by increasing their credit costs since most of our loans have adjustable interest rates that reset periodically. Any of these events could adversely affect our results of operations, financial condition and liquidity.
We are subject to liquidity risk.
The Company requires liquidity to meet our deposit and other obligations as they come due. The Company’s access to funding sources in amounts adequate to finance its activities or on terms that are acceptable to it could be impaired by factors that affect it specifically or the financial services industry or economy generally. Factors that could reduce its access to liquidity sources include a downturn in the Texas market, difficult credit markets or adverse regulatory actions against the Company. The Company’s access to deposits may also be affected by the liquidity needs of its depositors. In particular, a substantial majority of the Company’s liabilities are demand, savings, interest checking and money market deposits, which are payable on demand or upon several days’ notice,
24
Table of Contents
while by comparison, a substantial portion of its assets are loans, which cannot be called or sold in the same time frame. The Company may not be able to replace maturing deposits and advances as necessary in the future, especially if a large number of its depositors sought to withdraw their accounts, regardless of the reason. A failure to maintain adequate liquidity could have a material adverse effect on the Company’s business, financial condition and result of operations.
The value of certain securities in our investment portfolio may be negatively affected by changes or disruptions in the market for these securities.
Our investment portfolio securities include obligations of, and mortgage-backed securities guaranteed by, government sponsored enterprises such as the Federal National Mortgage Association, referred to as Fannie Mae, the Government National Mortgage Association, referred to as Ginnie Mae, the Federal Home Loan Mortgage Corporation, referred to as Freddie Mac, and the Federal Home Loan Bank or otherwise backed by Federal Housing Administration or Veteran’s Administration guaranteed loans; however, volatility or illiquidity in financial markets may cause investment securities held within our investment portfolio to fall in value or become less liquid. The FRB’s actions to increase the money supply (sometimes referred to as quantitative easing) may be curtailed or ended which may cause a decline in the value of securities held by the Company. Uncertainty surrounding the credit risk associated with mortgage collateral or guarantors may cause material discrepancies in valuation estimates obtained from third parties. Volatile market conditions may reduce valuations due to the perception of heightened credit and liquidity risks in addition to interest rate risk typically associated with these securities. There can be no assurance that declines in market value associated with these disruptions will not result in impairments of these assets, which would lead to accounting charges that could have a material adverse effect on our results of operations, equity and capital ratios.
The downgrade of U.S. government securities by the credit rating agencies could have a material adverse effect on our operations, results of operations and financial condition.
The recent debates in Congress regarding the national debt ceiling, federal budget deficit concerns and overall weakness in the economy resulted in actual and threatened downgrades of United States government securities by the various major credit ratings agencies. While the federal banking agencies, including the Federal Reserve Board and the FDIC, have issued guidance indicating that, for risk-based capital purposes, the risk weights for United States Treasury securities and other securities issued or guaranteed by the United States government, government agencies and government-sponsored entities will not be affected by the downgrade, the downgrade of United States government securities by the credit agencies and the possible future downgrade of the federal government’s credit rating could create further uncertainty in the United States and global financial markets and cause other events which, directly or indirectly, could adversely affect our operations, results of operations and financial condition.
First Financial Bankshares, Inc. relies on dividends from its subsidiaries for most of its revenue.
First Financial Bankshares, Inc. is a separate and distinct legal entity from its subsidiaries. It receives substantially all of its revenue from dividends paid by its subsidiaries. These dividends are the principal source of funds to pay dividends on the Company’s common stock and interest and principal on First Financial Bankshares, Inc. debt (if we had balances outstanding). Various federal and/or state laws and regulations limit the amount of dividends that our bank and trust subsidiaries may pay to First Financial Bankshares, Inc. In the event our subsidiaries are unable to pay dividends to First Financial Bankshares, Inc., First Financial Bankshares, Inc. may not be able to service debt, if any, or pay dividends on the Company’s common stock. The inability to receive dividends from our subsidiaries could have a material adverse effect on the Company’s business, financial condition, results of operations and liquidity.
To continue our growth, we are affected by our ability to identify and acquire other financial institutions.
We intend to continue our current growth strategy. This strategy includes opening new branches and acquiring other banks that serve customers or markets we find desirable. The market for acquisitions remains highly competitive, and we may be unable to find satisfactory acquisition candidates in the future that fit our acquisition and growth strategy. To the extent that we are unable to find suitable acquisition candidates, an important component of our growth strategy may be lost. Additionally, our completed acquisitions, or any future acquisitions, may not produce the revenue, earnings or synergies that we anticipated.
25
Table of Contents
We may not be able to complete future acquisitions, may not be successful in realizing the benefits of any future acquisitions that are completed, or may choose not to pursue acquisition opportunities we might find beneficial.
A substantial part of our historical growth has been a result of acquisitions of other financial institutions, and we may, from time to time, evaluate and engage in the acquisition of other financial institutions. We must generally satisfy a number of conditions prior to completing any such transaction, including certain bank regulatory approvals. Bank regulators consider a number of factors with regard to all institutions involved in the transaction when determining whether to approve a proposed transaction, including, among others, the ratings and compliance history, anti-money laundering and Bank Secrecy Act compliance history, CRA examination results and the effect of the proposed transaction on the financial stability of the institutions involved and the market as a whole.
The process for obtaining required regulatory approvals has become substantially more difficult, time-consuming and unpredictable as a result of the financial crisis. We may fail to pursue, evaluate or complete strategic and competitively significant business opportunities as a result of our inability, or our perceived inability, to obtain required regulatory approvals in a timely manner or at all.
Assuming we are able to successfully complete one or more transactions, we may not be able to successfully integrate and realize the expected synergies from any completed transaction in a timely manner or at all. In particular, we may be charged by federal and state regulators with regulatory and compliance failures at an acquired business prior to the date of the acquisition, and these failures by the acquired company may have negative consequences for us, including the imposition of formal or informal enforcement actions. Completion and integration of any transaction may also divert management attention from other matters, result in addition costs and expenses, or adversely affect our relationships with our customers and employees, any of which may adversely affect our business or results of operations. As a result, our financial condition may be affected, and we may become more susceptible to general economic conditions and competitive pressures.
Use of our common stock for future acquisitions or to raise capital may be dilutive to existing stockholders.
When we determine that appropriate strategic opportunities exist, we may acquire other financial institutions and related businesses, subject to applicable regulatory requirements. We may use our common stock for such acquisitions. We may also seek to raise capital through selling additional common stock, although we have not historically done so. It is possible that the issuance of additional common stock in such acquisition or capital transactions may be dilutive to the interests of our existing shareholders.
Our accounting estimates and risk management processes rely on analytical and forecasting models.
The processes we use to estimate our allowance for loan losses and to measure the fair value of financial instruments, as well as the processes used to estimate the effects of changing interest rates depends upon the use of analytical and forecasting models. In addition, these models are used to calculate fair value of our assets and liabilities when we acquire other financial institutions. These models reflect assumptions that may not be accurate, particularly in times of market stress or other unforeseen circumstances. Even if these assumptions are adequate, the models may prove to be inadequate or inaccurate because of other flaws in their design or their implementation. If the models we use for interest rate risk and asset-liability management are inadequate, we may incur increased or unexpected losses upon changes in market interest rates or other market measures. If the models we use for determining our probable loan losses are inadequate, the allowance for loan losses may not be sufficient to support future charge-offs. If the models we use to measure the fair value financial instruments is inadequate, the fair value of such financial instruments may fluctuate unexpectedly or may not accurately reflect what we could realize upon sale or settlement of such financial instruments. Such failure in our analytical or forecasting models could have a material adverse effect on our business, financial condition and results of operations.
26
Table of Contents
The value of our goodwill and other intangible assets may decline in the future.
As of December 31, 2014, we had $97.36 million of goodwill and other intangible assets. A significant decline in our financial condition, a significant adverse change in the business climate, slower growth rates or a significant and sustained decline in the price of our common stock may necessitate taking charges in the future related to the impairment of our goodwill and other intangible assets. If we were to conclude that a future write-down of goodwill and other intangible assets is necessary, we would record the appropriate charge, which could have a material adverse effect on our financial condition and results of operations.
We rely heavily on our management team, and the unexpected loss of key management or inability to recruit qualified personnel in the future may adversely affect our operations.
Our success to date has been strongly influenced by our ability to attract and to retain senior management experienced in banking in the markets we serve. Our ability to retain executive officers and the current management teams will continue to be important to the successful implementation of our strategies. We do not have employment agreements with these key employees other than executive agreements in the event of a change of control and a confidential information, non-solicitation and non-competition agreement related to our stock options. The unexpected loss of services of any key management personnel, or the inability to recruit and retain qualified personnel in the future, could have an adverse effect on our business and financial results.
The Company’s stock price can be volatile.
Stock price volatility may make it more difficult for you to resell your common stock when you want and at prices you find attractive. The Company’s stock price can fluctuate significantly in response to a variety of factors including, among other things:
| • | actual or anticipated variations in quarterly results of operations; |
| • | recommendations by securities analysts; |
| • | operating and stock price performance of other companies that investors deem comparable to the Company; |
| • | new reports relating to trends, concerns and other issues in the financial services industry or Texas economy; |
| • | perceptions in the marketplace regarding the Company and/or its competitors; |
| • | new technology used, or services offered, by competitors; |
| • | significant acquisitions or business combinations involving the Company or its competitors; and |
| • | changes in government regulations, including tax laws. |
General market fluctuations, industry factors and general economic and political conditions and events, such as economic slowdowns or recessions, interest rate changes or credit loss trends could also cause the Company’s stock price to decrease regardless of operational results.
The trading volume in our common stock is less than other larger financial institutions.
Although the Company’s common stock is listed for trading on the Nasdaq Global Select Market, the trading volume in its common stock is less than that of other, larger financial services companies. A public trading market having the desired characteristics of depth, liquidity and orderliness depends on the presence in the marketplace of willing buyers and sellers of the Company’s common stock at any given time. This presence depends on the individual decisions of investors and general economic and market conditions over which the Company has no control. Given the lower trading volume of the Company’s common stock, significant sales of the Company’s common stock, or the expectation of these sales, could cause the Company’s stock price to fall.
27
Table of Contents
Breakdowns in our internal controls and procedures could have an adverse effect on us.
We believe our internal control system as currently documented and functioning is adequate to provide reasonable assurance over our internal controls. Nevertheless, because of the inherent limitation in administering a cost effective control system, misstatements due to error or fraud may occur and not be detected. Breakdowns in our internal controls and procedures could occur in the future, and any such breakdowns could have an adverse effect on us. See “Item 9A – Controls and Procedures” for additional information.
We compete in an industry that continually experiences technological change, and we may have fewer resources than many of our competitors to continue to invest in technological improvements.
The financial services industry is undergoing rapid technological changes, with frequent introductions of new technology-driven products and services. In addition to improving the ability to serve customers, the effective use of technology increases efficiency and enables financial institutions to reduce costs. Our future success will depend, in part, upon our ability to address the needs of our customers by using technology to provide products and services that will satisfy customer demands for conveniences, as well as to create additional efficiencies in our operations. Many of our larger competitors have substantially greater resources to invest in technological improvements. We may not be able to effectively implement new technology-driven products and services or be successful in marketing these products and services to our customers.
System failure or cybersecurity breaches of our network security could subject us to increased operating costs as well as litigation and other potential losses.
The computer systems and network infrastructure we use could be vulnerable to unforeseen hardware and cybersecurity issues, including “hacking” and “identity theft.” Our operations are dependent upon our ability to protect our computer equipment against damage from fire, power loss, telecommunications failure or a similar catastrophic event. Any damage or failure that causes an interruption in our operations could have an adverse effect on our financial condition and results of operations. In addition, our operations are dependent upon our ability to protect the computer systems and network infrastructure utilized by us, including our Internet banking activities, against damage from physical break-ins, cybersecurity breaches and other disruptive problems caused by the Internet or other users. Such computer break-ins and other disruptions would jeopardize the security of information stored in and transmitted through our computer systems and network infrastructure, which may result in significant liability to us, damage our reputation and inhibit current and potential customers from our Internet banking services. Each year, we add additional security measures to our computer systems and network infrastructure to mitigate the possibility of cybersecurity breaches including firewalls and penetration testing. We continue to investigate cost effective measures as well as insurance protection.
Furthermore, our customers could incorrectly blame the Company and terminate their accounts with the Company for a cyber-incident which occurred on their own system or with that of an unrelated third party. In addition, a security breach could also subject us to additional regulatory scrutiny and expose us to civil litigation and possible financial liability.
We are subject to claims and litigation pertaining to intellectual property.
We rely on technology companies to provide information technology products and services necessary to support our day-to-day operations. Technology companies frequently enter into litigation based on allegations of patent infringement or other violations of intellectual property rights. In addition, patent holding companies seek to monetize patents they have purchased or otherwise obtained. Competitors of our vendors, or other individuals or companies, have from time to time claimed to hold intellectual property sold to us by its vendors. Such claims may increase in the future as the financial services sector becomes more reliant on information technology vendors. The plaintiffs in these actions frequently seek injunctions and substantial damages.
Regardless of the scope or validity of such patents or other intellectual property rights, or the merits of any claims by potential or actual litigants, we may have to engage in litigation that could be expensive, time-consuming, disruptive to our operations, and distracting to management. If we are found to infringe one or more patents or other intellectual property rights, we may be required to pay substantial damages or royalties to a third-party. In certain
28
Table of Contents
cases, we may consider entering into licensing agreements for disputed intellectual property, although no assurance can be given that such licenses can be obtained on acceptable terms or that litigation will not occur. These licenses may also significantly increase our operating expenses. If legal matters related to intellectual property claims were resolved against us or settled, we could be required to make payments in amounts that could have a material adverse effect on our business, financial condition and results of operations.
An investment in our common stock is not an insured deposit.
Our common stock is not a bank deposit and, therefore, is not insured against loss by the FDIC, any other deposit insurance fund, or by any other public or private entity. Investment in our common stock is inherently risky for the reasons described in this “Risk Factors” section and elsewhere in this Report. As a result, if you acquire our common stock, you may lose some or all of your investment.
| ITEM 1B. | UNRESOLVED STAFF COMMENTS |
None.
| ITEM 2. | PROPERTIES |
Our principal office is located in the First Financial Bank Building at 400 Pine Street in downtown Abilene, Texas. We lease four spaces in buildings owned by First Financial Bank, National Association, Abilene totaling approximately 8,600 square feet. Our subsidiaries collectively own 56 banking facilities, some of which are detached drive-ins, and also lease 11 banking facilities and 16 ATM locations. Our management considers all our existing locations to be well-suited for conducting the business of banking. We believe our existing facilities are adequate to meet our requirements and our subsidiaries’ requirements for the foreseeable future.
| ITEM 3. | LEGAL PROCEEDINGS |
From time to time we and our subsidiaries are parties to lawsuits arising in the ordinary course of our banking business. However, there are no material pending legal proceedings to which we, our subsidiaries or our other direct and indirect subsidiaries, or any of their properties, are currently subject. Other than regular, routine examinations by state and federal banking authorities, there are no proceedings pending or known to be contemplated by any governmental authorities.
| ITEM 4. | MINE SAFETY DISCLOSURES |
Not applicable.
29
Table of Contents
PART II
| ITEM 5. | MARKET FOR REGISTRANT’S COMMON EQUITY, RELATED STOCKHOLDER MATTERS AND ISSUER PURCHASES OF EQUITY SECURITIES |
Market Information
Our common stock, par value $0.01 per share, is traded on the Nasdaq Global Select Market under the trading symbol FFIN. See “Item 8—Financial Statements and Supplementary Data—Quarterly Financial Data” for the high, low and closing sales prices as reported by the Nasdaq Global Select Market for our common stock for the periods indicated.
Record Holders
As of February 1, 2015, we had approximately 1,200 shareholders of record.
Dividends
See “Item 8—Financial Statements and Supplementary Data—Quarterly Results of Operations” for the frequency and amount of cash dividends paid by us. Also, see “Item 1 – Business – Supervision and Regulation – Payment of Dividends” and “Item 7 – Management’s Discussion and Analysis of the Financial Condition and Results of Operations – Liquidity – Dividends” for restrictions on our present or future ability to pay dividends, particularly those restrictions arising under federal and state banking laws.
Equity Compensation Plans
See “Item 12 – Security Ownership of Certain Beneficial Owners and Management and Related Stockholder Matters”.
30
Table of Contents
PERFORMANCE GRAPH
The following performance graph compares cumulative total shareholder returns for our common stock, the Russell 3000 Index, and the SNL Bank Index, which is a banking index prepared by SNL Financial LC and is comprised of banks with $5 billion to $10 billion in total assets, for a five-year period (December 31, 2009 to December 31, 2014). The performance graph assumes $100 invested in our common stock at its closing price on December 31, 2009, and in each of the Russell 3000 Index and the SNL Bank Index on the same date. The performance graph also assumes the reinvestment of all dividends. The dates on the performance graph represent the last trading day of each year indicated. The amounts noted on the performance graph have been adjusted to give effect to all stock splits and stock dividends.
First Financial Bankshares, Inc.
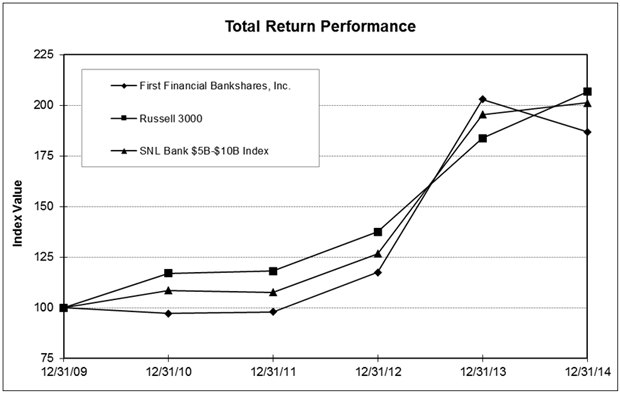
| Period Ending | ||||||||||||||||||||||||
| Index |
12/31/09 | 12/31/10 | 12/31/11 | 12/31/12 | 12/31/13 | 12/31/14 | ||||||||||||||||||
| First Financial Bankshares, Inc. |
100.00 | 97.11 | 97.94 | 117.51 | 202.92 | 186.77 | ||||||||||||||||||
| Russell 3000 |
100.00 | 116.93 | 118.13 | 137.52 | 183.66 | 206.72 | ||||||||||||||||||
| SNL Bank $5B-$10B Index |
100.00 | 108.48 | 107.66 | 126.64 | 195.38 | 201.25 | ||||||||||||||||||
Source : SNL Financial LC, Charlottesville, VA
© 2015
www.snl.com
31
Table of Contents
| ITEM 6. | SELECTED FINANCIAL DATA |
The selected financial data presented below as of and for the years ended December 31, 2014, 2013, 2012, 2011, and 2010, have been derived from our audited consolidated financial statements. The selected financial data should be read in conjunction with “Item 7—Management’s Discussion and Analysis of Financial Condition and Results of Operations” and our consolidated financial statements and accompanying notes presented elsewhere in this Form 10-K. The results of operations presented below are not necessarily indicative of the results of operations that may be achieved in the future. Management’s Discussion and Analysis of Financial Condition and Results of Operations incorporates information required to be disclosed by the SEC’s Industry Guide 3, “Statistical Disclosure by Bank Holding Companies.”
| Year Ended December 31, | ||||||||||||||||||||
| 2014 | 2013 | 2012 | 2011 | 2010 | ||||||||||||||||
| (dollars in thousands, except per share data) | ||||||||||||||||||||
| Summary Income Statement Information: |
||||||||||||||||||||
| Interest income |
$ | 198,539 | $ | 176,369 | $ | 159,796 | $ | 160,021 | $ | 149,699 | ||||||||||
| Interest expense |
4,181 | 4,088 | 5,112 | 8,024 | 13,528 | |||||||||||||||
|
|
|
|
|
|
|
|
|
|
|
|||||||||||
| Net interest income |
194,358 | 172,281 | 154,684 | 151,997 | 136,171 | |||||||||||||||
| Provision for loan losses |
4,465 | 3,753 | 3,484 | 6,626 | 8,962 | |||||||||||||||
| Noninterest income |
66,624 | 62,052 | 57,209 | 51,438 | 49,478 | |||||||||||||||
| Noninterest expense |
137,925 | 126,012 | 109,049 | 104,624 | 98,256 | |||||||||||||||
|
|
|
|
|
|
|
|
|
|
|
|||||||||||
| Earnings before income taxes and extraordinary item |
118,592 | 104,568 | 99,360 | 92,185 | 78,431 | |||||||||||||||
| Income tax expense |
29,033 | 25,700 | 25,135 | 23,816 | 20,068 | |||||||||||||||
|
|
|
|
|
|
|
|
|
|
|
|||||||||||
| Net earnings before extraordinary item |
89,559 | 78,868 | 74,225 | 68,369 | 58,363 | |||||||||||||||
| Extraordinary item |
— | — | — | — | 1,296 | |||||||||||||||
|
|
|
|
|
|
|
|
|
|
|
|||||||||||
| Net earnings |
$ | 89,559 | $ | 78,868 | $ | 74,225 | $ | 68,369 | $ | 59,659 | ||||||||||
|
|
|
|
|
|
|
|
|
|
|
|||||||||||
| Per Share Data: |
||||||||||||||||||||
| Earnings per share, basic before extraordinary item |
$ | 1.40 | $ | 1.24 | $ | 1.18 | $ | 1.09 | $ | 0.94 | ||||||||||
| Earnings per share, assuming dilution before extraordinary item |
1.39 | 1.24 | 1.18 | 1.09 | 0.94 | |||||||||||||||
| Earnings per share, basic |
1.40 | 1.24 | 1.18 | 1.09 | 0.96 | |||||||||||||||
| Earnings per share, assuming dilution |
1.39 | 1.24 | 1.18 | 1.09 | 0.96 | |||||||||||||||
| Cash dividends declared |
0.55 | 0.52 | 0.50 | 0.48 | 0.46 | |||||||||||||||
| Book value at period-end |
10.63 | 9.18 | 8.84 | 8.08 | 7.03 | |||||||||||||||
| Earnings performance ratios: |
||||||||||||||||||||
| Return on average assets |
1.65 | % | 1.64 | % | 1.75 | % | 1.78 | % | 1.75 | % | ||||||||||
| Return on average equity |
14.00 | 13.75 | 13.85 | 14.44 | 13.74 | |||||||||||||||
| Summary Balance Sheet Data (Period-end): |
||||||||||||||||||||
| Securities |
$ | 2,416,297 | $ | 2,058,407 | $ | 1,820,096 | $ | 1,844,998 | $ | 1,546,242 | ||||||||||
| Loans |
2,937,991 | 2,689,448 | 2,088,623 | 1,786,544 | 1,690,346 | |||||||||||||||
| Total assets |
5,848,202 | 5,222,208 | 4,502,012 | 4,120,531 | 3,776,367 | |||||||||||||||
| Deposits |
4,750,255 | 4,135,075 | 3,632,584 | 3,334,798 | 3,113,301 | |||||||||||||||
| Total liabilities |
5,166,665 | 4,634,561 | 3,945,049 | 3,611,994 | 3,334,679 | |||||||||||||||
| Total shareholders’ equity |
681,537 | 587,647 | 556,963 | 508,537 | 441,688 | |||||||||||||||
| Asset quality ratios: |
||||||||||||||||||||
| Allowance for loan losses/period-end loans |
1.25 | % | 1.26 | % | 1.67 | % | 1.92 | % | 1.84 | % | ||||||||||
| Nonperforming assets/period-end loans plus foreclosed assets |
0.74 | 1.16 | 1.22 | 1.64 | 1.53 | |||||||||||||||
| Net charge offs/average loans |
0.06 | 0.15 | 0.15 | 0.20 | 0.35 | |||||||||||||||
| Capital ratios: |
||||||||||||||||||||
| Average shareholders’ equity/average assets |
11.78 | % | 11.95 | % | 12.62 | % | 12.30 | % | 12.76 | % | ||||||||||
| Leverage ratio (1) |
9.89 | 9.84 | 10.60 | 10.33 | 10.28 | |||||||||||||||
| Tier 1 risk-based capital (2) |
16.05 | 15.82 | 17.43 | 17.49 | 17.01 | |||||||||||||||
| Total risk-based capital (3) |
17.16 | 16.92 | 18.68 | 18.74 | 18.26 | |||||||||||||||
| Dividend payout ratio |
39.34 | 41.62 | 41.99 | 43.57 | 47.58 | |||||||||||||||
32
Table of Contents
| (1) | Calculated by dividing at period-end, shareholders’ equity (before accumulated other comprehensive earnings/loss) less intangible assets by fourth quarter average assets less intangible assets. |
| (2) | Calculated by dividing at period-end, shareholders’ equity (before accumulated other comprehensive earnings/loss) less intangible assets by risk-adjusted assets. |
| (3) | Calculated by dividing at period-end, shareholders’ equity (before accumulated other comprehensive earnings/loss) less intangible assets plus allowance for loan losses to the extent allowed under regulatory guidelines by risk-adjusted assets. |
| ITEM 7. | MANAGEMENT’S DISCUSSION AND ANALYSIS OF FINANCIAL CONDITION AND RESULTS OF OPERATIONS |
The following discussion contains forward-looking statements that are subject to risks and uncertainties. Actual results may differ materially from those contemplated by the forward-looking statements as a result of certain factors, including but not limited to those listed in “Item 1A – Risk Factors” and in the “Cautionary Statement Regarding Forward-Looking Statements” notice on page 1.
Introduction
As a financial holding company, we generate most of our revenue from interest on loans and investments, trust fees, and service charges. Our primary source of funding for our loans and investments are deposits held by our bank subsidiary, First Financial Bank, National Association, Abilene, Texas. Our largest expenses are interest on these deposits, salaries and related employee benefits. We usually measure our performance by calculating our return on average assets, return on average equity, our regulatory leverage and risk based capital ratios and our efficiency ratio, which is calculated by dividing noninterest expense by the sum of net interest income on a tax equivalent basis and noninterest income.
The following discussion and analysis of the major elements of our consolidated balance sheets as of December 31, 2014 and 2013, and consolidated statements of earnings for the years 2012 through 2014 should be read in conjunction with our consolidated financial statements, accompanying notes, and selected financial data presented elsewhere in this Form 10-K.
Critical Accounting Policies
We prepare consolidated financial statements based on generally accepted accounting principles and customary practices in the banking industry. These policies, in certain areas, require us to make significant estimates and assumptions.
We deem a policy critical if (1) the accounting estimate required us to make assumptions about matters that are highly uncertain at the time we make the accounting estimate; and (2) different estimates that reasonably could have been used in the current period, or changes in the accounting estimate that are reasonably likely to occur from period to period, would have a material impact on the financial statements.
We deem our most critical accounting policies to be (1) our allowance for loan losses and our provision for loan losses and (2) our valuation of securities. We have other significant accounting policies and continue to evaluate the materiality of their impact on our consolidated financial statements, but we believe these other policies either do not generally require us to make estimates and judgments that are difficult or subjective, or it is less likely they would have a material impact on our reported results for a given period. A discussion of (1) our allowance for loan losses and our provision for loan losses and (2) our valuation of securities is included in Note 1 to our Consolidated Financial Statements beginning on page F-7.
Acquisition of Orange Savings Bank, SSB
On February 9, 2013, we entered into an agreement and plan of merger to acquire Orange Savings Bank, SSB. On May 31, 2013, the transaction was completed, which we refer to herein as the “Orange acquisition.” Pursuant to the agreement, we paid $39.20 million in cash and issued 840,000 shares of the Company’s common stock in exchange for all of the outstanding shares of Orange Savings Bank, SSB.
33
Table of Contents
At closing, Orange Savings Bank, SSB was merged into First Financial Bank, N.A., Abilene, Texas, a wholly owned subsidiary of the Company. The total purchase price exceeded the estimated fair value of assets acquired by approximately $23.02 million and the Company recorded such excess as goodwill.
Consolidation of Bank Charters
Effective December 30, 2012, the Company consolidated its eleven bank charters into our Abilene bank charter, First Financial Bank, National Association. The Company cited regulatory, compliance and technology complexities and the opportunity for cost savings as its reason for making this change. The Company operates under its charter as it previously did with eleven charters, with local management and local advisory boards to benefit the customers and communities it serves.
Stock Split
On April 22, 2014 the Company’s Board of Directors declared a two-for-one stock split in the form of a 100% stock dividend effective for shareholders of record on May 15, 2014 that was distributed on June 2, 2014. All share and per share amounts in this report have been restated to reflect this stock split. An amount equal to the par value of the additional common shares to be issued pursuant to the stock split was reflected as a transfer from retained earnings to common stock on the consolidated financial statements as of and for the year ended December 31, 2014.
Results of Operations
Performance Summary. Net earnings for 2014 were $89.56 million, an increase of $10.69 million, or 13.55%, over net earnings for 2013 of $78.87 million. Net earnings for 2012 were $74.23 million. The increases in net earnings for 2014 over 2013 and 2013 over 2012 were primarily attributable to growth in net interest income and noninterest income.
On a basic net earnings per share basis, net earnings were $1.40 for 2014 as compared to $1.24 for 2013 and $1.18 for 2012. The return on average assets was 1.65% for 2014 as compared to 1.64% for 2013 and 1.75% for 2012. The return on average equity was 14.00% for 2014 as compared to 13.75% for 2013 and 13.85% for 2012.
Net Interest Income. Net interest income is the difference between interest income on earning assets and interest expense on liabilities incurred to fund those assets. Our earning assets consist primarily of loans and investment securities. Our liabilities to fund those assets consist primarily of noninterest-bearing and interest-bearing deposits. Tax-equivalent net interest income was $213.49 million in 2014 as compared to $189.00 million in 2013 and $169.32 million in 2012. The increases in 2014 compared to 2013 and in 2013 compared to 2012 were largely attributable to increases in the volume of earning assets. Average earning assets were $5.08 billion in 2014, as compared to $4.48 billion in 2013 and $3.95 billion in 2012. Average earning assets increased $602.51 million in 2014, when compared to 2013, with increases in all categories of earning assets, except for short-term investments and Federal funds sold. Average earning assets increased $525.62 million in 2013, when compared to 2012, with increase in all categories of earning assets, except for short-term investments and taxable investment securities. The yield on earning assets decreased 3 basis points in 2014, whereas the rate paid on interest-bearing liabilities decreased 1 basis point when compared to 2013. The yield on earning assets decreased ten basis points in 2013, whereas the rate paid on interest-bearing liabilities decreased six basis points when compared to 2012.
34
Table of Contents
Table 1 allocates the change in tax-equivalent net interest income between the amount of change attributable to volume and to rate.
Table 1 — Changes in Interest Income and Interest Expense (in thousands):
| 2014 Compared to 2013 | 2013 Compared to 2012 | |||||||||||||||||||||||
| Change Attributable to | Total Change |
Change Attributable to | Total Change |
|||||||||||||||||||||
| Volume | Rate | Volume | Rate | |||||||||||||||||||||
| Short-term investments |
$ | (32 | ) | $ | (107 | ) | $ | (139 | ) | $ | (327 | ) | $ | 81 | $ | (246 | ) | |||||||
| Taxable investment securities |
2,938 | (41 | ) | 2,897 | (2,525 | ) | (3,288 | ) | (5,813 | ) | ||||||||||||||
| Tax-exempt investment securities (1) |
6,482 | 32 | 6,514 | 7,613 | (2,519 | ) | 5,094 | |||||||||||||||||
| Loans (1) (2) |
17,903 | (2,598 | ) | 15,305 | 28,236 | (8,612 | ) | 19,624 | ||||||||||||||||
|
|
|
|
|
|
|
|
|
|
|
|
|
|||||||||||||
| Interest income |
27,291 | (2,714 | ) | 24,577 | 32,997 | (14,338 | ) | 18,659 | ||||||||||||||||
| Interest-bearing deposits |
578 | (404 | ) | 174 | 559 | (1,727 | ) | (1,168 | ) | |||||||||||||||
| Short-term borrowings |
(3 | ) | (78 | ) | (81 | ) | 129 | 15 | 144 | |||||||||||||||
|
|
|
|
|
|
|
|
|
|
|
|
|
|||||||||||||
| Interest expense |
575 | (482 | ) | 93 | 688 | (1,712 | ) | (1,024 | ) | |||||||||||||||
|
|
|
|
|
|
|
|
|
|
|
|
|
|||||||||||||
| Net interest income |
$ | 26,716 | $ | (2,232 | ) | $ | 24,484 | $ | 32,309 | $ | (12,626 | ) | $ | 19,683 | ||||||||||
|
|
|
|
|
|
|
|
|
|
|
|
|
|||||||||||||
| (1) | Computed on tax-equivalent basis assuming marginal tax rate of 35%. |
| (2) | Non-accrual loans are included in loans. |
The net interest margin, which measures tax-equivalent net interest income as a percentage of average earning assets, is illustrated in Table 2 for the years 2012 through 2014. The net interest margin in 2014 was 4.20%, a decrease of 2 basis points from 2013 which also decreased an additional 6 basis points from 2012. The decrease in our net interest margin in 2014 was largely the result of the extended period of historically low levels of short-term interest rates. The Federal funds rate remained at zero to 0.25% during 2012 to 2014. We have been able to somewhat mitigate the impact of low short-term interest rates by establishing minimum interest rates on certain of our loans, improving the pricing for loan risk, and reducing rates paid on interest bearing liabilities. We expect interest rates to remain at the current low levels based on forward guidance from the Federal Reserve Board which will continue to place pressure on our interest margin.
The net interest margin, which measures tax-equivalent net interest income as a percentage of average earning assets, is illustrated in Table 2.
Table 2 — Average Balances and Average Yields and Rates (in thousands, except percentages):
| 2014 | 2013 | 2012 | ||||||||||||||||||||||||||||||||||
| Average Balance |
Income/ Expense |
Yield/ Rate |
Average Balance |
Income/ Expense |
Yield/ Rate |
Average Balance |
Income/ Expense |
Yield/ Rate |
||||||||||||||||||||||||||||
| Assets |
||||||||||||||||||||||||||||||||||||
| Short-term investments (1) |
$ | 75,093 | $ | 370 | 0.49 | % | $ | 81,822 | $ | 509 | 0.62 | % | $ | 134,588 | $ | 754 | 0.61 | % | ||||||||||||||||||
| Taxable investment securities (2) |
1,173,725 | 28,402 | 2.42 | 1,052,453 | 25,505 | 2.42 | 1,144,763 | 31,318 | 2.74 | |||||||||||||||||||||||||||
| Tax-exempt investment securities (2)(3) |
1,045,304 | 50,657 | 4.85 | 911,472 | 44,143 | 4.84 | 762,754 | 39,049 | 5.12 | |||||||||||||||||||||||||||
| Loans (3)(4) |
2,786,011 | 138,240 | 4.96 | 2,431,872 | 122,935 | 5.06 | 1,909,890 | 103,312 | 5.41 | |||||||||||||||||||||||||||
|
|
|
|
|
|
|
|
|
|
|
|
|
|
|
|
|
|
|
|||||||||||||||||||
| Total earning assets |
$ | 5,080,133 | $ | 217,669 | 4.28 | % | $ | 4,477,619 | $ | 193,092 | 4.31 | % | $ | 3,951,995 | $ | 174,433 | 4.41 | % | ||||||||||||||||||
| Cash and due from banks |
144,029 | 129,222 | 120,477 | |||||||||||||||||||||||||||||||||
| Bank premises and equipment, net |
98,828 | 91,341 | 80,315 | |||||||||||||||||||||||||||||||||
| Other assets |
43,749 | 49,084 | 47,891 | |||||||||||||||||||||||||||||||||
| Goodwill and other intangible assets, net |
97,443 | 86,809 | 72,041 | |||||||||||||||||||||||||||||||||
| Allowance for loan losses |
(35,599 | ) | (34,815 | ) | (34,802 | ) | ||||||||||||||||||||||||||||||
|
|
|
|
|
|
|
|||||||||||||||||||||||||||||||
| Total assets |
$ | 5,428,583 | $ | 4,799,260 | $ | 4,237,917 | ||||||||||||||||||||||||||||||
|
|
|
|
|
|
|
|||||||||||||||||||||||||||||||
| Liabilities and Shareholders’ Equity |
||||||||||||||||||||||||||||||||||||
| Interest-bearing deposits |
$ | 2,905,734 | $ | 3,883 | 0.13 | % | $ | 2,513,674 | $ | 3,709 | 0.15 | % | $ | 2,255,239 | $ | 4,877 | 0.22 | % | ||||||||||||||||||
| Short-term borrowings |
397,738 | 298 | 0.07 | 400,545 | 379 | 0.09 | 258,863 | 235 | 0.09 | |||||||||||||||||||||||||||
|
|
|
|
|
|
|
|
|
|
|
|
|
|
|
|
|
|
|
|||||||||||||||||||
| Total interest-bearing liabilities |
3,303,472 | $ | 4,181 | 0.13 | % | 2,914,219 | $ | 4,088 | 0.14 | % | 2,514,102 | $ | 5,112 | 0.20 | % | |||||||||||||||||||||
| Noninterest-bearing deposits |
1,441,125 | 1,266,135 | 1,132,862 | |||||||||||||||||||||||||||||||||
| Other liabilities |
44,242 | 45,521 | 55,021 | |||||||||||||||||||||||||||||||||
|
|
|
|
|
|
|
|||||||||||||||||||||||||||||||
| Total liabilities |
4,788,839 | 4,225,875 | 3,701,985 | |||||||||||||||||||||||||||||||||
| Shareholders’ equity |
639,744 | 573,385 | 535,932 | |||||||||||||||||||||||||||||||||
|
|
|
|
|
|
|
|||||||||||||||||||||||||||||||
| Total liabilities and shareholders’ equity |
$ | 5,428,583 | $ | 4,799,260 | $ | 4,237,917 | ||||||||||||||||||||||||||||||
|
|
|
|
|
|
|
|||||||||||||||||||||||||||||||
| Net interest income |
$ | 213,488 | $ | 189,004 | $ | 169,321 | ||||||||||||||||||||||||||||||
|
|
|
|
|
|
|
|||||||||||||||||||||||||||||||
| Rate Analysis: |
||||||||||||||||||||||||||||||||||||
| Interest income/earning assets |
4.28 | % | 4.31 | % | 4.41 | % | ||||||||||||||||||||||||||||||
| Interest expense/earning assets |
0.08 | 0.09 | 0.13 | |||||||||||||||||||||||||||||||||
|
|
|
|
|
|
|
|||||||||||||||||||||||||||||||
| Net yield on earning assets |
4.20 | % | 4.22 | % | 4.28 | % | ||||||||||||||||||||||||||||||
|
|
|
|
|
|
|
|||||||||||||||||||||||||||||||
35
Table of Contents
| (1) | Short-term investments are comprised of Fed Funds sold, interest bearing deposits in banks and interest bearing time deposits in banks. |
| (2) | Average balances include unrealized gains and losses on available-for-sale securities. |
| (3) | Computed on a tax-equivalent basis assuming a marginal tax rate of 35%. |
| (4) | Nonaccrual loans are included in loans. |
Noninterest Income. Noninterest income for 2014 was $66.62 million, an increase of $4.57 million, or 7.37%, as compared to 2013. Increases in certain categories of noninterest income included (1) ATM, interchange and credit card fees of $2.68 million, (2) trust fees of $2.45 million and (3) net gain on sale of foreclosed assets of $1.06 million. Under the Dodd-Frank Act, the Federal Reserve Board was authorized to establish rules regarding interchange fees charged for electronic debit transactions by payment card issuers. While the changes relate only to banks with assets greater than $10 billion, concern exists that the regulation will also impact our Company in the future. The increase in ATM, interchange and credit card fees are primarily a result of increases in the number of net new accounts and debit cards. The increase in trust fees was primarily due to the growth in assets under management over the prior year as well as higher fees generated from mineral management services. The fair value of our trust assets, which are not reflected in our consolidated balance sheets, totaled $3.76 billion at December 31, 2014 compared to $3.36 billion at December 31, 2013. The increase in net gain on sale of foreclosed assets is a result of several gains recognized on sales of foreclosed properties in our Orange and Weatherford regions.
Offsetting the increases in 2014 were decreases in real estate mortgage fees of $710 thousand and service charges on deposit accounts of $636 thousand. The decline in real estate mortgage fees is a result of the overall decline in the mortgage refinance market in 2014 when compared to 2013. The decline in service charges is a result of continued declines in NSF fees due to charges in overdraft regulations. Since the third quarter of 2010, a rule issued by the Federal Reserve Board has prohibited financial institutions from charging consumers fees for paying overdrafts on automated teller machine and debit card transactions, unless a consumer consents, or opts in, to the overdraft service for those types of transactions. Consumers must be provided a notice that explains the financial institution’s overdraft services, including the fees associated with the service, and the consumer’s choices. We continue to monitor the impact of these new regulations and other related developments on our service charge revenue.
Noninterest income for 2013 was $62.05 million, an increase of $4.84 million, or 8.47%, as compared to 2012. Increases in certain categories of noninterest income included (1) ATM, interchange and credit card fees of $1.56 million principally as a result of increased use of debit cards, (2) trust fees of $1.85 million, (3) real estate mortgage operations of $1.26 million and (4) service charges on deposit accounts of $853 thousand. Under the Dodd-Frank Act, the Federal Reserve Board was authorized to establish rules regarding interchange fees charged for electronic debit transactions by payment card issuers. While the changes relate only to banks with assets greater than $10 billion, concern exists that the regulation will also impact our Company in the future. The increase in trust fees was primarily due to the growth in assets under management over the prior year as well as higher fees generated from oil and gas management. The fair value of our trust assets, which are not reflected in our consolidated balance sheets, totaled $3.36 billion at December 31, 2013 compared to $2.85 billion at December 31, 2012. The increases in income from real estate secondary market mortgage operations reflected a higher level of new home and home sale financing from additional resources devoted to expanding the Company’s mortgage loan operations although we experienced a decrease in such fees in the fourth quarter of 2013. The increase in service charges on deposit accounts was primarily due to our Orange acquisition and to an increase in the number of deposit accounts offset by changes in overdraft regulations.
The increases in noninterest income in 2013 were offset by a decrease of $2.63 million in net gain on sale of available-for-sale securities when compared to amounts recorded in 2012.
36
Table of Contents
Table 3 — Noninterest Income (in thousands):
| 2014 | Increase (Decrease) |
2013 | Increase (Decrease) |
2012 | ||||||||||||||||
| Trust fees |
$ | 18,766 | $ | 2,449 | $ | 16,317 | $ | 1,853 | $ | 14,464 | ||||||||||
| Service charges on deposit accounts |
16,910 | (636 | ) | 17,546 | 853 | 16,693 | ||||||||||||||
| ATM, interchange and credit card fees |
19,427 | 2,677 | 16,750 | 1,563 | 15,187 | |||||||||||||||
| Real estate mortgage operations |
5,639 | (710 | ) | 6,349 | 1,255 | 5,094 | ||||||||||||||
| Net gain on sale of available-for-sale securities |
(4 | ) | (151 | ) | 147 | (2,625 | ) | 2,772 | ||||||||||||
| Net gain (loss) on sale of foreclosed assets |
904 | 1,056 | (152 | ) | 198 | (350 | ) | |||||||||||||
| Other: |
||||||||||||||||||||
| Check printing fees |
223 | (6 | ) | 229 | 24 | 205 | ||||||||||||||
| Safe deposit rental fees |
533 | 30 | 503 | 50 | 453 | |||||||||||||||
| Credit life and debt protection fees |
214 | (12 | ) | 226 | (3 | ) | 229 | |||||||||||||
| Brokerage commissions |
871 | 174 | 697 | 519 | 178 | |||||||||||||||
| Interest on loan recoveries |
601 | 133 | 468 | 151 | 317 | |||||||||||||||
| Gain on sales of assets, net |
10 | (173 | ) | 183 | (24 | ) | 207 | |||||||||||||
| Miscellaneous income |
2,530 | (259 | ) | 2,789 | 1,029 | 1,760 | ||||||||||||||
|
|
|
|
|
|
|
|
|
|
|
|||||||||||
| Total other |
4,982 | (113 | ) | 5,095 | 1,746 | 3,349 | ||||||||||||||
|
|
|
|
|
|
|
|
|
|
|
|||||||||||
| Total Noninterest Income |
$ | 66,624 | $ | 4,572 | $ | 62,052 | $ | 4,843 | $ | 57,209 | ||||||||||
|
|
|
|
|
|
|
|
|
|
|
|||||||||||
Noninterest Expense. Total noninterest expense for 2014 was $137.93 million, an increase of $11.91 million, or 9.45%, as compared to 2013. Noninterest expense for 2013 amounted to $126.01 million, an increase of $16.96 million, or 15.56%, as compared to 2012. An important measure in determining whether a banking company effectively manages noninterest expenses is the efficiency ratio, which is calculated by dividing noninterest expense by the sum of net interest income on a tax-equivalent basis and noninterest income. Lower ratios indicate better efficiency since more income is generated with a lower noninterest expense total. Our efficiency ratio for 2014 was 49.24% compared to 50.19% for 2013, and 48.14% for 2012.
Salaries and employee benefits for 2014 totaled $70.46 million, an increase of $3.93 million, or 5.90%, as compared to 2013. The principal causes of this increase were (1) salary increases, (2) additional employees to staff new branches and compliance related areas and (3) an increase in medical claims.
All other categories of noninterest expense for 2014 totaled $67.47 million, an increase of $7.99 million, or 13.43%, as compared to 2013. The increase in noninterest expense was largely attributable to the Company’s recognition of a $2.91 million expense from the partial settlement of its frozen defined benefit pension plan (see Note 11 to the Consolidated Financial Statements for more details) and the recognition of a $2.39 million expense related to a litigation settlement and the deductible from damage sustained in a hail storm in Abilene. Other categories of noninterest expense with increases included ATM, interchange and credit card expenses, equipment expense and net occupancy expense.
Salaries and employee benefits for 2013 totaled $66.53 million, an increase of $8.26 million, or 14.18%, as compared to 2012. The principal causes of this increase were (1) additional salaries from our Orange acquisition, (2) additional employees to staff new branches and compliance related areas, (3) an increase in profit sharing expense, and (4) an increase in medical claims.
All other categories of noninterest expense for 2013 totaled $59.48 million, an increase of $8.70 million, or 17.14%, as compared to 2012. The increase in noninterest expense was largely the result of increases in other miscellaneous expense of $3.55 million, net occupancy expense of $1.02 million, professional and service fees of $1.10 million and equipment expense of $883 thousand. The increases in other miscellaneous expense and professional and service fees were largely attributable to IT termination and conversion costs associated with our Orange acquisition. The increases in net occupancy and equipment costs were likewise primarily from increased costs from our Orange acquisition.
37
Table of Contents
Table 4 — Noninterest Expense (in thousands):
| 2014 | Increase (Decrease) |
2013 | Increase (Decrease) |
2012 | ||||||||||||||||
| Salaries |
$ | 53,483 | $ | 3,617 | $ | 49,866 | $ | 5,374 | $ | 44,492 | ||||||||||
| Medical |
5,185 | 359 | 4,826 | 1,396 | 3,430 | |||||||||||||||
| Profit sharing |
5,324 | (362 | ) | 5,686 | 975 | 4,711 | ||||||||||||||
| Pension |
172 | (384 | ) | 556 | (76 | ) | 632 | |||||||||||||
| 401(k) match expense |
1,699 | 139 | 1,560 | 177 | 1,383 | |||||||||||||||
| Payroll taxes |
3,884 | 260 | 3,624 | 337 | 3,287 | |||||||||||||||
| Stock option expense |
709 | 298 | 411 | 77 | 334 | |||||||||||||||
|
|
|
|
|
|
|
|
|
|
|
|||||||||||
| Total salaries and employee benefits |
70,456 | 3,927 | 66,529 | 8,260 | 58,269 | |||||||||||||||
| Loss from partial settlement of pension plan |
2,909 | 2,909 | — | — | — | |||||||||||||||
| Net occupancy expense |
9,100 | 1,005 | 8,095 | 1,019 | 7,076 | |||||||||||||||
| Equipment expense |
10,740 | 1,067 | 9,673 | 883 | 8,790 | |||||||||||||||
| FDIC insurance premiums |
2,725 | 307 | 2,418 | 198 | 2,220 | |||||||||||||||
| ATM, interchange and credit card expenses |
6,870 | 1,210 | 5,660 | 212 | 5,448 | |||||||||||||||
| Professional and service fees |
4,295 | 152 | 4,143 | 1,099 | 3,044 | |||||||||||||||
| Printing, stationery and supplies |
2,637 | 571 | 2,066 | 96 | 1,970 | |||||||||||||||
| Amortization of intangible assets |
275 | 78 | 197 | 48 | 149 | |||||||||||||||
| Other: |
||||||||||||||||||||
| Data processing fees |
309 | 60 | 249 | (7 | ) | 256 | ||||||||||||||
| Postage |
1,670 | 136 | 1,534 | 131 | 1,403 | |||||||||||||||
| Advertising |
3,590 | 816 | 2,774 | 551 | 2,223 | |||||||||||||||
| Correspondent bank service charges |
887 | (28 | ) | 915 | 59 | 856 | ||||||||||||||
| Telephone |
2,138 | 71 | 2,067 | 513 | 1,554 | |||||||||||||||
| Public relations and business development |
2,357 | 298 | 2,059 | 305 | 1,754 | |||||||||||||||
| Directors’ fees |
865 | (2 | ) | 867 | 98 | 769 | ||||||||||||||
| Audit and accounting fees |
1,561 | (158 | ) | 1,719 | 326 | 1,393 | ||||||||||||||
| Legal fees |
867 | 142 | 725 | (231 | ) | 956 | ||||||||||||||
| Regulatory exam fees |
927 | 102 | 825 | (246 | ) | 1,071 | ||||||||||||||
| Travel |
958 | (35 | ) | 993 | 218 | 775 | ||||||||||||||
| Courier expense |
784 | 52 | 732 | (34 | ) | 766 | ||||||||||||||
| Operational and other losses |
3,681 | 2,328 | 1,353 | 237 | 1,116 | |||||||||||||||
| Other real estate |
470 | (55 | ) | 525 | 12 | 513 | ||||||||||||||
| Software amortization and expense |
1,426 | (406 | ) | 1,832 | (336 | ) | 2,168 | |||||||||||||
| Other miscellaneous expense |
5,428 | (2,634 | ) | 8,062 | 3,552 | 4,510 | ||||||||||||||
|
|
|
|
|
|
|
|
|
|
|
|||||||||||
| Total other |
27,918 | 687 | 27,231 | 5,148 | 22,083 | |||||||||||||||
|
|
|
|
|
|
|
|
|
|
|
|||||||||||
| Total Noninterest Expense |
$ | 137,925 | $ | 11,913 | $ | 126,012 | $ | 16,963 | $ | 109,049 | ||||||||||
|
|
|
|
|
|
|
|
|
|
|
|||||||||||
Income Taxes. Income tax expense was $29.03 million for 2014 as compared to $25.70 million for 2013 and $25.14 million for 2012. Our effective tax rates on pretax income were 24.48%, 24.58%, and 25.30%, respectively, for the years 2014, 2013 and 2012. The effective tax rates differ from the statutory federal tax rate of 35.0% largely due to tax exempt interest income earned on certain investment securities and loans and the deductibility of dividends paid to our employee stock ownership plan.
38
Table of Contents
Balance Sheet Review
Loans. Our portfolio is comprised of loans made to businesses, professionals, individuals, and farm and ranch operations located in the primary trade areas served by our subsidiary bank. Real estate loans represent loans primarily for 1-4 family residences and owner-occupied commercial real estate. The structure of loans in the real estate mortgage area generally provides re-pricing intervals to minimize the interest rate risk inherent in long-term fixed rate loans. As of December 31, 2014, total loans held for investment were $2.93 billion, an increase of $244.90 million, as compared to December 31, 2013. As compared to year-end 2013, real estate loans increased $144.34 million, commercial loans increased $43.22 million, agricultural loans increased $29.77 million and consumer loans increased $27.57 million. Loans averaged $2.79 billion during 2014, an increase of $354.14 million over the 2013 average balances.
Table 5 — Composition of Loans (in thousands):
| December 31, | ||||||||||||||||||||
| 2014 | 2013 | 2012 | 2011 | 2010 | ||||||||||||||||
| Commercial |
$ | 639,954 | $ | 596,730 | $ | 509,609 | $ | 454,087 | $ | 442,377 | ||||||||||
| Agricultural |
105,694 | 75,928 | 68,306 | 68,122 | 82,380 | |||||||||||||||
| Real estate |
1,822,854 | 1,678,514 | 1,226,823 | 1,041,396 | 962,366 | |||||||||||||||
| Consumer |
360,686 | 333,113 | 272,428 | 212,310 | 190,064 | |||||||||||||||
|
|
|
|
|
|
|
|
|
|
|
|||||||||||
| Total loans held-for-investment |
$ | 2,929,188 | $ | 2,684,285 | $ | 2,077,166 | $ | 1,775,915 | $ | 1,677,187 | ||||||||||
|
|
|
|
|
|
|
|
|
|
|
|||||||||||
As of December 31, 2014, our real estate loans represent approximately 62.23% of our loan portfolio and are comprised of (i) commercial real estate loans of 28.57%, generally owner occupied, (ii) 1-4 family residence loans of 46.63%, (iii) residential development and construction loans of 6.84%, which includes our custom and speculation home construction loans, (iv) commercial development and construction loans of 3.58% and (v) other loans, which includes ranches, hospitals and universities of 14.38%.
Loans held for sale, consisting of secondary market mortgage loans, totaled $8.80 million and $5.16 million at December 31, 2014 and 2013, respectively, which were recorded at cost as fair value exceeded cost.
The Company has certain lending policies and procedures in place that are designed to maximize loan income with an acceptable level of risk. Management reviews and approves these policies and procedures on an annual basis and makes changes as appropriate. Management receives and reviews monthly reports related to loan originations, quality, concentrations, delinquencies, nonperforming and potential problem loans. Diversification in the loan portfolio is a means of managing risk associated with fluctuations in economic conditions, both by type of loan and geographic location.
Commercial loans are underwritten after evaluating and understanding the borrower’s ability to operate profitably and effectively. Underwriting standards are designed to determine whether the borrower possesses sound business ethics and practices and to evaluate current and projected cash flows to determine the ability of the borrower to repay their obligations as agreed. Commercial loans are primarily made based on the identified cash flows of the borrower and, secondarily, on the underlying collateral provided by the borrower. Most commercial loans are secured by the assets being financed or other business assets, such as accounts receivable or inventory, and include personal guarantees.
Agricultural loans are subject to underwriting standards and processes similar to commercial loans. These agricultural loans are based primarily on the identified cash flows of the borrower and secondarily on the underlying collateral provided by the borrower. Most agricultural loans are secured by the agriculture related assets being financed, such as farm land, cattle or equipment, and include personal guarantees.
Real estate loans are also subject to underwriting standards and processes similar to commercial and agricultural loans. These loans are underwritten primarily based on projected cash flows and, secondarily, as loans secured by real estate. The repayment of real estate loans is generally largely dependent on the successful operation of the property securing the loans or the business conducted on the property securing the loan. Real estate loans may be more adversely affected by conditions in the real estate markets or in the general economy. The properties securing
39
Table of Contents
the Company’s real estate portfolio are generally diverse in terms of type and geographic location within Texas. This diversity helps reduce the exposure to adverse economic events that affect any single market or industry. Generally, real estate loans are owner occupied which further reduces the Company’s risk.
Consumer loan underwriting utilizes methodical credit standards and analysis to supplement the Company’s underwriting policies and procedures. The Company’s loan policy addresses types of consumer loans that may be originated and the collateral, if secured, which must be perfected. The relatively smaller individual dollar amounts of consumer loans that are spread over numerous individual borrowers also minimize the Company’s risk.
Table 6 — Maturity Distribution and Interest Sensitivity of Loans at December 31, 2014 (in thousands):
The following tables summarize maturity and repricing information for the commercial and agricultural and the real estate-construction portion of our loan portfolio as of December 31, 2014:
| One Year or less |
After One Year Through Five Years |
After Five Years |
Total | |||||||||||||
| Commercial and agricultural |
$ | 337,759 | $ | 230,953 | $ | 176,936 | $ | 745,648 | ||||||||
| Real estate - construction |
74,830 | 27,092 | 107,970 | 209,892 | ||||||||||||
| Maturities After One Year |
||||
| Loans with fixed interest rates |
$ | 397,472 | ||
| Loans with floating or adjustable interest rates |
145,479 | |||
Asset Quality. The loan portfolio of our bank subsidiary is subject to periodic reviews by our centralized independent loan review group as well as periodic examinations by bank regulatory agencies. Loans are placed on nonaccrual status when, in the judgment of management, the collectibility of principal or interest under the original terms becomes doubtful. Nonaccrual, past due 90 days or more and still accruing and restructured loans plus foreclosed assets, were $21.72 million at December 31, 2014, as compared to $31.13 million at December 31, 2013 and $25.46 million at December 31, 2012. As a percent of loans and foreclosed assets, these assets were 0.74% at December 31, 2014, as compared to 1.16% at December 31, 2013 and 1.22% at December 31, 2012. As a percent of total assets, these assets were 0.37% at December 31, 2014, as compared to 0.60% at December 31, 2013 and 0.57% at December 31, 2012. We believe the level of these assets to be manageable and are not aware of any material classified credits not properly disclosed as nonperforming at December 31, 2014. The increase in dollar amount of nonperforming loans in 2013 was primarily from our Orange acquisition.
Table 7 — Nonaccrual, Past Due 90 Days or More and Still Accruing, Restructured Loans and Foreclosed Assets (in thousands, except percentages):
| At December 31, | ||||||||||||||||||||
| 2014 | 2013 | 2012 | 2011 | 2010 | ||||||||||||||||
| Nonaccrual loans* |
$ | 20,194 | $ | 27,926 | $ | 21,800 | $ | 19,975 | $ | 15,445 | ||||||||||
| Loans still accruing and past due 90 days or more |
261 | 133 | 97 | 96 | 2,196 | |||||||||||||||
| Troubled debt restructured loans** |
226 | — | — | — | — | |||||||||||||||
|
|
|
|
|
|
|
|
|
|
|
|||||||||||
| Nonperforming loans |
20,681 | 28,059 | 21,897 | 20,071 | 17,641 | |||||||||||||||
| Foreclosed assets |
1,035 | 3,069 | 3,565 | 9,464 | 8,309 | |||||||||||||||
|
|
|
|
|
|
|
|
|
|
|
|||||||||||
| Total nonperforming assets |
$ | 21,716 | $ | 31,128 | $ | 25,462 | $ | 29,535 | $ | 25,950 | ||||||||||
|
|
|
|
|
|
|
|
|
|
|
|||||||||||
| As a % of loans and foreclosed assets |
0.74 | % | 1.16 | % | 1.22 | % | 1.64 | % | 1.53 | % | ||||||||||
| As a % of total assets |
0.37 | 0.60 | 0.57 | 0.72 | 0.69 | |||||||||||||||
| * | Includes $2.15 million and $2.71 million, respectively, of purchased credit impaired loans as of December 31, 2014 and 2013. There were no purchased credit impaired loan balances in prior periods. |
| ** | Troubled debt restructured loans of $9.07 million, $13.30 million, $14.36 million and $6.55 million, whose interest collection, after considering economic and business conditions and collection efforts, is doubtful are included in non-accrual loans as of December 31, 2014, 2013, 2012 and 2011, respectively. There were no such balances at December 31, 2010. |
40
Table of Contents
We record interest payments received on non-accrual loans as reductions of principal. Prior to the loans being placed on non-accrual, we recognized interest income on impaired loans as of December 31, 2014 of approximately $97 thousand during the year ended December 31, 2014. If interest on these impaired loans had been recognized on a full accrual basis during the year ended December 31, 2014, such income would have approximated $1.58 million.
See Note 3 to the Consolidated Financial Statements beginning on page F-17 for more information on these assets.
Provision and Allowance for Loan Losses. The allowance for loan losses is the amount we determine as of a specific date to be appropriate to absorb probable losses on existing loans in which full collectability is unlikely based on our review and evaluation of the loan portfolio. For a discussion of our methodology, see our accounting policies in Note 1 to the Consolidated Financial Statements beginning on page F-7. The continued provision for loan losses in 2014 reflects the growth in loans and continuing levels of nonperforming and classified assets. However the general stability of our balances in non-accrual loans and reductions in net charge-offs as a percentage of average loans enabled the Company to not significantly increase provisions in 2014. As a percent of average loans, net loan charge-offs were 0.06% during 2014, 0.15% during 2013 and 0.15% during 2012. The allowance for loan losses as a percent of loans was 1.25% as of December 31, 2014, as compared to 1.26% at December 31, 2013 and 1.67% at December 31, 2012. The decrease in the allowance for loan losses percentage in 2013 is due primarily to the impact of loans acquired in the Orange acquisition, which were initially recorded at fair value with an embedded credit adjustment and no allocated allowance for loan losses. Included in Tables 8 and 9 are further analysis of our allowance for loan losses.
Although we believe we use the best information available to make loan loss allowance determinations, future adjustments could be necessary if circumstances or economic conditions differ substantially from the assumptions used in making our initial determinations. A downturn in the economy or lower employment could result in increased levels of nonaccrual, past due 90 days or more and still accruing, restructured loans, foreclosed assets, charge-offs, increased loan loss provisions and reductions in income. Additionally, as an integral part of their examination process, bank regulatory agencies periodically review the adequacy of our allowance for loan losses. The banking agencies could require additions to the loan loss allowance based on their judgment of information available to them at the time of their examinations of our bank subsidiary.
41
Table of Contents
Table 8 — Loan Loss Experience and Allowance for Loan Losses (in thousands, except percentages):
| 2014 | 2013 | 2012 | 2011 | 2010 | ||||||||||||||||
| Balance at January 1, |
$ | 33,900 | $ | 34,839 | $ | 34,315 | $ | 31,106 | $ | 27,612 | ||||||||||
| Charge-offs: |
||||||||||||||||||||
| Commercial |
583 | 1,283 | 499 | 640 | 2,598 | |||||||||||||||
| Agricultural |
2 | 100 | 53 | 95 | 113 | |||||||||||||||
| Real estate |
1,075 | 1,970 | 2,951 | 3,682 | 2,231 | |||||||||||||||
| Consumer |
1,222 | 1,268 | 852 | 907 | 1,505 | |||||||||||||||
|
|
|
|
|
|
|
|
|
|
|
|||||||||||
| Total charge-offs |
2,882 | 4,621 | 4,355 | 5,324 | 6,447 | |||||||||||||||
|
|
|
|
|
|
|
|
|
|
|
|||||||||||
| Recoveries: |
||||||||||||||||||||
| Commercial |
346 | 402 | 281 | 610 | 234 | |||||||||||||||
| Agricultural |
18 | 39 | 54 | 33 | 56 | |||||||||||||||
| Real estate |
505 | 239 | 639 | 874 | 238 | |||||||||||||||
| Consumer |
472 | 337 | 421 | 390 | 451 | |||||||||||||||
|
|
|
|
|
|
|
|
|
|
|
|||||||||||
| Total recoveries |
1,341 | 1,017 | 1,395 | 1,907 | 979 | |||||||||||||||
|
|
|
|
|
|
|
|
|
|
|
|||||||||||
| Net charge-offs |
1,541 | 3,604 | 2,960 | 3,417 | 5,468 | |||||||||||||||
| Transfer of off-balance sheet exposure to other liabilities |
— | (1,088 | ) | — | — | — | ||||||||||||||
| Provision for loan losses |
4,465 | 3,753 | 3,484 | 6,626 | 8,962 | |||||||||||||||
|
|
|
|
|
|
|
|
|
|
|
|||||||||||
| Balance at December 31, |
$ | 36,824 | $ | 33,900 | $ | 34,839 | $ | 34,315 | $ | 31,106 | ||||||||||
|
|
|
|
|
|
|
|
|
|
|
|||||||||||
| Loans at year-end |
$ | 2,937,991 | $ | 2,689,448 | $ | 2,088,623 | $ | 1,786,544 | $ | 1,690,346 | ||||||||||
| Average loans |
2,786,011 | 2,431,872 | 1,909,890 | 1,715,266 | 1,543,537 | |||||||||||||||
| Net charge-offs/average loans |
0.06 | % | 0.15 | % | 0.15 | % | 0.20 | % | 0.35 | % | ||||||||||
| Allowance for loan losses/year-end loans* |
1.25 | 1.26 | 1.67 | 1.92 | 1.84 | |||||||||||||||
| Allowance for loan losses/nonaccrual, past due 90 days still accruing and restructured loans |
178.06 | 120.82 | 159.10 | 171.00 | 176.33 | |||||||||||||||
| * | Reflects the impact of loans acquired in the Orange Savings Bank, SSB acquisition, which were initially recorded at fair value with no allocated allowance for loan losses. |
Table 9 — Allocation of Allowance for Loan Losses (in thousands):
| 2014 | 2013 | 2012 | 2011 | 2010 | ||||||||||||||||
| Allocation Amount |
Allocation Amount |
Allocation Amount |
Allocation Amount |
Allocation Amount |
||||||||||||||||
| Commercial |
$ | 7,990 | $ | 6,440 | $ | 7,343 | $ | 9,664 | $ | 7,745 | ||||||||||
| Agricultural |
527 | 383 | 1,541 | 1,482 | 2,299 | |||||||||||||||
| Real estate |
26,657 | 24,940 | 24,063 | 21,533 | 19,101 | |||||||||||||||
| Consumer |
1,650 | 2,137 | 1,892 | 1,636 | 1,961 | |||||||||||||||
|
|
|
|
|
|
|
|
|
|
|
|||||||||||
| Total |
$ | 36,824 | $ | 33,900 | $ | 34,839 | $ | 34,315 | $ | 31,106 | ||||||||||
|
|
|
|
|
|
|
|
|
|
|
|||||||||||
Percent of Loans in Each Category of Total Loans:
| 2014 | 2013 | 2012 | 2011 | 2010 | ||||||||||||||||
| Commercial |
21.84 | % | 22.23 | % | 24.53 | % | 26.37 | % | 26.17 | % | ||||||||||
| Agricultural |
3.61 | 2.83 | 3.29 | 4.02 | 4.87 | |||||||||||||||
| Real estate |
62.23 | 62.53 | 59.06 | 57.66 | 57.71 | |||||||||||||||
| Consumer |
12.32 | 12.41 | 13.12 | 11.95 | 11.25 | |||||||||||||||
42
Table of Contents
Included in our loan portfolio are certain other loans not included in Table 7 that are deemed to be potential problem loans. Potential problem loans are those loans that are currently performing, but for which known information about trends, uncertainties or possible credit problems of the borrowers causes management to have serious doubts as to the ability of such borrowers to comply with present repayment terms, possibly resulting in the transfer of such loans to nonperforming status. These potential problem loans totaled $1.63 million as of December 31, 2014.
Interest-Bearing Deposits in Banks. The Company had interest-bearing deposits in banks of $71.33 million, $57.42 million, and $188.68 million at December 31, 2014, 2013, and 2012, respectively. At December 31, 2014, our interest-bearing deposits in banks included $54.03 million maintained at the Federal Reserve Bank of Dallas, $17.00 million invested in FDIC-insured certificates of deposit and $300 thousand on deposit with the Federal Home Loan Bank of Dallas (FHLB). The change in 2014 and 2013 was due to the Company investing its liquid funds in higher yield assets. The average balance of interest-bearing deposits in banks was $66.68 million, $69.17 million and $123.00 million in 2014, 2013 and 2012, respectively. The average yield on interest-bearing deposits in banks was 0.51%%, 0.67% and 0.61% in 2014, 2013 and 2012, respectively.
Available-for-Sale and Held-to-Maturity Securities. At December 31, 2014, securities with a fair value of $2.42 billion were classified as securities available-for-sale and securities with an amortized cost of $441 thousand were classified as securities held-to-maturity. As compared to December 31, 2013, the available-for-sale portfolio at December 31, 2014, reflected (1) an increase of $520 thousand in U. S. Treasury securities; (2) a decrease of $8.33 million in obligations of U.S. government sponsored enterprises and agencies; (3) an increase of $176.36 million in obligations of states and political subdivisions; (4) a decrease of $10.28 million in corporate bonds and other; and (5) an increase of $199.87 million in mortgage-backed securities. As compared to December 31, 2012, the available-for-sale portfolio at December 31, 2013, reflected (1) a decrease of $6.09 million in U. S. Treasury securities; (2) a decrease of $85.39 million in obligations of U.S. government sponsored enterprises and agencies; (3) an increase of $147.58 million in obligations of states and political subdivisions; (4) a decrease of $14.15 million in corporate bonds and other; and (5) an increase of $196.74 million in mortgage-backed securities. Securities-available-for-sale included fair value adjustments of $77.17 million, $22.60 million and $91.80 million at December 31, 2014, 2013, and 2012, respectively. We did not hold any collateralized mortgage obligations or structured notes as of December 31, 2014 that we consider to be high risk. Our mortgage related securities are backed by GNMA, FNMA or FHLMC or are collateralized by securities backed by these agencies.
See Table 10 and Note 2 to the Consolidated Financial Statements for additional disclosures relating to the maturities and fair values of the investment portfolio at December 31, 2014 and 2013.
Table 10 — Maturities and Yields of Available-for-Sale Held at December 31, 2014 (in thousands, except percentages):
| Maturing | ||||||||||||||||||||||||||||||||||||||||
| One Year or Less |
After One Year Through Five Years |
After Five Years Through Ten Years |
After Ten Years |
Total | ||||||||||||||||||||||||||||||||||||
| Available-for-Sale: |
Amount | Yield | Amount | Yield | Amount | Yield | Amount | Yield | Amount | Yield | ||||||||||||||||||||||||||||||
| U.S.Treasury securities |
$ | — | — | % | $ | 520 | 1.18 | % | $ | — | — | % | $ | — | — | % | $ | 520 | 1.18 | % | ||||||||||||||||||||
| Obligations of U.S. government sponsored enterprises and agencies |
24,597 | 1.69 | 105,158 | 1.25 | — | — | — | — | 129,755 | 1.34 | ||||||||||||||||||||||||||||||
| Obligations of states and political subdivisions |
45,175 | 3.89 | 534,262 | 5.06 | 580,250 | 5.22 | 7,941 | 7.88 | 1,167,628 | 5.12 | ||||||||||||||||||||||||||||||
| Corporate bonds and other securities |
12,306 | 1.76 | 86,452 | 2.59 | — | — | — | — | 98,758 | 2.49 | ||||||||||||||||||||||||||||||
| Mortgage-backed securities |
3,579 | 4.72 | 613,625 | 2.62 | 401,841 | 2.50 | 150 | 2.01 | 1,019,195 | 2.58 | ||||||||||||||||||||||||||||||
|
|
|
|
|
|
|
|
|
|
|
|
|
|
|
|
|
|
|
|
|
|||||||||||||||||||||
| Total |
$ | 85,657 | 2.99 | % | $ | 1,340,017 | 3.49 | % | $ | 982,091 | 4.11 | % | $ | 8,091 | 7.77 | % | $ | 2,415,856 | 3.74 | % | ||||||||||||||||||||
|
|
|
|
|
|
|
|
|
|
|
|||||||||||||||||||||||||||||||
Amounts for held-to-maturity securities are not included herein due to insignificance.
All yields are computed on a tax-equivalent basis assuming a marginal tax rate of 35%. Yields on available-for-sale securities are based on amortized cost. Maturities of mortgage-backed securities are based on contractual maturities and could differ due to prepayments of underlying mortgages. Maturities of other securities are reported at the earlier of maturity date or call date.
43
Table of Contents
As of December 31, 2014, the investment portfolio had an overall tax equivalent yield of 3.74%, a weighted average life of 4.63 years and modified duration of 4.11 years.
Deposits. Deposits held by our subsidiary bank represent our primary source of funding. Total deposits were $4.75 billion as of December 31, 2014, as compared to $4.14 billion as of December 31, 2013 and $3.63 billion as of December 31, 2012. Table 11 provides a breakdown of average deposits and rates paid over the past three years and the remaining maturity of time deposits of $100,000 or more:
Table 11 — Composition of Average Deposits and Remaining Maturity of Time Deposits of $100,000 or More (in thousands, except percentages):
| 2014 | 2013 | 2012 | ||||||||||||||||||||||
| Average Balance |
Average Rate |
Average Balance |
Average Rate |
Average Balance |
Average Rate |
|||||||||||||||||||
| Noninterest-bearing deposits |
$ | 1,441,125 | — | $ | 1,266,135 | — | $ | 1,132,862 | — | |||||||||||||||
| Interest-bearing deposits |
||||||||||||||||||||||||
| Interest-bearing checking |
1,341,754 | 0.11 | % | 1,094,897 | 0.11 | % | 899,204 | 0.11 | % | |||||||||||||||
| Savings and money market accounts |
888,108 | 0.06 | 754,493 | 0.07 | 648,815 | 0.11 | ||||||||||||||||||
| Time deposits under $100,000 |
279,734 | 0.22 | 291,026 | 0.25 | 299,902 | 0.42 | ||||||||||||||||||
| Time deposits of $100,000 or more |
396,138 | 0.32 | 373,258 | 0.34 | 407,318 | 0.47 | ||||||||||||||||||
|
|
|
|
|
|
|
|
|
|
|
|
|
|||||||||||||
| Total interest-bearing deposits |
2,905,734 | 0.13 | % | 2,513,674 | 0.15 | % | 2,255,239 | 0.22 | % | |||||||||||||||
|
|
|
|
|
|
|
|
|
|
|
|
|
|||||||||||||
| Total average deposits |
$ | 4,346,859 | $ | 3,779,809 | $ | 3,388,101 | ||||||||||||||||||
|
|
|
|
|
|
|
|||||||||||||||||||
| As of December 31, 2014 |
||||
| Three months or less |
$ | 134,813 | ||
| Over three through six months |
109,890 | |||
| Over six through twelve months |
94,830 | |||
| Over twelve months |
45,016 | |||
|
|
|
|||
| Total time deposits of $100,000 or more |
$ | 384,549 | ||
|
|
|
|||
Short-Term Borrowings. Included in short-term borrowings were federal funds purchased, securities sold under repurchase agreements and advances from the FHLB of $367.11 million, $463.89 million and $259.70 million at December 31, 2014, 2013 and 2012, respectively. Securities sold under repurchase agreements are generally with significant customers of the Company that require short-term liquidity for their funds for which we pledge certain securities that have a fair value equal to at least the amount of the short-term borrowing. The average balances of federal funds purchased, securities sold under repurchase agreements and advances from the FHLB were $397.74 million, $400.55 million and $247.98 million in 2014, 2013 and 2012, respectively. The average rates paid on federal funds purchased, securities sold under repurchase agreements and advances from the FHLB were 0.07%, 0.09% and 0.09% in 2014, 2013 and 2012, respectively. The weighted average interest rate paid on federal funds purchased, securities sold under repurchase agreements and advances from the FHLB was 0.04%, 0.10% and 0.05% at December 31, 2014, 2013 and 2012, respectively. The highest amount of federal funds purchased, securities sold under repurchase agreements and advances from the FHLB at any month end during 2014, 2013 and 2012 was $497.31 million, $532.39 million and $263.35 million, respectively.
Capital Resources
We evaluate capital resources by our ability to maintain adequate regulatory capital ratios to do business in the banking industry. Issues related to capital resources arise primarily when we are growing at an accelerated rate but not retaining a significant amount of our profits or when we experience significant asset quality deterioration.
Total shareholders’ equity was $681.54 million, or 11.65% of total assets, at December 31, 2014, as compared to $587.65 million, or 11.25% of total assets, at December 31, 2013. During 2014, total shareholders’ equity averaged $639.74 million, or 11.78% of average assets, as compared to $573.39 million, or 11.95% of average assets, during 2013.
44
Table of Contents
Banking regulators measure capital adequacy by means of the risk-based capital ratios and leverage ratio. The risk-based capital rules provide for the weighting of assets and off-balance-sheet commitments and contingencies according to prescribed risk categories ranging from 0% to 100%. Regulatory capital is then divided by risk-weighted assets to determine the risk-adjusted capital ratios. The leverage ratio is computed by dividing shareholders’ equity less intangible assets by quarter-to-date average assets less intangible assets. Minimum regulatory ratios necessary to be designated “well capitalized” are a total risk-based capital ratio of 10.00%, a Tier 1 risked-based capital ratio of 6.00% and a leverage ratio of 5.00%. As of December 31, 2014, our total risk-based, Tier 1 risked-based and leverage capital ratios on a consolidated basis were 17.16%, 16.05% and 9.89%, respectively, as compared to total risk-based, Tier 1 risked-based and leverage capital ratios of 16.92%, 15.82% and 9.84% as of December 31, 2013. We believe by all measurements our capital ratios remain well above regulatory requirements to be considered “well capitalized” by the regulators.
Interest Rate Risk. Interest rate risk results when the maturity or repricing intervals of interest-earning assets and interest-bearing liabilities are different. Our exposure to interest rate risk is managed primarily through our strategy of selecting the types and terms of interest-earning assets and interest-bearing liabilities that generate favorable earnings while limiting the potential negative effects of changes in market interest rates. We use no off-balance-sheet financial instruments to manage interest rate risk.
Our subsidiary bank has an asset liability management committee that monitors interest rate risk and compliance with investment policies. The subsidiary bank utilizes an earnings simulation model as the primary quantitative tool in measuring the amount of interest rate risk associated with changing market rates. The model quantifies the effects of various interest rate scenarios on projected net interest income and net income over the next twelve months. The model measures the impact on net interest income relative to a base case scenario of hypothetical fluctuations in interest rates over the next twelve months. These simulations incorporate assumptions regarding balance sheet growth and mix, pricing and the repricing and maturity characteristics of the existing and projected balance sheet.
As of December 31, 2014, the model simulations projected that 100 and 200 basis point increases in interest rates would result in positive variances in net interest income of 0.89% and 1.17%, respectively, relative to the current financial statement structure over the next twelve months, while decreases in interest rates of 50 basis points would result in a negative variance in a net interest income of 3.18% relative to the current financial statement structure over the next twelve months. We consider the likelihood of a decrease in interest rates beyond 50 basis points after December 31, 2014 remote given current interest rate levels. These are good faith estimates and assume that the composition of our interest sensitive assets and liabilities existing at each year-end will remain constant over the relevant twelve month measurement period and that changes in market interest rates are instantaneous and sustained across the yield curve regardless of duration of pricing characteristics of specific assets or liabilities. Also, this analysis does not contemplate any actions that we might undertake in response to changes in market interest rates. We believe these estimates are not necessarily indicative of what actually could occur in the event of immediate interest rate increases or decreases of this magnitude. As interest-bearing assets and liabilities re-price in different time frames and proportions to market interest rate movements, various assumptions must be made based on historical relationships of these variables in reaching any conclusion. Since these correlations are based on competitive and market conditions, we anticipate that our future results will likely be different from the foregoing estimates, and such differences could be material.
Should we be unable to maintain a reasonable balance of maturities and repricing of our interest-earning assets and our interest-bearing liabilities, we could be required to dispose of our assets in an unfavorable manner or pay a higher than market rate to fund our activities. Our asset liability committee oversees and monitors this risk.
Liquidity
Liquidity is our ability to meet cash demands as they arise. Such needs can develop from loan demand, deposit withdrawals or acquisition opportunities. Potential obligations resulting from the issuance of standby letters of credit and commitments to fund future borrowings to our loan customers are other factors affecting our liquidity needs. Many of these obligations and commitments are expected to expire without being drawn upon; therefore the total commitment amounts do not necessarily represent future cash requirements affecting our liquidity position. The potential need for liquidity arising from these types of financial instruments is represented by the contractual
45
Table of Contents
notional amount of the instrument, as detailed in Tables 12 and 13. Asset liquidity is provided by cash and assets which are readily marketable or which will mature in the near future. Liquid assets include cash, federal funds sold, and short-term investments in time deposits in banks. Liquidity is also provided by access to funding sources, which include core depositors and correspondent banks that maintain accounts with and sell federal funds to our subsidiary bank. Other sources of funds include our ability to borrow from short-term sources, such as purchasing federal funds from correspondent banks, sales of securities under agreements to repurchase and advances from the FHLB, which amounted to $367.11 million at December 31, 2014, and an unfunded $25.00 million revolving line of credit established with Frost Bank, a nonaffiliated bank, which matures on June 30, 2015 (see next paragraph). Our subsidiary bank also has federal funds purchased lines of credit with two non-affiliated banks totaling $100.00 million. At December 31, 2014, there were no amounts drawn on these lines of credit. Our subsidiary bank also has available a line of credit with the FHLB totaling $901.01 million at December 31, 2014, secured by portions of our loan portfolio and certain investment securities. At December 31, 2014, $1.01 million in advances and $5.00 million in letters of credit issued by the FHLB were outstanding under these lines of credit. These letters of credit were pledged as collateral for public funds held by our subsidiary bank.
The Company renewed its loan agreement, effective June 30, 2013, with Frost Bank. Under the loan agreement, as renewed and amended, we are permitted to draw up to $25.00 million on a revolving line of credit. Prior to June 30, 2015, interest is paid quarterly at the Wall Street Journal Prime Rate and the line of credit matures June 30, 2015. If a balance exists at June 30, 2015, the principal balance converts to a term facility payable quarterly over five years and interest is paid quarterly at our election at the Wall Street Journal Prime Rate plus 50 basis points or LIBOR plus 250 basis points. The line of credit is unsecured. Among other provisions in the credit agreement, we must satisfy certain financial covenants during the term of the loan agreement, including, without limitation, covenants that require us to maintain certain capital, tangible net worth, loan loss reserve, non-performing asset and cash flow coverage ratio. In addition, the credit agreement contains certain operational covenants, which among others, restricts the payment of dividends above 55% of consolidated net income, limits the incurrence of debt (excluding any amounts acquired in an acquisition) and prohibits the disposal of assets except in the ordinary course of business. Since 1995, we have historically declared dividends as a percentage of consolidated net income in a range of 37% (low) in 1995 to 53% (high) in 2003 and 2006. The Company was in compliance with the financial and operational covenants at December 31, 2014. There was no outstanding balance under the line of credit as of December 31, 2014 or 2013.
In addition, we anticipate that any future acquisition of financial institutions, expansion of branch locations or offering of new products could also place a demand on our cash resources. Available cash and cash equivalents and securities at our parent company, which totaled $70.09 million at December 31, 2014, investment securities which totaled $12.24 million at December 31, 2014 which matures over 8 to 15 years, available dividends from our subsidiaries which totaled $93.16 million at December 31, 2014, utilization of available lines of credit, and future debt or equity offerings are expected to be the source of funding for potential acquisitions or expansions.
Given the strong core deposit base and relatively low loan to deposit ratios maintained at our subsidiary bank, we consider our current liquidity position to be adequate to meet our short-term and long-term liquidity needs.
Table 12 — Contractual Obligations as of December 31, 2014 (in thousands):
| Payment Due by Period | ||||||||||||||||||||
| Total Amounts | Less than 1 year |
2 - 3 years | 4 - 5 years | Over 5 years |
||||||||||||||||
| Deposits with stated maturity dates |
$ | 648,992 | $ | 565,794 | $ | 54,539 | $ | 28,659 | $ | — | ||||||||||
| Pension obligation |
8,971 | 784 | 1,660 | 1,773 | 4,754 | |||||||||||||||
| Operating leases |
1,549 | 640 | 815 | 94 | — | |||||||||||||||
| Outsourcing service contracts |
1,455 | 1,455 | — | — | — | |||||||||||||||
|
|
|
|
|
|
|
|
|
|
|
|||||||||||
| Total Contractual Obligations |
$ | 660,967 | $ | 568,673 | $ | 57,014 | $ | 30,526 | $ | 4,754 | ||||||||||
|
|
|
|
|
|
|
|
|
|
|
|||||||||||
Amounts above for deposits do not include related accrued interest.
Off-Balance Sheet Arrangements. We are a party to financial instruments with off-balance-sheet risk in the normal course of business to meet the financing needs of our customers. These financial instruments include
46
Table of Contents
unfunded lines of credit, commitments to extend credit and federal funds sold to correspondent banks and standby letters of credit. Those instruments involve, to varying degrees, elements of credit and interest rate risk in excess of the amount recognized in our consolidated balance sheets.
Our exposure to credit loss in the event of nonperformance by the counterparty to the financial instrument for unfunded lines of credit, commitments to extend credit and standby letters of credit is represented by the contractual notional amount of these instruments. We generally use the same credit policies in making commitments and conditional obligations as we do for on-balance-sheet instruments.
Unfunded lines of credit and commitments to extend credit are agreements to lend to a customer as long as there is no violation of any condition established in the contract. These commitments generally have fixed expiration dates or other termination clauses and may require payment of a fee. Since many of the commitments are expected to expire without being drawn upon, the total commitment amounts do not necessarily represent future cash requirements. We evaluate each customer’s creditworthiness on a case-by-case basis. The amount of collateral obtained, as we deem necessary upon extension of credit, is based on our credit evaluation of the counterparty. Collateral held varies but may include accounts receivable, inventory, property, plant and equipment and income-producing commercial properties.
Standby letters of credit are conditional commitments we issue to guarantee the performance of a customer to a third party. The credit risk involved in issuing letters of credit is essentially the same as that involved in extending loan facilities to customers. The average collateral value held on letters of credit usually exceeds the contract amount.
Table 13 – Commitments as of December 31, 2014 (in thousands):
| Total Notional Amounts Committed |
Less than 1 year |
2 - 3 years | 4 - 5 years | Over 5 years |
||||||||||||||||
| Unfunded lines of credit |
$ | 444,687 | $ | 420,454 | $ | 4,089 | $ | 9,179 | $ | 10,965 | ||||||||||
| Unfunded commitments to extend credit |
128,293 | 69,814 | 13,021 | 6,422 | 39,036 | |||||||||||||||
| Standby letters of credit |
31,301 | 24,333 | 3,901 | 17 | 3,050 | |||||||||||||||
|
|
|
|
|
|
|
|
|
|
|
|||||||||||
| Total Commercial Commitments |
$ | 604,281 | $ | 514,601 | $ | 21,011 | $ | 15,618 | $ | 53,051 | ||||||||||
|
|
|
|
|
|
|
|
|
|
|
|||||||||||
We believe we have no other off-balance sheet arrangements or transactions with unconsolidated, special purpose entities that would expose us to liability that is not reflected on the face of the financial statements.
Parent Company Funding. Our ability to fund various operating expenses, dividends, and cash acquisitions is generally dependent on our own earnings (without giving effect to our subsidiaries), cash reserves and funds derived from our subsidiaries. These funds historically have been produced by intercompany dividends and management fees that are limited to reimbursement of actual expenses. We anticipate that our recurring cash sources will continue to include dividends and management fees from our subsidiaries. At December 31, 2014, approximately $93.16 million was available for the payment of intercompany dividends by the subsidiaries without the prior approval of regulatory agencies. Our subsidiaries paid aggregate dividends of $34.00 million in 2014 and $64.20 million in 2013. The decrease in dividends in 2014 from subsidiaries was due to the Company’s desire to keep more capital at the subsidiary levels.
Dividends. Our long-term dividend policy is to pay cash dividends to our shareholders of approximately 40% of annual net earnings while maintaining adequate capital to support growth. We are also restricted by a loan covenant within our line of credit agreement with Frost Bank to dividend no greater than 55% of net income, as defined in such loan agreement. The cash dividend payout ratios have amounted to 39.34%, 41.62% and 41.99% of net earnings, respectively, in 2014, 2013 and 2012. Given our current capital position, projected earnings and asset growth rates, we do not anticipate any significant change in our current dividend policy.
Our bank subsidiary, which is a national banking association and a member of the Federal Reserve System, is required by federal law to obtain the prior approval of the OCC to declare and pay dividends if the total of all dividends declared in any calendar year would exceed the total of (1) such bank’s net profits (as defined and interpreted by regulation) for that year plus (2) its retained net profits (as defined and interpreted by regulation) for the preceding two calendar years, less any required transfers to surplus.
47
Table of Contents
To pay dividends, we and our subsidiary bank must maintain adequate capital above regulatory guidelines. In addition, if the applicable regulatory authority believes that a bank under its jurisdiction is engaged in or is about to engage in an unsafe or unsound practice (which, depending on the financial condition of the bank, could include the payment of dividends), the authority may require, after notice and hearing, that such bank cease and desist from the unsafe practice. The Federal Reserve, the FDIC and the OCC have each indicated that paying dividends that deplete a bank’s capital base to an inadequate level would be an unsafe and unsound banking practice. The Federal Reserve, the OCC and the FDIC have issued policy statements that recommend that bank holding companies and insured banks should generally only pay dividends out of current operating earnings.
| ITEM 7A. | QUANTITATIVE AND QUALITATIVE DISCLOSURES ABOUT MARKET RISK |
Management considers interest rate risk to be a significant market risk for the Company. See “Item 7—Management’s Discussion and Analysis of Financial Condition and Results of Operations—Capital Resources—Interest Rate Risk” for disclosure regarding this market risk.
| ITEM 8. | FINANCIAL STATEMENTS AND SUPPLEMENTARY DATA |
Our consolidated financial statements and the report of our independent registered public accounting firm begin on page F-1.
48
Table of Contents
Quarterly Results of Operations (in thousands, except per share and common stock data):
The following tables set forth certain unaudited historical quarterly financial data for each of the eight consecutive quarters in the fiscal years of 2014 and 2013. This information is derived from unaudited consolidated financial statements that include, in our opinion, all adjustments (consisting of normal recurring adjustments) necessary for a fair presentation when read in conjunction with our consolidated financial statements and notes thereto included elsewhere in this Form 10-K.
| 2014 | ||||||||||||||||
| 4th | 3rd | 2nd | 1st | |||||||||||||
| (dollars in thousands, except per share amounts) | ||||||||||||||||
| Summary Income Statement Information: |
||||||||||||||||
| Interest income |
$ | 51,121 | $ | 49,955 | $ | 49,254 | $ | 48,209 | ||||||||
| Interest expense |
1,039 | 1,069 | 1,037 | 1,036 | ||||||||||||
|
|
|
|
|
|
|
|
|
|||||||||
| Net interest income |
50,082 | 48,886 | 48,217 | 47,173 | ||||||||||||
| Provision for loan losses |
755 | 896 | 1,124 | 1,690 | ||||||||||||
|
|
|
|
|
|
|
|
|
|||||||||
| Net interest income after provision for loan losses |
49,327 | 47,990 | 47,093 | 45,483 | ||||||||||||
| Noninterest income |
17,023 | 17,323 | 15,873 | 16,409 | ||||||||||||
| Net gain (loss) on securities transactions |
— | 1 | (1 | ) | (4 | ) | ||||||||||
| Noninterest expense |
36,435 | 34,040 | 35,002 | 32,448 | ||||||||||||
|
|
|
|
|
|
|
|
|
|||||||||
| Earnings before income taxes |
29,915 | 31,274 | 27,963 | 29,440 | ||||||||||||
| Income tax expense |
7,328 | 7,843 | 6,758 | 7,104 | ||||||||||||
|
|
|
|
|
|
|
|
|
|||||||||
| Net earnings |
$ | 22,587 | $ | 23,431 | $ | 21,205 | $ | 22,336 | ||||||||
|
|
|
|
|
|
|
|
|
|||||||||
| Per Share Data: |
||||||||||||||||
| Earnings per share, basic |
$ | 0.35 | $ | 0.37 | $ | 0.33 | $ | 0.35 | ||||||||
| Earnings per share, assuming dilution |
0.35 | 0.36 | 0.33 | 0.35 | ||||||||||||
| Cash dividends declared |
0.14 | 0.14 | 0.14 | 0.13 | ||||||||||||
| Book value at period-end |
10.63 | 10.28 | 9.99 | 9.63 | ||||||||||||
| Common stock sales price: |
||||||||||||||||
| High |
$ | 32.34 | $ | 32.54 | $ | 32.30 | $ | 33.47 | ||||||||
| Low |
26.58 | 27.72 | 28.48 | 28.61 | ||||||||||||
| Close |
29.88 | 27.79 | 31.37 | 30.90 | ||||||||||||
49
Table of Contents
| 2013 | ||||||||||||||||
| 4th | 3rd | 2nd | 1st | |||||||||||||
| (dollars in thousands, except per share amounts) | ||||||||||||||||
| Summary Income Statement Information: |
||||||||||||||||
| Interest income |
$ | 47,756 | $ | 46,655 | $ | 42,446 | $ | 39,575 | ||||||||
| Interest expense |
1,066 | 1,164 | 946 | 904 | ||||||||||||
|
|
|
|
|
|
|
|
|
|||||||||
| Net interest income |
46,690 | 45,491 | 41,500 | 38,671 | ||||||||||||
| Provision for loan losses |
1,171 | 1,349 | 832 | 401 | ||||||||||||
|
|
|
|
|
|
|
|
|
|||||||||
| Net interest income after provision for loan losses |
45,519 | 44,142 | 40,668 | 38,270 | ||||||||||||
| Noninterest income |
15,792 | 17,183 | 15,120 | 13,738 | ||||||||||||
| Net gain (loss) on securities transactions |
— | (108 | ) | 33 | 222 | |||||||||||
| Noninterest expense |
33,096 | 35,534 | 29,911 | 27,471 | ||||||||||||
|
|
|
|
|
|
|
|
|
|||||||||
| Earnings before income taxes |
28,215 | 25,683 | 25,910 | 24,759 | ||||||||||||
| Income tax expense |
6,977 | 6,121 | 6,420 | 6,182 | ||||||||||||
|
|
|
|
|
|
|
|
|
|||||||||
| Net earnings |
$ | 21,238 | $ | 19,562 | $ | 19,490 | $ | 18,577 | ||||||||
|
|
|
|
|
|
|
|
|
|||||||||
| Per Share Data: |
||||||||||||||||
| Earnings per share, basic |
$ | 0.33 | $ | 0.31 | $ | 0.31 | $ | 0.30 | ||||||||
| Earnings per share, assuming dilution |
0.33 | 0.31 | 0.31 | 0.30 | ||||||||||||
| Cash dividends declared |
0.13 | 0.13 | 0.13 | 0.13 | ||||||||||||
| Book value at period-end |
9.19 | 8.89 | 9.01 | 8.95 | ||||||||||||
| Common stock sales price: |
||||||||||||||||
| High |
$ | 33.76 | $ | 32.00 | $ | 28.45 | $ | 24.50 | ||||||||
| Low |
28.26 | 27.84 | 22.96 | 19.93 | ||||||||||||
| Close |
33.06 | 29.43 | 27.83 | 24.30 | ||||||||||||
| ITEM 9. | CHANGES IN AND DISAGREEMENTS WITH ACCOUNTANTS ON ACCOUNTING AND FINANCIAL DISCLOSURE |
None.
| ITEM 9A. | CONTROLS AND PROCEDURES |
As of December 31, 2014, we carried out an evaluation, under the supervision and with the participation of our management, including our principal executive officer and principal financial officer, of the effectiveness of the design and operation of our disclosure controls and procedures (as defined in Rule 13a-15(e) or 15d-15(e) of the Securities Exchange Act of 1934). Our management, which includes our principal executive officer and our principal financial officer, does not expect that our disclosure controls and procedures will prevent all errors and all fraud.
A control system, no matter how well conceived and operated, can provide only reasonable, not absolute, assurance that the objectives of the control system are met. Further, the design of a control system must reflect the fact that there are resource constraints, and the benefits of controls must be considered relative to their costs. Because of the inherent limitations in all control systems, no evaluation of controls can provide absolute assurance that all control issues and instances of fraud, if any, within the Company have been detected. These inherent limitations include the realities that judgments in decision-making can be faulty and that breakdowns can occur because of simple error or mistake. Additionally, controls can be circumvented by the individual acts of some persons, by collusion of two or more people, or by management override of the control. The design of any system of controls also is based in part upon certain assumptions about the likelihood of future events, and there can be no assurance that any design will succeed in achieving its stated goals under all potential future conditions; over time, controls may become inadequate because of changes in conditions or the degree of compliance with the policies or procedures may deteriorate. Because of the inherent limitations in a cost-effective control system, misstatements due to error or fraud may occur and not be detected. Our principal executive officer and principal financial officer have concluded, based on our evaluation of our disclosure controls and procedures, that our disclosure controls and procedures were effective at the reasonable assurance level as of December 31, 2014.
50
Table of Contents
There were no changes in our internal control over financial reporting that occurred during the quarter ended December 31, 2014, that has materially affected, or is reasonably likely to materially affect, our internal control over financial reporting.
MANAGEMENT’S REPORT ON INTERNAL CONTROL OVER FINANCIAL REPORTING
The management of First Financial Bankshares, Inc. and subsidiaries is responsible for establishing and maintaining adequate internal control over financial reporting. First Financial Bankshares, Inc. and subsidiaries’ internal control system was designed to provide reasonable assurance to the Company’s management and board of directors regarding the reliability of financial reporting and the preparation of financial statements for external purposes in accordance with generally accepted accounting principles.
All internal control systems, no matter how well designed, have inherent limitations. Therefore, even those systems determined to be effective can provide only reasonable assurance with respect to financial statement preparation and presentation.
First Financial Bankshares, Inc. and subsidiaries’ management assessed the effectiveness of the Company’s internal control over financial reporting as of December 31, 2014. In making this assessment, it used the criteria for effective internal control over financial reporting set forth by the Committee of Sponsoring Organizations of the Treadway Commission (2013 Framework) (COSO) in Internal Control – Integrated Framework. Based on our assessment we believe that, as of December 31, 2014, the Company’s internal control over financial reporting, as such term is defined in Rule 13a-15(f) of the Securities Exchange Act of 1934, is effective based on those criteria.
First Financial Bankshares, Inc. and subsidiaries’ independent auditors have issued an audit report, dated February 20, 2015, on the effectiveness of the Company’s internal control over financial reporting as of December 31, 2014.
REPORT OF INDEPENDENT REGISTERED PUBLIC ACCOUNTING FIRM
To the Board of Directors and Shareholders of
First Financial Bankshares, Inc.
We have audited First Financial Bankshares, Inc. and subsidiaries’ internal control over financial reporting as of December 31, 2014, based on criteria established in Internal Control-Integrated Framework issued by the Committee of Sponsoring Organizations of the Treadway Commission (2013 Framework) (the COSO criteria). First Financial Bankshares, Inc. and subsidiaries’ management is responsible for maintaining effective internal control over financial reporting, and for its assessment of the effectiveness of internal control over financial reporting included in the accompanying Management’s Report on Internal Control over Financial Reporting. Our responsibility is to express an opinion on the company’s internal control over financial reporting based on our audit.
We conducted our audit in accordance with the standards of the Public Company Accounting Oversight Board (United States). Those standards require that we plan and perform the audit to obtain reasonable assurance about whether effective internal control over financial reporting was maintained in all material respects. Our audit included obtaining an understanding of internal control over financial reporting, assessing the risk that a material weakness exists, testing and evaluating the design and operating effectiveness of internal control based on the assessed risk, and performing such other procedures as we considered necessary in the circumstances. We believe that our audit provides a reasonable basis for our opinion.
A company’s internal control over financial reporting is a process designed to provide reasonable assurance regarding the reliability of financial reporting and the preparation of financial statements for external purposes in accordance with generally accepted accounting principles. A company’s internal control over financial reporting includes those policies and procedures that (1) pertain to the maintenance of records that, in reasonable detail, accurately and fairly reflect the transactions and dispositions of the assets of the company; (2) provide reasonable assurance that transactions are recorded as necessary to permit preparation of financial statements in accordance
51
Table of Contents
with generally accepted accounting principles, and that receipts and expenditures of the company are being made only in accordance with authorizations of management and directors of the company; and (3) provide reasonable assurance regarding prevention or timely detection of unauthorized acquisition, use, or disposition of the company’s assets that could have a material effect on the financial statements.
Because of its inherent limitations, internal control over financial reporting may not prevent or detect misstatements. Also, projections of any evaluation of effectiveness to future periods are subject to the risk that controls may become inadequate because of changes in conditions, or that the degree of compliance with the policies or procedures may deteriorate.
In our opinion, First Financial Bankshares, Inc. and subsidiaries maintained, in all material respects, effective internal control over financial reporting as of December 31, 2014, based on the COSO criteria.
We also have audited, in accordance with the standards of the Public Company Accounting Oversight Board (United States), the 2014 consolidated financial statements of First Financial Bankshares, Inc. and subsidiaries and our report dated February 20, 2015 expressed an unqualified opinion thereon.
/s/ Ernst & Young LLP
Dallas, Texas
February 20, 2015
| ITEM 9B. | OTHER INFORMATION |
None.
52
Table of Contents
PART III
| ITEM 10. | DIRECTORS, EXECUTIVE OFFICERS AND CORPORATE GOVERNANCE |
The information required by Item 10 is hereby incorporated by reference from our proxy statement for our 2015 annual meeting of shareholders which will be filed with the SEC not later than 120 days after December 31, 2014.
| ITEM 11. | EXECUTIVE COMPENSATION |
The information required by Item 11 is hereby incorporated by reference from our proxy statement for our 2015 annual meeting of shareholders which will be filed with the SEC not later than 120 days after December 31, 2014.
| ITEM 12. | SECURITY OWNERSHIP OF CERTAIN BENEFICIAL OWNERS AND MANAGEMENT AND RELATED STOCKHOLDER MATTERS |
The information required by Item 12 related to security ownership of certain beneficial owners and management is hereby incorporated by reference from our proxy statement for our 2015 annual meeting of shareholders. The following chart gives aggregate information under our equity compensation plans as of December 31, 2014.
| Number of Securities To be Issued Upon Exercise of Outstanding Options, Warrants and Rights |
Weighted Average Exercise Price of Outstanding Options, Warrants and Rights |
Number of Securities Remaining Available For Future Issuance Under Equity Compensation Plans (Excluding Securities Reflected in Far Left Column) |
||||||||||
| Equity compensation plans approved by security holders |
927,677 | $ | 21.69 | 2,625,600 | ||||||||
| Equity compensation plans not approved by security holders |
— | — | — | |||||||||
|
|
|
|
|
|
|
|||||||
| Total |
927,677 | $ | 21.69 | 2,625,600 | ||||||||
|
|
|
|
|
|
|
|||||||
The remainder of the information required by Item 12 is incorporated by reference from our proxy statement for our 2015 annual meeting of shareholders.
| ITEM 13. | CERTAIN RELATIONSHIPS AND RELATED TRANSACTIONS, AND DIRECTOR INDEPENDENCE |
The information required by Item 13 is hereby incorporated by reference from our proxy statement for our 2015 annual meeting of shareholders which will be filed with the SEC not later than 120 days after December 31, 2014.
| ITEM 14. | PRINCIPAL ACCOUNTANT FEES AND SERVICES |
The information required by Item 14 is hereby incorporated by reference from our proxy statement for our 2015 annual meeting of shareholders which will be filed with the SEC not later than 120 days after December 31, 2014.
53
Table of Contents
PART IV
| ITEM 15. | EXHIBITS, FINANCIAL STATEMENT SCHEDULES |
| (a) | The following documents are filed as part of this report: |
| (1) | Financial Statements: |
Report of Independent Registered Public Accounting Firm
Consolidated Balance Sheets as of December 31, 2014 and 2013
Consolidated Statements of Earnings for the years ended December 31, 2014, 2013 and 2012
Consolidated Statements of Comprehensive Earnings for the years ended December 31, 2014, 2013 and 2012
Consolidated Statements of Shareholders’ Equity for the years ended December 31, 2014, 2013 and 2012
Consolidated Statements of Cash Flows for the years ended December 31, 2014, 2013 and 2012
Notes to the Consolidated Financial Statements
| (2) | Financial Statement Schedules: |
These schedules have been omitted because they are not required, are not applicable or have been included in our consolidated financial statements.
| (3) | Exhibits: |
The information required by this Item 15(a)(3) is set forth in the Exhibit Index immediately following our signature pages. The exhibits listed herein will be furnished upon written request to J. Bruce Hildebrand, Executive Vice President, First Financial Bankshares, Inc., 400 Pine Street, Abilene, Texas 79601, and payment of a reasonable fee that will be limited to our reasonable expense in furnishing such exhibits.
54
Table of Contents
Pursuant to the requirements of Section 13 or 15(d) of the Securities Exchange Act of 1934, the Registrant has duly caused this report to be signed on its behalf by the undersigned, thereunto duly authorized.
| FIRST FINANCIAL BANKSHARES, INC. | ||||||
| Date: February 20, 2015 | By: | /s/ F. SCOTT DUESER | ||||
| F. SCOTT DUESER | ||||||
| Chairman of the Board, Director, President and Chief Executive Officer | ||||||
| (Principal Executive Officer) | ||||||
The undersigned directors and officers of First Financial Bankshares, Inc. hereby constitute and appoint J. Bruce Hildebrand, with full power to act and with full power of substitution and resubstitution, our true and lawful attorney-in-fact with full power to execute in our name and behalf in the capacities indicated below any and all amendments to this report and to file the same, with all exhibits thereto and other documents in connection therewith with the Securities and Exchange Commission and hereby ratify and confirm all that such attorney-in-fact or his substitute shall lawfully do or cause to be done by virtue hereof.
Pursuant to the requirements of the Securities Exchange Act of 1934, this report has been signed below by the following persons on behalf of the registrant and in the capacities and on the dates indicated.
| Name |
Title |
Date | ||
| /s/ F. SCOTT DUESER F. Scott Dueser |
Chairman of the Board, Director, President, and Chief Executive Officer (Principal Executive Officer) |
February 20, 2015 | ||
| /s/ J. BRUCE HILDEBRAND J. Bruce Hildebrand |
Executive Vice President and Chief Financial Officer (Principal Financial Officer and Principal Accounting Officer) |
February 20, 2015 | ||
| /s/ STEVEN L. BEAL Steven L. Beal |
Director | February 20, 2015 | ||
| /s/ TUCKER S. BRIDWELL Tucker S. Bridwell |
Director | February 20, 2015 | ||
| /s/ DAVID COPELAND David Copeland |
Director | February 20, 2015 | ||
| /s/ MURRAY EDWARDS Murray Edwards |
Director | February 20, 2015 | ||
55
Table of Contents
| Name |
Title |
Date | ||
| /s/ RON GIDDIENS Ron Giddiens |
Director | February 20, 2015 | ||
| /s/ TIM LANCASTER Tim Lancaster |
Director | February 20, 2015 | ||
| /s/ KADE L. MATTHEWS Kade L. Matthews |
Director | February 20, 2015 | ||
| /s/ ROSS H. SMITH, JR. Ross H. Smith, Jr. |
Director | February 20, 2015 | ||
| /s/ JOHNNY TROTTER Johnny Trotter |
Director | February 20, 2015 | ||
56
Table of Contents
The following exhibits are filed as part of this report:
| 2.1 | — | Agreement and Plan of Merger between First Financial Bankshares, Inc., First Financial Bank, N.A., OSB Financial Services, Inc. and Orange Savings Bank, SSB, dated as of February 20, 2013 (Schedules have been omitted pursuant to Item 601(b)(2) of Regulation S-K) (incorporated by reference from Exhibit 2.1 to Registrant’s Form 8-K filed February 26, 2013). | ||
| 3.1 | — | Amended and Restated Certificate of Formation (incorporated by reference from Exhibit 3.1 of the Registrant’s Form 8-K filed April 25, 2012). | ||
| 3.2 | — | Amended and Restated Bylaws of the Registrant (incorporated by reference from Exhibit 3.2 of the Registrant’s Form 8-K filed January 24, 2012). | ||
| 4.1 | — | Specimen certificate of First Financial Common Stock (incorporated by reference from Exhibit 3 of the Registrant’s Amendment No. 1 to Form 8-A filed on Form 8-A/A No. 1 on January 7, 1994). | ||
| 10.1 | — | Executive Recognition Agreement (incorporated by reference from Exhibit 10.1 of the Registrant’s Form 8-K Report filed June 30, 2014). | ||
| 10.2 | — | 2002 Incentive Stock Option Plan (incorporated by reference from Exhibit 10.3 of the Registrant’s Form 10-Q filed May 4, 2010). | ||
| 10.3 | — | 2012 Incentive Stock Option Plan (incorporated by reference from Appendix A of the Registrant’s Definitive Proxy Statement Pursuant to Section 14(a) of the Securities Exchange Act of 1934 filed March 1, 2012). | ||
| 10.4 | — | Loan Agreement dated June 30, 2013, between First Financial Bankshares, Inc. and Frost Bank (incorporated by reference from Exhibit 10.1 of the Registrant’s Form 8-K filed July 1, 2013). | ||
| 21.1 | — | Subsidiaries of the Registrant.* | ||
| 23.1 | — | Consent of Ernst & Young LLP.* | ||
| 24.1 | — | Power of Attorney (included on signature page of this Form 10-K).* | ||
| 31.1 | — | Rule 13a-14(a) / 15(d)-14(a) Certification of Chief Executive Officer of First Financial Bankshares, Inc.* | ||
| 31.2 | — | Rule 13a-14(a) / 15(d)-14(a) Certification of Chief Financial Officer of First Financial Bankshares, Inc.* | ||
| 32.1 | — | Section 1350 Certification of Chief Executive Officer of First Financial Bankshares, Inc.* | ||
| 32.2 | — | Section 1350 Certification of Chief Financial Officer of First Financial Bankshares, Inc.* | ||
| 101.INS | — | XBRL Instance Document.* | ||
| 101.SCH | — | XBRL Taxonomy Extension Schema Document.* | ||
| 101.CAL | — | XBRL Taxonomy Extension Calculation Linkbase Document.* | ||
| 101.DEF | — | XBRL Taxonomy Extension Definition Linkbase Document.* | ||
| 101.LAB | — | XBRL Taxonomy Extension Label Linkbase Document.* | ||
| 101.PRE | — | XBRL Taxonomy Extension Presentation Linkbase Document.* | ||
| * | Filed herewith |
57
Table of Contents
REPORT OF INDEPENDENT REGISTERED PUBLIC ACCOUNTING FIRM
To the Board of Directors and Shareholders of
First Financial Bankshares, Inc.
We have audited the accompanying consolidated balance sheets of First Financial Bankshares, Inc. (a Texas corporation) and subsidiaries as of December 31, 2014 and 2013, and the related consolidated statements of earnings, comprehensive earnings, shareholders’ equity, and cash flows for each of the three years in the period ended December 31, 2014. These financial statements are the responsibility of the Company’s management. Our responsibility is to express an opinion on these financial statements based on our audits.
We conducted our audits in accordance with the standards of the Public Company Accounting Oversight Board (United States). Those standards require that we plan and perform the audit to obtain reasonable assurance about whether the financial statements are free of material misstatement. An audit includes examining, on a test basis, evidence supporting the amounts and disclosures in the financial statements. An audit also includes assessing the accounting principles used and significant estimates made by management, as well as evaluating the overall financial statement presentation. We believe that our audits provide a reasonable basis for our opinion.
In our opinion, the financial statements referred to above present fairly, in all material respects, the consolidated financial position of First Financial Bankshares, Inc. and subsidiaries at December 31, 2014 and 2013, and the consolidated results of their operations and their cash flows for each of the three years in the period ended December 31, 2014, in conformity with U. S. generally accepted accounting principles.
We also have audited, in accordance with the standards of the Public Company Accounting Oversight Board (United States), First Financial Bankshares, Inc.’s internal control over financial reporting as of December 31, 2014, based on criteria established in Internal Control-Integrated Framework issued by the Committee of Sponsoring Organizations of the Treadway Commission (2013 Framework) and our report dated February 20, 2015, expressed an unqualified opinion thereon.
/s/ Ernst & Young LLP
Dallas, Texas
February 20, 2015
F-1
Table of Contents
FIRST FINANCIAL BANKSHARES, INC. AND SUBSIDIARIES
Consolidated Balance Sheets
December 31, 2014 and 2013
(Dollars in thousands, except share and per share amounts)
| 2014 | 2013 | |||||||
| ASSETS |
||||||||
| CASH AND DUE FROM BANKS |
$ | 190,387 | $ | 183,084 | ||||
| FEDERAL FUNDS SOLD |
8,760 | 3,430 | ||||||
| INTEREST-BEARING DEPOSITS IN BANKS |
54,324 | 25,498 | ||||||
|
|
|
|
|
|||||
| Total cash and cash equivalents |
253,471 | 212,012 | ||||||
| INTEREST-BEARING TIME DEPOSITS IN BANKS |
17,002 | 31,917 | ||||||
| SECURITIES AVAILABLE-FOR-SALE, at fair value |
2,415,856 | 2,057,723 | ||||||
| SECURITIES HELD-TO-MATURITY (fair value of $447 and $694 at December 31, 2014 and 2013, respectively) |
441 | 684 | ||||||
| LOANS: |
||||||||
| Held for investment |
2,929,188 | 2,684,285 | ||||||
| Less – allowance for loan losses |
(36,824 | ) | (33,900 | ) | ||||
|
|
|
|
|
|||||
| Net loans held for investment |
2,892,364 | 2,650,385 | ||||||
| Held for sale |
8,803 | 5,163 | ||||||
|
|
|
|
|
|||||
| Net loans |
2,901,167 | 2,655,548 | ||||||
| BANK PREMISES AND EQUIPMENT, net |
103,000 | 95,505 | ||||||
| INTANGIBLE ASSETS |
97,359 | 97,485 | ||||||
| OTHER ASSETS |
59,906 | 71,334 | ||||||
|
|
|
|
|
|||||
| Total assets |
$ | 5,848,202 | $ | 5,222,208 | ||||
|
|
|
|
|
|||||
| LIABILITIES AND SHAREHOLDERS’ EQUITY |
||||||||
| NONINTEREST-BEARING DEPOSITS |
$ | 1,570,330 | $ | 1,362,184 | ||||
| INTEREST-BEARING DEPOSITS |
3,179,925 | 2,772,891 | ||||||
|
|
|
|
|
|||||
| Total deposits |
4,750,255 | 4,135,075 | ||||||
| DIVIDENDS PAYABLE |
8,972 | 8,318 | ||||||
| SHORT-TERM BORROWINGS |
367,110 | 463,888 | ||||||
| OTHER LIABILITIES |
40,328 | 27,280 | ||||||
|
|
|
|
|
|||||
| Total liabilities |
5,166,665 | 4,634,561 | ||||||
|
|
|
|
|
|||||
| COMMITMENTS AND CONTINGENCIES |
||||||||
| SHAREHOLDERS’ EQUITY: |
||||||||
| Common stock - $0.01 par value; authorized 80,000,000 shares; 64,089,921 and 31,922,497 shares issued at December 31, 2014 and 2013, respectively |
641 | 320 | ||||||
| Capital surplus |
305,429 | 302,991 | ||||||
| Retained earnings |
327,978 | 273,972 | ||||||
| Treasury stock (shares at cost: 529,563 and 269,467 at December 31, 2014 and 2013, respectively) |
(5,878 | ) | (5,490 | ) | ||||
| Deferred Compensation |
5,878 | 5,490 | ||||||
| Accumulated other comprehensive earnings |
47,489 | 10,364 | ||||||
|
|
|
|
|
|||||
| Total shareholders’ equity |
681,537 | 587,647 | ||||||
|
|
|
|
|
|||||
| Total liabilities and shareholders’ equity |
$ | 5,848,202 | $ | 5,222,208 | ||||
|
|
|
|
|
|||||
The accompanying notes are an integral part of these consolidated financial statements.
F-2
Table of Contents
FIRST FINANCIAL BANKSHARES, INC. AND SUBSIDIARIES
Consolidated Statements of Earnings
Years Ended December 31, 2014, 2013 and 2012
(Dollars in thousands, except per share amounts)
| 2014 | 2013 | 2012 | ||||||||||
| INTEREST INCOME: |
||||||||||||
| Interest and fees on loans |
$ | 136,684 | $ | 121,512 | $ | 102,172 | ||||||
| Interest on investment securities: |
||||||||||||
| Taxable |
28,402 | 25,505 | 31,318 | |||||||||
| Exempt from federal income tax |
33,081 | 28,843 | 25,552 | |||||||||
| Interest on federal funds sold and interest-bearing deposits in banks |
372 | 509 | 754 | |||||||||
|
|
|
|
|
|
|
|||||||
| Total interest income |
198,539 | 176,369 | 159,796 | |||||||||
|
|
|
|
|
|
|
|||||||
| INTEREST EXPENSE: |
||||||||||||
| Interest on deposits |
3,883 | 3,709 | 4,877 | |||||||||
| Other |
298 | 379 | 235 | |||||||||
|
|
|
|
|
|
|
|||||||
| Total interest expense |
4,181 | 4,088 | 5,112 | |||||||||
|
|
|
|
|
|
|
|||||||
| Net interest income |
194,358 | 172,281 | 154,684 | |||||||||
| PROVISION FOR LOAN LOSSES |
4,465 | 3,753 | 3,484 | |||||||||
|
|
|
|
|
|
|
|||||||
| Net interest income after provision for loan losses |
189,893 | 168,528 | 151,200 | |||||||||
|
|
|
|
|
|
|
|||||||
| NONINTEREST INCOME: |
||||||||||||
| Trust fees |
18,766 | 16,317 | 14,464 | |||||||||
| Service charges on deposit accounts |
16,910 | 17,546 | 16,693 | |||||||||
| ATM, interchange and credit card fees |
19,427 | 16,750 | 15,187 | |||||||||
| Real estate mortgage operations |
5,639 | 6,349 | 5,094 | |||||||||
| Net gain (loss) on sale of available-for-sale securities (includes ($4), $147 and $2,772 for the years ended December 31, 2014, 2013 and 2012, respectively, related to accumulated comprehensive earnings reclassifications) |
(4 | ) | 147 | 2,772 | ||||||||
| Net gain (loss) on sale of foreclosed assets |
904 | (152 | ) | (350 | ) | |||||||
| Other |
4,982 | 5,095 | 3,349 | |||||||||
|
|
|
|
|
|
|
|||||||
| Total noninterest income |
66,624 | 62,052 | 57,209 | |||||||||
|
|
|
|
|
|
|
|||||||
| NONINTEREST EXPENSE: |
||||||||||||
| Salaries and employee benefits |
70,456 | 66,529 | 58,269 | |||||||||
| Loss from partial settlement of pension plan |
2,909 | — | — | |||||||||
| Net occupancy expense |
9,100 | 8,095 | 7,076 | |||||||||
| Equipment expense |
10,740 | 9,673 | 8,790 | |||||||||
| FDIC insurance premiums |
2,725 | 2,418 | 2,220 | |||||||||
| ATM, interchange and credit card expenses |
6,870 | 5,660 | 5,448 | |||||||||
| Professional and service fees |
4,295 | 4,143 | 3,044 | |||||||||
| Printing, stationery and supplies |
2,637 | 2,066 | 1,970 | |||||||||
| Amortization of intangible assets |
275 | 197 | 149 | |||||||||
| Other |
27,918 | 27,231 | 22,083 | |||||||||
|
|
|
|
|
|
|
|||||||
| Total noninterest expense |
137,925 | 126,012 | 109,049 | |||||||||
|
|
|
|
|
|
|
|||||||
| EARNINGS BEFORE INCOME TAXES |
118,592 | 104,568 | 99,360 | |||||||||
| INCOME TAX EXPENSE (includes ($1), $51 and $970 for the years ended December 31, 2014, 2013 and 2012, respectively, related to income tax expense from reclassification items) |
29,033 | 25,700 | 25,135 | |||||||||
|
|
|
|
|
|
|
|||||||
| NET EARNINGS |
$ | 89,559 | $ | 78,868 | $ | 74,225 | ||||||
|
|
|
|
|
|
|
|||||||
| NET EARNINGS PER SHARE, BASIC |
$ | 1.40 | $ | 1.24 | $ | 1.18 | ||||||
|
|
|
|
|
|
|
|||||||
| NET EARNINGS PER SHARE, ASSUMING DILUTION |
$ | 1.39 | $ | 1.24 | $ | 1.18 | ||||||
|
|
|
|
|
|
|
|||||||
The accompanying notes are an integral part of these consolidated financial statements.
F-3
Table of Contents
FIRST FINANCIAL BANKSHARES, INC. AND SUBSIDIARIES
Consolidated Statements of Comprehensive Earnings
Years Ended December 31, 2014, 2013 and 2012
(Dollars in thousands)
| 2014 | 2013 | 2012 | ||||||||||
| NET EARNINGS |
$ | 89,559 | $ | 78,868 | $ | 74,225 | ||||||
| OTHER ITEMS OF COMPREHENSIVE EARNINGS (LOSS): |
||||||||||||
| Change in unrealized gain (loss) on investment securities available-for-sale, before income tax |
54,571 | (69,054 | ) | 10,619 | ||||||||
| Reclassification adjustment for realized losses (gains) on investment securities included in net earnings, before income tax |
4 | (147 | ) | (2,772 | ) | |||||||
| Minimum liability pension adjustment, before income tax |
2,540 | 6,209 | (1,564 | ) | ||||||||
|
|
|
|
|
|
|
|||||||
| Total other items of comprehensive earnings (losses) |
57,115 | (62,992 | ) | 6,283 | ||||||||
| Income tax benefit (expense) related to: |
||||||||||||
| Investment securities |
(19,101 | ) | 24,220 | (2,746 | ) | |||||||
| Minimum liability pension adjustment |
(889 | ) | (2,173 | ) | 547 | |||||||
|
|
|
|
|
|
|
|||||||
| Total income tax benefit (expense) |
(19,990 | ) | 22,047 | (2,199 | ) | |||||||
|
|
|
|
|
|
|
|||||||
| COMPREHENSIVE EARNINGS |
$ | 126,684 | $ | 37,923 | $ | 78,309 | ||||||
|
|
|
|
|
|
|
|||||||
The accompanying notes are an integral part of these consolidated financial statements.
F-4
Table of Contents
FIRST FINANCIAL BANKSHARES, INC. AND SUBSIDIARIES
Consolidated Statements of Shareholders’ Equity
Years Ended December 31, 2014, 2013 and 2012
(Dollars in thousands, except per share amounts)
| Common Stock | Capital Surplus |
Retained Earnings |
Treasury Stock | Deferred Compensation |
Accumulated Other Comprehensive Earnings (Losses) |
Total Shareholders’ Equity |
||||||||||||||||||||||||||||||
| Shares | Amount | Shares | Amounts | |||||||||||||||||||||||||||||||||
| BALANCE, December 31, 2011 |
31,459,635 | $ | 314 | $ | 276,127 | $ | 184,871 | (258,235 | ) | $ | (4,597 | ) | $ | 4,597 | $ | 47,225 | $ | 508,537 | ||||||||||||||||||
| Net earnings |
— | — | — | 74,225 | — | — | — | — | 74,225 | |||||||||||||||||||||||||||
| Stock option exercises |
37,246 | 1 | 824 | — | — | — | — | — | 825 | |||||||||||||||||||||||||||
| Cash dividends declared, $0.50 per share |
— | — | — | (31,169 | ) | — | — | — | — | (31,169 | ) | |||||||||||||||||||||||||
| Minimum liability pension adjustment, net of related income taxes |
— | — | — | — | — | — | — | (1,017 | ) | (1,017 | ) | |||||||||||||||||||||||||
| Change in unrealized gain on investment insecurities available-for-sale, net of related income taxes |
— | — | — | — | — | — | — | 5,101 | 5,101 | |||||||||||||||||||||||||||
| Additional tax benefit related to directors’ deferred compensation plan |
— | — | 127 | — | — | — | — | — | 127 | |||||||||||||||||||||||||||
| Shares purchased in connection with directors’ deferred compensation plan, net |
— | — | — | — | (8,610 | ) | (410 | ) | 410 | — | — | |||||||||||||||||||||||||
| Stock option expense |
— | — | 334 | — | — | — | — | — | 334 | |||||||||||||||||||||||||||
|
|
|
|
|
|
|
|
|
|
|
|
|
|
|
|
|
|
|
|||||||||||||||||||
| BALANCE, December 31, 2012 |
31,496,881 | 315 | 277,412 | 227,927 | (266,845 | ) | (5,007 | ) | 5,007 | 51,309 | 556,963 | |||||||||||||||||||||||||
|
|
|
|
|
|
|
|
|
|
|
|
|
|
|
|
|
|
|
|||||||||||||||||||
| Net earnings |
— | — | — | 78,868 | — | — | — | — | 78,868 | |||||||||||||||||||||||||||
| Stock issued in acquisition of Orange Savings Bank, SSB |
420,000 | 4 | 23,096 | — | — | — | — | — | 23,100 | |||||||||||||||||||||||||||
| Stock option exercises |
75,616 | 1 | 1,957 | — | — | — | — | — | 1,958 | |||||||||||||||||||||||||||
| Cash dividends declared, $0.52 per share |
— | — | — | (32,823 | ) | — | — | — | — | (32,823 | ) | |||||||||||||||||||||||||
| Minimum liability pension adjustment, net of related income taxes |
— | — | — | — | — | — | — | 4,036 | 4,036 | |||||||||||||||||||||||||||
| Change in unrealized gain (loss) on investment insecurities available-for-sale, net of related income taxes |
— | — | — | — | — | — | — | (44,981 | ) | (44,981 | ) | |||||||||||||||||||||||||
| Additional tax benefit related to directors’ deferred compensation plan |
— | — | 115 | — | — | — | — | — | 115 | |||||||||||||||||||||||||||
| Shares purchased in connection with directors’ deferred compensation plan, net |
— | — | — | — | (2,622 | ) | (483 | ) | 483 | — | — | |||||||||||||||||||||||||
| Stock option expense |
— | — | 411 | — | — | — | — | — | 411 | |||||||||||||||||||||||||||
|
|
|
|
|
|
|
|
|
|
|
|
|
|
|
|
|
|
|
|||||||||||||||||||
| BALANCE, December 31, 2013 |
31,992,497 | 320 | 302,991 | 273,972 | (269,467 | ) | (5,490 | ) | 5,490 | $ | 10,364 | $ | 587,647 | |||||||||||||||||||||||
|
|
|
|
|
|
|
|
|
|
|
|
|
|
|
|
|
|
|
|||||||||||||||||||
| Net earnings |
— | — | — | 89,559 | — | — | — | — | 89,559 | |||||||||||||||||||||||||||
| Stock option exercises |
74,664 | 1 | 1,436 | — | — | — | — | — | 1,437 | |||||||||||||||||||||||||||
| Cash dividends declared, $0.55 per share |
— | — | — | (35,233 | ) | — | — | — | — | (35,233 | ) | |||||||||||||||||||||||||
| Minimum liability pension adjustment, net of related income taxes |
— | — | — | — | — | — | — | 1,651 | 1,651 | |||||||||||||||||||||||||||
| Change in unrealized gain (loss) on investment insecurities available-for-sale, net of related income taxes |
— | — | — | — | — | — | — | 35,474 | 35,474 | |||||||||||||||||||||||||||
| Additional tax benefit related to directors’ deferred compensation plan |
— | — | 293 | — | — | — | — | — | 293 | |||||||||||||||||||||||||||
| Shares purchased in connection with directors’ deferred compensation plan, net |
— | — | — | — | 8,038 | (388 | ) | 388 | — | — | ||||||||||||||||||||||||||
| Stock option expense |
— | — | 709 | — | — | — | — | — | 709 | |||||||||||||||||||||||||||
| Two-for-one stock split in the form of 100% stock dividend |
32,022,760 | 320 | — | (320 | ) | (268,134 | ) | — | — | — | — | |||||||||||||||||||||||||
|
|
|
|
|
|
|
|
|
|
|
|
|
|
|
|
|
|
|
|||||||||||||||||||
| BALANCE, December 31, 2014 |
64,089,921 | $ | 641 | $ | 305,429 | $ | 327,978 | (529,563 | ) | $ | (5,878 | ) | $ | 5,878 | $ | 47,489 | $ | 681,537 | ||||||||||||||||||
|
|
|
|
|
|
|
|
|
|
|
|
|
|
|
|
|
|
|
|||||||||||||||||||
The accompanying notes are an integral part of these consolidated financial statements.
F-5
Table of Contents
FIRST FINANCIAL BANKSHARES, INC. AND SUBSIDIARIES
Consolidated Statements of Cash Flows
Years Ended December 31, 2014, 2013 and 2012
(Dollars in thousands)
| 2014 | 2013 | 2012 | ||||||||||
| CASH FLOWS FROM OPERATING ACTIVITIES: |
||||||||||||
| Net earnings |
$ | 89,559 | $ | 78,868 | $ | 74,225 | ||||||
| Adjustments to reconcile net earnings to net cash provided by operating activities: |
||||||||||||
| Depreciation and amortization |
9,262 | 8,638 | 7,920 | |||||||||
| Provision for loan losses |
4,465 | 3,753 | 3,484 | |||||||||
| Securities premium amortization (discount accretion), net |
20,221 | 18,235 | 15,757 | |||||||||
| Gain on sale of assets, net |
(910 | ) | (178 | ) | (2,628 | ) | ||||||
| Deferred federal income tax expense (benefit) |
(893 | ) | 754 | 1,517 | ||||||||
| Change in loans held for sale |
(3,640 | ) | 6,292 | (827 | ) | |||||||
| Change in other assets |
9,852 | (6,254 | ) | (5,170 | ) | |||||||
| Change in other liabilities |
3,486 | (250 | ) | (1,216 | ) | |||||||
|
|
|
|
|
|
|
|||||||
| Total adjustments |
41,843 | 30,990 | 18,837 | |||||||||
|
|
|
|
|
|
|
|||||||
| Net cash provided by operating activities |
131,402 | 109,858 | 93,062 | |||||||||
|
|
|
|
|
|
|
|||||||
| CASH FLOWS FROM INVESTING ACTIVITIES: |
||||||||||||
| Cash paid for acquisition of bank, less cash acquired |
— | (25,706 | ) | — | ||||||||
| Net decrease in interest-bearing time deposits in banks |
14,915 | 17,088 | 12,170 | |||||||||
| Activity in available-for-sale securities: |
||||||||||||
| Sales |
1,619 | 122,025 | 144,144 | |||||||||
| Maturities |
2,917,407 | 2,181,684 | 1,909,635 | |||||||||
| Purchases |
(3,248,804 | ) | (2,525,499 | ) | (2,049,275 | ) | ||||||
| Activity in held-to-maturity securities – maturities |
243 | 377 | 2,557 | |||||||||
| Net increase in loans |
(247,829 | ) | (320,136 | ) | (306,412 | ) | ||||||
| Purchases of bank premises and equipment and other assets |
(17,412 | ) | (11,324 | ) | (16,180 | ) | ||||||
| Proceeds from sale of bank premises and equipment and other assets |
4,656 | 4,721 | 8,370 | |||||||||
|
|
|
|
|
|
|
|||||||
| Net cash used in investing activities |
(575,205 | ) | (556,770 | ) | (294,991 | ) | ||||||
|
|
|
|
|
|
|
|||||||
| CASH FLOWS FROM FINANCING ACTIVITIES: |
||||||||||||
| Net increase (decrease) in noninterest-bearing deposits |
208,146 | (17,053 | ) | 210,132 | ||||||||
| Net increase in interest-bearing deposits |
407,035 | 133,594 | 87,654 | |||||||||
| Net increase (decrease) in short-term borrowings |
(96,778 | ) | 204,191 | 51,941 | ||||||||
| Common stock transactions: |
||||||||||||
| Proceeds from stock issuances |
1,437 | 1,958 | 824 | |||||||||
| Dividends paid |
(34,578 | ) | (24,505 | ) | (38,719 | ) | ||||||
|
|
|
|
|
|
|
|||||||
| Net cash provided by financing activities |
485,262 | 298,185 | 311,832 | |||||||||
|
|
|
|
|
|
|
|||||||
| NET INCREASE (DECREASE) IN CASH AND CASH EQUIVALENTS |
41,459 | (148,727 | ) | 109,903 | ||||||||
| CASH AND CASH EQUIVALENTS, beginning of year |
212,012 | 360,739 | 250,836 | |||||||||
|
|
|
|
|
|
|
|||||||
| CASH AND CASH EQUIVALENTS, end of year |
$ | 253,471 | $ | 212,012 | $ | 360,739 | ||||||
|
|
|
|
|
|
|
|||||||
The accompanying notes are an integral part of these consolidated financial statements.
F-6
Table of Contents
FIRST FINANCIAL BANKSHARES, INC. AND SUBSIDIARIES
Notes to Consolidated Financial Statements
December 31, 2014, 2013 and 2012
| 1. | SUMMARY OF SIGNIFICANT ACCOUNTING POLICIES: |
Nature of Operations
First Financial Bankshares, Inc. (a Texas corporation) (“Bankshares”, “Company”, “we” or “us”) is a financial holding company which owns all of the capital stock of one bank with 62 locations located in Texas as of December 31, 2014. The subsidiary bank is First Financial Bank, National Association, Abilene. The bank’s primary source of revenue is providing loans and banking services to consumers and commercial customers in the market area in which the subsidiary is located. In addition, the Company also owns First Financial Trust & Asset Management Company, National Association, First Financial Insurance Agency, Inc., and First Technology Services, Inc.
A summary of significant accounting policies of Bankshares and subsidiaries applied in the preparation of the accompanying consolidated financial statements follows. The accounting principles followed by the Company and the methods of applying them are in conformity with both U.S. generally accepted accounting principles and prevailing practices of the banking industry.
The Company evaluated subsequent events for potential recognition through the date the consolidated financial statements were issued.
Use of Estimates in Preparation of Financial Statements
The preparation of financial statements in conformity with U.S. generally accepted accounting principles requires management to make estimates and assumptions that affect the reported amounts of assets and liabilities and disclosure of contingent assets and liabilities at the date of the financial statements and reported amounts of revenues and expenses during the reporting period. Actual results could differ from those estimates.
Consolidation
The accompanying consolidated financial statements include the accounts of Bankshares and its subsidiaries, all of which are wholly-owned. All significant intercompany accounts and transactions have been eliminated.
Stock Repurchase
On October 28, 2014, the Company’s Board of Directors authorized the repurchase of up to 1,500,000 common shares through September 30, 2017. The stock buyback plan authorizes management to repurchase the stock at such time as repurchases are considered beneficial to stockholders. Any repurchase of stock will be made through the open market, block trades or in privately negotiated transactions in accordance with applicable laws and regulations. Under the repurchase plan, there is no minimum number of shares that the Company is required to repurchase. For the years ended December 31, 2014, 2013 and 2012, no shares were repurchased under this or the prior authorization that expired September 30, 2014.
Stock Split
On April 22, 2014, the Company’s Board of Directors declared a two-for-one stock split in the form of a 100% stock dividend effective for shareholders of record on May 15, 2014 that was distributed on June 2, 2014. All share and per share amounts in this report have been restated to reflect this stock split. An amount equal to the par value of the additional common shares issued pursuant to the stock split was reflected as a transfer from retained earnings to common stock on the consolidated financial statements as of and for the year ended December 31, 2014.
Acquisition
On May 31, 2013, the Company acquired 100% of the outstanding capital stock of Orange Savings Bank, SSB, a wholly-owned subsidiary of OSB Financial Services, Inc. The results of operations of Orange Savings Bank, SSB, subsequent to the acquisition date, are included in the consolidated earnings of the Company. See Note 18 for additional information.
F-7
Table of Contents
FIRST FINANCIAL BANKSHARES, INC. AND SUBSIDIARIES
Notes to Consolidated Financial Statements
December 31, 2014, 2013 and 2012
Consolidation of Bank Charters
Effective December 30, 2012, the Company consolidated its eleven bank charters into one charter. The Company cited regulatory, compliance and technology complexities and the opportunity for cost savings as its reason for making this change. The Company operates the one charter as it previously did with eleven charters, with local management and board decisions to benefit the customers and communities it serves.
Increase in Authorized Shares
On April 24, 2012, the Company’s shareholders approved an amendment to the Company’s Amended and Restated Certificate of Formation to increase the number of authorized common shares to 80,000,000.
Investment Securities
Management classifies debt and equity securities as held-to-maturity, available-for-sale, or trading based on its intent. Debt securities that management has the positive intent and ability to hold to maturity are classified as held-to-maturity and recorded at cost, adjusted for amortization of premiums and accretion of discounts, which are recognized as adjustments to interest income using the interest method. Securities not classified as held-to-maturity or trading are classified as available-for-sale and recorded at fair value, with all unrealized gains and unrealized losses judged to be temporary, net of deferred income taxes, excluded from earnings and reported in the consolidated statements of comprehensive earnings. Available-for-sale securities that have unrealized losses that are judged other-than-temporary are included in gain (loss) on sale of securities and a new cost basis is established. Securities classified as trading are recorded at estimated fair value with unrealized gains and losses included in earnings.
The Company records its available-for-sale and trading securities portfolio at fair value. Fair values of these securities are determined based on methodologies in accordance with current authoritative accounting guidance. Fair values are volatile and may be influenced by a number of factors, including market interest rates, prepayment speeds, discount rates, credit ratings and yield curves. Fair values for investment securities are based on quoted market prices, where available. If quoted market prices are not available, fair values are based on the quoted prices of similar instruments or an estimate of fair value by using a range of fair value estimates in the market place as a result of the illiquid market specific to the type of security.
When the fair value of a security is below its amortized cost, and depending on the length of time the condition exists and the extent the fair value is below amortized cost, additional analysis is performed to determine whether an other-than-temporary impairment condition exists. Available-for-sale and held-to-maturity securities are analyzed quarterly for possible other-than-temporary impairment. The analysis considers (i) whether we have the intent to sell our securities prior to recovery and/or maturity, (ii) whether it is more likely than not that we will have to sell our securities prior to recovery and/or maturity, (iii) the length of time and extent to which the fair value has been less than amortized cost, and (iv) the financial condition of the issuer. Often, the information available to conduct these assessments is limited and rapidly changing, making estimates of fair value subject to judgment. If actual information or conditions are different than estimated, the extent of the impairment of the security may be different than previously estimated, which could have a material effect on the Company’s results of operations and financial condition.
F-8
Table of Contents
FIRST FINANCIAL BANKSHARES, INC. AND SUBSIDIARIES
Notes to Consolidated Financial Statements
December 31, 2014, 2013 and 2012
The Company’s investment portfolio consists of U.S. Treasury securities, obligations of U.S. government sponsored enterprises and agencies, obligations of state and political subdivisions, mortgage pass-through securities, corporate bonds and general obligation or revenue based municipal bonds. Pricing for such securities is generally readily available and transparent in the market. The Company utilizes independent third party pricing services to value its investment securities, which the Company reviews as well as the underlying pricing methodologies for reasonableness and to ensure such prices are aligned with pricing matrices. The Company validates quarterly, on a sample basis, prices supplied by the independent pricing services by comparison to prices obtained from other third party sources.
Loans and Allowance for Loan Losses
Loans held for investment are stated at the amount of unpaid principal, reduced by unearned income and an allowance for loan losses. Interest on loans is calculated by using the simple interest method on daily balances of the principal amounts outstanding. The Company defers and amortizes net loan origination fees and costs as an adjustment to yield. The allowance for loan losses is established through a provision for loan losses charged to expense. Loans are charged against the allowance for loan losses when management believes the collectability of the principal is unlikely.
The allowance for loan losses is an amount which represents management’s best estimate of probable losses that are inherent in the Company’s loan portfolio as of the balance sheet date. The allowance for loan losses is comprised of three elements: (i) specific reserves determined based on probable losses on specific classified loans; (ii) a historical valuation reserve component that considers historical loss rates; and (iii) qualitative reserves based upon general economic conditions and other qualitative risk factors both internal and external to the Company. The allowance for loan losses is increased by charges to income and decreased by charge-offs (net of recoveries). Management’s periodic evaluation of the appropriateness of the allowance is based on general economic conditions, the financial condition of borrowers, the value and liquidity of collateral, delinquency, prior loan loss experience, and the results of periodic reviews of the portfolio. For purposes of determining our historical valuation reserve, the loan portfolio, less cash secured loans, government guaranteed loans and classified loans, is multiplied by the Company’s historical loss rate. Specific allocations are increased or decreased in accordance with deterioration or improvement in credit quality and a corresponding increase or decrease in risk of loss on a particular loan. In addition, we adjust our allowance for qualitative factors such as current local economic conditions and trends, including, without limitations, unemployment, oil and gas prices, drought conditions, changes in lending staff, policies and procedures, changes in credit concentrations, changes in the trends and severity of problem loans and changes in trends in volume and terms of loans. This qualitative reserve serves to estimate for additional areas of losses inherent in our portfolio that are not reflected in our historic loss factors.
Although we believe we use the best information available to make loan loss allowance determinations, future adjustments could be necessary if circumstances or economic conditions differ substantially from the assumptions used in making our initial determinations. A downturn in the economy and employment could result in increased levels of non-performing assets and charge-offs, increased loan provisions and reductions in income. Additionally, bank regulatory agencies periodically review our allowance for loan losses and methodology and could require, in accordance with generally accepted accounting principles, additional provisions to the allowance for loan losses based on their judgment of information available to them at the time of their examination as well as changes to our methodology.
Accrual of interest is discontinued on a loan and payments are applied to principal when management believes, after considering economic and business conditions and collection efforts, the borrower’s financial condition is such that collection of interest is doubtful. Except for consumer loans, generally all loans past due greater than 90 days, based on contractual terms, are placed on non-accrual. Loans are returned to accrual status when all the principal and interest amounts contractually due are brought current and future payments are reasonably assured. Consumer loans are generally charged-off when a loan becomes past due 90 days. For other loans in the portfolio, facts and circumstances are evaluated in making charge-off decisions.
Loans are considered impaired when, based on current information and events, management determines that it is probable we will be unable to collect all amounts due in accordance with the loan agreement, including scheduled
F-9
Table of Contents
FIRST FINANCIAL BANKSHARES, INC. AND SUBSIDIARIES
Notes to Consolidated Financial Statements
December 31, 2014, 2013 and 2012
principal and interest payments. If a loan is impaired, a specific valuation allowance is allocated, if necessary. Interest payments on impaired loans are typically applied to principal unless collectability of the principal amount is reasonably assured, in which case interest is recognized on a cash basis. Impaired loans, or portions thereof, are charged-off when deemed uncollectable.
The Company’s policy requires measurement of the allowance for an impaired, collateral dependent loan based on the fair value of the collateral. Other loan impairments for non-collateral dependent loans are measured based on the present value of expected future cash flows or the loan’s observable market price. At December 31, 2014 and 2013, all significant impaired loans have been determined to be collateral dependent and the allowance for loss has been measured utilizing the estimated fair value of the collateral.
From time to time, the Company modifies its loan agreement with a borrower. A modified loan is considered a troubled debt restructuring when two conditions are met: (i) the borrower is experiencing financial difficulty and (ii) concessions are made by the Company that would not otherwise be considered for a borrower with similar credit risk characteristics. Modifications to loan terms may include a lower interest rate, a reduction of principal, or a longer term to maturity. For all impaired loans, including the Company’s troubled debt restructurings, the Company performs a periodic, well-documented credit evaluation of the borrower’s financial condition and prospects for repayment to assess the likelihood that all principal and interest payments required under the terms of the agreement will be collected in full. When doubt exists about the ultimate collectability of principal and interest, the troubled debt restructuring remains on non-accrual status and payments received are applied to reduce principal to the extent necessary to eliminate such doubt. This determination of accrual status is judgmental and is based on facts and circumstances related to each troubled debt restructuring. Each of these loans is individually evaluated for impairment and a specific reserve is recorded based on probable losses, taking into consideration the related collateral, modified loan terms and cash flow. As of December 31, 2014 and 2013, substantially all of the Company’s troubled debt restructured loans are included in the non-accrual totals.
The Company originates certain mortgage loans for sale in the secondary market. Accordingly, these loans are classified as held-for-sale and are carried at the lower of cost or fair value on an aggregate basis. The mortgage loan sales contracts contain indemnification clauses should the loans default, generally in the first three to six months, or if documentation is determined not to be in compliance with regulations. The Company’s historic losses as a result of these indemnities have been insignificant.
Loans acquired, including loans acquired in a business combination, are initially recorded at fair value with no valuation allowance. Acquired loans are segregated between those considered to be credit impaired and those deemed performing. To make this determination, management considers such factors as past due status, nonaccrual status and credit risk ratings. The fair value of acquired performing loans is determined by discounting expected cash flows, both principal and interest, at prevailing market interest rates. The difference between the fair value and principal balances at acquisition date, the fair value discount, is accreted into income over the estimated life of each loan.
Purchased credit impaired loans are those loans that showed evidence of deterioration of credit quality since origination and for which it is probable, at acquisition, that the Company will be unable to collect all amounts contractually owed. Their acquisition fair value, which includes a credit component at the acquisition date, was based on the estimate of cash flows, both principal and interest, expected to be collected or estimated collateral values if cash flows are not estimable, discounted at prevailing market rates of interest. The difference between the discounted cash flows expected at acquisition and the investment in the loan is recognized as interest income on a level-yield method over the life of the loan, unless management was unable to reasonably forecast cash flows in which case the loans were placed on nonaccrual. Contractually required payments for interest and principal that exceed the cash flows expected at acquisition are not recognized as a yield adjustment. Increases in expected cash flows subsequent to the initial investment are recognized prospectively through adjustment of the yield on the loan over its remaining life. Decreases in expected cash flows subsequent to acquisition are recognized as impairment. Valuation allowances on these impaired loans reflect only losses incurred after the acquisition. The carrying amount of purchased credit impaired loans at December 31, 2014 and 2013 were $2,151,000 and $2,707,000, respectively, compared to a contractual balance of $3,275,000 and $3,970,000, respectively. Other purchased credit impaired loan disclosures were omitted due to immateriality.
F-10
Table of Contents
FIRST FINANCIAL BANKSHARES, INC. AND SUBSIDIARIES
Notes to Consolidated Financial Statements
December 31, 2014, 2013 and 2012
Other Real Estate
Other real estate owned is foreclosed property held pending disposition and is initially recorded at fair value, less estimated costs to sell. At foreclosure, if the fair value of the real estate, less estimated costs to sell, is less than the Company’s recorded investment in the related loan, a write-down is recognized through a charge to the allowance for loan losses. Any subsequent reduction in value is recognized by a charge to income. Operating and holding expenses of such properties, net of related income, and gains and losses on their disposition are included in net gain (loss) on sale of foreclosed assets as incurred.
Bank Premises and Equipment
Bank premises and equipment are stated at cost less accumulated depreciation and amortization. Depreciation and amortization are computed principally on a straight-line basis over the estimated useful lives of the related assets. Leasehold improvements are amortized over the life of the respective lease or the estimated useful lives of the improvements, whichever is shorter.
Business Combinations, Goodwill and Other Intangible Assets
The Company accounts for all business combinations under the purchase method of accounting. Tangible and intangible assets and liabilities of the acquired entity are recorded at fair value. Intangible assets with finite useful lives represent the future benefit associated with the acquisition of the core deposits and are amortized over seven years, utilizing a method that approximates the expected attrition of the deposits. Goodwill with an indefinite life is not amortized, but rather tested annually for impairment as of June 30 each year and totaled $94,882,000 at both December 31, 2014 and 2013, respectively. There was no impairment recorded for the years ended December 31, 2014, 2013 and 2012.
The carrying amount of goodwill arising from acquisitions that qualify as an asset purchase for federal income tax purposes was $72,626,000 at both December 31, 2014 and 2013, respectively, and is deductible for federal income tax purposes.
Also included in other intangible assets are mortgage servicing rights totaling $1,834,000 and $1,684,000 at December 31, 2014 and 2013, respectively.
Securities Sold Under Agreements To Repurchase
Securities sold under agreements to repurchase, which are classified as short-term borrowings, generally mature within one to four days from the transaction date. Securities sold under agreements to repurchase are reflected at the amount of the cash received in connection with the transaction. The Company may be required to provide additional collateral based on the estimated fair value of the underlying securities.
Segment Reporting
The Company has determined that its banking regions meet the aggregation criteria of the current authoritative accounting guidance since each of its banking regions offers similar products and services, operates in a similar manner, has similar customers and reports to the same regulatory authority, and therefore operates one line of business (community banking) located in a single geographic area (Texas).
Statements of Cash Flows
For purposes of reporting cash flows, cash and cash equivalents includes cash on hand, amounts due from banks, including interest-bearing deposits in banks with original maturity of 90 days or less, and federal funds sold.
F-11
Table of Contents
FIRST FINANCIAL BANKSHARES, INC. AND SUBSIDIARIES
Notes to Consolidated Financial Statements
December 31, 2014, 2013 and 2012
Accumulated Other Comprehensive Income (Loss)
Unrealized gains on the Company’s available-for-sale securities (after applicable income tax expense) totaling $50,162,000 and $14,688,000 at December 31, 2014 and 2013, respectively, and the minimum pension liability totaled (after applicable income tax benefit) totaling $2,673,000 and $4,324,000 at December 31, 2014 and 2013, respectively, are included in accumulated other comprehensive income.
Income Taxes
The Company’s provision for income taxes is based on income before income taxes adjusted for permanent differences between financial reporting and taxable income. Deferred tax assets and liabilities are determined using the liability (or balance sheet) method. Under this method, the net deferred tax asset or liability is determined based on the tax effects of the temporary differences between the book and tax bases of the various balance sheet assets and liabilities and gives current recognition to changes in tax rates and laws.
Stock Based Compensation
The Company grants stock options for a fixed number of shares to employees with an exercise price equal to the fair value of the shares at the grant date. The Company recorded stock option expense totaling $709,000, $411,000 and $334,000 for the years ended December 31, 2014, 2013 and 2012, respectively.
Advertising Costs
Advertising costs are expensed as incurred.
Per Share Data
Net earnings per share (“EPS”) are computed by dividing net earnings by the weighted average number of common stock shares outstanding during the period. The Company calculates dilutive EPS assuming all outstanding options to purchase common stock have been exercised at the beginning of the year (or the time of issuance, if later.) The dilutive effect of the outstanding options is reflected by application of the treasury stock method, whereby the proceeds from the exercised options are assumed to be used to purchase common stock at the average market price during the period. The following table reconciles the computation of basic EPS to dilutive EPS:
| Net Earnings (in thousands) |
Weighted Average Shares |
Per Share Amount |
||||||||||
| For the year ended December 31, 2014: |
||||||||||||
| Net earnings per share, basic |
$ | 89,559 | 64,047,803 | $ | 1.40 | |||||||
| Effect of stock options |
— | 260,732 | (0.01 | ) | ||||||||
|
|
|
|
|
|
|
|||||||
| Net earnings per share, assuming dilution |
$ | 89,559 | 64,308,535 | $ | 1.39 | |||||||
|
|
|
|
|
|
|
|||||||
| For the year ended December 31, 2013: |
||||||||||||
| Net earnings per share, basic |
$ | 78,868 | 63,575,948 | $ | 1.24 | |||||||
| Effect of stock options |
— | 280,816 | — | |||||||||
|
|
|
|
|
|
|
|||||||
| Net earnings per share, assuming dilution |
$ | 78,868 | 63,856,764 | $ | 1.24 | |||||||
|
|
|
|
|
|
|
|||||||
| For the year ended December 31, 2012: |
||||||||||||
| Net earnings per share, basic |
$ | 74,225 | 62,960,310 | $ | 1.18 | |||||||
| Effect of stock options |
— | 42,224 | — | |||||||||
|
|
|
|
|
|
|
|||||||
| Net earnings per share, assuming dilution |
$ | 74,225 | 63,002,534 | $ | 1.18 | |||||||
|
|
|
|
|
|
|
|||||||
F-12
Table of Contents
FIRST FINANCIAL BANKSHARES, INC. AND SUBSIDIARIES
Notes to Consolidated Financial Statements
December 31, 2014, 2013 and 2012
Recently Issued Authoritative Accounting Guidance
In 2014, the Financial Accounting Standards Board (the “FASB”) amended its authoritative guidance related to residential real estate to clarify that an in substance repossession or foreclosure occurs, and a creditor is considered to have received physical possession of residential real estate property collateralizing a consumer mortgage loan, upon either (1) the creditor obtaining legal title to the residential real estate property upon completion of a foreclosure or (2) the borrower conveying all interest in the residential real estate property to the creditor to satisfy that loan through completion of a deed in lieu of foreclosure or through a similar legal agreement. Additionally, the amendment requires interim and annual disclosure of both (1) the amount of foreclosed residential real estate property held by the creditor and (2) the recorded investment in consumer mortgage loans collateralized by residential real estate property that are in the process of foreclosure according to local requirements of the applicable jurisdiction. The new guidance is effective for the Company on January 1, 2015 and is not expected to have a significant impact to the Company’s financial statements.
In 2014, the FASB issued a comprehensive new revenue recognition standard that will supersede substantially all existing revenue recognition guidance. The new standard’s core principle is that a company will recognize revenue when it transfers promised goods or services to customers in an amount that reflects the consideration to which the company expects to be entitled in exchange for those goods or services. In doing so, companies will need to use more judgment and make more estimates than under existing guidance. These may include identifying performance obligations in the contract, estimating the amount of variable consideration to include in the transaction price and allocating the transaction price to each separate performance obligation. The new standard will be effective in the first quarter of 2017. The Company is continuing to evaluate the potential impact to the Company’s financial statements.
In 2014, the FASB amended its authoritative guidance related to repurchase-to-maturity transaction to require that repurchase-to-maturity transactions be accounted for as secured borrowings consistent with the accounting for other repurchase agreements. In addition, the amendment requires separate accounting for repurchase financings, which entails the transfer of a financial asset executed contemporaneously with a repurchase agreement with the same counterparty. The amendment requires entities to disclose certain information about transfers accounted for as sales in transactions that economically similar to repurchase agreements. In addition, the amendment requires disclosures related to collateral, remaining contractual term and of the potential risks associated with repurchase agreements, securities lending transactions and repurchase-to-maturity transactions. The amendment will be effective on January 1, 2015 and is not expected to have a significant impact on the Company’s financial statements.
In 2015, the FASB eliminated from U.S. GAAP the concept of extraordinary items, which, among other things, required an entity to segregate extraordinary items considered to be unusual and infrequent from the results of ordinary operations and show the item separately in the income statement, net of tax, after income from continuing operations. The new guidance is effective for the Company beginning January 1, 2016, though early adoption is permitted, and is not expected to have a significant impact on the Company’s financial statements.
| 2. | INTEREST-BEARING TIME DEPOSITS IN BANKS AND SECURITIES: |
Interest-bearing time deposits in banks totaled $17,002,000 and $31,917,000 at December 31, 2014 and 2013, respectively, and have original maturities generally ranging from one to two years. Of these amounts, $15,467,000 and $29,002,000, respectively, are time deposits with balances greater than $100,000 at December 31, 2014 and 2013.
F-13
Table of Contents
FIRST FINANCIAL BANKSHARES, INC. AND SUBSIDIARIES
Notes to Consolidated Financial Statements
December 31, 2014, 2013 and 2012
A summary of the Company’s available-for-sale securities as of December 31, 2014 and 2013 are as follows (in thousands):
| December 31, 2014 | ||||||||||||||||
| Amortized Cost Basis |
Gross Unrealized Holding Gains |
Gross Unrealized Holding Losses |
Estimated Fair Value |
|||||||||||||
| Securities available-for-sale: |
||||||||||||||||
| U.S. Treasury securities |
$ | 518 | $ | 2 | $ | — | $ | 520 | ||||||||
| Obligations of U.S. government sponsored enterprises and agencies |
128,919 | 864 | (28 | ) | 129,755 | |||||||||||
| Obligations of state and political subdivisions |
1,107,795 | 60,083 | (250 | ) | 1,167,628 | |||||||||||
| Corporate bonds and other |
95,864 | 2,894 | — | 98,758 | ||||||||||||
| Residential mortgage-backed securities |
871,265 | 16,804 | (2,858 | ) | 885,211 | |||||||||||
| Commercial mortgage-backed securities |
134,322 | 555 | (893 | ) | 133,984 | |||||||||||
|
|
|
|
|
|
|
|
|
|||||||||
| Total securities available-for-sale |
$ | 2,338,683 | $ | 81,202 | $ | (4,029 | ) | $ | 2,415,856 | |||||||
|
|
|
|
|
|
|
|
|
|||||||||
| December 31, 2013 | ||||||||||||||||
| Amortized Cost Basis |
Gross Unrealized Holding Gains |
Gross Unrealized Holding Losses |
Estimated Fair Value |
|||||||||||||
| Securities available-for-sale: |
||||||||||||||||
| Obligations of U.S. government sponsored enterprises and agencies |
$ | 136,416 | $ | 1,672 | $ | — | $ | 138,088 | ||||||||
| Obligations of state and political subdivisions |
974,608 | 27,980 | (11,319 | ) | 991,269 | |||||||||||
| Corporate bonds and other |
105,490 | 3,550 | — | 109,040 | ||||||||||||
| Residential mortgage-backed securities |
706,289 | 12,253 | (7,922 | ) | 710,620 | |||||||||||
| Commercial mortgage-backed securities |
112,323 | — | (3,617 | ) | 108,706 | |||||||||||
|
|
|
|
|
|
|
|
|
|||||||||
| Total securities available-for-sale |
$ | 2,035,126 | $ | 45,455 | $ | (22,858 | ) | $ | 2,057,723 | |||||||
|
|
|
|
|
|
|
|
|
|||||||||
F-14
Table of Contents
FIRST FINANCIAL BANKSHARES, INC. AND SUBSIDIARIES
Notes to Consolidated Financial Statements
December 31, 2014, 2013 and 2012
Disclosures related to the Company’s held-to-maturity securities, which totaled $441,000 and $684,000 at December 31, 2014 and 2013, respectively, have not been presented due to insignificance.
The Company invests in mortgage-backed securities that have expected maturities that differ from their contractual maturities. These differences arise because borrowers may have the right to call or prepay obligations with or without a prepayment penalty. These securities include collateralized mortgage obligations (CMOs) and other asset backed securities. The expected maturities of these securities at December 31, 2014, were computed by using scheduled amortization of balances and historical prepayment rates. At December 31, 2014 and 2013, the Company did not hold any CMOs that entail higher risks than standard mortgage-backed securities.
The amortized cost and estimated fair value of available-for-sale securities at December 31, 2014, by contractual and expected maturity, are shown below (in thousands):
| Amortized Cost Basis |
Estimated Fair Value |
|||||||
| Due within one year |
$ | 81,336 | $ | 82,078 | ||||
| Due after one year through five years |
694,864 | 726,392 | ||||||
| Due after five years through ten years |
550,362 | 580,250 | ||||||
| Due after ten years |
6,534 | 7,941 | ||||||
| Mortgage-backed securities |
1,005,587 | 1,019,195 | ||||||
|
|
|
|
|
|||||
| Total |
$ | 2,338,683 | $ | 2,415,856 | ||||
|
|
|
|
|
|||||
The following table discloses, as of December 31, 2014 and 2013, the Company’s investment securities that have been in a continuous unrealized-loss position for less than 12 months and for 12 or more months (in thousands):
| Less than 12 Months | 12 Months or Longer | Total | ||||||||||||||||||||||
| December 31, 2014 |
Fair Value |
Unrealized Loss |
Fair Value |
Unrealized Loss |
Fair Value |
Unrealized Loss |
||||||||||||||||||
| Obligations of U.S. government sponsored enterprises and agencies |
$ | 25,480 | $ | 28 | $ | — | $ | — | $ | 25,480 | $ | 28 | ||||||||||||
| Obligations of state and political subdivisions |
15,128 | 60 | 21,249 | 190 | 36,377 | 250 | ||||||||||||||||||
| Residential mortgage-backed securities |
76,350 | 148 | 128,368 | 2,710 | 204,718 | 2,858 | ||||||||||||||||||
| Commercial mortgage-backed securities |
48,399 | 273 | 55,065 | 620 | 103,464 | 893 | ||||||||||||||||||
|
|
|
|
|
|
|
|
|
|
|
|
|
|||||||||||||
| Total |
$ | 165,357 | $ | 509 | $ | 204,682 | $ | 3,520 | $ | 370,039 | $ | 4,029 | ||||||||||||
|
|
|
|
|
|
|
|
|
|
|
|
|
|||||||||||||
| Less than 12 Months | 12 Months or Longer | Total | ||||||||||||||||||||||
| December 31, 2013 |
Fair Value |
Unrealized Loss |
Fair Value |
Unrealized Loss |
Fair Value |
Unrealized Loss |
||||||||||||||||||
| Obligations of state and political subdivisions |
$ | 316,394 | $ | 10,973 | $ | 4,153 | $ | 346 | $ | 320,547 | $ | 11,319 | ||||||||||||
| Residential mortgage-backed securities |
228,423 | 7,623 | 5,624 | 299 | 234,047 | 7,922 | ||||||||||||||||||
| Commercial mortgage-backed securities |
108,706 | 3,617 | — | — | 108,706 | 3,617 | ||||||||||||||||||
|
|
|
|
|
|
|
|
|
|
|
|
|
|||||||||||||
| Total |
$ | 653,523 | $ | 22,213 | $ | 9,777 | $ | 645 | $ | 663,300 | $ | 22,858 | ||||||||||||
|
|
|
|
|
|
|
|
|
|
|
|
|
|||||||||||||
F-15
Table of Contents
FIRST FINANCIAL BANKSHARES, INC. AND SUBSIDIARIES
Notes to Consolidated Financial Statements
December 31, 2014, 2013 and 2012
The number of investments in an unrealized loss position totaled 86 at December 31, 2014. We do not believe these unrealized losses are “other-than-temporary” as (i) we do not have the intent to sell our securities prior to recovery and/or maturity and, (ii) it is more likely than not that we will not have to sell our securities prior to recovery and/or maturity. In making this determination, we also consider the length of time and extent to which fair value has been less than cost and the financial condition of the issuer. The unrealized losses noted are interest rate related due to the level of interest rates at December 31, 2014 compared to the time of purchase. We have reviewed the ratings of the issuers and have not identified any issues related to the ultimate repayment of principal as a result of credit concerns on these securities. Our mortgage related securities are backed by GNMA, FNMA and FHLMC or are collateralized by securities backed by these agencies.
Securities, carried at approximately $1,600,682,000 and $1,147,955,000 at December 31, 2014 and 2013, respectively, were pledged as collateral for public or trust fund deposits, repurchase agreements and for other purposes required or permitted by law.
During 2014, 2013, and 2012, sales of investment securities that were classified as available-for-sale totaled $1,619,000, $122,025,000 and $144,144,000, respectively. Gross realized gains from 2014, 2013, and 2012, securities sales were $2,000, $1,376,000 and $2,816,000, respectively. Gross realized losses from 2014, 2013 and 2012 securities sales were $6,000, $1,229,000 and $44,000, respectively. The specific identification method was used to determine cost in order to compute the realized gains and losses.
| 3. | LOANS AND ALLOWANCE FOR LOAN LOSSES: |
Major classifications of loans held-for-investment by class of financing receivables are as follows (in thousands):
| December 31, | ||||||||
| 2014 | 2013 | |||||||
| Commercial |
$ | 639,954 | $ | 596,730 | ||||
| Agricultural |
105,694 | 75,928 | ||||||
| Real estate |
1,822,854 | 1,678,514 | ||||||
| Consumer |
360,686 | 333,113 | ||||||
|
|
|
|
|
|||||
| Total loans held-for-investment |
$ | 2,929,188 | $ | 2,684,285 | ||||
|
|
|
|
|
|||||
Loans held-for-sale totaled $8,803,000 and $5,163,000 at December 31, 2014 and 2013, respectively, which were recorded at cost as fair value exceeded cost.
F-16
Table of Contents
FIRST FINANCIAL BANKSHARES, INC. AND SUBSIDIARIES
Notes to Consolidated Financial Statements
December 31, 2014, 2013 and 2012
The Company’s non-accrual loans, loan still accruing and past due 90 days or more and restructured loans are as follows (in thousands):
| December 31, | ||||||||
| 2014 | 2013 | |||||||
| Non-accrual loans* |
$ | 20,194 | $ | 27,926 | ||||
| Loans still accruing and past due 90 days or more |
261 | 133 | ||||||
| Troubled debt restructured loans** |
226 | — | ||||||
|
|
|
|
|
|||||
| Total |
$ | 20,681 | $ | 28,059 | ||||
|
|
|
|
|
|||||
| * | Includes $2,151,000 and $2,707,000, respectively, of purchased credit impaired loans as of December 31, 2014 and 2013. There were no purchase credit impaired loan balances in prior periods. |
| ** | Troubled debt restructured loans of $9,073,000 and $13,298,000, whose interest collection, after considering economic and business conditions and collection efforts, is doubtful are included in non-accrual loans as of December 31, 2014 and 2013, respectively. |
The Company’s recorded investment in impaired loans and the related valuation allowance are as follows (in thousands):
| December 31, 2014 | December 31, 2013 | |||||||||||||
| Recorded Investment |
Valuation Allowance |
Recorded Investment |
Valuation Allowance |
|||||||||||
| $ | 20,194 | $ | 4,213 | $ | 27,926 | $ | 5,338 | |||||||
|
|
|
|
|
|
|
|
|
|||||||
The average recorded investment in impaired loans for the years ended December 31, 2014, 2013, and 2012 was $24,497,000, $31,293,000 and $24,025,000, respectively. The Company had $21,716,000 and $31,128,000 in nonaccrual, past due 90 days or more and still accruing, restructured loans and foreclosed assets at December 31, 2014 and 2013, respectively. Non-accrual loans totaled $20,194,000 and $27,926,000 at December 31, 2014 and 2013, respectively, and consisted of the following amounts by type (in thousands):
| December 31, | ||||||||
| 2014 | 2013 | |||||||
| Commercial |
$ | 3,193 | $ | 4,281 | ||||
| Agricultural |
165 | 131 | ||||||
| Real Estate |
16,218 | 22,548 | ||||||
| Consumer |
618 | 966 | ||||||
|
|
|
|
|
|||||
| Total |
$ | 20,194 | $ | 27,926 | ||||
|
|
|
|
|
|||||
No significant additional funds are committed to be advanced in connection with impaired loans as of December 31, 2014.
F-17
Table of Contents
FIRST FINANCIAL BANKSHARES, INC. AND SUBSIDIARIES
Notes to Consolidated Financial Statements
December 31, 2014, 2013 and 2012
The Company’s impaired loans and related allowance as of December 31, 2014 and 2013 is summarized in the following tables by class of financing receivables (in thousands). No interest income was recognized on impaired loans subsequent to their classification as impaired.
| December 31, 2014 |
Unpaid Contractual Principal Balance |
Recorded Investment With No Allowance* |
Recorded Investment With Allowance |
Total Recorded Investment |
Related Allowance |
Average Recorded Investment |
||||||||||||||||||
| Commercial |
$ | 3,749 | $ | 287 | $ | 2,906 | $ | 3,193 | $ | 1,171 | $ | 3,698 | ||||||||||||
| Agricultural |
177 | — | 165 | 165 | 57 | 179 | ||||||||||||||||||
| Real Estate |
22,177 | 4,859 | 11,359 | 16,218 | 2,867 | 19,837 | ||||||||||||||||||
| Consumer |
838 | 420 | 198 | 618 | 118 | 783 | ||||||||||||||||||
|
|
|
|
|
|
|
|
|
|
|
|
|
|||||||||||||
| Total |
$ | 26,941 | $ | 5,566 | $ | 14,628 | $ | 20,194 | $ | 4,213 | $ | 24,497 | ||||||||||||
|
|
|
|
|
|
|
|
|
|
|
|
|
|||||||||||||
| * | Includes $2,151,000 of purchased credit impaired loans. |
| December 31, 2013 |
Unpaid Contractual Principal Balance |
Recorded Investment With No Allowance* |
Recorded Investment With Allowance |
Total Recorded Investment |
Related Allowance |
Average Recorded Investment |
||||||||||||||||||
| Commercial |
$ | 4,764 | $ | 934 | $ | 3,347 | $ | 4,281 | $ | 1,079 | $ | 5,017 | ||||||||||||
| Agricultural |
139 | 17 | 114 | 131 | 41 | 144 | ||||||||||||||||||
| Real Estate |
31,704 | 5,794 | 16,754 | 22,548 | 4,006 | 25,060 | ||||||||||||||||||
| Consumer |
1,117 | 545 | 421 | 966 | 212 | 1,072 | ||||||||||||||||||
|
|
|
|
|
|
|
|
|
|
|
|
|
|||||||||||||
| Total |
$ | 37,724 | $ | 7,290 | $ | 20,636 | $ | 27,926 | $ | 5,338 | $ | 31,293 | ||||||||||||
|
|
|
|
|
|
|
|
|
|
|
|
|
|||||||||||||
| * | Includes $2,707,000 of purchases credit impaired loans. |
The Company recognized interest income on impaired loans prior to being recognized as impaired of approximately $162,000, $685,000 and $384,000 during the years ended December 31, 2014, 2013, and 2012, respectively.
From a credit risk standpoint, the Company rates its loans in one of four categories: (i) pass, (ii) special mention, (iii) substandard or (iv) doubtful. Loans rated as loss are charged-off.
The ratings of loans reflect a judgment about the risks of default and loss associated with the loan. The Company reviews the ratings on our credits as part of our on-going monitoring of the credit quality of our loan portfolio. Ratings are adjusted to reflect the degree of risk and loss that are felt to be inherent in each credit as of each reporting period. Our methodology is structured so that specific allocations are increased in accordance with deterioration in credit quality (and a corresponding increase in risk and loss) or decreased in accordance with improvement in credit quality (and a corresponding decrease in risk and loss).
Credits rated special mention show clear signs of financial weaknesses or deterioration in credit worthiness, however, such concerns are not so pronounced that the Company generally expects to experience significant loss within the short-term. Such credits typically maintain the ability to perform within standard credit terms and credit exposure is not as prominent as credits rated more harshly.
Credits rated substandard are those in which the normal repayment of principal and interest may be, or has been, jeopardized by reason of adverse trends or developments of a financial, managerial, economic or political nature, or important weaknesses exist in collateral. A protracted workout on these credits is a distinct possibility. Prompt corrective action is therefore required to strengthen the Company’s position, and/or to reduce exposure and to assure that adequate remedial measures are taken by the borrower. Credit exposure becomes more likely in such credits and a serious evaluation of the secondary support to the credit is performed.
Credits rated doubtful are those in which full collection of principal appears highly questionable, and which some degree of loss is anticipated, even though the ultimate amount of loss may not yet be certain and/or other factors exist which could affect collection of debt. Based upon available information, positive action by the Company is required to avert or minimize loss. Credits rated doubtful are generally also placed on non-accrual.
F-18
Table of Contents
FIRST FINANCIAL BANKSHARES, INC. AND SUBSIDIARIES
Notes to Consolidated Financial Statements
December 31, 2014, 2013 and 2012
The following summarizes the Company’s internal ratings of its loans held-for-investment by class of financing receivables and portfolio segments, which classes are the same, at December 31, 2014 and 2013 (in thousands):
| December 31, 2014 |
Pass | Special Mention |
Substandard | Doubtful | Total | |||||||||||||||
| Commercial |
$ | 626,266 | $ | 3,853 | $ | 9,835 | $ | — | $ | 639,954 | ||||||||||
| Agricultural |
105,101 | 91 | 502 | — | 105,694 | |||||||||||||||
| Real Estate |
1,765,886 | 15,106 | 41,722 | 140 | 1,822,854 | |||||||||||||||
| Consumer |
358,953 | 403 | 1,329 | 1 | 360,686 | |||||||||||||||
|
|
|
|
|
|
|
|
|
|
|
|||||||||||
| Total |
$ | 2,856,206 | $ | 19,453 | $ | 53,388 | $ | 141 | $ | 2,929,188 | ||||||||||
|
|
|
|
|
|
|
|
|
|
|
|||||||||||
| December 31, 2013 |
Pass | Special Mention |
Substandard | Doubtful | Total | |||||||||||||||
| Commercial |
$ | 584,547 | $ | 3,032 | $ | 9,151 | $ | — | $ | 596,730 | ||||||||||
| Agricultural |
75,382 | 245 | 298 | 3 | 75,928 | |||||||||||||||
| Real Estate |
1,609,242 | 20,773 | 48,352 | 147 | 1,678,514 | |||||||||||||||
| Consumer |
330,870 | 639 | 1,595 | 9 | 333,113 | |||||||||||||||
|
|
|
|
|
|
|
|
|
|
|
|||||||||||
| Total |
$ | 2,600,041 | $ | 24,689 | $ | 59,396 | $ | 159 | $ | 2,684,285 | ||||||||||
|
|
|
|
|
|
|
|
|
|
|
|||||||||||
At December 31, 2014 and 2013, the Company’s past due loans are as follows (in thousands):
| December 31, 2014 |
15-59 Days Past Due* |
60-89 Days Past Due |
Greater Than 90 Days |
Total Past Due |
Total Current |
Total Loans |
Total 90 Days Past Due Still Accruing |
|||||||||||||||||||||
| Commercial |
$ | 4,611 | $ | 94 | $ | 175 | $ | 4,880 | $ | 635,074 | $ | 639,954 | $ | 24 | ||||||||||||||
| Agricultural |
437 | 42 | — | 479 | 105,215 | 105,694 | — | |||||||||||||||||||||
| Real Estate |
12,002 | 707 | 1,868 | 14,577 | 1,808,277 | 1,822,854 | 207 | |||||||||||||||||||||
| Consumer |
2,322 | 496 | 134 | 2,952 | 357,734 | 360,686 | 30 | |||||||||||||||||||||
|
|
|
|
|
|
|
|
|
|
|
|
|
|
|
|||||||||||||||
| Total |
$ | 19,372 | $ | 1,339 | $ | 2,177 | $ | 22,888 | $ | 2,906,300 | $ | 2,929,188 | $ | 261 | ||||||||||||||
|
|
|
|
|
|
|
|
|
|
|
|
|
|
|
|||||||||||||||
| December 31, 2013 |
15-59 Days Past Due* |
60-89 Days Past Due |
Greater Than 90 Days |
Total Past Due |
Total Current |
Total Loans |
Total 90 Days Past Due Still Accruing |
|||||||||||||||||||||
| Commercial |
$ | 5,303 | $ | 287 | $ | 420 | $ | 6,010 | $ | 590,720 | $ | 596,730 | $ | — | ||||||||||||||
| Agricultural |
355 | — | — | 355 | 75,573 | 75,928 | — | |||||||||||||||||||||
| Real Estate |
13,787 | 2,489 | 1,876 | 18,152 | 1,660,362 | 1,678,514 | 55 | |||||||||||||||||||||
| Consumer |
2,708 | 582 | 277 | 3,567 | 329,546 | 333,113 | 78 | |||||||||||||||||||||
|
|
|
|
|
|
|
|
|
|
|
|
|
|
|
|||||||||||||||
| Total |
$ | 22,153 | $ | 3,358 | $ | 2,573 | $ | 28,084 | $ | 2,656,201 | $ | 2,684,285 | $ | 133 | ||||||||||||||
|
|
|
|
|
|
|
|
|
|
|
|
|
|
|
|||||||||||||||
| * | The Company monitors commercial, agricultural and real estate loans after such loans are 15 days past due. Consumer loans are monitored after such loans are 30 days past due. |
F-19
Table of Contents
FIRST FINANCIAL BANKSHARES, INC. AND SUBSIDIARIES
Notes to Consolidated Financial Statements
December 31, 2014, 2013 and 2012
The allowance for loan losses as of December 31, 2014 and 2013, is presented below. Management has evaluated the appropriateness of the allowance for loan losses by estimating the probable losses in various categories of the loan portfolio, which are identified below (in thousands):
| 2014 | 2013 | |||||||
| Allowance for loan losses provided for: |
||||||||
| Loans specifically evaluated as impaired |
$ | 4,213 | $ | 5,338 | ||||
| Remaining portfolio |
32,611 | 28,562 | ||||||
|
|
|
|
|
|||||
| Total allowance for loan losses |
$ | 36,824 | $ | 33,900 | ||||
|
|
|
|
|
|||||
The following table details the allowance for loan losses at December 31, 2014 and 2013 by portfolio segment (in thousands). There were no allowances for purchased credit impaired loans at December 31, 2014 or 2013. Allocation of a portion of the allowance to one category of loans does not preclude its availability to absorb losses in other categories.
| December 31, 2014 |
Commercial | Agricultural | Real Estate | Consumer | Total | |||||||||||||||
| Loans individually evaluated for impairment |
$ | 2,877 | $ | 199 | $ | 6,591 | $ | 309 | $ | 9,976 | ||||||||||
| Loan collectively evaluated for impairment |
5,113 | 328 | 20,066 | 1,341 | 26,848 | |||||||||||||||
|
|
|
|
|
|
|
|
|
|
|
|||||||||||
| Total |
$ | 7,990 | $ | 527 | $ | 26,657 | $ | 1,650 | $ | 36,824 | ||||||||||
|
|
|
|
|
|
|
|
|
|
|
|||||||||||
| December 31, 2013 |
Commercial | Agricultural | Real Estate | Consumer | Total | |||||||||||||||
| Loans individually evaluated for impairment |
$ | 2,755 | $ | 125 | $ | 7,215 | $ | 378 | $ | 10,473 | ||||||||||
| Loan collectively evaluated for impairment |
3,685 | 258 | 17,725 | 1,759 | 23,427 | |||||||||||||||
|
|
|
|
|
|
|
|
|
|
|
|||||||||||
| Total |
$ | 6,440 | $ | 383 | $ | 24,940 | $ | 2,137 | $ | 33,900 | ||||||||||
|
|
|
|
|
|
|
|
|
|
|
|||||||||||
Changes in the allowance for loan losses for the years ended December 31, 2014 and 2013 are summarized as follows (in thousands):
| December 31, 2014 |
Commercial | Agricultural | Real Estate | Consumer | Total | |||||||||||||||
| Beginning balance |
$ | 6,440 | $ | 383 | $ | 24,940 | $ | 2,137 | $ | 33,900 | ||||||||||
| Provision for loan losses |
1,787 | 128 | 2,287 | 263 | 4,465 | |||||||||||||||
| Recoveries |
346 | 18 | 505 | 472 | 1,341 | |||||||||||||||
| Charge-offs |
(583 | ) | (2 | ) | (1,075 | ) | (1,222 | ) | (2,882 | ) | ||||||||||
|
|
|
|
|
|
|
|
|
|
|
|||||||||||
| Ending balance |
$ | 7,990 | $ | 527 | $ | 26,657 | $ | 1,650 | $ | 36,824 | ||||||||||
|
|
|
|
|
|
|
|
|
|
|
|||||||||||
| December 31, 2013 |
Commercial | Agricultural | Real Estate | Consumer | Total | |||||||||||||||
| Beginning balance |
$ | 7,343 | $ | 1,541 | $ | 24,063 | $ | 1,892 | $ | 34,839 | ||||||||||
| Provision (credit) for loan losses |
220 | (1,066 | ) | 3,288 | 1,311 | 3,753 | ||||||||||||||
| Recoveries |
402 | 39 | 239 | 337 | 1,017 | |||||||||||||||
| Charge-offs |
(1,283 | ) | (100 | ) | (1,970 | ) | (1,268 | ) | (4,621 | ) | ||||||||||
| Transfer of off balance sheet exposure to other liabilities |
(242 | ) | (31 | ) | (680 | ) | (135 | ) | (1,088 | ) | ||||||||||
|
|
|
|
|
|
|
|
|
|
|
|||||||||||
| Ending balance |
$ | 6,440 | $ | 383 | $ | 24,940 | $ | 2,137 | $ | 33,900 | ||||||||||
|
|
|
|
|
|
|
|
|
|
|
|||||||||||
F-20
Table of Contents
FIRST FINANCIAL BANKSHARES, INC. AND SUBSIDIARIES
Notes to Consolidated Financial Statements
December 31, 2014, 2013 and 2012
The Company’s recorded investment in loans as of December 31, 2014 and 2013 related to the balance in the allowance for loan losses on the basis of the Company’s impairment methodology was as follows (in thousands). Purchased credit impaired loans of $2,151,000 and $2,707,000, respectively, at December 31, 2014 and 2013 are included in loans individually evaluated for impairment.
| December 31, 2014 |
Commercial | Agricultural | Real Estate | Consumer | Total | |||||||||||||||
| Loans individually evaluated for impairment |
$ | 13,688 | $ | 593 | $ | 56,968 | $ | 1,733 | $ | 72,982 | ||||||||||
| Loan collectively evaluated for impairment |
626,266 | 105,101 | 1,765,886 | 358,953 | 2,856,206 | |||||||||||||||
|
|
|
|
|
|
|
|
|
|
|
|||||||||||
| Total |
$ | 639,954 | $ | 105,694 | $ | 1,822,854 | $ | 360,686 | $ | 2,929,188 | ||||||||||
|
|
|
|
|
|
|
|
|
|
|
|||||||||||
| December 31, 2013 |
Commercial | Agricultural | Real Estate | Consumer | Total | |||||||||||||||
| Loans individually evaluated for impairment |
$ | 12,183 | $ | 546 | $ | 69,272 | $ | 2,243 | $ | 84,244 | ||||||||||
| Loan collectively evaluated for impairment |
584,547 | 75,382 | 1,609,242 | 330,870 | 2,600,041 | |||||||||||||||
|
|
|
|
|
|
|
|
|
|
|
|||||||||||
| Total |
$ | 596,730 | $ | 75,928 | $ | 1,678,514 | $ | 333,113 | $ | 2,684,285 | ||||||||||
|
|
|
|
|
|
|
|
|
|
|
|||||||||||
The Company’s loans that were modified in the years ended December 31, 2014 and 2013, and considered a troubled debt restructuring are as follows (in thousands):
| Year Ended December 31, 2014 | Year Ended December 31, 2013 | |||||||||||||||||||||||
| Number | Pre-Modification Recorded Investment |
Post- Modification Recorded Investment |
Number | Pre-Modification Recorded Investment |
Post- Modification Recorded Investment |
|||||||||||||||||||
| Commercial |
7 | $ | 668 | $ | 668 | 4 | $ | 253 | $ | 253 | ||||||||||||||
| Agricultural |
1 | 39 | 39 | 1 | 24 | 24 | ||||||||||||||||||
| Real Estate |
5 | 630 | 630 | 11 | 3,958 | 3,958 | ||||||||||||||||||
| Consumer |
3 | 11 | 11 | 6 | 138 | 138 | ||||||||||||||||||
|
|
|
|
|
|
|
|
|
|
|
|
|
|||||||||||||
| Total |
16 | $ | 1,348 | $ | 1,348 | 22 | $ | 4,373 | $ | 4,373 | ||||||||||||||
|
|
|
|
|
|
|
|
|
|
|
|
|
|||||||||||||
The balances below provide information as to how the loans were modified as troubled debt restructured loans during the year ended December 31, 2014 and 2013 (in thousands):
| Year Ended December 31, 2014 | Year Ended December 31, 2013 | |||||||||||||||||||||||
| Adjusted Interest Rate |
Extended Maturity |
Combined Rate and Maturity |
Adjusted Interest Rate |
Extended Maturity |
Combined Rate and Maturity |
|||||||||||||||||||
| Commercial |
$ | — | $ | 366 | $ | 302 | $ | — | $ | 218 | $ | 35 | ||||||||||||
| Agricultural |
— | — | 39 | — | 24 | — | ||||||||||||||||||
| Real Estate |
— | 118 | 512 | 420 | 433 | 3,105 | ||||||||||||||||||
| Consumer |
— | 8 | 3 | — | 134 | 4 | ||||||||||||||||||
|
|
|
|
|
|
|
|
|
|
|
|
|
|||||||||||||
| Total |
$ | — | $ | 492 | $ | 856 | $ | 420 | $ | 809 | $ | 3,144 | ||||||||||||
|
|
|
|
|
|
|
|
|
|
|
|
|
|||||||||||||
F-21
Table of Contents
FIRST FINANCIAL BANKSHARES, INC. AND SUBSIDIARIES
Notes to Consolidated Financial Statements
December 31, 2014, 2013 and 2012
During the years ended December 31, 2014 and 2013, certain loans were modified as a troubled debt restructured loans within the previous 12 months and for which there was a payment default. A default for purposes of this disclosure is a troubled debt restructured loan in which the borrower is 90 days past or more due or results in the foreclosure and repossession of the applicable collateral. The loans are as follows (dollars in thousands):
| Year Ended December 31, 2014 | Year Ended December 31, 2013 | |||||||||||||||
| Number | Balance | Number | Balance | |||||||||||||
| Commercial |
— | $ | — | 6 | $ | 316 | ||||||||||
| Agriculture |
— | — | — | — | ||||||||||||
| Real Estate |
— | — | — | — | ||||||||||||
| Consumer |
1 | 32 | 2 | 18 | ||||||||||||
|
|
|
|
|
|
|
|
|
|||||||||
| Total |
1 | $ | 32 | 8 | $ | 334 | ||||||||||
|
|
|
|
|
|
|
|
|
|||||||||
As of December 31, 2014, the Company has no commitments to lend additional funds to loan customers whose terms have been modified in troubled debt restructurings.
An analysis of the changes in loans to officers, directors, principal shareholders, or associates of such persons for the year ended December 31, 2014 (determined as of each respective year-end) follows (in thousands):
| Beginning Balance |
Additional Loans |
Payments | Ending Balance |
|||||||||||||
| Year ended December 31, 2014 |
$ | 47,299 | $ | 132,118 | $ | 124,620 | $ | 54,797 | ||||||||
In the opinion of management, those loans are on substantially the same terms, including interest rates and collateral requirements, as those prevailing at the time for comparable transactions with unaffiliated persons.
Our subsidiary bank has established a line of credit with the Federal Home Loan Bank of Dallas (FHLB) to provide liquidity and meet pledging requirements for those customers eligible to have securities pledged to secure certain uninsured deposits. At December 31, 2014, $1,667,472,000 in loans held by our bank subsidiary were subject to blanket liens as security for this line of credit. At December 31, 2014, $1,010,000 in advances and $5,000,000 in letters of credit were outstanding under this line of credit. These letters of credit were pledged as collateral for public funds held by our bank.
F-22
Table of Contents
FIRST FINANCIAL BANKSHARES, INC. AND SUBSIDIARIES
Notes to Consolidated Financial Statements
December 31, 2014, 2013 and 2012
| 4. | BANK PREMISES AND EQUIPMENT: |
The following is a summary of bank premises and equipment (in thousands):
| Useful Life |
December 31, | |||||||||
| 2014 | 2013 | |||||||||
| Land |
— | $ | 25,096 | $ | 22,635 | |||||
| Buildings |
20 to 40 years | 97,013 | 89,907 | |||||||
| Furniture and equipment |
3 to 10 years | 50,700 | 48,763 | |||||||
| Leasehold improvements |
Lesser of lease term or 5 to 15 years | 4,687 | 4,802 | |||||||
|
|
|
|
|
|||||||
| 177,496 | 166,107 | |||||||||
| Less-accumulated depreciation and amortization |
(74,496 | ) | (70,602 | ) | ||||||
|
|
|
|
|
|||||||
| $ | 103,000 | $ | 95,505 | |||||||
|
|
|
|
|
|||||||
Depreciation expense for the years ended December 31, 2014, 2013 and 2012 amounted to $7,833,000, $7,196,000 and $6,492,000, respectively, and is included in the captions net occupancy expense and equipment expense in the accompanying consolidated statements of earnings.
The Company is lessor for portions of its banking premises. Total rental income for all leases included in net occupancy expense is approximately $1,923,000, $1,862,000 and $1,703,000, for the years ended December 31, 2014, 2013, and 2012, respectively.
| 5. | DEPOSITS AND SHORT-TERM BORROWINGS: |
Time deposits of $250,000 or more totaled approximately $211,490,000 and $142,842,000 at December 31, 2014 and 2013, respectively.
At December 31, 2014, the scheduled maturities of time deposits (in thousands) were, as follows:
| Year ending December 31, |
||||
| 2015 |
$ | 565,794 | ||
| 2016 |
40,122 | |||
| 2017 |
14,417 | |||
| 2018 |
15,107 | |||
| Thereafter |
13,552 | |||
|
|
|
|||
| $ | 648,992 | |||
|
|
|
|||
Deposits received from related parties at December 31, 2014 and 2013 totaled $53,556,000 and $42,237,000, respectively.
Included in short-term borrowings at December 31, 2014 and 2013 are $357,400,000 and $267,269,000, respectively, in securities sold under agreements to repurchase and $1,010,000 and $191,119,000, respectively, in advances from the Federal Home Loan Bank of Dallas.
F-23
Table of Contents
FIRST FINANCIAL BANKSHARES, INC. AND SUBSIDIARIES
Notes to Consolidated Financial Statements
December 31, 2014, 2013 and 2012
| 6. | LINE OF CREDIT: |
The Company renewed its loan agreement, effective June 30, 2013, with Frost Bank. Under the loan agreement, as renewed and amended, we are permitted to draw up to $25,000,000 on a revolving line of credit. Prior to June 30, 2015, interest is paid quarterly at Wall Street Journal Prime Rate and the line of credit matures June 30, 2015. If a balance exists at June 30, 2015, the principal balance converts to a term facility payable quarterly over five years and interest is paid quarterly at our election at Wall Street Journal Prime Rate plus 50 basis points or LIBOR plus 250 basis points. The line of credit is unsecured. Among other provisions in the credit agreement, we must satisfy certain financial covenants during the term of the loan agreement, including, without limitation, covenants that require us to maintain certain capital, tangible net worth, loan loss reserve, non-performing asset and cash flow coverage ratio. In addition, the credit agreement contains certain operational covenants, which among others, restricts the payment of dividends above 55% of consolidated net income, limits the incurrence of debt (excluding any amounts acquired in an acquisition) and prohibits the disposal of assets except in the ordinary course of business. Since 1995, we have historically declared dividends as a percentage of our consolidated net income in a range of 37% (low) in 1995 to 53% (high) in 2003 and 2006. The Company was in compliance with the financial and operational covenants at December 31, 2014. There was no outstanding balance under the line of credit as of December 31, 2014 or 2013.
| 7. | INCOME TAXES: |
The Company files a consolidated federal income tax return. Income tax expense is comprised of the following (dollars in thousands):
| Year Ended December 31, | ||||||||||||
| 2014 | 2013 | 2012 | ||||||||||
| Current federal income tax |
$ | 29,832 | $ | 24,931 | $ | 23,605 | ||||||
| Current state income tax |
94 | 15 | 13 | |||||||||
| Deferred federal income tax expense (benefit) |
(893 | ) | 754 | 1,517 | ||||||||
|
|
|
|
|
|
|
|||||||
| Income tax expense |
$ | 29,033 | $ | 25,700 | $ | 25,135 | ||||||
|
|
|
|
|
|
|
|||||||
Income tax expense, as a percentage of pretax earnings, differs from the statutory federal income tax rate as follows:
| As a Percent of Pretax Earnings | ||||||||||||
| 2014 | 2013 | 2012 | ||||||||||
| Statutory federal income tax rate |
35.0 | % | 35.0 | % | 35.0 | % | ||||||
| Reductions in tax rate resulting from interest income exempt from federal income tax |
(10.6 | ) | (10.5 | ) | (9.7 | ) | ||||||
| Effect of state income tax |
0.1 | — | 0.1 | |||||||||
| ESOP tax credit |
(0.2 | ) | (0.2 | ) | (0.3 | ) | ||||||
| Other |
0.2 | 0.3 | 0.2 | |||||||||
|
|
|
|
|
|
|
|||||||
| Effective income tax rate |
24.5 | % | 24.6 | % | 25.3 | % | ||||||
|
|
|
|
|
|
|
|||||||
F-24
Table of Contents
FIRST FINANCIAL BANKSHARES, INC. AND SUBSIDIARIES
Notes to Consolidated Financial Statements
December 31, 2014, 2013 and 2012
The approximate effects of each type of difference that gave rise to the Company’s deferred tax assets and liabilities at December 31, 2014 and 2013 are as follows (dollars in thousands):
| 2014 | 2013 | |||||||
| Deferred tax assets: |
||||||||
| Tax basis of loans in excess of financial statement basis |
$ | 13,876 | $ | 12,904 | ||||
| Minimum liability in defined benefit plan |
1,440 | 2,328 | ||||||
| Recognized for financial reporting purposes but not for tax purposes: |
||||||||
| Deferred compensation |
2,423 | 2,213 | ||||||
| Write-downs and adjustments to other real estate owned and repossessed assets |
78 | 174 | ||||||
| Other deferred tax assets |
350 | 322 | ||||||
|
|
|
|
|
|||||
| Total deferred tax assets |
18,167 | 17,941 | ||||||
|
|
|
|
|
|||||
| Deferred tax liabilities: |
||||||||
| Financial statement basis of fixed assets in excess of tax basis |
5,311 | 5,567 | ||||||
| Intangible asset amortization deductible for tax purposes, but not for financial reporting purposes |
11,704 | 10,277 | ||||||
| Recognized for financial reporting purposes but not for tax purposes: |
||||||||
| Accretion on investment securities |
1,679 | 1,678 | ||||||
| Pension plan contributions |
1,414 | 2,309 | ||||||
| Net unrealized gain on investment securities available-for-sale |
27,010 | 7,909 | ||||||
| Other deferred tax liabilities |
310 | 366 | ||||||
|
|
|
|
|
|||||
| Total deferred tax liabilities |
47,428 | 28,106 | ||||||
|
|
|
|
|
|||||
| Net deferred tax asset (liability) |
$ | (29,261 | ) | $ | (10,165 | ) | ||
|
|
|
|
|
|||||
Current authoritative accounting guidance prescribes a recognition threshold and a measurement attribute for the financial statement recognition and measurement of a tax position taken or expected to be taken in a tax return. Benefits from tax positions should be recognized in the financial statements only when it is more likely than not that the tax position will be sustained upon examination by the appropriate taxing authority that would have full knowledge of all relevant information. A tax position that meets the more-likely-than-not recognition threshold is measured at the largest amount of cumulative benefit that is greater than fifty percent likely of being realized upon ultimate settlement. Tax positions that previously failed to meet the more-likely-than-not recognition threshold should be recognized in the first subsequent financial reporting period in which that threshold is met. Previously recognized tax positions that no longer meet the more-likely-than-not recognition threshold should be derecognized in the first subsequent financial reporting period in which that threshold is no longer met. Current authoritative accounting guidance also provides guidance on the accounting for and disclosure of unrecognized tax benefits, interest and penalties. The Company concluded the tax benefits of positions taken and expected to be taken on its tax returns should be recognized in the financial statements under this guidance. The Company files income tax returns in the U.S. federal jurisdiction and several U.S. state jurisdictions. We are no longer subject to U.S. federal income tax examinations by tax authorities for years before 2011 or Texas state tax examinations by tax authorities for years before 2010.
F-25
Table of Contents
FIRST FINANCIAL BANKSHARES, INC. AND SUBSIDIARIES
Notes to Consolidated Financial Statements
December 31, 2014, 2013 and 2012
| 8. | FAIR VALUE DISCLOSURES: |
The accounting authoritative guidance for fair value measurements defines fair value as the price that would be received to sell an asset or paid to transfer a liability in an orderly transaction between market participants. A fair value measurement assumes that the transaction to sell the asset or transfer the liability occurs in the principal market for the asset or liability or, in the absence of a principal market, the most advantageous market for the asset or liability. The price in the principal (or most advantageous) market used to measure the fair value of the asset or liability shall not be adjusted for transaction costs. An orderly transaction is a transaction that assumes exposure to the market for a period prior to the measurement date to allow for marketing activities that are usual and customary for transactions involving such assets and liabilities; it is not a forced transaction. Market participants are buyers and sellers in the principal market that are (i) independent, (ii) knowledgeable, (iii) able to transact and (iv) willing to transact.
The accounting authoritative guidance requires the use of valuation techniques that are consistent with the market approach, the income approach and/or the cost approach. The market approach uses prices and other relevant information generated by market transactions involving identical or comparable assets and liabilities. The income approach uses valuation techniques to convert future amounts, such as cash flows or earnings, to a single present amount on a discounted basis. The cost approach is based on the amount that currently would be required to replace the service capacity of an asset (replacement costs). Valuation techniques should be consistently applied. Inputs to valuation techniques refer to the assumptions that market participants would use in pricing the asset or liability. Inputs may be observable, meaning those that reflect the assumptions market participants would use in pricing the asset or liability developed based on market data obtained from independent sources, or unobservable, meaning those that reflect the reporting entity’s own assumptions about the assumptions market participants would use in pricing the asset or liability developed based on the best information available in the circumstances. In that regard, the authoritative guidance establishes a fair value hierarchy for valuation inputs that gives the highest priority to quoted prices in active markets for identical assets or liabilities and the lowest priority to unobservable inputs. The fair value hierarchy is as follows:
| • | Level 1 Inputs – Unadjusted quoted prices in active markets for identical assets or liabilities that the reporting entity has the ability to access at the measurement date. |
| • | Level 2 Inputs – Inputs other than quoted prices included in Level 1 that are observable for the asset or liability, either directly or indirectly. These include quoted prices for similar assets or liabilities in active markets, quoted prices for identical or similar assets or liabilities in markets that are not active, inputs other than quoted prices that are observable for the asset or liability (for example, interest rates, volatilities, prepayment speeds, loss severities, credit risks and default rates) or inputs that are derived principally from or corroborated by observable market data by correlation or other means. |
| • | Level 3 Inputs – Significant unobservable inputs that reflect an entity’s own assumptions that market participants would use in pricing the assets or liabilities. |
A description of the valuation methodologies used for assets and liabilities measured at fair value, as well as the general classification of such instruments pursuant to the valuation hierarchy, is set forth below.
In general, fair value is based upon quoted market prices, where available. If such quoted market prices are not available, fair value is based upon internally developed models that primarily use, as inputs, observable market-based parameters. Valuation adjustments may be made to ensure that financial instruments are recorded at fair value. While management believes the Company’s valuation methodologies are appropriate and consistent with other market participants, the use of different methodologies or assumptions to determine the fair value of certain financial instruments could result in a different estimate of fair value at the reporting date.
F-26
Table of Contents
FIRST FINANCIAL BANKSHARES, INC. AND SUBSIDIARIES
Notes to Consolidated Financial Statements
December 31, 2014, 2013 and 2012
Securities classified as available-for-sale and trading are reported at fair value utilizing Level 1 and Level 2 inputs. For these securities, the Company obtains fair value measurements from an independent pricing service. The fair value measurements consider observable data that may include market spreads, cash flows, the United States Treasury yield curve, live trading levels, trade execution data, dealer quotes, market consensus prepayments speeds, credit information and the security’s terms and conditions, among other items. Securities are considered to be measured with Level 1 inputs at the time of purchase and for 30 days following. After 30 days, the majority of securities are transferred to Level 2 as they are considered to be measured with Level 2 inputs, with the exception of U. S. Treasury securities and any other security for which there remain Level 1 inputs. Transfers are recognized on the actual date of transfer.
There were no transfers between Level 2 and Level 3 during the year ended December 31, 2014.
The following table summarizes financial assets and financial liabilities measured at fair value on a recurring basis as of December 31, 2014, segregated by the level of the valuation inputs within the fair value hierarchy utilized to measure fair value (in thousands):
| Level 1 Inputs |
Level 2 Inputs |
Level 3 Inputs |
Total Fair Value |
|||||||||||||
| Available-for-sale investment securities: |
||||||||||||||||
| U.S. Treasury securities |
$ | 520 | $ | — | $ | — | $ | 520 | ||||||||
| Obligations of U. S. government sponsored enterprises and agencies |
— | 129,755 | — | 129,755 | ||||||||||||
| Obligations of state and political subdivisions |
59,455 | 1,108,173 | — | 1,167,628 | ||||||||||||
| Corporate bonds |
— | 94,065 | — | 94,065 | ||||||||||||
| Residential mortgage-backed securities |
— | 885,211 | — | 885,211 | ||||||||||||
| Commercial mortgage-backed securities |
— | 133,984 | — | 133,984 | ||||||||||||
| Other securities |
4,693 | — | — | 4,693 | ||||||||||||
|
|
|
|
|
|
|
|
|
|||||||||
| Total |
$ | 64,668 | $ | 2,351,188 | $ | — | $ | 2,415,856 | ||||||||
|
|
|
|
|
|
|
|
|
|||||||||
Certain financial assets and financial liabilities are measured at fair value on a nonrecurring basis, that is, the instruments are not measured at fair value on an ongoing basis but are subject to fair value adjustments in certain circumstances (for example, when there is evidence of impairment). Financial assets and financial liabilities measured at fair value on a non-recurring basis include the following at December 31, 2014:
Impaired Loans – Impaired loans are reported at the fair value of the underlying collateral if repayment is expected solely from the collateral. Collateral values are estimated using Level 2 inputs based on observable market data, or Level 3 inputs based on the discounting of the collateral. At December 31, 2014, impaired loans with a carrying value of $20,194,000 were reduced by specific valuation reserves totaling $4,213,000 resulting in a net fair value of $15,981,000.
Loans Held for Sale – Loans held for sale are reported at the lower of cost or fair value. In determining whether the fair value of loans held for sale is less than cost when quoted market prices are not available, the Company considers investor commitments/contracts. These loans are considered Level 2 of the fair value hierarchy. At December 31, 2014, the Company’s mortgage loans held for sale were recorded at cost as fair value exceeded cost.
Certain non-financial assets and non-financial liabilities measured at fair value on a non-recurring basis include other real estate owned, goodwill and other intangible assets and other non-financial long-lived assets. Non-financial assets measured at fair value on a non-recurring basis during the year ended December 31, 2014 and 2013 include other real estate owned which, subsequent to their initial transfer to other real estate owned from loans, were re-measured at fair value through a write-down included in gain (loss) on sale of foreclosed assets. During the reported periods, all fair value measurements for foreclosed assets utilized Level 2 inputs based on observable market data, generally third-party appraisals, or Level 3 inputs based on customized discounting criteria. These
F-27
Table of Contents
FIRST FINANCIAL BANKSHARES, INC. AND SUBSIDIARIES
Notes to Consolidated Financial Statements
December 31, 2014, 2013 and 2012
appraisals are evaluated individually and discounted as necessary due to the age of the appraisal, lack of comparable sales, expected holding periods of property or special use type of the property. Such discounts vary by appraisal based on the above factors but generally range from 5% to 25% of the appraised value. Reevaluation of other real estate owned is performed at least annually as required by regulatory guidelines or more often if particular circumstances arise. The following table presents other real estate owned that were re-measured subsequent to their initial transfer to other real estate owned (dollars in thousands):
| Year Ended December 31, |
||||||||
| 2014 | 2013 | |||||||
| Carrying value of other real estate owned prior to remeasurement |
$ | 881 | $ | 2,405 | ||||
| Write-downs included in gain (loss) on sale of other real estate owned |
(135 | ) | (445 | ) | ||||
|
|
|
|
|
|||||
| Fair value |
$ | 746 | $ | 1,960 | ||||
|
|
|
|
|
|||||
At December 31, 2014 and 2013, other real estate owned totaled $943,000 and $2,903,000, respectively.
The Company is required under current authoritative accounting guidance to disclose the estimated fair value of their financial instrument assets and liabilities including those subject to the requirements discussed above. For the Company, as for most financial institutions, substantially all of its assets and liabilities are considered financial instruments. Many of the Company’s financial instruments, however, lack an available trading market as characterized by a willing buyer and willing seller engaging in an exchange transaction.
The estimated fair value amounts of financial instruments have been determined by the Company using available market information and appropriate valuation methodologies. However, considerable judgment is required to interpret data to develop the estimates of fair value. Accordingly, the estimates presented herein are not necessarily indicative of the amounts the Company could realize in a current market exchange. The use of different market assumptions and/or estimation methodologies may have a material effect on the estimated fair value amounts.
In addition, reasonable comparability between financial institutions may not be likely due to the wide range of permitted valuation techniques and numerous estimates that must be made given the absence of active secondary markets for many of the financial instruments. This lack of uniform valuation methodologies also introduces a greater degree of subjectivity to these estimated fair values.
Cash and due from banks, federal funds sold, interest-bearing deposits and time deposits in banks and accrued interest receivable and payable are liquid in nature and considered Level 1 or 2 of the fair value hierarchy.
Financial instruments with stated maturities have been valued using a present value discounted cash flow with a discount rate approximating current market for similar assets and liabilities and are considered Levels 2 and 3 of the fair value hierarchy. Financial instrument liabilities with no stated maturities have an estimated fair value equal to both the amount payable on demand and the carrying value and are considered Level 1 of the fair value hierarchy.
The carrying value and the estimated fair value of the Company’s contractual off-balance-sheet unfunded lines of credit, loan commitments and letters of credit, which are generally priced at market at the time of funding, are not material.
F-28
Table of Contents
FIRST FINANCIAL BANKSHARES, INC. AND SUBSIDIARIES
Notes to Consolidated Financial Statements
December 31, 2014, 2013 and 2012
The estimated fair values and carrying values of all financial instruments under current authoritative guidance at December 31, 2014 and 2013, were as follows (dollars in thousands):
| 2014 | 2013 | |||||||||||||||||
| Carrying Value |
Estimated Fair Value |
Carrying Value |
Estimated Fair Value |
Fair Value Hierarchy | ||||||||||||||
| Cash and due from banks |
$ | 190,387 | $ | 190,387 | $ | 183,084 | $ | 183,084 | Level 1 | |||||||||
| Federal funds sold |
8,760 | 8,760 | 3,430 | 3,430 | Level 1 | |||||||||||||
| Interest-bearing deposits in banks |
54,324 | 54,324 | 25,498 | 25,498 | Level 1 | |||||||||||||
| Interest-bearing time deposits in banks |
17,002 | 17,032 | 31,917 | 32,059 | Level 2 | |||||||||||||
| Available-for-sale securities |
2,415,856 | 2,415,856 | 2,057,723 | 2,057,723 | Levels 1 and 2 | |||||||||||||
| Held-to-maturity securities |
441 | 447 | 684 | 694 | Level 2 | |||||||||||||
| Loans |
2,901,167 | 2,906,399 | 2,655,548 | 2,667,743 | Level 3 | |||||||||||||
| Accrued interest receivable |
28,998 | 28,998 | 26,865 | 26,865 | Level 2 | |||||||||||||
| Deposits with stated maturities |
648,992 | 650,893 | 686,626 | 688,876 | Level 2 | |||||||||||||
| Deposits with no stated maturities |
4,101,263 | 4,101,263 | 3,448,449 | 3,448,449 | Level 1 | |||||||||||||
| Short term borrowings |
367,110 | 367,110 | 463,888 | 463,888 | Level 2 | |||||||||||||
| Accrued interest payable |
237 | 237 | 299 | 299 | Level 2 | |||||||||||||
| 9. | COMMITMENTS AND CONTINGENCIES: |
The Company is engaged in legal actions arising from the normal course of business. In management’s opinion, the Company has adequate legal defenses with respect to these actions, and as of December 31, 2014 the resolution of these matters is not expected to have material adverse effects upon the results of operations or financial condition of the Company.
The Company leases a portion of its bank premises and equipment under operating leases. At December 31, 2014, future minimum lease commitments were: 2015 - $640,000; 2016 - $503,000; 2017 - $312,000, 2018 - $78,000 and 2019 - $16,000.
| 10. | FINANCIAL INSTRUMENTS WITH OFF-BALANCE-SHEET RISK: |
We are a party to financial instruments with off-balance-sheet risk in the normal course of business to meet the financing needs of our customers. These financial instruments include unfunded lines of credit, commitments to extend credit and federal funds sold to correspondent banks and standby letters of credit. Those instruments involve, to varying degrees, elements of credit and interest rate risk in excess of the amount recognized in the consolidated balance sheets.
F-29
Table of Contents
FIRST FINANCIAL BANKSHARES, INC. AND SUBSIDIARIES
Notes to Consolidated Financial Statements
December 31, 2014, 2013 and 2012
Our exposure to credit loss in the event of nonperformance by the counterparty to the financial instrument for unfunded lines of credit, commitments to extend credit and standby letters of credit is represented by the contractual notional amount of these instruments. We generally use the same credit policies in making commitments and conditional obligations as we do for on-balance-sheet instruments.
| Total Notional Amounts Committed December 31, 2014 (in thousands) |
||||
| Financial instruments whose contract amounts represent credit risk: |
||||
| Unfunded lines of credit |
$ | 444,687 | ||
| Unfunded commitments to extend credit |
128,293 | |||
| Standby letters of credit |
31,301 | |||
|
|
|
|||
| Total commercial commitments |
$ | 604,281 | ||
|
|
|
|||
Unfunded lines of credit and commitments to extend credit are agreements to lend to a customer as long as there is no violation of any condition established in the contract. These commitments generally have fixed expiration dates or other termination clauses and may require payment of a fee. Since many of the commitments are expected to expire without being drawn upon, the total commitment amounts do not necessarily represent future cash requirements. We evaluate each customer’s creditworthiness on a case-by-case basis. The amount of collateral obtained, as we deem necessary upon extension of credit, is based on our credit evaluation of the counterparty. Collateral held varies but may include accounts receivable, inventory, property, plant, equipment, livestock, and income-producing commercial properties.
Standby letters of credit are conditional commitments we issue to guarantee the performance of a customer to a third party. The credit risk involved in issuing letters of credit is essentially the same as that involved in extending loan facilities to customers. The average collateral value held on letters of credit usually exceeds the contract amount.
We believe we have no other off-balance sheet arrangements or transactions with unconsolidated, special purpose entities that would expose us to liability that is not reflected on the face of the financial statements.
| 11. | CONCENTRATION OF CREDIT RISK: |
The Company grants commercial, retail, agriculture and residential real estate loans to customers primarily in North Central, Southeastern and West Texas. Although the Company has a diversified loan portfolio, a substantial portion of its borrowers’ ability to honor their commitments is dependent upon each local economic sector. In addition, the Company holds mortgage related securities which are backed by GNMA, FNMA or FHLMC or are collateralized by securities backed by these agencies.
| 12. | PENSION AND PROFIT SHARING PLANS: |
The Company’s defined benefit pension plan was frozen effective January 1, 2004, whereby no new participants will be added to the Plan and no additional years of service will accrue to participants, unless the pension plan is reinstated at a future date. The pension plan covered substantially all of the Company’s employees at the time. The benefits for each employee were based on years of service and a percentage of the employee’s qualifying compensation during the final years of employment. The Company’s funding policy was and is to contribute annually the amount necessary to satisfy the Internal Revenue Service’s funding standards. Contributions to the pension plan, prior to freezing the plan, were intended to provide not only for benefits attributed to service to date but also for those expected to be earned in the future. As a result of the Pension Protection Act of 2006 (the “Protection Act”), the Company will be required to contribute amounts in future years to fund any shortfalls. The Company has evaluated the provisions of the Protection Act as well as the Internal Revenue Service’s funding standards to develop a plan for funding in future years. The Company made a contribution totaling $250,000 and $1,000,000 in 2014 and 2013, respectively, and is continuing to evaluate future funding amounts.
F-30
Table of Contents
FIRST FINANCIAL BANKSHARES, INC. AND SUBSIDIARIES
Notes to Consolidated Financial Statements
December 31, 2014, 2013 and 2012
During 2014, as permitted by the Internal Revenue Service, the Company offered settlement of a portion of its pension obligations to those plan participants who no longer were employed by the Company. As a result of the partial settlement of the plan, the Company recognized $2,909,000, before income tax, in pension expense, a component of noninterest expense. The effect of this transaction was relatively neutral to shareholders’ equity since the recorded pension obligation associated with the plan participants who accepted the settlement closely approximated the amount offered to such plan participants and the amount recognized in pension expense had been previously recognized as unrealized losses in other comprehensive earnings. As a result, the Company paid $10,626,000 out of pension plan assets, or approximately 43% of the total outstanding obligation balance, to plan participants and the number of participants was reduced by 335, or 44%. The Company’s investment risk and administrative expense associated with the Company’s pension plan should be significantly reduced going forward.
Using an actuarial measurement date of December 31, 2014 and 2013, benefit obligation activity and fair value of plan assets for the years ended December 31, 2014 and 2013, and a statement of the funded status as of December 31, 2014 and 2013, are as follows (dollars in thousands):
| 2014 | 2013 | |||||||
| Reconciliation of benefit obligations: |
||||||||
| Benefit obligation at January 1 |
$ | 25,499 | $ | 27,838 | ||||
| Interest cost on projected benefit obligation |
1,131 | 1,020 | ||||||
| Actuarial loss (gain) |
1,075 | (2,097 | ) | |||||
| Benefits paid, including partial settlement of certain participant balances |
(12,124 | ) | (1,262 | ) | ||||
|
|
|
|
|
|||||
| Benefit obligation at December 31 |
$ | 15,581 | $ | 25,499 | ||||
|
|
|
|
|
|||||
| Reconciliation of fair value of plan assets: |
||||||||
| Fair value of plan assets at January 1 |
$ | 25,467 | $ | 21,110 | ||||
| Actual return on plan assets |
1,865 | 4,619 | ||||||
| Employer contributions |
250 | 1,000 | ||||||
| Benefits paid, including partial settlement of certain participant balances |
(12,124 | ) | (1,262 | ) | ||||
|
|
|
|
|
|||||
| Fair value of plan assets at December 31 |
15,458 | 25,467 | ||||||
|
|
|
|
|
|||||
| Funded status |
$ | (123 | ) | $ | (32 | ) | ||
|
|
|
|
|
|||||
Amounts recognized as a component of accumulated other comprehensive earnings as of year-end that have not been recognized as a component of the net period benefit cost of the Company’s defined benefit pension plan are as follows (in thousands):
| 2014 | 2013 | |||||||
| Net actuarial loss |
$ | (4,435 | ) | $ | (6,975 | ) | ||
| Deferred tax benefit |
1,762 | 2,651 | ||||||
|
|
|
|
|
|||||
| Amounts included in accumulated other comprehensive earnings, net of tax |
$ | (2,673 | ) | $ | (4,324 | ) | ||
|
|
|
|
|
|||||
F-31
Table of Contents
FIRST FINANCIAL BANKSHARES, INC. AND SUBSIDIARIES
Notes to Consolidated Financial Statements
December 31, 2014, 2013 and 2012
Net periodic pension benefit cost for the years ended December 31, 2014, 2013, and 2012, are as follows (dollars in thousands):
| Year Ended December 31, | ||||||||||||
| 2014 | 2013 | 2012 | ||||||||||
| Service cost - benefits earned during the period |
$ | — | $ | — | $ | — | ||||||
| Interest cost on projected benefit obligation |
1,131 | 1,020 | 1,113 | |||||||||
| Expected return on plan assets |
(1,497 | ) | (1,293 | ) | (1,140 | ) | ||||||
| Amortization of unrecognized net loss |
337 | 786 | 659 | |||||||||
| Recognized loss on partial settlement of certain participant balances |
2,909 | — | — | |||||||||
|
|
|
|
|
|
|
|||||||
| Net periodic pension benefit expense |
$ | 2,880 | $ | 513 | $ | 632 | ||||||
|
|
|
|
|
|
|
|||||||
The following table sets forth the rates used in the actuarial calculations of the present value of benefit obligations and net periodic pension cost and the rate of return on plan assets:
| 2014 | 2013 | 2012 | ||||||||||
| Weighted average discount rate |
4.10 | % | 4.75 | % | 3.75 | % | ||||||
| Expected long-term rate of return on assets |
6.25 | % | 6.25 | % | 6.25 | % | ||||||
The weighted average discount rate is estimated based on setting a discount rate to establish an obligation for pension benefits equivalent to an amount that, if invested in high quality fixed income securities, would produce a return that matches the expected benefit payment stream. The expected long-term rate of return on plan assets is based on historical returns and expectations of future returns based on asset mix, after consultation with our investment advisors and actuaries.
The major type of plan assets in the pension plan and the targeted allocation percentage as of December 31, 2014 and 2013 is as follows:
| December 31, 2014 Allocation |
December 31, 2013 Allocation |
Targeted Allocation |
||||||||||
| Equity securities |
75 | % | 75 | % | 75 | % | ||||||
| Debt securities |
24 | % | 24 | % | 25 | % | ||||||
| Cash and equivalents |
1 | % | 1 | % | — | |||||||
The range and weighted average final maturities of debt securities held in the pension plan as of December 31, 2014 are 3.01 to 13.34 years and approximately 7.73 years, respectively. Assets held in the pension plan are considered either Level 1 consisting of the money market funds, publicly traded common stocks and publically traded mutual funds or Level 2 consisting of obligations of state and political subdivisions, corporate bonds and mortgage-backed securities. There were no Level 3 securities. See note 8 for a discussion of the fair value hierarchy. The breakdown by level is as follows (dollars in thousands):
| Level 1 Inputs |
Level 2 Inputs |
Level 3 Inputs |
Total Fair Value |
|||||||||||||
| Money market fund |
$ | 281 | $ | — | $ | — | $ | 281 | ||||||||
| Obligations of state and political subdivisions |
— | 687 | — | 687 | ||||||||||||
| Corporate bonds |
— | 791 | — | 791 | ||||||||||||
| Mortgage-backed securities |
— | 1,178 | — | 1,178 | ||||||||||||
| Corporate stocks and mutual funds |
12,521 | — | — | 12,521 | ||||||||||||
|
|
|
|
|
|
|
|
|
|||||||||
| Total |
$ | 12,802 | $ | 2,656 | $ | — | $ | 15,458 | ||||||||
|
|
|
|
|
|
|
|
|
|||||||||
F-32
Table of Contents
FIRST FINANCIAL BANKSHARES, INC. AND SUBSIDIARIES
Notes to Consolidated Financial Statements
December 31, 2014, 2013 and 2012
First Financial Trust & Asset Management Company, National Association, a wholly owned subsidiary of the Company, manages the pension plan assets as well as the profit sharing plan assets (see below). The investment strategy and targeted allocations are based on similar strategies First Financial Trust & Asset Management Company, National Association employs for most of its managed accounts whereby appropriate diversification is achieved. First Financial Trust & Asset Management Company, National Association is prohibited from holding investments deemed to be high risk by the Office of the Comptroller of the Currency.
An estimate of the undiscounted projected future payments to eligible participants for the next five years and the following five years in the aggregate is as follows (in thousands):
| Year Ending December 31, |
||||
| 2015 |
784 | |||
| 2016 |
805 | |||
| 2017 |
855 | |||
| 2018 |
874 | |||
| 2019 |
899 | |||
| 2020 forward |
4,754 | |||
As of December 31, 2014 and 2013, the pension plan’s total assets included First Financial Bankshares, Inc. common stock valued at approximately $1,933,000 and $2,037,000, respectively.
The Company also provides a profit sharing plan, which covers substantially all full-time employees. The profit sharing plan is a defined contribution plan and allows employees to contribute a percentage of their base annual salary. Employees are fully vested to the extent of their contributions and become fully vested in the Company’s contributions over a six-year vesting period. Costs related to the Company’s defined contribution plan totaled approximately $5,324,000, $5,686,000 and $4,711,000 in 2014, 2013 and 2012, respectively, and are included in salaries and employee benefits in the accompanying consolidated statements of earnings. As of December 31, 2014 and 2013, the profit sharing plan’s assets included First Financial Bankshares, Inc. common stock valued at approximately $42,008,000 and $46,979,000, respectively.
In 2004, after freezing our pension plan, we added a safe harbor match to the 401(k) plan. We match a maximum of 4% on employee deferrals of 5% of their employee compensation. Total expense for this matching in 2014, 2013 and 2012 was $1,699,000, $1,560,000 and $1,383,000, respectively, and is included in salaries and employee benefits in the statements of earnings.
The Company has a directors’ deferred compensation plan whereby the directors may elect to defer up to 100% of their directors’ fees. All deferred compensation is invested in the Company’s common stock held in a rabbi trust. The stock is held in nominee name of the trustee, and the principal and earnings of the trust are held separate and apart from other funds of the Company, and are used exclusively for the uses and purposes of the deferred compensation agreement. The accounts of the trust have been consolidated in the financial statements of the Company.
| 13. | DIVIDENDS FROM SUBSIDIARIES: |
At December 31, 2014, approximately $93,160,000 was available for the declaration of dividends by the Company’s subsidiaries without the prior approval of regulatory agencies.
| 14. | REGULATORY MATTERS: |
The Company is subject to various regulatory capital requirements administered by the federal banking agencies. Failure to meet minimum capital requirements can initiate certain mandatory, and possibly additional discretionary, actions by regulators that, if undertaken, could have a direct material effect on the Company’s financial statements. Under capital adequacy guidelines and the regulatory framework for prompt corrective action, each of Bankshares’
F-33
Table of Contents
FIRST FINANCIAL BANKSHARES, INC. AND SUBSIDIARIES
Notes to Consolidated Financial Statements
December 31, 2014, 2013 and 2012
subsidiaries must meet specific capital guidelines that involve quantitative measures of the subsidiaries’ assets, liabilities, and certain off-balance-sheet items as calculated under regulatory accounting practices. The subsidiaries’ capital amounts and classification are also subject to qualitative judgments by the regulators about components, risk weightings, and other factors.
Quantitative measures established by regulation to ensure capital adequacy require the Company and its subsidiaries to maintain minimum amounts and ratios (set forth in the table below) of total and Tier 1 capital (as defined in the regulations) to risk-weighted assets (as defined), and of Tier 1 capital (as defined) to average assets (as defined). As of December 31, 2014 and 2013, the Company and its subsidiaries met all capital adequacy requirements to which they were subject.
As of December 31, 2014 and 2013, the most recent notification from our primary regulator categorized the Company and its bank subsidiary as well-capitalized. To be categorized as well-capitalized, we must maintain minimum total risk-based, Tier 1 risk-based, and Tier 1 leverage ratios as set forth in the following table.
There are no conditions or events since that notification that management believes has changed the institutions’ categories. The Company’s and its bank subsidiary’s actual capital amounts and ratios are presented in the table below (in thousands):
| To Be Well | ||||||||||||||||||||||||
| Capitalized Under | ||||||||||||||||||||||||
| For Capital | Prompt Corrective | |||||||||||||||||||||||
| Actual | Adequacy Purposes: | Action Provisions: | ||||||||||||||||||||||
| Amount | Ratio | Amount | Ratio | Amount | Ratio | |||||||||||||||||||
| As of December 31, 2014: |
||||||||||||||||||||||||
| Total Capital (to Risk-Weighted Assets): |
||||||||||||||||||||||||
| Consolidated |
$ | 587,094 | 17 | % | ³$ | 273,764 | ³ | 8 | % | N/A | ||||||||||||||
| First Financial Bank, N.A. |
$ | 492,668 | 14 | % | ³$ | 272,318 | ³ | 8 | % | ³$ | 340,397 | ³ | 10 | % | ||||||||||
| Tier 1 Capital (to Risk-Weighted Assets): |
||||||||||||||||||||||||
| Consolidated |
$ | 549,124 | 16 | % | ³$ | 136,882 | ³ | 4 | % | N/A | ||||||||||||||
| First Financial Bank, N.A. |
$ | 454,698 | 13 | % | ³$ | 136,159 | ³ | 4 | % | ³$ | 204,238 | ³ | 6 | % | ||||||||||
| Tier 1 Capital (to Average Assets): |
||||||||||||||||||||||||
| Consolidated |
$ | 549,124 | 10 | % | ³$ | 166,489 | ³ | 3 | % | N/A | ||||||||||||||
| First Financial Bank, N.A. |
$ | 454,698 | 8 | % | ³$ | 165,598 | ³ | 3 | % | ³$ | 275,996 | ³ | 5 | % | ||||||||||
| As of December 31, 2013: |
||||||||||||||||||||||||
| Total Capital (to Risk-Weighted Assets): |
||||||||||||||||||||||||
| Consolidated |
$ | 525,460 | 17 | % | ³$ | 247,985 | ³ | 8 | % | N/A | ||||||||||||||
| First Financial Bank, N.A. |
$ | 433,538 | 14 | % | ³$ | 246,788 | ³ | 8 | % | ³$ | 308,484 | ³ | 10 | % | ||||||||||
| Tier 1 Capital (to Risk-Weighted Assets): |
||||||||||||||||||||||||
| Consolidated |
$ | 490,460 | 16 | % | ³$ | 123,993 | ³ | 4 | % | N/A | ||||||||||||||
| First Financial Bank, N.A. |
$ | 398,538 | 13 | % | ³$ | 123,394 | ³ | 4 | % | ³$ | 185,091 | ³ | 6 | % | ||||||||||
| Tier 1 Capital (to Average Assets): |
||||||||||||||||||||||||
| Consolidated |
$ | 490,460 | 10 | % | ³$ | 149,488 | ³ | 3 | % | N/A | ||||||||||||||
| First Financial Bank, N.A. |
$ | 398,538 | 8 | % | ³$ | 148,690 | ³ | 3 | % | ³$ | 247,816 | ³ | 5 | % | ||||||||||
In connection with the First Financial Trust & Asset Management Company, N.A.’s (the “Trust Company”) application to obtain our trust charter, the Trust Company is required to maintain tangible net assets of $2,000,000 at all times. As of December 31, 2014, our Trust Company had tangible net assets totaling $11,659,000.
F-34
Table of Contents
FIRST FINANCIAL BANKSHARES, INC. AND SUBSIDIARIES
Notes to Consolidated Financial Statements
December 31, 2014, 2013 and 2012
Our subsidiary bank may be required at times to maintain reserve balances with the Federal Reserve Bank. At December 31, 2014 and 2013, the subsidiary bank’s reserve balances were $14,334,000 and $5,916,000, respectively.
| 15. | STOCK OPTION PLAN: |
The Company has an incentive stock plan to provide for the granting of options to employees of the Company at prices not less than market at the date of grant. At December 31, 2014, the Company had allocated 3,553,000 shares of stock for issuance under the plan. The plan provides that options granted are exercisable after two years from date of grant at a rate of 20% each year cumulatively during the 10-year term of the option. Shares are issued under the stock option plan from available authorized shares. An analysis of stock option activity for the year ended December 31, 2014 is presented in the table and narrative below:
| Weighted- Average |
||||||||||||||||
| Shares | Weighted- Average Ex. Price |
Remaining Contractual Term (Years) |
Aggregate Intrinsic Value ($000) |
|||||||||||||
| Outstanding, beginning of year (split adjusted) |
1,064,064 | $ | 20.99 | |||||||||||||
| Granted |
— | — | ||||||||||||||
| Exercised |
(104,927 | ) | 13.69 | |||||||||||||
| Cancelled |
(31,460 | ) | 24.78 | |||||||||||||
|
|
|
|
|
|||||||||||||
| Outstanding, end of year |
927,677 | 21.69 | 6.43 | $ | 20,118 | |||||||||||
|
|
|
|
|
|
|
|
|
|||||||||
| Exercisable at end of year |
358,597 | $ | 15.31 | 4.07 | $ | 5,489 | ||||||||||
|
|
|
|
|
|
|
|
|
|||||||||
The options outstanding at December 31, 2014, had exercise prices ranging between $11.03 and $30.85. Stock options have been adjusted retroactively for the effects of stock dividends and splits.
The following table summarizes information concerning outstanding and vested stock options as of December 31, 2014:
| Exercise Price | Number Outstanding |
Remaining Contracted Life (Years) |
Number Vested | |||||||||||
| $ | 11.03 | 22,816 | 0.1 | 22,816 | ||||||||||
| 13.66 | 106,110 | 2.1 | 106,110 | |||||||||||
| 16.78 | 182,411 | 4.4 | 138,431 | |||||||||||
| 15.73 | 241,940 | 6.8 | 89,240 | |||||||||||
| 30.85 | 374,400 | 8.8 | 2,000 | |||||||||||
|
|
|
|
|
|||||||||||
| 927,677 | 358,597 | |||||||||||||
|
|
|
|
|
|||||||||||
F-35
Table of Contents
FIRST FINANCIAL BANKSHARES, INC. AND SUBSIDIARIES
Notes to Consolidated Financial Statements
December 31, 2014, 2013 and 2012
The fair value of the options granted in 2013 was estimated using the Black-Scholes options pricing model with the following weighted-average assumptions: risk-free interest rate of 1.59%; expected dividend yield of 1.69%; expected life of 5.99 years; and expected volatility of 26.91%, respectively.
The weighted-average grant-date fair value of options granted during 2013 was $7.14. There were no grants during 2014 and 2012. The total intrinsic value of options exercised during the years ended December 31, 2014, 2013, and 2012, was $1,738,000, $1,958,000, and $510,000, respectively.
As of December 31, 2014, there was $2,201,000 of total unrecognized compensation cost related to nonvested share-based compensation arrangements granted under the Plan. That cost is expected to be recognized over a weighted-average period of 2.30 years. The total fair value of shares vested during the years ended December 31, 2014, 2013, and 2012 was $382,000, $565,000 and $423,000, respectively.
The aggregate intrinsic value of vested stock options at December 31, 2014 totaled $5,225,438.
| 16. | CONDENSED FINANCIAL INFORMATION - PARENT COMPANY: |
Condensed Balance Sheets-December 31, 2014 and 2013
| 2014 | 2013 | |||||||
| ASSETS | ||||||||
| Cash in subsidiary bank |
$ | 9,441 | $ | 11,960 | ||||
| Cash in unaffiliated banks |
2 | 2 | ||||||
| Interest-bearing deposits in subsidiary bank |
60,642 | 64,108 | ||||||
|
|
|
|
|
|||||
| Total cash and cash equivalents |
70,085 | 76,070 | ||||||
| Interest-bearing time deposits in unaffiliated banks |
— | 480 | ||||||
| Securities available-for-sale, at fair value |
12,243 | 11,701 | ||||||
| Investment in and advances to subsidiaries, at equity |
606,415 | 507,074 | ||||||
| Intangible assets |
723 | 723 | ||||||
| Other assets |
2,787 | 2,054 | ||||||
|
|
|
|
|
|||||
| Total assets |
$ | 692,253 | $ | 598,102 | ||||
|
|
|
|
|
|||||
| LIABILITIES AND SHAREHOLDERS’ EQUITY | ||||||||
| Total liabilities |
$ | 10,716 | $ | 10,455 | ||||
| Shareholders’ equity: |
||||||||
| Common stock |
641 | 320 | ||||||
| Capital surplus |
305,429 | 302,991 | ||||||
| Retained earnings |
327,978 | 273,972 | ||||||
| Treasury shares |
(5,878 | ) | (5,490 | ) | ||||
| Deferred compensation |
5,878 | 5,490 | ||||||
| Accumulated other comprehensive earnings |
47,489 | 10,364 | ||||||
|
|
|
|
|
|||||
| Total shareholders’ equity |
681,537 | 587,647 | ||||||
|
|
|
|
|
|||||
| Total liabilities and shareholders’ equity |
$ | 692,253 | $ | 598,102 | ||||
|
|
|
|
|
|||||
F-36
Table of Contents
FIRST FINANCIAL BANKSHARES, INC. AND SUBSIDIARIES
Notes to Consolidated Financial Statements
December 31, 2014, 2013 and 2012
Condensed Statements of Earnings-
For the Years Ended December 31, 2014, 2013 and 2012
| 2014 | 2013 | 2012 | ||||||||||
| Income: |
||||||||||||
| Cash dividends from subsidiaries |
$ | 34,000 | $ | 64,200 | $ | 58,400 | ||||||
| Excess of earnings over dividends of subsidiaries |
58,539 | 17,192 | 17,547 | |||||||||
| Other |
3,717 | 3,118 | 2,682 | |||||||||
|
|
|
|
|
|
|
|||||||
| 96,256 | 84,510 | 78,629 | ||||||||||
|
|
|
|
|
|
|
|||||||
| Expenses: |
||||||||||||
| Salaries and employee benefits |
5,595 | 4,540 | 3,668 | |||||||||
| Other operating expenses |
3,309 | 3,017 | 2,338 | |||||||||
|
|
|
|
|
|
|
|||||||
| 8,904 | 7,557 | 6,006 | ||||||||||
|
|
|
|
|
|
|
|||||||
| Earnings before income taxes |
87,352 | 76,953 | 72,623 | |||||||||
| Income tax benefit |
2,207 | 1,915 | 1,602 | |||||||||
|
|
|
|
|
|
|
|||||||
| Net earnings |
$ | 89,559 | $ | 78,868 | $ | 74,225 | ||||||
|
|
|
|
|
|
|
|||||||
F-37
Table of Contents
FIRST FINANCIAL BANKSHARES, INC. AND SUBSIDIARIES
Notes to Consolidated Financial Statements
December 31, 2014, 2013 and 2012
Condensed Statements of Cash Flows-
For the Years Ended December 31, 2014, 2013, and 2012
| 2014 | 2013 | 2012 | ||||||||||
| Cash flows from operating activities: |
||||||||||||
| Net earnings |
$ | 89,559 | $ | 78,868 | $ | 74,225 | ||||||
| Adjustments to reconcile net earnings to net cash provided by operating activities: |
||||||||||||
| Excess of earnings over dividends of subsidiary bank |
(58,539 | ) | (17,192 | ) | (17,547 | ) | ||||||
| Depreciation and amortization, net |
200 | 135 | 142 | |||||||||
| Decrease (increase) in other assets |
(150 | ) | (3 | ) | 34 | |||||||
| Increase (decrease) in other liabilities |
(314 | ) | 890 | (918 | ) | |||||||
|
|
|
|
|
|
|
|||||||
| Net cash provided by operating activities |
30,756 | 62,698 | 55,936 | |||||||||
|
|
|
|
|
|
|
|||||||
| Cash flows from investing activities: |
||||||||||||
| Acquisition of bank |
— | (39,200 | ) | — | ||||||||
| Net decrease (increase) in interest-bearing time deposits in unaffiliated banks |
480 | 2,598 | (960 | ) | ||||||||
| Maturities of available-for-sale securities |
— | — | 5,430 | |||||||||
| Purchases of bank premises and equipment |
(780 | ) | (224 | ) | (86 | ) | ||||||
| Repayment from (of advances to) investment in and advances to subsidiaries, net |
(3,300 | ) | 700 | (400 | ) | |||||||
|
|
|
|
|
|
|
|||||||
| Net cash used in (provided by) investing activities |
(3,600 | ) | (36,126 | ) | 3,984 | |||||||
|
|
|
|
|
|
|
|||||||
| Cash flows from financing activities: |
||||||||||||
| Proceeds of stock issuances |
1,437 | 1,958 | 824 | |||||||||
| Cash dividends paid |
(34,578 | ) | (24,505 | ) | (38,719 | ) | ||||||
|
|
|
|
|
|
|
|||||||
| Net cash used in financing activities |
(33,141 | ) | (22,547 | ) | (37,895 | ) | ||||||
|
|
|
|
|
|
|
|||||||
| Net increase (decrease) in cash and cash equivalents |
(5,985 | ) | 4,025 | 22,025 | ||||||||
| Cash and cash equivalents, beginning of year |
76,070 | 72,045 | 50,020 | |||||||||
|
|
|
|
|
|
|
|||||||
| Cash and cash equivalents, end of year |
$ | 70,085 | $ | 76,070 | $ | 72,045 | ||||||
|
|
|
|
|
|
|
|||||||
F-38
Table of Contents
FIRST FINANCIAL BANKSHARES, INC. AND SUBSIDIARIES
Notes to Consolidated Financial Statements
December 31, 2014, 2013 and 2012
| 17. | CASH FLOW INFORMATION: |
Supplemental information on cash flows and noncash transactions is as follows (dollars in thousands):
| Year Ended December 31, | ||||||||||||
| 2014 | 2013 | 2012 | ||||||||||
| Supplemental cash flow information: |
||||||||||||
| Interest paid |
$ | 4,231 | $ | 4,077 | $ | 5,419 | ||||||
| Federal income taxes paid |
28,711 | 21,790 | 20,779 | |||||||||
| Schedule of noncash investing and financing activities: |
||||||||||||
| Assets acquired through foreclosure |
1,385 | 1,615 | 2,459 | |||||||||
| Investment securities purchased but not settled |
1,248 | 7,248 | 8,589 | |||||||||
| 18. | ACQUISITION: |
On February 9, 2013, we entered into an agreement and plan of merger to acquire Orange Savings Bank, SSB. On May 31, 2013, the transaction was completed. Pursuant to the agreement, we paid $39,200,000 in cash and issued 840,000 shares of the Company’s common stock in exchange for all of the outstanding shares of Orange Savings Bank, SSB. At closing, Orange Savings Bank, SSB, was merged into First Financial Bank, N.A., Abilene, Texas, a wholly owned subsidiary of the Company.
The primary purpose of the acquisition was to expand the Company’s market share along Interstate Highway 10 in Southeast Texas. Factors that contributed to a purchase price resulting in goodwill include Orange Savings Bank, SSB’s historic record of earnings, strong local economic environment and opportunity for growth. The results of operations from this acquisition are included in the consolidated earnings of the Company commencing June 1, 2013.
F-39
Table of Contents
FIRST FINANCIAL BANKSHARES, INC. AND SUBSIDIARIES
Notes to Consolidated Financial Statements
December 31, 2014, 2013 and 2012
The assets acquired and liabilities assumed were recorded on the consolidated balance sheet at estimated fair value on the acquisition date. The acquisition was not considered to be a significant business combination. The following table presents the amounts recorded on the consolidated balance sheet on the acquisition date (dollars in thousands):
| Fair value of consideration paid: |
||||
| Cash |
$ | 39,200 | ||
| Common stock issued (840,000 shares) |
23,100 | |||
|
|
|
|||
| Total fair value of consideration paid |
62,300 | |||
|
|
|
|||
| Fair value of identifiable assets acquired: |
||||
| Cash and cash equivalents |
13,494 | |||
| Securities available-for-sale |
107,735 | |||
| Loans |
293,288 | |||
| Identifiable intangible assets |
2,300 | |||
| Other assets |
12,569 | |||
|
|
|
|||
| Total identifiable assets acquired |
429,386 | |||
|
|
|
|||
| Fair value of liabilities assumed: |
||||
| Deposits |
385,950 | |||
| Other liabilities |
4,154 | |||
|
|
|
|||
| Total liabilities assumed |
390,104 | |||
|
|
|
|||
| Fair value of net identifiable assets acquired |
39,282 | |||
|
|
|
|||
| Goodwill resulting from acquisition |
$ | 23,018 | ||
|
|
|
|||
Goodwill recorded in the acquisition of Orange Savings Bank, SSB was accounted for in accordance with the authoritative business combination guidance. Accordingly, goodwill will not be amortized, but will be tested for impairment annually. The goodwill recorded is expected to be deductible for federal income tax purposes.
The fair value of total loans acquired was $293,288,000 at acquisition compared to contractual amounts of $299,252,000. The fair value of purchased credit impaired loans at acquisition was $4,475,000 compared to contractual amounts of $5,878,000. Additional purchased credit impaired loan disclosures were omitted due to immateriality. All other acquired loans were considered performing loans.
Orange Savings Bank, SSB had branches in Orange, Vidor, Mauriceville, Port Arthur and Newton, all located east of Houston, Texas.
F-40