Attached files
| file | filename |
|---|---|
| 8-K - FORM 8-K - SRC Energy Inc. | syrg_8k.htm |
| EX-99.1 - EXHIBIT 99.1 - SRC Energy Inc. | ex99x1.htm |
Exhibit 99.2

At Home In the Wattenberg NYSE MKT: SYRG Corporate Presentation – February 2015

Key Statistics Stock Price (02/13/15) $11.87 52 Week High/Low $14.11-$8.05 Shares Outstanding (02/15/15) Diluted 105 M Public Float 95 M Options Outstanding @ avg. price $5.94 (02/15/15) 2.2 M Avg. Daily Vol. (3 month) 1.9 M Market Capitalization $1,239 M Institutional Holdings 72% Insider & Employee Holdings, est. 10% Fiscal Year End August 31 Cash & Short Term Investments (02/15/15) $237 M Total Debt (02/15/15) $146 M Forward Looking Statements & Key Statistics This presentation may contain forward-looking statements, within the meaning of the Private Securities Litigation Reform Act of 1995. The use of words such as "believes," "expects," "anticipates," "intends," "plans," "estimates," "should," "likely" or similar expressions, indicates a forward-looking statement. These statements are subject to risks and uncertainties and are based on the beliefs and assumptions of management, and information currently available to management. The actual results could differ materially from a conclusion, forecast or projection in the forward-looking information. Certain material factors or assumptions were applied in drawing a conclusion or making a forecast or projection as reflected in the forward-looking information. The identification in this presentation of factors that may affect the company’s future performance and the accuracy of forward-looking statements is meant to be illustrative and by no means exhaustive. All forward-looking statements should be evaluated with the understanding of their inherent uncertainty. Factors that could cause the company’s actual results to differ materially from those expressed or implied by forward-looking statements include, but are not limited to: the success of the company’s exploration and development efforts; the price of oil and gas; the worldwide economic situation; changes in interest rates or inflation; the ability of the company to transport gas; willingness and ability of third parties to honor their contractual commitments; the company’s ability to raise additional capital, as it may be affected by current conditions in the stock market and competition in the oil and gas industry for risk capital; the company’s capital costs, which may be affected by delays or cost overruns; costs of production; environmental and other regulations, as the same presently exist or may later be amended; the company’s ability to identify, finance and integrate any future acquisitions; and the volatility of the company’s stock price. Sources: Capital IQ, SEC, Thomson Reuters, Company estimates. In USD

Features of the Wattenberg Field 3

Experienced Management Team Edward Holloway, co-CEO33 years as an executive of oil and gas companies focused on the Wattenberg Field in the D-J Basin Built three Wattenberg companies and sold each of them to larger, public companies William Scaff, Jr., co-CEOOver 30 years of management in the oil and gas industry with focus on the D-J BasinFrank (Monty) Jennings, CFOMore than 35 years of accounting and finance experience, including oil & gas exploration and production Craig Rasmuson, COO9 years in the oil and gas industry all focused on the D-J BasinValerie Dunn, Secretary/Controller Ms. Dunn has been Controller of SYRG since 2008 and appointed Secretary in 2014. She has 30 years of experience in oil & gas accounting for Wattenberg based companies Ron Morgenstern, VP of Land & Business DevelopmentMore than 38 years managing lease assets in various basins in the Rocky Mountains, including the DJ BasinJon Kruljac, VP, Capital Markets & Investor Relations30 years of experience in capital markets including 23 years of focus on small cap, Rocky Mountain E&P companiesBrant DeMuth CFA, VP, Finance30 years of experience in the oil & gas industry including 20 years of providing capital to industry participants Over 200 Years Combined Experience Operating in the Wattenberg 4

Cycle Tested Team with World Class Assets 5 Managing Through Down Cycle Results in a Stronger Company in Up Cycle *Based on average 22 stage completion utilizing sliding sleeves. Plug and perf increases costs by 10-15% per well. **Pro-forma for equity offering closed 2/2/15 and total debt outstanding as of 2/15/15. Lower estimated completed well costs by 10-20% to $3.1MM-$3.8MM for 2015 Low debt to market capitalization (<15%**) and low cost of debt (~2.5% interest rate) Recent equity offering of $190MM strengthens the balance sheet and allows the company to take advantage of potential acquisitions and development opportunities No long term drilling contracts in place, allowing the company flexibility to spend capital when and where it is most economic High rate of return projects generate strong cash flow to be reinvested toward production and asset growth

Wattenberg Focused Position * Synergy Land Legend Leasehold * Corporate headquarters in Platteville, CO Core Wattenberg Area NE Wattenberg Extension Area Colorado Synergy HQ 75,065 net acres in the Greater Wattenberg Area 36,643 net acre position in the Core Wattenberg (includes leases on 1,739 net acres with rights to formations excluding the Niobrara & Codell)38,422 net acres* in the NE Wattenberg Extension Area (most leases have options to extend the lease for 2-4 years at an average cost of $100 per acre) *Pending any adjustments to final closing with Vecta on March 23, 2015

Core Wattenberg Stacked Pay HZ Well Inventory 7 Niobrara C Bench Niobrara A Bench Niobrara B Bench Codell The maps depict the estimated aerial extent of the Niobrara Benches & Codell formations and are derived from hydrocarbon saturation models utilizing porosity and resistivity open-hole log analysis CORE WATTENBERGAssumes 20 Wells Per Section* Niobrara A 234 Niobrara B 288 Niobrara C 291 Codell 247 Total Potential HZ Drilling Locations* 1,060 *Management estimations of resource potential 3rd Party Proved Locations may differ.
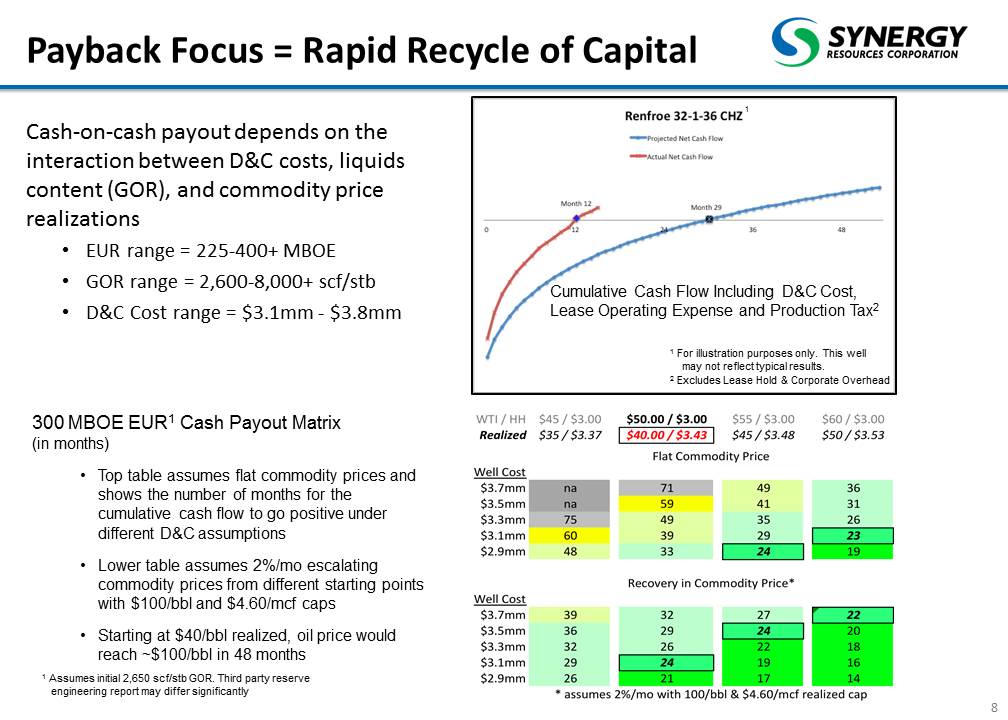
Payback Focus = Rapid Recycle of Capital Cash-on-cash payout depends on the interaction between D&C costs, liquids content (GOR), and commodity price realizations EUR range = 225-400+ MBOEGOR range = 2,600-8,000+ scf/stbD&C Cost range = $3.1mm - $3.8mm 8 1 Assumes initial 2,650 scf/stb GOR. Third party reserve engineering report may differ significantly 300 MBOE EUR1 Cash Payout Matrix(in months)Top table assumes flat commodity prices and shows the number of months for the cumulative cash flow to go positive under different D&C assumptionsLower table assumes 2%/mo escalating commodity prices from different starting points with $100/bbl and $4.60/mcf capsStarting at $40/bbl realized, oil price would reach ~$100/bbl in 48 months Cumulative Cash Flow Including D&C Cost, Lease Operating Expense and Production Tax2 2 Excludes Lease Hold & Corporate Overhead 1 1 For illustration purposes only. This well may not reflect typical results.

Core Wattenberg HZ Operated Wells Eberle Pad 6 wells Colorado Phelps Pad 6 wells Kelly Farms Pad 4 wells Union Pad 6 wells Leffler Pad 6 wells Renfroe Pad 5 wells 36,643 net acre position in the Core Wattenberg (approximately 20,000 net acres held by production)39 Horizontal wells drilled and completed on 7 SYRG pads with 100% success rate39 wells are comprised of 15 Codell wells, 10 Niobrara C/B wells, 5 Niobrara C wells, 4 Niobrara B wells and 5 wells on the Union pad completed in both the Codell and Niobrara per the geology in the areaProducing wells consist of 37 standard length laterals with an average of 23 frac stages, and 2 mid-length laterals averaging 45 stages29 of the wells are sliding sleeve and 10 wells are plug and perf Synergy Land Legend Leasehold Weld 152 Pad 6 wells

Wattenberg Drilling and Completions Cannon Pad 11 Wells Colorado One rig contracted, currently drilling 11 HZ wells on Cannon Pad finishing in late MayCompletion phase on 29 wells to begin mid-March 2015 on the Kiehn/Weis Pad on the western flank of the Wattenberg FieldGeis and Weideman Pads are slated to begin completion in May when the Lucerne II Plant is scheduled to be in service Potential for 40 gross wells to come on production by Aug 31st, 2015 (36 standard length and 4 extended reach; 30 sliding sleeve and 10 plug and perf completions)24 Niobrara wells (16 C, 7 B and 1 A bench)16 Codell wells Synergy Land Legend Leasehold DRILLING TO BE COMPLETED Operated pads with producing wells. Kiehn/Weis Pad 13 Wells Weideman Pad 8 wells Geis Pad 8 wells

38,422 Net Acres NE Wattenberg Extension Area Core samples exhibit the Greenhorn Formation is thermally mature and has 3.5 % total organic content. The formation is 90 feet in thickness. Synergy is targeting the lower Greenhorn Lincoln Lime which shows the interval to be in the middle of oil maturity and the expulsion window. The thin limestone and marlstone beds are brittle and should be conducive to creating abundant fractures. Synergy plans on procuring seismic data and drilling one well initially and evaluating results to determine future development potential. Operated Horizontal Drilling Program Targeting the Greenhorn Formation to Commence by 5/31/15Increased working interest to 65%, adding 10k net acres, in an all stock transaction with non-op partner Note: Offset operator acreage positions reflect approximations and not entire leasehold. Synergy Land Legend Leasehold
184,603 Net Acres in Nebraska Conventional Oil Play Vertical wells targeting conventional oil prone zones in the Lansing and Kansas City Groups of the Upper Pennsylvanian, 4,100-4,800 ft. depth, $550k-$650k est. completed well cost.Synergy has entered into an exploration agreement with a private operator to participate in up to 10 wells covering 8,000 net acres leased by SYRG in Dundy County Nebraska. Synergy will pay 3/8ths the cost of the wells and retain a 50% WI and an overriding royalty Synergy has long term leases with85% Net RevenueInterestActivity commencedin January, 2015Private and publicindustry competitorsare increasing the rigcount and well resultsin the area.Crude locally refined Synergy Land Legend Leasehold 4,100-4,700 ft. target formations highlighted in gold Cherokee Group

Proved Reserves 32MM BOE, PV-10 value $534MM (8/31/14) 13 * Proved Reserves as of 8/31/14 (Ryder Scott 3rd Party Reserve Engineers) $MM PUD PDNP PDP 95% Compound Annual Increase in Value of Proved Reserves Driven by PDP Growth $534 $72 $149 $236


Production, Revenue and EBITDA Growth 14 Margin: 77% Growing Production and Profitability Rapidly and Responsibly $MM BOEPD Margin: 73% Margin: 73% * See slide 20 for Adjusted EBITDA (a NON GAAP financial measure ) Reconciliation History of 100%+ Compound Annual Growth

Revenue Mix & Average Sales Price Oil Gas & NGL Revenue Mix: 81% Oil, 19% NGL & Gas (11-30-14) $MM Average Realized Sales Price per Fiscal Quarter Fiscal Quarters 2Q FY-13 3Q FY-13 4Q FY-13 1Q FY-14 2Q FY-14 3Q FY-14 4Q FY-14 1Q FY-15 Oil (Bbls) $84.20 $83.98 $92.32 $93.06 $86.82 $90.91 $89.72 $73.96 Gas & Liquids (Mcf) $4.77 $4.76 $5.06 $4.86 $5.93 $5.15 $4.95 $4.74 NGL Premium (%) 32% 34% 39% 35% 33% 39% 37% 35% BOE $58.70 $59.33 $64.35 $66.00 $65.32 $67.72 $66.86 $56.47

Fiscal 2015 Cash CAPEX Budget $270 Million 16 Operated Horizontal Wells$165 Million Non-Operated Horizontal Wells$15 Million Land Leasing$10 Million Fully Funded Budget: 97% Wattenberg FocusedDrilling Budget: 98% Horizontal Wells and 90% Operated NE Extension, Nebraska & Other$5 Million Acquisition$75 Million (cash) Operational and Financial Flexibility Focused on Return of Capital

Key Takeaways

Appendix

Eastern Colorado Assets 63,465 net acres, with long term leases and 85% NRIProven shallow Niobrara dry gas field, economic above $4/mcf2 days to drill and complete vertical wells (est. cost $250k)Area has existing gas gathering and processing infrastructureNumerous deeper exploratory tests being drilled by other operators 19 Synergy Land Legend Leasehold

Adjusted EBITDA Reconciliation SYNERGY RESOURCES CORPORATION RECONCILIATION OF NON-GAAP FINANCIAL MEASURES (unaudited, in thousands) Three Months Ended Twelve Months Ended Nov 30, Nov 30, Aug 31, Aug 31, ADJUSTED EBITDA 2014 2013 2014 2013 Net income $ 21,151 6,100 $ 28,853 $ 9,581 Depreciation, depletion, and amortization 16,454 5,591 32,958 13,336 Income tax expense 11,744 3,387 15,014 6,870 Stock based compensation 793 419 2,968 1,362 Change in fair value - derivatives (16,708) (2,636) (2,459 ) 2,649 Interest Income / Expense (31) (82 ) 50 Adjusted EBITDA $ 33,434 12,830 $ 77,252 $ 33,848

Hedging Summary as of February 15, 2015 21 Collar Volumes Average Collar Prices (1) Month Oil(Bbl) Gas HH (MMBtu) Gas CIG (MMBtu) Oil (Bbl) Gas HH(MMBtu) Gas CIG(MMBtu) February 1 to December 31, 2015 217,000 792,000 - $81.52 - $96.89 $4.15 - $4.49 - January 1 to December 31, 2016 120,000 480,000 1,200,000 $77.92 - $98.51 $3.99 - $4.39 $2.65 - $3.10 Swap Volumes Average Swap Prices (1) Month Oil(Bbl) Gas HH (MMBtu) Gas CIG (MMBtu) Oil (Bbl) Gas HH(MMBtu) Gas CIG(MMBtu) February 1 to December 31, 2015 309,000 - - $85.29 - - January 1 to December 31, 2016 184,000 - - $85.02 - - Put Volumes Average Option Put Prices (1) Month Oil(Bbl) Gas HH (MMBtu) Gas CIG (MMBtu) Oil (Bbl) Gas HH(MMBtu) Gas CIG(MMBtu) February 1 to December 31, 2015 470,000 - - $ 50.00 - - January 1 to December 31, 2016 300,000 - - $ 50.00 - - January 1 to April 30, 2017 80,000 - - $ 50.00 - - (1) Oil price is based on NYMEX WTI and gas price is based on NYMEX Henry Hub (HH) and/or CIG.

Sell-Side Research Coverage Firm Analyst Brean Capital Curtis Trimble Canaccord Genuity Stephen Berman, CFA Cowen and Company Christopher Walling Euro Pacific Equities Joel Musante, CFA FBR & Co. Megan Repine Global Hunter Securities Mike Kelly GMP Securities Ipsit Mohanty Iberia Capital Partners David Beard, CFA Imperial Capital Kim Pacanovsky Ph. D Johnson Rice & Co. Welles Fitzpatrick Key Banc David Decklebaum Northland Capital Markets Mo Dahhane Roth Capital Partners Joe Reagor Stifel Michael Scialla SunTrust Robinson Humphrey Ryan Oatman, CFA Wunderlich Securities Irene Haas Please note that any opinions, estimates or forecasts regarding Synergy Resources performance made by these analysts are theirs alone and do not represent opinions, forecasts or predictions of Synergy Resources or its management. Synergy Resources does not by its reference above imply its endorsement of or concurrence with such information, conclusions or recommendations. This list includes analysts currently known by Synergy Resources to follow the company, but may not be complete and may change as firms add or delete coverage. Synergy Resources does not undertake any duty to update this information or any information provided by third parties.